Article

Investigation of Circular Hollow Concrete Columns Reinforced with GFRP Bars and Spirals

1
Department of Civil Engineering, University of Engineering and Technology, Taxila 47080, Pakistan
2
Department of Building Engineering, Energy Systems and Sustainability Science, Faculty of Engineering and Sustainable Development, University of Gävle, 801 76 Gävle, Sweden
3
Centre for Future Materials (CFM), School of Civil Engineering and Surveying, University of Southern Queensland, Toowoomba 4350, Australia
4
Department of Civil and Architectural Engineering, University of Westminster, London W1B 2HW, UK
*
Author to whom correspondence should be addressed.
Buildings 2023, 13(4), 1056; https://doi.org/10.3390/buildings13041056
Submission received: 26 February 2023 / Revised: 28 March 2023 / Accepted: 29 March 2023 / Published: 17 April 2023
(This article belongs to the Collection Advanced Concrete Structures in Civil Engineering)

Abstract

:
Glass fiber-reinforced polymer (GFRP) reinforcements are useful alternatives to traditional steel bars in concrete structures, particularly in vertical structural elements such as columns, as they are less prone to corrosion, and impart increasing strength and endurance of buildings. There is limited research on the finite element analysis (FEA) of the structural behavior of hollow glass fiber-reinforced polymer reinforced concrete (GFRPRC) columns. The hollow portion can be used for the service duct and for reducing the self-weight of the members. Numerical analysis of the compressive response of circular hollow concrete columns reinforced with GFRP bars and spirals is performed in this study. This article aims to investigate the axial behavior of hollow GFRP concrete columns and compare it with that of solid steel reinforced concrete (RC) columns as well as hollow steel RC columns. The Abaqus software is used to construct finite element models. After calibration of modeling using an experimental test result as a control model, a parametric study is conducted. The columns with the same geometry, loading, and boundary conditions are analyzed in the parametric study. It is resulted that the hollow GFRP concrete columns provide a greater confinement effect than the solid steel RC columns. The average variation in the ultimate axial load-carrying capacities of the experimental results, from that of the FEA values, is noted to be only 3.87%, while the average difference in the corresponding deformations is 7.08%. Moreover, the hollow GFRP concrete columns possess greater axial load and deformation capacities compared with the solid steel RC columns.

1. Introduction

Hollow glass fiber-reinforced polymer (GFRP) columns have emerged as a promising alternative to conventional construction materials due to their high strength-to-weight ratio, corrosion resistance, and durability. In civil engineering, GFRP columns are widely used as structural members in various construction applications, such as bridges, buildings, and offshore structures. GFRP columns are extensively being used as a useful innovative reinforcement material instead of traditional steel reinforcements in reinforced concrete (RC) structures, thanks to their corrosion free characteristics [1]. Ephraim et al. [2] reported that GFRP with 40% fiber showed 25% more ductility than that recommended by ACI 440 [3]. Jabbar and Farid [4] observed that in addition to higher corrosion resistance, the GFRP bars have 13% higher tensile strength and 58% higher tensile yield strain than steel. Over the last two decades, different investigations have been conducted on the GFRP in axial members having solid cross sections and under different loading conditions [5,6,7,8,9,10,11,12,13,14,15,16,17,18,19,20,21,22,23,24]. Tobbi et al. [25] investigated the cover spalling in which the lateral confinement is gained from GFRP spiral reinforcement that enhances the strength and ductility of the columns. Raval and Dave [26] witnessed that the ultimate axial load-carrying capacity of columns is lowest for rectangular shape, followed by square and circular columns. Considerable improvement in the axial strength and corresponding deflection is attained for RC circular columns by wrapping with fiber-reinforced polymer (FRP) [27]. The FRP bars in columns demonstrated the compressive strength range of 10–86% and the modulus of elasticity range of 65–97% with different fiber types [28]. In contrast with steel-reinforced columns, the GFRP columns fail by simultaneous crushing of GFRP bars and concrete, as reported by El Gamal and Alshareedah [29].
Numerous studies [5,6,7,8,9,10,11,12,13,14,15,16,17,18,19,20,21,22,23,24] have examined the structural performance of hollow GFRP columns under various loading conditions, including axial, bending, and combined loadings. The results suggest that the performance of hollow GFRP columns is strongly influenced by the percentage of the GFRP bars, GFRP spirals, as well as the boundary conditions, loading type, and columns slenderness. Additionally, it has been shown that GFRP columns exhibit significant strain hardening, ductility, and energy absorption capacity, even under high strain rates and large deformations.
Lignola et al. [30] stated that in hollow glass fiber-reinforced polymer reinforced concrete (GFRPRC) columns, the cross-sectional shape and material properties determine the failure behavior. Khorramian and Sadeghian [15] suggested that while designing short GFRPRC columns, axial contribution of GFRP bars should be taken into consideration. The longitudinal GFRP bars contribute to load-carrying capacity, up to 5% of the ultimate load in the high strength concentric columns [31]. According to Liang and Sritharan [32], concrete dilation in RC columns occurs due to the inner void in the hollow columns which results in decrease in the columns’ confinement efficiency. Wayghan et al. [33] resulted that longitudinal GFRP bars have substantial contribution to the axial strength of RC columns, which is augmented by spirals. Al-Rubaye et al. [34] suggested that hollow composite structural elements can provide more compatibility with GFRP reinforcements compared with steel reinforcements due to similar elastic modulus.
Researchers studied the experimental responses of hollow GFRP columns under the axial loading, compared the results with the conventional hollow RC columns, and found that the key factors affecting the structural axial response of hollow RC columns are the size and diameter of GFRP bars, amount of lateral reinforcement, columns’ inner diameter to outer diameter ratio (i/o), and ratio of the actual load to axial load-carrying capacity [35,36,37].
The finite element method (FEM) is a smart and efficient way of analyzing the FRP composites, as it incurs much lower cost and time than experimental setups [38]. Havlásek [39] compared the concrete damage plasticity (CDP) model with the experimental results. Bahrami and Mahmoudi Kouhi [40] found that the circular columns gave much better axial performance than rectangular and square columns. He et al. [41] carried out the finite element analysis (FEA) on tubular hollow composite columns with GFRP bars and observed a gain in their load-carrying capacity by increasing the concrete strength or reducing the hollow ratio. Rashid and Bahrami [42] presented a comprehensive review on the structural performance of infilled steel–concrete composite thin-walled columns combined with FRP and CFRP.
Despite the significant progress made in the research on hollow GFRP columns [5,6,7,8,9,10,11,12,13,14,15,16,17,18,19,20,21,22,23,24,25,26,27,28,29,30,31,32,33,34,35,36,37,38,39,40,41,42], there are several challenges that need to be addressed. For example, there is a need for more reliable and accurate predictive FEM models to capture the complex behavior of hollow GFRP columns, including the effect of fiber architecture, material variability, and manufacturing defects. Therefore, this article focuses on the FEA of the axial response of hollow RC columns reinforced with GFRP, using the Abaqus software 6.14, on the published experimental results [35,36,37]. The significance of this study is that it helps explain the axial behavior of hollow GFRPRC columns and can lead to further parametric study of the columns numerically, without the need of cumbersome, time-consuming, and destructive experimental tests.

2. Experimental Program

2.1. Material Selection and Properties

2.1.1. Concrete

A normal strength concrete was cast for preparation of the column specimens, having a slump of 105 mm as per ASTM C143 [43] and using aggregate size of below 10 mm. The 28-day average compressive strength of concrete cylinders was noted as 31.8 MPa, having 3.54 MPa standard deviation. For determining the compressive strength of the columns, six cylinders were cast (each with 0.1 m diameter and 0.2 m height) as per ASTM C39 [44] and AS 1012.9 [45].

2.1.2. Reinforcements

The hollow GFRP column has GFRP bars No. 5 (each 15.9 mm diameter) used as main reinforcements and GFRP spirals No. 3 (each 9.5 mm diameter) as lateral reinforcements (Figure 1). The transverse GFRP reinforcements were provided in the form of spirals (with 180 mm inner diameter) instead of conventional circular hoops, because of their greater transverse confinement capability. For comparison, steel reinforcements were also used in the control specimen. The physical as well as mechanical properties of reinforcements are listed in Table 1.

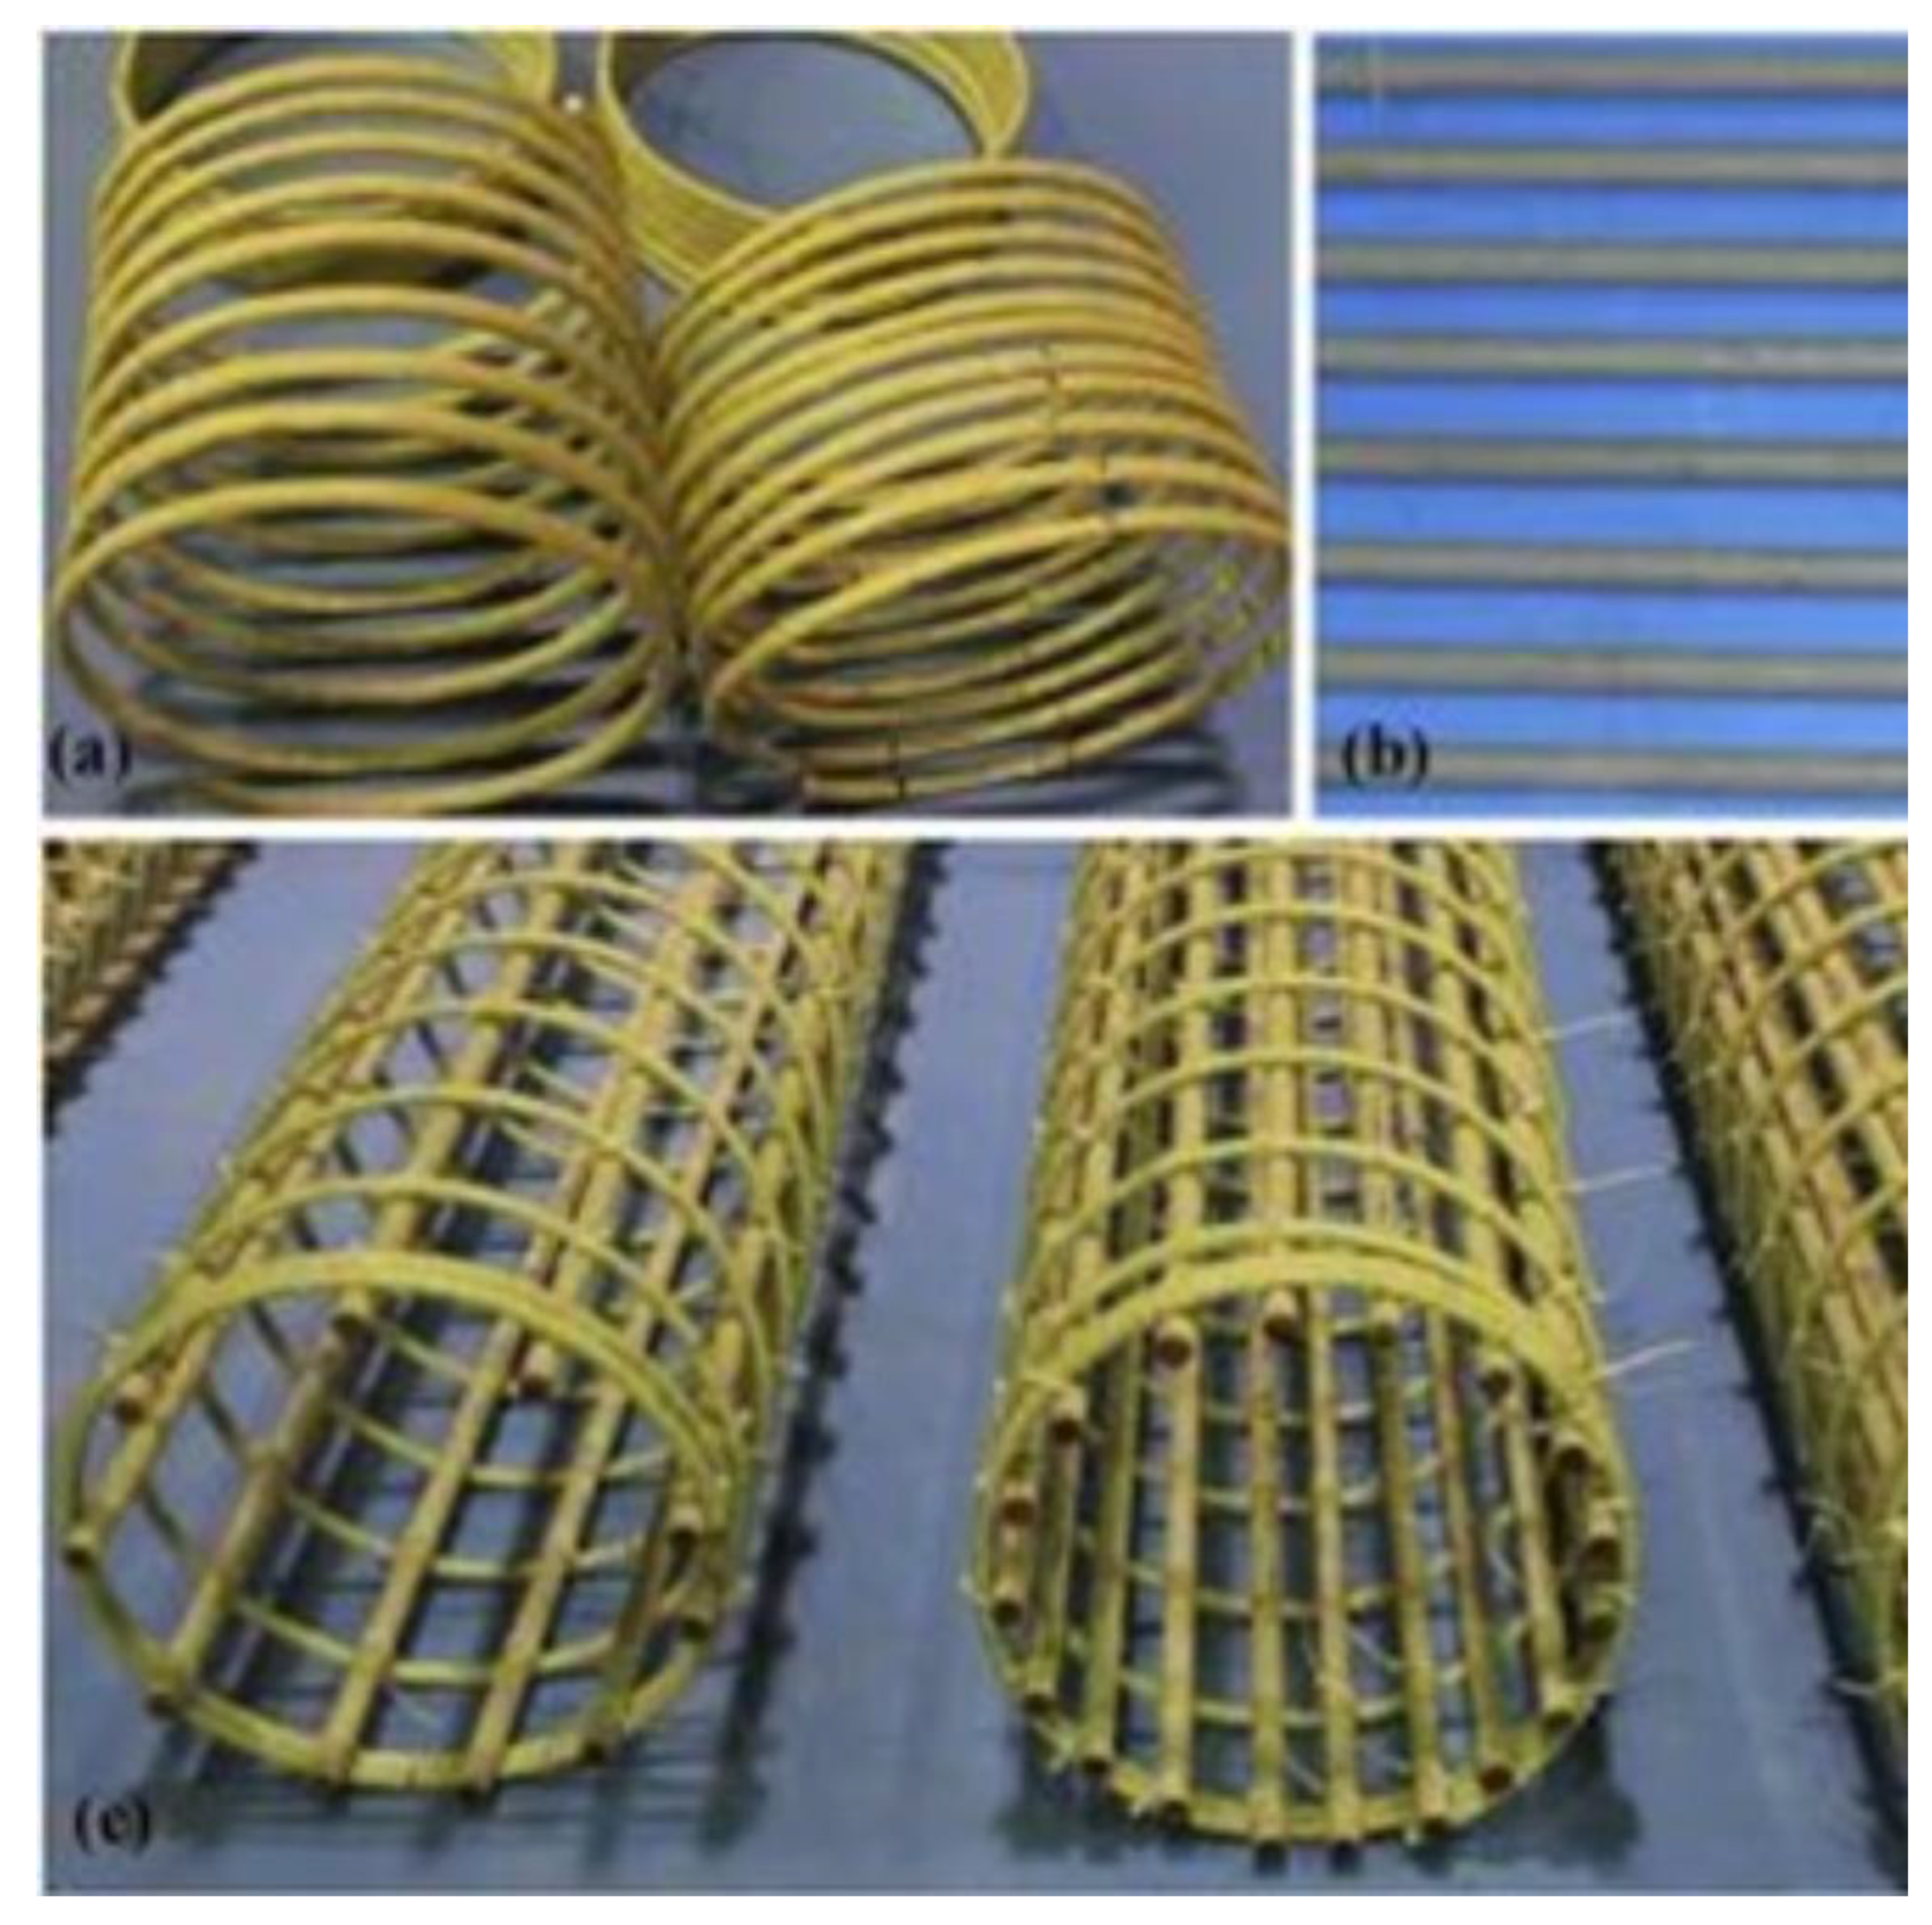
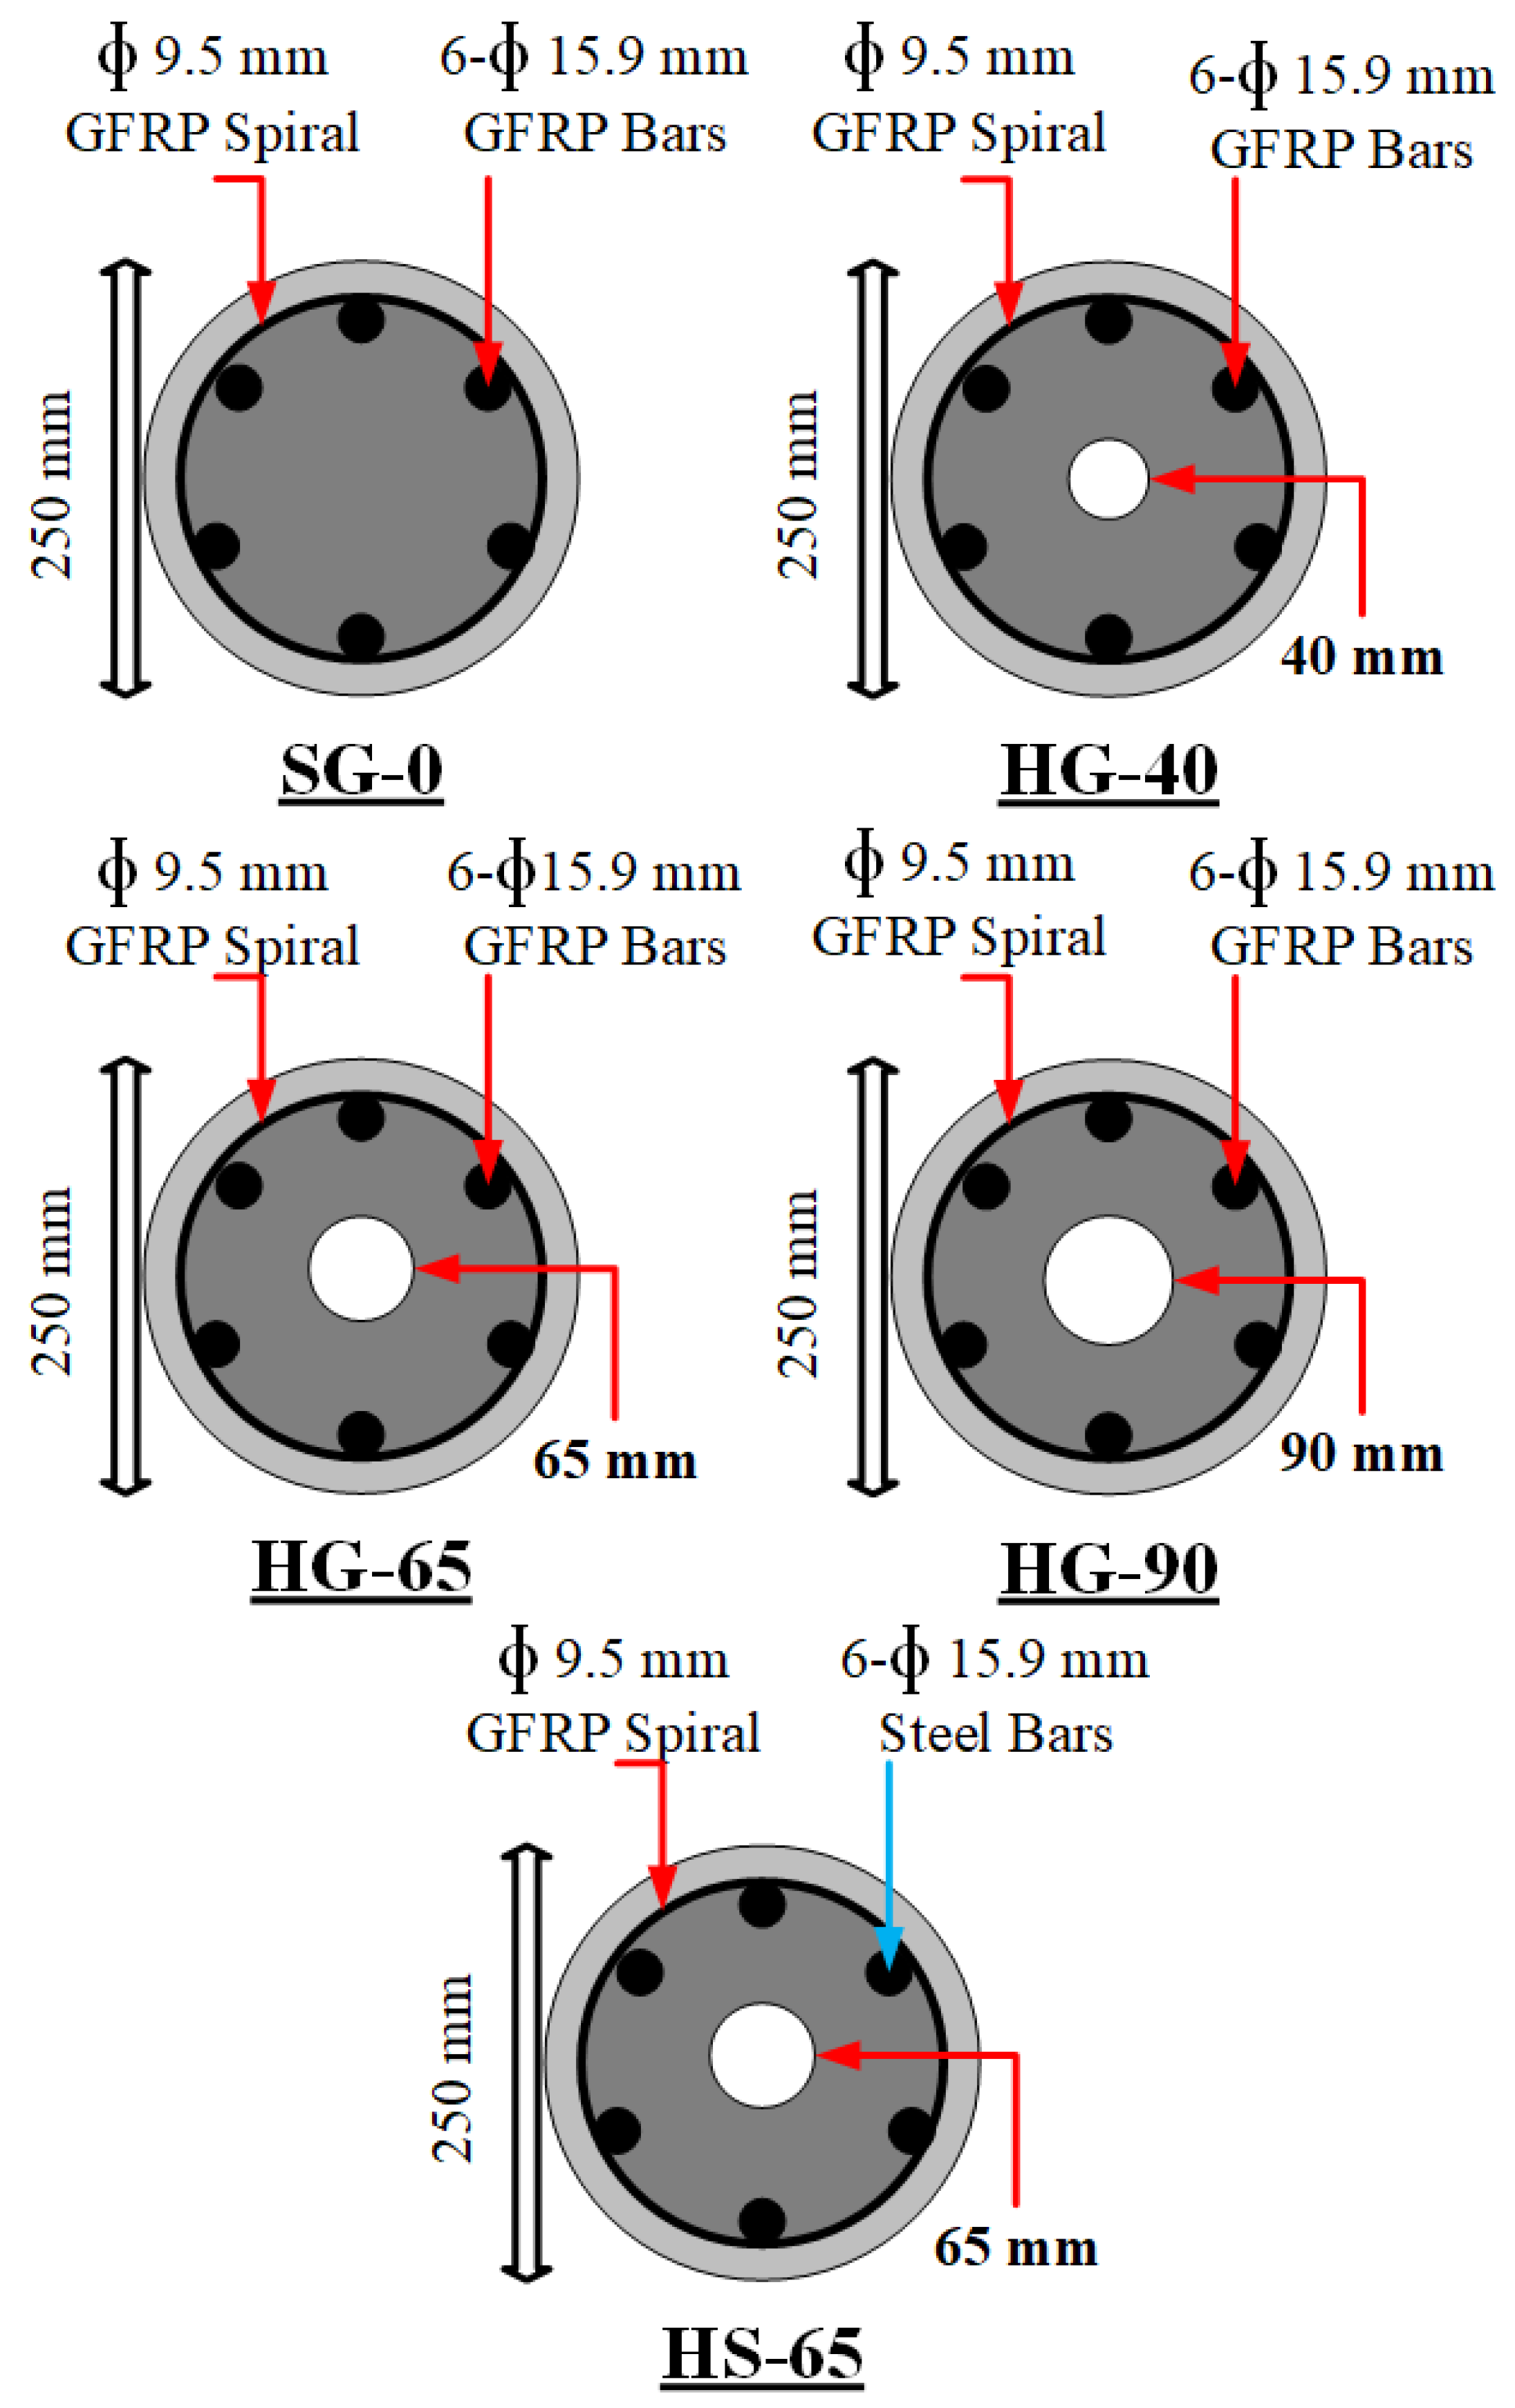
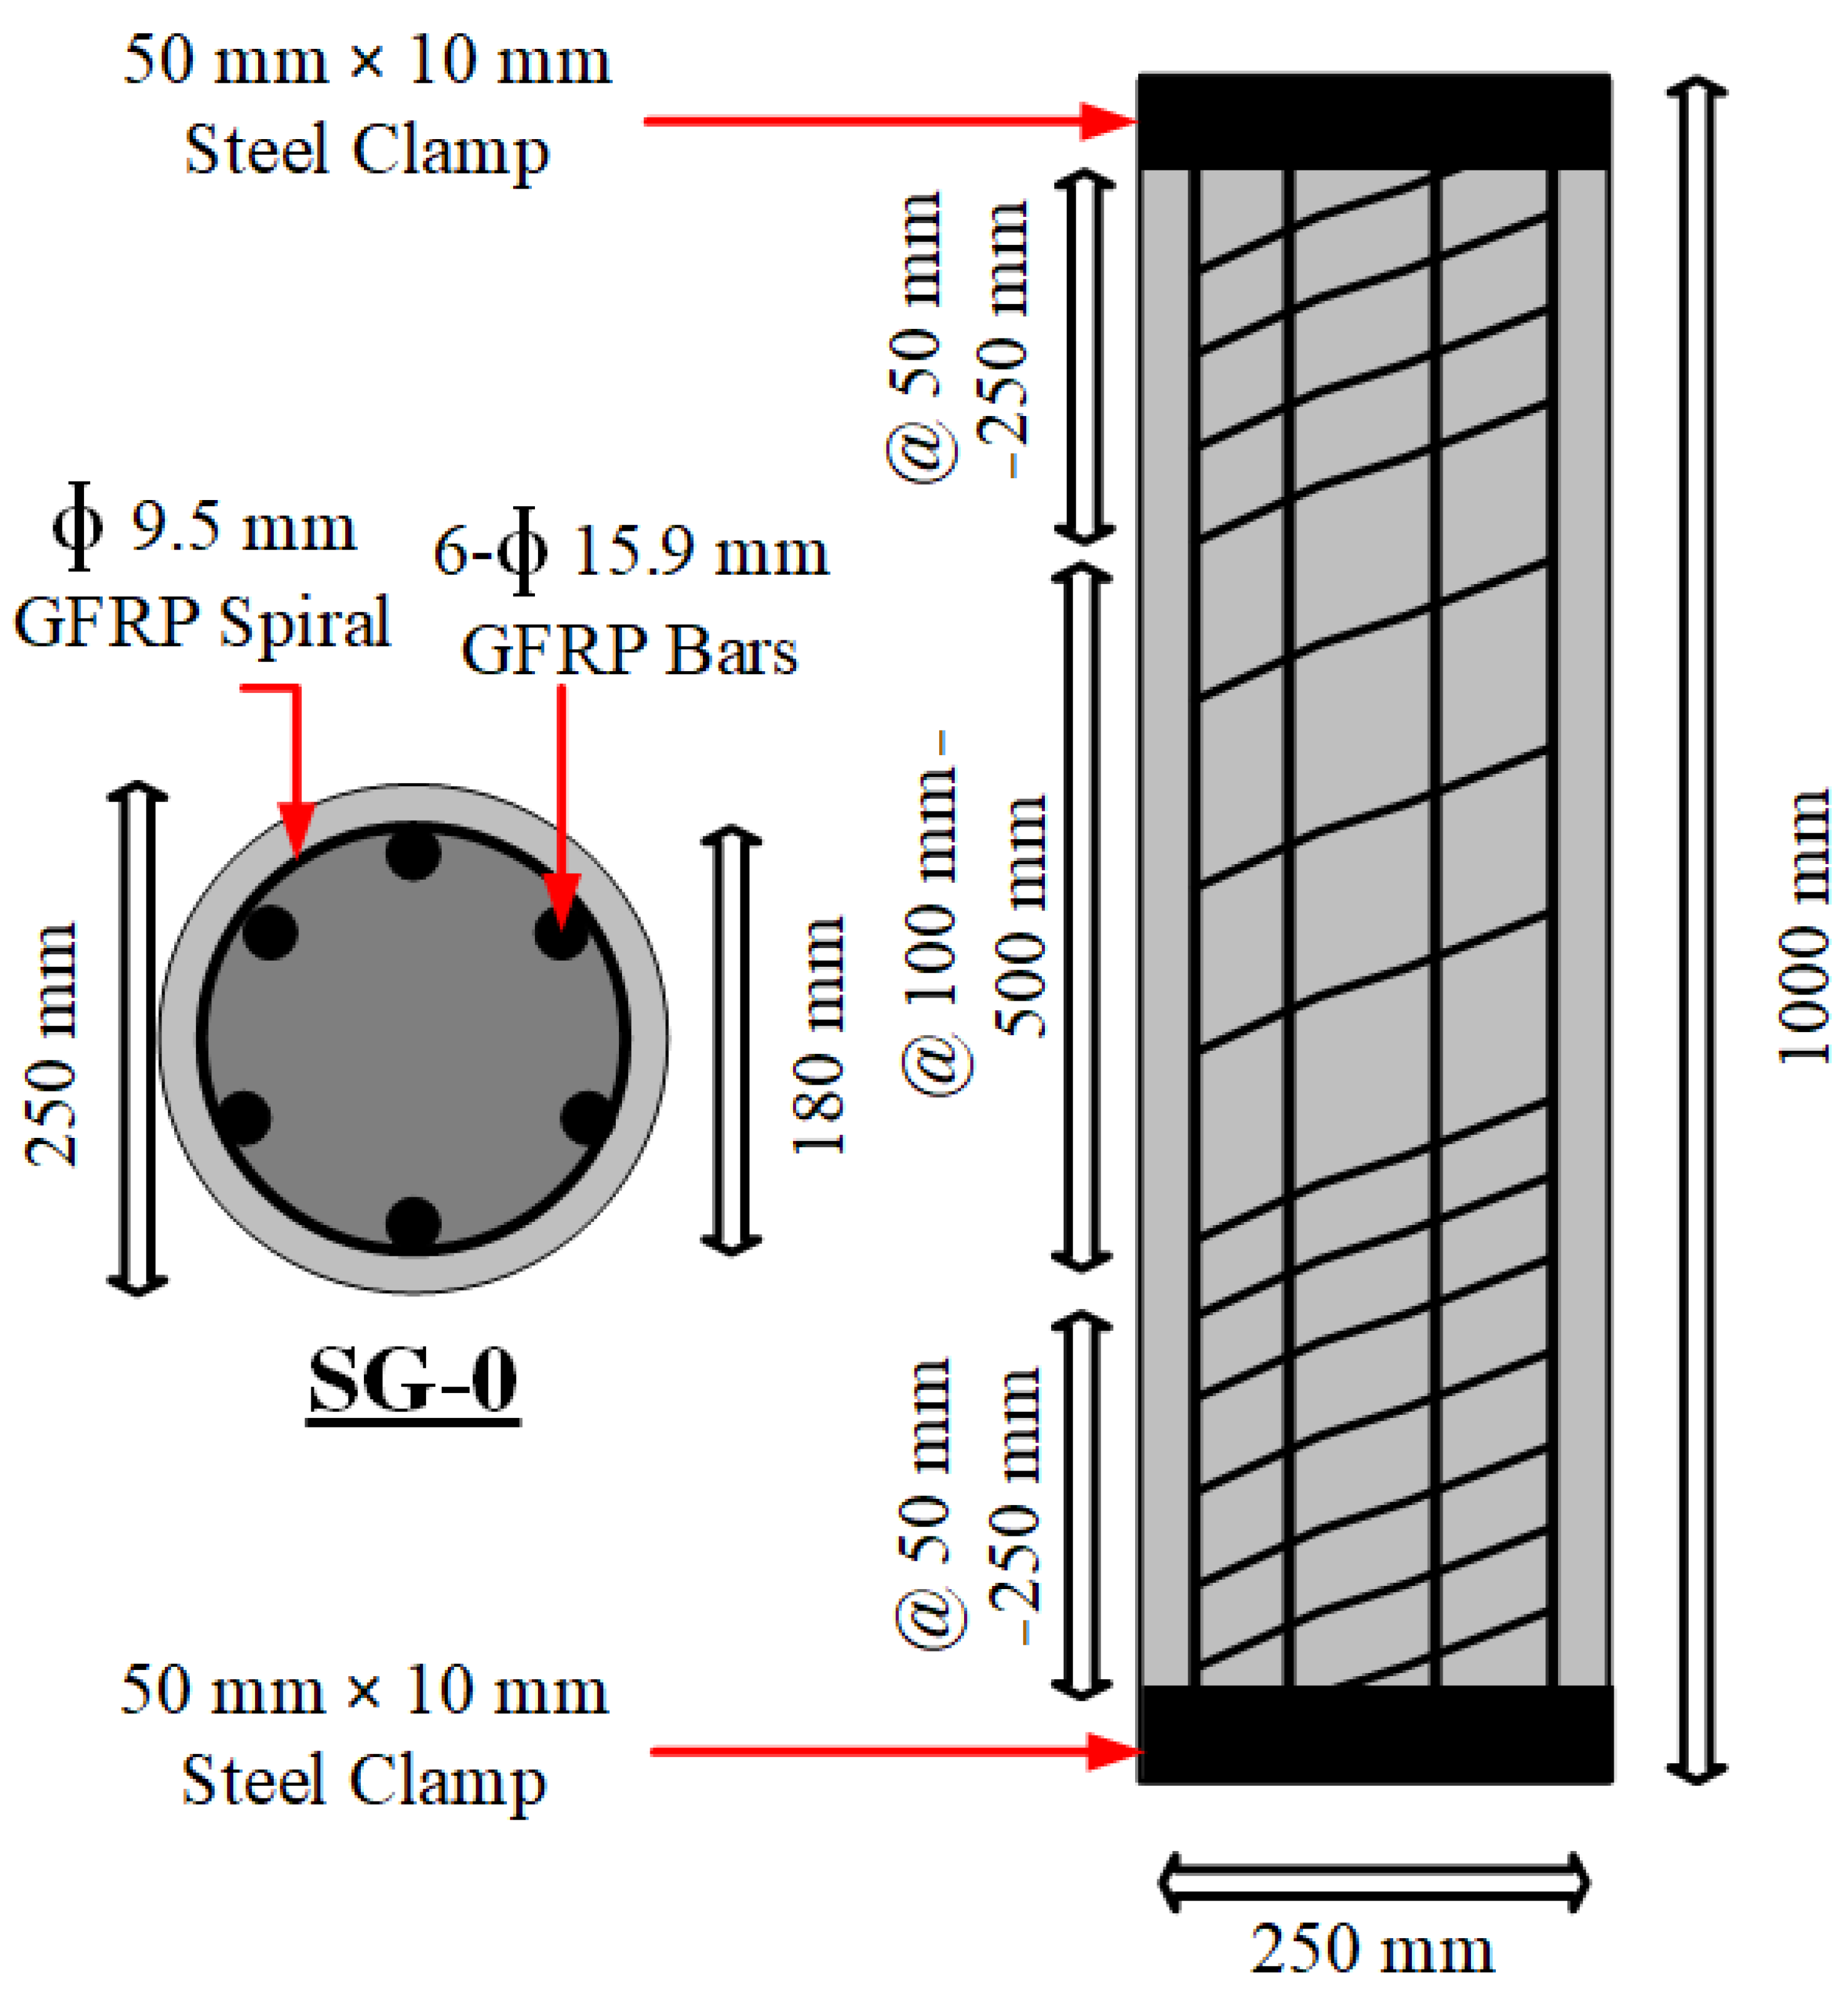
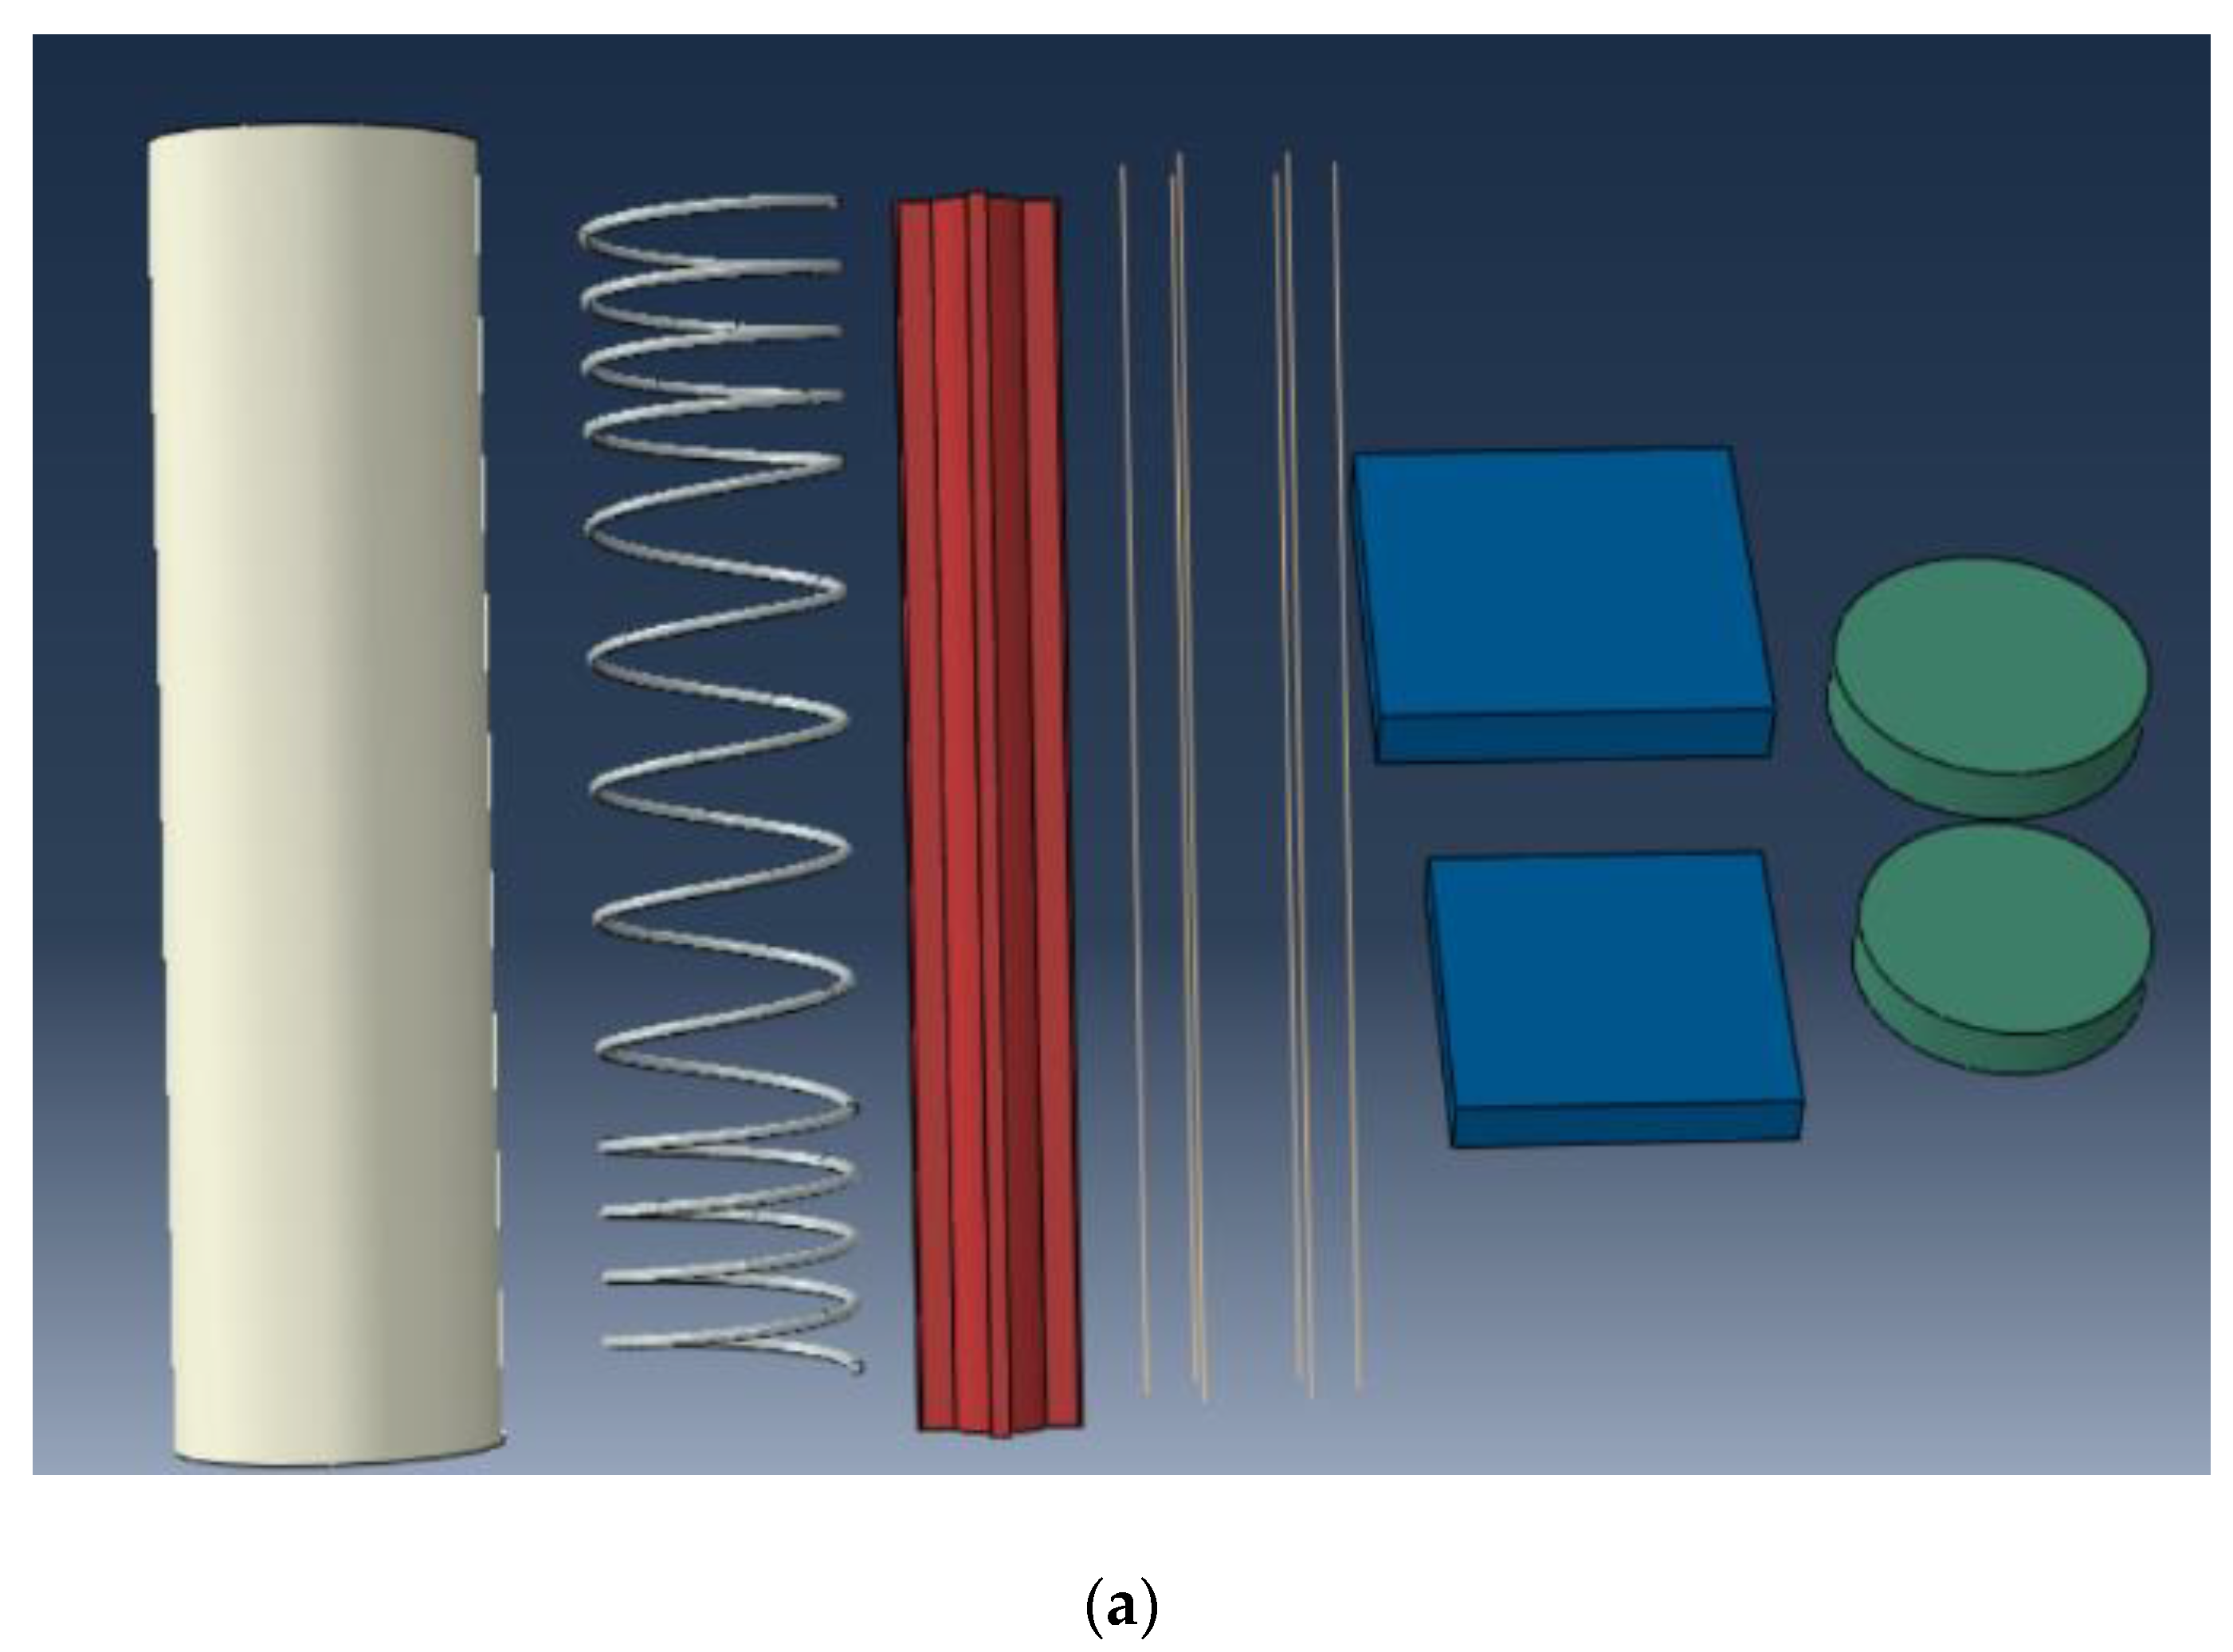
2.2. Preparation of Specimens

Five RC columns (each 1000 mm high with 250 mm diameter) were cast and evaluated, as presented in Table 2. The height to diameter ratio of 4 was ensured to eliminate buckling failure, as suggested by Hadi et al. [10]. Transverse reinforcement of all five columns consisted of GFRP spirals. The GFRP spirals were provided with spacing of 100 mm c/c along the middle half of the columns’ height, while spacing of 50 mm c/c was utilized along the exterior half-length toward top and bottom. Longitudinal reinforcements in all five tested specimens comprised six reinforcement bars, attaining 2.79% reinforcement ratio, well within the recommended range for steel bars (1–4%).
Assemblage of the tested columns is displayed in Figure 2, while parametric properties of various specimens are summarized in Table 2. The nomenclature of the specimens consists of two letters followed by a number. The first letter (S/H) defines whether the column is solid or hollow, the second letter (G/S) represents the type of main reinforcements (GFRP or steel), while the number designates the column’s inner diameter (mm). For example, specimen HG-90 stands for a hollow column, GFRP reinforced with 90 mm inner core diameter. Figure 2 depicts the cross sections of column specimens. In the figure, the light grey color illustrates the concrete cover of each specimen, the dark grey color shows the concrete core, and the inner white color displays the hollow core of the specimen.
Four columns were GFRP-reinforced, with one solid and three hollow cross sections (Figure 2), to achieve varying inner-to-outer diameter ratios (i/o), reinforcement ratios, and volumetric ratios. The fifth column was reinforced with steel bars, having inner diameter of 65 mm, which was used as a yardstick.

2.3. Test Setup and Instrumentation

A concentric monotonic load of 2000 kN at the rate of 1.5 mm/min was applied via a hydraulic cylinder to evaluate the columns. To ensure the occurrence of failure at the desired point (columns’ mid-height), 50 mm wide and 10 mm thick steel clamps were fixed to the columns’ top and bottom along with a 3 mm rubber pad, as illustrated in Figure 3. The deformation of the rubber pads was ignored during the experiment since it had no effect on the results. The applied load, axial deformation, and strain were regularly recorded using System 5000 data logger during the testing period. The cracking pattern was cautiously observed while loading the specimens.

3. FEA

3.1. Overview

The FEA of the RC columns was performed by modeling the constituent materials (concrete as well as GFRP and steel reinforcements) and their behavior. Abaqus [46] was utilized for the FEA of the RC columns. The concrete and reinforcements were simulated as a 3D solid stress section and 3D deformable wire elements, respectively. To ensure gradual application of applied load and its even distribution, a steel plate along with a 3 mm thick rubber pad was modeled and tied at the column’s top and bottom. After applying boundary conditions and loading, the controlled model was calibrated for parameters such as concrete shape factor, dilation angle, viscosity parameter, size of mesh, and type of mesh element. Next, further parametric study of additional parameters was conducted using the calibrated finite element model.

3.2. Simulation of Concrete (CDP Model)

3.2.1. Concrete Plasticity Models

In Abaqus, the concrete’s response in inelastic range can be defined using three different types of models, namely the CDP model, concrete smeared cracking (CSC) model, and brittle cracking concrete (BCC) model [46]. The CDP model is a damage model based on plasticity and like the other two, it also explains the concrete’s behavior and failure pattern, both the tensile cracking and compressive crushing. However, this model (Figure 4) is the most accurate of all as it delivers the output results more accurately in comparison with the CSC and BCC models. The peak stress of confined concrete is f’cc, and the failure stress of confined concrete is rk3f’cc with its corresponding strain as ε c u , while the peak stress of un-confined concrete is fcm with its corresponding strain as ε c 1 .

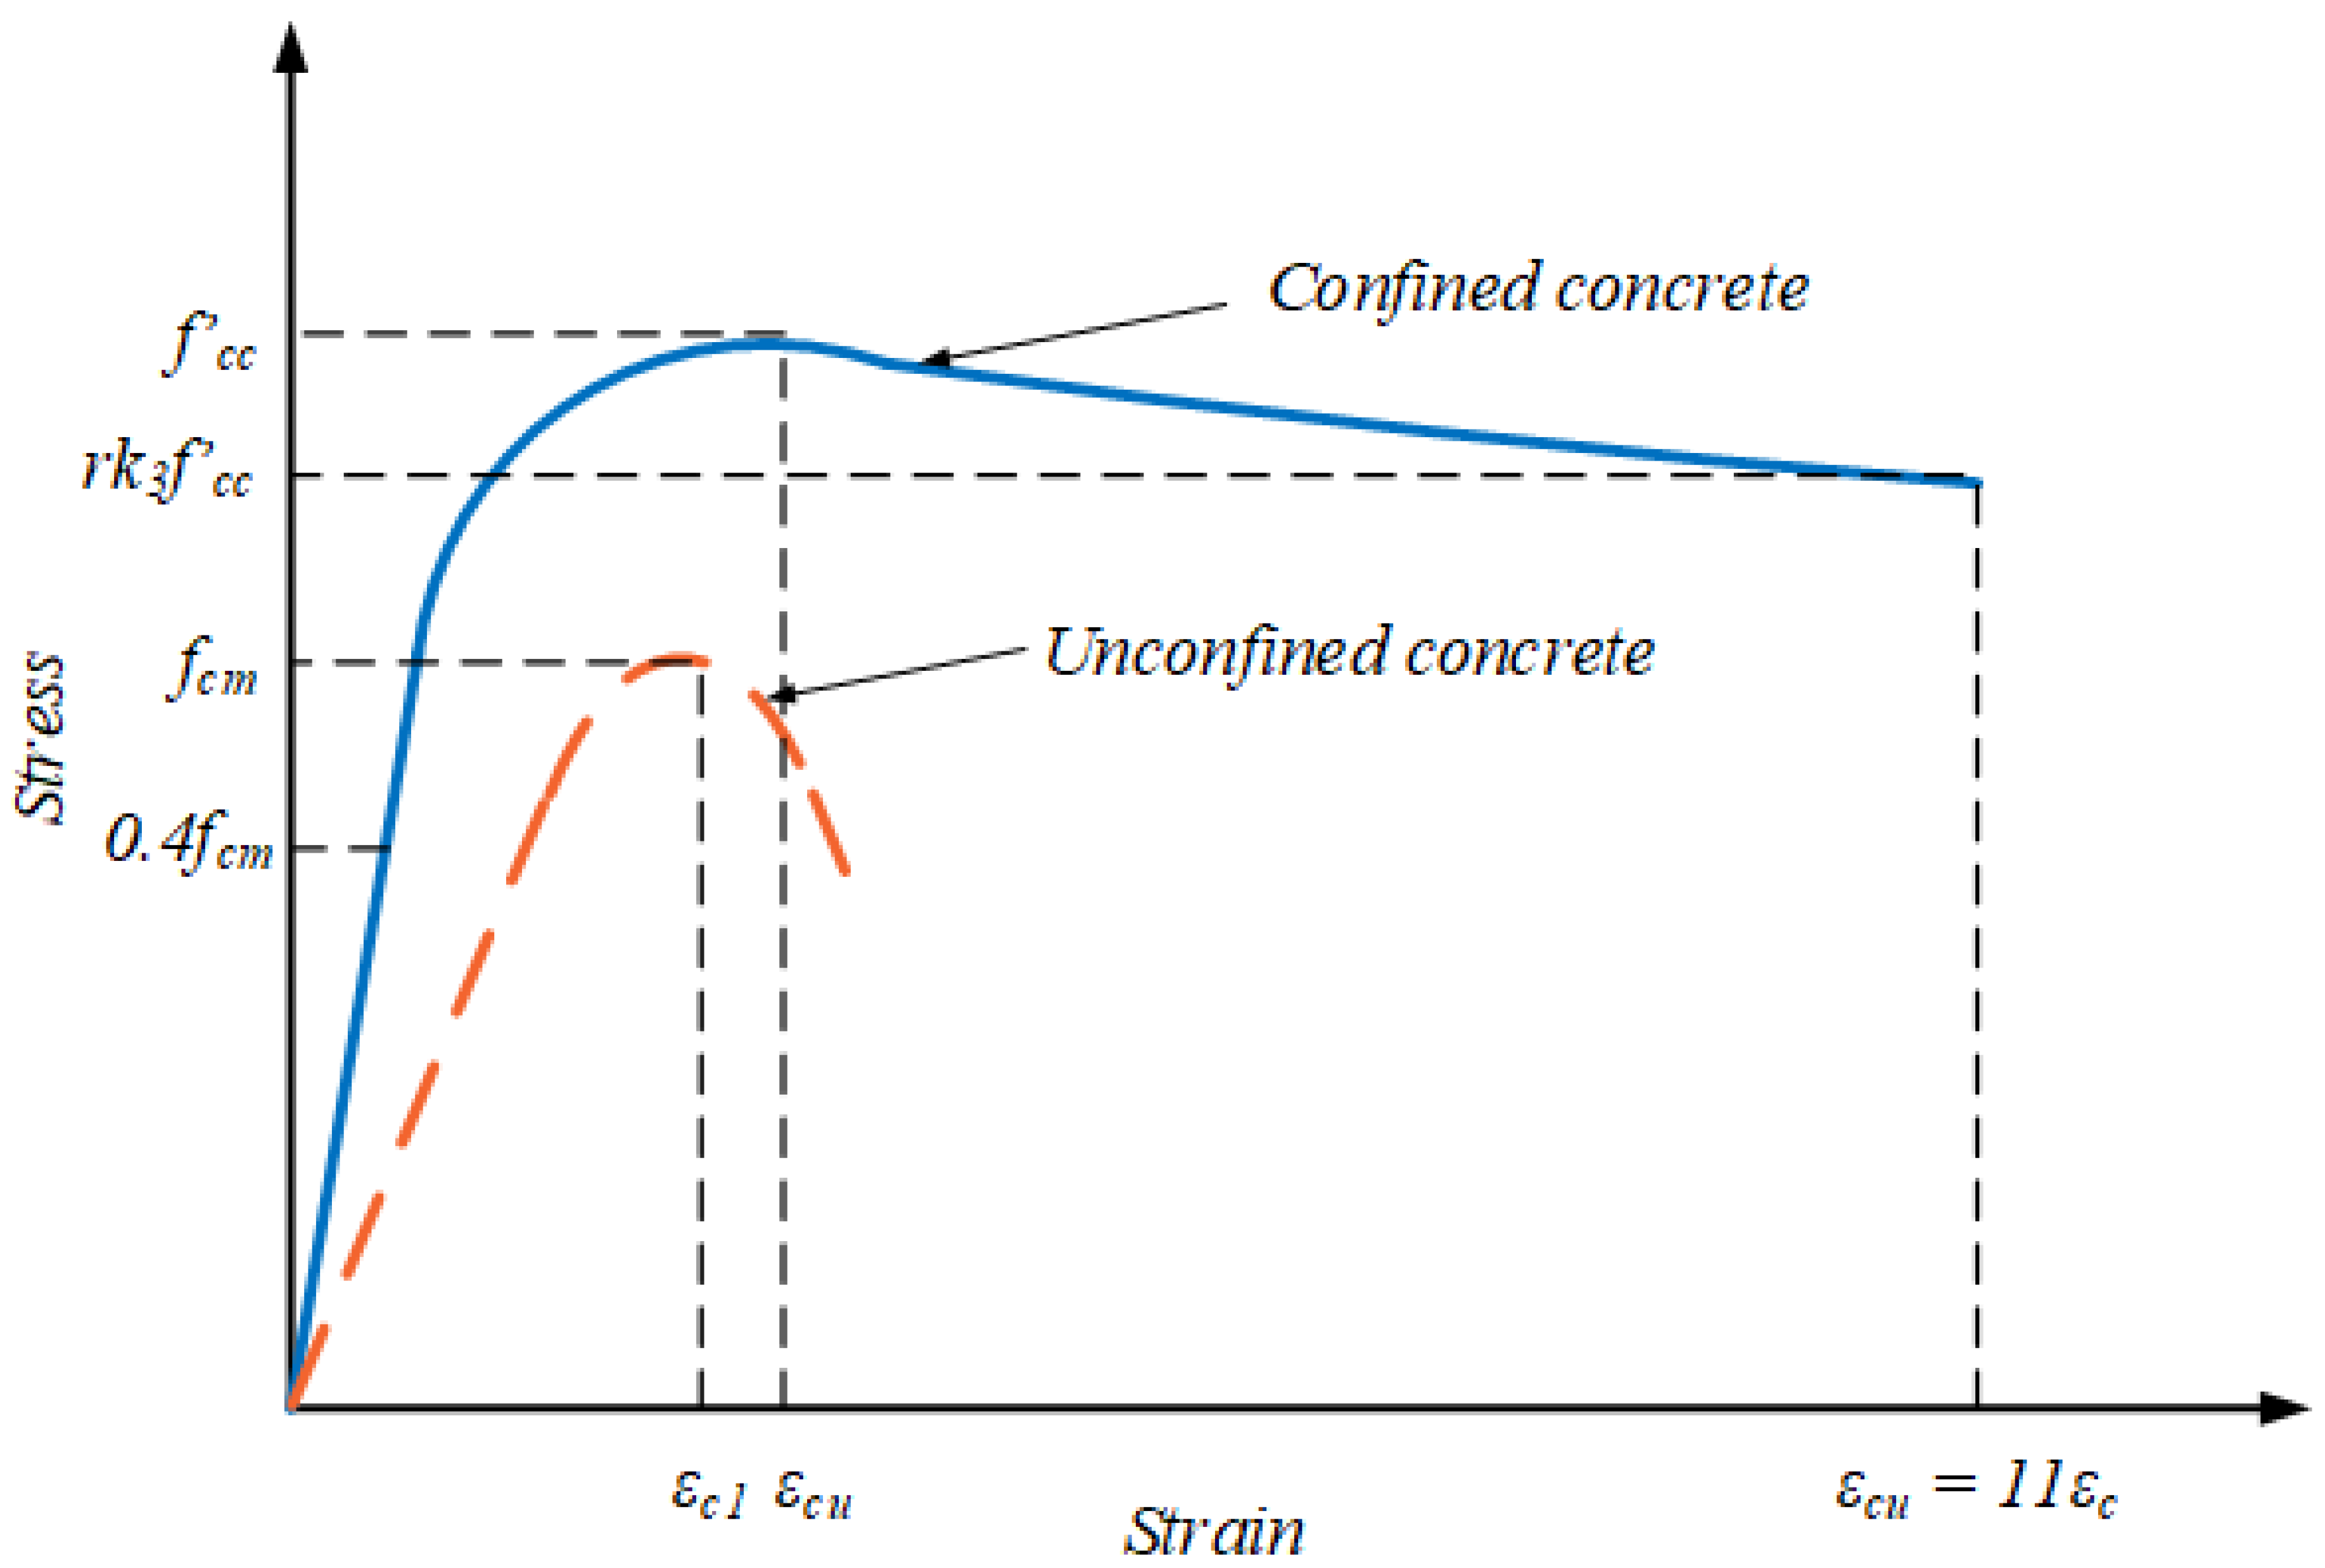
3.2.2. Computation of Compressive and Tensile Stresses

The uniaxial stress–strain relation is useful in obtaining the stress versus plastic-strain relation by providing stress versus “inelastic” strain data to Abaqus which automatically carries out the conversion and calculation. Thus, if ε t p l and ε c p l are equivalent plastic strains in tension and compression, respectively, ε t . p l and ε c . p l are rates of equivalent plastic strains in tension and compression, respectively, θ represents the temperature, and fi demonstrates another defined variable, then, tensile and compressive stresses σ t   and σ c are:
σ t = σ t ε t p l , ε t . p l , θ , f i
σ c = σ c ε c p l , ε c . p l , θ , f i
During unloading of concrete in the strain softening phase, the elastic stiffness of the concrete is diminished or reduced. This reduction in the elastic stiffness is dependent upon the temperature, the plastic strains, and other field variables, and is designated by the two damage variables, dt and dc, with the values ranging from 0 (for undamaged material) to 1 (totally damaged material), as mentioned below:
d t = d t ( ε t p l , θ , f i )
d c = d c ( ε c p l , θ , f i )
where 0 ≤ dt and dc ≤ 1.
The stress–strain curves under both tensile and compressive uniaxial loads are provided by the following equation, where E0 indicates the undamaged initial elastic stiffness of concrete.
σ t = 1 d t   E 0 ε t ε t p l
σ c = 1 d c   E 0 ε c ε c p l

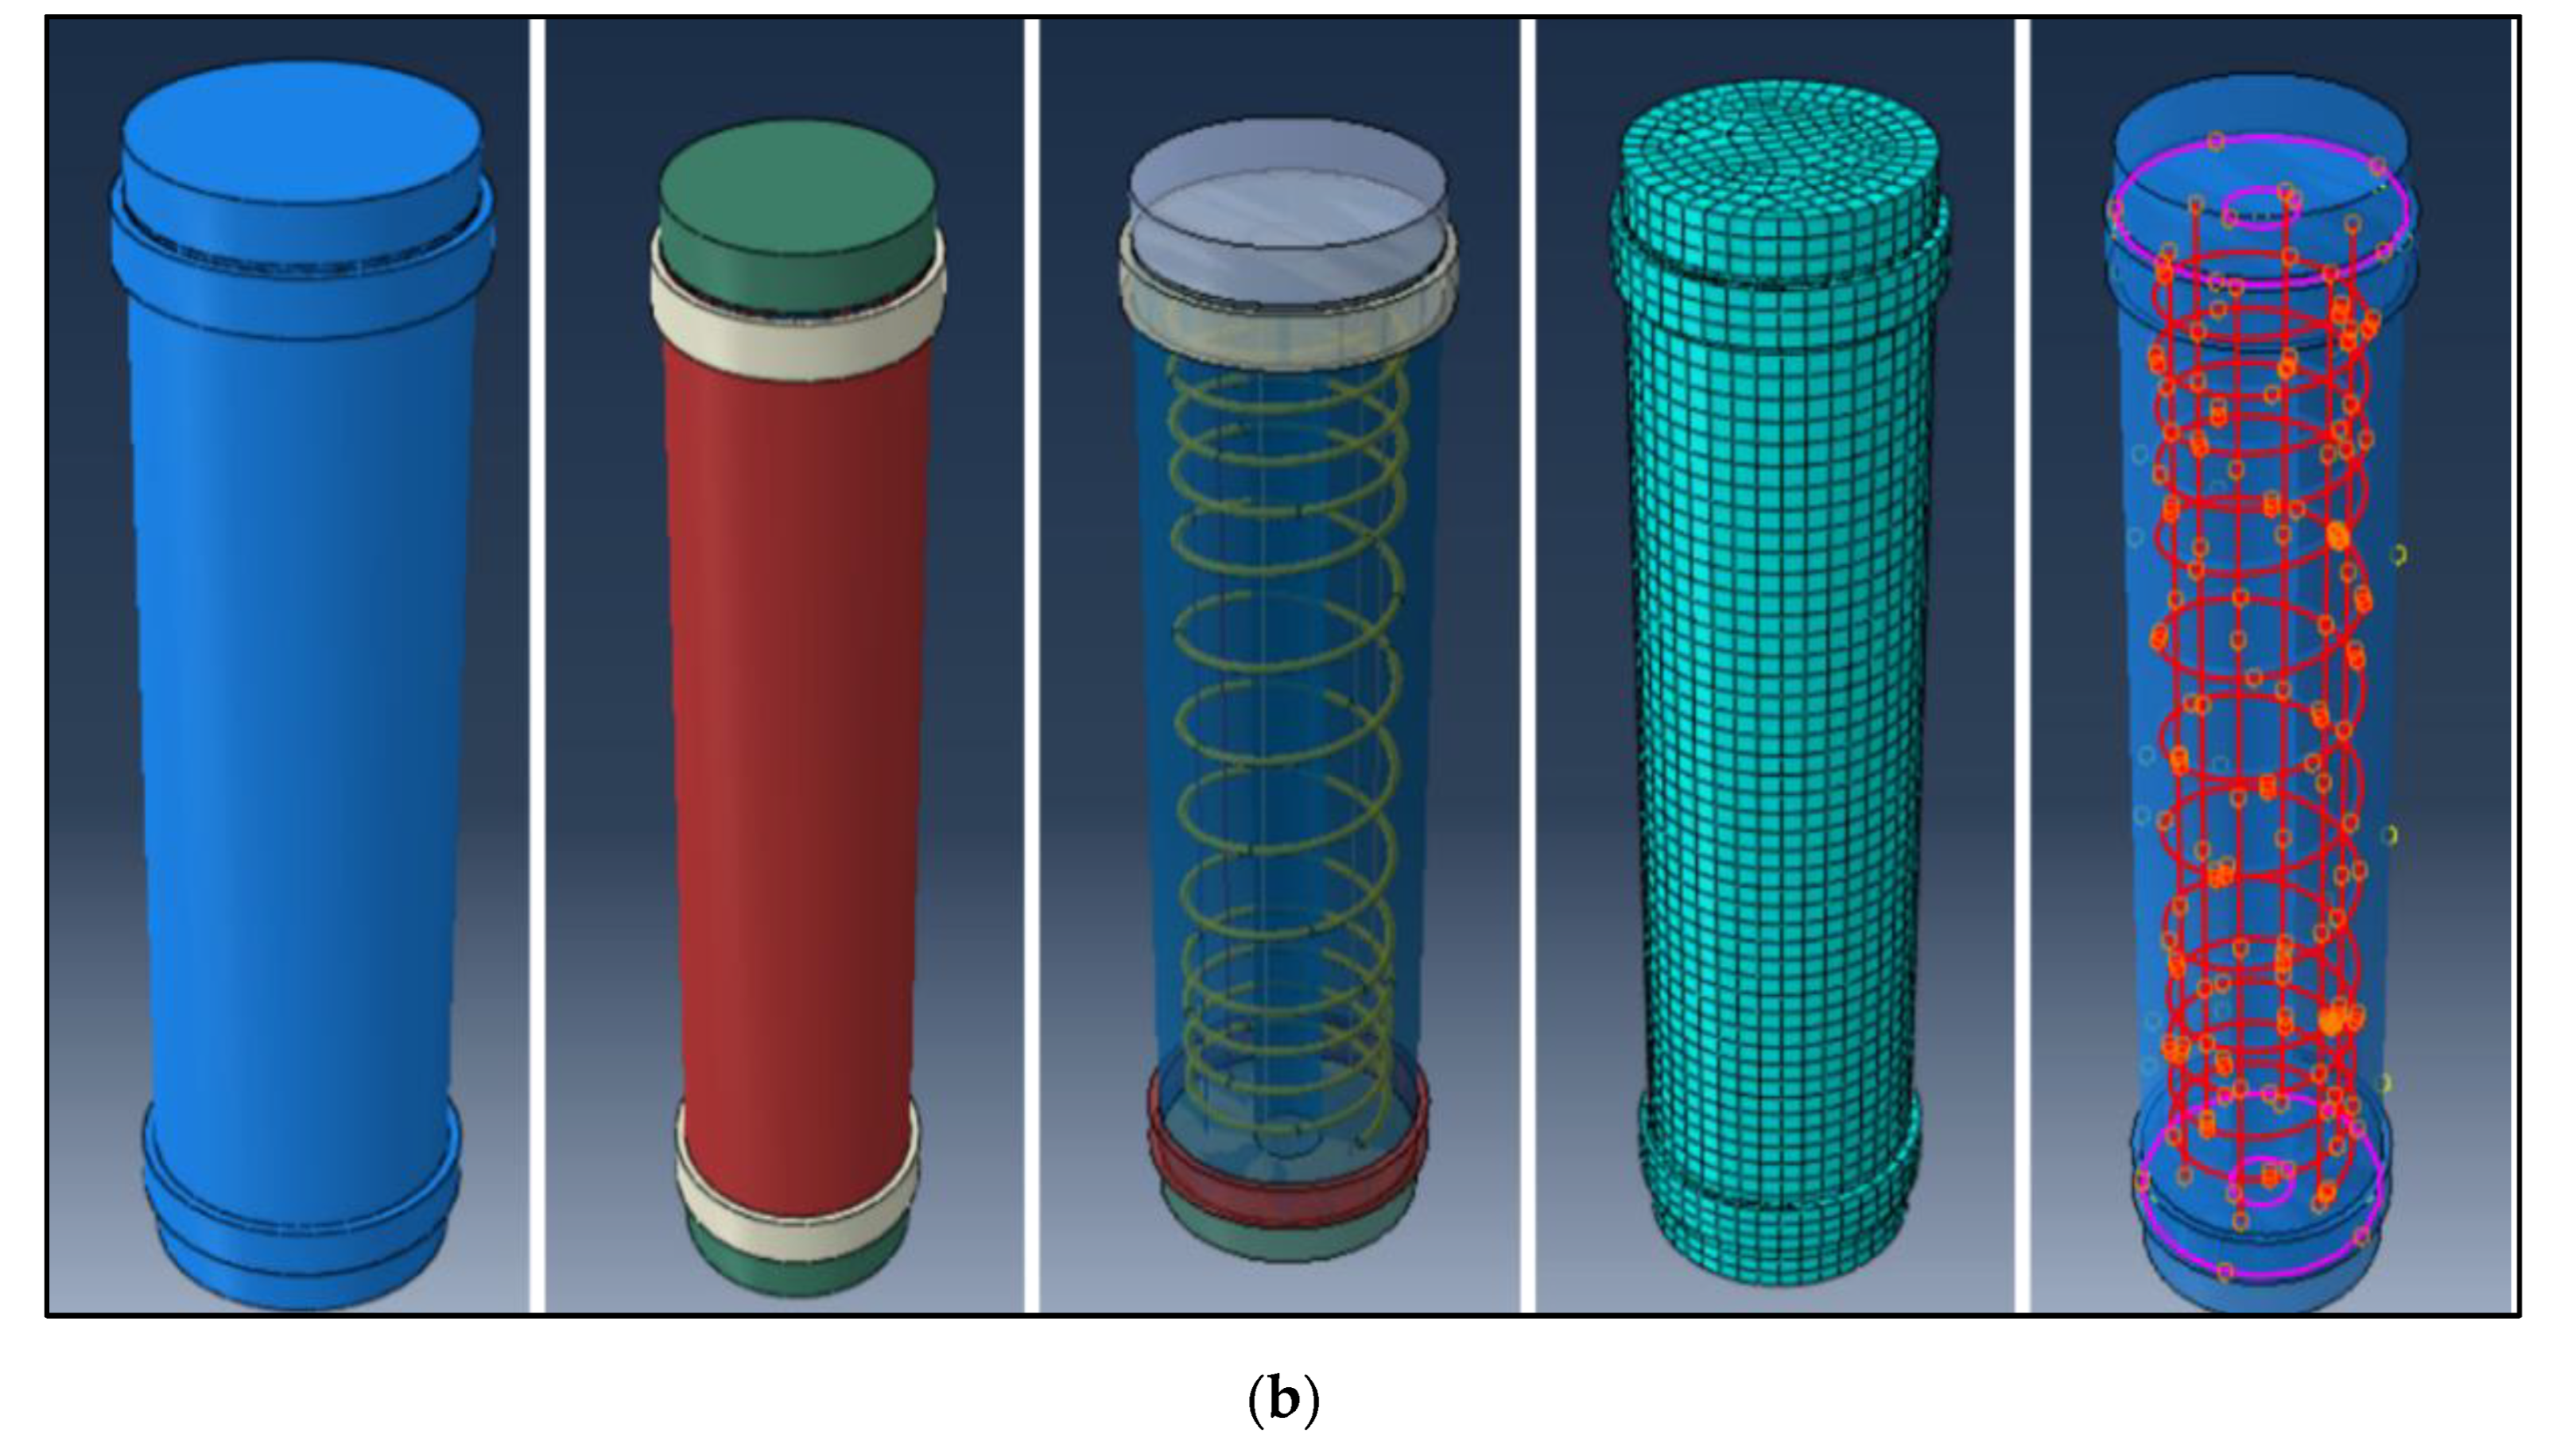
3.3. Finite Element Modeling

3.3.1. Geometric and Material Properties

The concrete core was simulated using a 3D solid feature, with the third dimension as an extrusion type. The GFRP and steel bars were simulated using a 3D wire frame, with planar third dimension. The GFRP spirals, presented as 3D solid features, were wound around the bars with a translational pitch of 50 mm. As GFRP has higher resistance against corrosion; therefore, relatively lesser clear cover was used for the GFRP reinforcements, as suggested by [22,23]. Few additional parts incorporated as parts of testing apparatus, such as top and bottom steel plates, top and bottom peripheral collars, and rubber pads, were also simulated as 3D solid features, using standard properties of steel and rubber, as can be observed from Figure 5a,b. Regarding rigidity, all the components were selected as deformable to allow for deformations under loading, thus enabling measuring their response.
For the simulation of concrete’s plasticity, the CDP model was implemented thanks to its comparative advantages. The steel and GFRP reinforcements were taken as linear elastic materials. Other properties of the materials are reported in Table 3.

3.3.2. Finite Element Mesh

Two important aspects of meshing are the type of mesh element and mesh size. The different types of mesh elements available in Abaqus can be grouped into two main sets. One is 3D stress elements, while the second is 3D wire elements. The 3D wire elements consist of T3D2H and T3D3H sub-types. The 3D stress elements are a variety of element types including hexahedral (C3D8R) and tetrahedral elements (C3D10H, C3D6H, and C3D4H). In this model, the GFRP and steel reinforcements were meshed using T3D2 elements, which means a 2-node truss with reduced integration. For the simulation of concrete, however, C3D8R elements were utilized which are 8-node, three-dimensional, hexahedral elements with reduced integration. The suitability of the use of these elements for non-linear static and dynamic analysis was also validated by Amiri et al. [47]. After defining the mesh type, a mesh size of 20 mm was selected through calibration, which demonstrated a close correlation with the experimental work.

3.3.3. Constraints and Interactions

The interaction amongst various components was modeled by “tie constraint”, using the concept of master and slave surfaces. In each two coinciding surfaces, the load transferring surface was considered to be “master surface”, while the second surface was “slave surface”. Thus, smooth transmitting of the load from the top steel plate, through the rubber pad, to the concrete column and then further to the bottom steel plate, was accurately simulated. The bond or interface of reinforcing bars and spirals with concrete was modeled with the help of another constraint “embedded region” in which reinforcements were defined as the “embedded elements” while concrete acted as “host region”.
The bottom ends of the modeled column specimens were fixed using “encased”, while no boundary condition was applied on the top ends, leaving them free to move in all directions. An axial static concentric load was applied at the center point of the RC columns’ top to explore the response of the columns under compressive load up to failure. The load was simulated using equivalent displacement instead of actual load. The displacement control technique was used to avoid damage to expensive testing equipment as a result of the load failure and consequent material rupture. To apply a concentric load of 25 kN, the equivalent displacement of 20 mm was used. The initial and maximum increment size of loading was kept as 0.01, minimum increment size was used as 10−15, and maximum number of increments was limited to 1000.

3.4. Calibration of Control Model

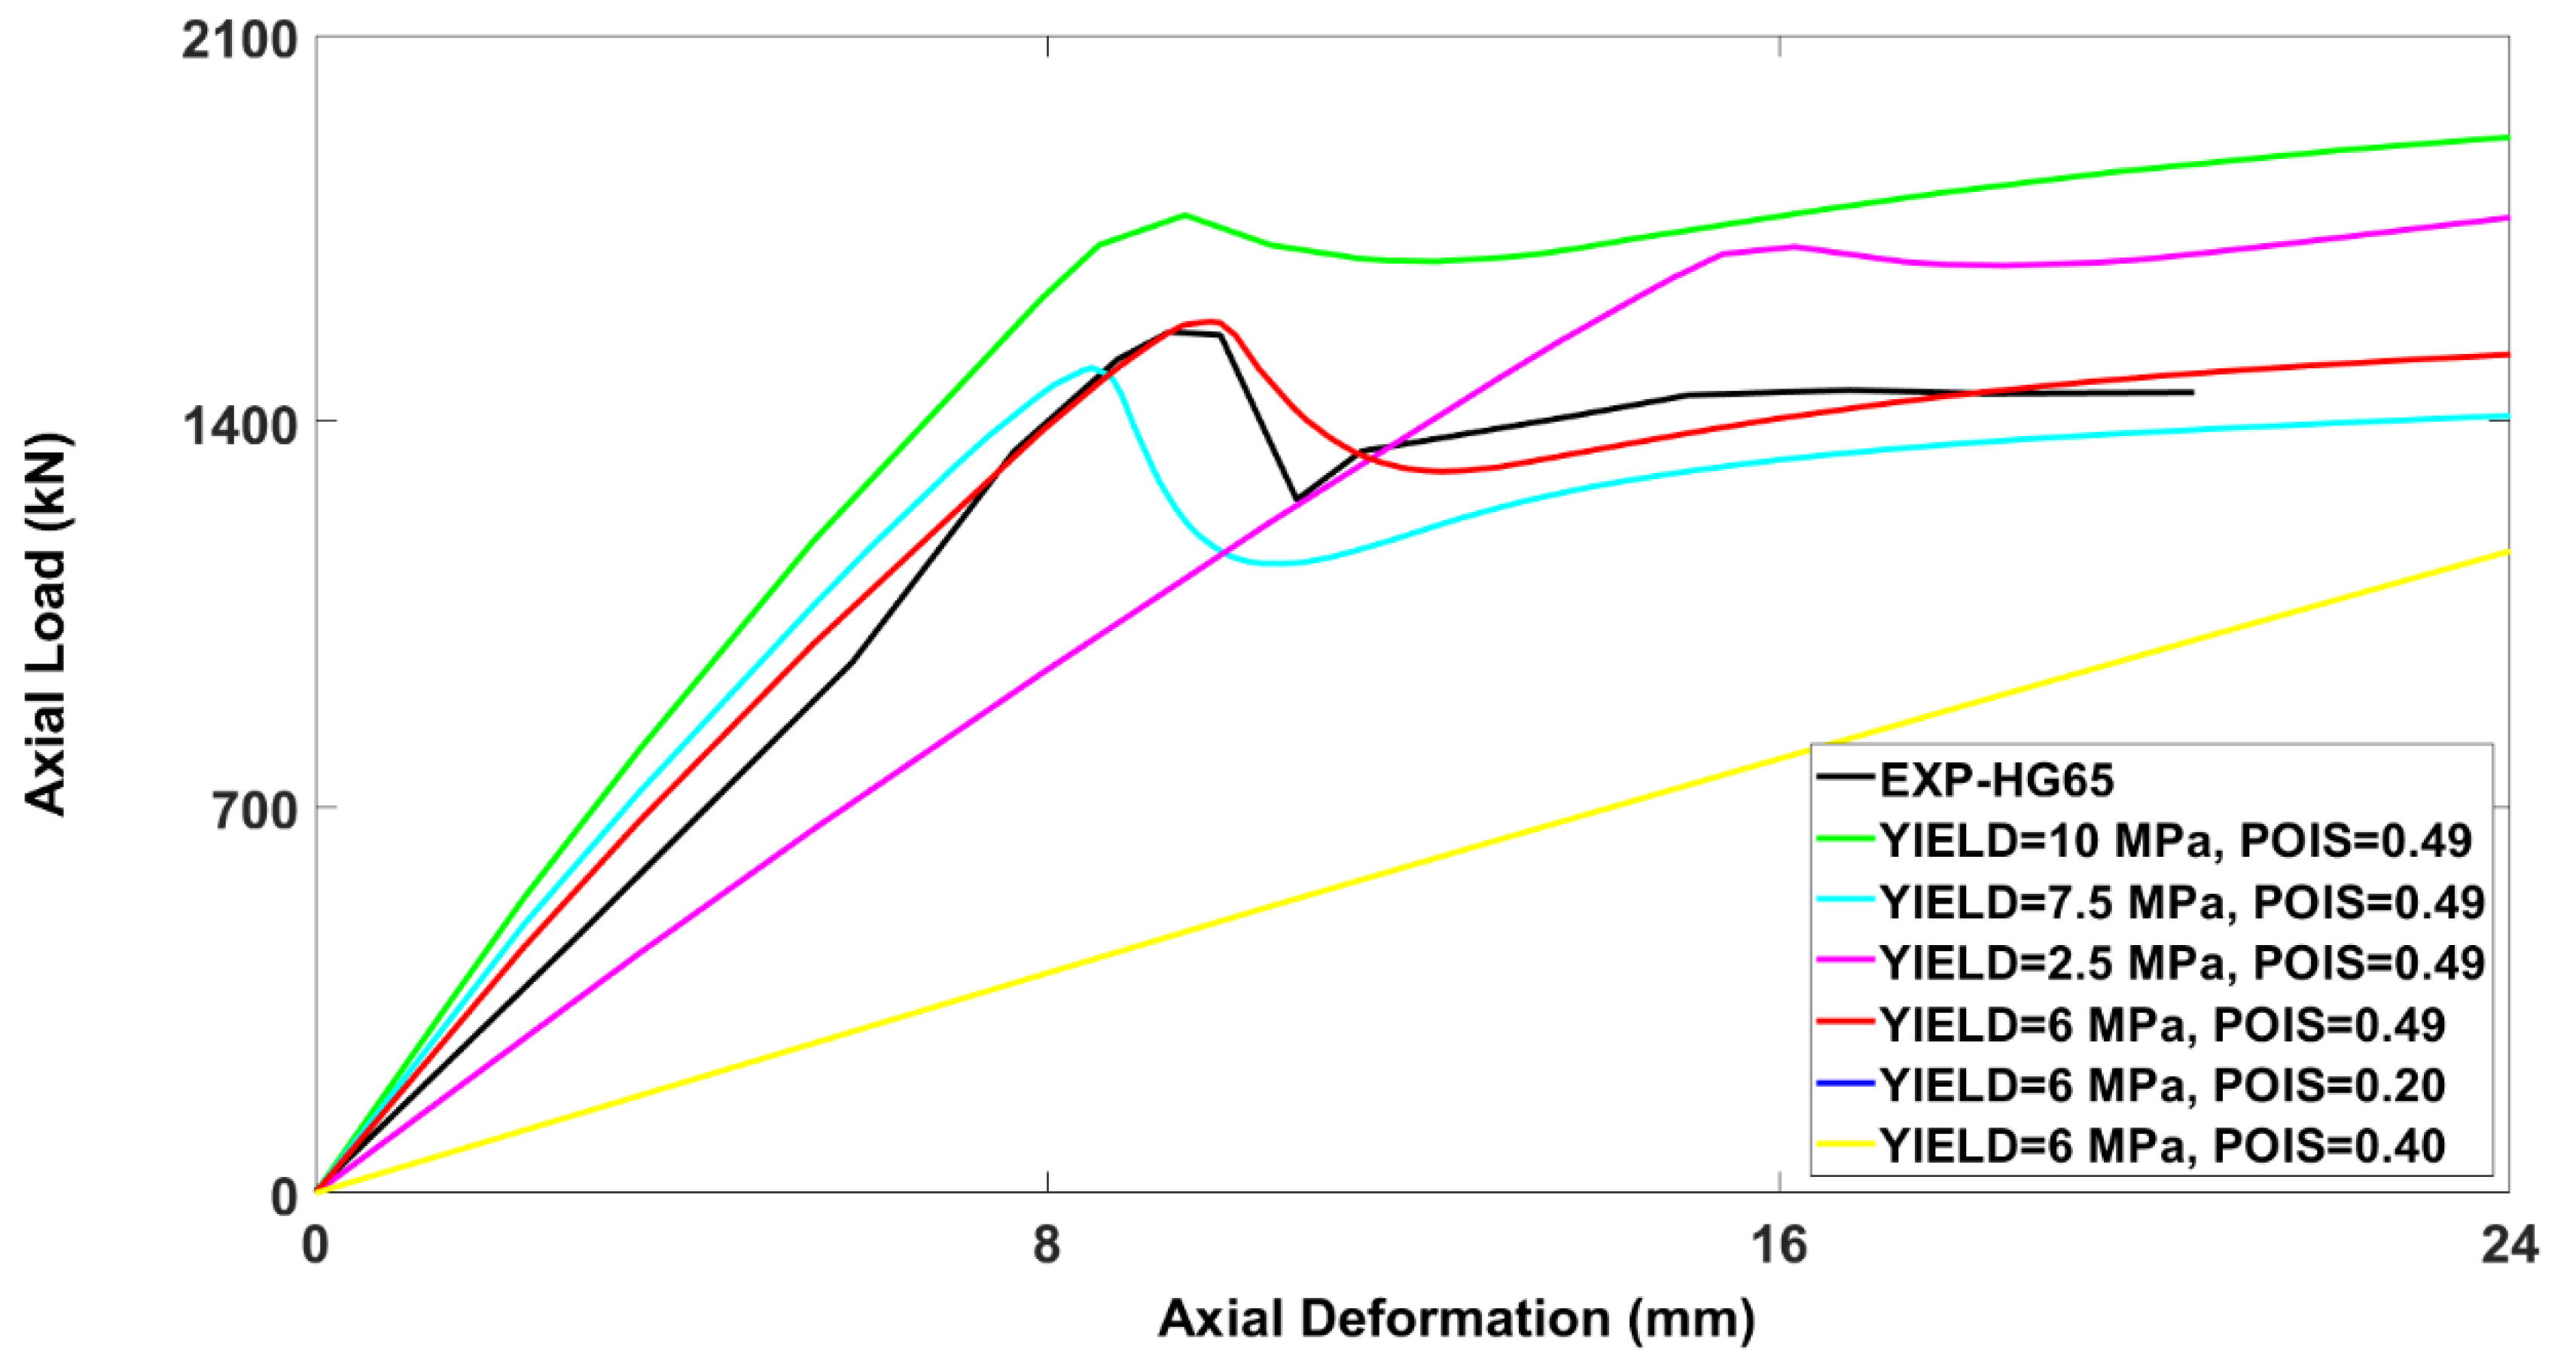
3.4.1. Parameters for Calibration

The calibration and authentication of the finite element model is necessary to accurately examine the effect and relative impact of various parameters and geometric or material properties of the model. For this reason, a control specimen (HG-65) from experimental work in [35,36,37] was used to calibrate the developed numerical model. The finite element model was checked for the impact of varying the mesh size, mesh element type, viscosity parameter (ν), shape factor ( K c ), and dilation angle (d). A total of 58 models were constructed, using various combinations of the above properties. The calibrated finite element model was then considered as a control model, to perform the FEA and further parametric study on all the modeled RC column specimens, as illustrated in the flow chart in Figure 6.

3.4.2. Viscosity Parameter (ν)

The initial and maximum times of increment greatly affect the viscosity parameter to be selected for the model. To attain the closest possible value, initial calibration was started using smaller values of the viscosity (almost 15% of the step time increment), as suggested by [22,23]. The viscosity values of 0.001, 0.0018, 0.002, 0.03, and 0.005 were examined on the control model. The variation in the axial load–axial deformation curve of HG-65 (control specimen) by varying the viscosity is shown in Figure 7. The numerical specimens, having the viscosities of 0.005 (1927.89 kN), 0.003 (1680.71 kN), 0.002 (1606.47 kN), 0.0018 (1580.82 kN), and 0.001 (1485.34 kN), demonstrated the differences of 23.43%, 7.61%, 2.85%, 1.21%, and −4.9%, respectively, in the ultimate axial load-carrying capacities compared with that of the experimental test result as 1561.0906 kN. Therefore, the closest curve was achieved using the viscosity as 0.0018.

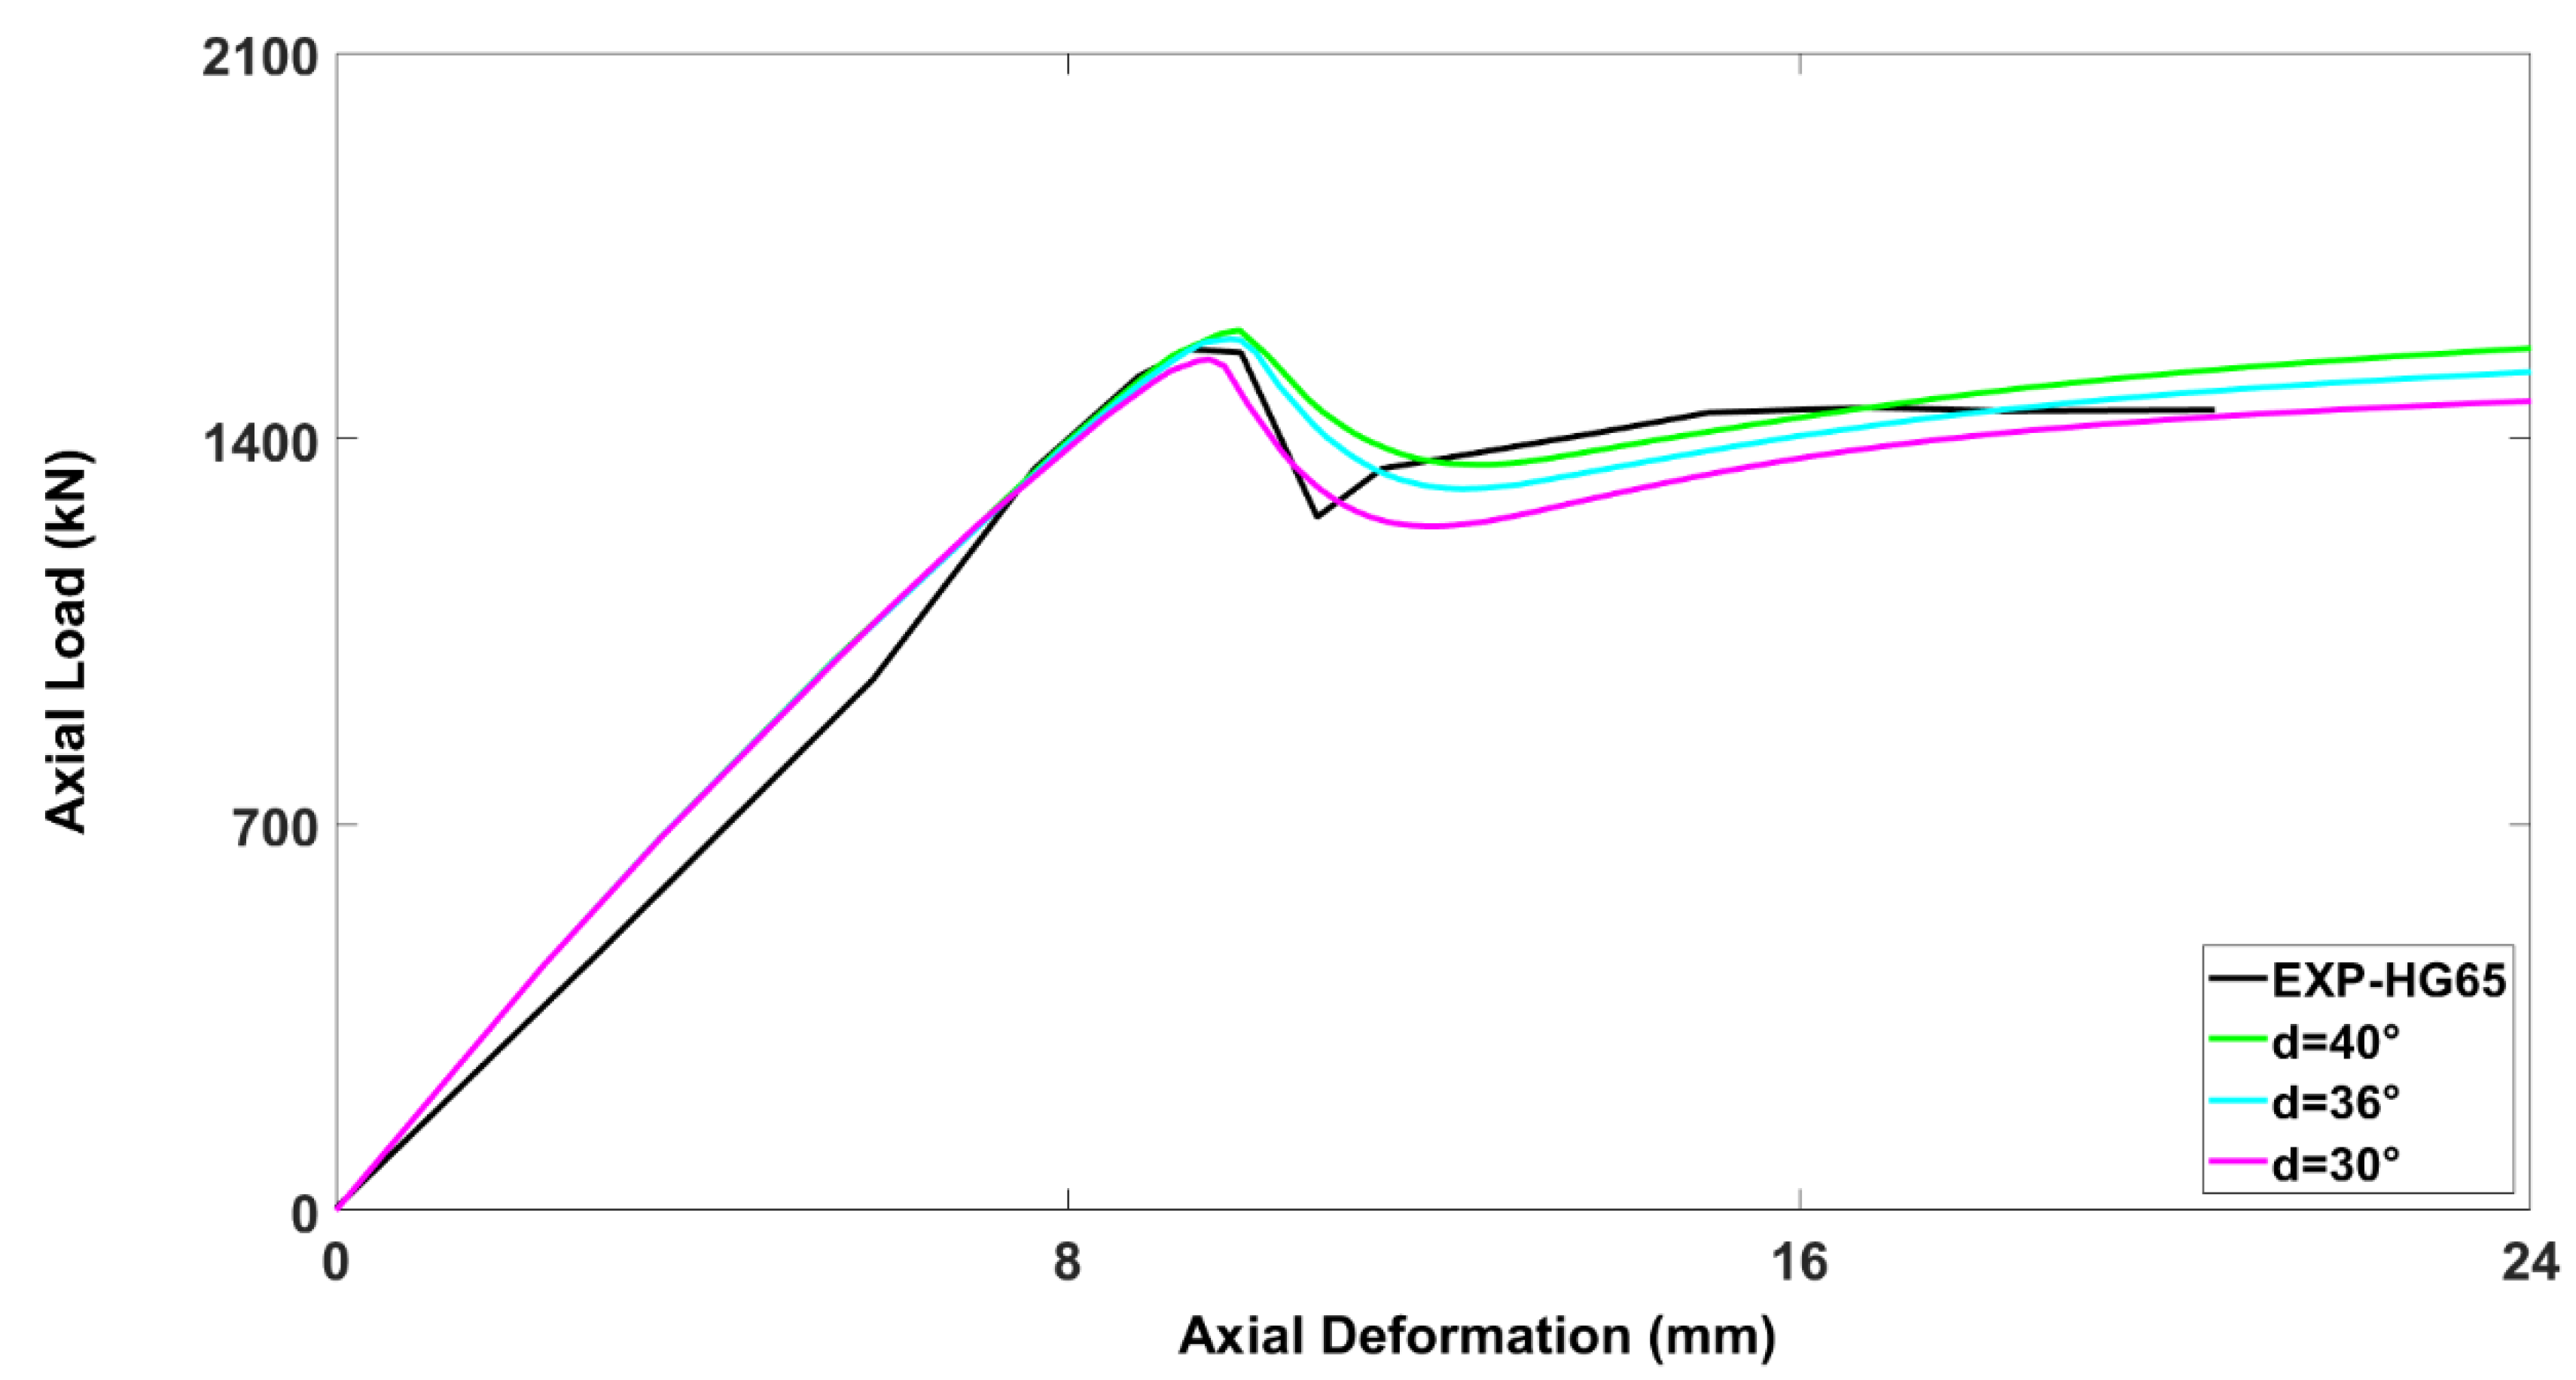
3.4.3. Dilation Angle (d)

The impact of varying the dilation angle on the axial load–axial deformation curve is not as large as that of the effect of the viscosity parameter, as indicated in Figure 8 for the control specimen (HG-65). To obtain the most accurate result, the dilation angles of 30°, 36°, and 40° were used. The numerical specimens, with the dilation angles of 40° (1596.36 kN), 36° (1580.82 kN), and 30° (1544.14 kN), illustrated the differences of 2.21%, 1.21%, and −1.14%, respectively, in the ultimate axial load-carrying capacities compared with that of the experimental test result (1561.09 kN). Consequently, the closest curve was obtained 36° as the dilation angle.

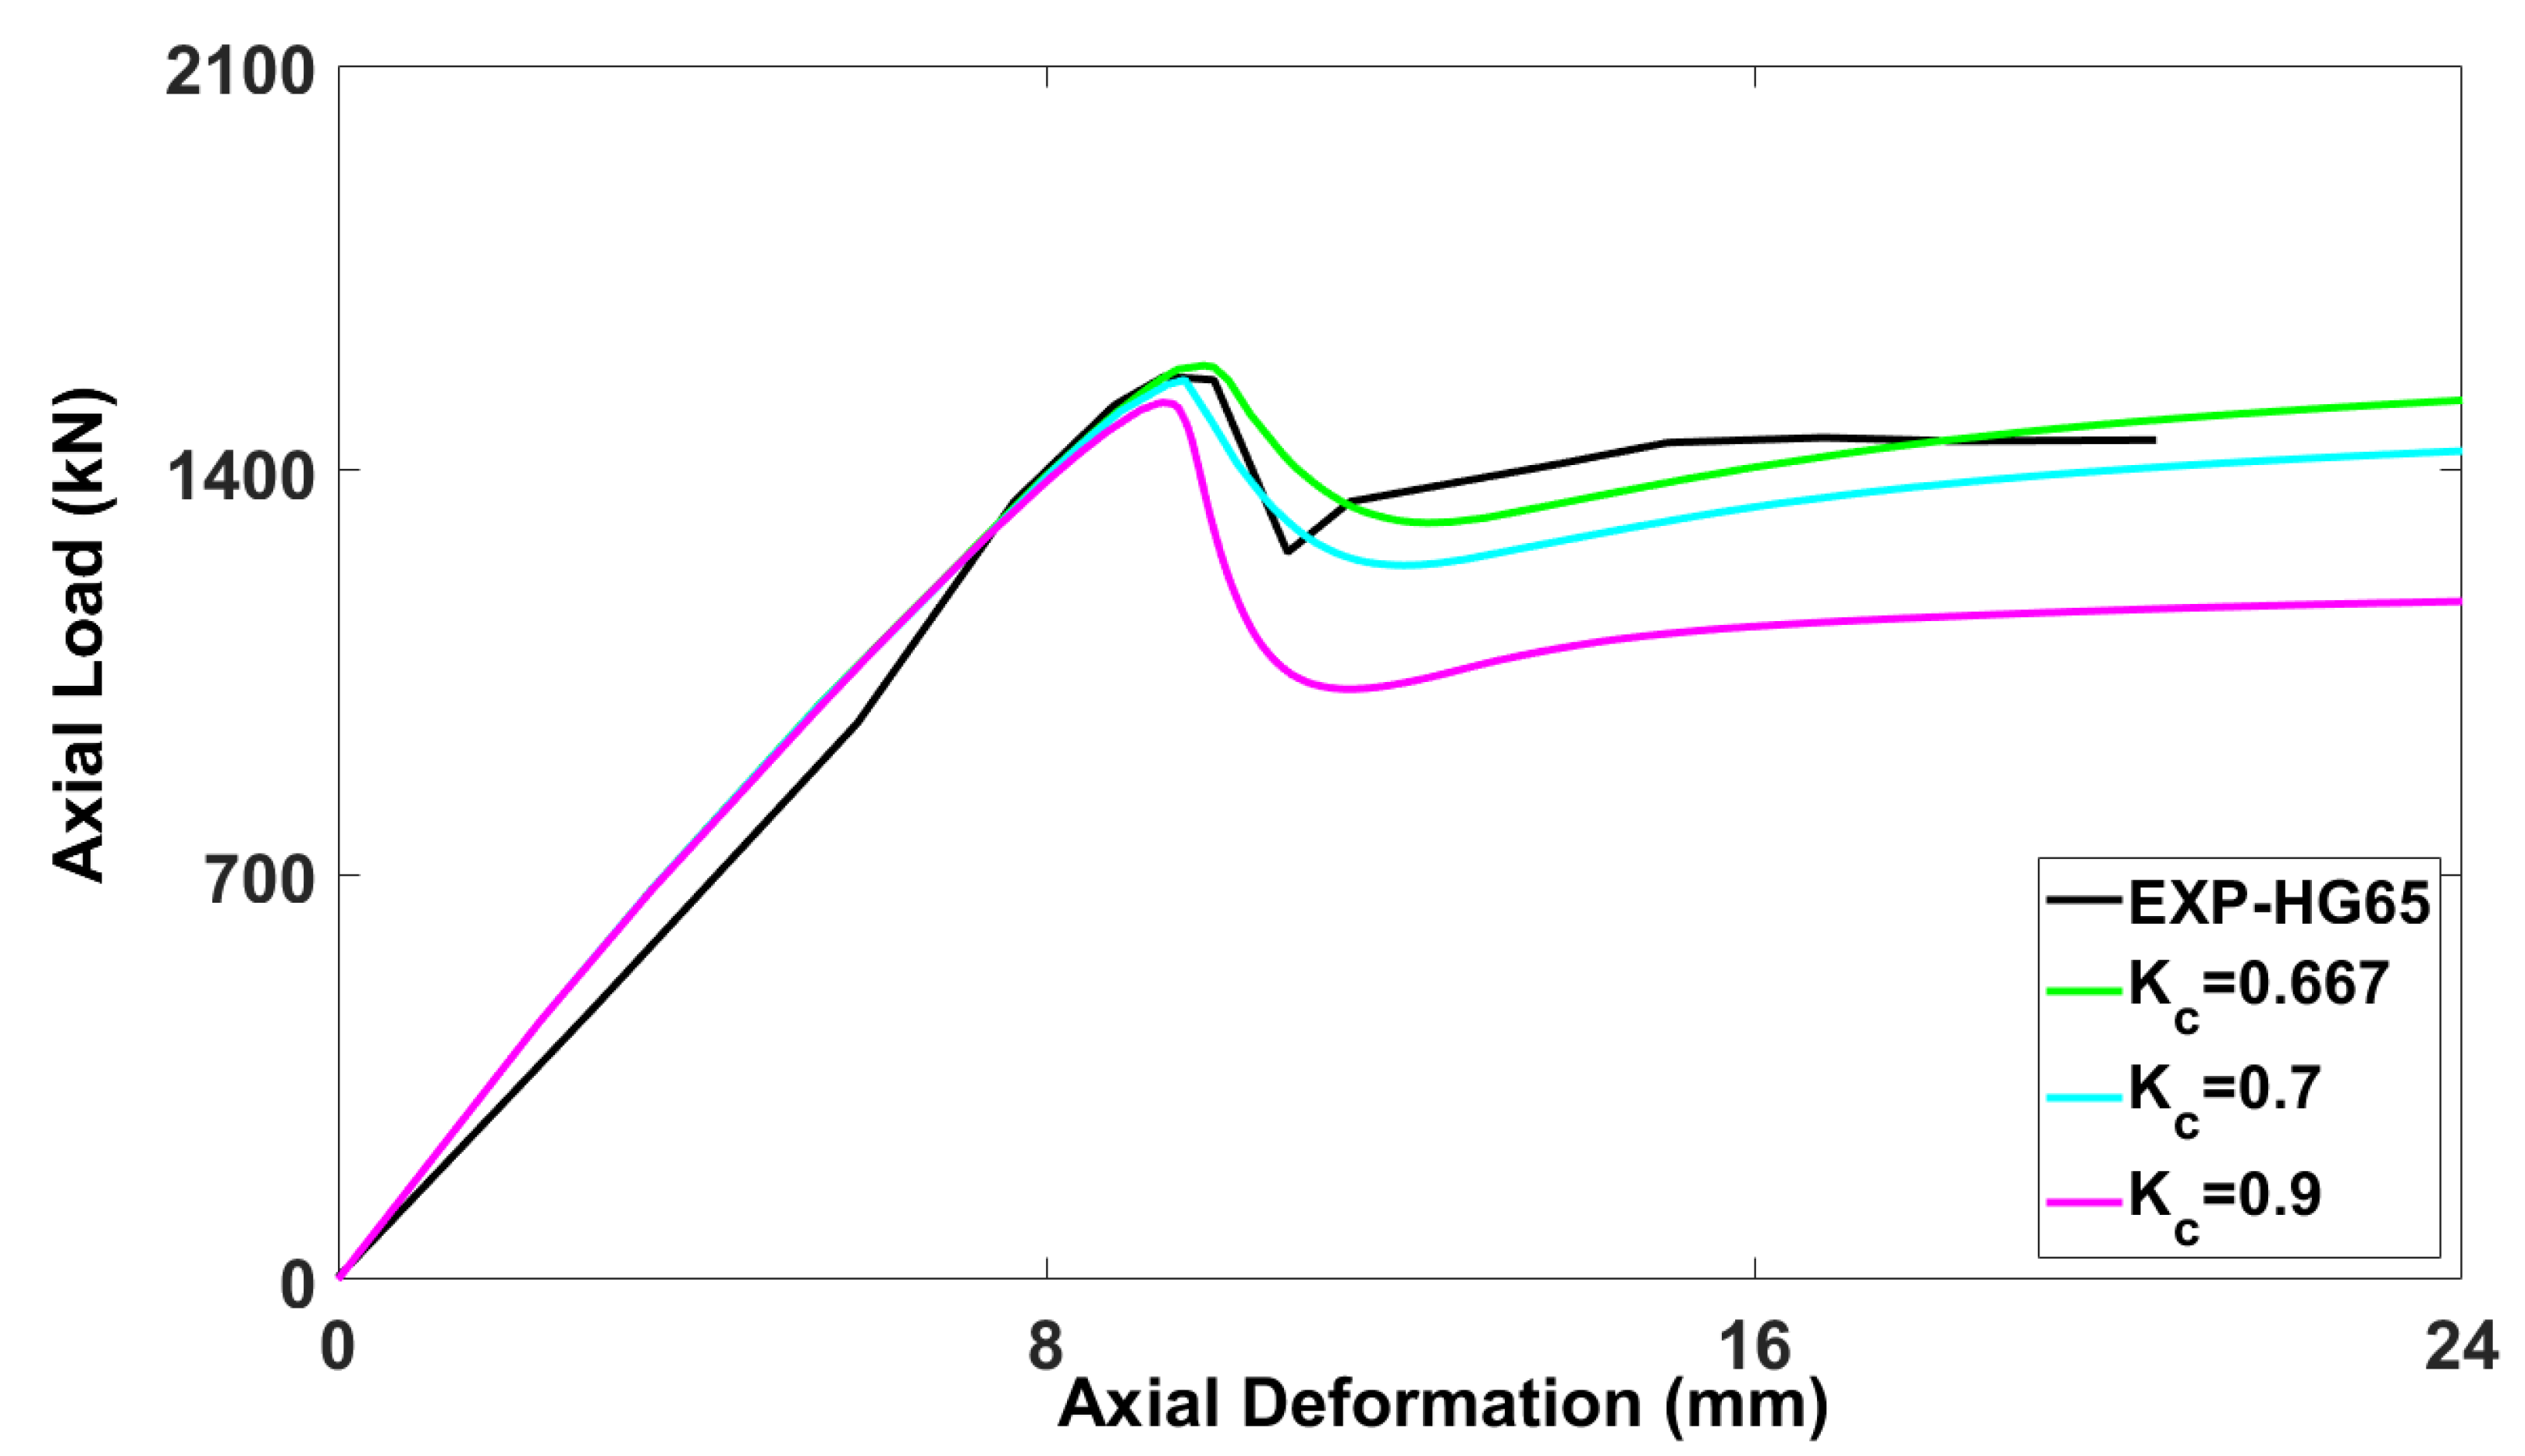
3.4.4. Shape Factor (Kc)
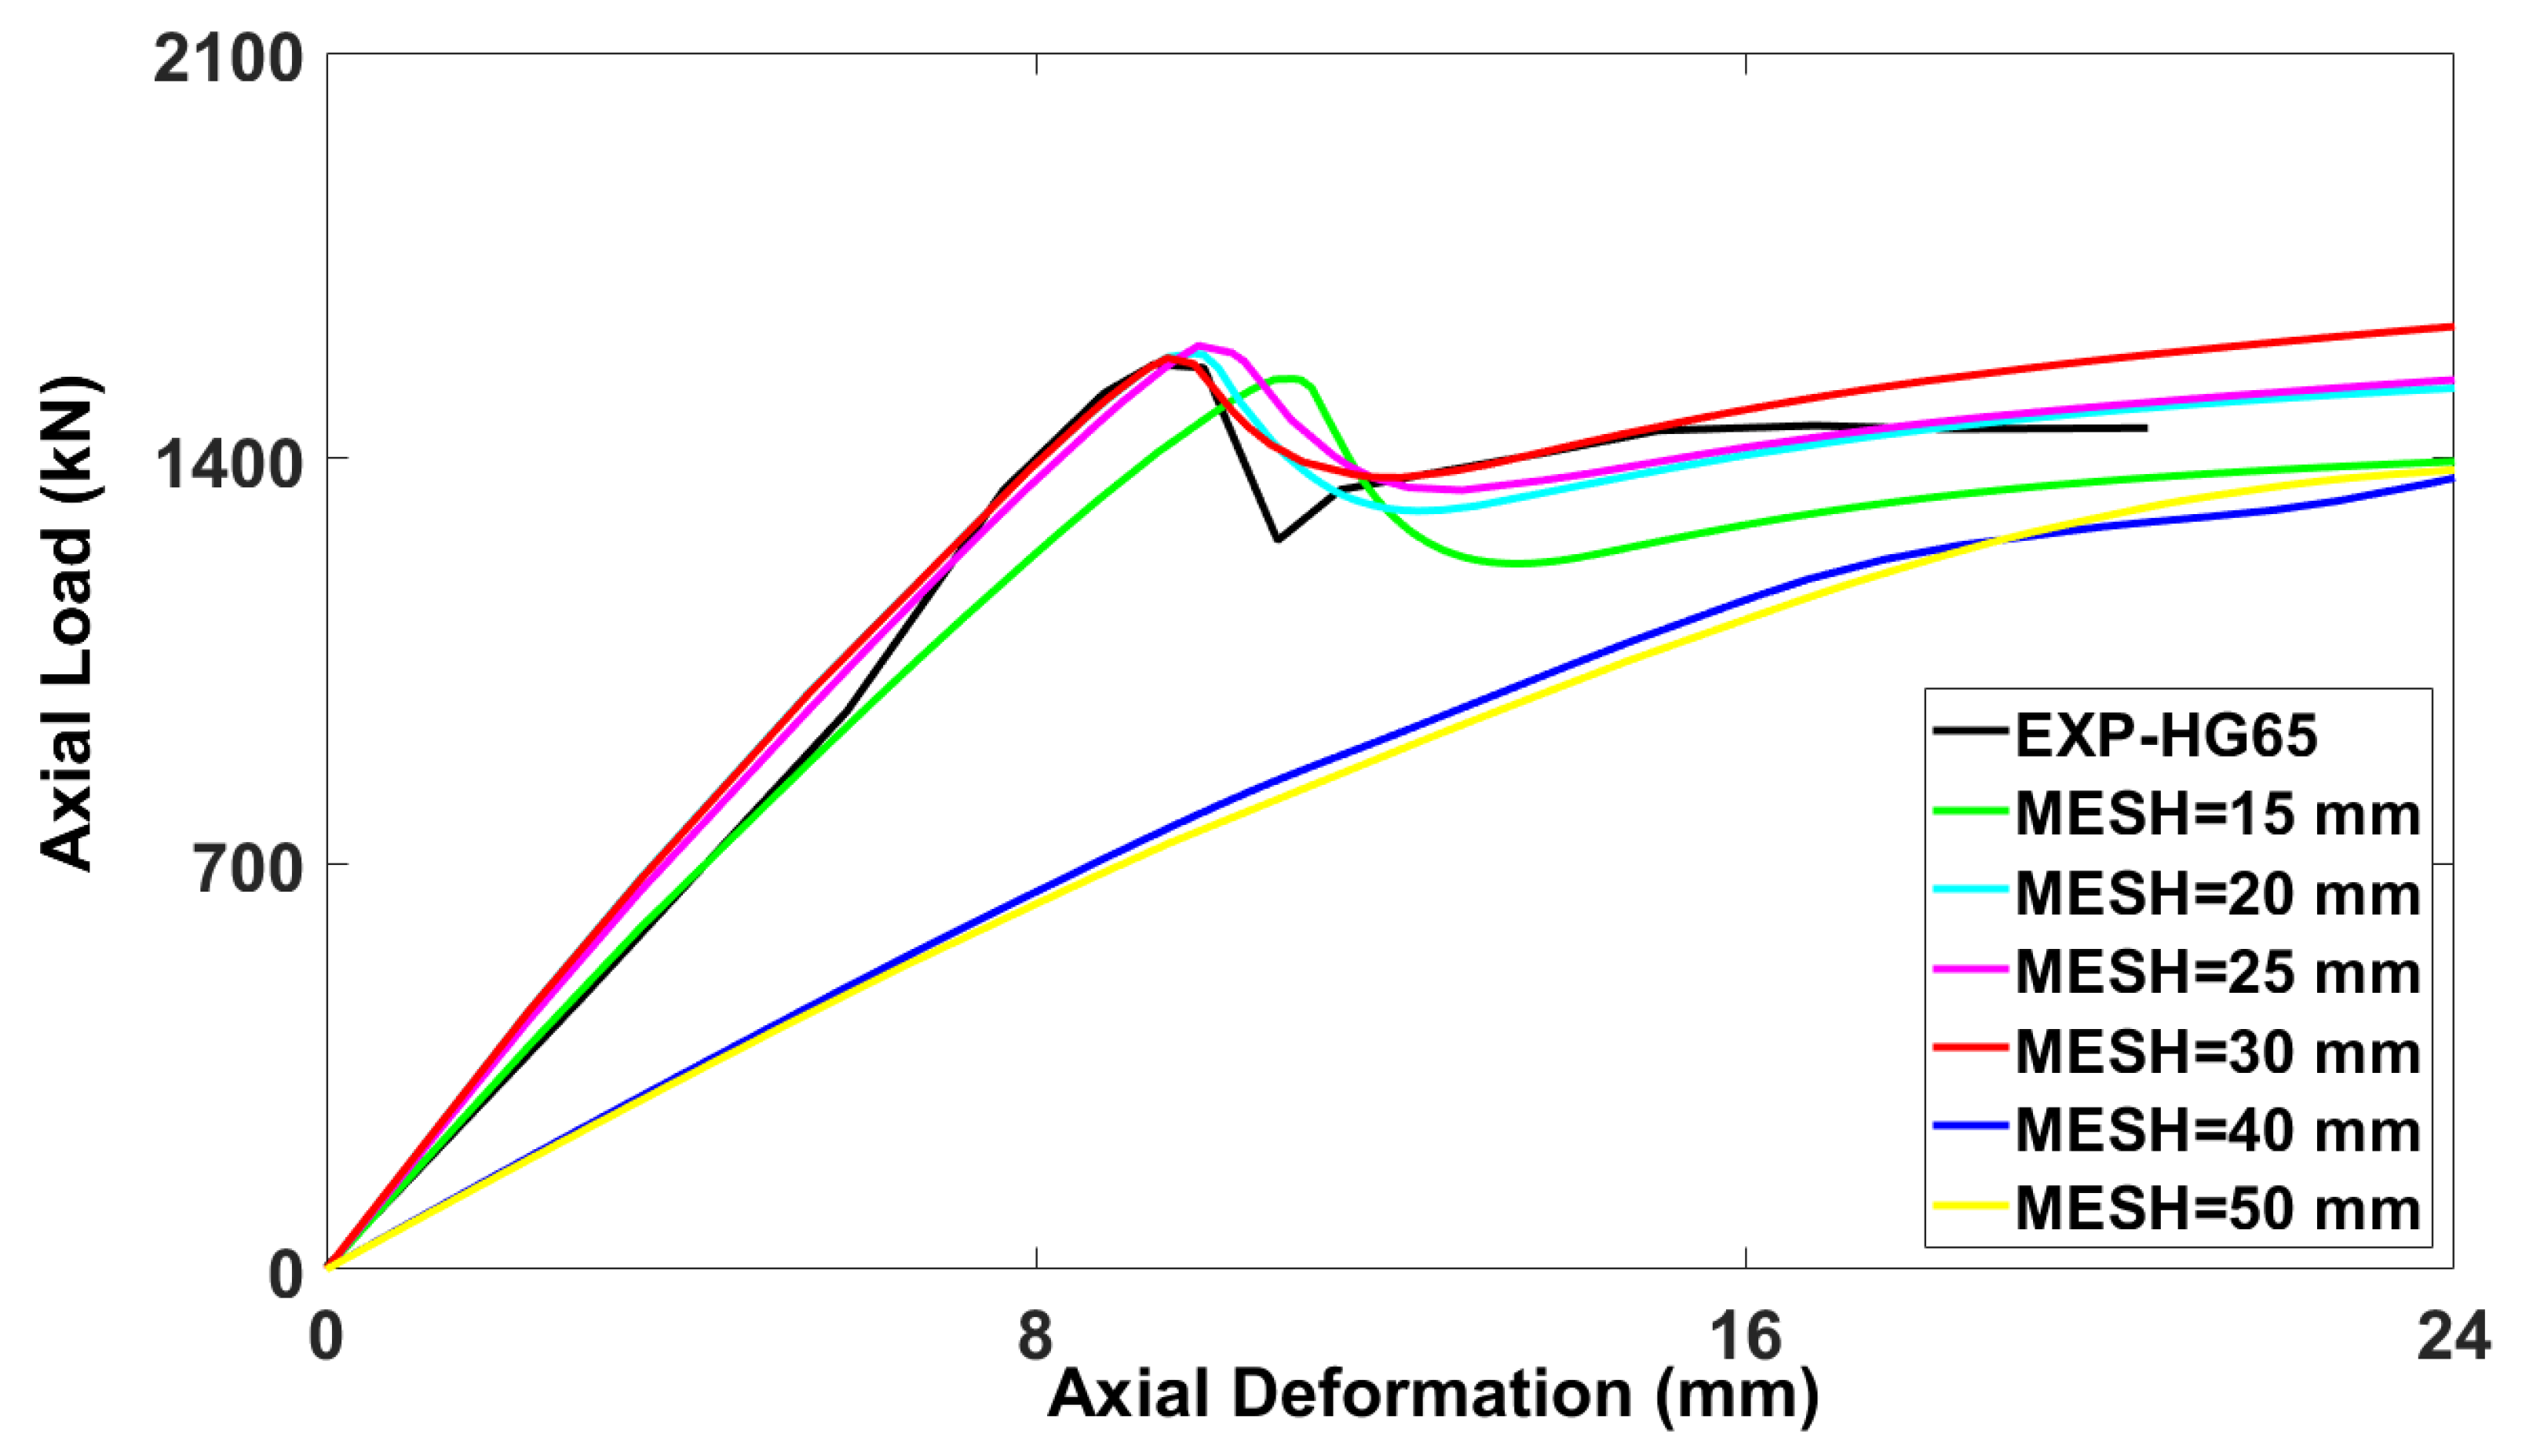
Figure 9 displays the variation in the axial load–axial deformation curve of the control specimen (HG-65) due to the effect of the shape factor. The effect of the shape factor on the columns’ behavior is not as considerable as the other parameters; however, its calibration is essential to obtain more refined and accurate results. The graphs depict that increasing the shape factor values between 0.667 and 0.9 results in more flattened post-peak curve and lesser values of the ultimate axial load-carrying capacity. The numerical specimens, having the shape factors of 0.667 (1580.823 kN), 0.7 (1555.97 kN), and 0.9 (1516.93 kN), gave the differences of 1.21%, −0.38%, and −2.88%, respectively, in the ultimate axial load-carrying capacities compared with that of the experimental test result as 1561.0906 kN. Thus, the value of Kc = 0.7 provided the closest curve to that of the experimental test.

3.4.5. Mesh Size

The selection of suitable mesh size is extremely important for the accurate prediction of numerical results. Selecting larger mesh size results in greater variation in numerical results than the experimentally obtained values, thus compromising the accuracy. As the different sizes of the mesh (i.e., finer or coarse mesh) cause the strain localization phenomenon, i.e., localizing the strain to a few selected elements, thus resulting in failure of the numerical convergence. Therefore, as a principle, appropriate mesh sizes were used to converge the numerical curve closer to the experimental result. Figure 10 demonstrates the axial behavior of the control model (HG-65) for the mesh sizes of 50 mm, 40 mm, 30 mm, 25 mm, 20 mm, and 15 mm. The numerical specimens, with the mesh sizes of 15 mm (1536.85 kN), 20 mm (1580.82 kN), 25 mm (1594.22 kN), 30 mm (1639.36 kN), 40 mm (1399.52 kN), and 50 mm (1396.19 kN), displayed the differences of −1.6%, 1.21%, 2.07%, 4.96%, −10.4%, and −10.62%, respectively, in the ultimate axial load-carrying capacities compared with that of the experimental test result (1561.09 kN). It can be concluded from the figure that the most accurate graph was obtained for the mesh size of 20 mm. Further, smaller meshes unnecessarily made the analysis time longer, with no significant enhancement in accuracy.

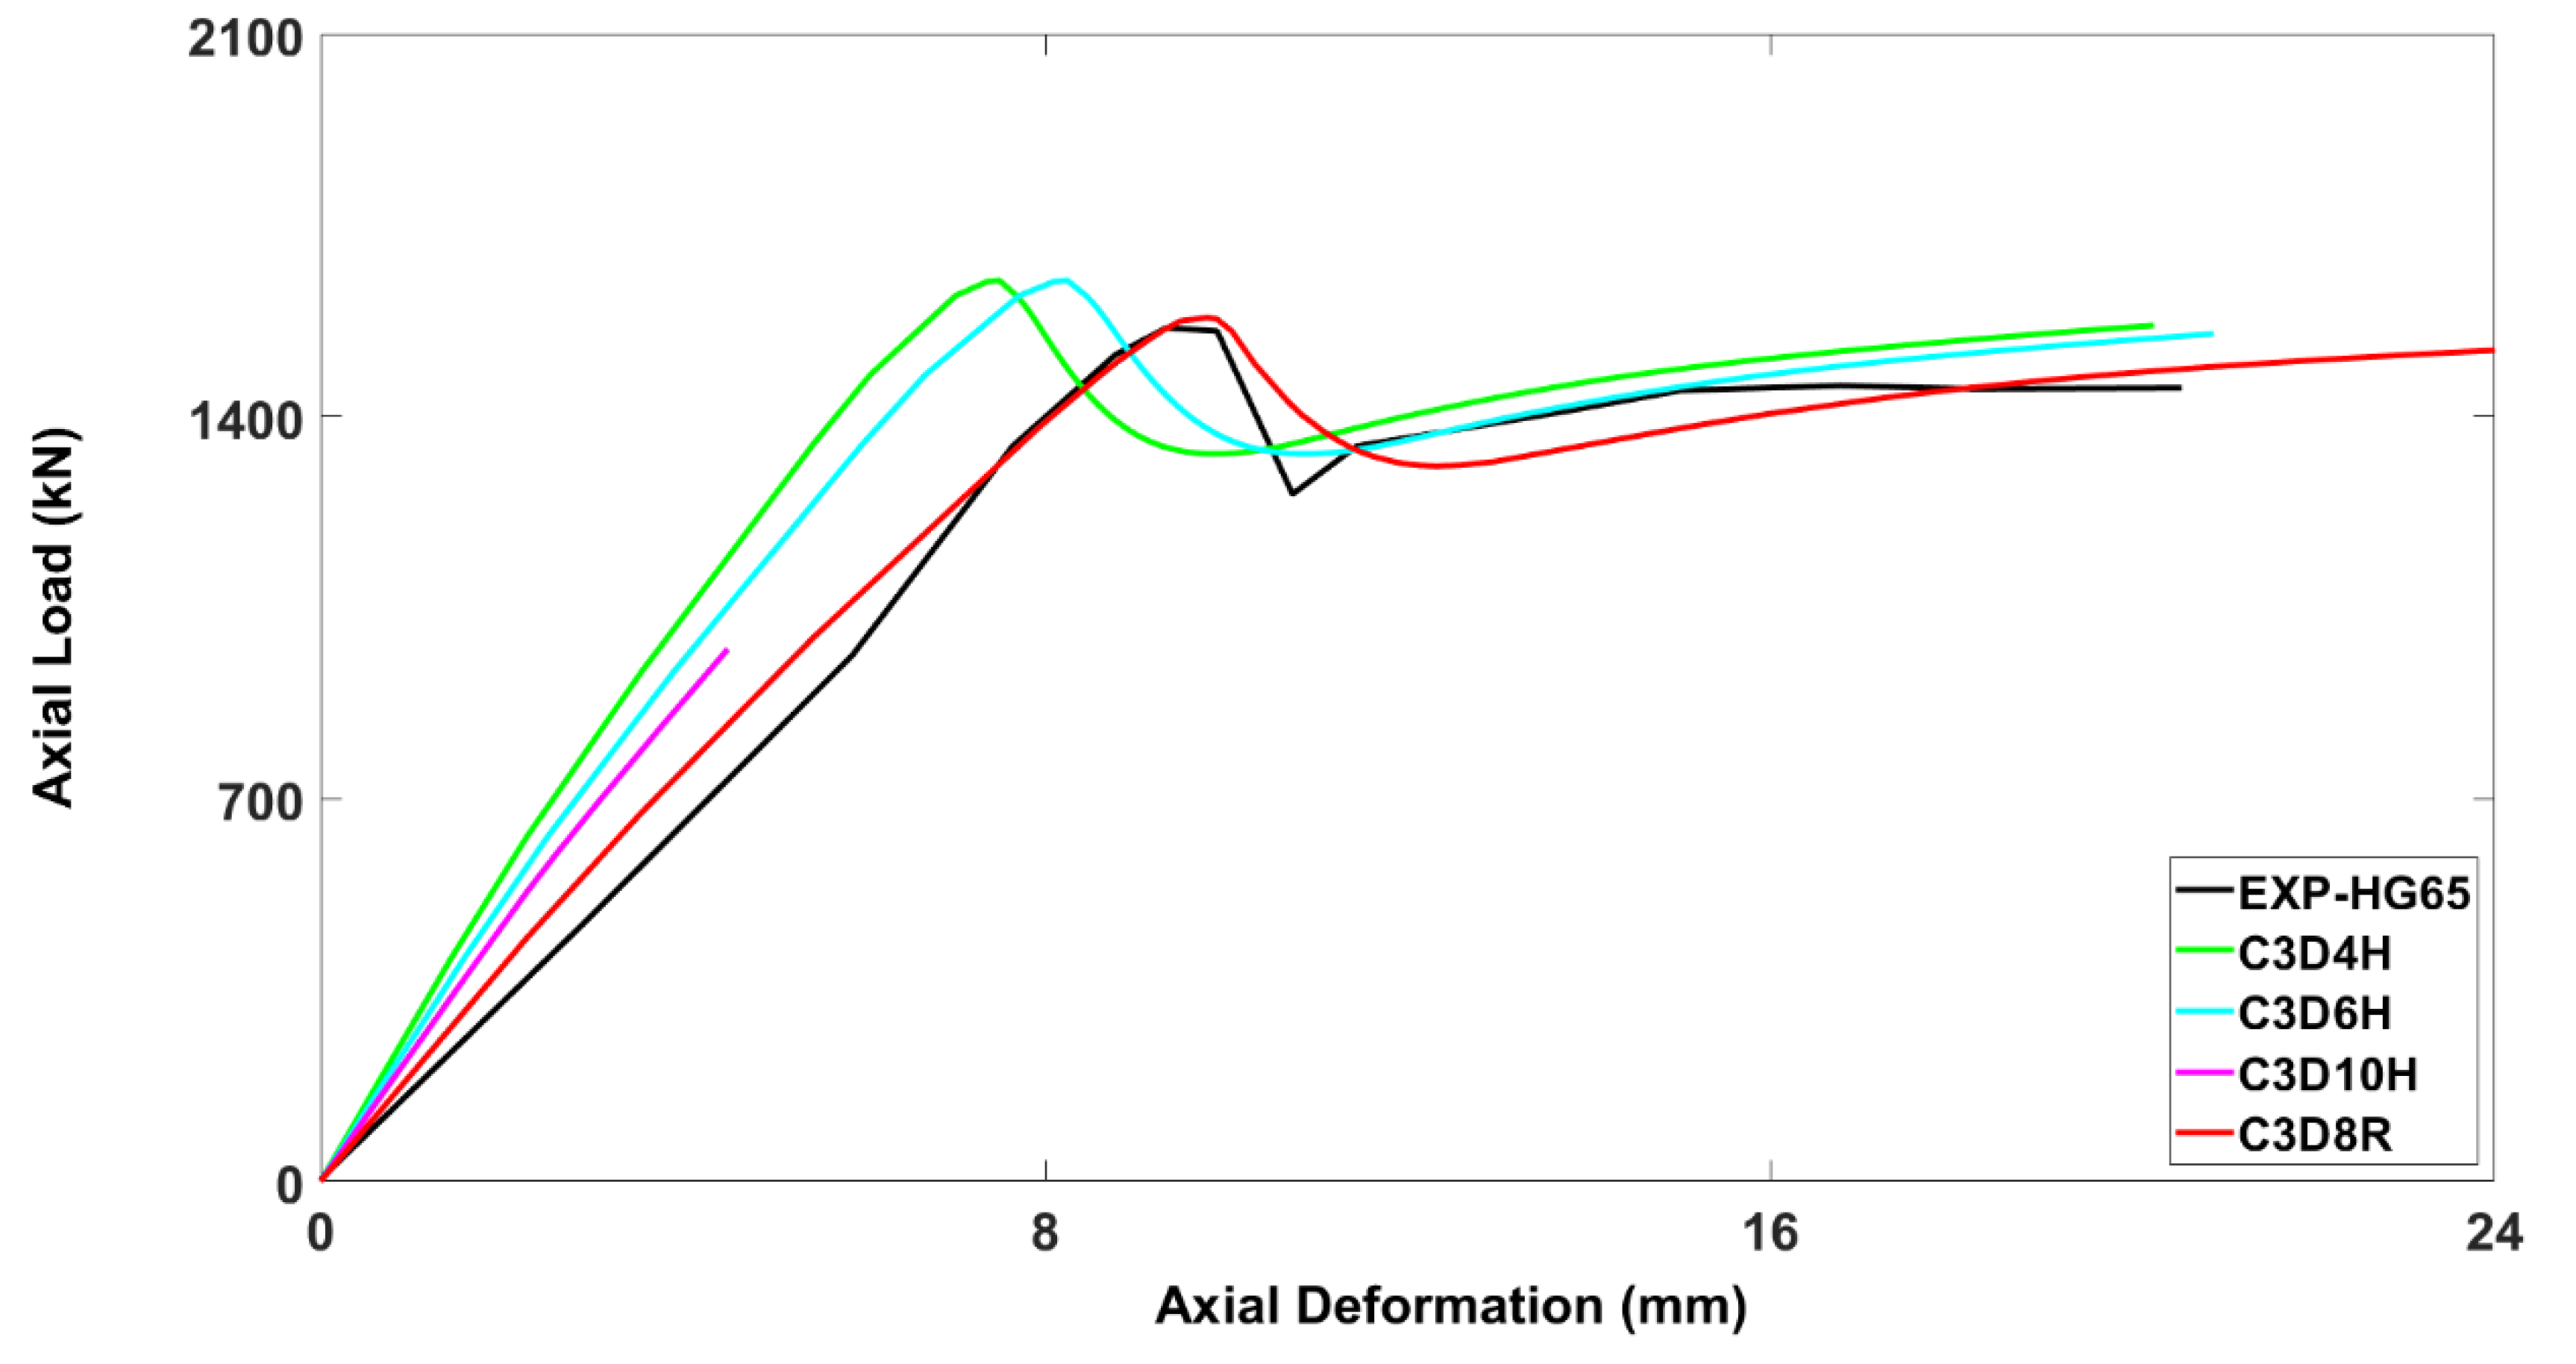
3.4.6. Mesh Element Type

The calibration of the model based on the element type of meshing is shown in Figure 11. The element type providing the most accurate result within the minimum analysis time is considered as the best suited element. As discussed earlier, 3D wire elements consist of T3D2H and T3D3H sub-types. However, for concrete, 3D stress elements have a variety of element types including hexahedral (C3D8R) and tetrahedral elements (C3D10H, C3D6H, and C3D4H). The axial load–axial deformation curves of all the elements indicate that the most accurate results are provided by the C3D8R element. It was observed from [22,23] that the C3D8R element took lesser running time for the analysis, with comparatively greater degree of accuracy. The numerical specimens, having the mesh types of C3D4H (1648.93 kN), C3D6H (1648.93 kN), C3D10H (974.24 kN), and C3D8R (1580.82 kN), demonstrated the differences of 5.57%, 5.57%, −37.62%, and 1.21%, respectively, in the ultimate axial load-carrying capacities compared with that of the experimental test result as 1561.09 kN. As a consequence, the C3D8R element, which gave the most accurate result, was taken in this study to ensure the accuracy of the modeling.

3.4.7. Properties of Rubber Pads

The rubber pads were used at the column’s top and bottom surfaces to ensure gradual transfer of the concentric load. These rubber pads had a softening effect on the slope of the stress–strain curve. To incorporate this phenomenon, 3 mm neoprene rubber cushions were fixed between the surfaces of concrete and steel plates and connected via tie constraints. Thus, the actual mechanical properties of the rubber pads had to be incorporated in the model’s behavior. However, the deformation of the rubber pads was ignored during the experiment, as it has no effect on the results. Therefore, the model was calibrated for various properties of the rubber pads such as yield stress (YIELD) and Poisson’s ratio (POIS). The numerical specimens, with the properties of YIELD = 10 MPa and POIS = 0.49 (1927.89 kN), YIELD = 7.5 MPa and POIS = 0.49 (1497.01 kN), YIELD = 2.5 MPa and POIS = 0.49 (1788.36 kN), YIELD = 6 MPa and POIS = 0.49 (1580.82 kN), YIELD = 6 MPa and POIS = 0.20 (1210.647 kN), and YIELD = 6 MPa and POIS = 0.40 (1210.647 kN), revealed the differences of 23.43%, −4.15%, 14.5%, 1.21%, −22.49%, and −22.49%, respectively, in the ultimate axial load-carrying capacities compared with that of the experimental test result (1561.09 kN). The closest curve was resulted for the yield stress of 6 MPa and Poisson’s ratio of 0.49 (Figure 12).

4. Comparisons of Numerical Results and Experimental Result

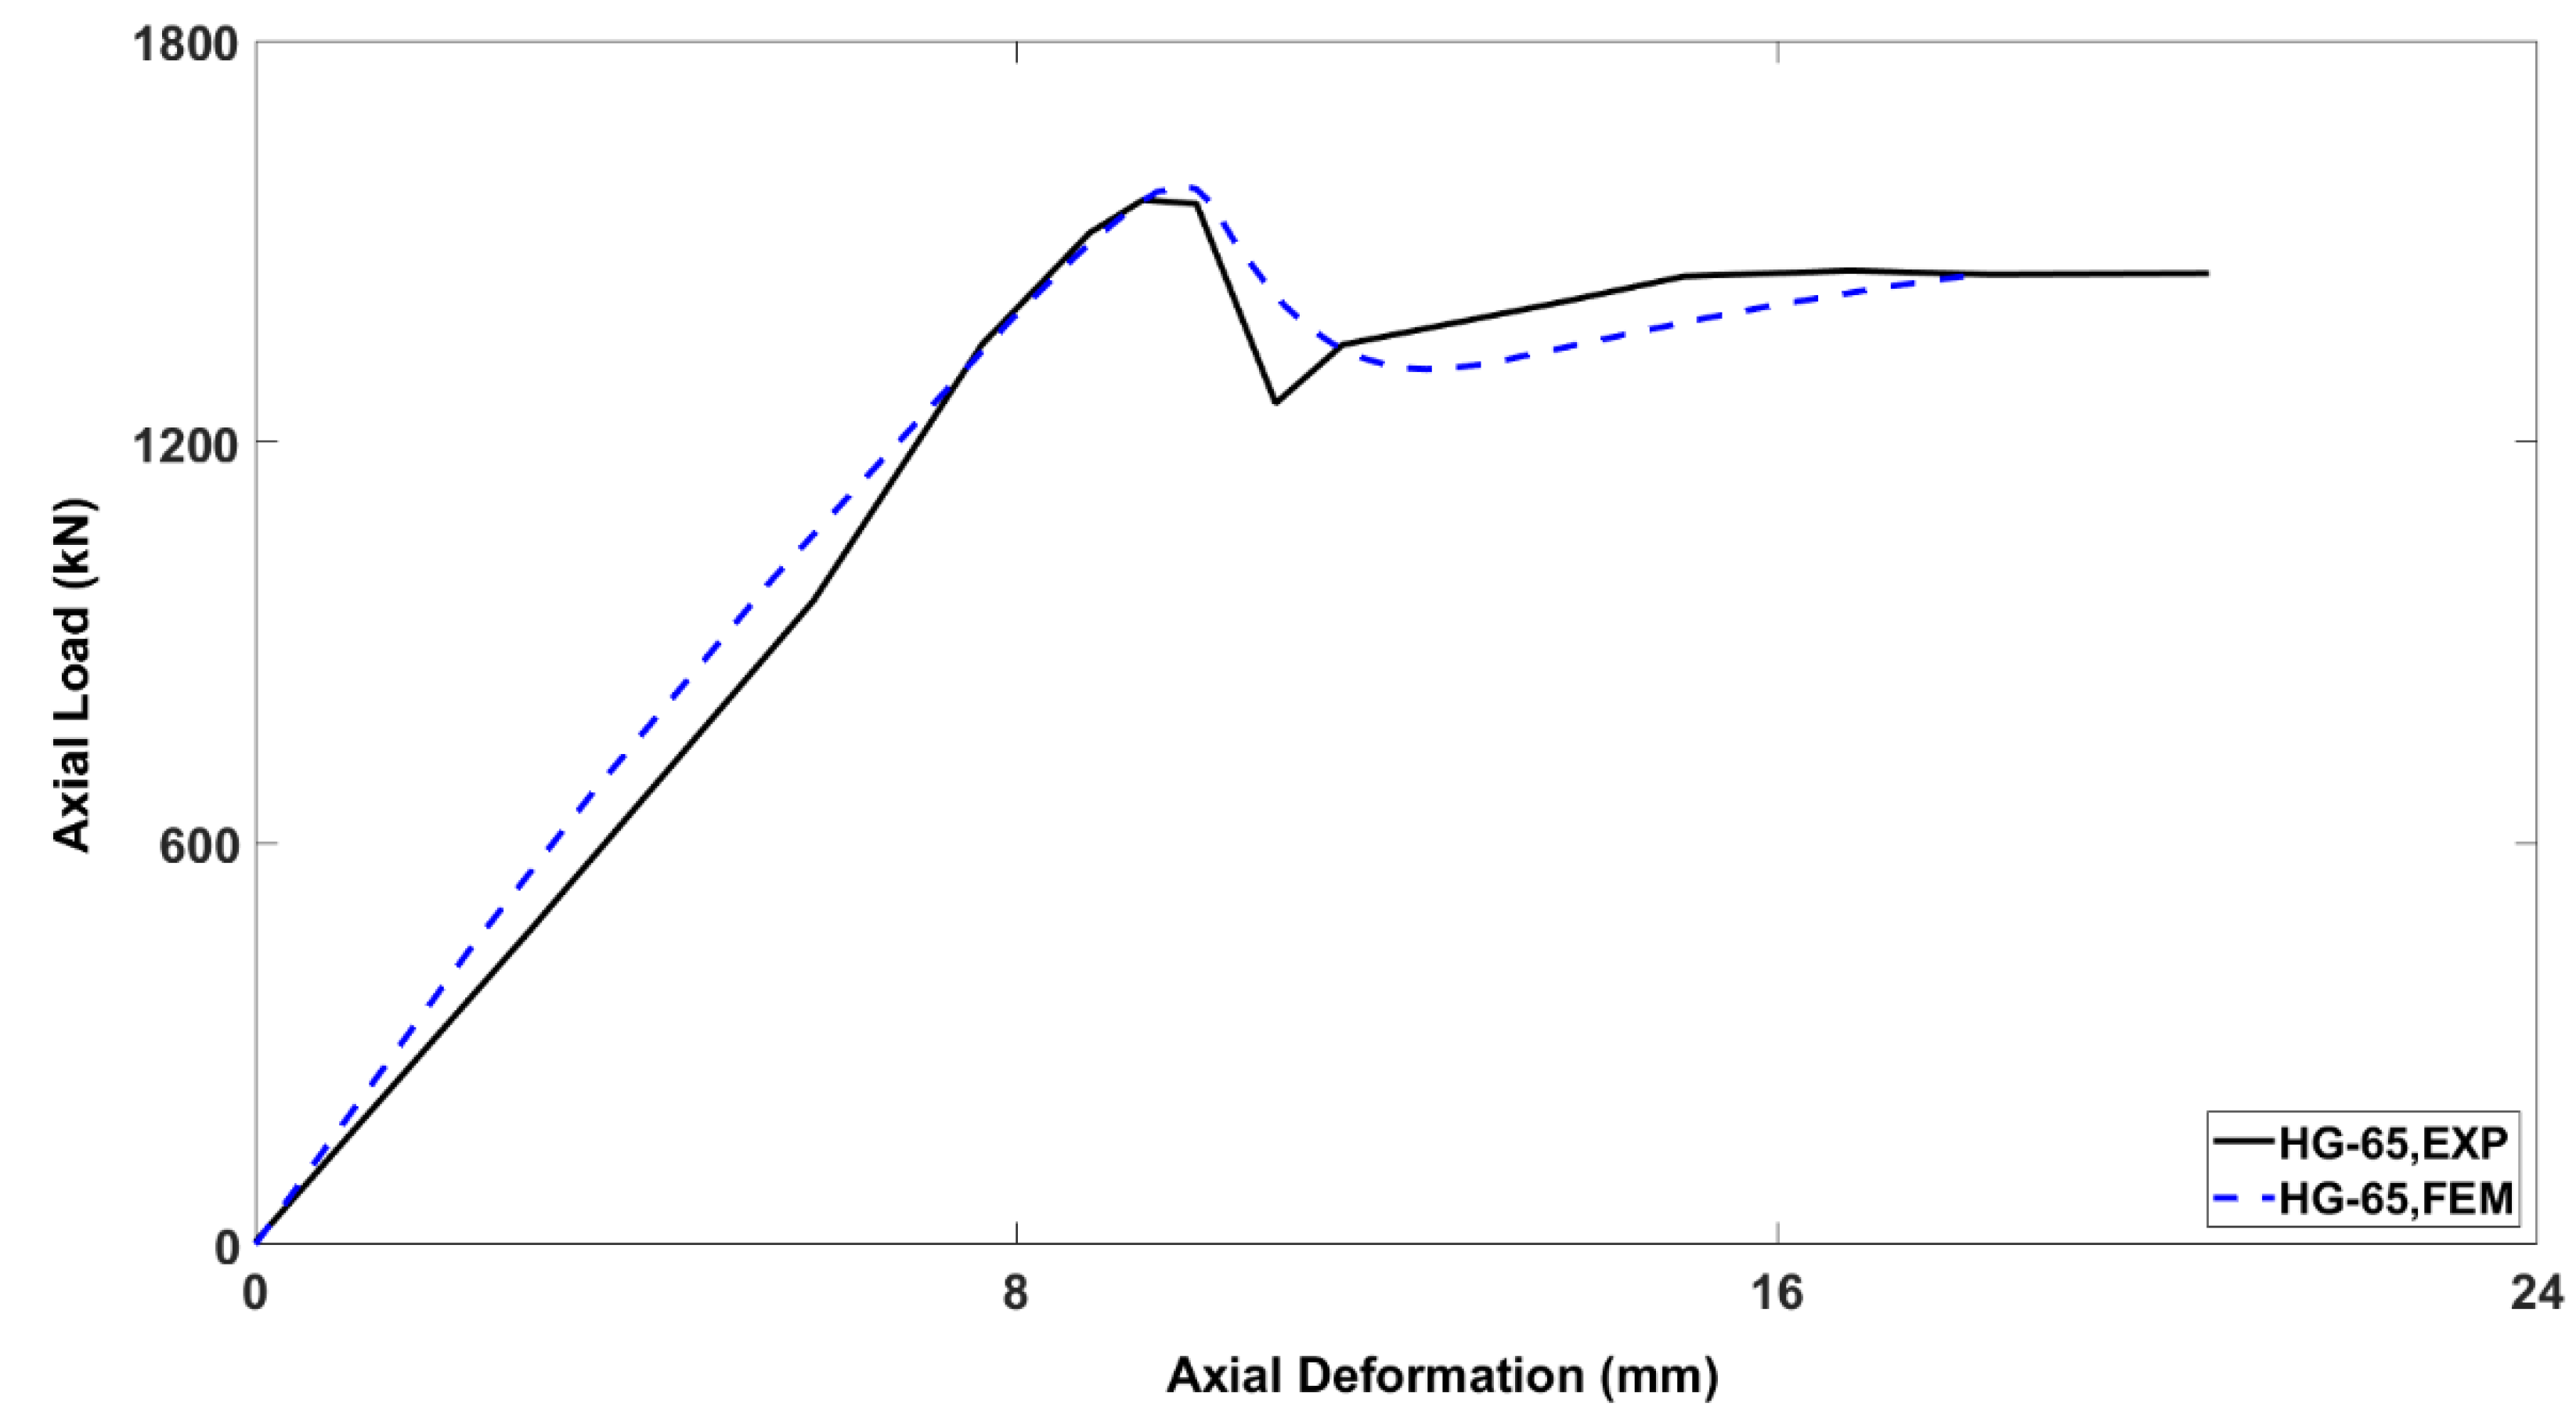
4.1. Control Finite Element Model (HG-65)

The axial load–axial deformation curve of the control finite element model (HG-65) and experimental result are illustrated in Figure 13. After intensive calibration for various parameters through trial models, the finally selected values of the viscosity parameter, shape factor, dilation angle, and mesh size are 0.0018, 0.667, 36°, and 20 mm, respectively. The experimental work conducted in [35,36,37] was considered as the yardstick and compared with the control model. The axial load–axial deformation curve of the control model (HG65) followed a similar path to that of the experimental result, as displayed in Figure 13. The results of the FEA indicated the difference of only 1.21% in the compressive strength and 5.18% in the axial deformation from the results of the experimental work. The results proved that numerical and experimental values of the ultimate axial load, and their corresponding axial deformations were approximately equal. However, the post-peak behavior of the numerical model was not properly converging with that of the experimental curve. This discrepancy during the post-peak behavior might be owing to the linear elastic characteristic of the GFRP bars because the damage criteria could not be considered for them.

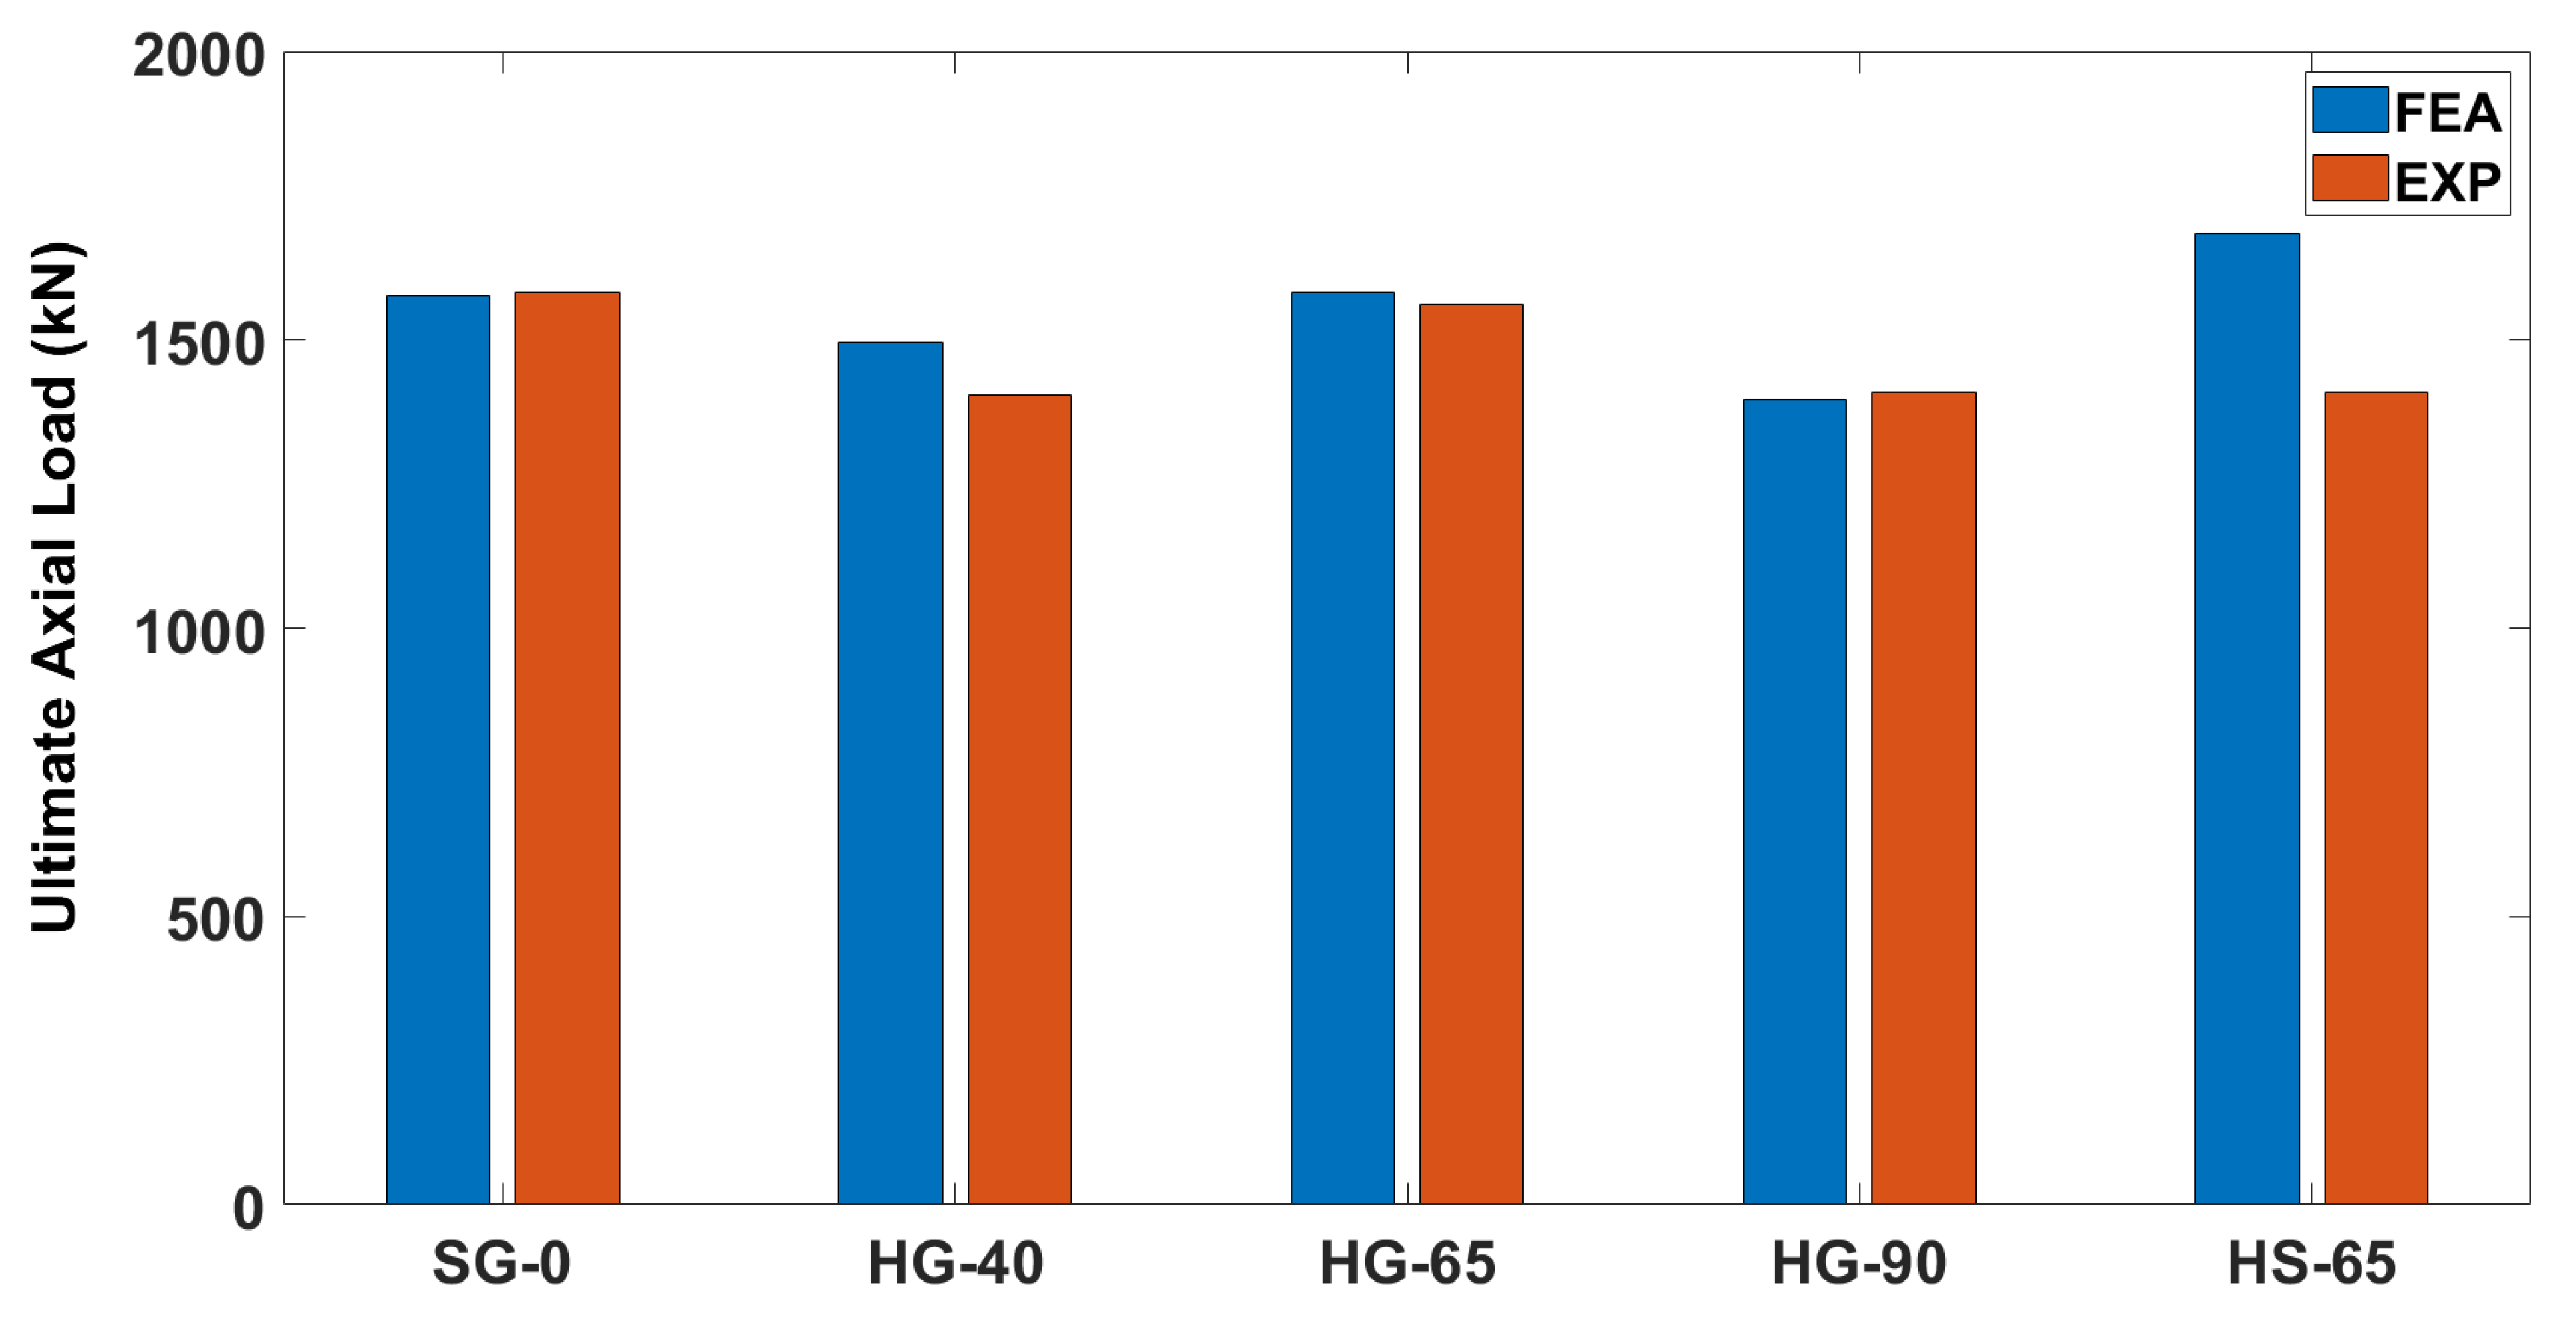
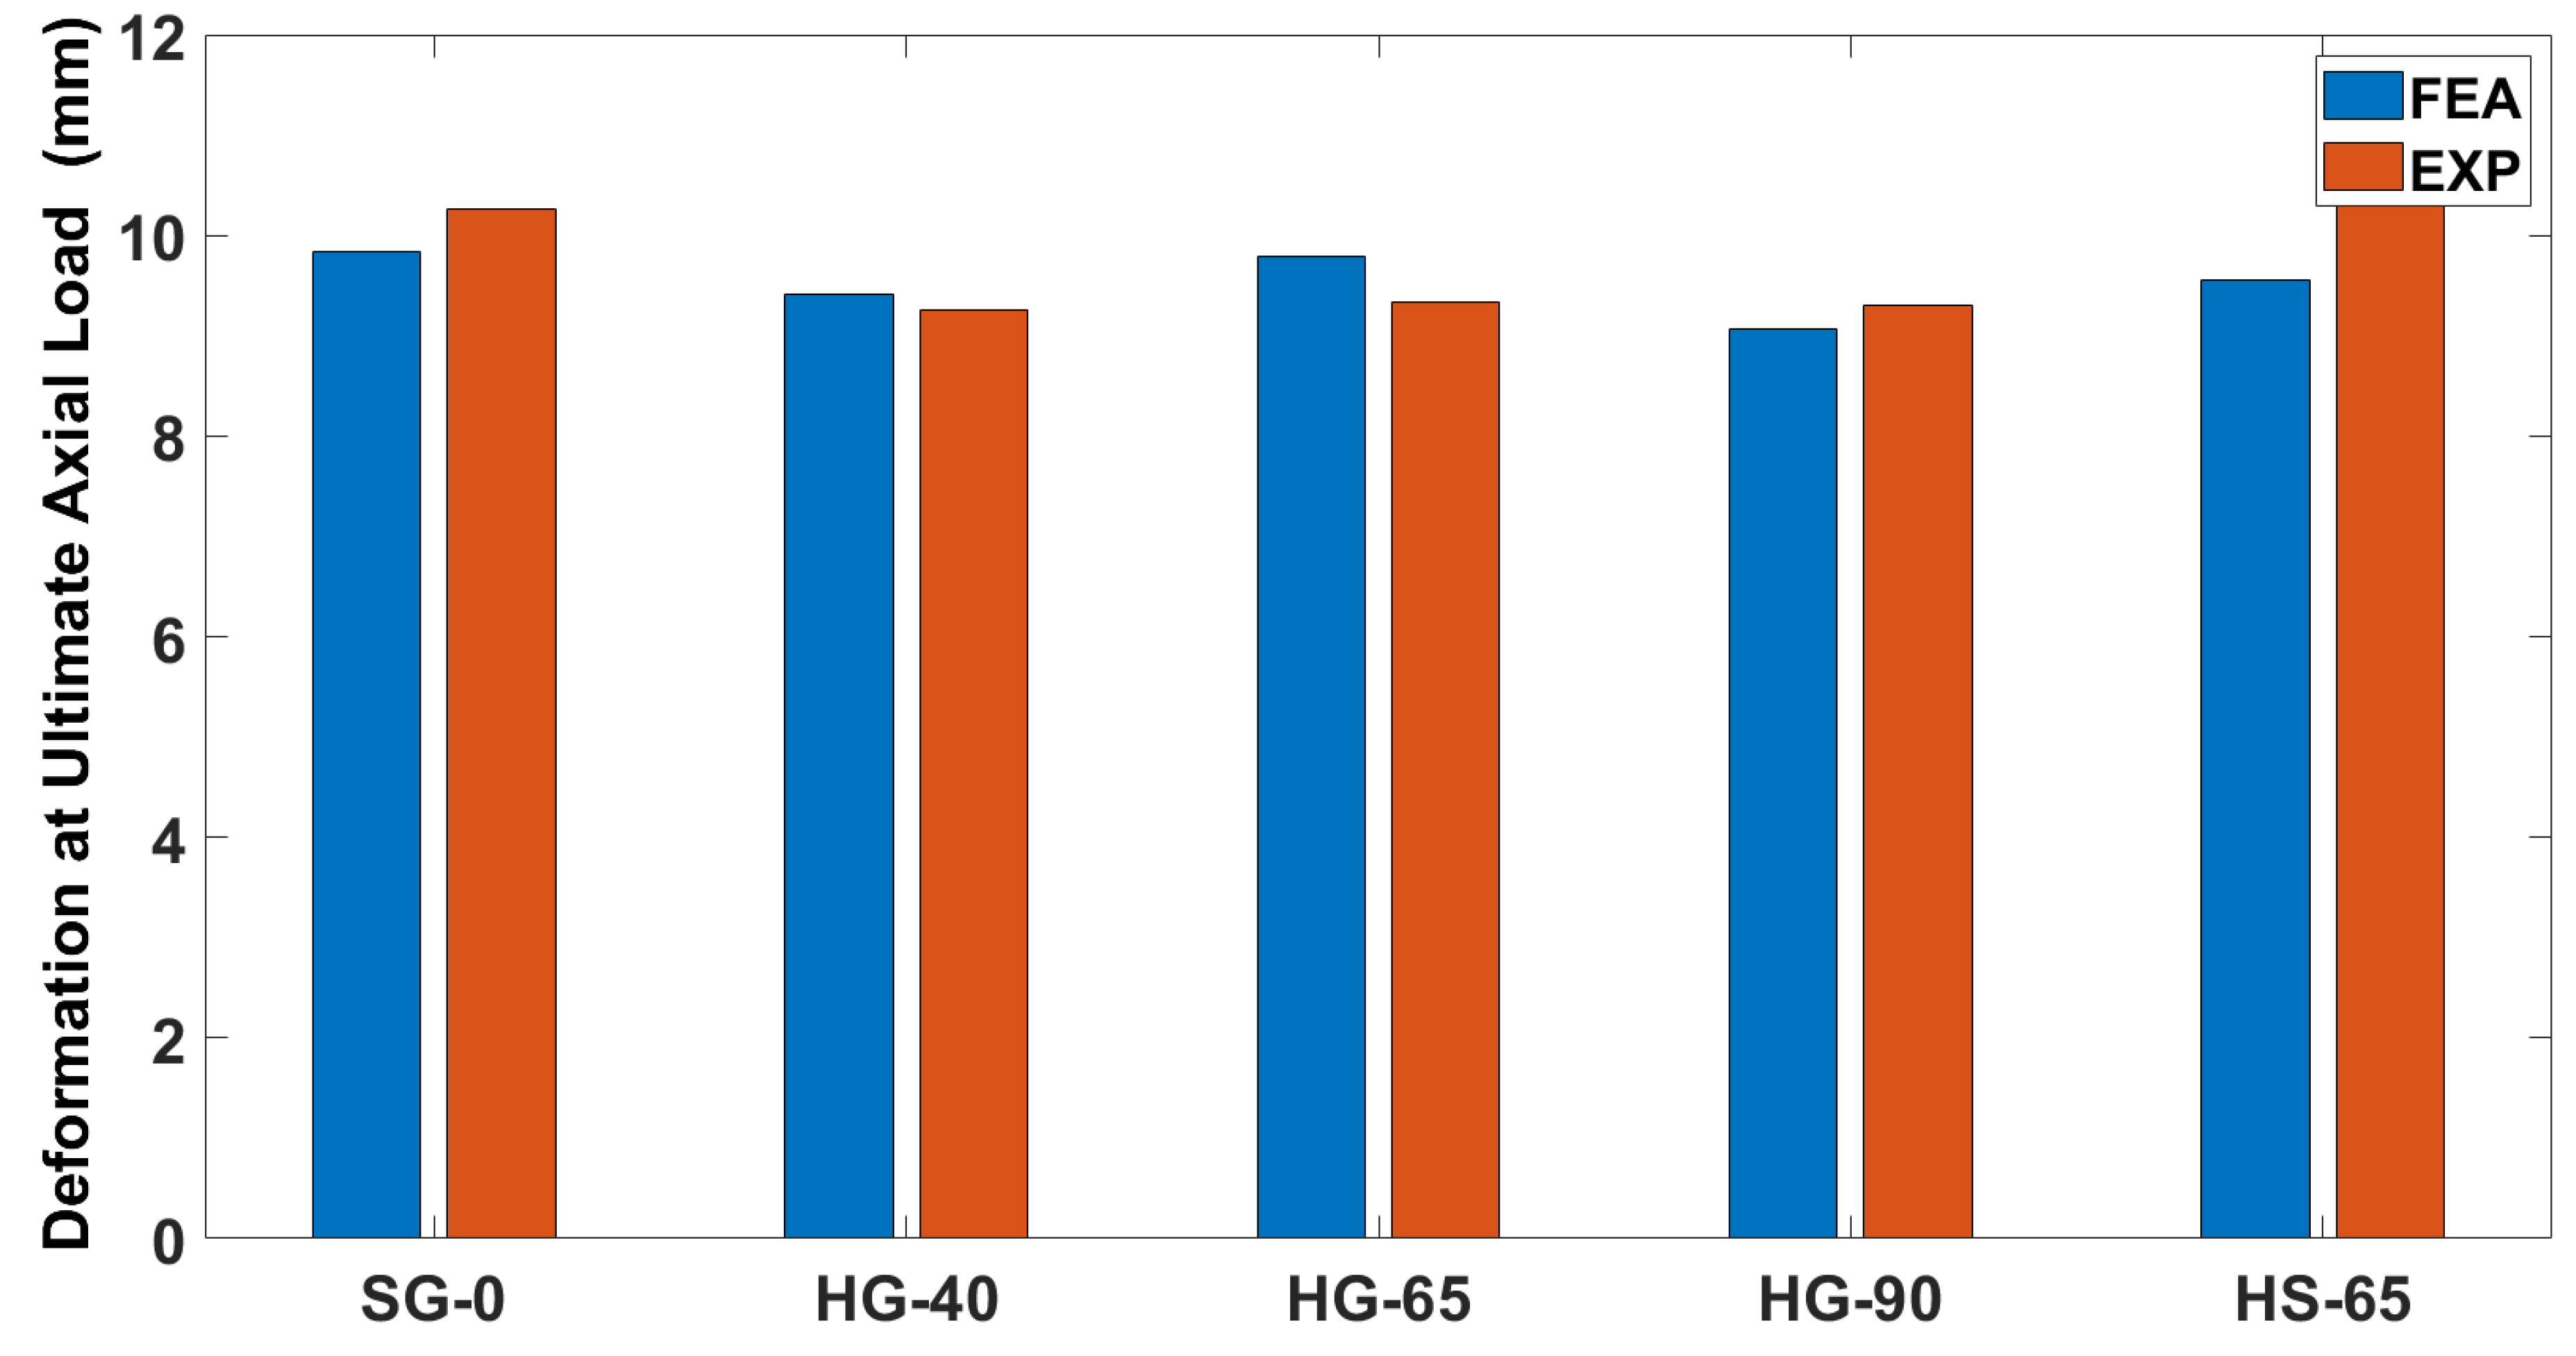
4.2. Ultimate Axial Load-Carrying Capacity and Corresponding Axial Deformation

The FEA and experimentally obtained values for the ultimate axial load-carrying capacity and corresponding deformation for all the modeled columns are summarized in Table 4, while their graphical representations are given in Figure 14 and Figure 15, respectively. The ultimate axial load obtained for the modeled columns SG-0, HG-40, HG-65, HG-90, and HS-65 at the deformations are listed in Table 4.
The ultimate axial load-carrying capacities of the columns SG-0 and HG-90 were overestimated by 0.34%, and 1.01%, respectively, while those of HG-40, HG-65, and HS-65 were underestimated by −6.5%, 1.21%, and 19.55%, respectively. These discrepancies are very nominal except for steel-reinforced column HS65 where the discrepancy of 19.55% could be found. This large difference for steel is due to its properties compared with GFRP used in the testing, or minor variation in steel placement. It may also be owing to an imperfect bond between steel reinforcement and concrete because of higher difference in their modulus of elasticity.

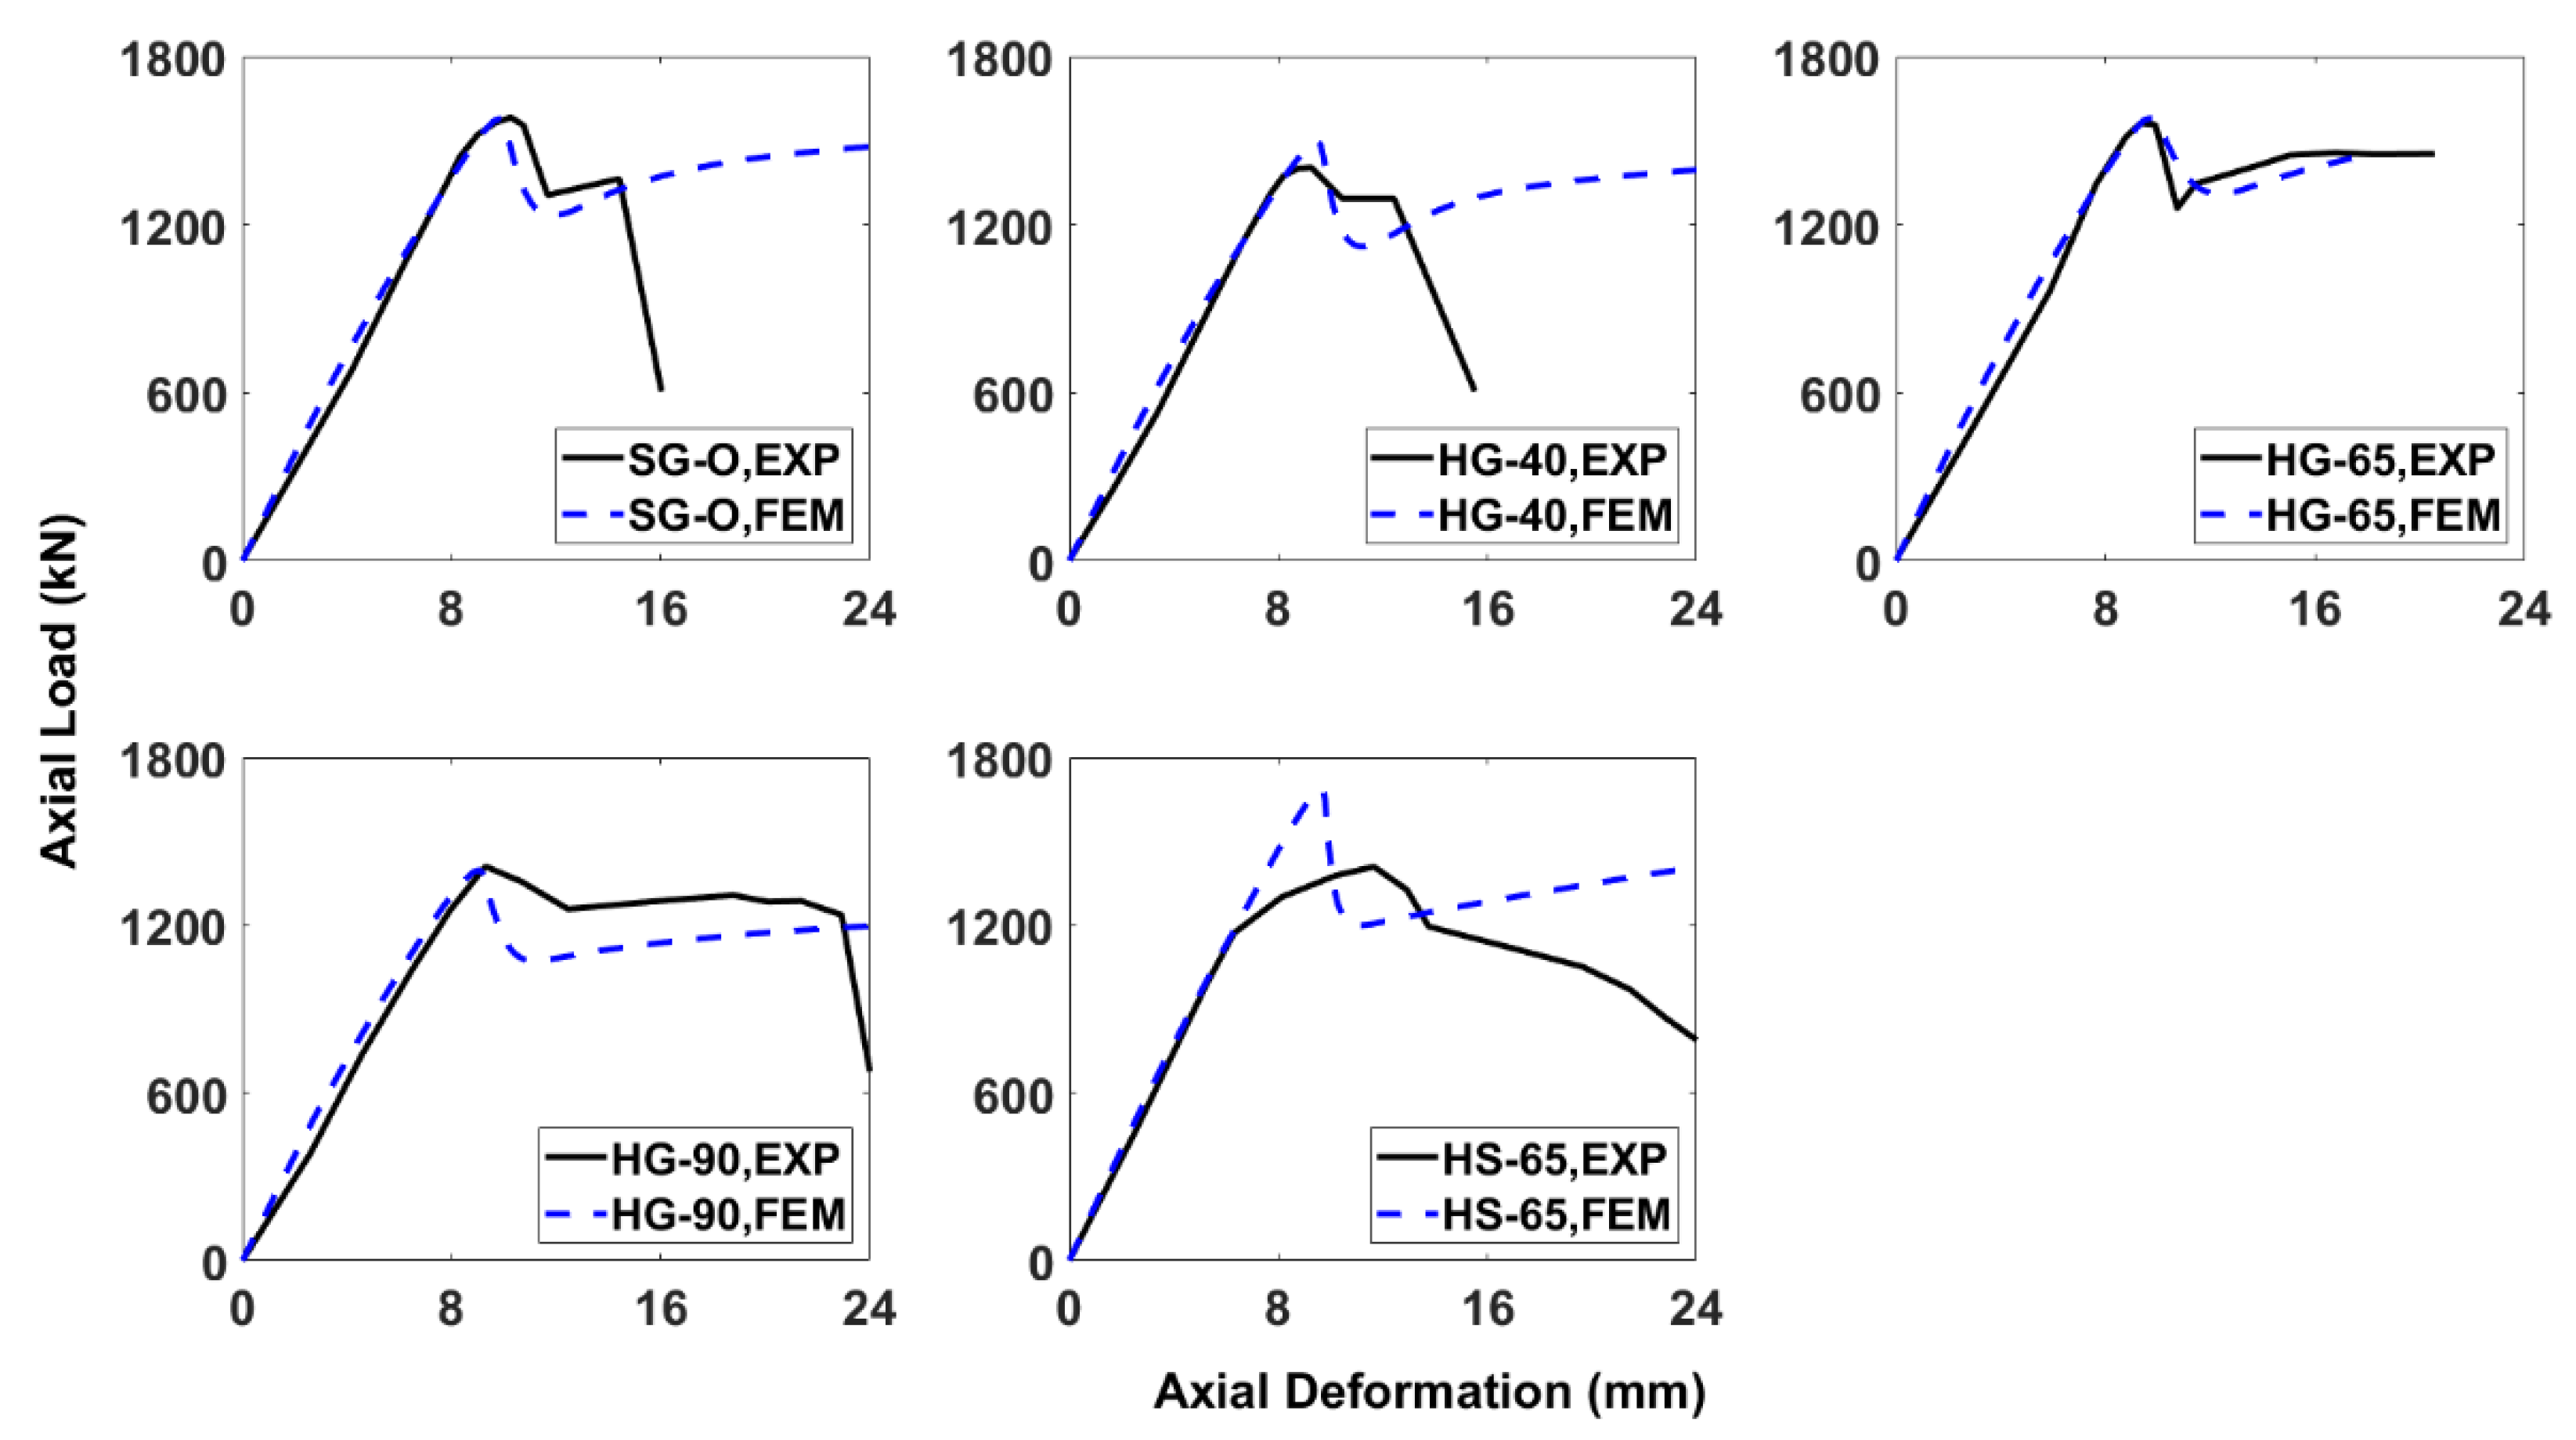
4.3. Axial Load–Axial Deformation Behavior

Figure 16 provides the comparative results of the numerically (FEM) and experimentally (EXP) achieved axial load–axial deformation curves for all the studied columns. The first column specimen (SG-0) demonstrated a linear load–deformation behavior in the initial phase, followed by a short nonlinear just before the peak load. The brief nonlinearity in the axial load–axial deformation curve indicates the initiation and development of minor cracks in the outer concrete core, as already observed in the experimental work. The ultimate load of 1577 kN was obtained at the deformation of 9.84 mm which is comparable with the experimental results. After the peak load, the axial load-carrying capacity experienced a drop, which is attributed to spalling of the concrete cover. A second upward movement in the axial load-carrying capacity is seen afterward, which is due to the confining effect of the GFRP spirals wound around the inner concrete core. The column finally failed when the GFRP reinforcements (both bars and spirals) ruptured. The other columns also generally showed a similar load–deformation response as that of SG-0. Models of all the columns exhibited linear elastic curves in the pre-peak phase dip due to spalling of the concrete cover, the second peak is attributed to the GFRP reinforcements’ confinement, and the final rupture is owing to the rupture of the reinforcements. The load–deformation behavior of all the modeled columns revealed a reasonable accuracy in the pre-peak phase. However, in the post-peak phase till failure, the results diverged from the experimental values and the numerical models overestimated the experimentally observed values. The deviation in the models’ behavior in the post-peak phase is attributed to the fact that the damage criteria for the GFRP reinforcements were not defined, as they were simulated as linear elastic materials. The differences between the obtained ultimate axial load-carrying capacities from the experiment and modeling of the columns SG-0, HG-40, HG-65, HG-90, and HS-65 are 0.34%, −6.5%, −1.21%, 1.01%, and −19.56%, respectively. The significant difference for HS-65 is owing to the calibration of the Abaqus modeling carried out on HG-65 (using the GFRP bars not on the steel bars). To avoid confusion for the calibration, the authors only used the calibrated values for HG-65. However, for the same columns, the axial deformation differences achieved from the experiment and modeling are 4.14%, −1.64%, −4.8%, 2.41%, and 17.95%, respectively.

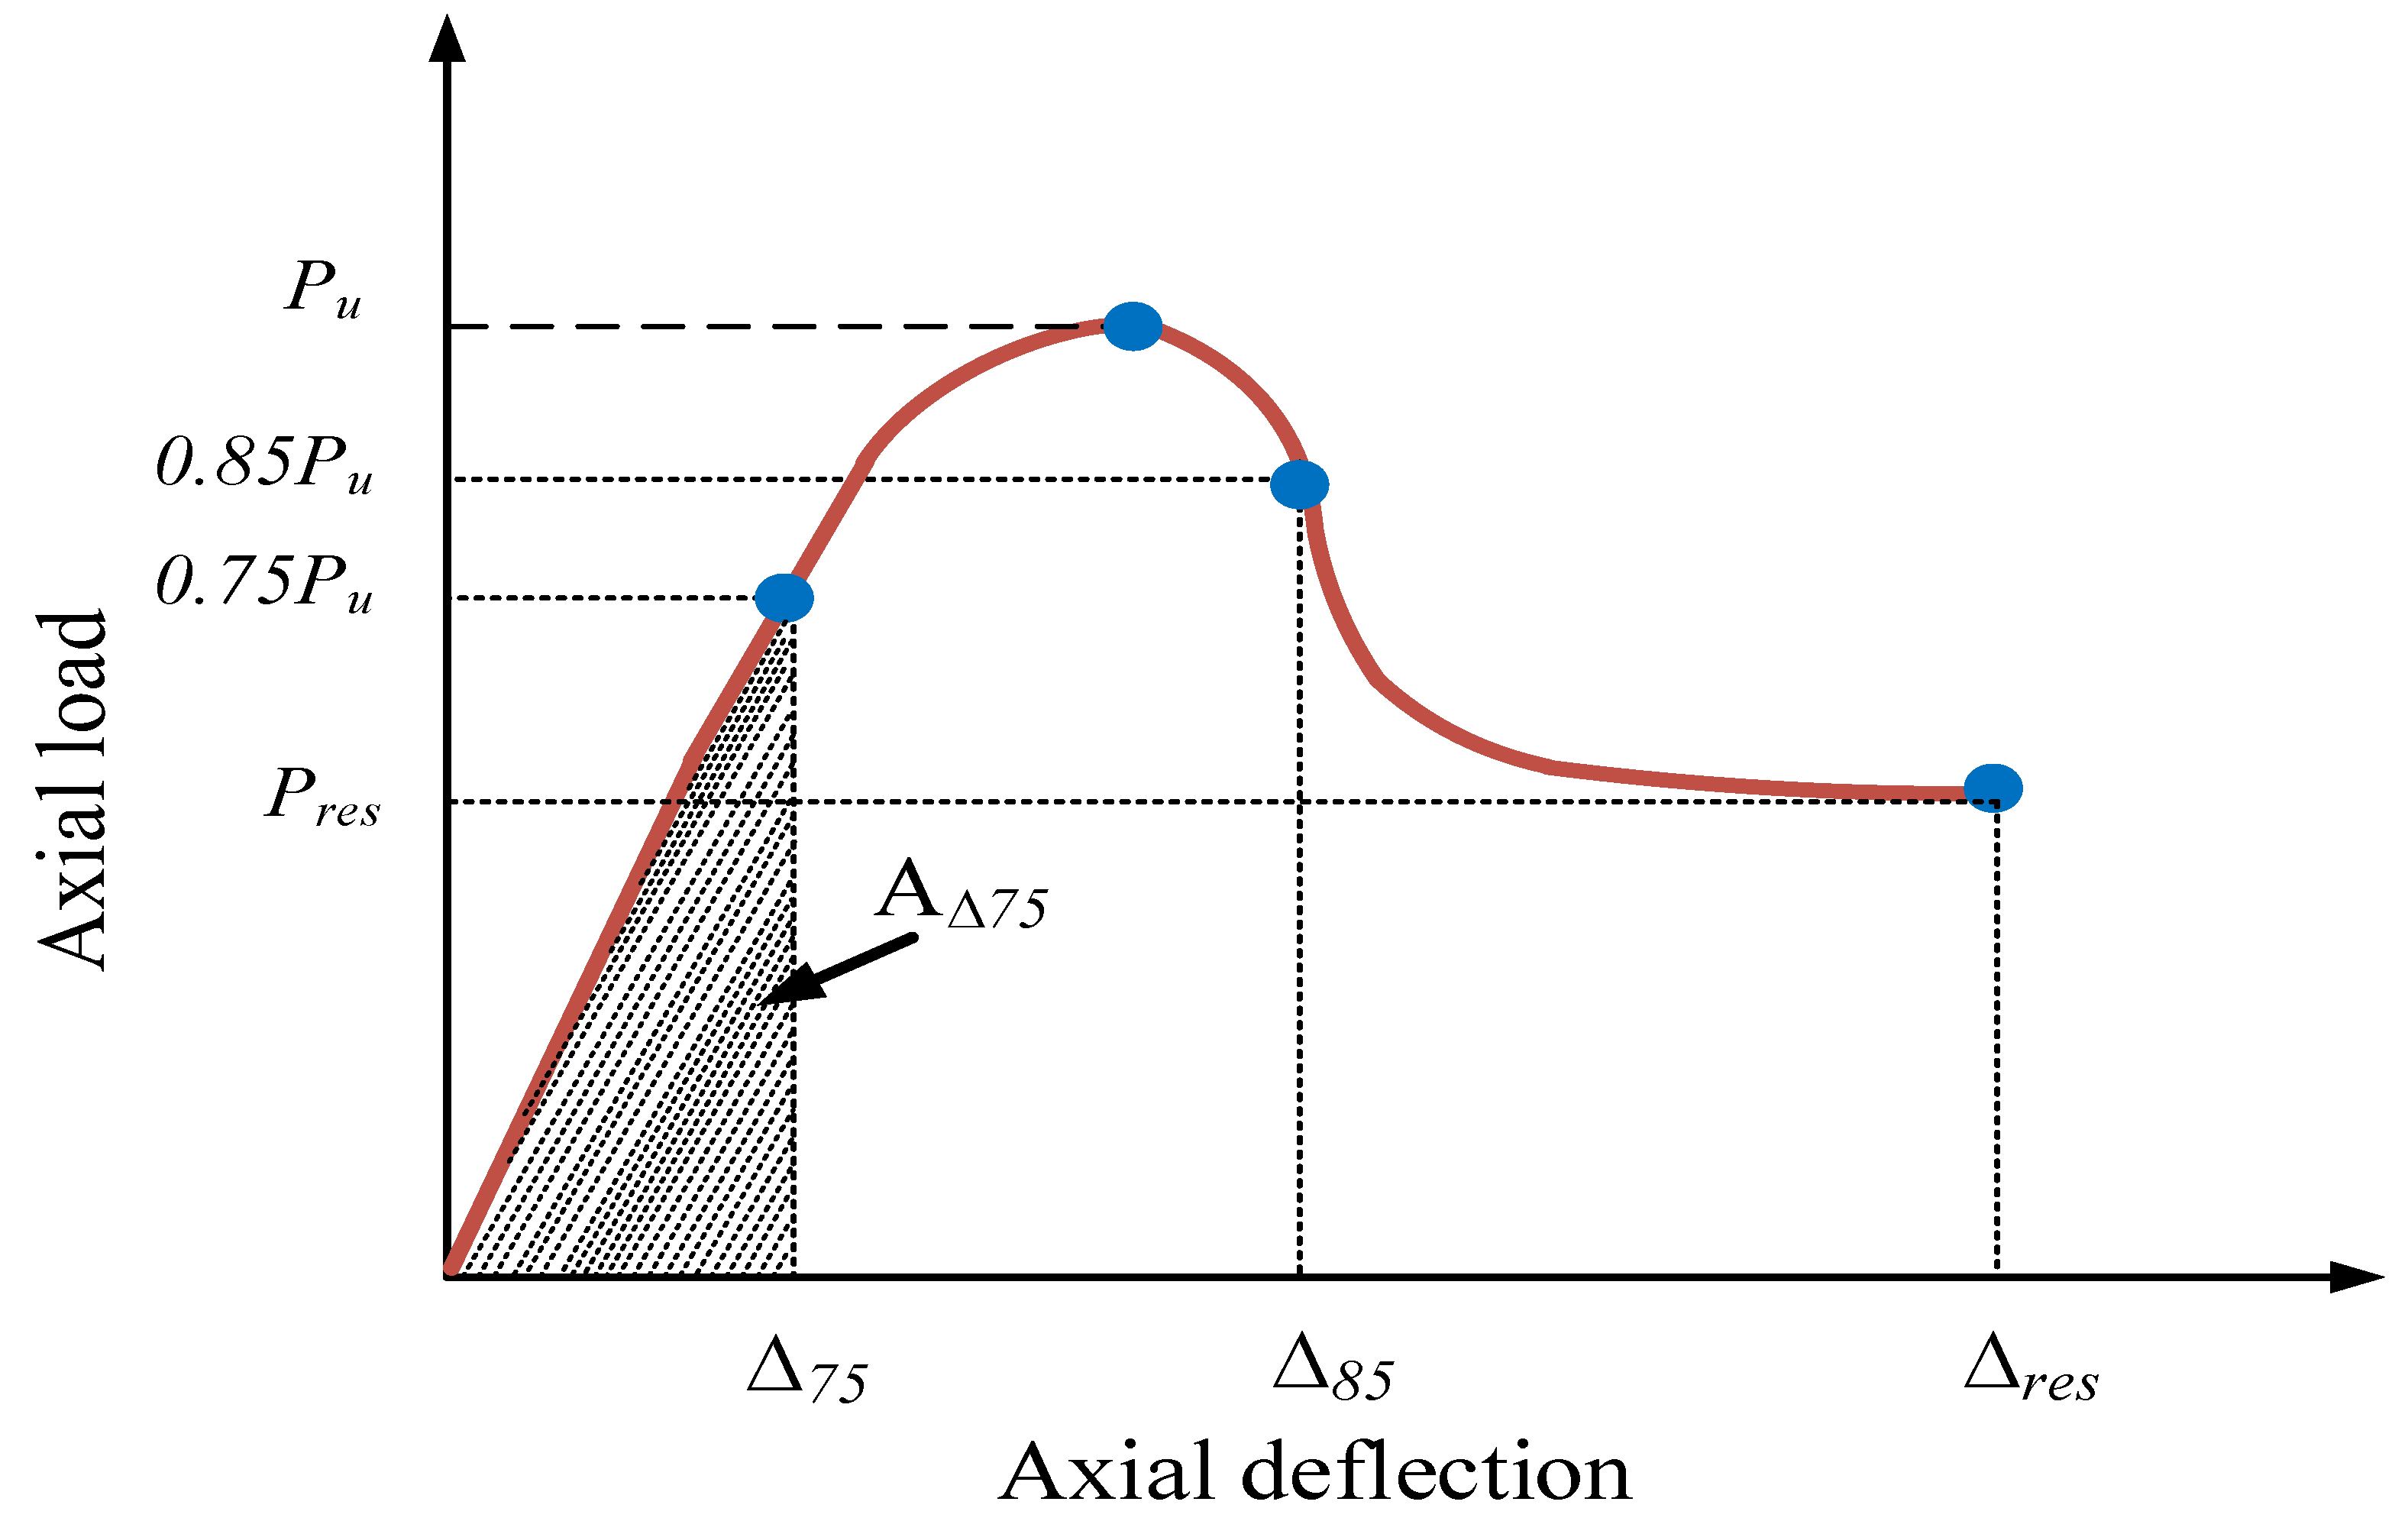
4.4. Ductility of Columns

The ability to withstand plastic deformation before failure is called ductility. It is the capability of any members to withstand the applied force after reaching the compressive strength limit. The term ductility may be applied to any of the mechanical parameters including deformation, rotation, axial strain, or energy associated with a member. For the hollow RC columns reinforced with GFRP, the ductility was examined and compared with that of the hollow RC columns with the same dimensions but reinforced with steel. The ductility factor ( D F ) for the columns in this study was determined using Equation (7).
D F = A 85 A 75
where A 75 and   A 85 are graphically explained through Figure 17. A 75 is the area under the curve up to a point ( 75 ) where the axial deformation is 75% of the ultimate compressive strength in the elastic phase, and   A 85 is the area under the curve up to a point ( 85 ) where the axial deformation is 85% of the ultimate compressive strength in the inelastic phase. Using the area under the curve method, the ductility factors of the numerical models of HG65 and HS65 were found to be 2.59 and 2.14, respectively. As both columns had similar geometry and reinforcements, only differing in the type of reinforcements, the ductility of the components with the steel bars was 20.68% lower than that of the components with the GFRP bars and was thus more brittle. This issue confirmed the earlier experimental results of [35,36,37].

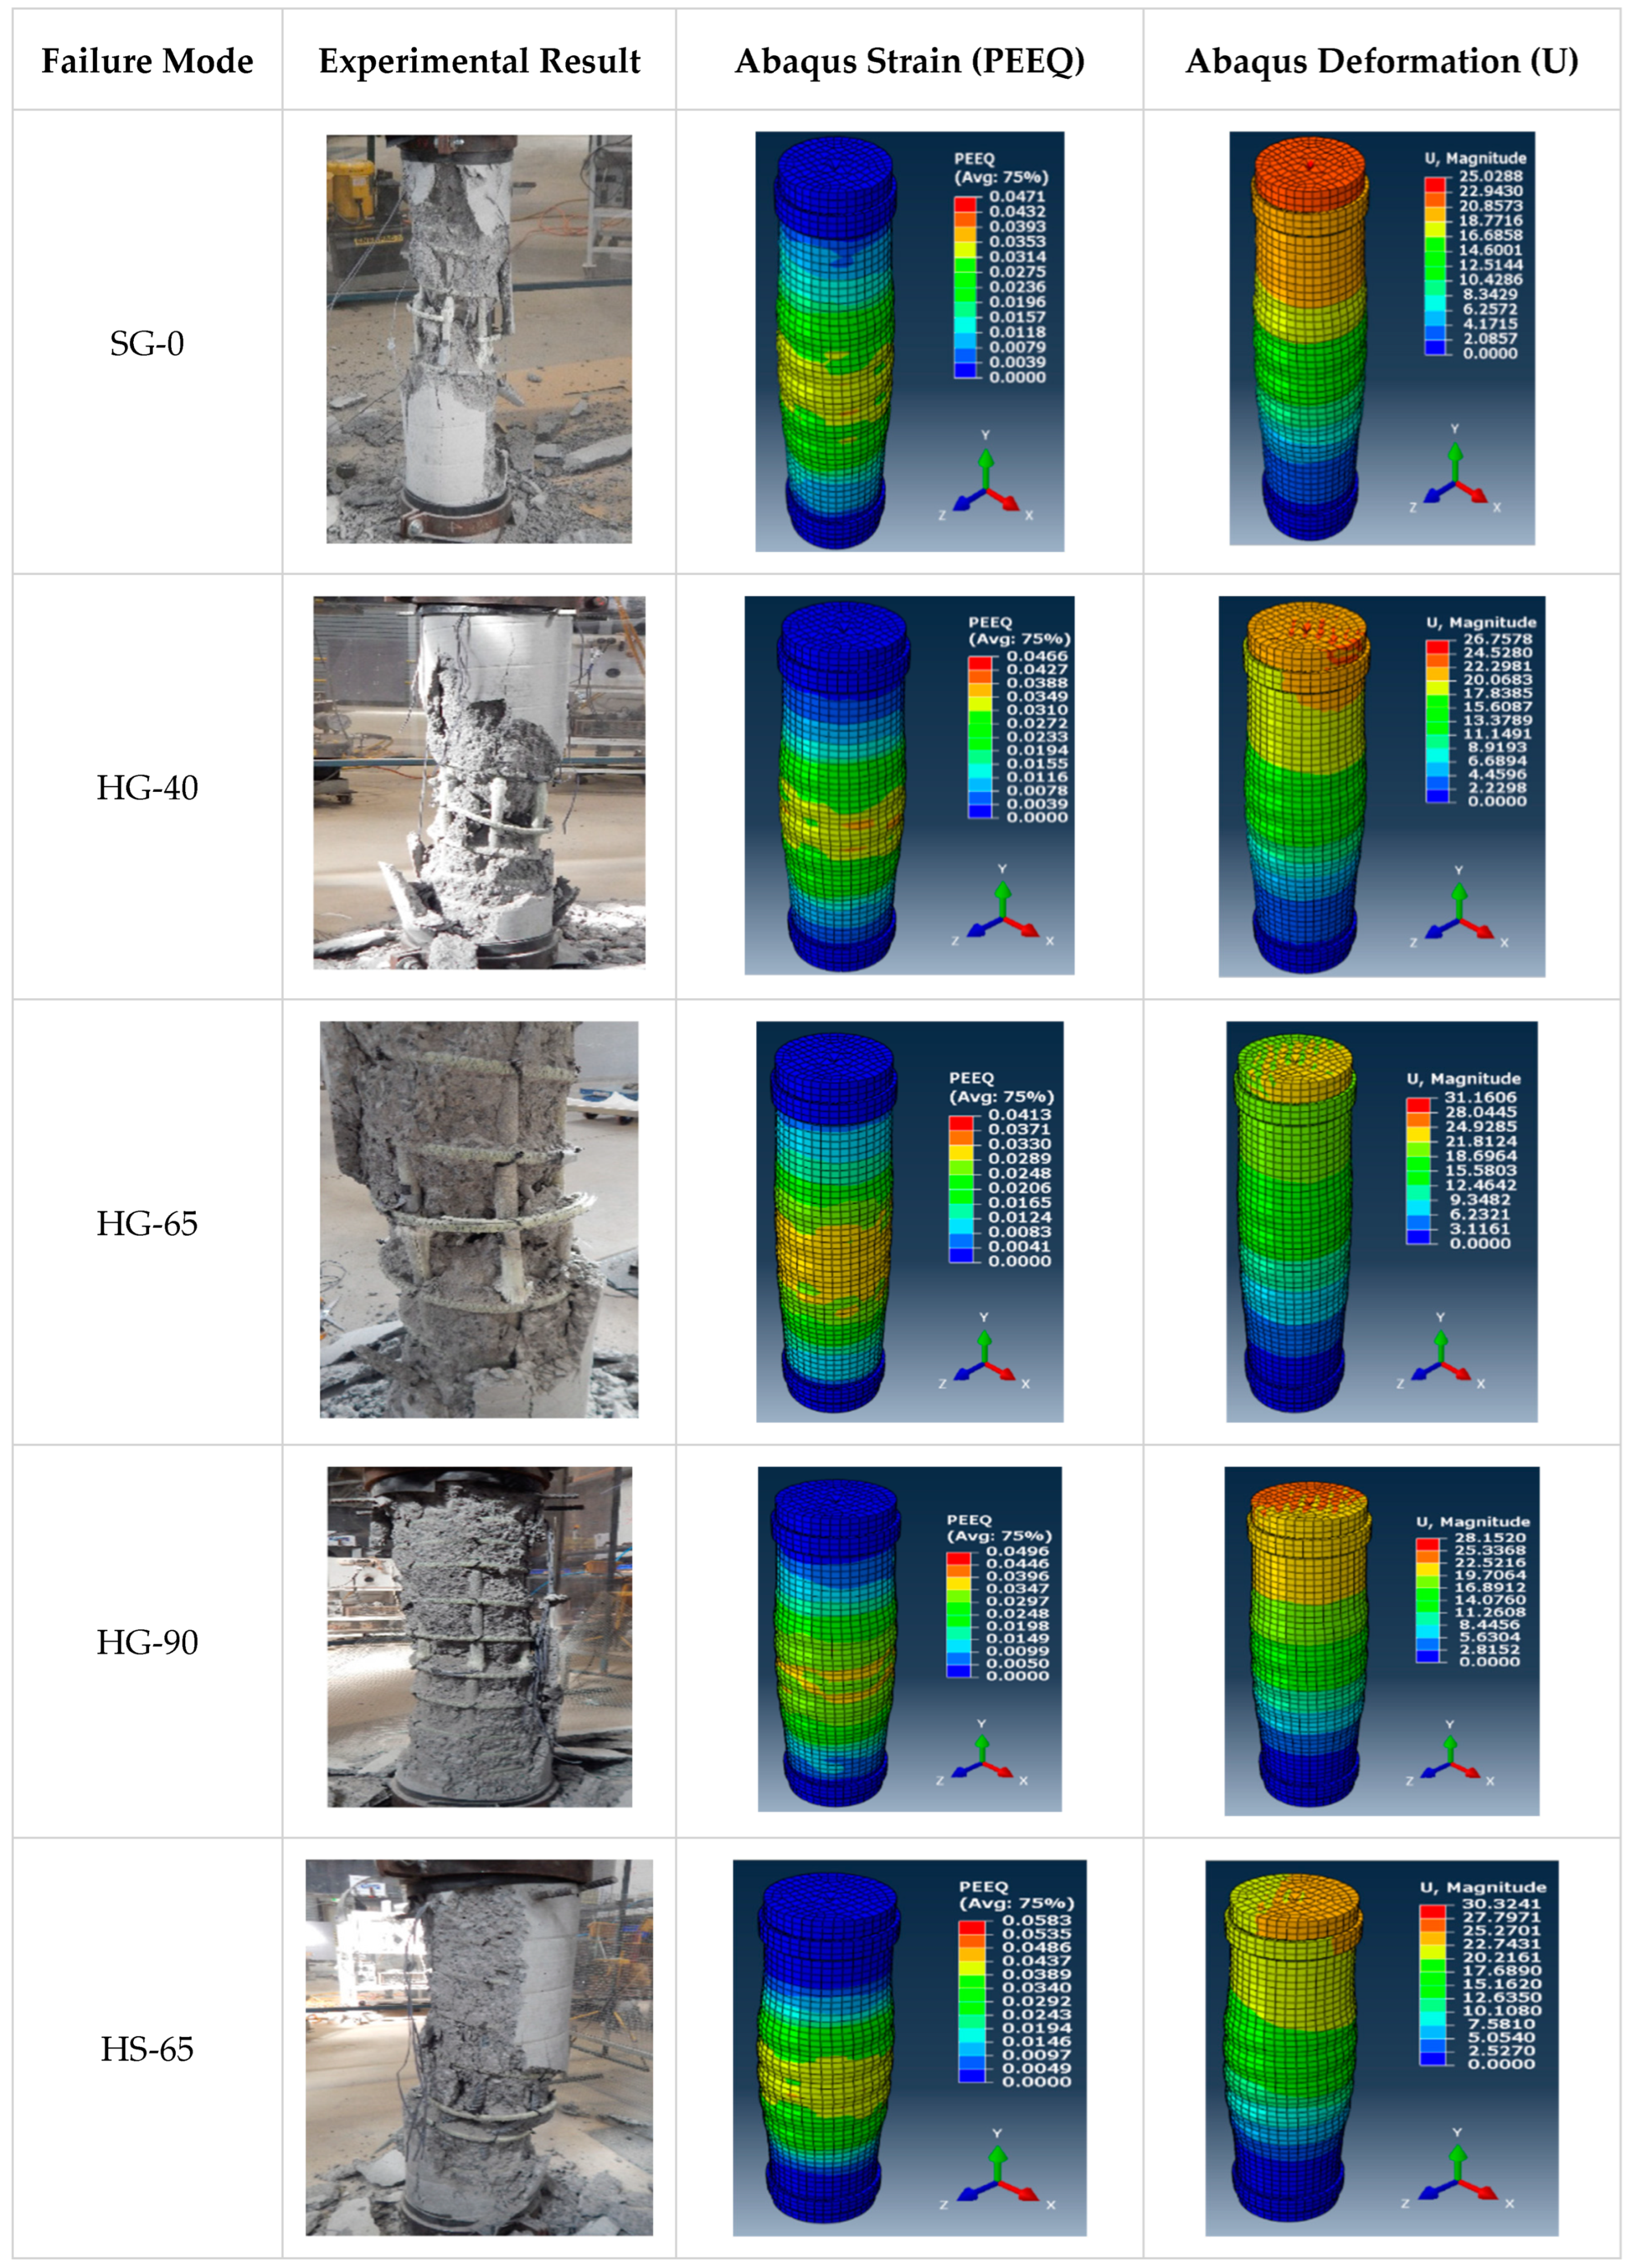
4.5. Crack Development and Failure Pattern

The visualization and simulation of cracks that were observed in the columns during the experimental study were performed with the help of the finite element models, as depicted in Figure 18. It was witnessed that the direction of equivalent plastic strain (PEEQ) is perpendicular to the development of cracks in concrete. Therefore, the models of the PEEQ of the studied columns were drawn to investigate the cracks’ behavior and failure modes in these columns. Strain models of all the columns were also studied to visualize and analyze the formation of the axial strain at the point of the cracks’ development. Furthermore, the PEEQ is the strain in the material that is irreversible and associated with the plastic deformation. It is often used to analyze the plastic behavior of the system, such as the amount of deformation that can occur before failure. The contours of the PEEQ in Figure 18 illustrate the maximum values of the concrete strain in the percentages.
Figure 18 demonstrate that the proposed finite element model could predict and explain the crack development behavior and failure pattern of the columns with reasonable accuracy. The failure modes of the columns are explained below:
a. 
Failure Mode of SG-0
The fracture of spirals followed abruptly by buckling of the longitudinal bars, resulting in failure of SG-0. However, the modeling showed the same with more stress concentration in the middle of SG-0 due to failure of both reinforcements.
b. 
Failure Mode of HG-40
The failure of the column HG-40 was due to the fracture of spirals and buckling of bars, with lesser time gap. The modeling indicated stress concentration in the center of the column, as a result of sequel spirals and bar failure.
c. 
Failure Mode of HG-65
In HG-65, there was more distributed failure owing to the bars rupture at different bars heights and simultaneous spiral fracture. The displayed stresses along the complete height of the column in the modeling presented more distributed failure.
d. 
Failure Mode of HG-90
The failure was because of the bar rupture after concrete spalling, with the spirals intact. The modeling provided lesser stresses, indicating the same controlled failure due to the bar rupture only.
e. 
Failure Mode of HS-65
In HS-65, the failure was characterized by bar buckling at different heights, but no spiral rupture. The modeling illustrated the same, with lesser stresses observed in the column, scattered along the column’s height.

4.6. Summary of Validity of Calibrated Model
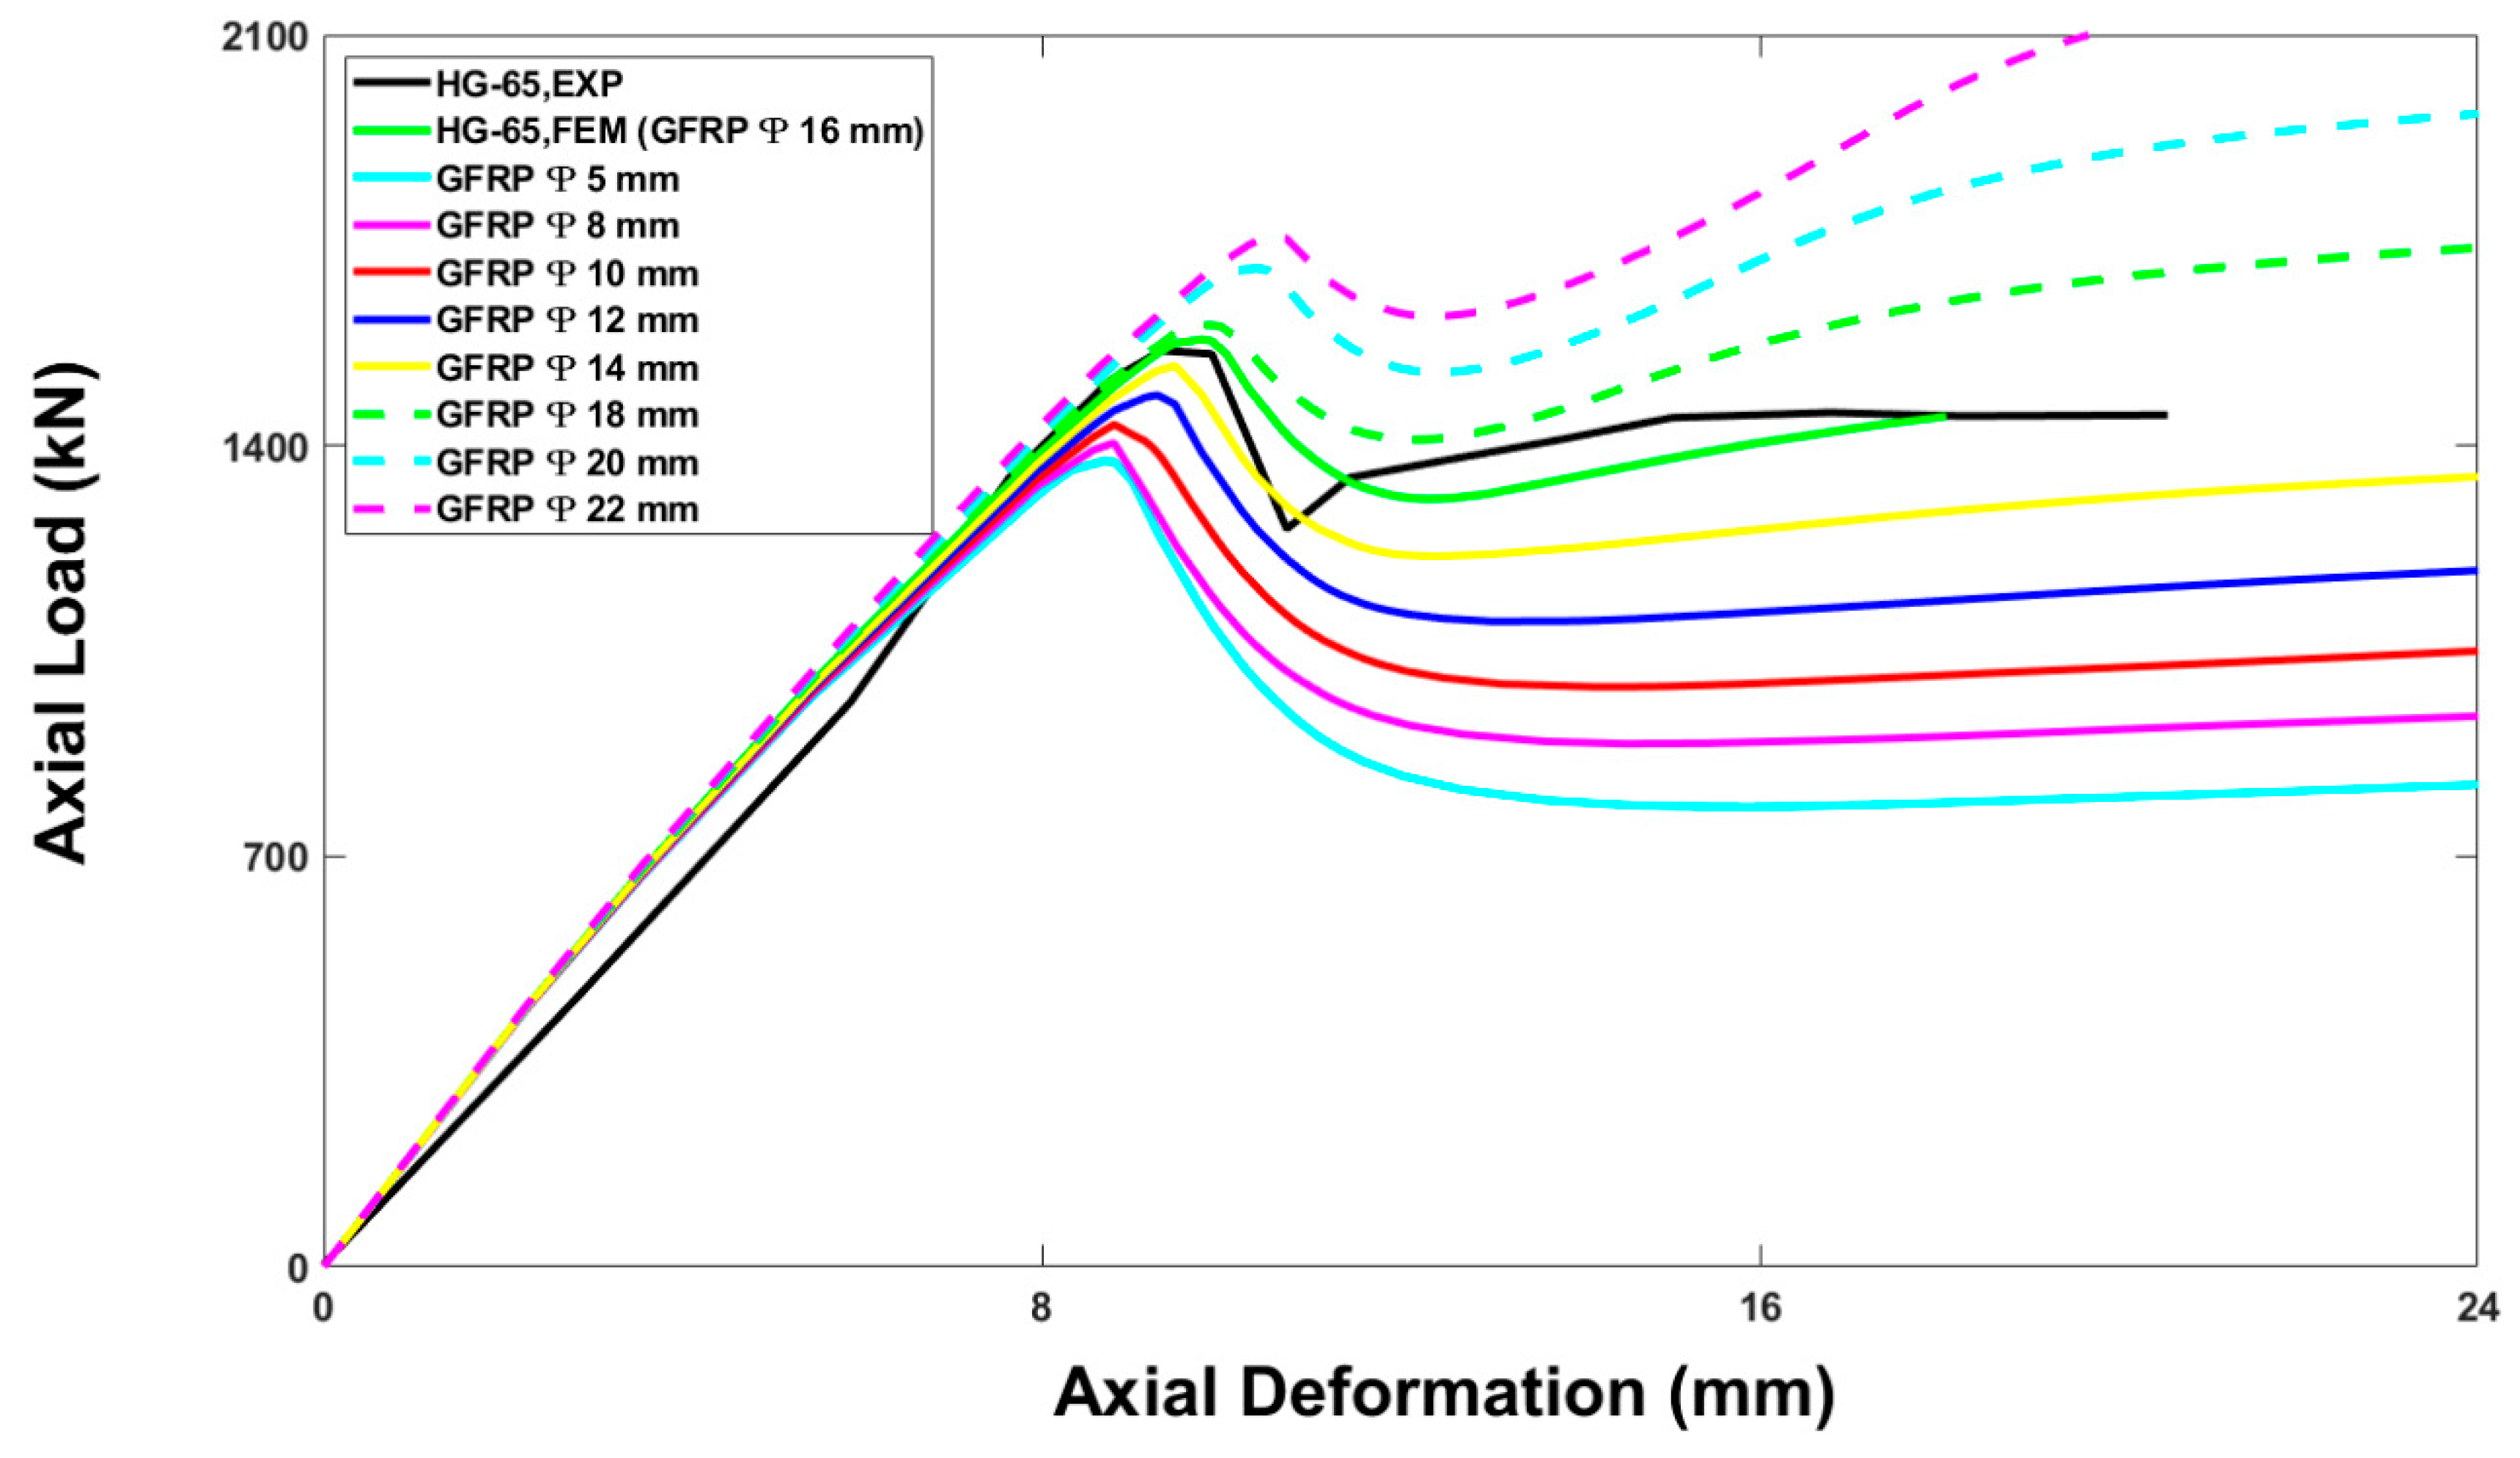
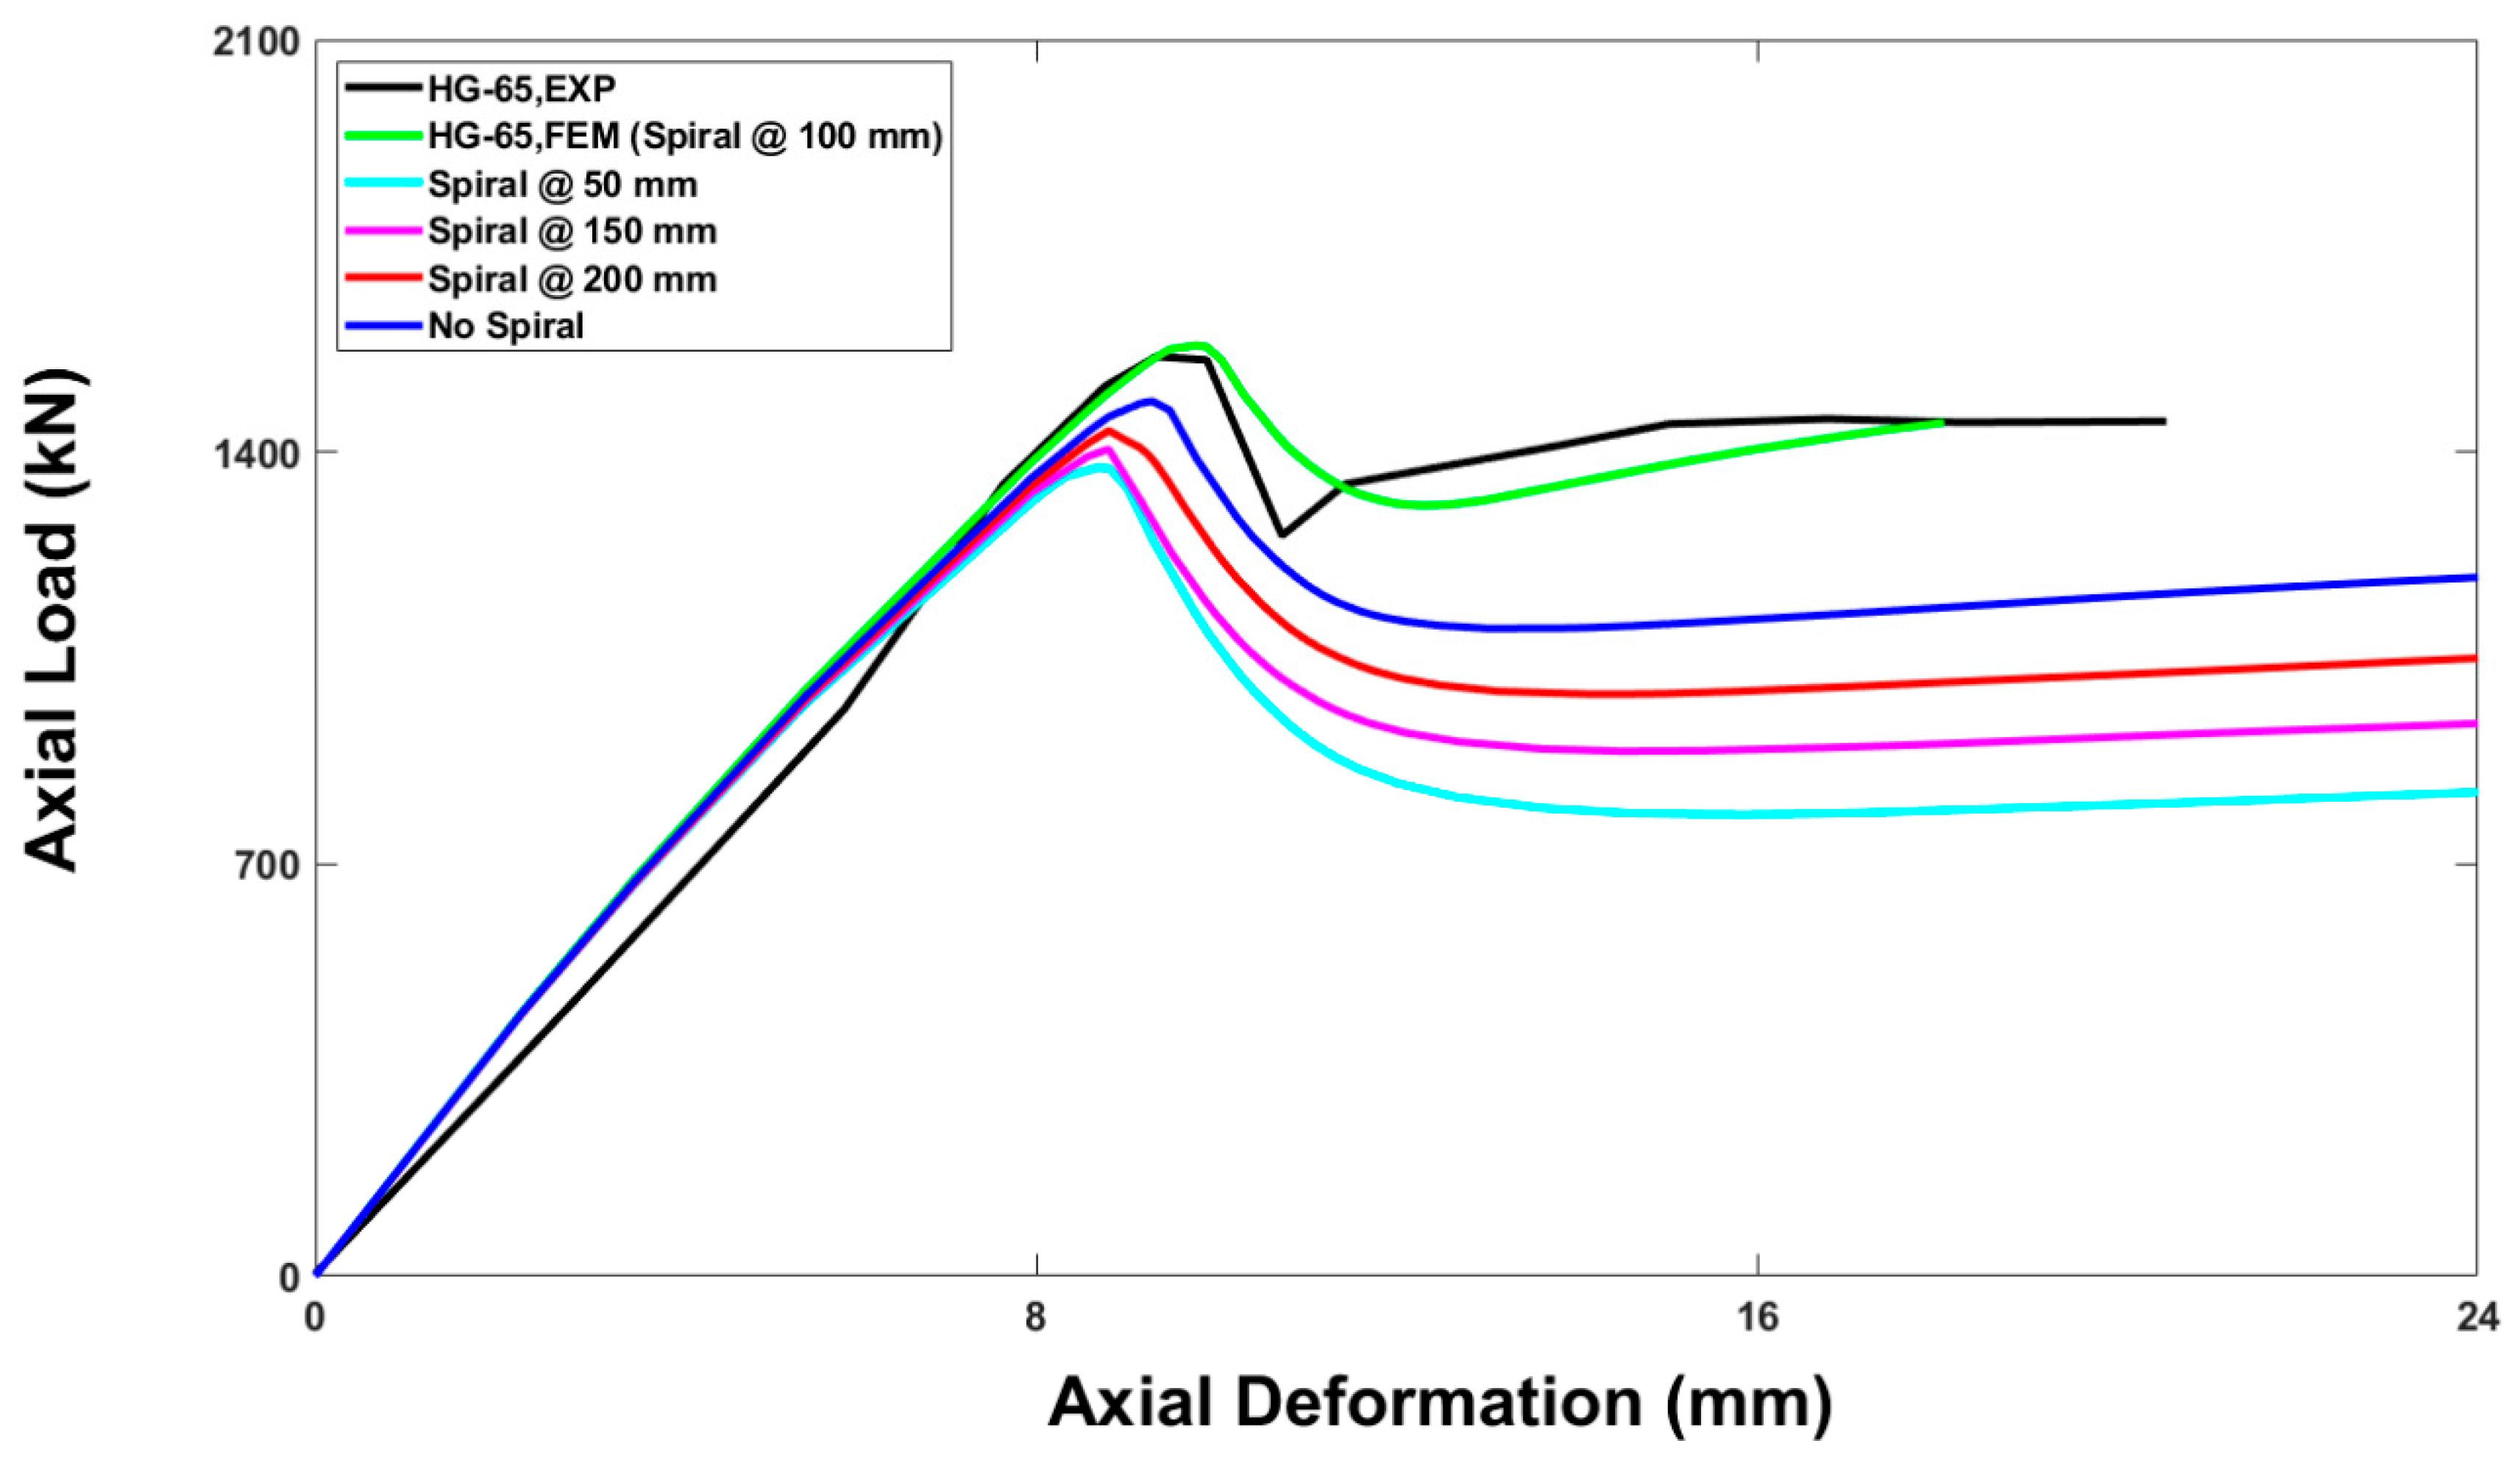
The comparison of the experimental results with those of the calibrated finite element models revealed that the axial load–axial displacement curve of the control model (HG65) followed a similar path to the experimental curve, as reported in Figure 13. The average difference in the peak loads of the experimental and numerical curves of the columns was 3.87%. The ductility of the components with the steel bars was 20.68% lower than that of the components with the GFRP bars, which resulted in being more brittle. Moreover, all the observations in Figure 18 proved that the finite element model can be used for further parametric study.

5. Parametric Study

To comprehensively study the axial load–axial deformation behavior of the hollow GFRPRC columns, a numerical parametric study was done on the control specimen, i.e., HG-65. The study aimed at determining the effects of different variables such as the concrete compressive strength (f’c), presence or absence of the GFRP spirals and bars (provision of reinforcements), longitudinal reinforcement ratio (ρl), and pitch of spiral reinforcement.

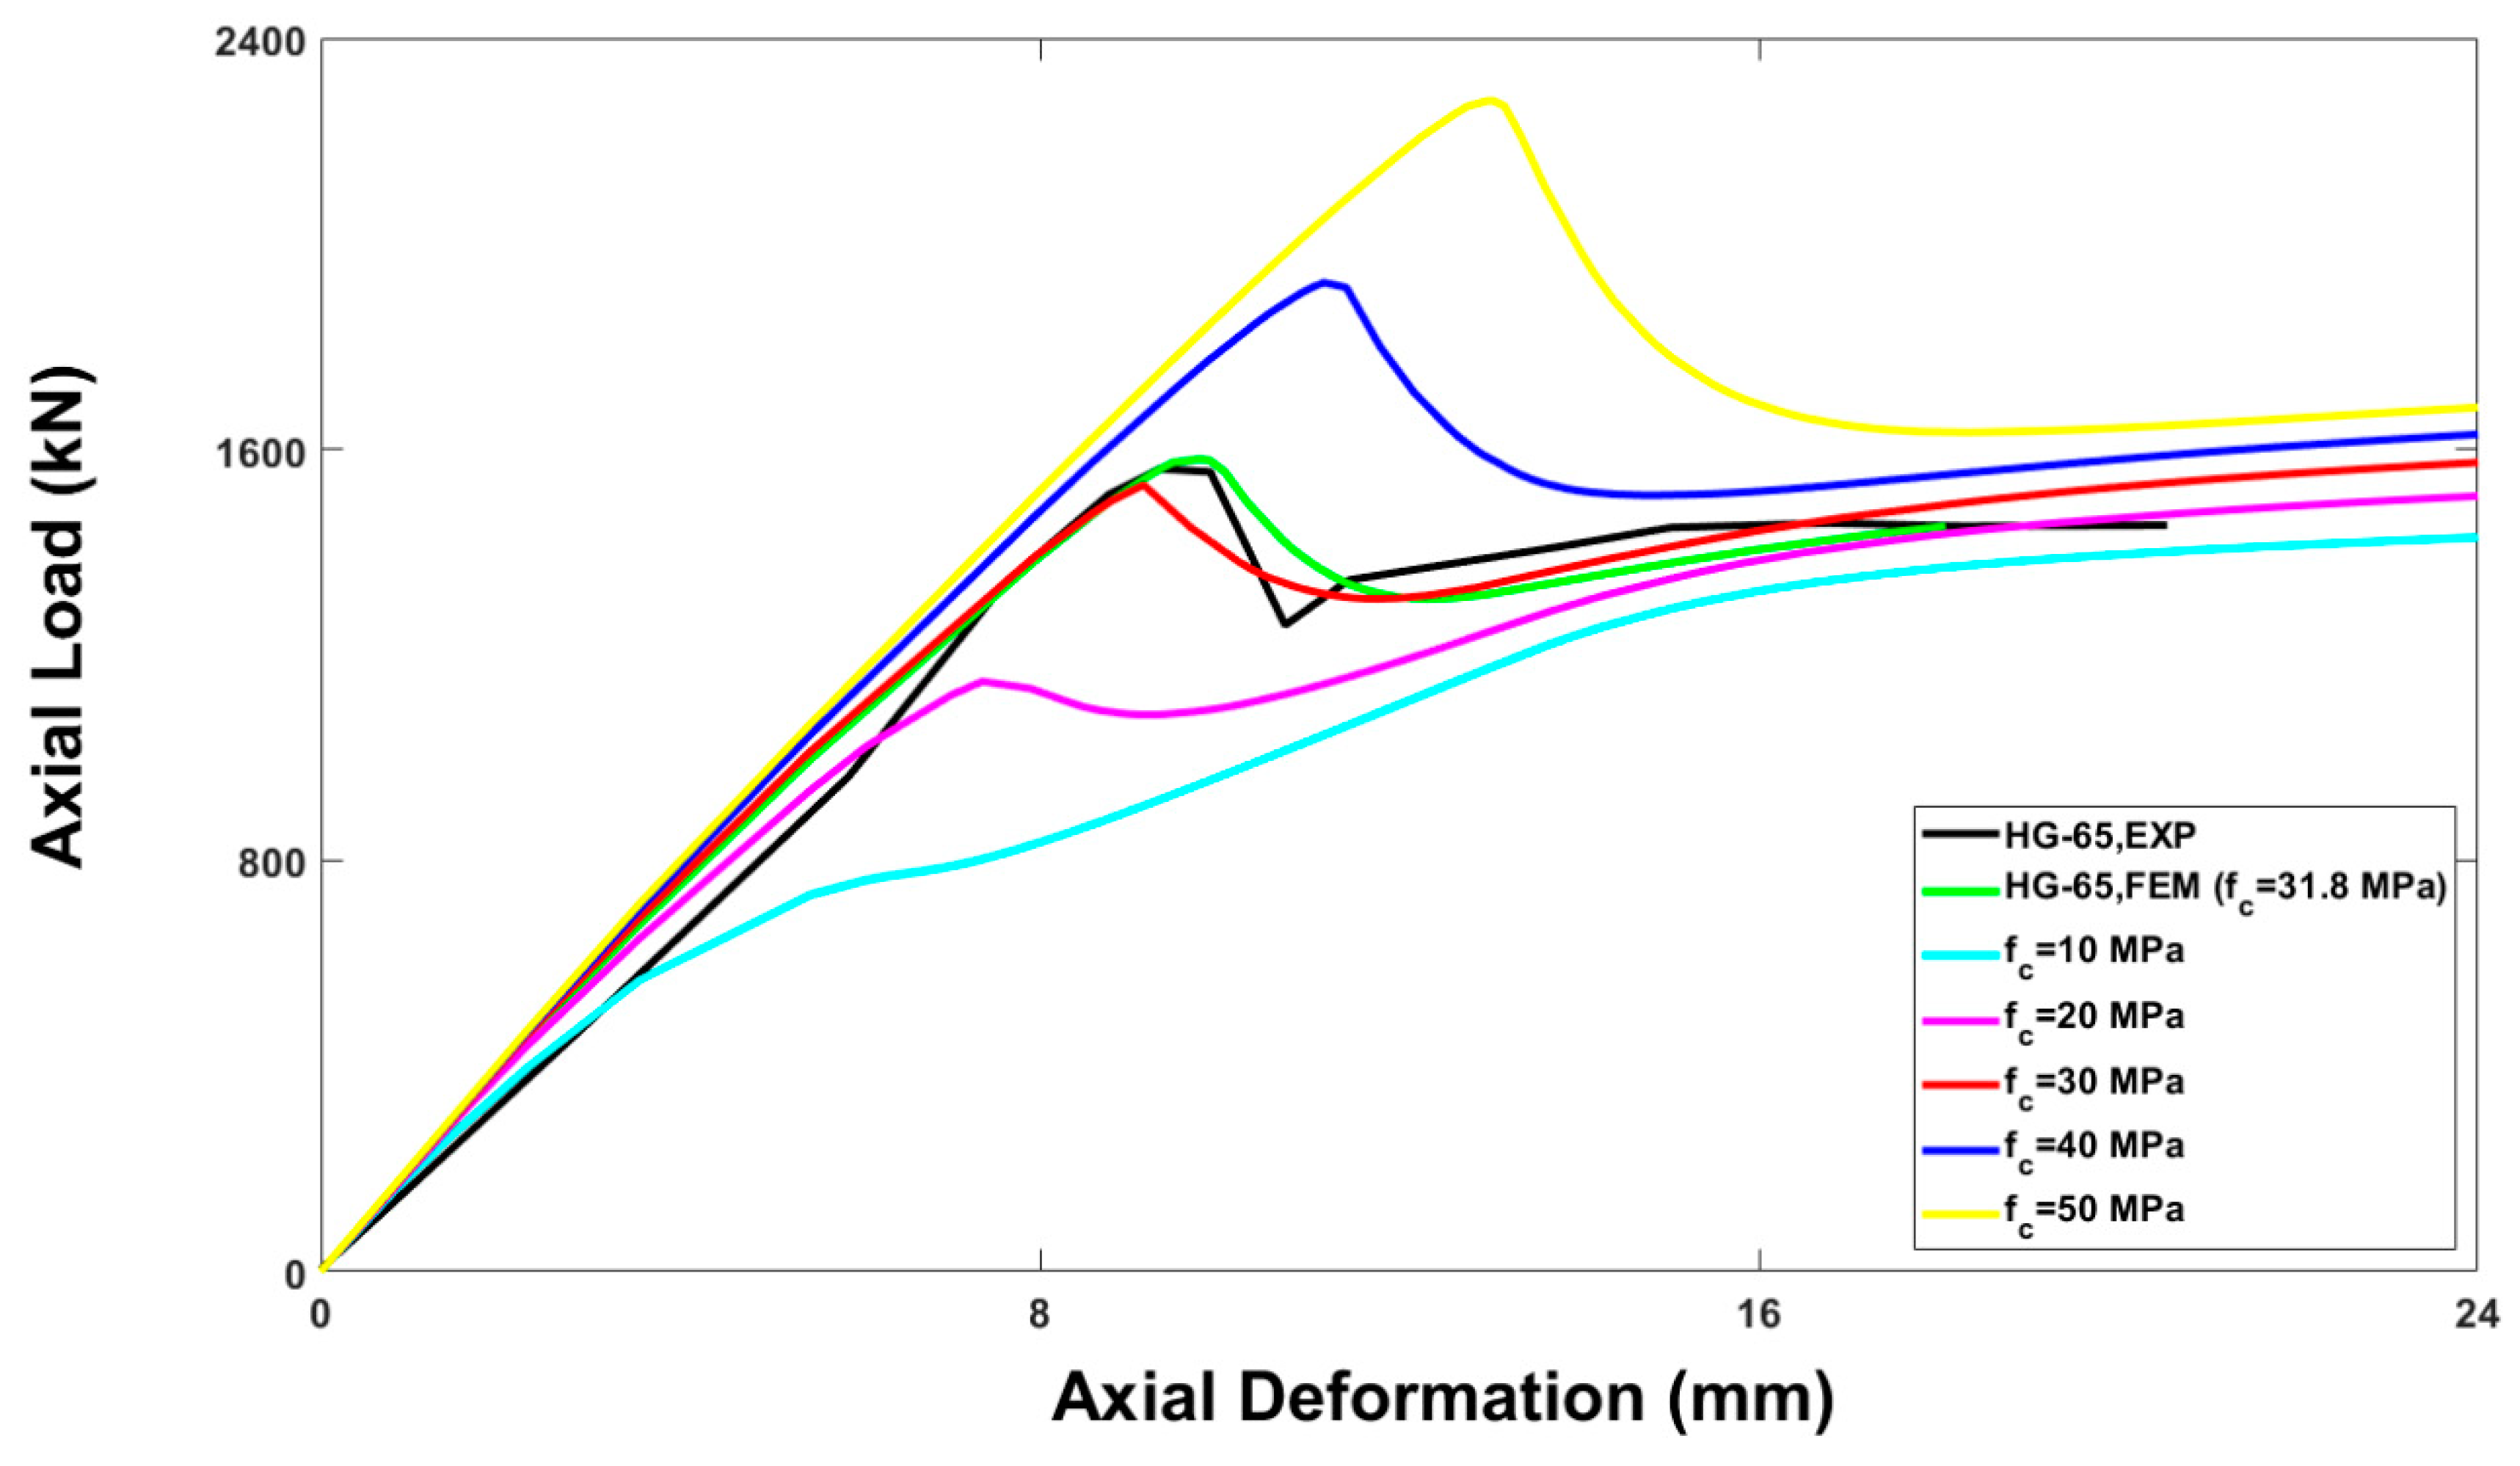
5.1. Effect of Concrete Compressive Strength (f’c)

To investigate the effect of varying the compressive strength of concrete (f’c) on the axial load–axial deformation response of the control specimen, fc of 10 MPa, 20 MPa, 30 MPa, 40 MPa, and 50 MPa were considered to analyze its effect on the axial behavior of the column. The resultant behavior is illustrated in Figure 19. The concrete strength of 30 MPa was taken as the benchmark, since it is closer to the compressive strength of the experimental specimen, i.e., 31.8 MPa. The longitudinal and lateral reinforcements were kept constant. The numerical specimens, having fc = 10 MPa (1434.94 kN), fc = 20 MPa (1516.84 kN), fc = 30 MPa (1583.45 kN), fc = 40 MPa (1924.339 kN), and fc = 50 MPa (2278.1 kN), provided the differences of −8.13%, −2.89%, 1.38%, 23.2%, and 45.85%, respectively, in the ultimate axial load-carrying capacities compared with that of the experimental test result as 1561.09 kN.

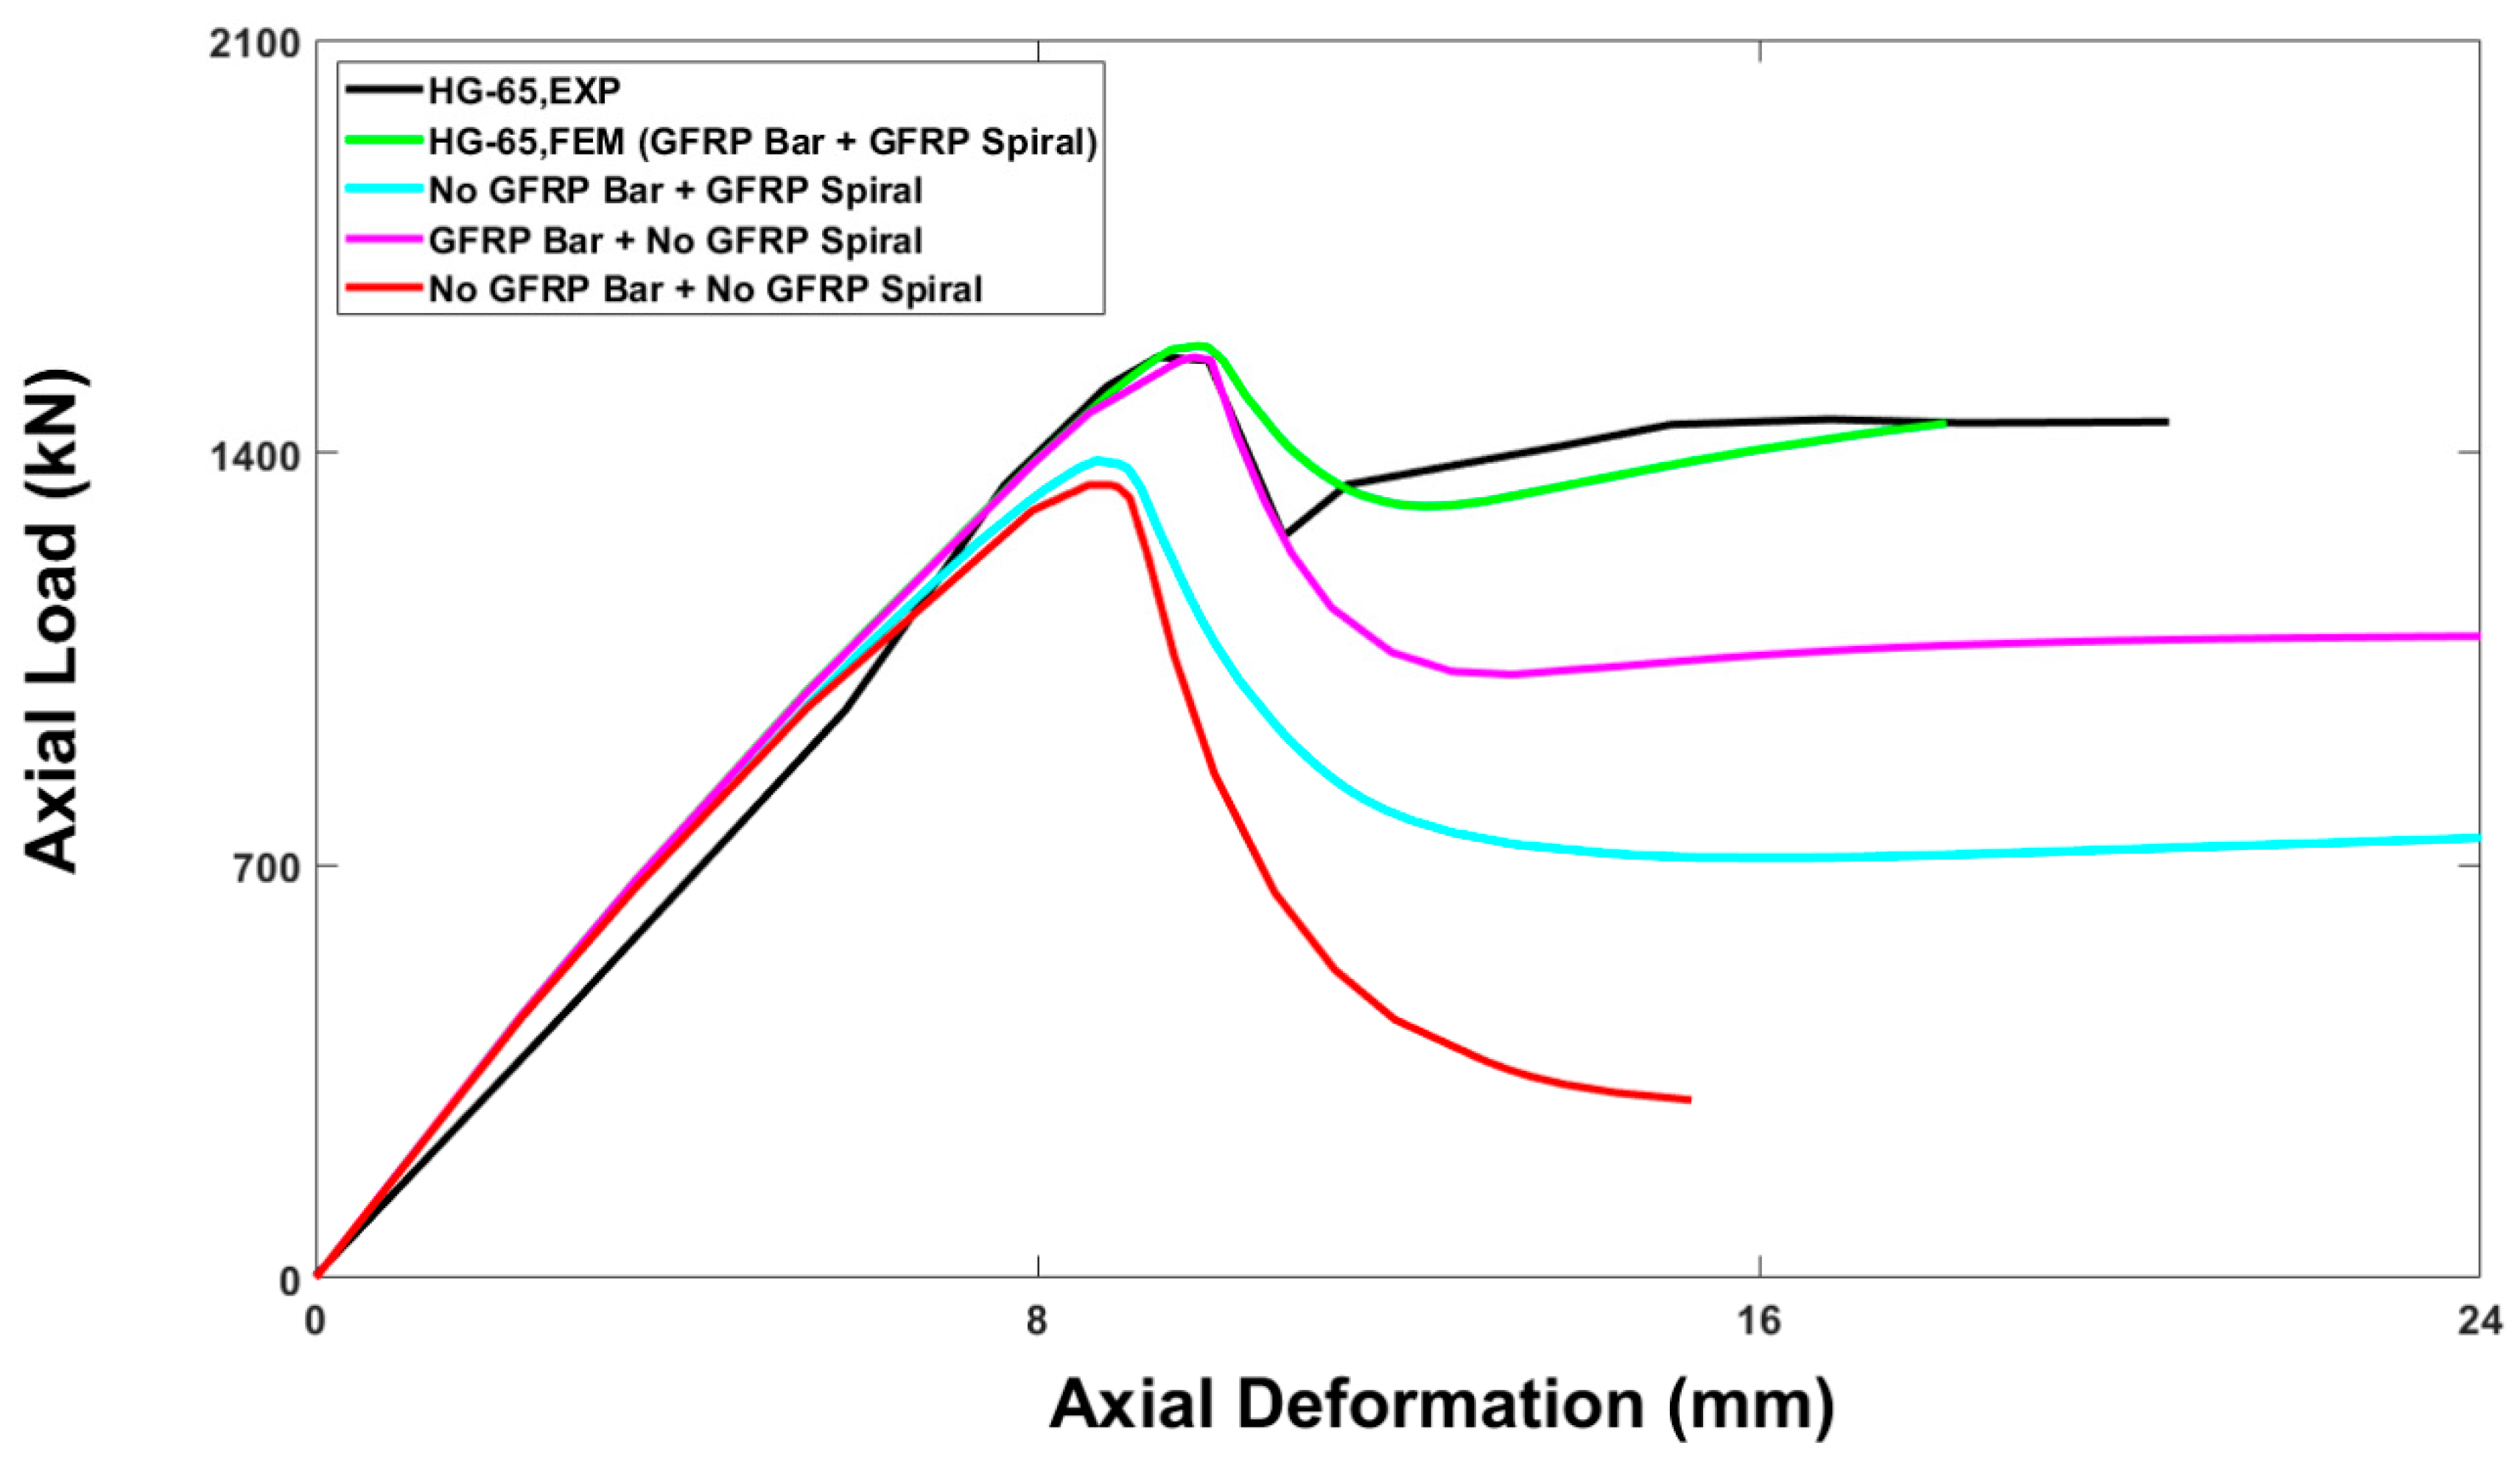
5.2. Effect of Provision of Reinforcements

To ascertain the comparative role of longitudinal as well as transverse reinforcements in the axial behavior of the modeled column, separate specimens were modeled in which either or both types of reinforcements were provided one by one. As can be seen from Figure 20, the ultimate axial load-carrying capacity was achieved for the control model, in which both the longitudinal and transverse reinforcements were used. However, the column, with the spiral reinforcement only, displayed higher ultimate load-carrying capacity than the column, with the longitudinal bars only. The least axial load-carrying capacity was observed for the column having no reinforcement. In addition, all the columns showed almost identical response in the pre-peak phase, while in the post-peak phase, the greatest axial load-carrying capacity was seen for the column with both types of the reinforcements, followed by spiral only column, bar only column, and no reinforcement column. The FEA of the specimens, with GFRP Bar + GFRP Spiral (1580.82 kN), No GFRP Bar + GFRP Spiral (1386.24 kN), GFRP Bar + No GFRP Spiral (1561.79 kN), and No GFRP Bar + No GFRP Spiral (1345.06 kN), presented the differences of 1.21%, −11.25%, −0.01%, and −13.88%, respectively, in the ultimate axial load-carrying capacities compared with that of the experimental test result (1561.09 kN).

5.3. Effect of Longitudinal Reinforcement Ratio (ρl)

Figure 21 illustrates the relation of various longitudinal reinforcement ratios with the axial load–axial deformation response of the hollow GFRP columns. The control model had the transverse reinforcement of 5-mm diameter GFRP spirals and the longitudinal reinforcement ratio of 2.6%, using 16-mm diameter GFRP bars. While keeping the transverse reinforcement constant, the longitudinal reinforcement was changed with the GFRP bars having the diameters of 10 mm, 12 mm, 14 mm, 16 mm, 18 mm, 20 mm, and 22 mm. The corresponding longitudinal reinforcement ratios achieved for these bars were 1.03%, 1.48%, 2.02%, 3.34%, 4.12%, and 4.98%, thus remaining within the recommended longitudinal reinforcement range for axial members (1–4%). It was observed that the percentage decreases in the axial load-carrying capacities compared with that of the control column were 2.82%, 5.99%, and 9.18%, by reducing the longitudinal reinforcement ratios to 2.02%, 1.48%, and 1.03%, respectively. Similarly, the increases of 1.56%, 7.67%, and 10.99% were observed by using the longitudinal reinforcement ratios of 3.34%, 4.12% and 4.98%, respectively. The FEA results verified that increasing the longitudinal reinforcement ratio enhanced the axial load-carrying capacity of the modeled columns, as shown by Figure 21.

5.4. Effect of Pitch of Spiral Reinforcement

In the control model, the spiral pitch of 100 mm was used in the middle portion of the column’s length. However, along the peripheral, 250 mm toward top and bottom of the column, the pitch was reduced to 50 mm to avoid premature cracking of concrete. Due to the varying pitch along the length, the effect of the pitch on the column’s axial load-carrying capacity was not completely understood. Therefore, to clearly observe the effect of the spiral pitch on the column’s response, three separate specimens were modeled with the continuous spiral pitches of 50 mm, 100 mm, and 200 mm. The results in Figure 22 signifies that the spiral pitch of 50 mm was the most effective with 7.05% higher axial load-carrying capacity compared with the column with the spiral pitch of 200 mm. The numerical specimens, having Spiral @ 100 mm (1580.82 kN), Spiral @ 50 mm (1373.50 kN), Spiral @ 150 mm (1404.85 kN), Spiral @ 200 mm (1435.74 kN), and No Spiral (1486.16 kN), provided the differences of 1.21%, −12.06%, −10.06%, −8.08%, and −4.9%, respectively, in the ultimate axial load-carrying capacities compared with that of the experimental test result as 1561.09 kN.

6. Compatibility of Equations for Axial Load-Carrying Capacity

The RC design codes such as ACI 440 [3] and AS 1012.9 [45] consider the design of RC columns reinforced with FRP but both of them ignore the relative share of the GFRP reinforcements in the axial load-carrying capacity of the RC columns and suggest that the load is resisted by concrete only. Researchers [35,36,37] have found that the GFRP bars also add to the axial load-carrying capacity, therefore, its incorporation into the equation is essential to accurately predict the compressive behavior of hollow RC columns. The specific amount of contribution provided by the GFRP bars is, however, under study due to variation in failure behavior of the GFRP reinforcements under axial load. Afifi et al. [48] observed that the compressive strength of GFRP corresponds to 35% of its strength in tension, as demonstrated in Equation (8). However, their hypothesis overrated the contribution of the GFRP bars. This may be attributed to lower strength of the GFRP bars tested by Afifi et al. [48] in comparison with the one used in this study. On the contrary, Tobbi et al. [49] proposed the linear elastic theory with respect to the GFRP reinforcements, in which the axial load-carrying capacity of the GFRP bars is expressed in terms of multiplication of the elastic modulus of GFRP (EFRP) and average axial strain value corresponding to the peak load. The expression is elaborated by Equation (9). AlAjarmeh et al. [35,36,37] proposed another equation through an experimental study, as Equation (10). The actual contribution of the concrete area was taken by all the researchers as 85% of the concrete compressive strength, as per recommendation of ACI 440 [3].
P n = 0.85 f c + 0.35 f u , F R P . A F R P  
P n = 0.85 f c A g A F R P + 0.002 E F R P . A F R P  
P n = 0.85 f c A g A F R P + 0.0025 E F R P . A F R P  
In the above equations, f’c is the concrete compressive strength, EFRP is the elastic modulus of the longitudinal FRP bars, Ag is the column’s gross cross-sectional area, AFRP is the longitudinal FRP bar’s cross-sectional area, and fu,FRP is the GFRP bar’s ultimate tensile strength. The axial load-carrying capacity ratio (Pn) was calculated with Equations (8)–(10) and compared with the experimental and FEA results. The comparisons are summarized in Table 5. The table indicates that Equations (9) and (10) present the most accurate results regarding the axial load-carrying capacities.

7. Conclusions

This research work aimed at exploring the axial response of the hollow GFRPRC columns, using Abaqus. The FEA was executed by simulating the RC columns using the CDP model and reinforcements as linear elastic materials. The following are the key outcomes of this study:
  • The results indicated that the axial load-carrying capacity of the hollow RC columns reinforced with GFRP was affected by certain input parameters. The most critical of these parameters were the mesh size and viscosity parameter. Other variables affecting ultimate axial load-carrying capacity of the columns were the shape factor, dilation angle, and mesh type. Thus, any finite element model should be calibrated for these variables before using it for numerical study.
  • The FEA analysis yielded close results with those earlier concluded by experimental work. The axial load-axial deformation responses of the finite element models of all the columns coincided with a reasonable accuracy to the experimental curve, particularly in the pre-peak phase.
  • The post-peak behavior of the axial load–axial deformation curves which employed the GFRP bars and spirals, could be accurately simulated by Abaqus. However, the ultimate failure of the GFRP reinforcements could not be predicted by the curve. This was probably due to the fact that the damage parameters of the GFRP were not as defined as that of concrete. Therefore, further study is required to define the damage pattern of the GFRP reinforcements.
  • The average variation in the ultimate axial load-carrying capacities of the experimental results, from that of FEA values, was noted to be only 3.87%, while the average difference in their corresponding deformations was 7.08%. This nominal difference in the results revealed that the numerical model was suitable for implementation in further study on the hollow GFRPRC columns.
  • The numerical analysis confirmed the results of the experimental work regarding the effects of inner-to-outer diameter ratios, hollowness, and confinement efficiency on the hollow RC columns reinforced with GFRP.
  • The cracking pattern in the hollow RC columns was visualized through PEEQs. A satisfactory comparison was obtained between the crack development behavior attained through the FEA and actual experimental cracks. This substantiated the idea that the FEA analysis of structural members can be performed using Abaqus, instead of undergoing costly experimental investigations.
  • The average variations between numerically obtained ultimate axial load-carrying capacities and the results of Equations (8)–(10) were 31.368%, 3.383%, and 3.378%, respectively.
  • The numerical parametric study of HG-65 (selected model column) revealed that the ultimate axial load-carrying capacity of the column was enhanced by increasing the concrete compressive strength and longitudinal reinforcement ratio or by reducing the spiral pitch.
The limitation of this work is that the outcomes of the parametric study through the detail experimental scheme must be validated, which is the future work of this research project.

Recommendation

The load-carrying capacity of the hollow GFRP columns can be predicted by the FEM models by using the values of the viscosity parameter, shape factor, dilation angle, and mesh size of 0.0018, 0.667, 36°, and 20 mm, respectively. The results exhibited that the presented FEM models predicted the close axial load–axial deformation curves of the studied specimens compared with that of the experimental counterpart.

Author Contributions

A.A.: Conceptualization; Methodology; Investigation; Validation; Formal analysis; Resources; Writing—original draft; Project administration. A.B.: Conceptualization; Methodology; Investigation; Validation; Formal analysis; Resources; Writing—original draft; Writing—review and editing; Project administration. O.A.: Investigation; Validation. N.C.: Formal analysis. M.Y.: Validation. All authors have read and agreed to the published version of the manuscript.

Funding

This research received no external funding.

Data Availability Statement

Not applicable.

Conflicts of Interest

The authors declare no conflict of interest.

References

  1. Deitz, D.; Harik, I.E.; Gesund, H. Physical properties of glass fiber reinforced polymer rebars in compression. J. Compos. Constr. 2003, 7, 363–366. [Google Scholar] [CrossRef]
  2. Ephraim, M.; Adetiloye, A.; Harcourt, P. Mechanical properties of glass fibre reinforced polymer based on resin from recycled plastic. IJSER 2015, 6, 145–152. [Google Scholar]
  3. ACI Committee. Guide for the Design and Construction of Structural Concrete Reinforced with Fiber-Reinforced Polymer (FRP) Bars (ACI 440. 1R-15); American Concrete Institute: Farmington Hills, MI, USA, 2015. [Google Scholar]
  4. Jabbar, S.A.; Farid, S.B. Replacement of steel rebars by GFRP rebars in the concrete structures. Karbala Int. J. Mod. Sci. 2018, 4, 216–227. [Google Scholar] [CrossRef]
  5. Afifi, M.Z.; Mohamed, H.M.; Benmokrane, B. Axial capacity of circular concrete columns reinforced with GFRP bars and spirals. J. Compos. Constr. 2014, 18, 04013017. [Google Scholar] [CrossRef]
  6. Afifi, M.Z.; Mohamed, H.M.; Benmokrane, B. Theoretical stress–strain model for circular concrete columns confined by GFRP spirals and hoops. Eng. Struct. 2015, 102, 202–213. [Google Scholar] [CrossRef]
  7. Ali, M.A.; El-Salakawy, E. Seismic performance of GFRP-reinforced concrete rectangular columns. J. Compos. Constr. 2016, 20, 04015074. [Google Scholar] [CrossRef]
  8. El Refai, A.; Abed, F.; Al-Rahmani, A. Structural performance and serviceability of concrete beams reinforced with hybrid (GFRP and steel) bars. Constr. Build. Mater. 2015, 96, 518–529. [Google Scholar] [CrossRef]
  9. Hadhood, A.; Mohamed, H.M.; Ghrib, F.; Benmokrane, B. Efficiency of glass-fiber reinforced-polymer (GFRP) discrete hoops and bars in concrete columns under combined axial and flexural loads. Compos. Part B Eng. 2017, 114, 223–236. [Google Scholar] [CrossRef]
  10. Hadi, M.N.; Karim, H.; Sheikh, M.N. Experimental investigations on circular concrete columns reinforced with GFRP bars and helices under different loading conditions. J. Compos. Constr. 2016, 20, 04016009. [Google Scholar] [CrossRef]
  11. Hadi, M.N.; Youssef, J. Experimental investigation of GFRP-reinforced and GFRP-encased square concrete specimens under axial and eccentric load, and four-point bending test. J. Compos. Constr. 2016, 20, 04016020. [Google Scholar] [CrossRef]
  12. Hales, T.A.; Pantelides, C.P.; Reaveley, L.D. Experimental evaluation of slender high-strength concrete columns with GFRP and hybrid reinforcement. J. Compos. Constr. 2016, 20, 04016050. [Google Scholar] [CrossRef]
  13. Karim, H.; Sheikh, M.N.; Hadi, M.N. Axial load-axial deformation behaviour of circular concrete columns reinforced with GFRP bars and helices. Constr. Build. Mater. 2016, 112, 1147–1157. [Google Scholar] [CrossRef]
  14. Khan, Q.S.; Sheikh, M.N.; Hadi, M.N. Axial-flexural interactions of GFRP-CFFT columns with and without reinforcing GFRP bars. J. Compos. Constr. 2017, 21, 04016109. [Google Scholar] [CrossRef]
  15. Khorramian, K.; Sadeghian, P. Experimental and analytical behavior of short concrete columns reinforced with GFRP bars under eccentric loading. Eng. Struct. 2017, 151, 761–773. [Google Scholar] [CrossRef]
  16. Mohamed, H.M.; Benmokrane, B. Design and performance of reinforced concrete water chlorination tank totally reinforced with GFRP bars: Case study. J. Compos. Constr. 2014, 18, 05013001. [Google Scholar] [CrossRef]
  17. Pantelides, C.P.; Gibbons, M.E.; Reaveley, L.D. Axial load behavior of concrete columns confined with GFRP spirals. J. Compos. Constr. 2013, 17, 305–313. [Google Scholar] [CrossRef]
  18. Sun, L.; Wei, M.; Zhang, N. Experimental study on the behavior of GFRP reinforced concrete columns under eccentric axial load. Constr. Build. Mater. 2017, 152, 214–225. [Google Scholar] [CrossRef]
  19. Tabatabaei, A.; Eslami, A.; Mohamed, H.M.; Benmokrane, B. Strength of compression lap-spliced GFRP bars in concrete columns with different splice lengths. Constr. Build. Mater. 2018, 182, 657–669. [Google Scholar] [CrossRef]
  20. Tavassoli, A.; Sheikh, S.A. Seismic resistance of circular columns reinforced with steel and GFRP. J. Compos. Constr. 2017, 21, 04017002. [Google Scholar] [CrossRef]
  21. Raza, A.; Khan, Q.u.Z.; Ahmad, A. Prediction of axial compressive strength for FRP-confined concrete compression members. KSCE J. Civ. Eng. 2020, 24, 2099–2109. [Google Scholar] [CrossRef]
  22. Raza, A.; Khan, Q.u.Z.; Ahmad, A. Investigation of HFRC columns reinforced with GFRP bars and spirals under concentric and eccentric loadings. Eng. Struct. 2021, 227, 111461. [Google Scholar] [CrossRef]
  23. Ahmad, A.; Aljuhni, A.; Arshid, U.; Elchalakani, M.; Abed, F. Prediction of columns with GFRP bars through Artificial Neural Network and ABAQUS. Structures 2022, 40, 247–255. [Google Scholar] [CrossRef]
  24. AlAjarmeh, O.; Manalo, A.; Benmokrane, B.; Schubel, P.; Zeng, X.; Ahmad, A.; Hassanli, R.; Sorbello, C.-D. Compression behavior of GFRP bars under elevated In-Service temperatures. Constr. Build. Mater. 2022, 314, 125675. [Google Scholar] [CrossRef]
  25. Tobbi, H.; Farghaly, A.S.; Benmokrane, B. Concrete columns reinforced longitudinally and transversally with glass fiber-reinforced polymer bars. ACI Struct. J. 2012, 109, 551–558. [Google Scholar]
  26. Raval, R.; Dave, U. Behavior of GFRP wrapped RC columns of different shapes. Procedia Eng. 2013, 51, 240–249. [Google Scholar] [CrossRef]
  27. Guo, Y.-C.; Gao, W.-Y.; Zeng, J.-J.; Duan, Z.-J.; Ni, X.-Y.; Peng, K.-D. Compressive behavior of FRP ring-confined concrete in circular columns: Effects of specimen size and a new design-oriented stress-strain model. Constr. Build. Mater. 2019, 201, 350–368. [Google Scholar] [CrossRef]
  28. Elmessalami, N.; El Refai, A.; Abed, F. Fiber-reinforced polymers bars for compression reinforcement: A promising alternative to steel bars. Constr. Build. Mater. 2019, 209, 725–737. [Google Scholar] [CrossRef]
  29. El Gamal, S.; Alshareedah, O. Experimental study on the performance of circular concrete columns reinforced with GFRP under axial load. In Proceedings of the International Conference on Civil Infrastructure and Construction, Doha, Qatar, 2–5 February 2020. [Google Scholar] [CrossRef]
  30. Lignola, G.P.; Nardone, F.; Prota, A.; De Luca, A.; Nanni, A. Analysis of RC hollow columns strengthened with GFRP. J. Compos. Constr. 2011, 15, 545–556. [Google Scholar] [CrossRef]
  31. Hadhood, A.; Mohamed, H.M.; Benmokrane, B. Strength of circular HSC columns reinforced internally with carbon-fiber-reinforced polymer bars under axial and eccentric loads. Constr. Build. Mater. 2017, 141, 366–378. [Google Scholar] [CrossRef]
  32. Liang, X.; Sritharan, S. Effects of confinement in square hollow concrete column sections. Eng. Struct. 2019, 191, 526–535. [Google Scholar] [CrossRef]
  33. Wayghan, A.R.T.; Mofid, M.; Ravandi, B.B.; Yazdi, S.M.Z. Increasing the contribution of gfrp bars on the compressive strength of concrete columns with circular cross section. Civ. Eng. J. 2019, 5, 1850–1862. [Google Scholar] [CrossRef]
  34. Al-Rubaye, M.; Manalo, A.; Alajarmeh, O.; Ferdous, W.; Lokuge, W.; Benmokrane, B.; Edoo, A. Flexural behaviour of concrete slabs reinforced with GFRP bars and hollow composite reinforcing systems. Compos. Struct. 2020, 236, 111836. [Google Scholar] [CrossRef]
  35. AlAjarmeh, O.S.; Manalo, A.C.; Benmokrane, B.; Vijay, P.V.; Ferdous, W.; Mendis, P. Novel testing and characterization of GFRP bars in compression. Constr. Build. Mater. 2019, 225, 1112–1126. [Google Scholar] [CrossRef]
  36. AlAjarmeh, O.S.; Manalo, A.C.; Benmokrane, B.; Karunasena, K.; Ferdous, W.; Mendis, P. Hollow concrete columns: Review of structural behavior and new designs using GFRP reinforcement. Eng. Struct. 2020, 203, 109829. [Google Scholar] [CrossRef]
  37. AlAjarmeh, O.S.; Manalo, A.C.; Benmokrane, B.; Karunasena, W.; Mendis, P. Effect of spiral spacing and concrete strength on behavior of GFRP-reinforced hollow concrete columns. J. Compos. Constr. 2020, 24, 04019054. [Google Scholar] [CrossRef]
  38. Raza, A.; Khan, Q.u.Z.; Ahmad, A. Numerical investigation of load-carrying capacity of GFRP-reinforced rectangular concrete members using CDP model in ABAQUS. Adv. Civ. Eng. 2019, 2019, 1745341. [Google Scholar] [CrossRef]
  39. Havlásek, P. Numerical modeling of axially compressed circular concrete columns. Eng. Struct. 2021, 227, 111445. [Google Scholar] [CrossRef]
  40. Bahrami, A.; Mahmoudi Kouhi, A. Compressive behaviour of circular, square, and rectangular concrete-filled steel tube stub columns. Civ. Eng. Arch. 2020, 8, 1119–1126. [Google Scholar] [CrossRef]
  41. He, K.; Chen, Y.; Yan, Y. Axial mechanical properties of concrete-filled GFRP tubular hollow composite columns. Compos. Struct. 2020, 243, 112174. [Google Scholar] [CrossRef]
  42. Rashid, S.M.P.; Bahrami, A. Structural performance of infilled steel–concrete composite thin-walled columns combined with FRP and CFRP: A comprehensive review. Materials 2023, 16, 1564. [Google Scholar] [CrossRef]
  43. ASTM C143/C143M; Standard Test Method for Slump of Hydraulic-Cement Concrete. ASTM: West Conshohocken, PA, USA, 2020.
  44. ASTM C39/C39M; Standard Test Method for Compressive Strength of Cylindrical Concrete Specimens. ASTM: West Conshohocken, PA, USA, 2018.
  45. AS 1012.9; Methods of Testing Concrete, Method 9: Compressive Strength Tests—Concrete, Mortar and Grout Specimens. Standards Australia: Sydney, Australia, 2014.
  46. Abaqus. ABAQUS 6.14 Documentation: Simulia, Dassault Systemes, RI, USA. 2014. Available online: https://130.149.89.49:2080/v6.14/ (accessed on 25 February 2023).
  47. Amiri, G.G.; Jahromi, A.J.; Mohebi, B. Effect of transverse reinforcing on circular columns confined with FRP. In Challenges, Opportunities and Solutions in Structural Engineering and Construction; CRC Press: Las Vegas, NV, USA, 2009; pp. 251–256. [Google Scholar]
  48. Afifi, M.Z.; Mohamed, H.M.; Benmokrane, B. Strength and axial behavior of circular concrete columns reinforced with CFRP bars and spirals. J. Compos. Constr. 2014, 18, 04013035. [Google Scholar] [CrossRef]
  49. Tobbi, H.; Farghaly, A.S.; Benmokrane, B. Strength model for concrete columns reinforced with fiber-reinforced polymer bars and ties. ACI Struct. J. 2014, 111, 789–798. [Google Scholar] [CrossRef]
Figure 1. GFRP reinforcements; (a) transverse spirals, (b) longitudinal bars, and (c) GFRP cage.
Buildings 13 01056 g001
Figure 2. Cross sections of column specimens.
Buildings 13 01056 g002
Figure 3. Detailing of specimens.
Buildings 13 01056 g003
Figure 4. CDP model for concrete (stress versus strain).
Buildings 13 01056 g004
Figure 5. Modeling; (a) individual parts and (b) assembled parts.
Buildings 13 01056 g005aBuildings 13 01056 g005b
Figure 6. Flow chart of FEA calibration and parametric study.
Buildings 13 01056 g006
Figure 7. Calibration of control specimen (HG-65) for viscosity parameter.
Buildings 13 01056 g007
Figure 8. Calibration of control specimen (HG-65) for dilation angle.
Buildings 13 01056 g008
Figure 9. Calibration of control specimen (HG-65) for shape factor.
Buildings 13 01056 g009
Figure 10. Calibration of control specimen (HG-65) for mesh size.
Buildings 13 01056 g010
Figure 11. Calibration of control specimen (HG-65) for mesh element type.
Buildings 13 01056 g011
Figure 12. Calibration of control specimen (HG-65) for properties of rubber pads.
Buildings 13 01056 g012
Figure 13. Axial load–axial deformation curves of control specimen (HG-65).
Buildings 13 01056 g013
Figure 14. Ultimate axial load-carrying capacities.
Buildings 13 01056 g014
Figure 15. Deformations at ultimate axial load-carrying capacities.
Buildings 13 01056 g015
Figure 16. Axial load–axial deformation curves of columns.
Buildings 13 01056 g016
Figure 17. Ductility factor.
Buildings 13 01056 g017
Figure 18. Failure modes of columns and their numerical representation.
Buildings 13 01056 g018
Figure 19. Effect of concrete compressive strength.
Buildings 13 01056 g019
Figure 20. Effect of provision of longitudinal and transverse reinforcements.
Buildings 13 01056 g020
Figure 21. Effect of longitudinal reinforcement ratio.
Buildings 13 01056 g021
Figure 22. Effect of pitch of spiral reinforcement.
Buildings 13 01056 g022
Table 1. Characteristics of GFRP and steel reinforcements.
Type of ReinforcementNominal Diameter (mm)Area (mm2)Tensile Strength (MPa)Elastic Modulus (GPa)Ultimate Strain (%)
GFRP spiral No. 3 9.570.8131562.52.3
GFRP bar No. 5 15.9198.51237602.1
Steel bar No. 5 16200.965002002.1
Table 2. Size and reinforcement details of tested column specimens.
SpecimenInner Diameter (mm)Inner-to-Outer Diameter Ratio (i/o)Reinforcement Ratio (%)Volumetric Ratio (%)
SG-00002.411.49
HG-40400.162.471.56
HG-65650.262.591.69
HG-90900.362.781.92
HS-65650.262.591.60
Table 3. Geometric and material properties.
ParameterConcreteGFRPSteelRubber Pad
Density (ton/mm3)2.4 × 10−92.1 × 10−97.58 × 10−91.25 × 10−9
Poisson’s ratio0.20.250.30.49
Elastic modulus (N/mm2)24,43560,000200,0006000
Concrete cover of specimen (mm)-2040-
Table 4. Ultimate axial load-carrying capacities and corresponding deformations, FEA versus experiment (EXP).
Sr. No.SpecimenUltimate Axial Load-Carrying Capacity (kN)Deformation at Ultimate Axial-Load Carrying Capacity (mm)
FEAEXPPercentage
Difference
FEAEXPPercentage
Difference
1SG-01577.131582.480.349.8410.274.17
2HG-401494.801403.51−6.59.419.26−1.64
3HG-651580.821561.91−1.219.789.33−4.8
4HG-901395.911410.141.019.079.302.41
5HS-651684.641409.07−19.569.5611.6517.95
Table 5. Comparison of ultimate axial load-carrying capacity in percentage.
Column SpecimenPercentage Difference (Equation vs. Exp)Percentage Difference (Equation vs. FEA)
Equation (8)Equation (9)Equation (10)Equation (8)Equation (9)Equation (10)
SG-028.783.793.7929.223.473.46
HG-4042.36−5.63−5.6342.49−5.72−5.73
HG-6523.739.289.2822.2510.3610.36
HG-9030.186.376.3731.515.425.42
Average31.2633.4533.45331.3683.3833.378
Disclaimer/Publisher’s Note: The statements, opinions and data contained in all publications are solely those of the individual author(s) and contributor(s) and not of MDPI and/or the editor(s). MDPI and/or the editor(s) disclaim responsibility for any injury to people or property resulting from any ideas, methods, instructions or products referred to in the content.

