Article

Influence of Superabsorbent Polymer in Self-Compacting Mortar

by
Michel Henry Bacelar de Souza
1,
Lucas Ramon Roque Silva
1,
Vander Alkmin dos Santos Ribeiro
2,*,
Paulo César Gonçalves
2,
Mirian de Lourdes Noronha Motta Melo
1,
Carlos Eduardo Marmorato Gomes
3 and
Valquíria Claret dos Santos
2
1
Institute of Mechanical Engineering, Unifei-Federal University of Itajubá, Av. BPS, 1303, Itajubá 37500-903, MG, Brazil
2
Institute of Natural Resources, Federal University of Itajubá (UNIFEI), Itajubá 37500-903, MG, Brazil
3
Department of Construction, State University of Campinas (UNICAMP), Campinas 13083-970, SP, Brazil
*
Author to whom correspondence should be addressed.
Buildings 2023, 13(7), 1640; https://doi.org/10.3390/buildings13071640
Submission received: 29 May 2023 / Revised: 22 June 2023 / Accepted: 26 June 2023 / Published: 28 June 2023
(This article belongs to the Special Issue Advances in Cement Composite Materials)

Abstract

:
Self-compacting concrete (SCC) is an innovative type of concrete that does not require vibration for compaction; however, it needs attention in relation to the control of thermally generated cracks, due to the hydration heat generated mainly during the curing process in pieces with large concrete volume. In this study we investigated the addition of Superabsorbent Polymers (SAP) as internal curing elements in self-compacting mortar (SCM), as well as its thermal and mechanical characteristics, looking to obtain the optimal proportion of materials in a way that is useful as the basis of self-compacting concrete use, focusing on large volume structures. This work stands out for studying an alternative for shrinkage control, in an unconventional cementitious composite, highlighting the thermal analysis of the mixture. In the experimental program, laboratory trials were conducted using self-compacting mortar with the addition of 0%, 0.1%, and 0.2% of SAP either for CPII-E-32 and CPV-ARI and with samples undergoing both dry and submerged curing. Among the results obtained, the reduction of variation in temperature in samples with added SAP stand out, and it is possible to presume it as being a viable way of mitigating the temperature spikes in large volume concrete parts. By contrast, the compression and tensile tests indicated a reduced strength, except in the tensile trial on the CPII-E-32, which the addition of SAP resulted in an increase in strength.

1. Introduction

The construction industry went through adaptations and updates in the last decades, presenting a growing technological advance aimed at the sector, either as the introduction of new material or even new building techniques. These factors allow for a better workability in a shorter executing time, which in many cases results in saving in labor and costs [1].
The self-compacting concrete (SCC) is an example of that, being an innovative type of concrete that does not require vibration to compact. With concrete being the most used material in building around the world, the evolution of this cement composite significantly impacted the development of new engineering projects [2].
Several research studies present promising materials to be utilized to control such harmful events; some of these materials, which are currently being studied, are known as superabsorbent polymers (SAP) [3]. It is a material that is becoming a potential point of technological innovation in cement internal curing and hydration. These are materials with a high capacity of water absorption, acting as an internal reservoir to not only improve the workability, but also reduce the water/cement ratio [4].
In the last two decades, there was an increase in the number of studies proposing the utilization of SAP residues in distinct types of cement blends, analyzing the way that they can positively influence the limitation of the effects of retraction, help the internal curing process, and improve the workability [5]. Highlights of such studies led to the belief that the pathological manifestations commonly found in these elements will be better countered. Still, there are few studies that refer to the influence of adding SAP in other cement-based materials, such as self-compacting concrete [6].
Studies that relate the development of concrete as a technology alongside with environmental solutions, are of extreme relevance for the ecological and responsible development of the building industry. These materials that are among the most used in the sector are essential in most ventures.
To ensure the development of the physical characteristics of concrete or hardened mortar, such as mechanical strength and durability, it is necessary to provide adequate conditions of temperature and humidity to material, especially in the fresh and early-age stages. This curing process aims to optimize the hydration of the cement and reduce its retraction [7].
Big concrete structures, such as dams and foundation blocks, can be susceptible to cracks, particularly in the early-age of the Portland cement due to the thermic tensions and the induction of autogenous contraction [8].
The making of high-volume concrete parts is a challenge to technologists, as these present significant increases in temperature that can result in damaging effects to the structure [9]. In these structures, the heat is generated by the hydration reaction, particularly by the cement reaction, while the temperature increase happens because the heat generation rate is superior to the dissipation rate to the environment due to the large dimensions of the parts and the thermic characteristics of the concrete [10].
According to [11], the main hydration reaction, which generates the largest amount of heat, usually happens in the initial hours of the mixing of the cement material with water, usually in the first 72 h. During the hydration phase and the concrete hardening, the structural element also exchanges heat with the environment, to the point which its internal temperature tends to equalize with the ambient temperature beginning by the structure external surface [9]. In this stage, the risk of cracking is increased due to the element of the concrete that was compressed and expanded in the early-age now contracting, often unevenly, creating tension to traction gradients, at the same time that there is little tensile strength to endure the demand [12]. The overdone thermic evolution can lead to a temperature range that causes destructive fissures in dams.
The use of SAP with self-compacting cement and mortar is underexplored; some studies have proven that it has advantages in the utilization of conventional cement composites, being of significant help to counter retractions in the curing process [13]. In [14], SAP in two diameters (600 μm and 800 μm) was added to self-compacting cement pastes, where increases in compressive strength of 35.2% and 34.3%, respectively, were obtained. The works of [15,16,17,18] are some examples of tests of the efficiency of SAPs as an internal curing agent to mitigate autogenous shrinkage in mortars. In parallel, studies such as [19,20] showed the addition of residues of other types of polymers in cementitious composites that also obtained gains in compressive strength.
The aim of this study is to analyze the addition of superabsorbent polymers (SAP) as the element of internal curing in self-compacting mortar (SCM), as well as its mechanical and thermic characteristics, and its usability in large volume structure, bearing in mind the production of self-compacting concrete. The SCM mix was made using type II and type V cement, with one reference mix and two other mixes with different percentages of SAP for each type of cement. The influence of SAP is checked in the submerged and dry curing process, the thermic behavior, and the mechanical and physical characteristics of the SCM with SAP in the fresh and hardened states.
This work stands out for studying an alternative to the control of retraction, analyzing the heat of hydration in SCM with the addition of SAP as internal curing agent, which may ensure the longer lifespan and reduce the probability of fissures. To facilitate satisfactory results in self-compacting concretes, the dosing of mortar is performed. In the mortar study, it is possible to determine if the material presents excessive fluidity, low viscosity, separation, and exudation, and by dosing the mortar, the material ratio is designed in a way that does not reduce the SCC workability.

2. Materials and Methods

The methodological procedure of this article consists in the creation of reference self-compacting mortar mixes, using CPII and CPV without the addition of SAP, adjusted mixes of SCM with added SAP, performing the tests in the fresh state, waiting for the curing time (dry and wet), and performing the test in the hardened state. The two types of cement belong to a class with high initial resistance; therefore, they need greater attention to prevent the appearance of shrinkage of thermal origin. According to [21,22], the proportion of SAP additions that have shown favorable results over the years ranges from 0.1% to 1%. However, as this study proposes the use of SAP in conjunction with a non-conventional cementitious compound, lower percentages of the polymer (0.1% and 0.2%) were chosen. These steps are shown in Figure 1, through a flowchart.
The type II Portland cement used, type CPII-F-32, was made by Grupo Votorantim Cimentos, an ITAU company. The properties and characteristics of the cement used in this article are presented in Table 1, and were provided by the manufacturer’s website.
The high strength type V Portland cement used, type CPV-ARI Structure, was made by Group Intercement, a CAUÊ company. The properties and characteristics of the cement used in this article are shown in Table 2, and were provided by the manufacturer’s website.
The activated silica used in the mix as the aggregate was provided by the company Tecnosil. It is a fine pulverized powder originated from the fabrication of metallic silicon or ferrosilicon. The high content of SiO2 in the amorphous form (non-crystalline), combined with the high grit, provides a high reactivity with the products resulting from the cement hydration, ensuring the best performance in concrete and mortar. The activated silica has spheric, vitreous particles, with the average diameter smaller than one μm and a specific surface area between 15 and 25 m2/kg, providing a high specific surface area and low apparent specific mass.
The sand used is from the city of Itajubá-MG, and it was split in an exceptionally fine portion (passing through the 600 μm sieve) and another portion (trapped in the 600 μm sieve and of maximum diameter of 4.8 mm). This separation was made to help the final dosing of the mortar mixes. As mixing water, the water from the public utilities of the city of Itajubá-MG was used.
The superplasticizer additive (SPA) used in the mix was the SILICON NS HIGH 210, manufactured and provided by the company Tecnsoil. According to the company, this SPA is a latest generation polycarboxylate-based organic additive that provides a high dispersion power, high workability, reduces water, and increases mechanical strength. The potassium-based superabsorbent polymer is a polymer developed by the Instituto Granado de Tecnologia da Poliacrilonitrila (IGTPAN) and its main characteristic is retaining water. The SAP-k reticulate has the capacity to absorb 300 times its weight in water. (Figure 2).
When in contact with water, it transforms into a gelatinous substance known as HIDROGEL. After releasing all its water, the SAP-k reverts to its original state (granulate), with the average active capacity of three to five years, able to absorb new irrigation water or rainwater without changing its structure [25]. Table 3 shows the characteristics of the SAP-k used in the tests.
The SAP-k provided by the IGTPAN is obtained through the chemical recycling of polyacrylonitrile, commonly used in textile applications due to characteristics similar to wool. It has special characteristics, such as low density, thermic stability, high strength and elasticity modulus, and UV degradation stability.
To achieve the desired SCM reference mix (CPII-F32 and CPV-ARI) and perform the addition of Superabsorbent Polymer, this research used as a base the mix developed by Silva, 2019, which used the dosing method proposed by Tutikian, 2007 [26], and part of the practical and experimental method of Helene and Terzian, 1992 [27].
The experimental program is divided into two parts, the first one being the tuning of the mix proposed by Silva, 2019 [28], to obtain the refence mix, making the proper adjustments to be used in the study. Starting with an a/c ratio of 0.5 and with 1.5% of superplasticizer by cement weight, until achieving the desired consistency.
The second part, with the possession of the reference mix, the mix with added SAP was developed, observing the behavior of the mortar, and making the necessary correction so that they continue with the self-compacting characteristics.
In the designing of the mix, the dry aggregate (cement, activated silica, fine sand, coarse sand, and SAP) was added first and mixed. Next, the water was added followed by the addition of SPA. Following that, the proper additions were made to achieve the properties. In this manner, the mixes presented in Table 4 were achieved.
After this stage, the fresh state tests were made, followed by the molding of the testing samples. The demolding was made 24 h later and from that, half the test samples were submerged in potable water for curing, and the other half were separated for dry curing, both for a period of 28 days. Therefore, there was a total of 12 (twelve) mixes, differentiated by the percentage of SAP (0; 0.1; 0.2), curing type (dry or submerged), and cement type (CPII-F-32 and CPV-ARI).
After this stage, the fresh state tests were made, followed by the molding of the testing samples. The demolding was made 24 h later and from that, half the test samples were submerged in potable water for curing and the other half were separated for dry curing, both for a period of 28 days. Therefore, there was a total of 12 (twelve) mixes, differentiated by the percentage of SAP (0; 0.1; 0.2), curing type (dry or submerged), and cement type (CPII-F-32 and CPV-ARI).

2.1. Fresh State Testing

The fresh state test was the first to be made; it was used to ensure and prove the self-compacting performance of the mortar, show the values of specific mass of the recently fill testing bodies, and obtain the thermic data in the beginning of the curing of the mortar. Table 5 shows the quantity of testing samples used in each test, the percentage of SAP and cement type, as well as the method used in making.
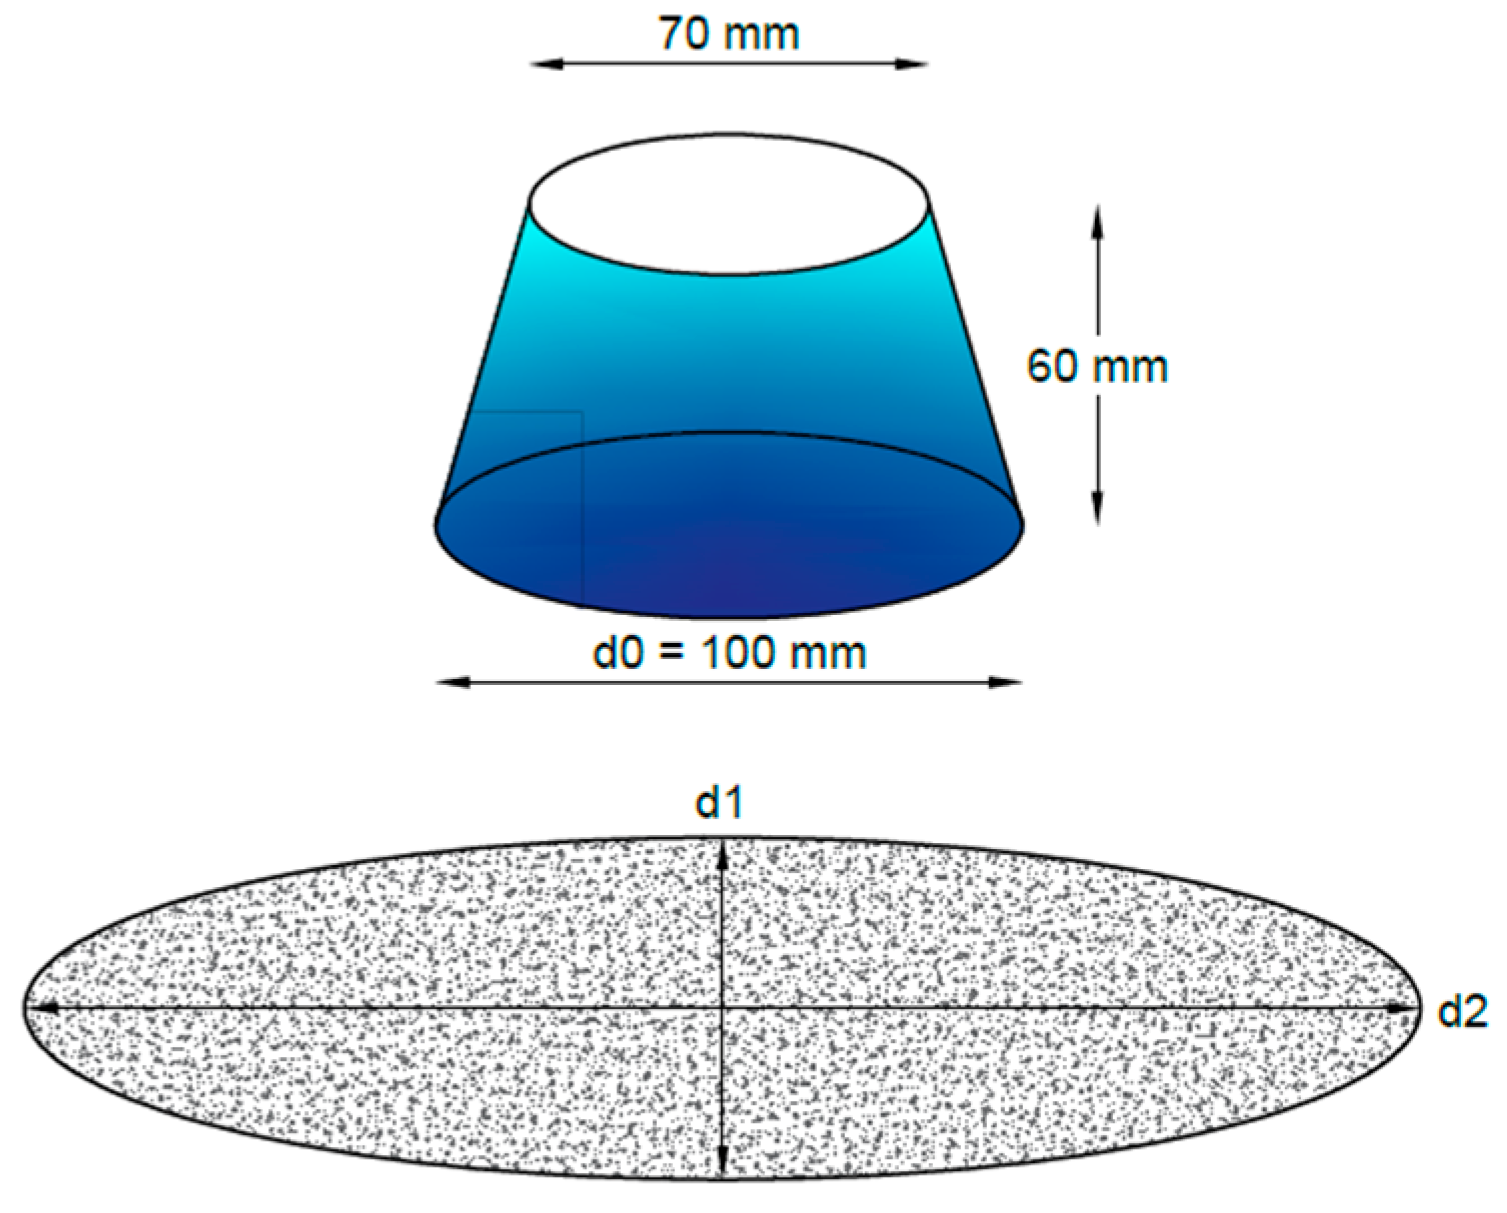
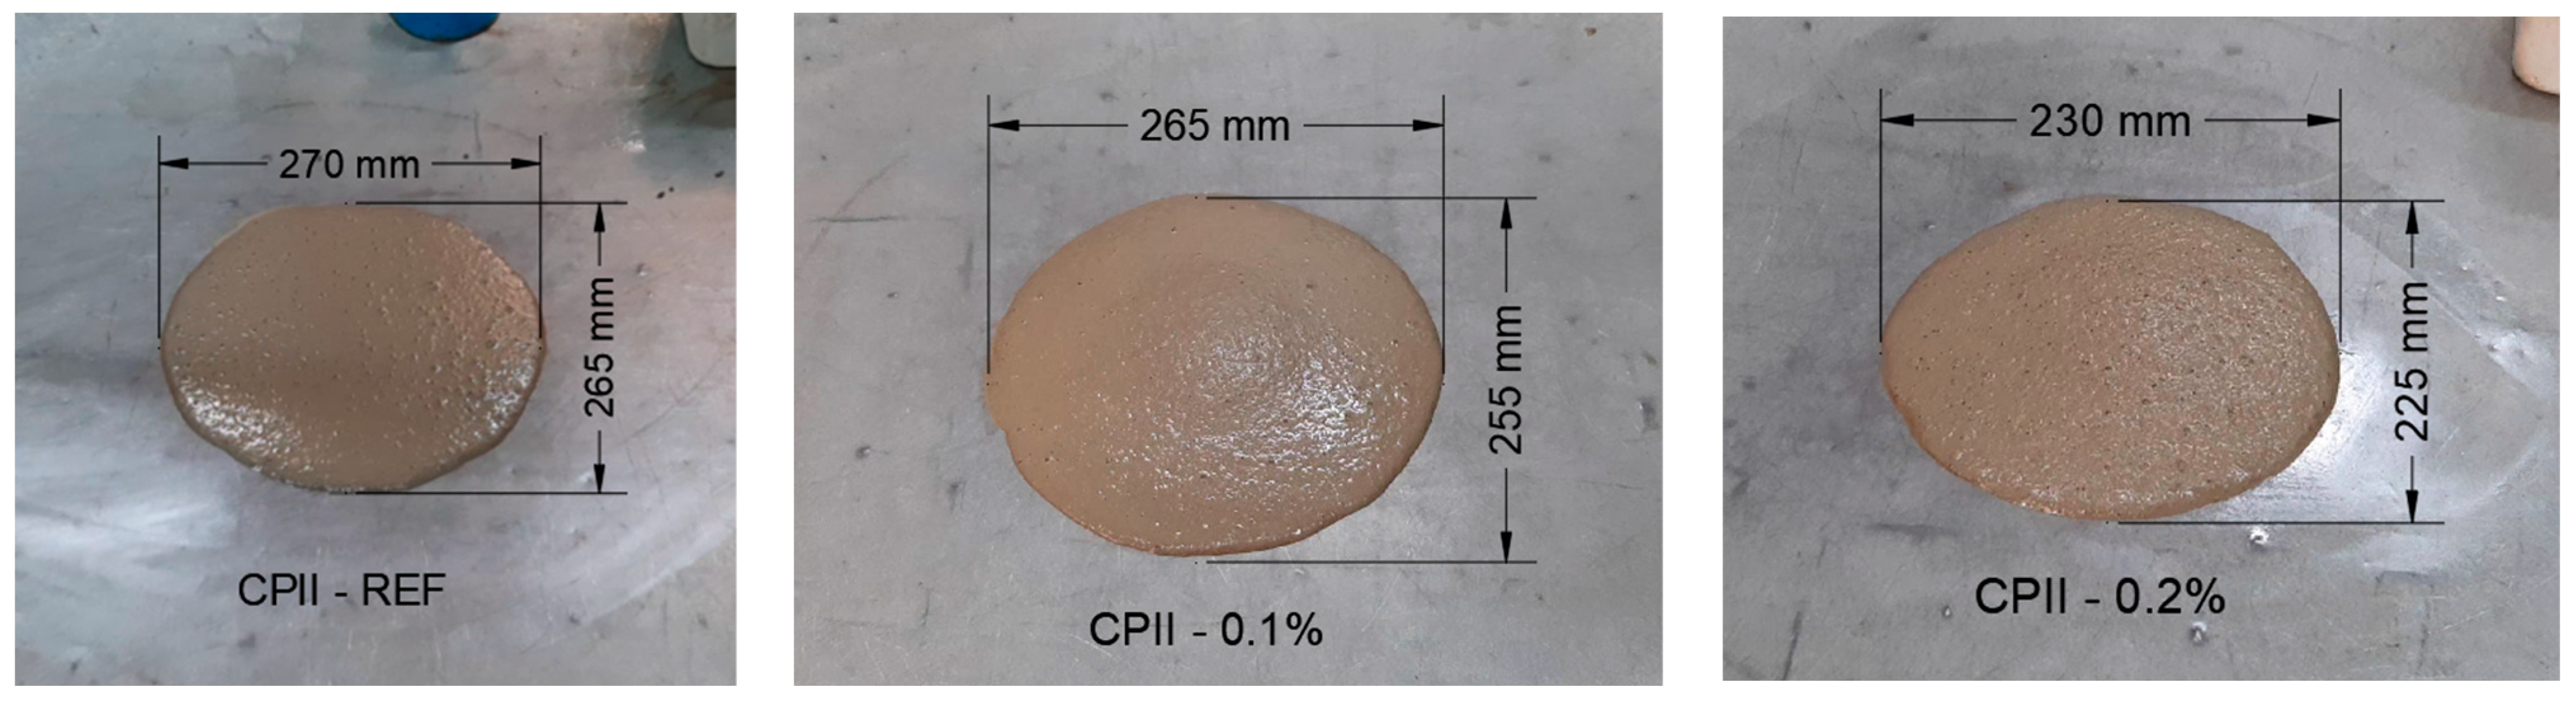
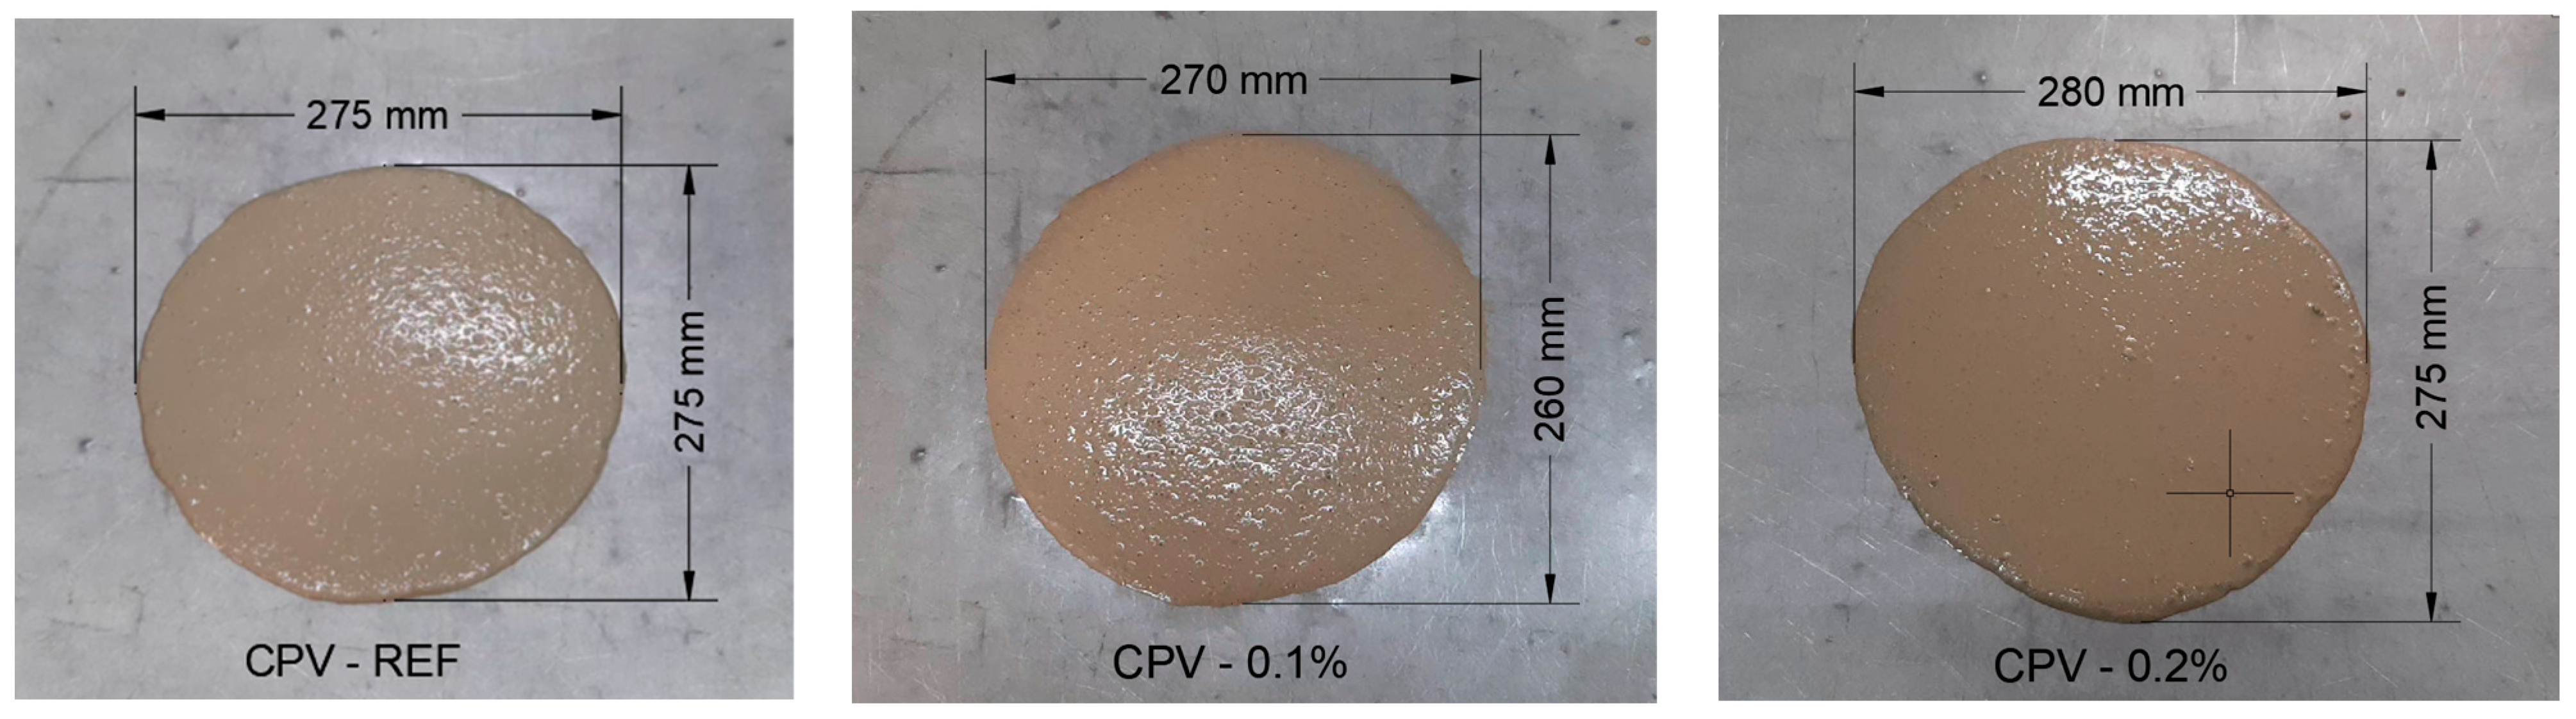
To obtain the flow diameter, the consistency index test was performed. This procedure enables the analysis of the mortar’s flow capacity under the influence of its own weight and its filling capability. The test consists of filling a cone shape (Figure 3) without compacting, that is vertically suspended, and after the mortar ceases movement, two orthogonal diameters are measured.
Applying the dosing method proposed by Okamura and Ouchi, 2003 [2], it is possible to calculate the relative spread index for mortar (Gm) using the two perpendicular measurements obtained in the mortar slump test.
It was used as optimal value Gm = 5, using as limits the values from 3 to 7 that equate to a slump diameter of 200 to 280.
To determine the mortar dosing according to the Okamura and Ouchi, 2003 [2] method, V-funnel testing of the rectangular section was performed. The test consists in measuring the time necessary for the mortar to flow through the funnel resisting separation. The funnel was filled without compacting the mortar, and the inferior hatch was open. With the help of a stopwatch, the time mortar flow time was measured until little was visible through the top part of the equipment. Figure 4 shows the dimensions of the V-funnel used to measure the relative flow time of mortar.
After timing the flow time in the V-funnel, it is possible to determine the relative flow time of mortar (Rm) using the dosing method proposed by Okamura and Ouchi, 1999 [29].
According to Takada et al., 1998 [30], mortar with Gm values of 5 and Rm values of 1 are classified as acceptable to obtain concrete with self-compacting characteristics. Edamatsu et al., 1999 [31] obtained Gm values between 3 and 7, corresponding to the mortar slump diameter from 280 mm to 283 mm, and the Rm value between 1 and 2, corresponding to the flow time of 5 to 10 s. Domone and Jin, 1999 [32] suggest that Gm higher than 8, equivalent to slump diameters bigger than 300 mm and Rm values of 1 to 5 equate to flow time (t) of 2 to 10 s. A high Gm value indicates a higher deformability, and a lower Rm value indicates a higher viscosity.
To measure the heat of hydration in the mortar, mixtures used a semi-adiabatic calorimeter, according to the NBR 120.006 1990 Cement—Determining the Heat of Hydration using the Langavant Bottle Method [33].
To perform this test, a thermal data acquisition board made by National Instruments, model cDAQ-9171 was used. A Type-K Thermocouple was used in conjunction to receive the signal emitted by the board, using the software LABTRIX version XP1502.
The analysis time for each of the mixes was two hours, starting from the time the sample finished confection.

2.2. Hardened State Testing

The tests made were axial compression strength, tensile strength by diametric compression, void ratio, specific mass, and dynamic elasticity modulus. The number of test samples used and the standard or method used are shown in Table 6.
The measurement of the mortar axial compression strength was made using a INSTRON 8001 machine, with the cylindrical test samples molded to 50 mm in diameter and 100 mm in height. The test samples must be kept in the wet curing process until the time of testing. Before the execution of the test, the base of the test samples must be prepared. Next, the load of (0.45 ± 0.15) MPa/s is applied until the rupture of the test sample (ABNT NBR 5739:2007) [34].
According to NBR 7222:2011 [35], through tensile testing by axial compression, the results of tensile strength are indirectly obtained. In the test, the test samples are also molded in a cylinder of 50 mm in diameter and 100 mm in height. The test consists in positioning the test samples in the compression machine in the horizontal position, supported by two wooden planks. The load is continuously applied, constantly increasing the tensile tension, at a rate of 0.05 MPa/s until the rupture of the test sample.
According to the NBR 9778:2005 [36] standard, the Water absorption, void ratio, and specific mass tests were carried out at the Universidade Federal de Itajubá (UNIFEI). The mass values were collected using a SHIMASZU scale, model UX6200H, with a precision of 0.01 g. Three test samples were made for each of the self-compacting mixes that were evaluated at the 28th day. For the testing, the test sample of 150 cm3 are placed in the heating chamber at a temperature of (105 ± 5) °C for a period of 72 h, later recording the mass in the dry state. To measure the submerged mass, the samples must remain underwater at a temperature of (23 ± 5) for 72 h, weighing hydrostatically. The samples are removed from the water next and dried with a damp cloth to measure the samples saturated mass.
The dynamic elasticity modulus test was performed at the Materials Lab for Civil Engineering of the Universidade Federal de Itajubá (UNIFEI). The equipment Sonelastic was used to perform the impulse excitation technique (IET) in the following setting:
  • Sonelastic software version 3.0;
  • Adjustable bar support;
  • SA-BC cylinders;
  • Directional acoustic receiver CA-DP;
  • Manual pulsator.
Based in the ASTM E1876 2015 [37], the test samples were subjected to the Impulse Excitation Technique (IET). Initially the length, diameter, and mass of the test samples were recorded, then they were supported by an adjustable support. Next, using a manual pulsator, each test sample was subjected to light knocks causing acoustic responses that were detected by an acoustic receiver. These acoustic responses were processed by the Sonelastic software version 3.0 to calculate the elasticity modulus and the dampening of each test sample.
Three test samples were made for each of the self-compacting mixes that were evaluated at the 28th day. Figure 5 respectively shows the equipment during the execution of the test and the Software Sonelastic version 3.0 interface.

3. Results

This section may be divided by subheadings. It should provide a concise and precise description of the experimental results, their interpretation, as well as the experimental conclusions that can be drawn.

3.1. Fresh State Properties

The results of the fresh state SCM are presented in this section. For a better organization of the analysis, this section is subdivided.

3.1.1. Slump Flow Test

The results of the slump flow test of the reference SCM and the samples with 0.1% and 0.2% SAP are shown in Table 7 and Table 8, performed according to the Okamura and Ouchi, 2003 [2] method, and using the parameters mentioned in this article methodology. Based in the parameters presented by the author previously mentioned in the Materials and Methods chapter, it was used as optimal value Gm = 5, and limiting values of 3 and 7 that amount to slump diameters of 200 to 280.
Using the results presented in Table 7 and Table 8, it is possible to assert that the addition of the superabsorbent polymer alters the slump behavior of the SCM in the fresh state. It can be observed that all the mortar mixes are within the limits to be considered self-compacting, however this was only possible due to the adjustments made to the mixes so that they had the desired consistency. During the testing, it was observed that the SAP, which has as a characteristic to absorb massive quantities of liquid, “sucked” part of the available water volume in the mix, therefore reducing the flow of the test samples, and stopped them from reaching the minimal slump diameter (200 mm). It is important to emphasize that the mortar using CPV-ARI presented a larger slump diameter than the CPII-F-32 ones, as expected due to it being a type of cement more commonly used in self-compacting cement composites, and which allows for a better flow in the mix in the fresh state.
These results converge with the ones of Schröfl et al., 2012 [15], in which the authors investigated the absorption capacity of SAP by adding in the mixes different amounts and types of SAP. Once the SAP absorbs the water in the mixture, it is important to make up for this (lost) water with the addition of extra water to ensure the workability required by the mixture in the fresh state.
In Figure 6 and Figure 7, the slump flow tests of the mixes using CPII-F-32 and CPV-ARI are shown, respectively. It is possible to notice by the images that all the mixes, after the already mentioned adjustments, present a good flow and uniformity, meeting the requirements to be considered as self-compacting, and without presenting exudation or separation.

3.1.2. Apparent Plastic Viscosity—V-Funnel

The results of the plastic apparent plastic viscosity of mortar made using CPII-F-32 and CPV-ARI are, respectively, shown in Table 9 and Table 10, and were performed according to the Okamura and Ouchi, 2003 [2] method, using a minimal Rm value of 1 and maximum of 2, that corresponds to a flow time inferior to 10 s.
According to Table 9 and Table 10, it is possible to observe that all the mixes are within the limitations of the proposed methodology (1 < Rm < 2), with a flow time lower than 10 s. This was also possible due to the adjustments made in the slump flow test phase, which allowed the mixes to achieve adequate apparent plastic viscosity. As expected, the mortar made using CPV-ARI presented a faster flow time than the ones using CPII-F, due to the cement type being more adequate to use in self-compacting composites, as it offers a better flow in the fresh state.

3.1.3. Heat of Hydration

The heat of hydration testing was performed according to the NBR 12.006 1990 [33], and an adaptation was made to simulate the conditions inside a semi-adiabatic chamber.
The results are described in Table 11 and Table 12, explaining the values detected by each of the thermocouples, for the CPII-F-32 mixes (Odd mixes: 1; 3; 5; 7; 8 and 11), as well for the CPV-ARI mixes (Even mixes: 2; 4; 6; 8; 10 and 12). At the end of the tables, a comparison is made to find out the variation of temperature during the experiment, showing the delta between the initial and final temperature.
Table 13 and Table 14 show the average temperature detected by the Thermocouples, in which it is possible to observe a reduction in its variation as the SAP addition increases in the CPII-F-32 and the CPV-ARI.
This reduction can be better seen in Figure 8, noting that the mixes with the SAP addition had a reduction in the heat peak. In the CPV, there was also a reduction in temperature in the first minutes. The controlling of the heat of hydration in the beginning of the curing process is especially important because it avoids the self-drying phenomenon in which the water is consumed by this heat, reducing the available quantity for the hydration of the cement base, which may cause retraction fissures [38].
These results overlap with the ones presented by Kumm, 2009 [39], in which the temperature variation, and the relative humidity of the cement paste were measured. The mixes with added SAP showed lower temperature peaks than the reference mixes, which favor the internal curing process of the pastes by controlling the heat of hydration.

3.2. Hardened State Properties

In this stage of the experimental program, the analysis of the hardened concrete properties was made. To this end, the following tests were made: axial compression strength, tensile strength by diametric compression, void ratio, specific mass, and dynamic elasticity modulus.

3.2.1. Axial Compression Strength Testing

Table 15 presents the results from the axial compression strength testing using the type II cement mixes. For these tests, three test samples were used for each of the mixes, identified in the Tables as samples 1, 2, and 3.
Observing Table 15 and Figure 9, it is noticeable that the addition of SAP influenced the compression strength of the mixes using CPII-F-32 cement, although with distinct behavior in the dry and submerged curing. For the samples that were cured underwater, the SAP did not significantly compromise, reducing 3.8% to 0.1% of SAP, and 5.15% to 0.2% of SAP in relation to the reference mix. In the dry cured samples, the SAP reduced its strength by 21.42% for the samples with 0.1% of SAP.
For the 0.2% SAP samples, there was an 10.97% increase in strength. It is known that the increase in porosity results in strength losses and, as seen, that is the result of adding SAP. However, the properties and advantages of SAP allow for a better hydration of the cement base, and justify the low reduction of strength in the submerged samples and the strength increase in the dry cured 0.2% SAP samples.
Table 16 presents the results of the axial compression strength testing in the mixes produced with type V cement. For these tests, three test samples were used for each of the mixes, identified in the Tables as samples 1, 2, and 3.
Observing Table 16 and Figure 10, it is noticeable that the addition of SAP influenced the compression strength of the mixes using CPV-ARI cement. Different from the samples using CPII-F-32 cement, in the type V cement, there was a substantial reduction in strength in the mixes with added SAP. The SAP samples cured underwater had a substantial reduction in strength, lowering by 39.41% for the 0.1% of SAP, and 36.68% for the 0.2% of SAP in comparison to the reference mix. In the dry cured samples, the 0.1% SAP mix reduced the strength by 40.25%, and the 0.2% SAP mix reduced the strength by 36.33%.
The general overview indicates that the obtained results point to a reduction in compression strength in the samples with added SAP (0.1% and 0.2%); however, the test samples with 0.2% added SAP present themselves as better than the ones with 0.1% addition, suggesting a potential ideal dosage for the mix.
These results support what is presented in the work of Muthalvan et al., 2021 [40], in which the cement mortar samples with a higher dosage of SAP present better compression strength results than the ones with a lower content. To Suarez, 2015 [41], the content that presented the best results in compression strength was the 0.2% by mass of cement. In its work, it was also stated that the reduction in compression strength with the use of SAP can be attributed to effects caused by the SAP in the hydration of the cement. The polymer expands when in contact with water. In the hydration phase, the water needed for the internal cure is pulled from the polymer, which returns to its original size and leaves voids in the structure.
According to Schröfl et al., 2012 [42], when SAP particulates are used in the mix in cement-based materials, several voids are formed, which can affect the material strength in a negative way. In articles by Jensen and Hensen, 2002 [43] and Pereira and Matos, 2011 [44], reduced compression strength of the samples containing superabsorbent polymers was found.

3.2.2. Tensile Strength by Diametric Compression Testing

Table 17 presents the results of the tensile strength by diametric compression test. For these tests, three test samples were used for each of the mixes, identified in the Tables as samples 1, 2, and 3.
Observing Table 17 and Figure 11, it is possible to notice that the addition of SAP influenced the tensile strength of the CPII-F-32 cement mix. For the samples cured underwater, the SAP provided a 21.36% increase in 0.1% mixes, and 21.69% in 0.2% mixes, compared to the reference mix. In the dry cured samples, the increment was significant, increasing the tensile strength by 21.43% in 0.1% mixes, and in the 0.2% mix, a 70.83% increase in strength.
Both the submerged samples and dry cured samples, with a 0.2 percent of SAP, show increased values, proving that this polymer content in the mix is adequate to this end.
Table 18 presents the results of the tensile strength by diametric compression test of the mixes using type V cement. For these tests, three test samples were used for each of the mixes, identified in the Tables as samples 1, 2, and 3.
Observing Table 18 and Figure 12, it is possible to observe that the addition of SAP influenced the tensile strength of the CPV-ARI cement mix, but differently from the CPII-F-32. For the samples cured underwater, the samples with SAP had the strength reduced by 17.62% for 0.1% SAP, and 16.87% for 0.2% SAP, compared to the reference mix. In the dry cured samples, the SAP reduced the strength by 27.63% in the 0.2% SAP samples, and for the 0.2% SAP samples, there was a 31.57% reduction in strength.
In conclusion, the results from the test point to a reduction in tensile strength in CPV-ARI testing samples with added SAP (0.1 and 0.2%) compared to the reference mix. However, the CPII-F-32 mix with added SAP presented an improvement in tensile strength, both in the submerged samples and dry cured ones.
Still, it is important to highlight that samples with a higher content of SAP, namely the 0.2%, presented better results in comparison to the lower content ones, as is the case for CPV-ARI mixes or when compared to the reference mix, as is the case for the CPII-F-32.
The results using CPV-ARI support the ones presented by Suarez, 2015 [41], in which a reduction in tensile strength was observed with the addition of the superabsorbent polymer in micro concretes if compared to the refence mix; however, even increasing the SAP content, large reductions in tensile strength were not observed.

3.2.3. Water Absorption, Void Ratio, and Specific Mass Testing

Table 19 shows the results of the real specific mass tests, Table 20 shows the void ratio, and Table 21 shows the water absorption of the self-condensing mortar using CPII-F-32 cement, performed according to ABNT NBR 9778:2009. For these tests, three test samples were used for each of the mixes, identified in the Tables as samples 1, 2, and 3.
For the mortar specific mass test in the hardened state, it is possible to notice a decrease in the samples with added SAP. For the 0.1% and 0.2% SAP samples that were cured underwater, the average reductions were 4.84% and 3.96%, respectively. The dry cured samples increased by 0.43% in the 0.1% samples, and reduced by 5.15% in the 0.2% samples.
Mechtcherine et al., 2009 [45] performed tests to determine the porosity and pores size distribution in high strength concrete. Different tests were made, and for all the samples considered for the test, the authors observed an increase in porosity of the concrete samples with SAP.
Regarding the void ratio, it is possible to observe in Table 20 that the addition of SAP in the mix results in variance. For the 0.1% SAP samples, there was a 5.85% decrease for the underwater samples and an 19.97% increase for the dry cured samples. For the 0.2% SAP samples, there was a 14.23% reduction for the underwater samples, and a 21.50% reduction for the dry cured samples.
Regarding water absorption, it can be observed in Table 21 that the addition of SAP to the mix causes variance. The samples cured underwater with 0.1% added SAP decreased by 16.27%, and the dry cured samples increased by 21.88%. The samples cured underwater with 0.2% added SAP increased by 14.79%, and the dry cured samples reduced by 22.65%, when compared to the reference mix.
Table 22 shows the results of the real specific mass tests, Table 23 shows the void ratio, and Table 24 shows the water absorption of the self-compacting mortar using CPV-ARI, performed according to ABNT NBR 9778:2009 [36]. For these tests, three test samples were used for each of the mixes, identified in the Tables as samples 1, 2, and 3.
For the mortar specific mass test in the hardened state, it is possible to observe a reduction in the samples with added SAP. The 0.1% and 0.2% samples cured underwater showed an average reduction of 5.17% and 3.02%, respectively. The 0.1% dry cured samples reduced by 3.86%, and the 0.2% samples reduced by 1.29%.
Lura et al., 2012 [6] explains that once the SAP reaches its final size, it forms stable inclusion filled with water. This water is then aspired to the interior of smaller capillary pores and consumed in the hydration of the cement. The SAP ends up as empty pores in the cement slurry, corroborating the specific mass test results, as the SAP samples have lower specific mass, both for the CPII-F-32 and the CPV-ARI cement.
Regarding the void ratio, it is possible to observe in Table 23 that the addition of SAP to the mix results in variance. The samples cured underwater with 0.1% added SAP decreased by 9.56%, and the dry cured samples reduced by 2.93%. The samples cured underwater with 0.2% added SAP increased by 3.06%, and the dry cured samples increased by 11.56%.
Regarding water absorption, it can be observed in Table 24 that the addition of SAP to the mix results in variance. The samples cured underwater with 0.1% added SAP decreased by 9.78%, and the dry cured samples reduced by 3.06%. The samples cured underwater with 0.2% added SAP increased by 3.08%, and the dry cured increased by 12.39%, when compared to the reference mix.

3.2.4. Dynamic Elasticity Modulus (Ed)

Table 25 and Table 26, and Figure 13 and Figure 14 show the results of the mortar dynamic elasticity modulus tests, according to ASTM E1876, 2015 [37].
It is possible to state that, according to the results presented in Table 25 and Figure 13, the elasticity modulus of self-compacting mortar with CPII-F-32 cement is affected by the addition of SAP. This variation is not linear, but follows a pattern that presents itself both in the underwater curing process and in the dry curing. The mortar cured underwater with 0.1% added SAP decreased the elasticity modulus by 15.47%, and the dry cured mortar reduced by 20.60%, when compared to the reference mix. Mortar with 0.2% added SAP had smaller decreases, with a 10.55% reduction for samples cured underwater and 6.62% for dry cured samples. These results reassure the results of previous tests, with the 0.2% SAP addition being more advantageous to the mixes.
The elasticity modulus in the cement mixes with the inclusion of less rigid particles, such as superabsorbent polymers, is generally smaller if compared to conventional concrete, for which the aggregate used is more rigid, such as quartz, basalt, and limestone. The addition of less rigid particles to the concrete makes the stress-deformation curve less inclined in the elastic region, making the final product have a lower elasticity modulus [46].
Table 26 and Figure 14 present the results, making it possible to state that the elasticity modulus of self-compacting mortar with CPV-ARI cement is affected by the addition of SAP. The mortar cured underwater with 0.2% added SAP presented lower reductions (16.62%) than the 0.1% samples (24.24%), when compared to the reference mix. The dry cured mortar presented similar reductions, with a 19.51% reduction in 0.1% SAP samples, and a 21.80% reduction in 0.2% SAP. Differently from the type II cement, the two types of curing process of the CPV cement did not behave in the same manner, improving in 0.2 percent samples cured underwater, but not repeating the results in the dry cured samples.
According to the obtained results that are presented in Table 25 and Table 26, and by analyzing Figure 15, which presents the variation in the dynamic elasticity modulus for the two types of cures, it is possible to observe that CPII-F-32 cement presented a reduction in the values with the addition of the superabsorbent polymer, indicating that it may have helped in the dry curing process, providing extra hydration due to the swelling of the SAP particles in the samples. However, in the CPV-ARI samples, there was a higher reduction in mixes with 0.1% SAP, and a significant increase in the 0.2% SAP mix, demonstrating that the SAP had a better behavior with 0.1% SAP for this type of cement, in the dry curing process.
Figure 16 shows the Pareto graphs for the standardized effects of the results of the compression (left) and traction (right) tests performed on the mortars with CPII-F-32 cement with SAP additions. Pareto charts show the absolute values of the standardized effects from highest to lowest effect, and have a reference line to indicate which effects are statistically significant. Thus, the bars that cross the reference line have significance. As expected, the different types of curing have a great influence on the behavior of mortars, both for compression and traction. Regarding compression, it is noted that the inclusion of PAS did not affect the resistance of the mortars significantly, maintaining values close to those of the reference trait. For traction, the addition promoted significant changes in the mortars, obtaining higher values than the reference trait.
Figure 17 shows the Pareto charts for the standardized effects of the results of the compression (left) and traction (right) tests performed on the mortars with CPV-ARI cement with SAP additions. In them, it is possible to notice the factors that presented greater influence on the traits. As in type II cement, the different types of curing have a great influence on the behavior of the mortars, both for compression and traction. It is noted that the inclusion of PAS significantly affected the resistance of the mortars, both for compression and for traction, with a significant reduction in relation to the reference trait.
Comparing the results of the Pareto charts between the two types of cement samples studied, it is noted that the PAS percentage parameter had higher significance for the CPV-ARI than the CPII-F-32. In Schröfl et al., 2012 [15], it was found that the SAP particles in the cement mixtures can create voids in the matrix, which can negatively affect the strength of the material, which justifies the loss of resistance of the CPV-ARI samples.
However, in their work, Agostinho et al., 2012 [47] found that CPV-ARI pastes with addition of 0.15% and 0.30% SAP showed lower rates of reaction acceleration due to a change in cement hydration kinetics, with peaks of lower C3S hydration due to internal curing or the presence of extra water that altered the w/c ratio. According to Baloch et al., 2019 [48], there are two possible behaviors for SAP. The first is the potential to intensify hydration processes, promoting internal healing and increasing endurance. The second is the possibility of creating voids in the matrix, weakening the resistance. In the studies of [49,50], it was found that a more uniform distribution of SAP throughout the cement matrix results in an increase in the effectiveness of internal curing in concrete. These works have shown that SAP has the ability to fill pores in a concrete mixture, which enables better control of autogenous shrinkage in cementitious composites.

4. Conclusions

In relation to the objectives initially set, it is possible to state that it was possible to analyze the addition of superabsorbent polymers (SAP) as internal curing elements in self-compacting mortar (SCM), as well as its mechanical and thermic characteristics, using the contents found as a base for the making of SCC applied to large volume structures.
In the fresh state testing, the addition of SAP resulted in a reduction in specific mass, a reduction in fluidity that had to be corrected with additional water, and an increase in slump time, which was corrected in the same manner, to both types of cement.
In relation to heat of hydration testing, both mortar using CPII-F-32 and CPV-ARI reached satisfactory results, allowing control of the temperature in the beginning of the curing process, something of importance to structures with a large volume of concrete, as is the case of hydraulic projects, in which temperature control is essential to avoid fissures caused by retraction. This can be an indication of a way of mitigating the temperature spikes that can occur in large volume concrete parts.
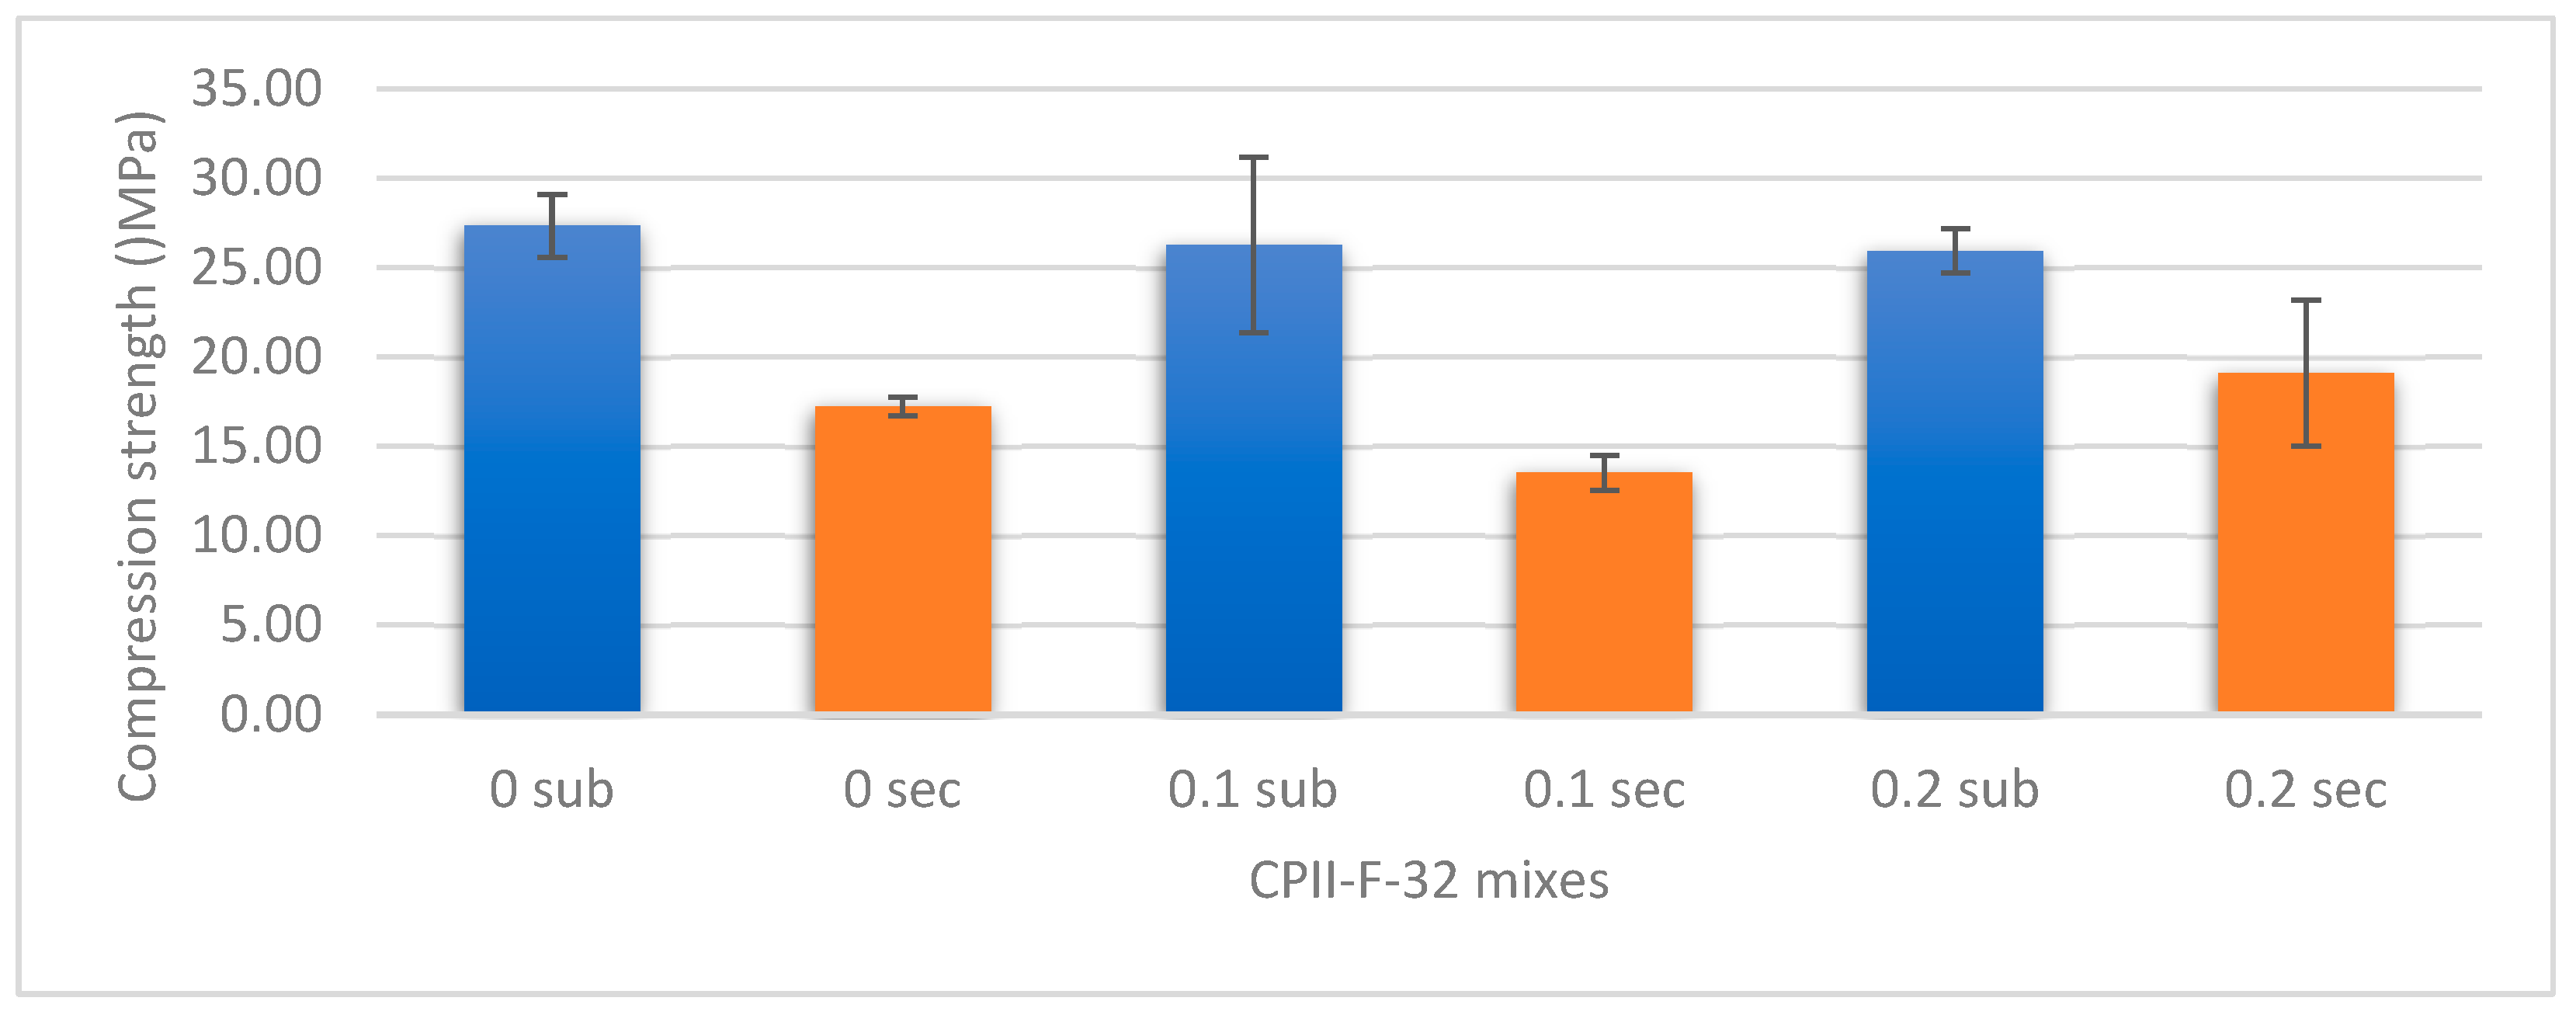
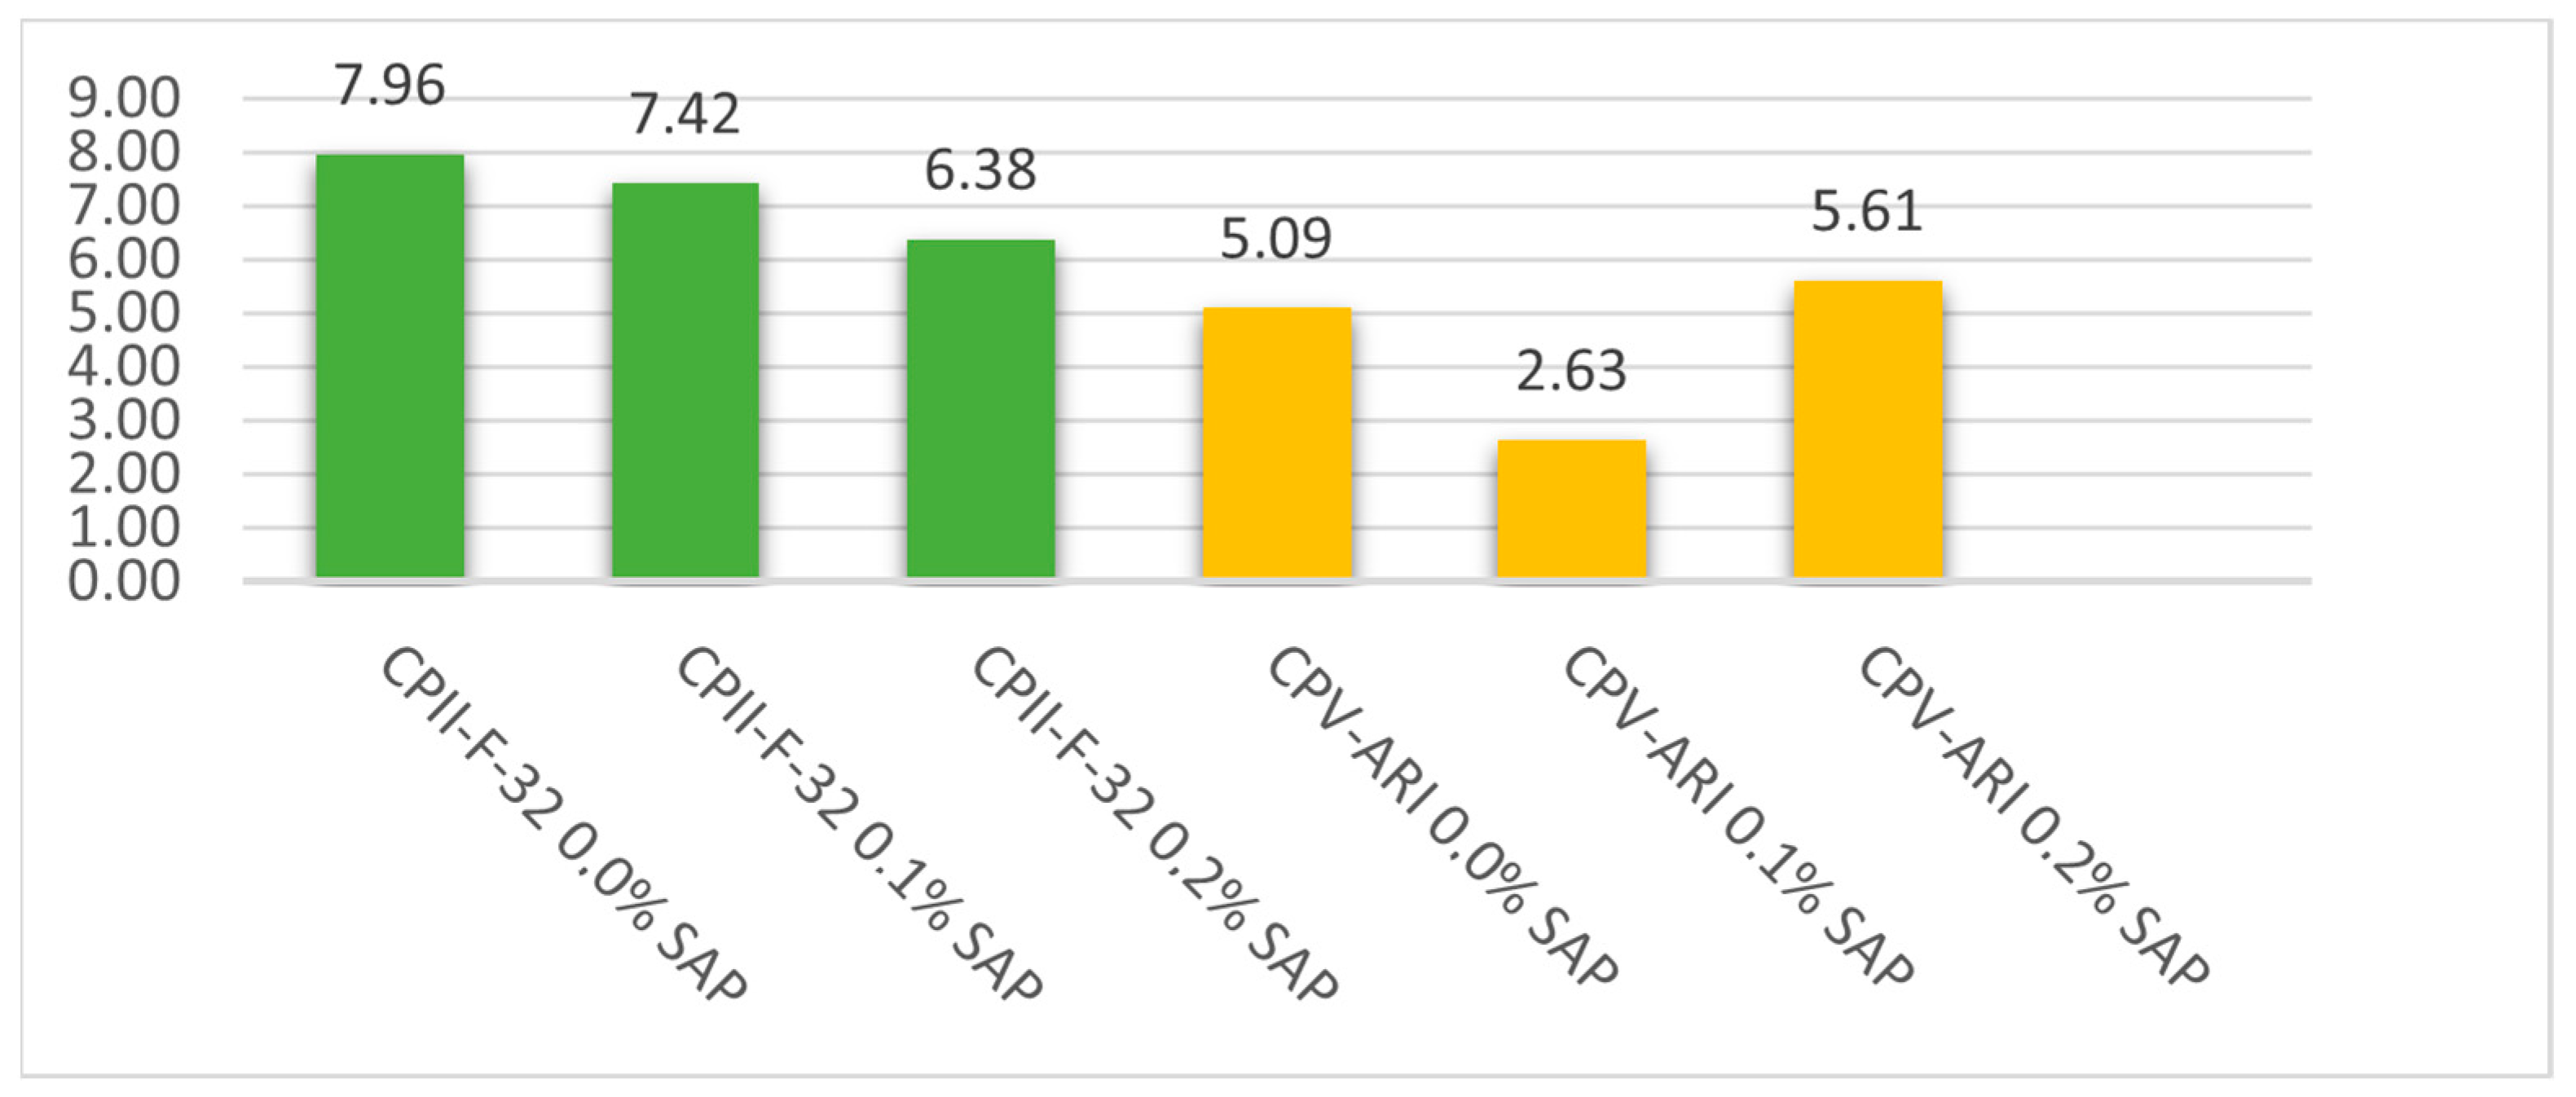
In the hardened state testing, the addition of SAP resulted in not significantly compromising the compression strength in mortar using CPII-F-32 cement, and in mortar using CPV-ARI cement, there was a substantial reduction in strength, reaching over 40%. The tensile strength of the submerged CPII-F-32 mortar presented similar increases, (around 21%); however, for the dry cured mortar, the increase in strength approached 70%. The mortar using CPV-ARI cement did not increase in strength when compared to the reference mix. The dynamic elasticity modulus presented a reduction with the addition of SAP; however, the reduction was lesser in samples with 0.2% of added SAP, both for type II as for type V cement.

Author Contributions

M.H.B.d.S.: conceptualization, methodological, data curation and writing— original draft preparation; L.R.R.S.: methodological, data curation and writing—original draft preparation; V.A.d.S.R.: writing—review and editing, visualization; P.C.G.: writing—review and editing, visualization; M.d.L.N.M.M.: writing—review and editing, visualization; C.E.M.G.: writing—review and editing, visualization; V.C.d.S.: conceptualization, methodological, writing—review and editing, supervision, project administration. All authors have read and agreed to the published version of the manuscript.

Funding

The authors thank CNPq for the financial support PIBIC CNPq.

Institutional Review Board Statement

Not applicable.

Data Availability Statement

Not applicable.

Acknowledgments

The authors thank company IGTPAN for the donation of SAP.

Conflicts of Interest

The authors declare no conflict of interest.

References

  1. EFNARC. The European Guidelines for Self-Compacting Concrete; EFNARC: Flums Hochwiese, Switzerland, 2005; Volume 63. [Google Scholar]
  2. Okamura, H.; Ouchi, M. Self-Compacting Concrete. J. Adv. Concr. Technol. 2003, 1, 5–15. [Google Scholar] [CrossRef]
  3. Justs, J.; Wyrzykowski, M.; Bajare, D.; Lura, P. Internal Curing by Superabsorbent Polymers in Ultra-High Performance Concrete. Cem. Concr. Res. 2015, 76, 82–90. [Google Scholar] [CrossRef]
  4. Hasholt, M.T.; Jensen, O.M.; Kovler, K.; Zhutovsky, S. Can Superabsorent Polymers Mitigate Autogenous Shrinkage of Internally Cured Concrete without Compromising the Strength? Constr. Build. Mater. 2012, 31, 226–230. [Google Scholar] [CrossRef]
  5. Snoeck, D.; Jensen, O.M.; De Belie, N. The Influence of Superabsorbent Polymers on the Autogenous Shrinkage Properties of Cement Pastes with Supplementary Cementitious Materials. Cem. Concr. Res. 2015, 74, 59–67. [Google Scholar] [CrossRef]
  6. Lura, P.; Friedemann, K.; Stallmach, F.; Mönnig, S.; Wyrzykowski, M.; Esteves, L.P. Kinetics of Water Migration in Cement-Based Systems Containing Superabsobent Polymers. In Application of Super Absorbent Polymers (SAP) in Concrete Construction: State-of-the-Art Report Prepared by Technical Committee 225-SAP; Springer: Empa, The Netherlands; Swiss Federal Laboratories for Materials Science and Technology: Dübendorf, Switzerland, 2012; pp. 21–37. ISBN 9789400727335/9789400727328. [Google Scholar]
  7. Bentz, B.Y.D.P.; Lura, P.; Roberts, J.W. Mixture Proportioning for Internal Curing. Concr. Int. 2005, 27, 35–40. [Google Scholar]
  8. Schroefl, C.; Mechtcherine, V.; Vontobel, P.; Hovind, J.; Lehmann, E. Sorption Kinetics of Superabsorbent Polymers (SAPs) in Fresh Portland Cement-Based Pastes Visualized and Quantified by Neutron Radiography and Correlated to the Progress of Cement Hydration. Cem. Concr. Res. 2015, 75, 1–13. [Google Scholar] [CrossRef]
  9. Mehta, P.K.; Monteiro, P.J.M. Concrete: Microstructure, Properties, and Materials, 4th ed.; McGraw-Hill Education: New York, NY, USA, 2014; ISBN 9780071797870. [Google Scholar]
  10. Domone, P. Self-Compacting Concrete: An Analysis of 11 Years of Case Studies. Cem. Concr. Compos. 2006, 28, 197–208. [Google Scholar] [CrossRef]
  11. Jensen, O.; Hansen, P. Water-Entrained Cement-Based Materials: I. Principles and Theoretical Background. Cem. Concr. Res. 2001, 31, 647–654. [Google Scholar] [CrossRef]
  12. Shen, D.; Liu, X.; Zeng, X.; Zhao, X.; Jiang, G. Effect of Polypropylene Plastic Fibers Length on Cracking Resistance of High Performance Concrete at Early Age. Constr. Build. Mater. 2020, 244, 117874. [Google Scholar] [CrossRef]
  13. de Souza, M.H.B.; Gonçalves, P.C.; Silva, L.R.R.; de Melo, M.L.N.M.; dos Santos, V.C. Use of Superabsorbent Polymers in Cement-Based Compounds: A Bibliometric Analysis. Res. Soc. Dev. 2021, 10, e21818. [Google Scholar] [CrossRef]
  14. de Souza, M.H.B.; Teixeira, B.A.; Gonçalves, P.C.; da Silva, L.R.R.; de Melo, M.L.N.M.; dos Ribeiro, V.A.S.; Sachs, D.; Capellato, P.; dos Santos, V.C. Effects on the Properties of Self-Compacting Cement Paste (PAA) with the Addition of Superabsorbent Polymer. Materials 2022, 15, 8478. [Google Scholar] [CrossRef] [PubMed]
  15. Schröfl, C.; Mechtcherine, V.; Gorges, M. Relation between the Molecular Structure and the Efficiency of Superabsorbent Polymers (SAP) as Concrete Admixture to Mitigate Autogenous Shrinkage. Cem. Concr. Res. 2012, 42, 865–873. [Google Scholar] [CrossRef]
  16. Rostami, R.; Klemm, A.J.; Almeida, F.C.R. Reduction of Shrinkage by Superabsorbent Polymers (SAP) in Fibre Reinforced Mortars. Constr. Build. Mater. 2021, 288, 123109. [Google Scholar] [CrossRef]
  17. Shen, D.; Li, C.; Li, M.; Liu, C.; Kang, J. Experimental Investigation on Correlation between Autogenous Shrinkage and Internal Relative Humidity of Superabsorbent Polymer-Modified Concrete. J. Mater. Civ. Eng. 2022, 34, 4099. [Google Scholar] [CrossRef]
  18. Wyrzykowski, M.; Assmann, A.; Hesse, C.; Lura, P. Microstructure Development and Autogenous Shrinkage of Mortars with C-S-H Seeding and Internal Curing. Cem. Concr. Res. 2020, 129, 105967. [Google Scholar] [CrossRef]
  19. El-Sayed, A.M.; Faheim, A.A.; Salman, A.A.; Saleh, H.M. Sustainable Lightweight Concrete Made of Cement Kiln Dust and Liquefied Polystyrene Foam Improved with Other Waste Additives. Sustainability 2022, 14, 15313. [Google Scholar] [CrossRef]
  20. Eskander, S.B.; Saleh, H.M.; Tawfik, M.E.; Bayoumi, T.A. Towards Potential Applications of Cement-Polymer Composites Based on Recycled Polystyrene Foam Wastes on Construction Fields: Impact of Exposure to Water Ecologies. Case Stud. Constr. Mater. 2021, 15, e00664. [Google Scholar] [CrossRef]
  21. Hamzah, N.; Saman, H.M.; Baghban, M.H.; Sam, A.R.M.; Faridmehr, I.; Sidek, M.N.M.; Benjeddou, O.; Huseien, G.F. A Review on the Use of Self-Curing Agents and Its Mechanism in High-Performance Cementitious Materials. Buildings 2022, 12, 152. [Google Scholar] [CrossRef]
  22. Zhang, B.; Zhu, H.; Feng, P.; Zhang, P. A Review on Shrinkage-Reducing Methods and Mechanisms of Alkali-Activated/Geopolymer Systems: Effects of Chemical Additives. J. Build. Eng. 2022, 49, 104056. [Google Scholar] [CrossRef]
  23. Votorantim Cimentos. Available online: https://www.votorantimcimentos.com.br/produtos/cimentos-votoran/obras-especiais-industrial-meios-agressivos/ (accessed on 19 June 2023).
  24. Brasil Intercement. InterCement. Available online: https://brasil.intercement.com/ (accessed on 19 June 2023).
  25. Instituto Granado de Tecnologia da Poliacrilonitrila IGTPAN. Available online: https://www.igtpan.com/ (accessed on 19 June 2023).
  26. Tutikian, B.F. Proposição de um Método de Dosagem Experimental Para Concretos Autoadensáveis. Ph.D. Thesis, Universidade Federal Do Rio Grande Do Sul, Rio Grande Do Sul, Brazil, 2007. [Google Scholar]
  27. Helene, P.; Terzian, P. Manual de Dosagem e Controle Do Concreto; Método Para Concreto Convencional IPT/EPSUP; PINI: São Paulo, Brazil, 1992. [Google Scholar]
  28. Da Silva, L.R.R. Análise de Propriedades do Concreto Autoadensável Com Resíduo Polimérico. Master’s Thesis, Universidade Federal de Itajubá, Itajubá, Brazil, 2020. [Google Scholar]
  29. Okamura, H.; Ouchi, M. Self-Compacting Concrete. Development, Present Use and Future. In Proceedings of the First International Rilem Symposiüm on Self-Compacting Concrete, Stockholm, Sweden, 13–14 September 1999. [Google Scholar]
  30. Takada, K.; Pelova, G.; Walraven, J. The First Trial of Self-Compacting Concrete in The Netherlands According to the Japanese Design Method. In Proceedings of FIP Congress; FIP: Amsterdam, The Netherlands, 1998; pp. 113–115. [Google Scholar]
  31. Edamatsu, H.; Da Nishi, N.; Oüchi, M. A Rational Mix-Design Method for Self-Compacting Concrete Considering Interaction between Coarse Aggregate and Mortar Particies. In Proceedings of the First International Rilem Symposiüm on Self-Compacting Concrete, Stockholm, Sweden, 13–14 September 1999; pp. 309–320. [Google Scholar]
  32. Domone, P.L.; Jin, J. Properties of Mortar for Self-Compacting Concrete. In Proceedings of the First International Rilem Symposiüm on Self-Compacting Concrete, Stockholm, Sweden, 13–14 September 1999; pp. 109–120. [Google Scholar]
  33. NBR 120006; Cement—Determining the Heat of Hydration Using the Langavant Bottle Method. NBR: Dhaka, Bangladesh, 1990.
  34. ABNT NBR 5739/2018; Concreto—Ensaio de Compressão de Corpos-de-Prova Cilíndricos. Associação Brasileira de Normas Tecnicas: Rio de Janeiro, Brazil, 2018.
  35. ABNT NBR 7222:2011; Concreto e Argamassa—Determinação da Resistência à Tração Por Compressão Diametral de Corpos de Prova Cilíndricos. ABNT—Associação Brasileira de Normas Técnicas: Rio de Janeiro, Brazil, 2011.
  36. ABNT NBR 9778:2009; Argamassa e Concreto Endurecidos—Determinação da Absorção de Água, Índice de Vazios e Massa Específica. ABNT—Associação Brasileira de Normas Técnicas: Rio de Janeiro, Brazil, 2009.
  37. ASTM E1876; International Standard Test Method for Dynamic Young’s Modulus, Shear Modulus, and Poisson’s Ratio by Impulse Excitation of Vibration. ASTM International: West Conshohocken, PA, USA, 2015; p. 17.
  38. Monteiro, P.; Mehta, P. Concrete: Microstructure, Properties and Materials; McGraw-Hill: New York, NY, USA, 2006; ISBN 0071462899/9780071462891. [Google Scholar]
  39. Kumm, T.C. Influência do Emprego de Polímeros Superabsorventes Nas Propriedades de Materiais à Base de Cimento Portland; Universidade Federal de Santa Catarina: Florianopolis, Brazil, 2009. [Google Scholar]
  40. Muthalvan, R.S.; Ravikumar, S.; Avudaiappan, S.; Amran, M.; Aepuru, R.; Vatin, N.; Fediuk, R. The Effect of Superabsorbent Polymer and Nano-Silica on the Properties of Blended Cement. Crystals 2021, 11, 1394. [Google Scholar] [CrossRef]
  41. Suarez, M.L.G. Polímeros Super Absorventes (PSA) Como Agente de Cura Interna Para Previnir Fissuração em Concretos de Alta Resistência; Universidade de Brasília: Brasília, Brazil, 2015; p. 82. [Google Scholar]
  42. Schröfl, C.; Mechtcherine, V. Superabsorbent Polymers to Mitigate Autogenous Shrinkage of Cement Mortar. In Proceedings of the 10th International Conference on Superplasticizers and Other Chemical Admixtures, Prague, Czech Republic, 28–31 October 2012; Research Group for Microstructural Characterization, Institut für Baustoffe (Institute of Construction Materials), Technische Universität: Dresden, Germany, 2012; pp. 265–278. [Google Scholar]
  43. Jensen, O.M.; Hansen, P.F. Water-Entrained Cement-Based Materials: II. Experimental Observations. Cem. Concr. Res. 2002, 32, 973–978. [Google Scholar] [CrossRef]
  44. Pereira, D.F.; e Matos, V.N. Combate à Retração Autógena Utilizando Polímeros Superabsorventes; Monografia de Projeto Final; Departamento de Engenharia Civil e Ambiental, Universidade de Brasília: Rio de Janeiro, Brazil, 2011; 72p. [Google Scholar]
  45. Mechtcherine, V.; Dudziak, L.; Hempel, S. Mitigating Early Age Shrinkage of Ultra-High Performance Concrete by Using Super Absorbent Polymers (SAP). In Proceedings of the 8th International Conference on Creep, Shrinkage and Durability Mechanics of Concrete and Concrete Structures, Ise-Shima, Japan, 30 September–2 October 2008; Institute of Construction Materials, TU: Dresden, Germany, 2009; Volume 2, pp. 847–853. [Google Scholar]
  46. Herrera-Sosa, E.S.E.A. Recovery and Modification of Waste Tire Particles and Their Use as Reinforcements of Concrete. Int. J. Polym. Sci. 2015, 2015, 1. [Google Scholar] [CrossRef] [Green Version]
  47. Agostinho, L.B.; Borges, J.G.; da Silva, E.F.; Cupertino, D.V.M.R. A calorimetry analysis of portland cement pastes containing superabsorbent polymer (Sap) and nanosilica (ns). Rev. Mater. 2020, 25, 1160. [Google Scholar] [CrossRef]
  48. Baloch, H.; Usman, M.; Rizwan, S.A.; Hanif, A. Properties Enhancement of Super Absorbent Polymer (SAP) Incorporated Self-Compacting Cement Pastes Modified by Nano Silica (NS) Addition. Constr. Build. Mater. 2019, 203, 18–26. [Google Scholar] [CrossRef]
  49. Kalinowski, M.; Woyciechowski, P.; Sokołowska, J. Effect of Mechanically-Induced Fragmentation of Polyacrylic Superabsorbent Polymer (SAP) Hydrogel on the Properties of Cement Composites. Constr. Build. Mater. 2020, 263, 120135. [Google Scholar] [CrossRef]
  50. Mechtcherine, V.; Gorges, M.; Schroefl, C.; Assmann, A.; Brameshuber, W.; Ribeiro, A.B.; Cusson, D.; Custódio, J.; Da Silva, E.F.; Ichimiya, K.; et al. Effect of Internal Curing by Using Superabsorbent Polymers (SAP) on Autogenous Shrinkage and Other Properties of a High-Performance Fine-Grained Concrete: Results of a RILEM Round-Robin Test. Mater. Struct. Constr. 2014, 47, 541–562. [Google Scholar] [CrossRef]
Figure 1. Study’s methodological procedure flowchart.
Buildings 13 01640 g001
Figure 2. SAP samples.
Buildings 13 01640 g002
Figure 3. Mortar slump test. Source: Adapted from Okamura and Ouchi, 2003 [2].
Buildings 13 01640 g003
Figure 4. Mortar Funnel testing. Source: Adapted from Okamura and Ouchi, 2003 [2].
Buildings 13 01640 g004
Figure 5. Support used to perform the dynamic elasticity modulus testing.
Buildings 13 01640 g005
Figure 6. Slump flow test of the CPII-F-32 mix, 0% (left), 0.1% (middle), and 0.2% (right).
Buildings 13 01640 g006
Figure 7. Slump flow test of the CPV-ARI mix, 0% (left), 0.1% (middle), and 0.2% (right).
Buildings 13 01640 g007
Figure 8. Temperature fluctuation in time (CPII-F-32 and CPV-ARI).
Buildings 13 01640 g008
Figure 9. Average results of compression strength of CPII-F-32.
Buildings 13 01640 g009
Figure 10. Average results of compression strength of CPV-ARI.
Buildings 13 01640 g010
Figure 11. Average results of tensile strength of CPII-F-32.
Buildings 13 01640 g011
Figure 12. Average results of tensile strength of CPV-ARI.
Buildings 13 01640 g012
Figure 13. Average dynamic elasticity modulus of CPII-F-32.
Buildings 13 01640 g013
Figure 14. Average dynamic elasticity modulus of CPV-ARI.
Buildings 13 01640 g014
Figure 15. Dynamic elasticity modulus variance.
Buildings 13 01640 g015
Figure 16. Pareto plot of standardized effects for CPII-E-32 (Compression and Tensile).
Buildings 13 01640 g016
Figure 17. Pareto plot of standardized effects for CPV-ARI (Compression and Tensile).
Buildings 13 01640 g017
Table 1. Properties of CPII-F-32.
Standard ABNT NBRValueUnit
Specific Mass (ABNT NBR 23:2001)2.99Kg/dm3
Setting Time
(ABNT NBR 65:2003)
Start170min
Finish241min
Compression strength
(ABNT NBR 7215:1997)
1 day-MPa
3 days25MPa
7 days31MPa
28 days39MPa
Source: Adapted from VOTORANTIMCIMENTOS, 2022 [23].
Table 2. Properties of CPV-ARI.
Standard ABNT NBRValueUnit
Specific Mass (ABNT NBR 23:2001)3.04Kg/dm3
Setting Time
(ABNT NBR 65:2003)
Start142min
Finish220min
Compression strength
(ABNT NBR 7215:1997)
1 day27MPa
3 days37MPa
7 days42MPa
28 days48MPa
Source: Adapted from BRASILINTERCEMENT, 2022 [24].
Table 3. Characteristics of the used Superabsorbent Polymer.
AppearanceYellow Granulates
Particle size (mm)0.6–2.5
Relative density (g/cm3)1.1
pH concentration 1 g/L7–9
Water solubilityInsoluble
Absorption (g water/g SAP)200–400
Time (min) to reach 60% absorption10
UV rays’ stabilityHigh resistance to UV rays
Product average stability in ground (years)3–5
Acrylamide residual (ppm)<1.0
Acrylic acid residual (ppm)<1.0
Potassium concentration (%)>20%
Nitrogen concentration (%)>10%
Source: Adapted from IGTPAN, 2023 [25].
Table 4. Unitary mix by mass used in SCM.
MixCementSilicaFine SandCoarse SandSPAa/cSAP
CPII-F-32 REF1.000.101.51.32.3%0.60.00
CPII-F-32 0.1%1.000.101.61.42.7%0.70.01
CPII-F-32 0.2%1.000.101.61.42.4%0.60.02
CPV-ARI REF1.000.061.51.31.7%0.50.00
CPV-ARI 0.1%1.000.061.61.42.0%0.60.01
CPV-ARI 0.2%1.000.061..61.42.1%0.60.02
Table 5. Number of test samples used in each fresh state test.
Fresh State TestingStandard/MethodN° Test Samples Ø 5 × 10 cm
CPII-F-32CPV-ARI
0%0.10%0.20%0%0.10%0.20%
Apparent specific massNBR 9833:2009333333
Consistency indexOkamura e Ouchi, 1999Did not use test samples
Apparent plastic viscosity
Heat of hydrationNBR 12006:1990333333
Table 6. Number of test samples used in each hardened state test.
Hardened State TestingStandard/MethodN° Test Samples Ø 5 × 10 cm
CPII-F-32CPV-ARI
0%0.10%0.20%0%0.10%0.20%
Axial compression strengthNBR 5739:2007666666
Tensile strengthNBR 7222:2011666666
Dynamic elasticity modulusASTM 1876-01 666666
Water absorption, void ratio, and specific massNBR 9778:2005666666
Note: the amount shown is regarding the sum of dry and submerged samples (3 each).
Table 7. Slump flow test—CPII.
Mix% SAPCureCement Typed1d2d0Gm
(3 < Gm < 7)
10SubCPII2702651006.2
30DryCPII2702651006.2
50.1SubCPII2652551005.8
70.1DryCPII2652551005.8
90.2SubCPII2302251004.2
110.2DryCPII2302251004.2
Table 8. Slump flow test—CPV.
Mix% SAPCureCement Typed1d2d0Gm
(3 < Gm < 7)
20SubCPV2752751006.6
40DryCPV2752751006.6
60.1SubCPV2602701006.0
80.1DryCPV2602701006.0
100.2SubCPV2752801006.7
120.2DryCPV2752801006.7
Table 9. Apparent plastic viscosity of CPII.
Mix% SAPCureCement TypeTime (s)Rm
(1 < Rm < 2)
10SubCPII91.1
30DryCPII91.1
50.1SubCPII91.1
70.1DryCPII91.1
90.2SubCPII101.0
110.2DryCPII101.0
Table 10. Apparent plastic viscosity of CPV.
Mix% SAPCureCement TypeTime (s)Rm
(1 < Rm < 2)
20SubCPV81.3
40DryCPV81.3
60.1SubCPV71.4
80.1DryCPV71.4
100.2SubCPV91.1
120.2DryCPV91.1
Table 11. Individual gathering of thermocouples in CPII-F-32.
Thermocouple 1Thermocouple 2Thermocouple 3
Sample Number1 and 35 and 79 and 111 and 35 and 79 and 111 and 35 and 79 and 11
% of SAP0.00%0.10%0.20%0.00%0.10%0.20%0.00%0.10%0.20%
00:00:0023.123.921.723.123.421.523.623.922
00:15:0024.225.222.32323.620.224.224.922
00:30:0025.825.822.824.524.120.62625.623.8
00:45:0026.726.523.725.524.621.22726.424.7
01:00:0027.426.623.626.124.420.927.826.425
01:15:0027.627.223.626.225.121.128.226.824.8
01:30:0028.227.424.426.925.421.728.927.126
01:45:0028.527.124.427.224.921.929.126.925.2
02:00:0028.627.324.927.325.42229.326.826.5
Tf-Ti5.53.43.24.220.55.72.94.5
Source: Author, 2021.
Table 12. Individual gathering of thermocouples in CPV-ARI.
Thermocouple 1Thermocouple 2Thermocouple 3
Sample Number2 and 46 and 810 and 122 and 46 and 810 and 122 and 46 and 810 and 12
% of SAP0.00%0.10%0.20%0.00%0.10%0.20%0.00%0.10%0.20%
00:00:0023.321.422.521.920.221.523.619.720.7
00:15:0023.518.918.720.816.216.924.116.416.4
00:30:0024.420.219.621.518.118.125.718.617.6
00:45:0025.3222022.419.818.826.820.318.6
01:00:0025.722.921.122.720.52027.220.719.9
01:15:0026.823.221.523.72220.228.322.320.2
01:30:0026.823.721.323.522.520.128.622.819.8
01:45:002723.821.723.822.520.328.922.720.2
02:00:0027.523.822.324.622.420.929.422.720.9
Tf-Ti4.22.4−0.22.72.2−0.65.830.2
Table 13. Thermocouple average in CPII-F-32.
Thermocouple Average
Sample Number1 and 35 and 79 and 11
% of SAP0.00%0.10%0.20%
00:00:0023.2723.7321.73
00:15:0023.8024.5721.50
00:30:0025.4325.1722.40
00:45:0026.4025.8323.20
01:00:0027.1025.8023.17
01:15:0027.3326.3723.17
01:30:0028.0026.6324.03
01:45:0028.2726.3023.83
02:00:0028.4026.5024.47
Tf-Ti5.132.772.73
Table 14. Thermocouple average in CPV-ARI.
Thermocouple Average
Sample Number2 and 46 and 810 and 12
% of SAP0.00%0.10%0.20%
00:00:0022.9320.4321.57
00:15:0022.8017.1717.33
00:30:0023.8718.9718.43
00:45:0024.8320.7019.13
01:00:0025.2021.3720.33
01:15:0026.2722.5020.63
01:30:0026.3023.0020.40
01:45:0026.5723.0020.73
02:00:0027.1722.9721.37
Tf-Ti4.232.53−0.2
Table 15. Compression strength test results (CPII-F-32).
Mix% SAPCureCement TypeCompression (MPa)Average
Sample 1Sample 2Sample 3
10SubCPII27.5425.5229.0227.36
30DryCPII17.7116.6817.2817.23
50.1SubCPII31.8922.6724.3426.30
70.1DryCPII13.8614.3112.4413.54
90.2SubCPII25.3727.3825.0925.95
110.2DryCPII19.8114.7422.8019.12
Table 16. Compression strength test results (CPV-ARI).
Mix% SAPCureCement TypeCompression (MPa)Average
Sample 1Sample 2Sample 3
20SubCPV50.9150.4550.5950.65
40DryCPV28.6741.2840.2936.75
60.1SubCPV29.5031.0531.5230.69
80.1DryCPV20.6321.7623.4821.96
100.2SubCPV27.3627.8038.0331.06
120.2DryCPV20.9625.9723.2823.40
Table 17. Tensile strength test results—CPII.
Mix% SAPCureCement TypeTraction (MPa)Average
Sample 1Sample 2Sample 3
10SubCPII2.343.843.103.09
30DryCPII1.481.561.991.68
50.1SubCPII3.843.793.613.75
70.1DryCPII2.132.002.002.04
90.2SubCPII3.863.563.863.76
110.2DryCPII1.983.722.922.87
Table 18. Tensile strength test results—CPV.
Mix% SAPCureCement TypeTraction (MPa)Average
Sample 1Sample 2Sample 3
20SubCPV3.624.583.904.03
40DryCPV4.064.113.693.96
60.1SubCPV3.623.153.203.32
80.1DryCPV2.352.612.452.47
100.2SubCPV2.913.883.253.35
120.2DryCPV2.542.782.822.71
Table 19. Specific mass of SCM in the hardened state—CPII-F-32.
Mix% SAPCureCement TypeSpecific Mass (g/cm3)Average
Sample 1Sample 2Sample 3
10SubCPII2.292.272.262.27
30DryCPII2.332.352.312.33
50.1SubCPII2.142.152.202.16
70.1DryCPII2.352.322.342.34
90.2SubCPII2.202.172.182.18
110.2DryCPII2.302.162.182.21
Table 20. Void ratio of SCM in the hardened state—CPII-F-32.
Mix% SAPCureCement TypeVoid ratioAverage
Sample 1Sample 2Sample
10SubCPII5.075.215.115.13
30DryCPII7.387.466.787.21
50.1SubCPII4.244.164.604.33
70.1DryCPII8.948.148.878.65
90.2SubCPII4.664.434.124.40
110.2DryCPII6.915.065.025.66
Table 21. Water absorption of SCM in the hardened state—CPII-F-32.
Mix% SAPCureCement TypeAbsorption %Average
Sample 1Sample 2Sample 3
10SubCPII5.345.505.395.41
30DryCPII7.978.067.287.77
50.1SubCPII4.434.344.824.53
70.1DryCPII9.828.879.739.47
90.2SubCPII4.884.634.304.61
110.2dryCPII7.425.335.286.01
Table 22. Specific mass of SCM in the hardened state—CPV-ARI.
Mix% SAPCureCement TypeSpecific Mass (g/cm3)Average
Sample 1Sample 2Sample 3
20SubCPV2.302.312.352.32
40DryCPV2.342.332.332.33
60.1SubCPV2.262.162.182.20
80.1DryCPV2.222.252.242.24
100.2SubCPV2.252.262.252.25
120.2DryCPV2.302.312.302.30
Table 23. Void ratio of SCM in the hardened state—CPV-ARI.
Mix% SAPCureCement TypeVoid RatioAverage
Sample 1Sample 2Sample 3
20SubCPV5.395.474.835.23
40DryCPV6.905.186.336.14
60.1SubCPV6.384.173.634.73
80.1DryCPV5.506.415.965.96
100.2SubCPV5.395.725.045.39
120.2DryCPV6.676.996.886.85
Table 24. Water absorption of SCM in the hardened state—CPV-ARI.
Mix% SAPCureCement TypeAbsorption %Average
Sample 1Sample 2Sample 3
20SubCPV5.695.795.075.52
40DryCPV7.425.466.766.54
60.1SubCPV6.814.353.774.98
80.1DryCPV5.826.846.346.34
100.2SubCPV5.706.075.315.69
120.2DryCPV7.157.527.397.35
Table 25. Dynamic elasticity modulus of CPII-F-32.
Mix% SAPCureCement TypeEd (GPa)Average
Sample 1Sample 2Sample 3
10SubCPII26.8429.3324.3326.83
30DryCPII19.8618.1818.5918.88
50.1SubCPII24.5520.0822.6122.41
70.1DryCPII16.2414.5514.1914.99
90.2SubCPII25.1223.0023.8924.00
110.2DryCPII17.7215.6119.5517.63
Table 26. Dynamic elasticity modulus of CPV-ARI.
Mix% SAPCureCement TypeEd (GPa)Average
Sample 1Sample 2Sample 3
20SubCPV30.7532.4530.6631.29
40DryCPV21.9527.9628.6726.19
60.1SubCPV23.0724.0124.0623.71
80.1DryCPV21.1620.3421.7421.08
100.2SubCPV26.1226.9025.2426.09
120.2DryCPV20.1220.6620.6620.48
Disclaimer/Publisher’s Note: The statements, opinions and data contained in all publications are solely those of the individual author(s) and contributor(s) and not of MDPI and/or the editor(s). MDPI and/or the editor(s) disclaim responsibility for any injury to people or property resulting from any ideas, methods, instructions or products referred to in the content.

