Article

Damage Model of Basalt-Fiber-Reinforced Cemented Soil Based on the Weibull Distribution

1
School of Transportation Science and Engineering, Jilin Jianzhu University, Changchun 130118, China
2
School of Civil Engineering, Jilin Jianzhu University, Changchun 130118, China
*
Author to whom correspondence should be addressed.
Buildings 2023, 13(2), 460; https://doi.org/10.3390/buildings13020460
Submission received: 5 January 2023 / Revised: 2 February 2023 / Accepted: 6 February 2023 / Published: 7 February 2023
(This article belongs to the Special Issue Advances in Cement Composite Materials)

Abstract

:
This study investigates the mechanical performance and a constitutive model of basalt-fiber-reinforced cemented soil (BFRCS) containing 0%, 0.1%, 0.3%, 0.5%, and 0.7% basalt fibers with lengths of 3, 6, 12, 20, and 35 mm, respectively. Unconfined compressive strength tests were used to examine the mechanical performance of BFRCS with varying basalt fiber contents and lengths. The test results demonstrate that the basalt fiber content of optimal quality is 0.1%, and that the fiber distribution uniformity and density have a significant impact on the strength of BFRCS. Based on the Weibull distribution of BFRCS for the degree of damage, a damage model for BFRCS, accounting for the fiber length and fiber content, is proposed here. Moreover, in this study we explored the relationship between the scale parameter as well as shape parameter of the Weibull distribution and fiber content as well as length. Furthermore, the evaluation methods for the mechanical properties of BFRCS according to the scale and shape parameters of the Weibull distribution are discussed. The results suggest that the proposed constitutive model captures the compressive stress–strain relationship of BFRCS; the theoretical results are in strong agreement with the data obtained.

1. Introduction

Currently, cemented soil is popular in various areas of soil reinforcement engineering [1,2], but its high brittleness and low tensile properties [3,4] render it susceptible to cracking during use, thereby decreasing its durability. To improve its mechanical properties, researchers have added various types of fibers to cemented soil to transform it into fiber-reinforced cemented soil. Studies have demonstrated that incorporating fibers can improve the strength and toughness of cemented soil [5,6,7].
Basalt fiber is a new environmental fiber material with a high tensile strength and erosion resistance [8,9,10], rendering it a common soil reinforcement material. Yang et al. [11] reported that when the fiber content of soil increased, its strength and stability increased. Furthermore, Otieno et al. [12] reported the reinforcing effect of basalt fiber and rice husk ash (RHA) co-cured with cement on the compressibility and swelling of soil. They reported that the addition of 12 mm of basalt fibers, 5% of RHA, and 3% of cement could effectively reinforce soil and enhance its ultimate strength. Ma et al. [13] examined the dynamic mechanical properties of basalt-fiber-reinforced cemented soil (BFRCS) and reported that the basalt fiber content affected the energy absorption capacity and improved the dynamic strength of BFRCS. Moreover, Cao [14] observed that adding basalt fibers to cement–fly-ash-stabilized soil considerably enhanced the static–dynamic mechanical properties of stabilized soil. With a basalt fiber content of 0.6%, a stable internal space structure was produced in stabilized soil; however, multiple weak interfaces between the fibers appeared in stabilized soil with a basalt fiber content of 1.2%. Shen et al. [15] examined the strength properties of fiber-reinforced clayey soil with a lower content of lime or cement (5% by weight); however, for the lime-treated soil specimens the peak values were observed when the fiber content was 0.1%. Furthermore, Zhu et al. [16] considered that the interfacial peak/residual shear resistance and shear stiffness of fiber-reinforced soil considerably depend on the soil compaction conditions. The addition of cement to soil can improve the soil compaction conditions, thus improving the effect of fiber-reinforced soil [17]. Wang et al. [18] reported that the inclusion of basalt fibers improves the ductility and weakens the brittleness of cemented kaolinite. The compressive strength increases with the basalt fiber content and curing time, peaks at a 0.2% fiber content, and then decreases because of the formation of a weak zone at higher fiber contents. Xiao et al. [19] discovered that the unconfined compressive strength (UCS) and splitting tensile strength of basalt-fiber-reinforced biocement with a given basalt fiber content significantly increased with an increase in the calcite content. Moreover, Lv et al. [20] reported that, as the fiber content increased, the cohesion and residual cohesion first increased and then decreased, and that the brittleness index decreased. Furthermore, the internal friction angle and residual internal friction angle exhibited no clear variation patterns. Dasaka et al. [21] reported that the UCS of soil significantly increased with the addition of coconut shell fibers. Divya et al. [22] used a digital image cross-correlation analysis of the top view of the soil captured during tensile tests to obtain the displacement vectors and strain field distribution. The fiber content and fiber length increased, such that the other parameters remained constant. Thus, the strain upon crack initiation and the energy absorption capacity of the fiber-reinforced soil increased, and the post-cracking behavior improved.
The aforementioned study showed a synergistic effect between fibers and cement, and that their joint addition can have a coupled reinforcing effect. Moreover, the fibers can effectively improve the mechanical properties of the reinforced material as long as they are present in the appropriate content and are of a suitable length.
Gao et al. [23] proposed a critical-state fiber-reinforced soil (FRS) model in the triaxial stress space by using the concept of effective skeleton stress and the void ratio. Sivakumar Babu et al. [24] reported an analytical model for the analysis of FRS in the framework of a modified cam clay model. Furthermore, Salih et al. [25] designed a stress–strain model describing the soil brick response to compressive loading for each fiber type, obtained via a regression analysis. Kanchi et al. [26] formulated an analytical model for the FRS based on the modified cam clay model concept. The results demonstrated that as the inclination of the fibers in the horizontal plane increased, the contribution of the fibers in improving the strength of FRS decreased. Wu et al. [27] developed a uniaxial strain-softening constitutive model for FRS based on the disturbed state concept. This study on the intrinsic structural model of reinforced soil primarily focused on fiber-reinforced soil or cement-reinforced soil; however, only a few studies are related to the constitutive model of fiber-reinforced cemented soil, and the results have not enabled researchers to form a unified theory.
Based on UCS tests, this study proposes a Weibull-distribution-based damage model. Moreover, the effects of fiber content and fiber length on the mechanical properties of BFRCS were analyzed. The model parameters were determined, and the stress–strain relationship of BFRCS under uniaxial pressure was fitted and analyzed for damage evolution. This study aids researchers in comprehending the evolution of the damage properties of BFRCS and provides a theoretical foundation for their accurate analysis and evaluation.

2. Material Properties and Test Procedure

2.1. Test Materials

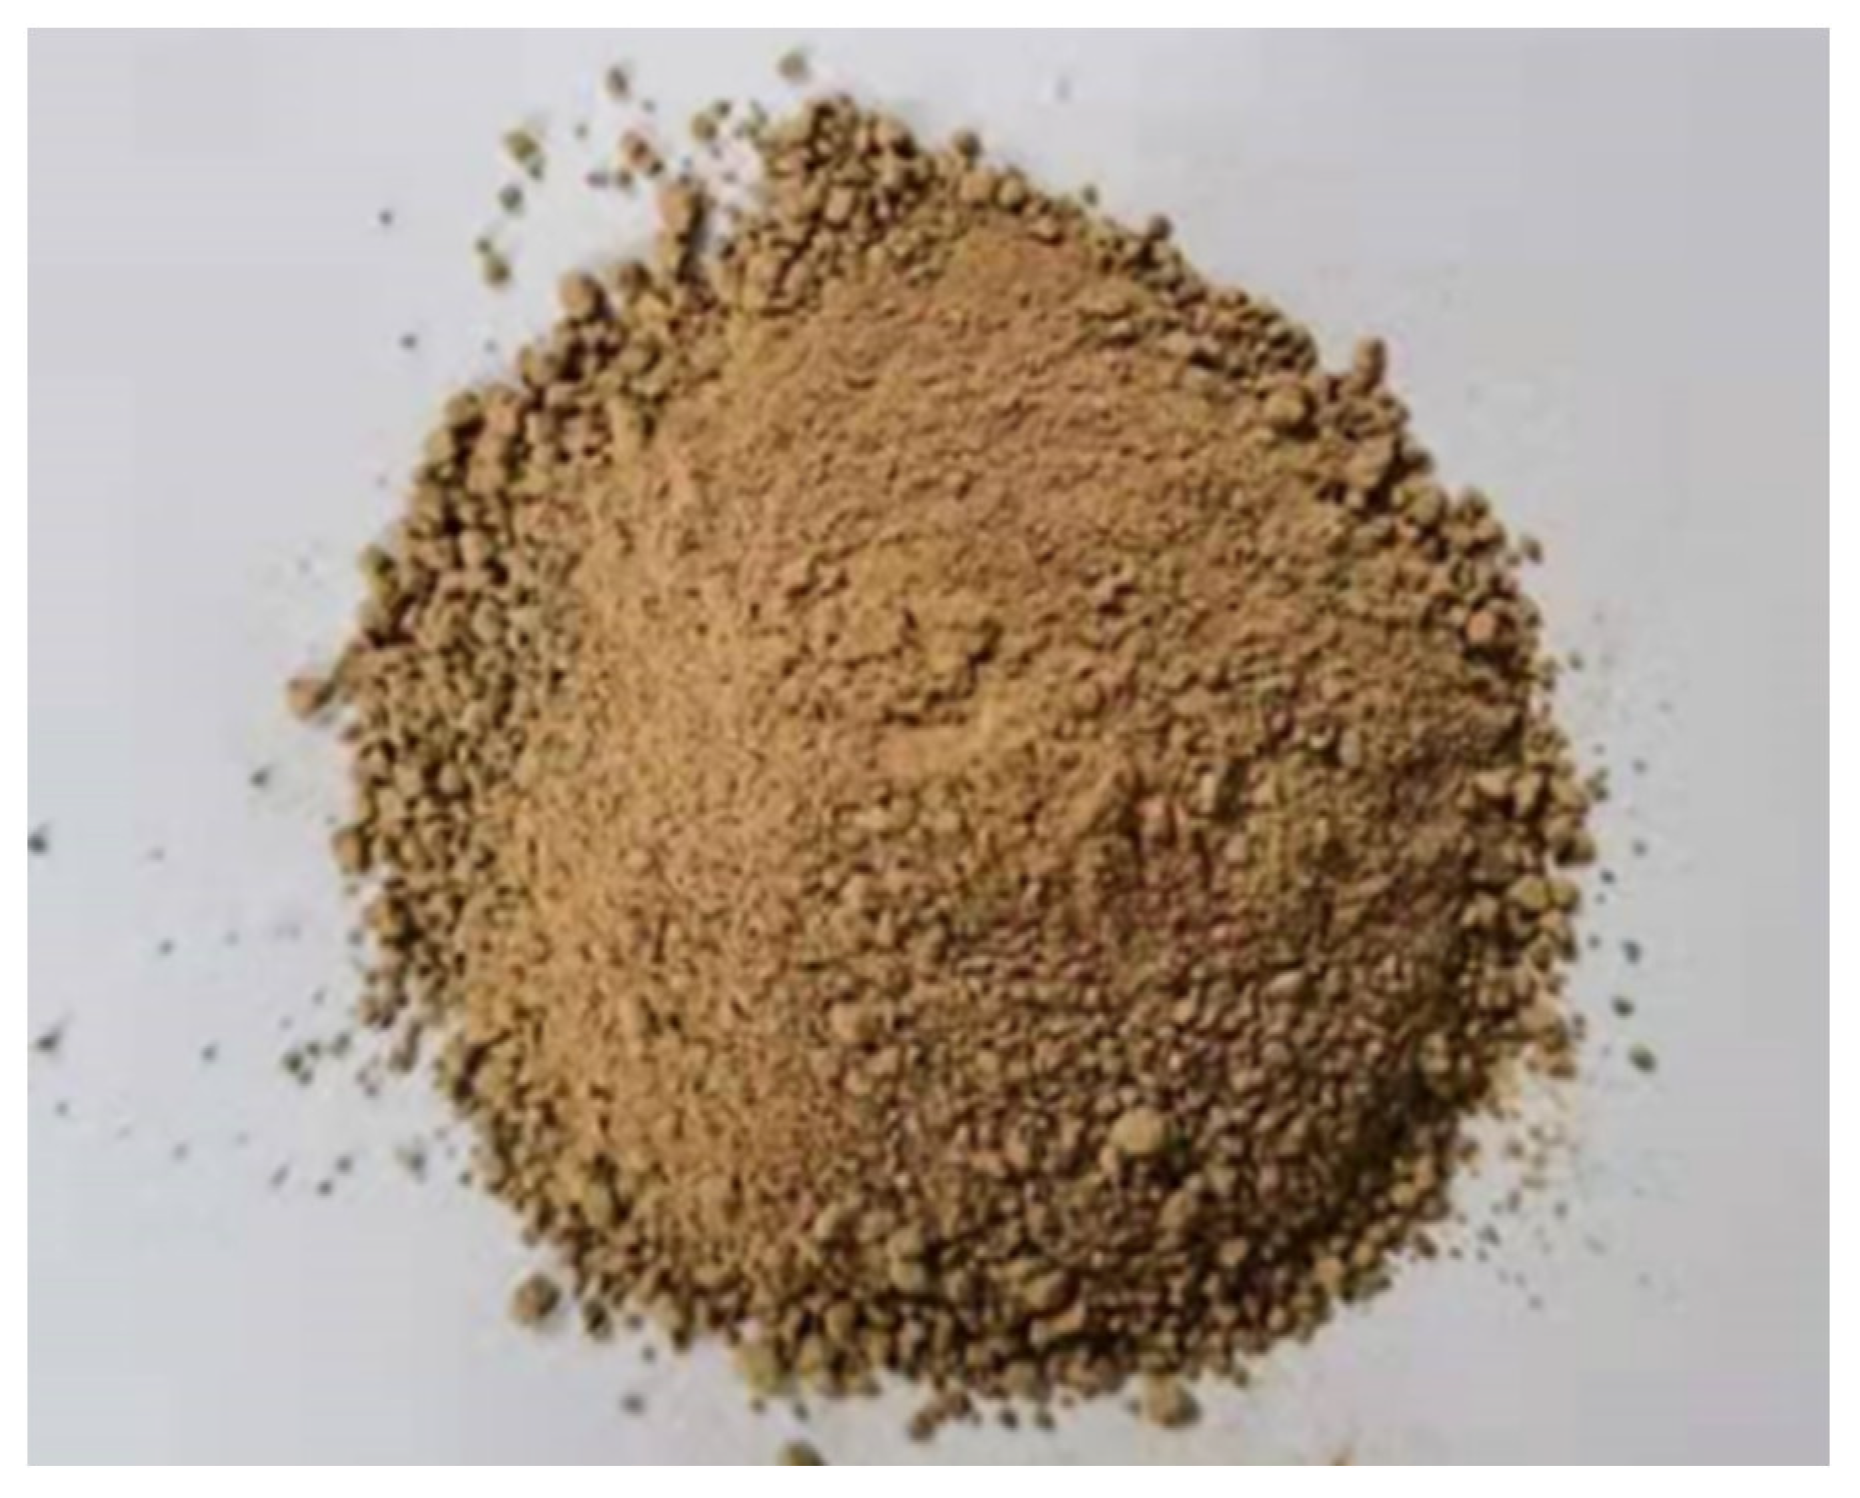
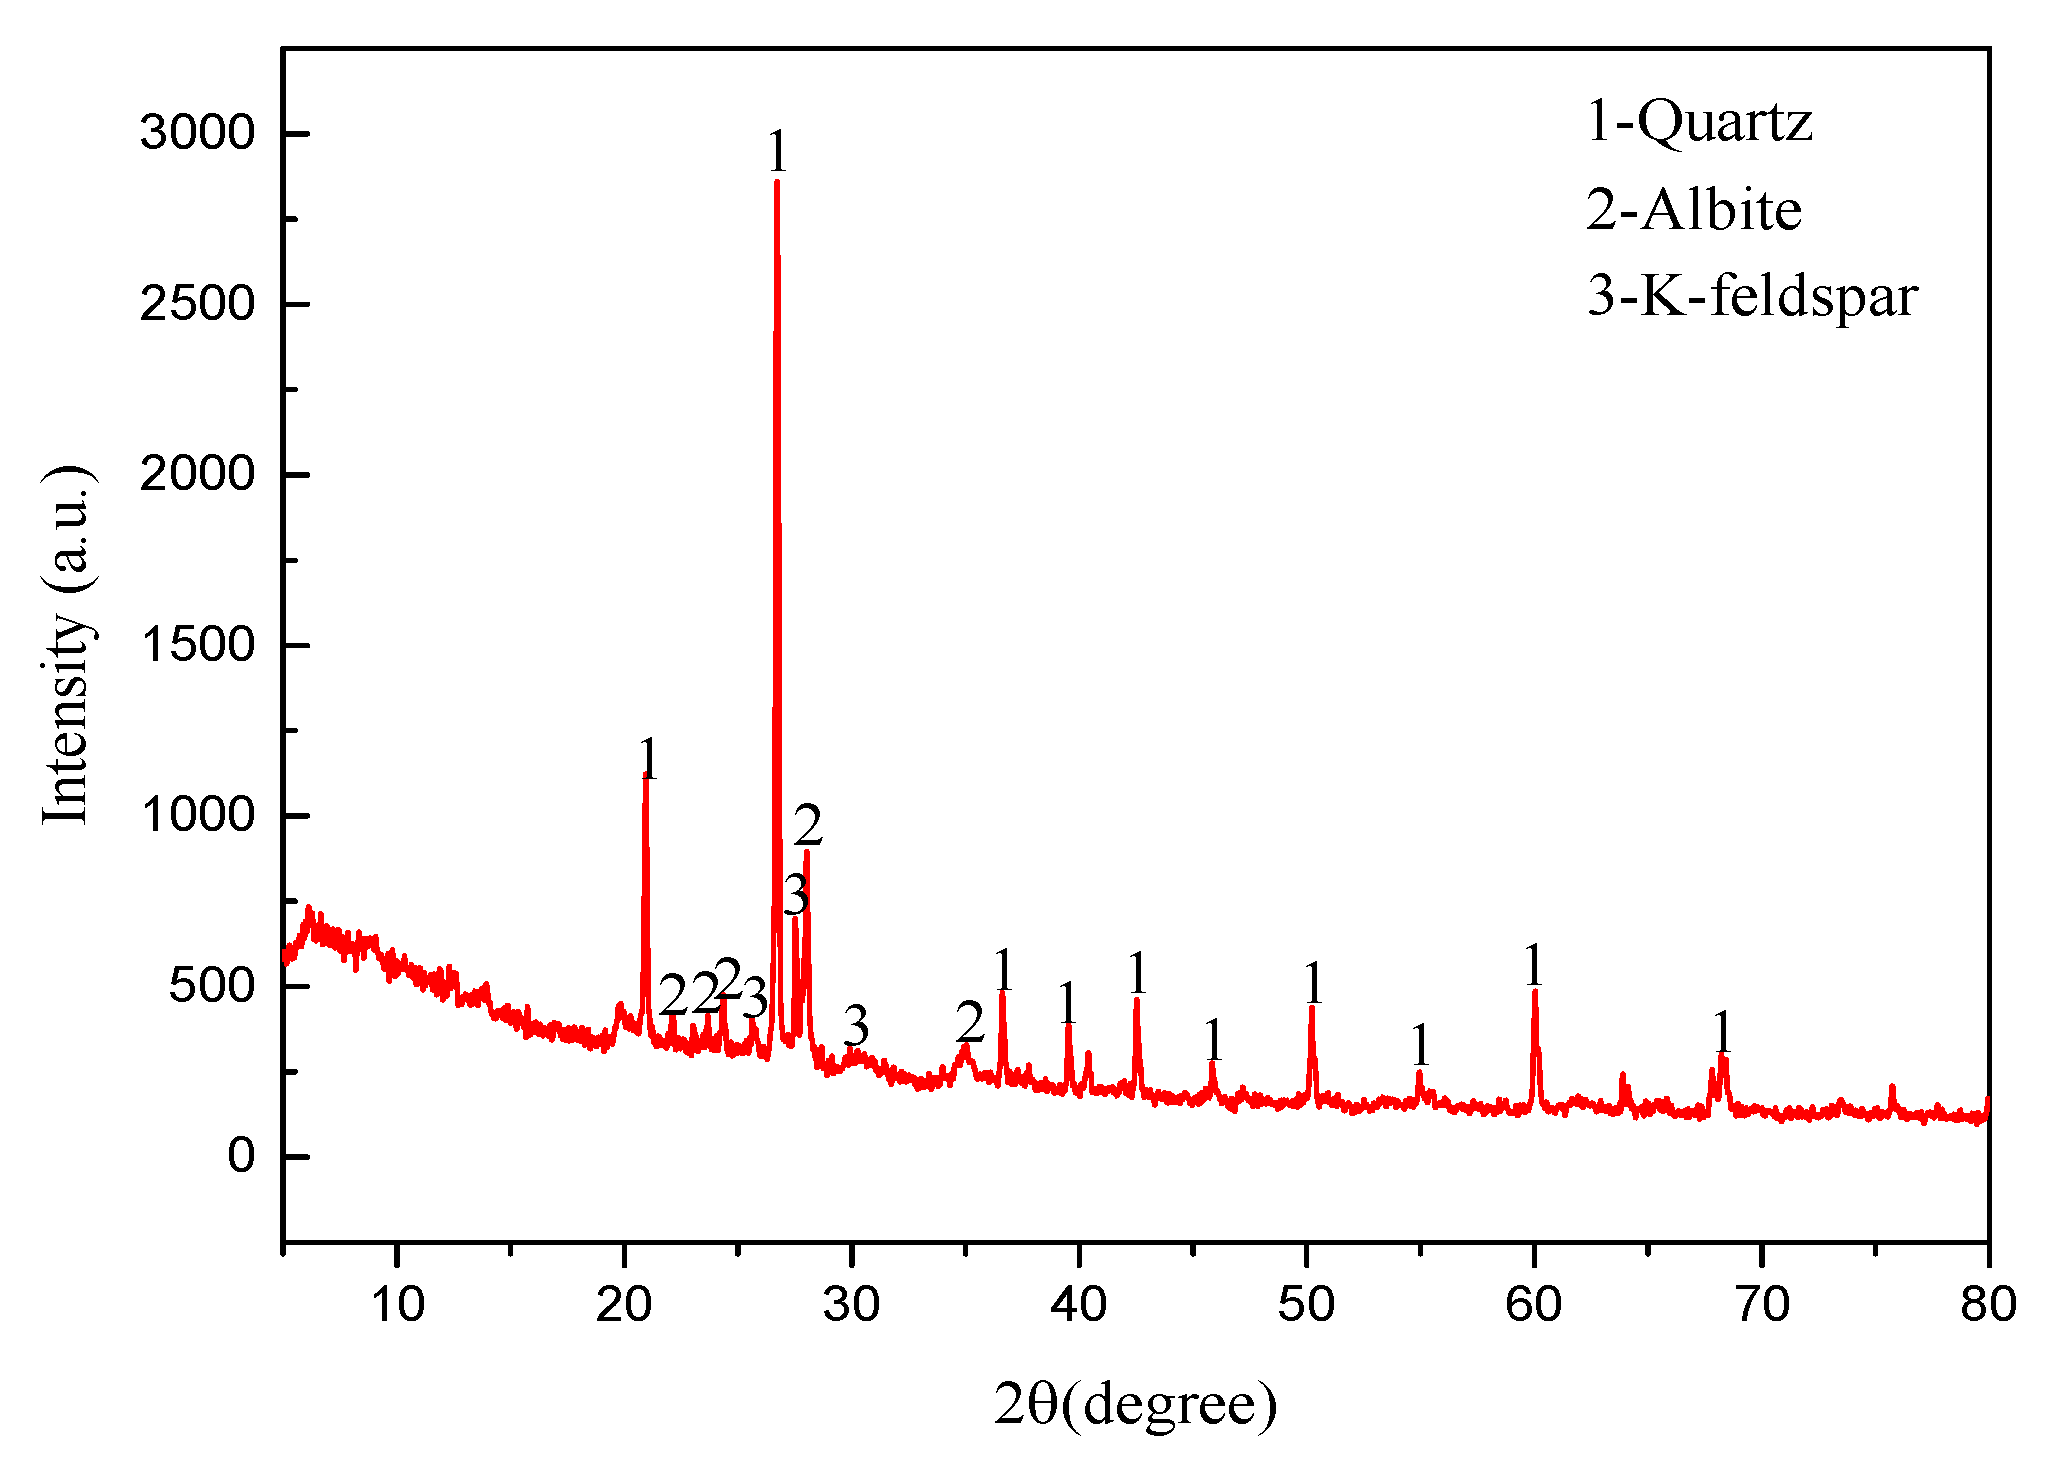
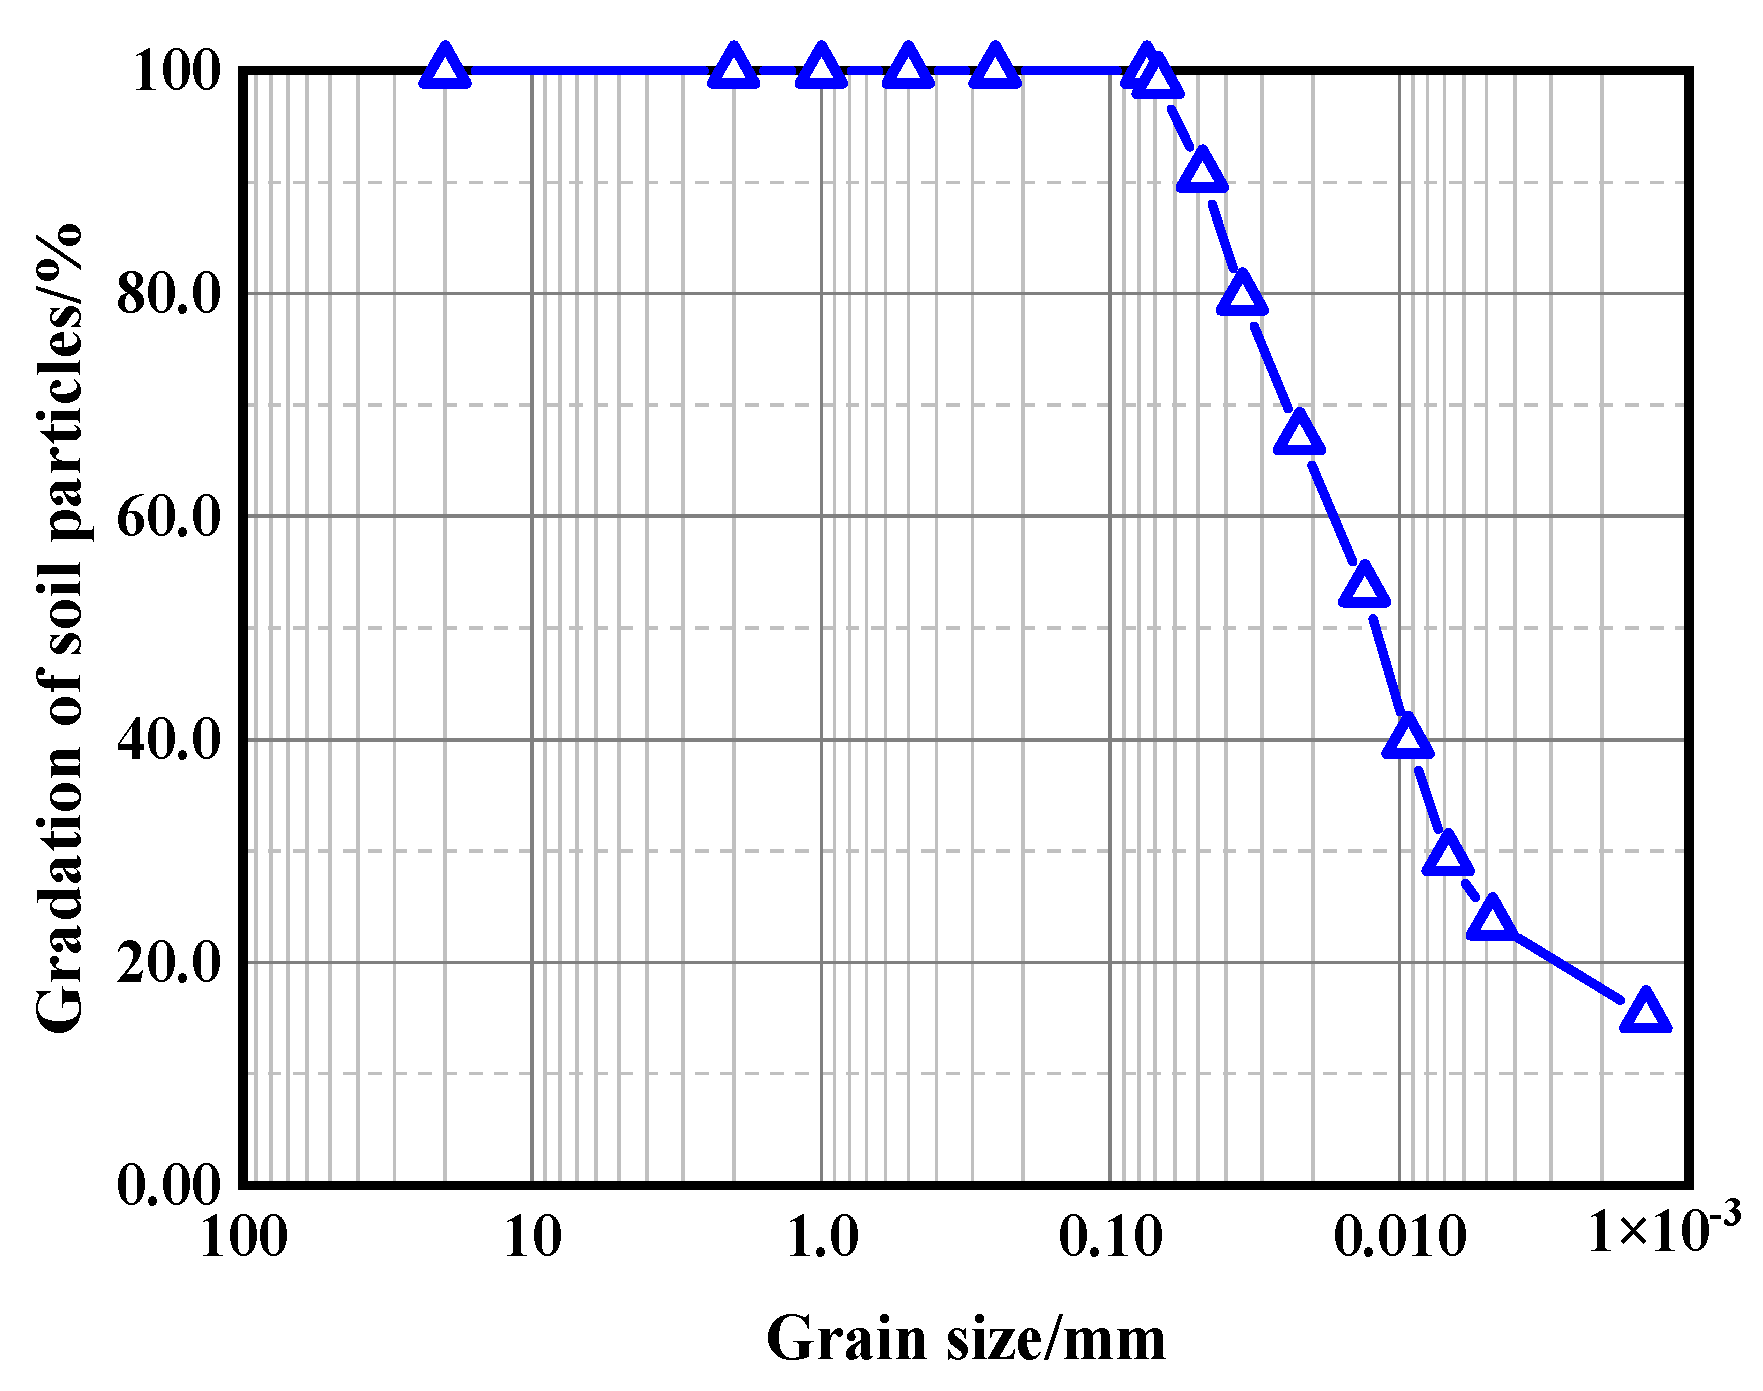
2.1.1. Soil Properties

The test soil was collected from a side slope in Changchun City, China, and its fundamental properties are listed in Table 1. Figure 1 shows the appearance of the test soil, and Figure 2 shows the original spectrum obtained in the XRD test. The primary components are quartz, sodium feldspar, and potassium feldspar. The grain particles are shown in Figure 3.

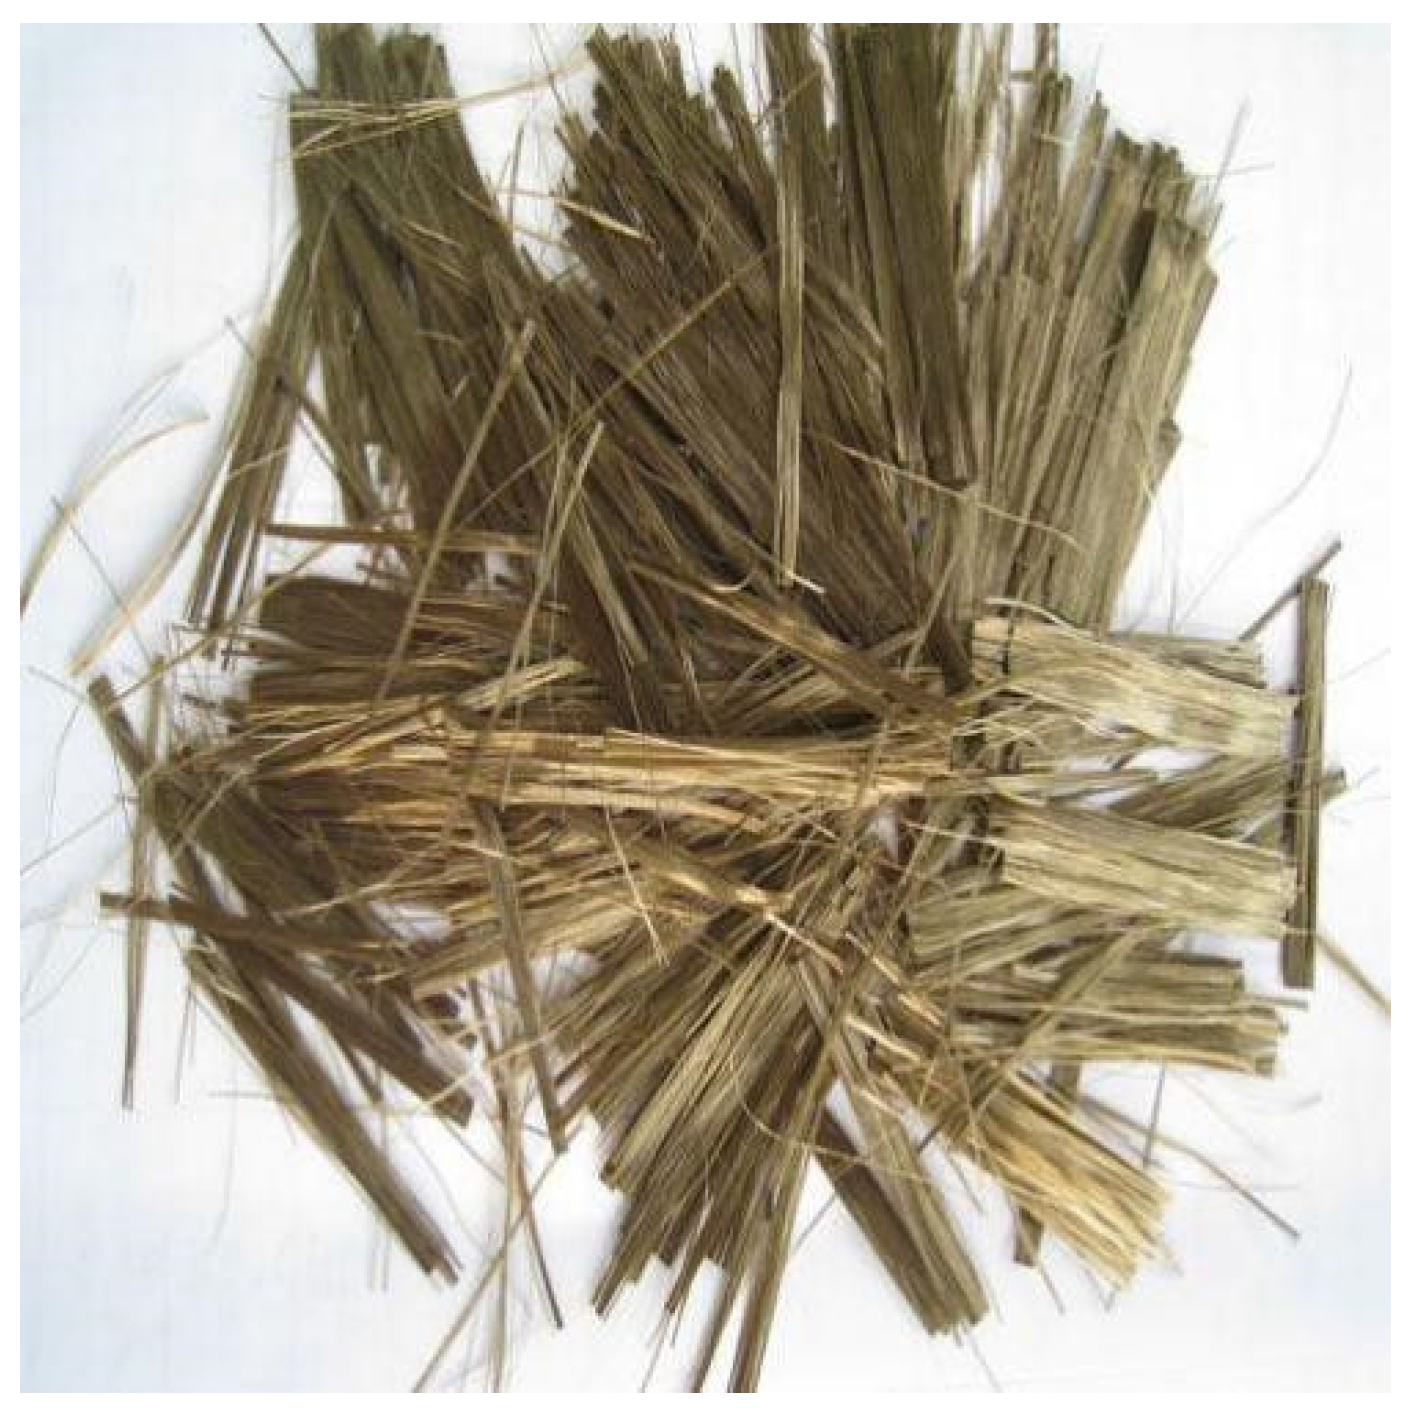
2.1.2. Basalt Fibers

The basic properties and composition of the basalt fibers are shown in Table 2 and Table 3. Figure 4 shows the appearance of the basalt fibers.

2.1.3. Cement

Ordinary Portland cement (grade 42.5), produced by the Changchun Yatai Group of China, was used as the cementitious material, and its basic properties are shown in Table 4.

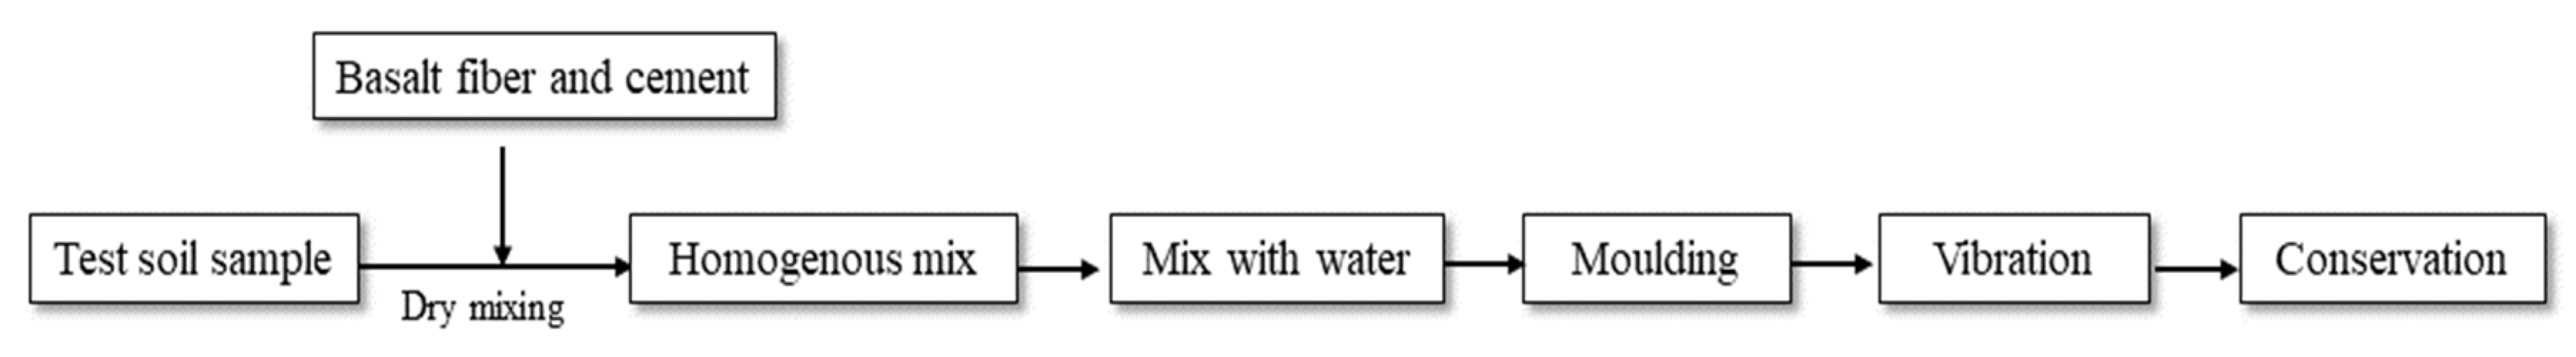
2.2. Specimen Preparation

Cubic specimens were prepared based on the JGJ/T233-2011 Specification for Mix Proportion Design of Cement Soil [28], with dimensions of 70.7 mm × 70.7 mm × 70.7 mm. The cement content was 10%. To produce the BFRCS specimens, basalt fibers, cement, and soil were mixed for 3 min. Water was then added, and the mixture was stirred for 6 min. Finally, the mixture was molded by 70.7 mm2 cubic molds and shaken for 3 min using a shaking table. The specimen preparation flowchart is shown in Figure 5.

2.3. Test Design

The mix designs of 21 groups of BFRCS are listed in Table 5, where C indicates the fiber content and L indicates the fiber length. For instance, C0.1-L20 indicates that the fiber content is 0.1% and the fiber length is 20 mm. Each group had three duplicate specimens to reduce the test errors.

2.4. Testing Apparatus and Procedure

The UCS test was performed with a WAW-600 microcomputer-controlled servo universal testing machine, produced by Changchun Kexin Testing Instruments in China, with displacement uniformity control and a loading speed of 0.1 mm/s. The acquisition of the UCS data was performed by using an automatic acquisition system matched with the WAW-600 universal testing machine, including the loads and displacements.

3. Experimental Results and Discussion

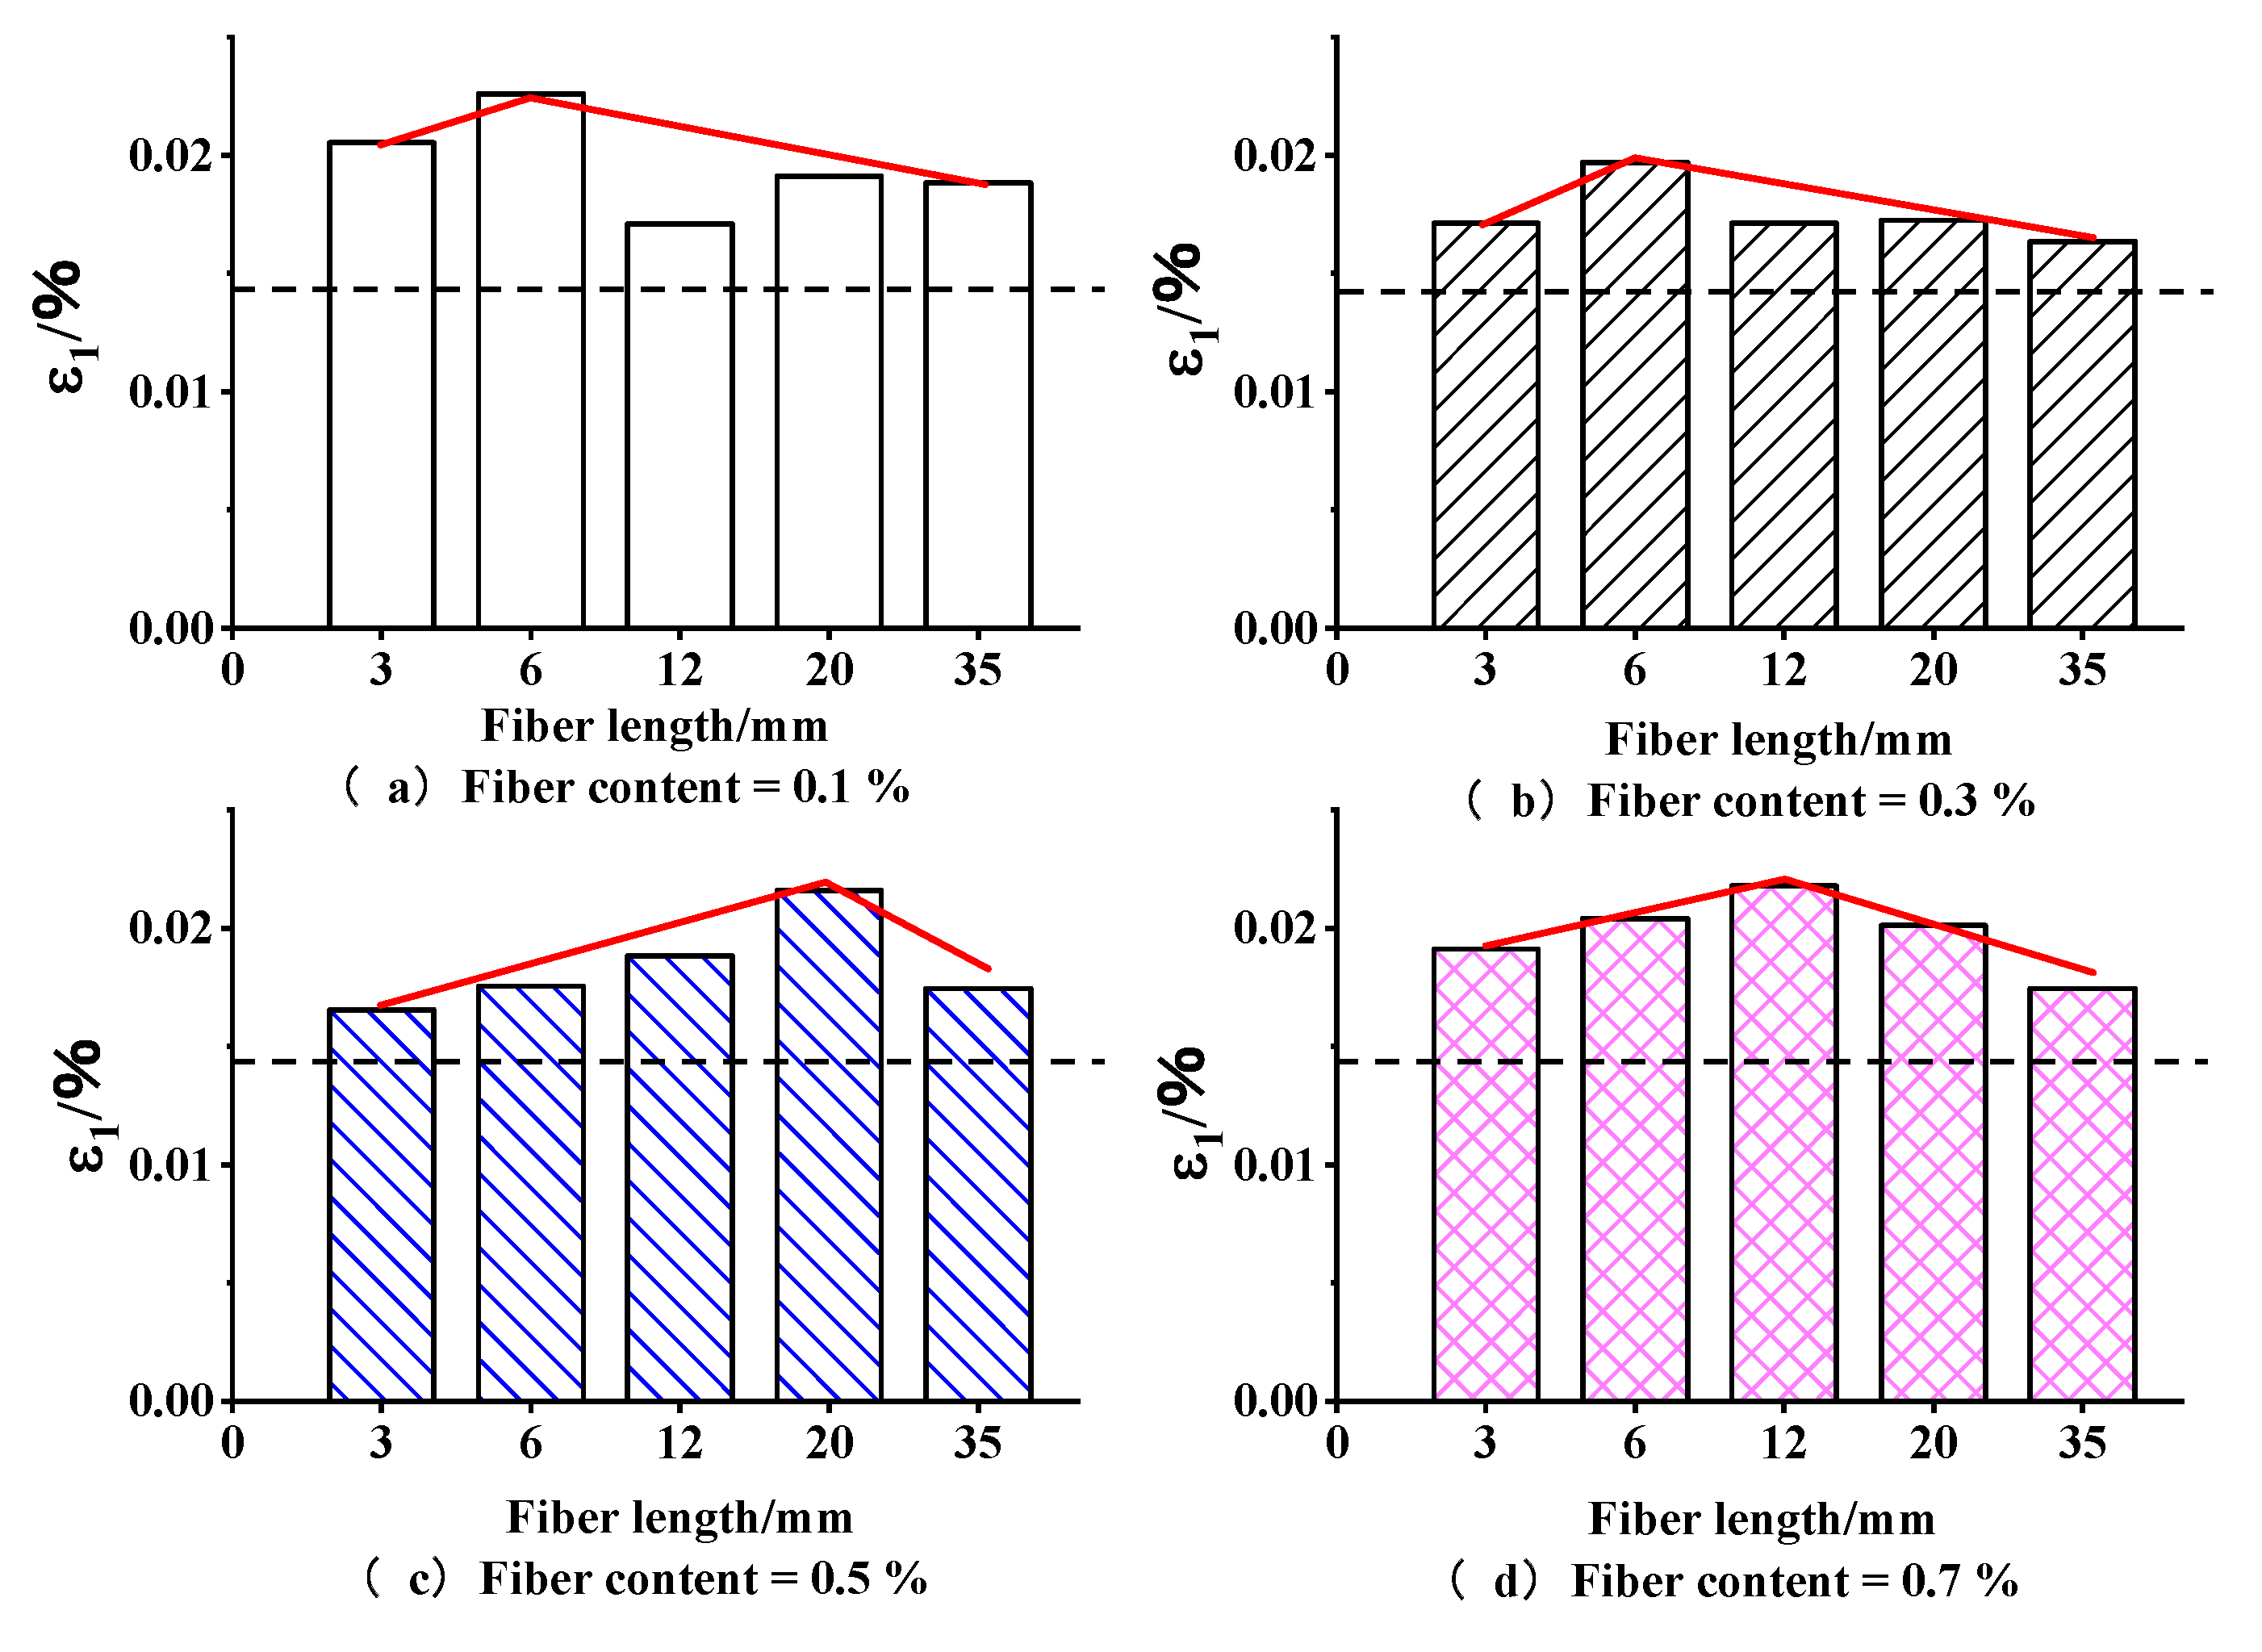
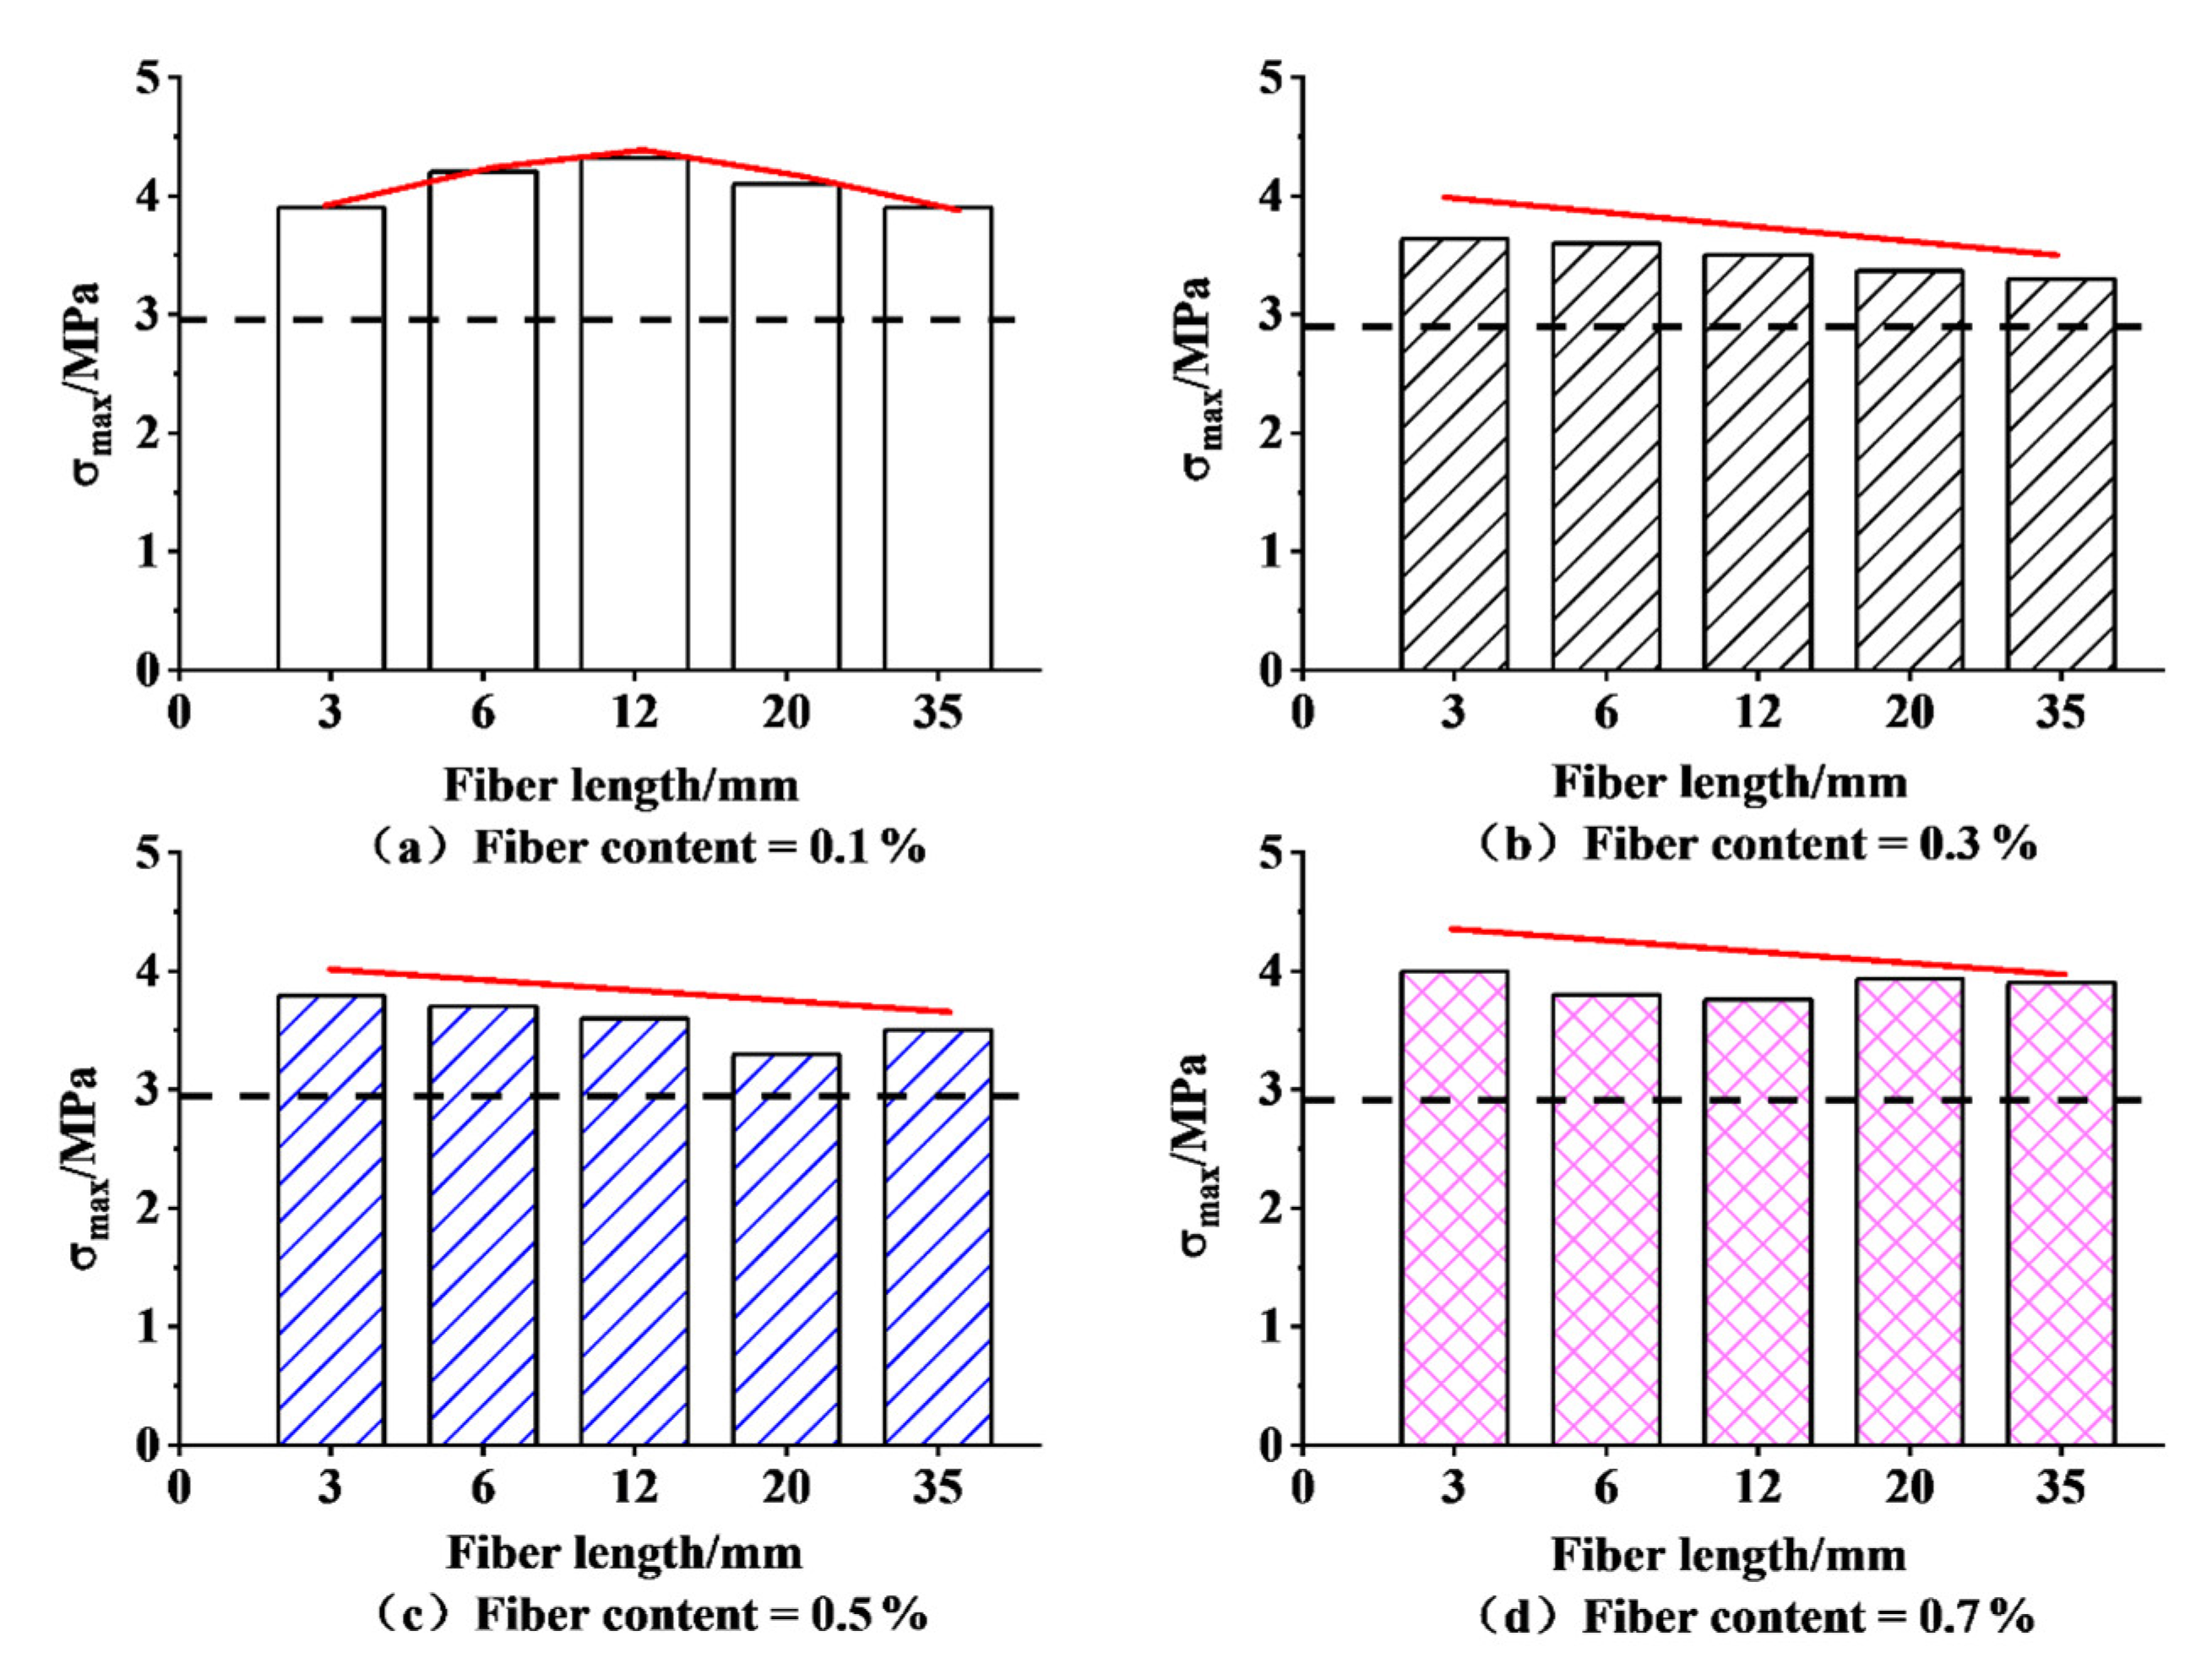
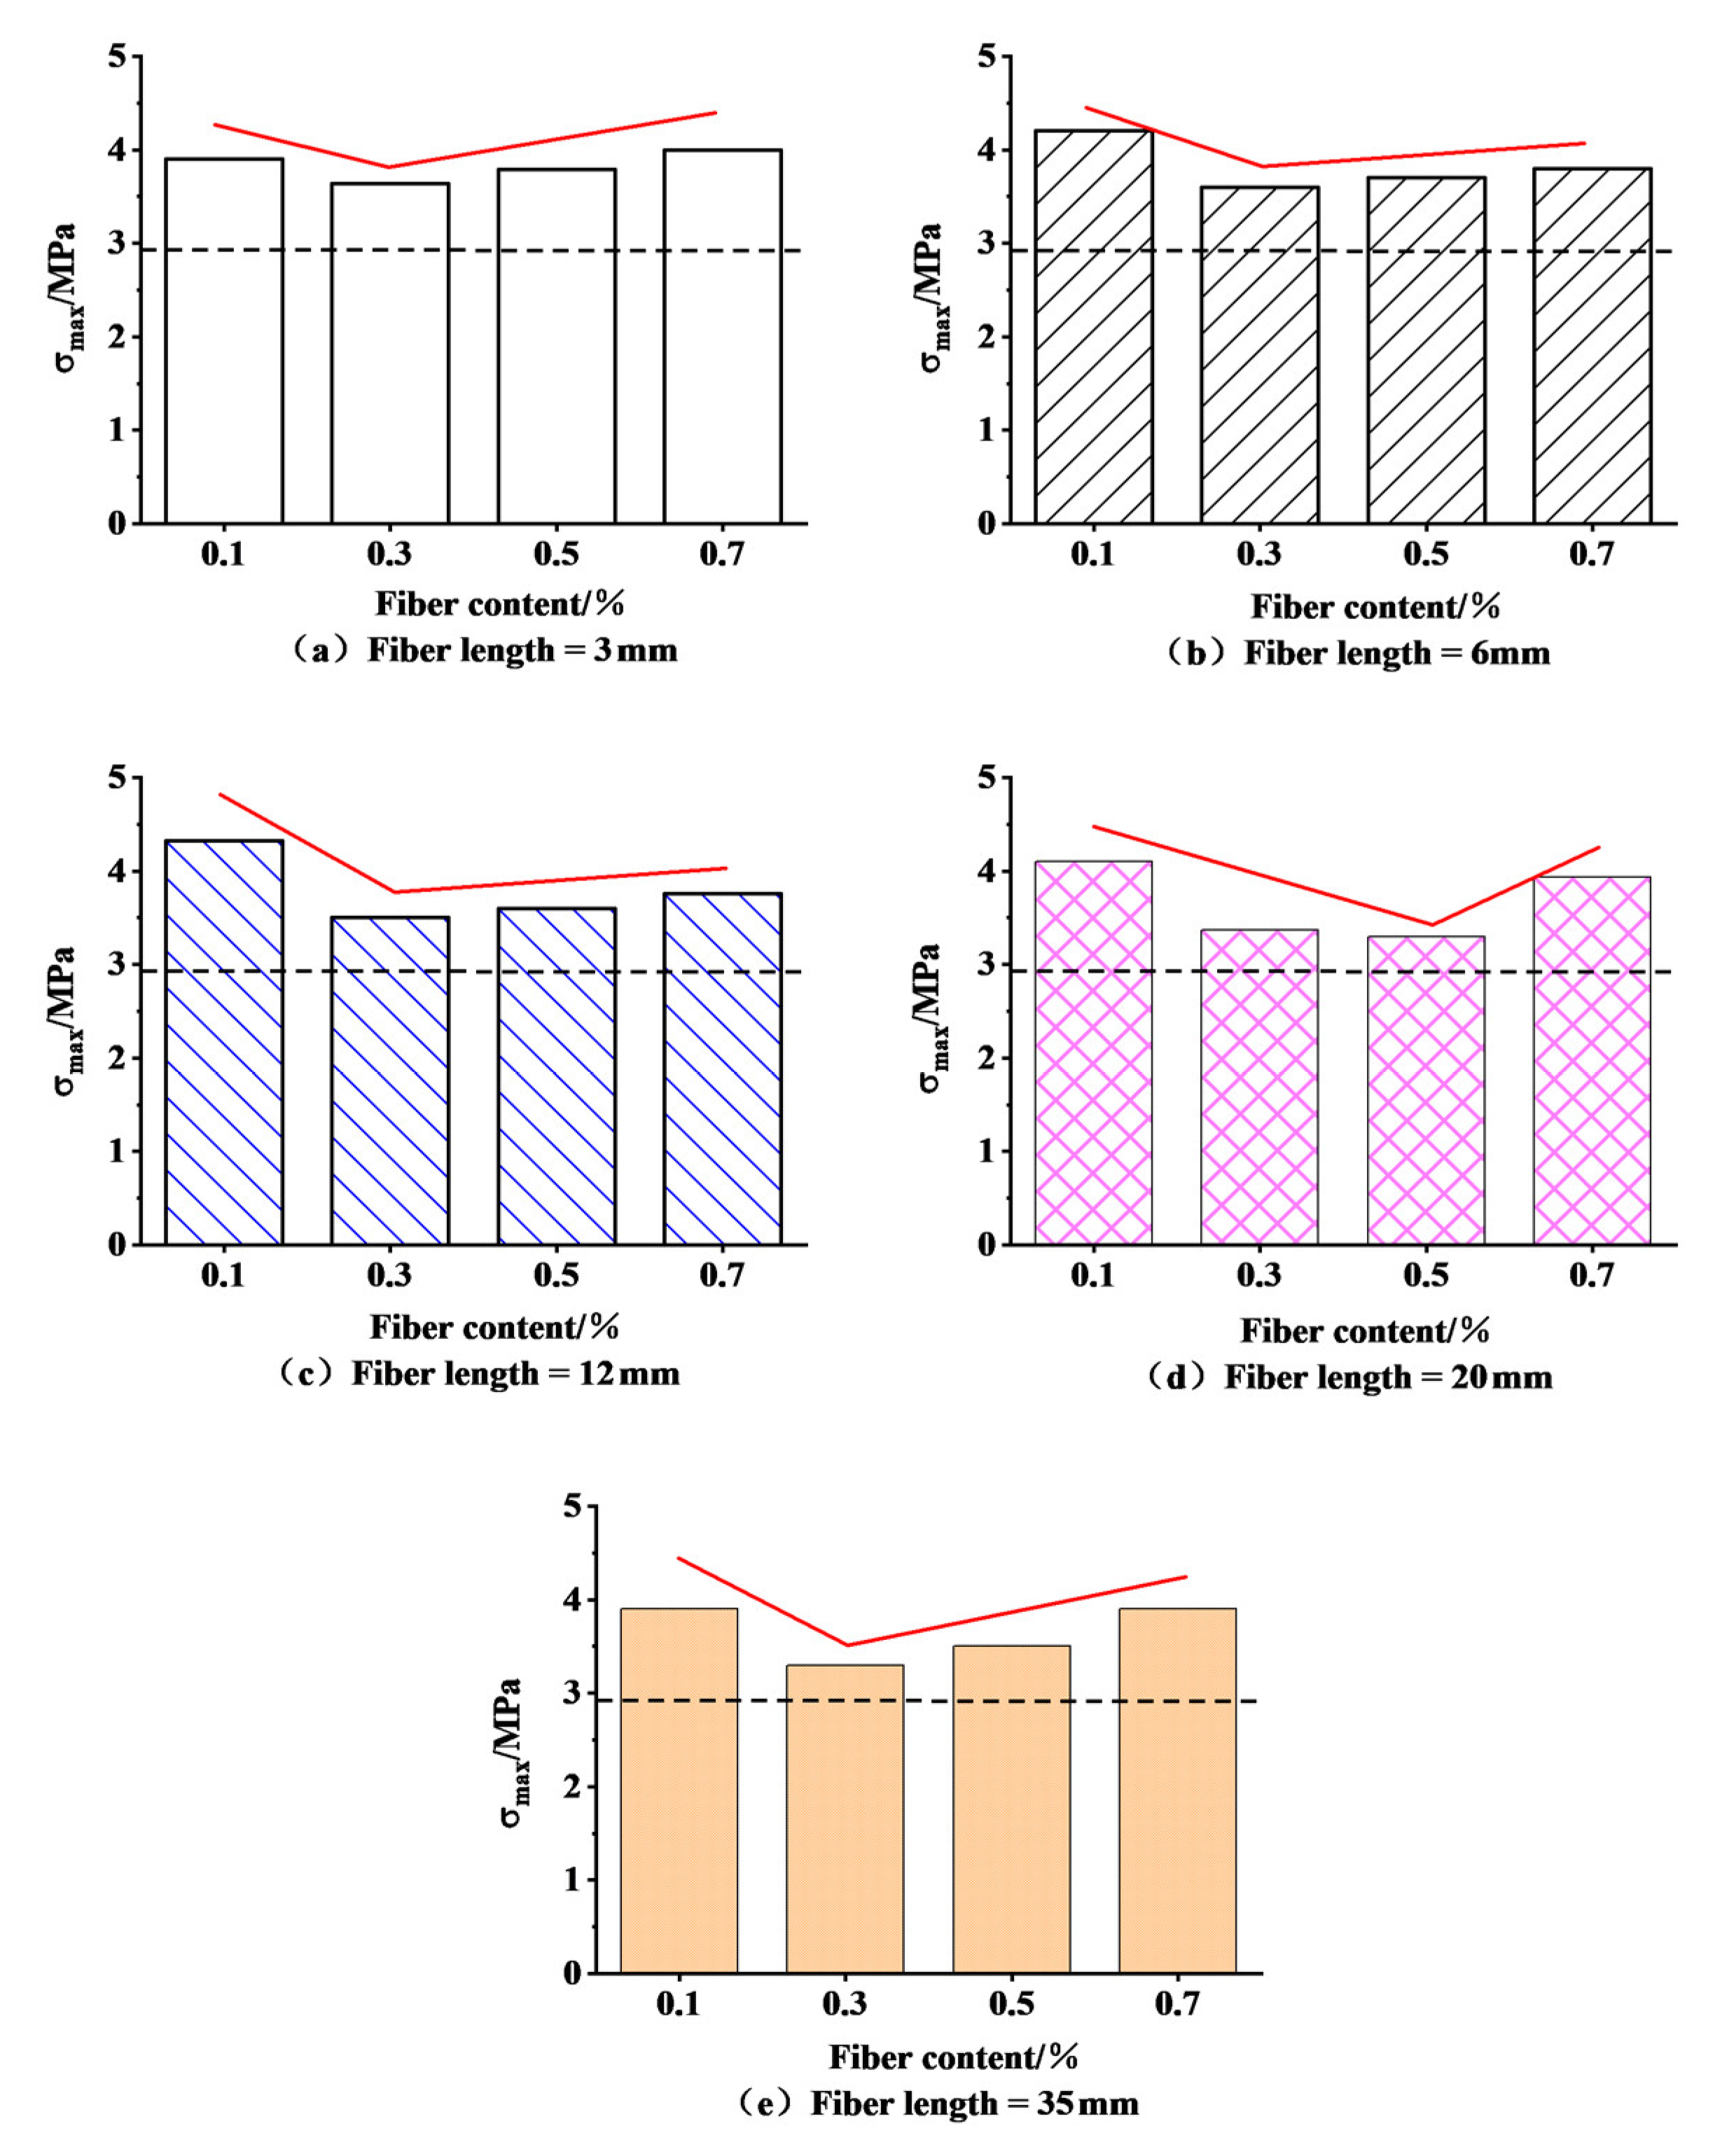
3.1. Effect of the Fiber Length on the Mechanical Properties

Damage strain is defined as the strain corresponding to the peak stress in the stress–strain curve (ε1). Figure 6a–d shows the variations in the damage strain versus the fiber length for the specimens with varying fiber contents, with the dashed line representing the value of the damage strain of the cemented soil without fibers. Figure 6 shows that the damage strain values of the specimens under different reinforcement conditions are higher than those of the specimens without fibers, indicating that the admixture of basalt fibers can improve the deformation resistance and toughness of the cemented soil. The damage strain curves tended to increase first and then decrease with an increase in the fiber length. The maximum value of the damage strain occurred in the case of the 6 mm fiber length, when the fiber contents were 0.1% and 0.3%, as well as the 20 and 12 mm fiber lengths, when the fiber contents were 0.5% and 0.7%. In conclusion, the damaged strain reached its maximum at a fiber content of 0.1% and a fiber length of 6 mm.
Considering the peak stress in the stress-strain curve as the peak strength ( σ m a x ) for analysis, Figure 7a–d illustrates the variations in the peak strength of the specimens with different fiber lengths and fiber contents. The dashed lines represent the cemented soil’s peak strengths without the addition of fibers. Figure 7 shows that the incorporation of basalt fibers can effectively increase the peak strengths of the specimens, and that the peak strengths of all of the specimens with fibers incorporated are greater than those of the specimens without fibers incorporated. The peak strength curves showed the tendency to decrease with an increase in the fiber length, except for a fiber content of 0.1%. The maximum peak strength values occurred in the case of the 3 mm fiber length, when the fiber contents were 0.3%, 0.5%, and 0.7%, and the 12 mm fiber length, when the fiber content was 0.1%. To sum up, the peak strength reached its maximum at a fiber content of 0.1% and a fiber length of 12 mm.

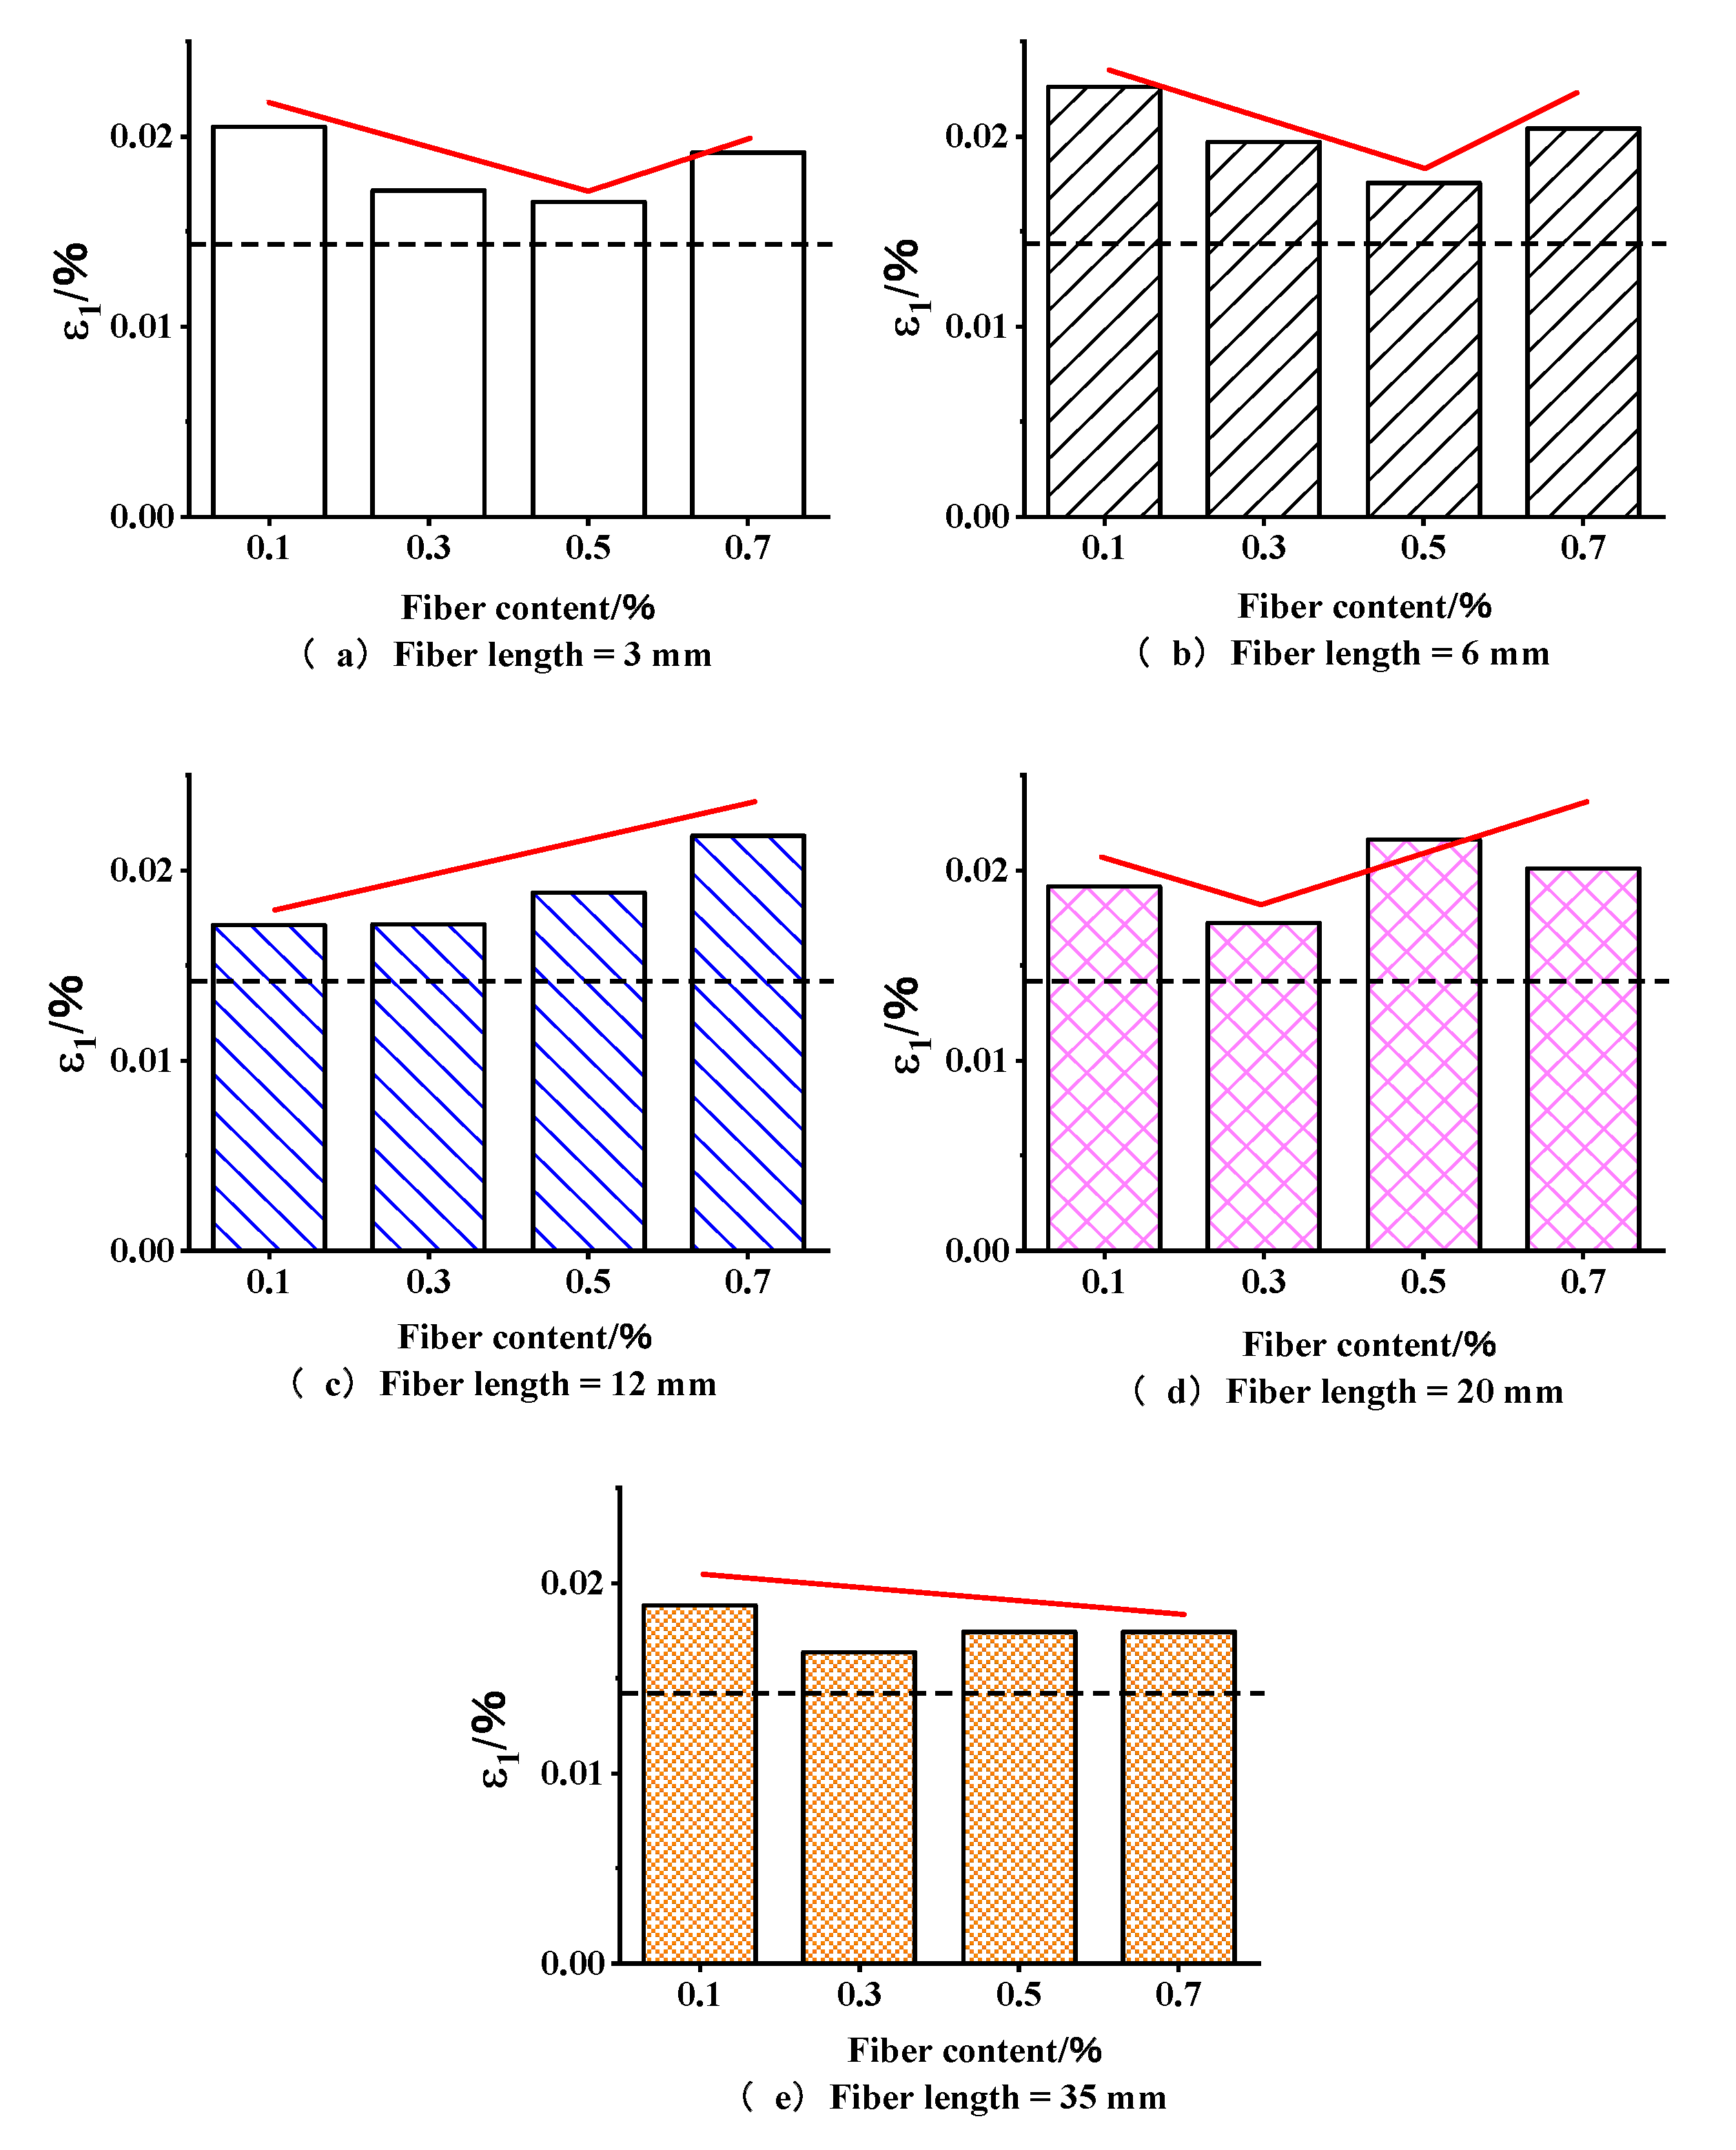
3.2. Effect of the Fiber Content on Mechanical Properties

Figure 8a–e shows the variations in the damage strains of the specimens with different fiber contents and fiber lengths. The dashed lines in the figure show the damage strain values of the cemented soil without the addition of fibers. From Figure 8, we can observe that the damage strain curves tended to decrease first and then increase with an increase in the fiber content when the fiber lengths were 3, 6, and 12 mm. Furthermore, when the fiber lengths were 12 and 35 mm the damage strain curves tended to linearly increase and linearly reduce. The tendencies of the damage strain curves for the individual fiber lengths are not identical.
Figure 9a–e shows the variations in the peak strength of the specimens with different fiber contents and fiber lengths. Figure 9 shows that the peak strengths tended to increase and then decrease with an increase in the fiber content for all the fiber lengths, while for all of the fiber lengths a fiber content of 0.1% resulted in the most noticeable improvement in the peak strength of BFRCS.

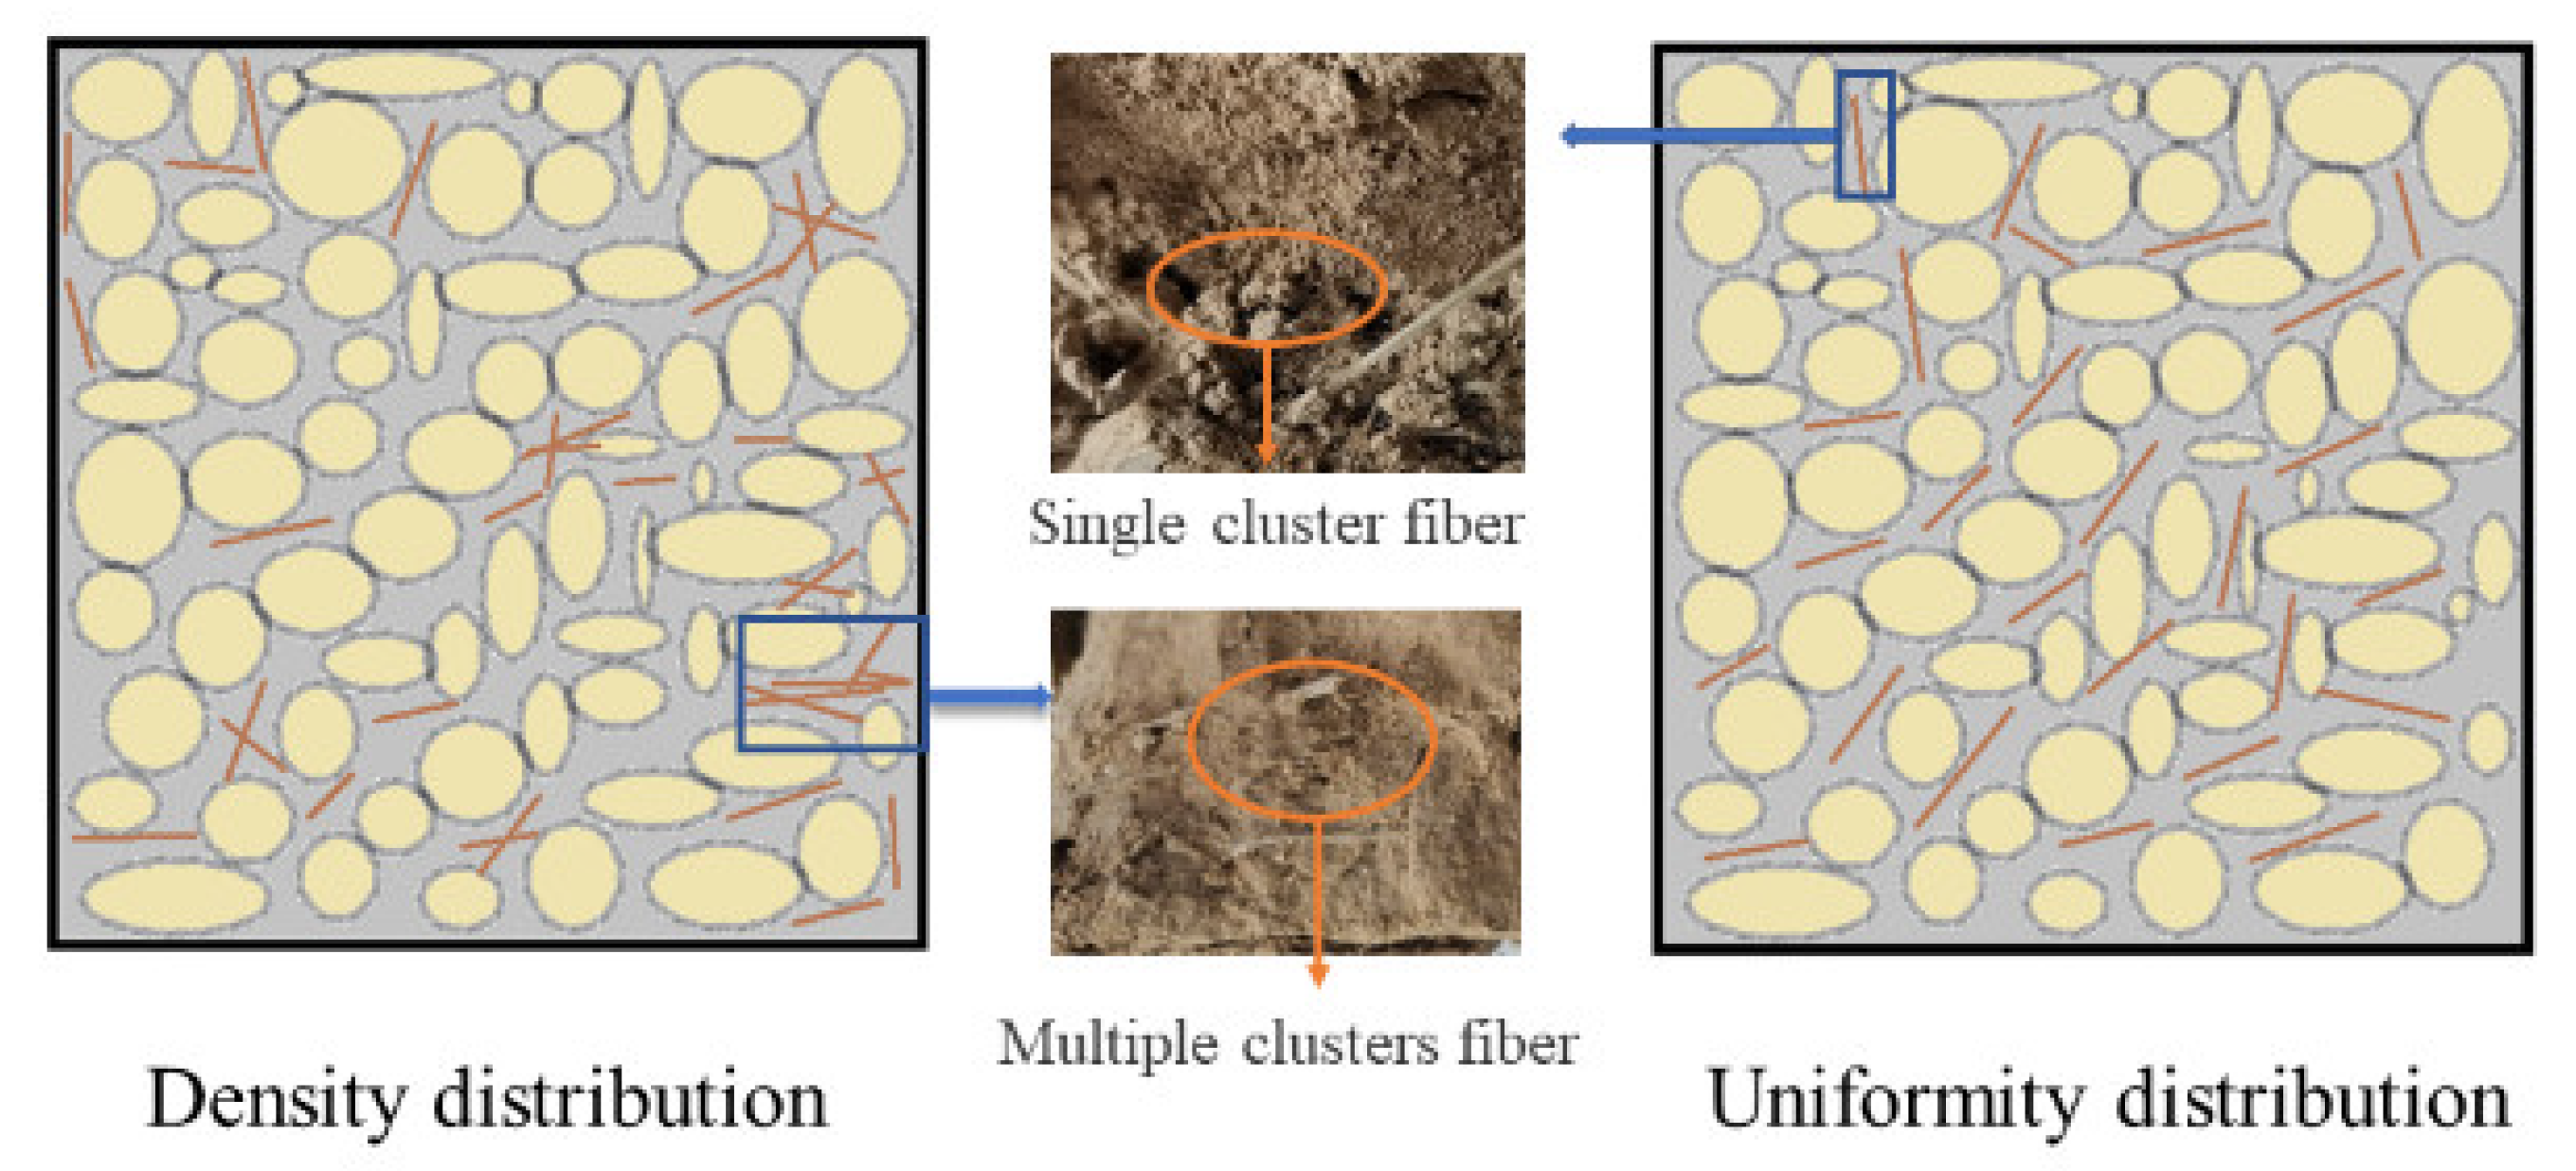
3.3. Reinforcement Mechanism of Fibers in Cemented Soil

The effect of the fiber material on cemented soil reinforcement primarily lies in the adhesion between fibers and cemented soil in addition to the distribution law of fibers, where the adhesion is related to the soil quality, particle gradation, cement content, conservation age, and other factors. Moreover, the distribution law of fibers is closely related to fiber length, content, and other factors. Furthermore, the observation of a loaded specimen reveals that the fibers in the specimen appear to be clustered. The distribution cannot be fully dispersed, and even fibers dispersed in filaments have an uneven distribution, as shown in Figure 10. From a microscopic perspective, constructing a BFRCS constitutive model becomes relatively complex and challenging in light of the complex fiber arrangement. Figure 10 shows that when the fiber density is too high the reinforcing effect is diminished by a mechanism similar to the anchor group effect, whereas it is difficult to exert a reinforcing effect when the density is too low. Therefore, a suitable fiber content, length, and arrangement can enhance the strength of BFRCS.

4. Damage-Theory-Based Constitutive Model

Damage mechanics is based on continuum mechanics, used to examine the laws of solid materials under certain loads and in erosive environments, according to which materials that develop damage will eventually undergo the destruction process. Statistical damage mechanics assumes that the degree of microelement damage within a material follows a probability density distribution, based on which the damage of the material is described. Because the integral distribution function of the Weibull distribution is easy to integrate, its mean value is greater than 0, etc. [29,30], the Weibull distribution is widely used in the description of rock and concrete materials [31,32,33,34]. This paper’s statistical damage model of BFRCS is based on the following fundamental postulates [35]:
  • The number of damaged microelements in relation to the pore area and effective bearing area of BFRCS obeys the Weibull distribution.
  • Under the action of an external load, the material comprises damaged and undamaged parts; the undamaged part bears the load on any microelements of the material.
  • The damage evolution of microelements during loading is a continuously changing process.
  • The material is an isotropic damage material, and the stress-strain relationship of undamaged microelements is in accordance with Hooke’s law.

4.1. Establishment of the Constitutive Model

Under the load, the damage in BFRCS gradually increases and expands, leading to changes in the effective bearing area and internal damage area of BFRCS. According to the pertinent theory of damage mechanics [36], the nominal stress and effective stress of BFRCS satisfy the following relationship:
σ = F A
σ * = F A *
where   σ is the nominal stress of BFRCS (MPa), σ   * is the effective stress of BFRCS (MPa), A is the nominal bearing area (mm2), A   * is the effective bearing area (mm2), and F is the load on BFRCS (N).
The relationship between the two kinds of stress can be determined from the above two equations as follows:
σ σ * = A * A
For BFRCS, the concept of a damage variable can be used to express the degree of internal damage, to which the damage variable D can be introduced to express the ratio of the internal damage area to the total load-bearing area:
D = A A   * A = 1 A * A
The above equation contains D   as its damage variable, 0 ≤ D ≤ 1, and its core is the ratio of the damaged area to the total area, which provides a parameter for the subsequent damage level.
Substituting Equation (4) into Equation (3) yields Equation (5), as follows:
σ = 1 D σ   *
According to the Lemaitre strain equivalence hypothesis [37], the intrinsic relationship of the damaged material can be expressed in terms of the stresses borne by the undamaged part of the material. Therefore,
σ = 1 D E ε
where   σ is the stress to which BFRCS is subjected (MPa), D is the damage variable of BFRCS (0 ≤ D ≤ 1), E is the modulus of elasticity of BFRCS, and ε is the strain of BFRCS.

4.2. Calculation of the Damage Variables at Different Stages

As shown in Figure 11, according to the stress–strain curve of BFRCS, the stress damage process is divided into two stages: the compression stage and damage stage. In the compression stage, with an increase in the strain, the main damage that affects the material is destruction of the pore structure by compression, and the pore unit of BFRCS decreases with an increase in the strain. In the damage phase, the main damage in the soil is the compression of the structural units, and the structural units of BFRCS decrease with an increase in the strain.

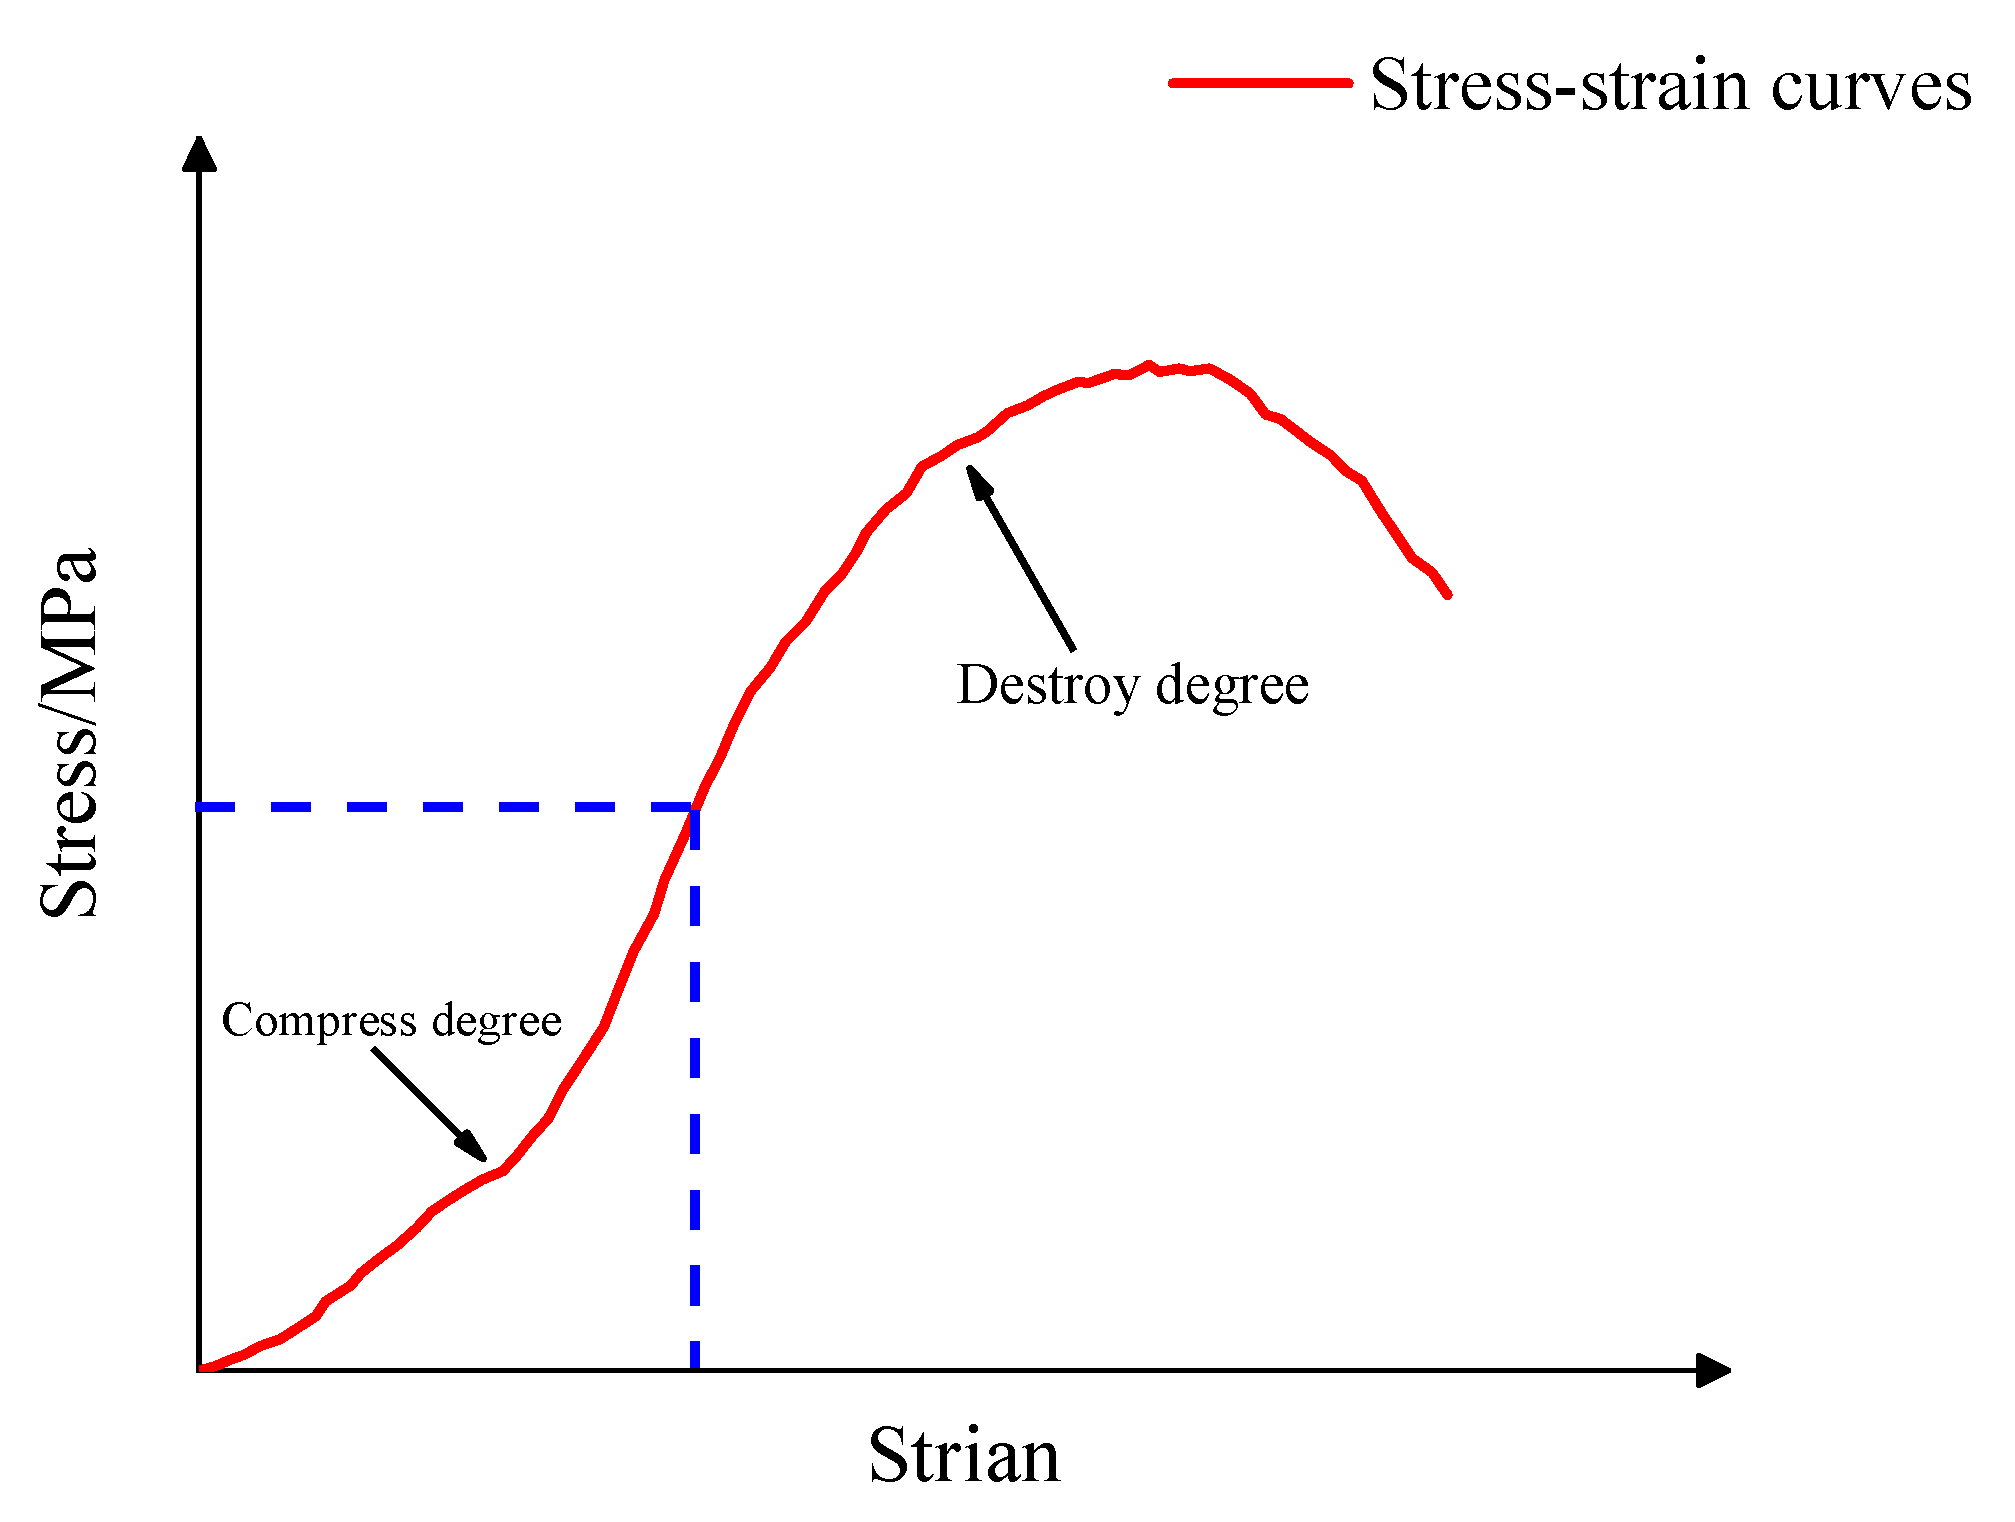
4.3. Calculation of the Damage Variables in the Compression Phase

According to statistical damage mechanics, BFRCS materials can be approximated as structural systems composed of a large number of microelements. Furthermore, in the present study [38], where the degree of damage of BFRCS can be expressed as the ratio of the number of pore microelements to the total number of microelements, it was assumed that, with an increase in strain, a proportion of the initial pores in BFRCS would be destroyed during the compression, and that the damage phases would follow the Weibull distribution as the displacement increased. Thus, Equation (7) can be derived as follows:
p ε = n m ε m n 1 e ε m n
where   p ε is the Weibull probability density function, m and n are the scale parameter and shape parameter of the Weibull distribution, respectively, and ε is the strain variable.
With an increase in displacement, N is the number of damaged microelements in the pore microelements. The number of damaged microelements in BFRCS is shown as follows:
N = 0 ε 1 N t p ε d ε = N t 1 e ε m n
In this case, by defining the total number of microelements as M , the number of pore microelements is   N t . The damage effect, at this time, is believed to be much less than the effect of compression; therefore, the effect of compression is primarily considered. Since the compression stage basically occurs in the early low-strain stage, it is believed that its effect on the total number of units is negligible.
Let the initial damage factor be   D 0 . Then:
D 0 = N t M
Then, from the definition of the damage variable of statistical damage mechanics, it is clear that the damage variable of BFRCS is the ratio of the number of damaged microelements to the total number of microelements. The damage coefficient in the compression phase is as follows:
D = N t N M = e ε m n N t M = e ε m n D 0
From Equations (6) and (10), we yield the following:
σ = E ε 1 D 0 e ε m n

4.4. Calculation of the Damage Variables in the Damage Phase

With an increase in deformation, the proportion of the solid unit damage in BFRCS follows the Weibull distribution as the displacement increases during the compression and elastic phases, and the following equation can be obtained:
p 1 ε = n 1 m 1 ε m 1 n 1 1 e ε m 1 n 1
where p 1 ε is the Weibull probability density function, m 1   and n 1 are the scale and shape parameters of the Weibull distribution, respectively, and ε is the strain variable.
Let M be the total number of microelements and N 1 be the number of microelements that are damaged. It is believed that the damage phase is present from the start, but in the early stage its influence is negligible and in the late stage it is pronounced. Thus, the integration based on the deformation of 0 yields the following equation:
N 1 = 0 ε M p ε d ε = M 1 e ε m 1 n 1
Then, from the definition of the damage variable of statistical damage mechanics, it is clear that the damage variable of BFRCS is, at the same time, the ratio of the number of damaged microelements to the total number of microelements. Thus, the damage coefficient of the damage phase is as follows:
D = N 1 M = 1 e ε m 1 n 1
From Equations (6) and (14), we yield the following:
σ = E ε e ε m 1 n 1
Combining Equations (10) and (15), the following Equation (16) can be obtained:
σ = E ε ( 1 D 0 e ε m n )   0 ε < ε 0 σ = E ε ( e ε m 1 n 1 )   ε 0 ε
Equation (16) is the damage model for BFRCS, where E is the modulus of elasticity of BFRCS, D 0 is the initial damage coefficient of BFRCS, ε 0 is the strain value for the transition from the compression phase to the damage phase, ε is the strain of BFRCS, and σ is the UCS of BFRCS.
The values of the parameters are m = 0.0082, m1 = 0.0233, n = 1.92, and n1 = 1.49 when the fiber content is 0. Based on Equation (16), the regression calculation of the stress–strain curve of BFRCS can be obtained by using the constitution model, as the parameters m, n, m1, and n1 vary with the fiber length, L, and the fiber content, C, as shown in Table 6 below.

5. Results and Discussion

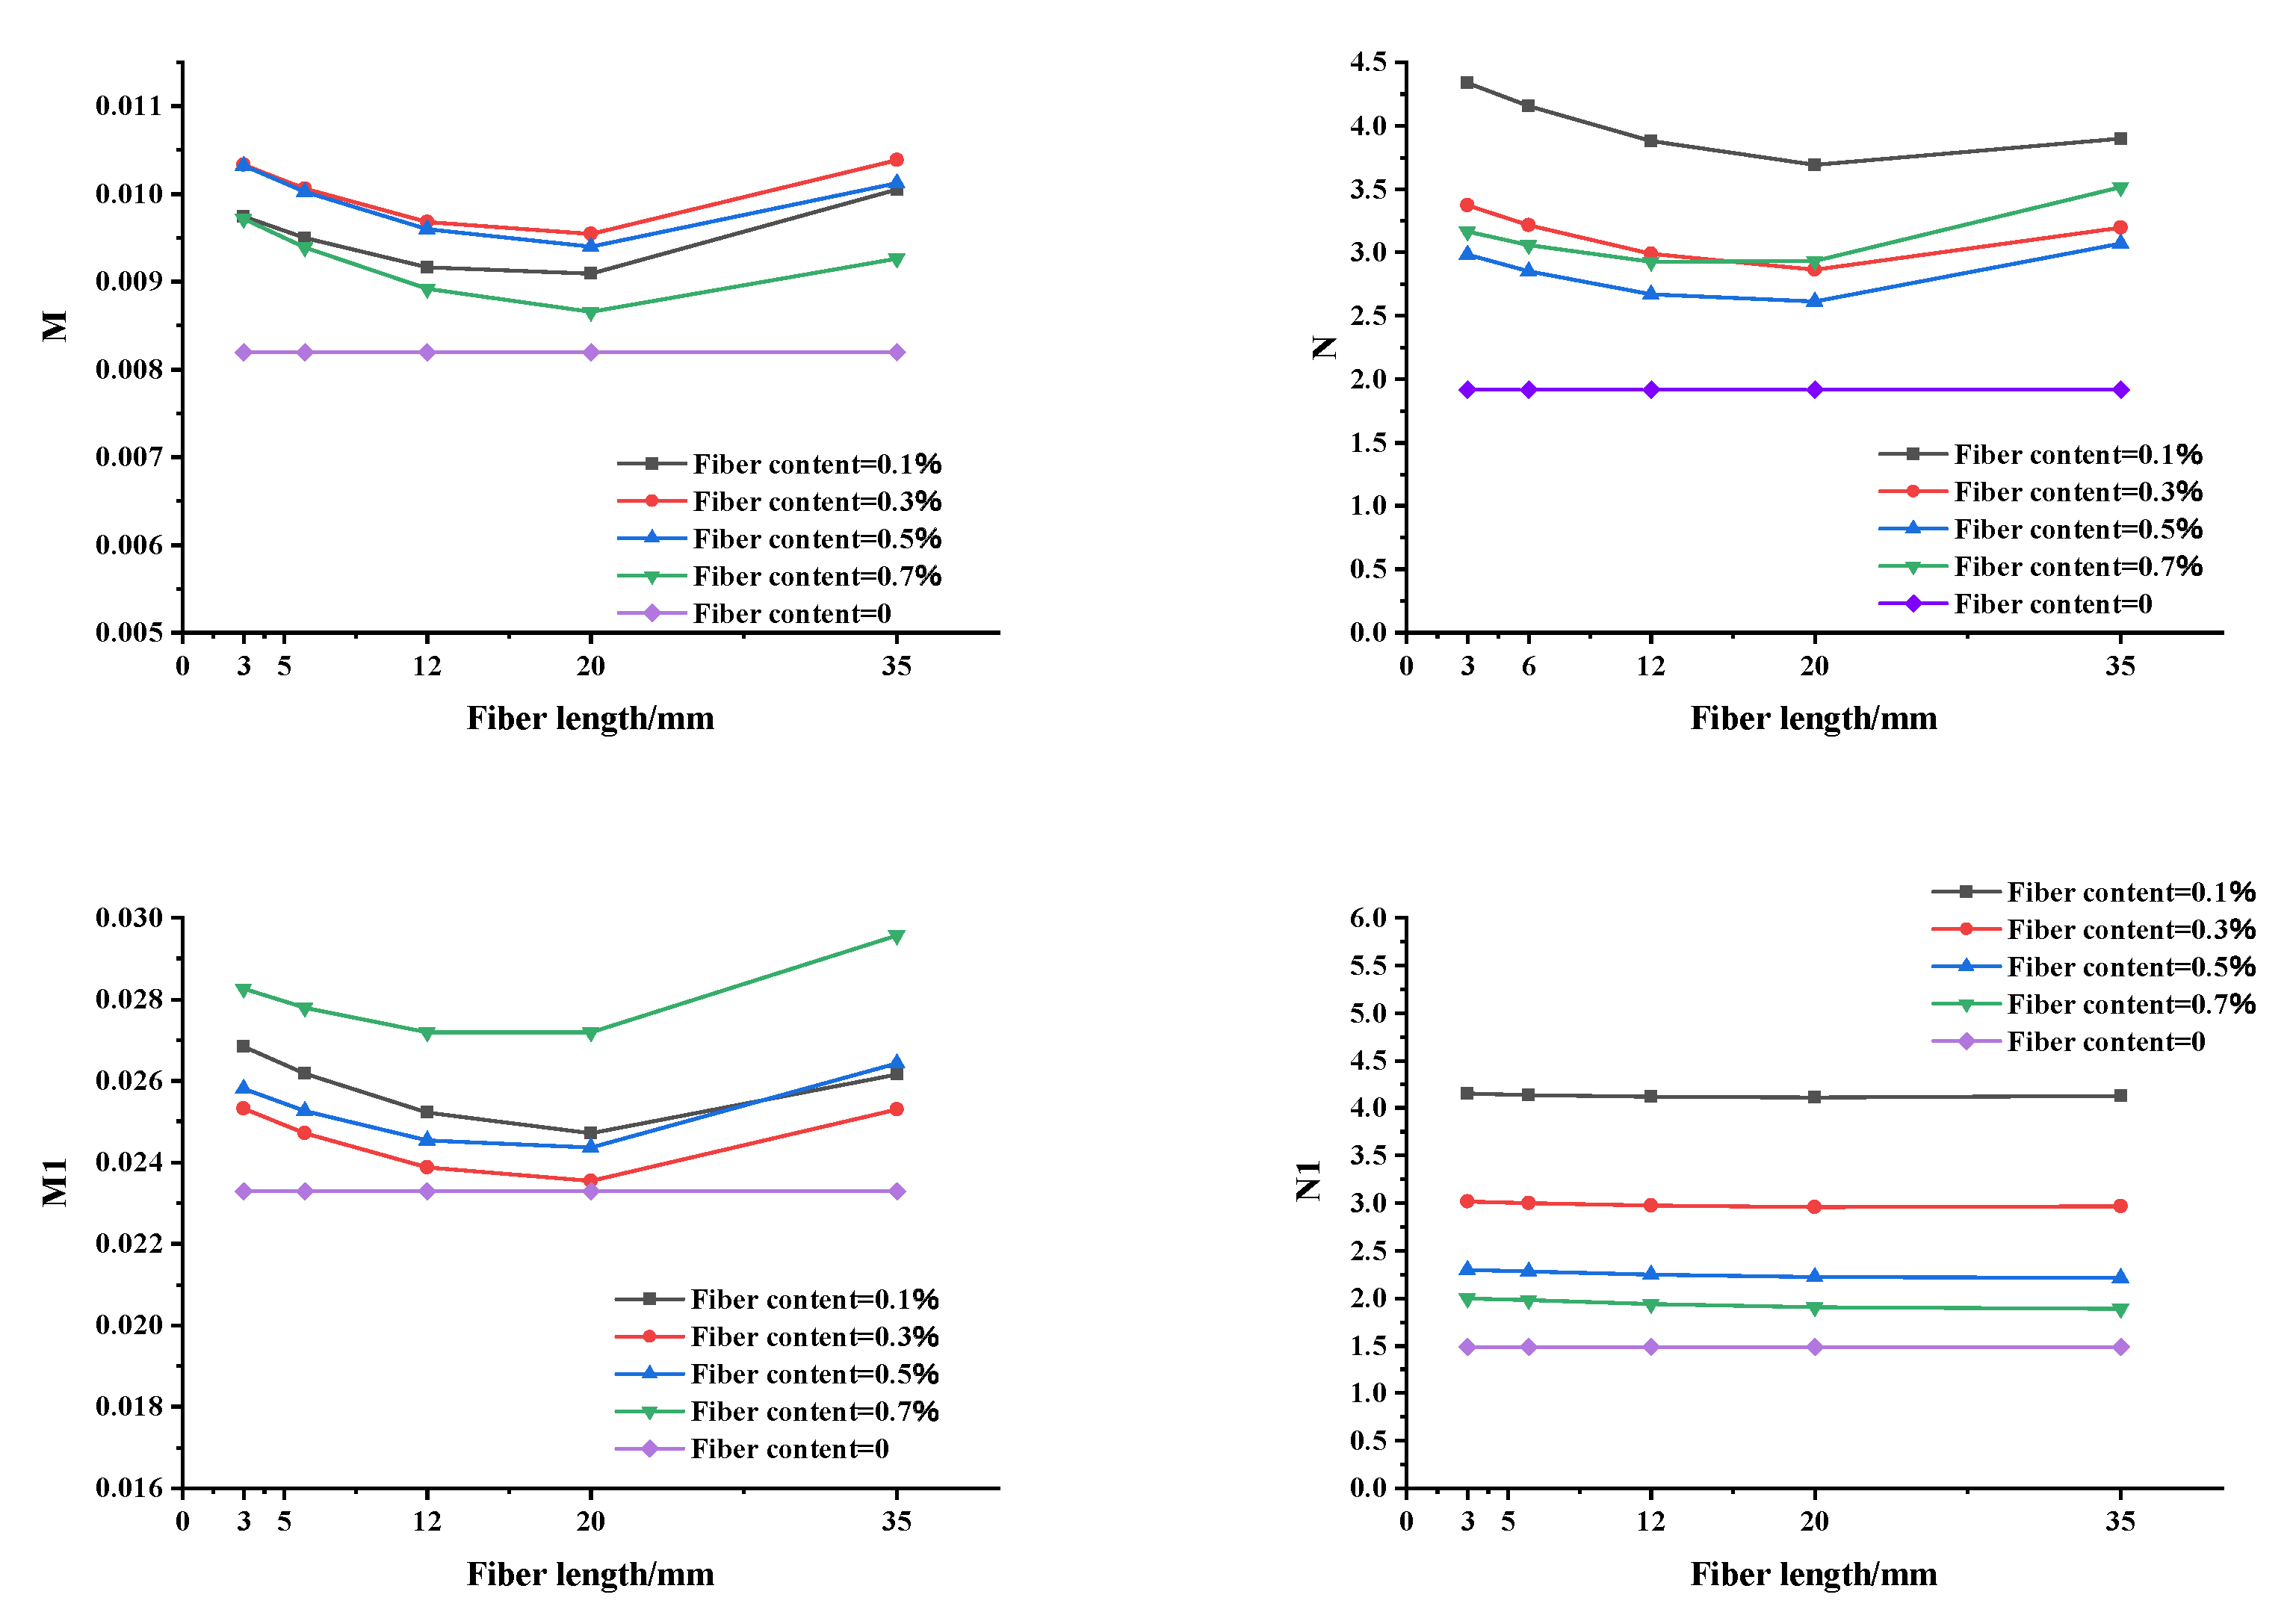
5.1. Weibull Parameters

Figure 12 shows the results of the scale parameters and shape parameters, m, n, m1, and n1, at different stages according to the fiber content and fiber length. When the specimen is in the compression stage, m and n both increase and then decrease with an increase in the fiber content, while they first decrease and then increase with an increase in the fiber length. When the specimen is in the damage stage, m1 decreases and then increases with an increase in the fiber content and fiber length, and n1 decreases with the increase in the fiber content, while the effect of the fiber length is insignificant.
Early research viewed the scale and shape parameters primarily as parameters that influence and determine the variations in their model curves, but their physical significance was not fully understood. Some studies reported that the shape parameters n and n1 reflect the degree of concentration of the internal microelement strength [39]. According to the analysis reported in this paper, n and n1 are characterized by the brittleness of BFRCS. In the process of compressive deformation, the smaller the values of n and n1 are the more concentrated the microelemental strength of the material will be. The material will be more brittle, and the arc of the curve between the compression and destruction stages of the loading process, on the one hand, and between the obvious compression and destruction stages, on the other hand, will be larger. The parameters m and m1 represent the material’s strength at a particular level.
The results of the analysis indicate that the addition of basalt fibers can effectively reduce the stress concentration of the material, which improves the material’s brittleness and enhances its average strength, its plastic deformation capacity under an external load, and its bearing capacity after the peak stress. These improvements are influenced by the coupling of the fiber length and fiber content. It can be seen from the relationship between Weibull’s shape parameters, n and n1, and the fiber content as well as length that the main factors affecting the brittleness of BFRCS in the compression stage are the fiber content and fiber length. Moreover, the main factor affecting the brittleness of BFRCS in the damage stage is the fiber content, while the influence of the fiber length is not evident; the size parameters m and m1 are jointly influenced by the fiber content and fiber length. As per the results of the overall analysis, the dimensional and shape parameters are excellent at a content of 0.1%, indicating the superior overall performance and confirming the conclusion of the previous analysis that 0.1% is the optimal content.

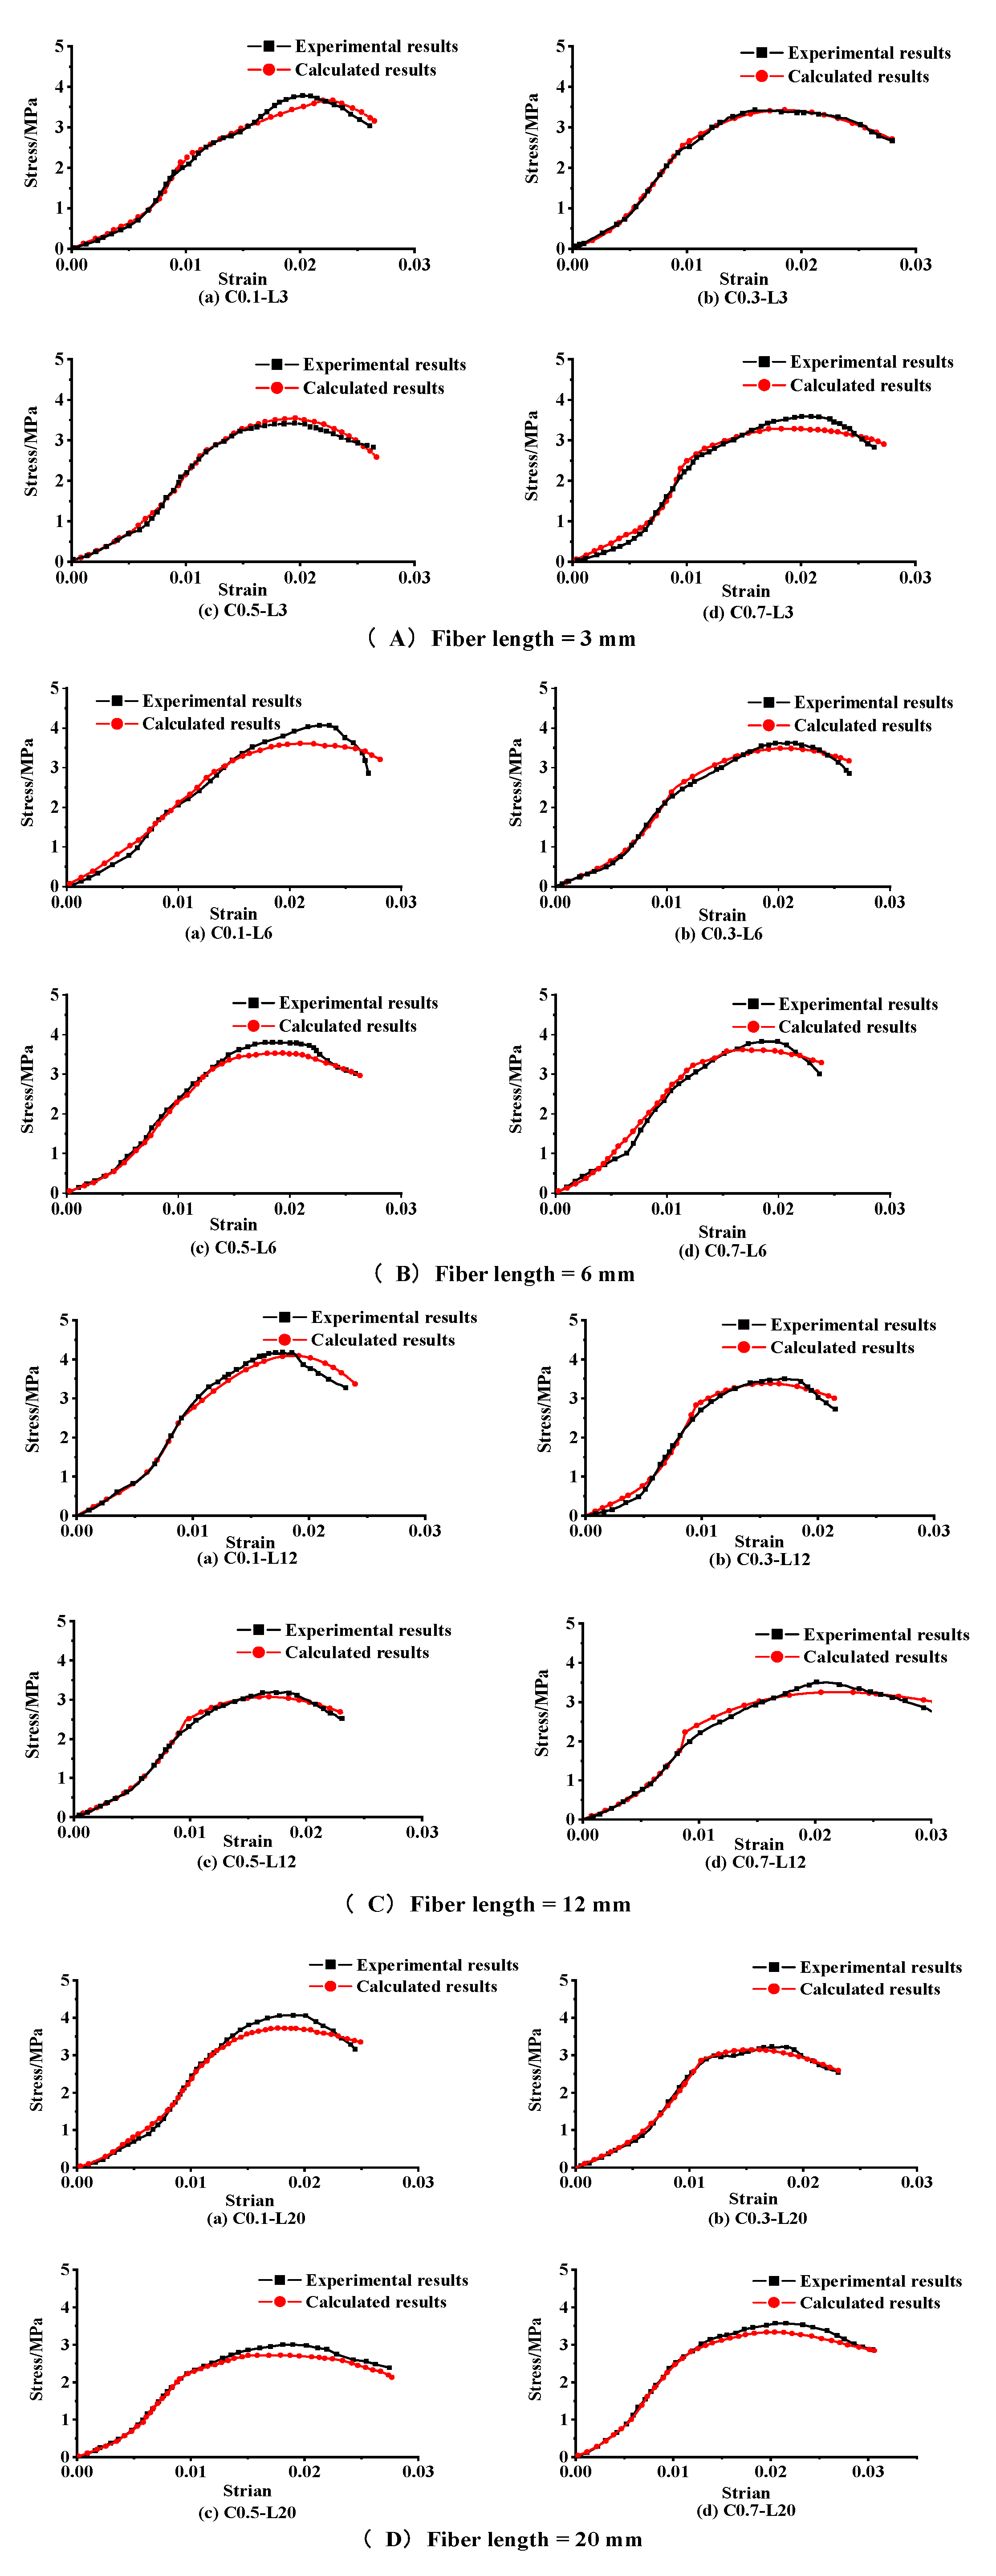
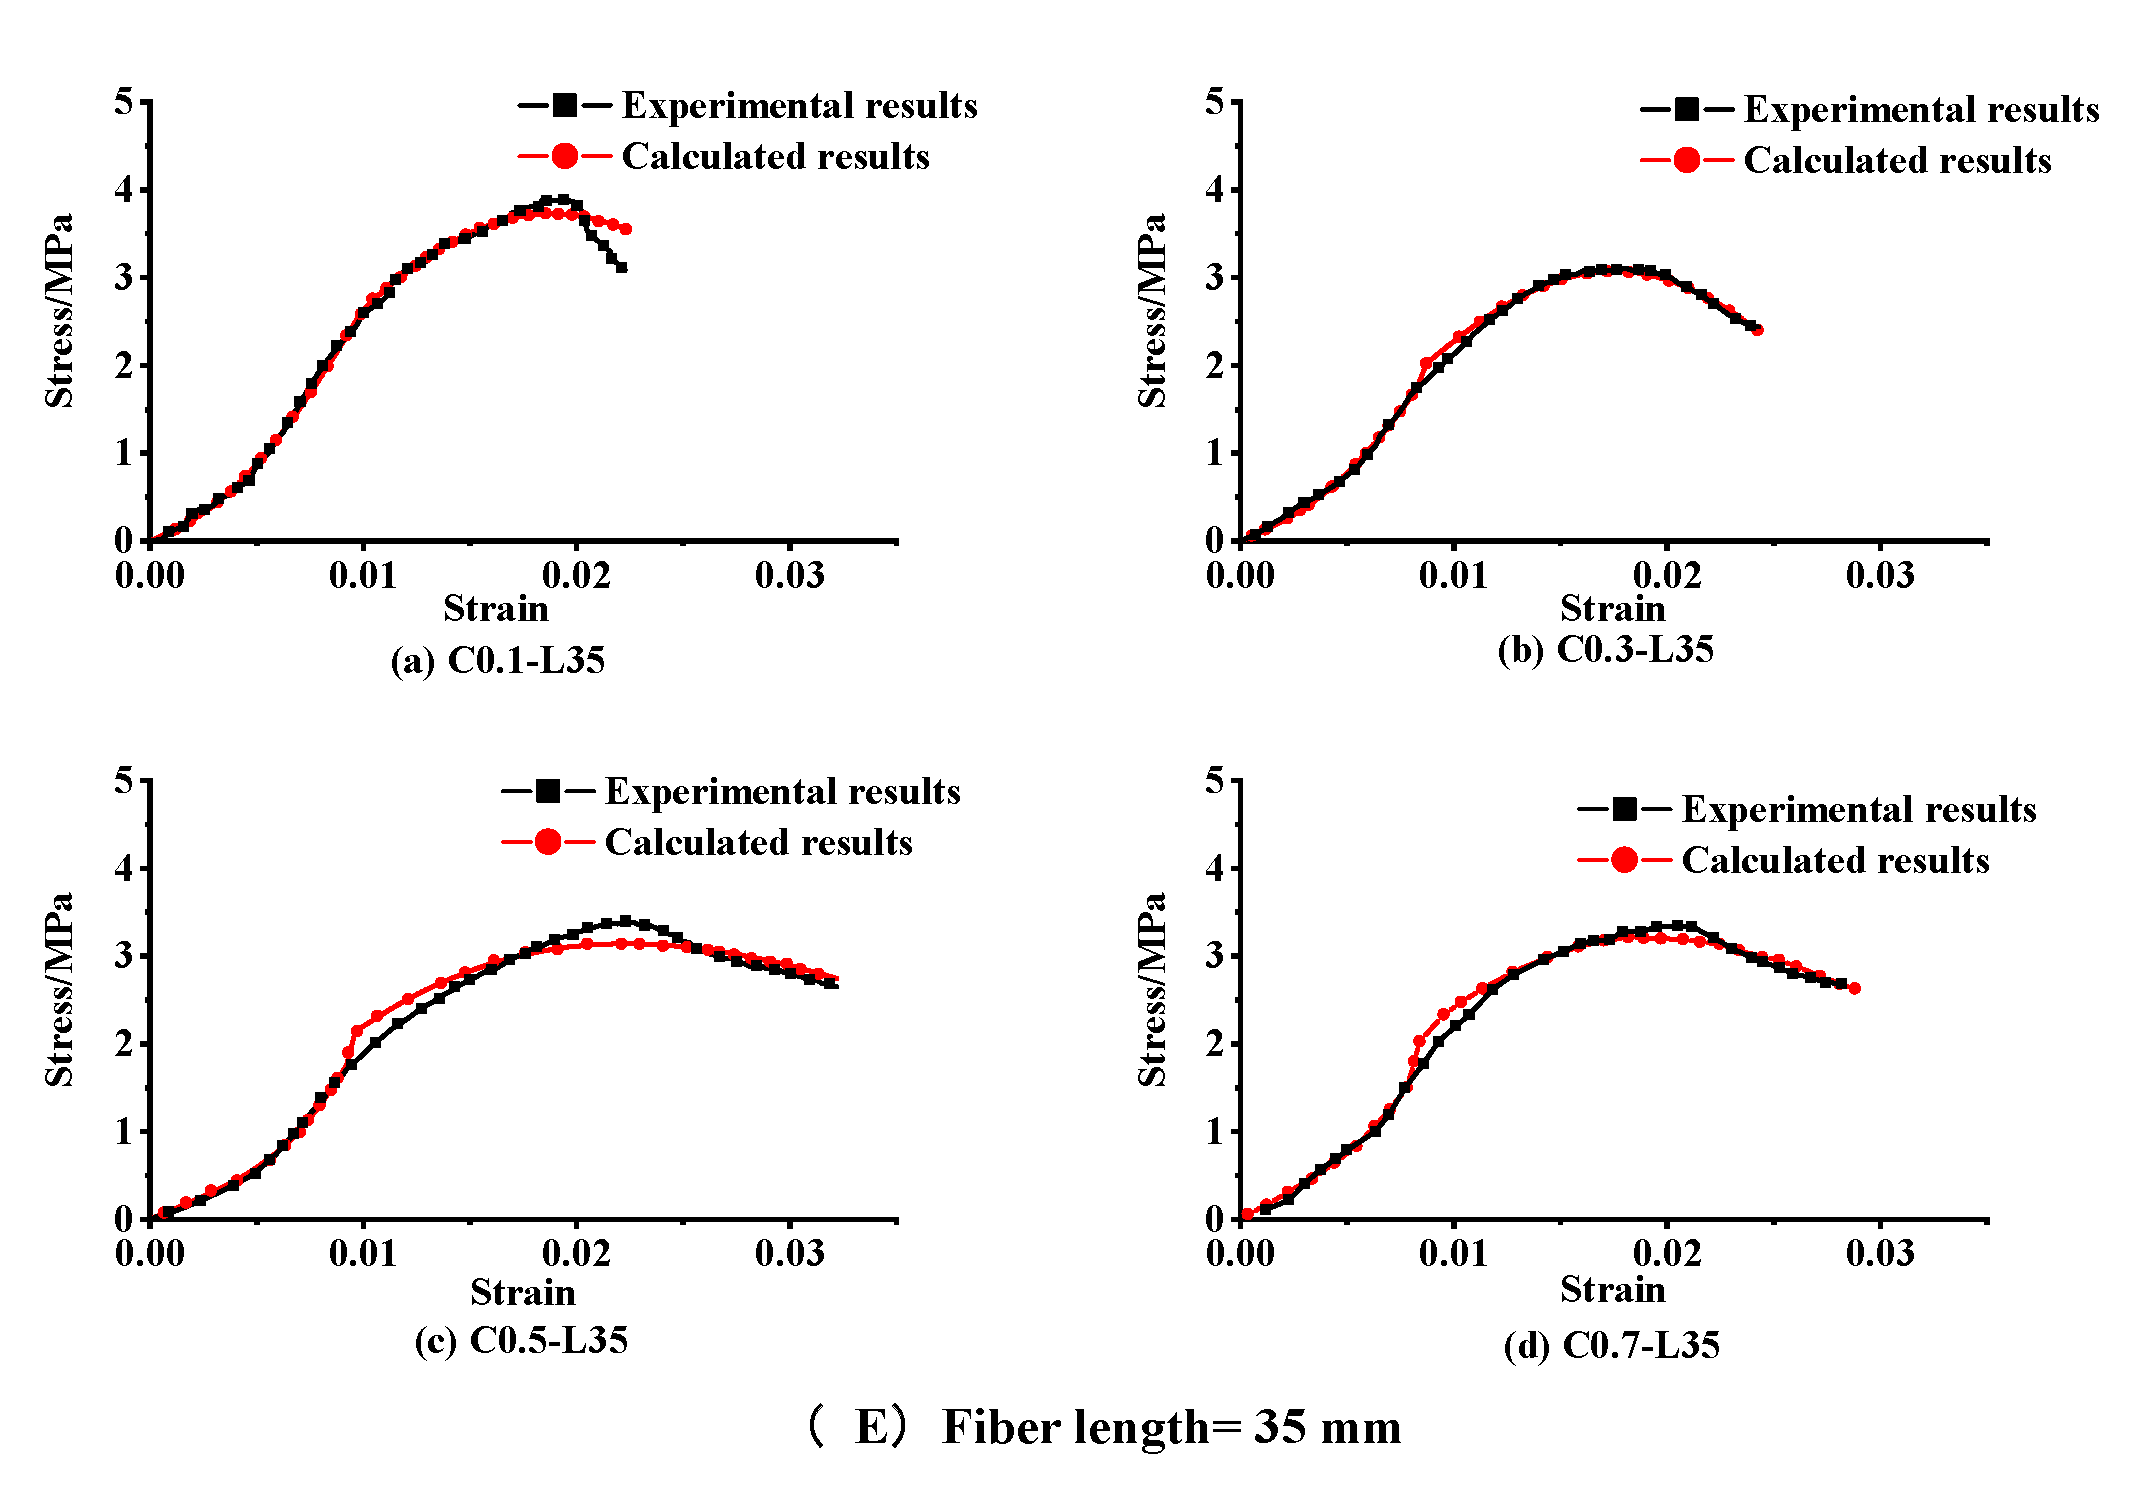
5.2. Stress–Strain Relationship Based on Statistical Damage

By substituting C and L into Table 6 and inserting m, n, m1, and n1 into Equation (16), the simulated constitutive relationships between different types of BFRCS with various fiber contents and lengths can be obtained (Figure 13). In Figure 13 the black lines represent the measured compressive stress-strain curves, while the red lines represent their respective theoretical curves for the same fiber content and length. The theoretical curve based on the presented damage model is similar to the test results, indicating that the Weibull distribution is a sound indicator of BFRCS strength and that the presented damage model is applicable to BFRCS.

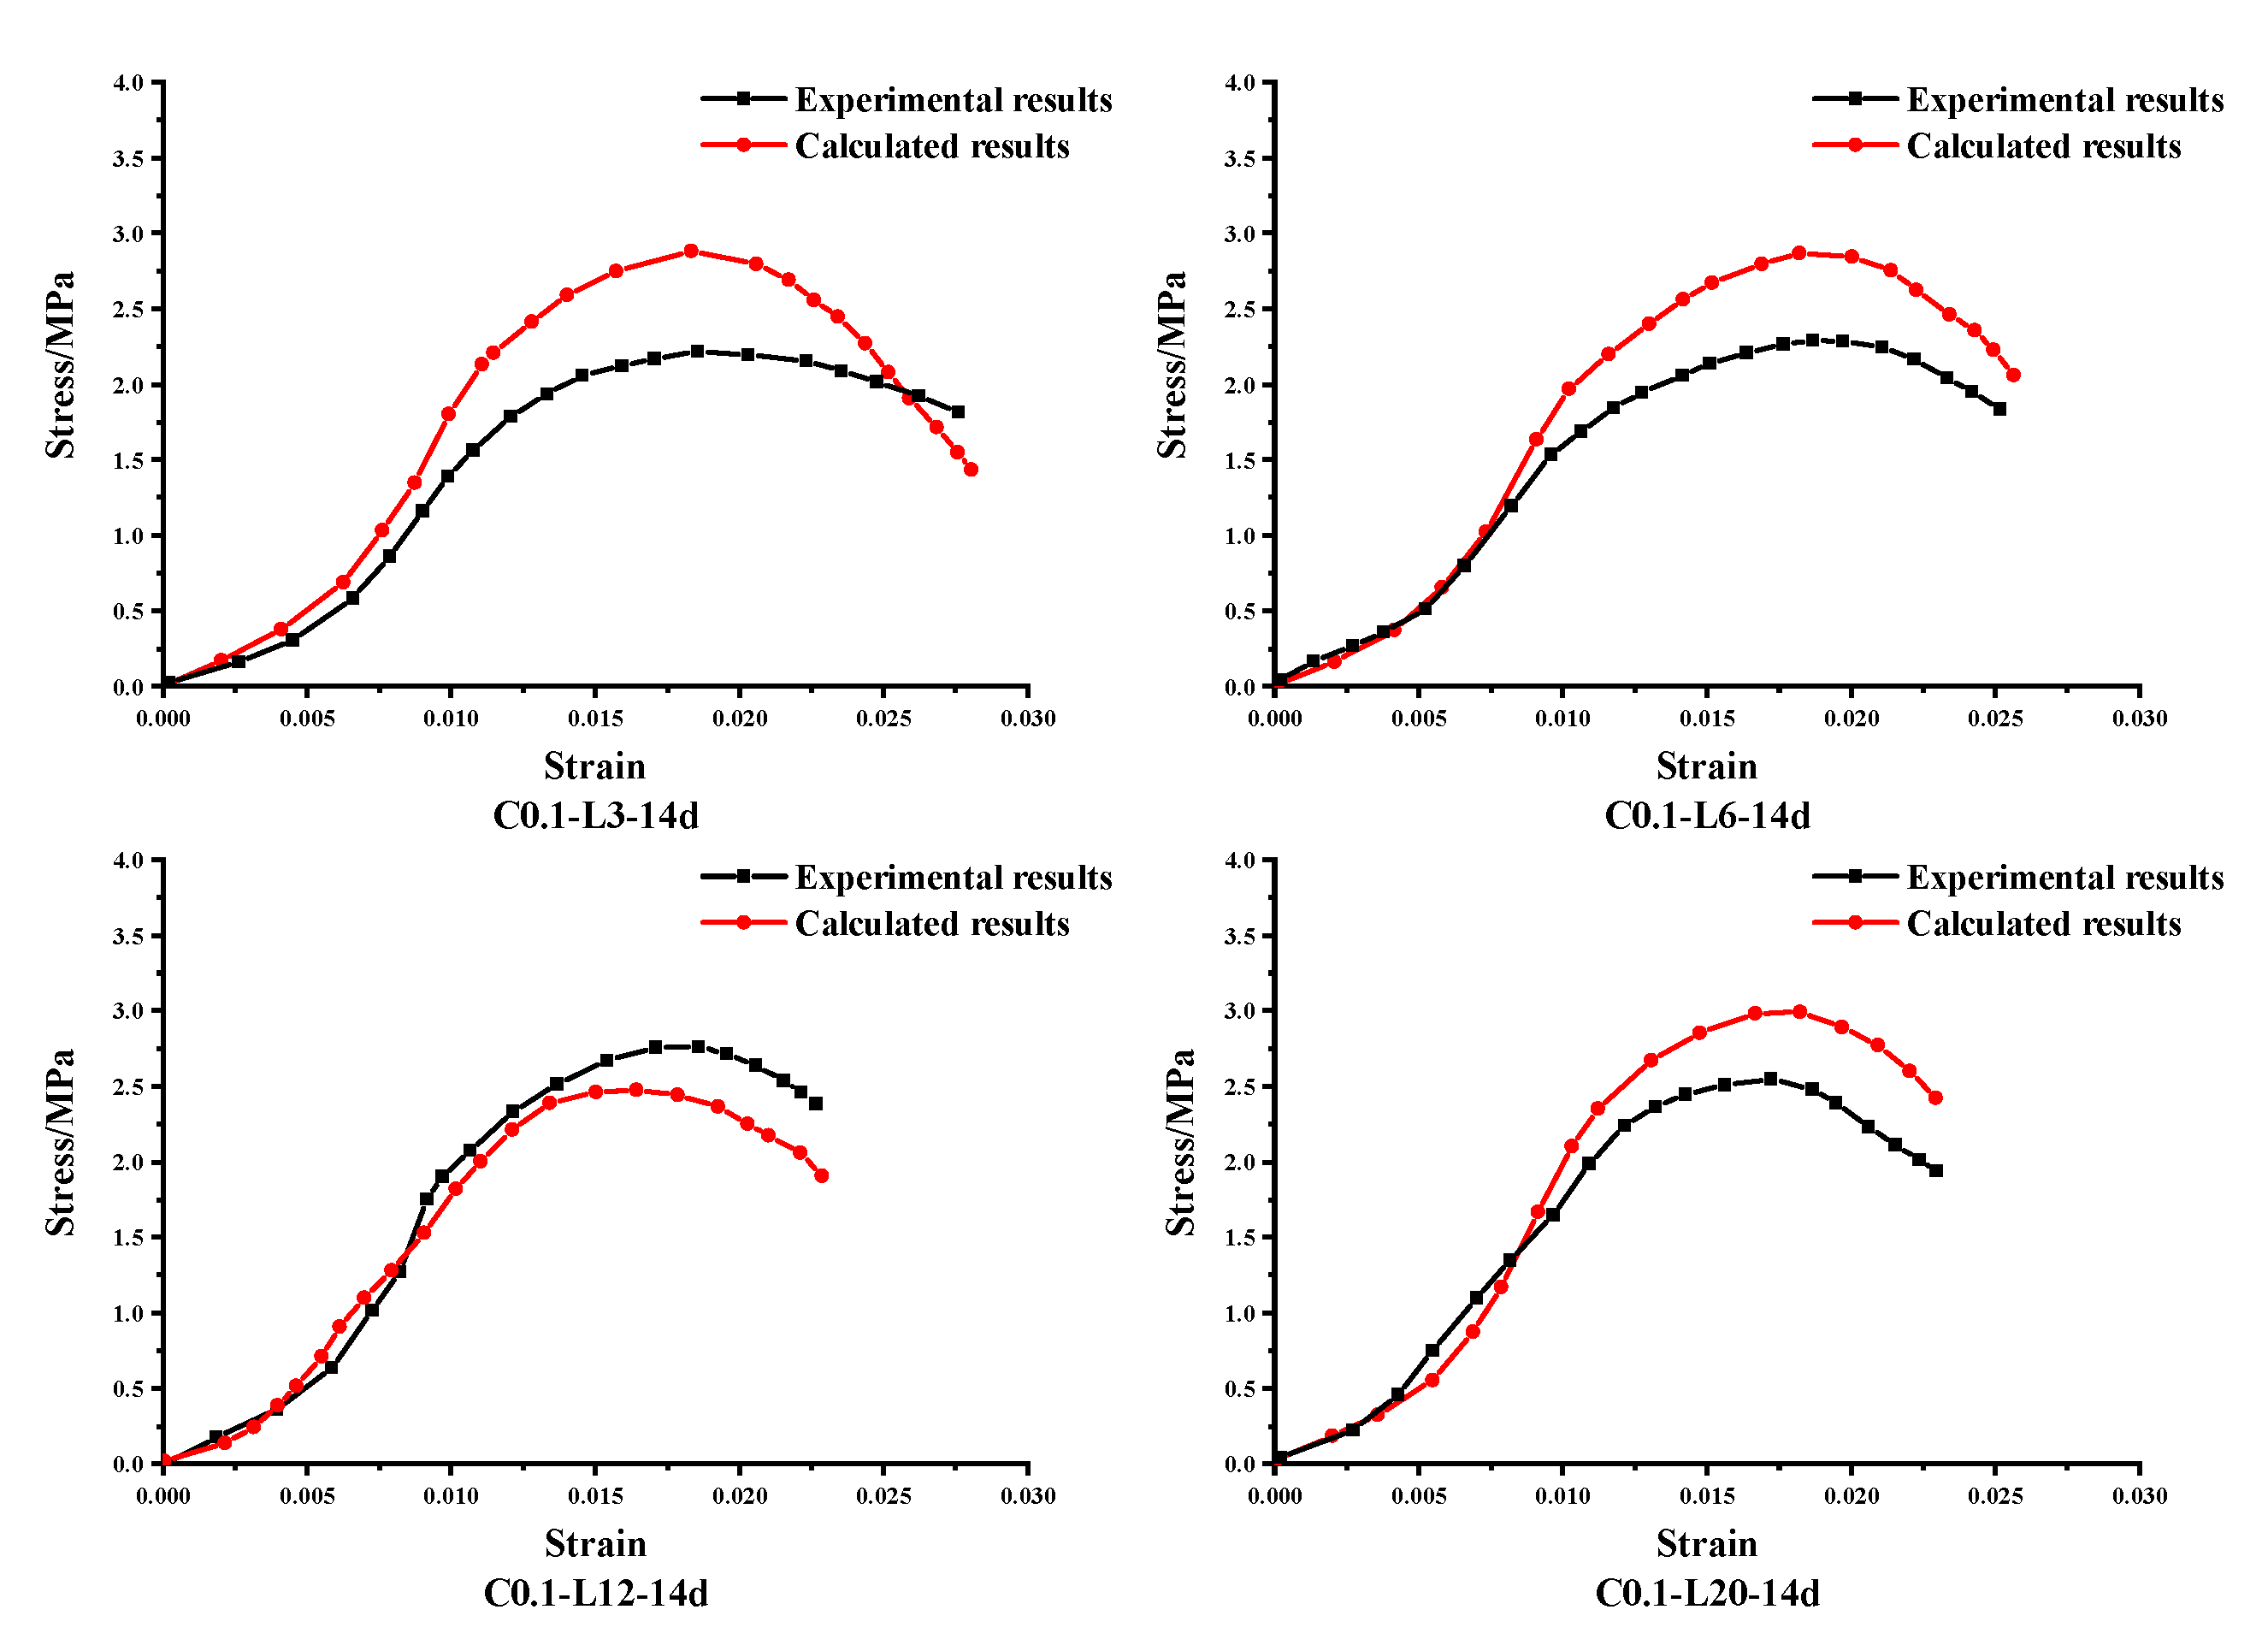
5.3. Constitutive Model Validation

In order to verify the rationality of the constitutive model, we performed BFRCS curing for 14 days, where the fiber content was 0.1%, the fiber lengths were 3, 6, 12, and 20 mm, and the cement content of BFRCS was 10%. For instance, C0.1-L3-14d indicates that the fiber content is 0.1%, the fiber length is 3 mm, and the curing time is 14 d. The related parameters are shown in Table 7.
The curing of BFRCS for 14 days was tested in the same way as the curing of BFRCS for 28 days. By substituting C and L into Table 6 and inserting m, n, m1, and n1 into Equation (16), we can obtain the simulated constitutive relationships between different types of BFRCS with various fiber contents and lengths subjected to curing for 14 days (Figure 14). In Figure 14 the black lines represent the measured compressive stress-strain curves and the red lines represent the stress-strain curves calculated by the constitutive model.
According to Figure 14, it can be seen that the theoretical stress-strain curves calculated by the constitutive model are similar to those of the stress-strain curves of BFRCS. The theoretical stress-strain curves calculated by the constitutive model reflect the trend in the stress-strain curves of BFRCS subjected to curing for 14 days. They also reflect the strain corresponding to the peak stress, but the stress-strain curves calculated by the constitutive model are not very effective in predicting the magnitude of the peak stress.

6. Conclusions

The addition of basalt fibers can effectively improve the peak strength and damage strain of cemented soil. When the fiber content is 0.1% the peak strength and breaking strain of BFRCS are excellent. In this study, the peak strength reached its maximum at a fiber content of 0.1% and a fiber length of 12 mm, while the damaged strain reached its maximum at a fiber content of 0.1% and a fiber length of 6 mm.
The variation in the basalt fiber content of fiber-reinforced cemented soil has a greater influence on the UCS than fiber length. This is primarily due to the greater influence of fiber content on the grip force between the fibers and cement in the soil. Furthermore, in terms of damage strain, the influence of fiber content and length is not evident when considered as a single factor, primarily due to the toughness of fiber-reinforced cemented soil. This, in turn, is mainly because the toughness of fiber-reinforced cemented soil results from the coupling of these two factors.
A constitutive model based on the Weibull distribution, which considers the fiber length and fiber content, was established, and the determination method of the model parameters was provided. Through example verification, we determined that the model calculation results presented in this paper are in strong agreement with the experimental results and accurately reflect the influences of the fiber length and fiber content on the inherent behavior of fiber-reinforced cemented soil. The fiber content has a greater effect on the material’s brittleness than the fiber length, but the effects of the fiber content and fiber length on the material’s strength are more significant.

Author Contributions

Formal analysis, R.Z.; investigation, R.Z. and C.Q.; data curation, L.N.; writing—original draft preparation, R.Z.; writing—review and editing, L.X.; supervision, L.X. All authors have read and agreed to the published version of the manuscript.

Funding

This research was funded by the National Natural Science Foundation of China (grant number: 52008185) and Jilin Provincial Science and Technology Department (grant number: 20220203063SF).

Institutional Review Board Statement

Not applicable.

Informed Consent Statement

Not applicable.

Data Availability Statement

The data are contained within the article.

Conflicts of Interest

The authors declare no conflict of interest.

References

  1. Ayeldeen, M.; Kitazume, M. Using fiber and liquid polymer to improve the behaviour of cement-stabilized soft clay. Geotext. Geomembr. 2017, 45, 592–602. [Google Scholar] [CrossRef]
  2. Boz, A.; Sezer, A.; Özdemir, T.; Hızal, G.E.; Azdeniz Dolmacı, Ö. Mechanical properties of lime-treated clay reinforced with different types of randomly distributed fibers. Arabian J. Geosci. 2018, 11, 122. [Google Scholar] [CrossRef]
  3. Baldovino, J.d.J.A.; Moreira, E.B.; Carazzai, É.; Rocha, E.V.d.G.; dos Santos Izzo, R.; Mazer, W.; Rose, J.L. Equations controlling the strength of sedimentary silty soil-cement blends: Influence of voids/cement ratio and types of cement. Int. J. Geotech. Eng. 2019, 15, 359–372. [Google Scholar] [CrossRef]
  4. Chen, D.; Liao, Y.; Jiang, C.; Feng, X. The mechanical properties of coastal soil treated with cement. J. Wuhan Univ. Technol. 2013, 28, 1155–1160. [Google Scholar] [CrossRef]
  5. Xu, L.; Deng, H.; Niu, L.; Zheng, J.; Qian, Y. Experimental study on mechanical properties of fiber-reinforced cemented soil with the low temperature curing condition subjected to effect of salt and drying-wetting cycles. J. Civil EE. 2022, 44, 10–19. [Google Scholar] [CrossRef]
  6. Xu, L.; Niu, L. Effect of polypropylene fiber on frost resistance of cemented soil. Mater. Plast. 2019, 57, 78–86. [Google Scholar] [CrossRef]
  7. Liu, J.; Bai, Y.; Song, Z.; Wang, Y.; Chen, Z.; Wang, Q.; Kanungo, D.P.; Qian, W. Debi Prasanna Kanungo, and Wei Qian, Effect of basalt fiber on the strength properties of polymer reinforced sand. Fibers Polym. 2018, 19, 2372–2387. [Google Scholar] [CrossRef]
  8. Zhang, X.; Gu, X.; Lv, J.; Zou, X. 3D numerical model to investigate the rheological properties of basalt fiber reinforced asphalt-like materials. Constr. Build. Mater. 2017, 138, 185–194. [Google Scholar] [CrossRef]
  9. Zhang, X.; Gu, X.; Lv, J.; Zhu, Z.; Zou, X. Numerical analysis of the rheological behaviors of basalt fiber reinforced asphalt mortar using ABAQUS. Constr. Build. Mater. 2017, 157, 392–401. [Google Scholar] [CrossRef]
  10. Shi, F.J. A study on structure and properties of basalt fiber. Appl. Mech. Mater. 2012, 238, 17–21. [Google Scholar] [CrossRef]
  11. Yang, K.; Wei, S.; Adilehou, W.M.; Ho, H. Fiber-reinforced internally unstable soil against suffusion failure. Constr. Build. Mater. 2019, 222, 458–473. [Google Scholar] [CrossRef]
  12. Otieno Owino, A.; Nahar, N.; Hossain, Z.; Tamaki, N. Dimensional influence of basalt fiber reinforcements on the consolidation behaviour of rice husk ash stabilized soils. Constr. Build. Mater. 2022, 339, 127686. [Google Scholar] [CrossRef]
  13. Ma, Q.; Gao, C. Effect of basalt fiber on the dynamic mechanical properties of cement-soil in SHPB test. J. Mater. Civ. Eng. 2018, 30, 04018185. [Google Scholar] [CrossRef]
  14. Cao, Z.; Ma, Q.; Wang, H. Effect of basalt fiber addition on static-dynamic mechanical behaviors and microstructure of stabilized soil compositing cement and fly ash. Adv. Civ. Eng. 2019, 0401815, 821453. [Google Scholar] [CrossRef]
  15. Shen, Y.; Tang, Y.; Yin, J.; Li, M.; Wen, T. An experimental investigation on strength characteristics of fiber-reinforced clayey soil treated with lime or cement. Constr. Build. Mater. 2021, 294, 12357. [Google Scholar] [CrossRef]
  16. Zhu, H.-H.; Zhang, C.-C.; Tang, C.-S.; Shi, B.; Wang, B.-J. Modeling the pullout behavior of short fibers in reinforced soil. Geotext. Geomembr. 2014, 42, 329–338. [Google Scholar] [CrossRef]
  17. Zhu, C.; Wang, Z.; Ju, J.; Liu, J.; Wang, X. The research on compaction characteristics of cement soil. In Proceedings of the Fourth International Conference on Digital Manufacturing Automation, Qindao, China, 29–30 June 2013; Volume 2, pp. 1521–1524. [Google Scholar] [CrossRef]
  18. Wang, D.; Wang, H.; Larsson, S.; Benzerzour, M.; Maherzi, W.; Amar, M. Effect of basalt fiber inclusion on the mechanical properties and microstructure of cement-solidified kaolinite. Constr. Build. Mater. 2020, 241, 118085. [Google Scholar] [CrossRef]
  19. Xiao, Y.; He, X.; Evans, T.M.; Stuedlein, A.W.; Liu, H. Unconfined compressive and splitting tensile strength of basalt fiber-reinforced biocemented sand. J. Geotech. Geoenviron. Eng. 2019, 145, 04019048. [Google Scholar] [CrossRef]
  20. Lv, X.; Zhou, H.; Liu, X.; Song, Y. Experimental study on the effect of basalt fiber on the shear behavior of cemented sand. Environ. Earth Sci. 2019, 78, 688. [Google Scholar] [CrossRef]
  21. Dasaka, S.M.; Sumesh, K.S. Effect of coir fiber on the stress-strain behavior of a reconstituted fine-grained soil. J. Nat. Fibers 2011, 8, 189–204. [Google Scholar] [CrossRef]
  22. Divya, P.V.; Viswanadham, B.V.S.; Gourc, J.P. Evaluation of tensile strength-strain characteristics of fiber-reinforced soil through laboratory tests. J. Mater. Civ. Eng. 2014, 26, 14–23. [Google Scholar] [CrossRef]
  23. Gao, Z.; Lu, D.; Huang, M. Effective skeleton stress and void ratio for constitutive modeling of fiber-reinforced sand. Acta Geotech. 2020, 15, 2797–2811. [Google Scholar] [CrossRef]
  24. Sivakumar Babu, G.L.; Chouksey, S.K. Model for analysis of fiber-reinforced clayey soil. Geomech. Geoeng. 2010, 5, 277–285. [Google Scholar] [CrossRef]
  25. Salih, M.M.; Osofero, A.I.; Imbabi, M.S. Constitutive models for fibre reinforced soil bricks. Constr. Build. Mater. 2020, 240, 117806. [Google Scholar] [CrossRef]
  26. Kanchi, G.M.; Neeraja, V.S.; Sivakumar Babu, G.L. Effect of anisotropy of fibers on the stress-strain response of fiber-reinforced soil. Int. J. Geomech. 2015, 15, 06014016. [Google Scholar] [CrossRef]
  27. Wu, Z.; Xu, J.; Li, Y.; Wang, S. Disturbed state concept-based model for the uniaxial strain-softening behavior of fiber-reinforced soil. Int. J. Geomech. 2022, 22, 4022092. [Google Scholar] [CrossRef]
  28. Specification for mix Proportion Design of Cement Soil. In Chinese Standard JGJ-T233-2011; Fujian Academy of Building Research: Fuzhou, China, 2011. (In Chinese)
  29. Lemaitre, J. A continuous damage mechanics model for ductile fracture. Trans. ASME, Ser. H. 1985, 107, 83–89. [Google Scholar] [CrossRef]
  30. Tian, H.; Ziegler, M.; Kempka, T. Physical and mechanical behavior of claystone exposed to temperatures up to 1000 °C. Int. J. Rock Mech Min. 2014, 70, 144–153. [Google Scholar] [CrossRef]
  31. Dusan, K.; Silva, M.A.G. Statistical aspects of the continuous damage theory. Int. J. Solids Struct. 1982, 18, 551–562. [Google Scholar] [CrossRef]
  32. Mcdowell, G.R.; Amon, A. The application of Weibull statistics to the fracture of soil particles. J. Jpn. Geotech Soc. 2000, 40, 133–141. [Google Scholar] [CrossRef]
  33. Munkholm, L.; Perfect, E. Brittle fracture of soil aggregates. Soil Sci. Soc. Am. J. 2005, 69, 1565–1571. [Google Scholar] [CrossRef]
  34. Frandsen, H.L. Weibull statistics effective area and volume in the ball-on-ring testing method. Mech. Mater. 2014, 73, 28–37. [Google Scholar] [CrossRef]
  35. Ding, Y.; Wei, W.; Pan, B.; Huang, Q.; Liu, Z.; Liu, D. Statistical damage model for fiber-reinforced vegetation concrete substrate. Chin. J. Geotech. Eng. 2022, 044, 652–659. [Google Scholar]
  36. Kachanov, M.; Montagut, E. Interaction of a crack with certain microcrack arrays. Eng. Fract. Mech. 1986, 25, 625–636. [Google Scholar] [CrossRef]
  37. Lemaite, J. How to use damage mechanics. Nucl. Eng. Des. 1984, 80, 233–245. [Google Scholar] [CrossRef]
  38. Tao, C.; He, H.; Yan, W.; Zhou, D. Compression damage constitutive model of hybrid fiber reinforced concrete and its experimental verification. Constr. Build. Mater. 2020, 264, 120026. [Google Scholar] [CrossRef]
  39. Xie, S.; Lin, H.; Wang, Y.; Xiong, W.; Zhao, Y.; Du, S. A statistical damage constitutive model considering whole joint shear deformation. Int. J. Damage Mech. 2020, 29, 988–1008. [Google Scholar] [CrossRef]
Figure 1. Image of the experimental soil.
Buildings 13 00460 g001
Figure 2. Original XRD spectrum of the tested soil.
Buildings 13 00460 g002
Figure 3. Grain size distribution curve.
Buildings 13 00460 g003
Figure 4. Basalt fibers.
Buildings 13 00460 g004
Figure 5. Specimen preparation flowchart.
Buildings 13 00460 g005
Figure 6. Variations in the damage strain with fiber length and different fiber contents.
Buildings 13 00460 g006
Figure 7. Variations in the peak strength with fiber length and different fiber contents.
Buildings 13 00460 g007
Figure 8. Variations in the damage strain with fiber content and different fiber lengths.
Buildings 13 00460 g008
Figure 9. Variations in the peak strength with fiber content and different fiber lengths.
Buildings 13 00460 g009
Figure 10. Dense and uniform fiber distributions in the matrices.
Buildings 13 00460 g010
Figure 11. Different degrees of BFRCS in the loading process.
Buildings 13 00460 g011
Figure 12. Varying trends in the parameters m, n, m1, and n1.
Buildings 13 00460 g012
Figure 13. Comparison of the calculation results of the proposed constitutive models with the experimental results of stress–strain curves of the fiber-reinforced cemented soil.
Buildings 13 00460 g013aBuildings 13 00460 g013b
Figure 14. Comparison of the calculation results obtained by the constitutive model with the experimental results of stress-strain curves of BFRCS subjected to curing for 14 days.
Buildings 13 00460 g014
Table 1. Physical indices of the soil.
Physical and Mechanical IndexValue
Natural water content (%)33.2
Plastic limit (%)41
Plasticity index16
Natural density (g/cm3)2.71
Void ratio1.03
Liquid limit (%)25
Table 2. Basic properties of the basalt fibers.
Main ComponentSiCaAlMgOKNaTiFe
Atomic fraction/%26.618.937.896.9031.811.181.631.264.04
Table 3. Basalt fiber composition.
Diameter/μmTensile Strength/MPaModulus of Elasticity/GPaDensity/(g/cm³)Thermal Conductivity/(W-m/k)Operating Temperature/°C
7–153000–480091–1102.63–2.650.030–0.038−269–650
Table 4. Basic properties of the cement.
Strength GradeSpecific Surface Area/(m²/kg)Initial Setting Time/hFinal Set Time/hCementitious Sand Flexural Strength/MPaCementitious Sand Compressive Strength/MPa
3 d28 d3 d28 d
P-O 42.534522.5582449
Table 5. Mixture designs of the test specimens.
No.Fiber Content/%Fiber Length/mmNo.Fiber Content/%Fiber Length/mm
C0-L000C0.5-L30.53
C0.1-L30.13C0.5-L60.56
C0.1-L60.16C0.5-L120.512
C0.1-L120.112C0.5-L200.520
C0.1-L200.120C0.5-L350.535
C0.1-L350.135C0.7-L30.73
C0.3-L30.33C0.7-L60.76
C0.3-L60.36C0.7-L120.712
C0.3-L120.312C0.7-L200.720
C0.3-L200.320C0.7-L350.735
C0.3-350.335
Table 6. Calculation results of the parameters m, n, m1, and n1.
Parameter Expressions in Different Degrees
Compress DegreeDestroy Degree
m = 9.52 × 10⁻³−6.05 × 10⁻³ C–1.08469 × 10⁻⁴. * L–7.49 × 10⁻³ * C2 + 3.20978 × 10⁻⁶ * L2 –3.94778 × 10⁻⁵ * C* Lm1 = 2.918 × 10⁻²–1.791 × 10⁻² * C–2.94713 × 10⁻⁴ * L + 2.495 × 10⁻² * C2 + 6.91643 × 10⁻⁶ * L2 + 1.03341 × 10⁻⁴ * C * L
n = 5.2595–7.80631 * C–7.979 × 10⁻² * L + 7.16081 * C2 + 1.63 × 10⁻³ * L2 + 4.1 × 10⁻² * C * Ln1 = 4.888–7.762 * C–4.83 × 10⁻³ * L – 5.243 * C2 + 1.248 × 10⁻⁴ * L2 −4.93 × 10⁻³ * C * L
Table 7. Related parameters of the BFRCS subjected to curing for 14 d.
Related ParametersED0nmm1n1
C0.1-L3-14d2020.614.33807710.0088571470.0268474.036524
C0.1-L6-14d2100.574.15501710.0086065670.0261814.023925
C0.1-L12-14d2140.63.87691710.0086041540.0252214.005465
C0.1-L20-14d2200.593.68867710.0087435180.0247143.99483
Disclaimer/Publisher’s Note: The statements, opinions and data contained in all publications are solely those of the individual author(s) and contributor(s) and not of MDPI and/or the editor(s). MDPI and/or the editor(s) disclaim responsibility for any injury to people or property resulting from any ideas, methods, instructions or products referred to in the content.

