Article

Optimization of Rockburst Risk Control Measures for Deeply Buried TBM Tunnels: A Case Study

1
Institute of Underground Space for Stability and Support of Surrounding Rock, Heze University, Heze 274015, China
2
State Key Laboratory of Geomechanics and Geotechnical Engineering, Institute of Rock and Soil Mechanics, Chinese Academy of Sciences, Wuhan 430071, China
3
Faculty of Civil Engineering and Mechanics, Jiangsu University, Zhenjiang 212013, China
4
School of Resources, Environment and Materials, Guangxi University, Nanning 530004, China
*
Author to whom correspondence should be addressed.
Buildings 2023, 13(6), 1440; https://doi.org/10.3390/buildings13061440
Submission received: 21 April 2023 / Revised: 27 May 2023 / Accepted: 30 May 2023 / Published: 31 May 2023
(This article belongs to the Special Issue Advances and Applications in Geotechnical and Structural Engineering)

Abstract

:
Choosing reasonable control measures for different intensity rockburst risks not only effectively prevents and mitigates rockburst risks but also reduces time and engineering investment costs. Due to the limitations of the tunnel boring machine’s structure and working conditions, tunnels excavated by TBMs are highly susceptible to rockbursts. What is even worse is that there are very few measures to control the rockburst risk in these tunnels. Implementing reasonable control measures from the limited mitigation measures to control and mitigate rockburst in TBM tunnels is an urgent problem that warrants a solution. In this paper, a large number of on-site rockburst risk control cases and a large amount of MS monitoring data (the total mileage of MS monitoring is approximately 7 km, lasting for 482 days) are used to derive a reasonable scheme to control the rockburst risk of different intensities in twin TBM tunnels. First, the rockburst early warning effect of the two headrace tunnels of the Neelum–Jhelum hydropower station based on microseismic monitoring is analyzed. Second, based on highly accurate rockburst warning results, 94 rockburst risk control cases are applied to analyze the control effect of different control measures at different intensities of rockburst risk. Then, by combining factors such as the time cost and expense cost of different control measures, more reasonable control measures for different intensity rockburst risks are proposed: for slight rockburst risk, normal excavation is preferred; for moderate rockburst risk, horizontal destress boreholes are preferred; and for intense rockburst risk, a combination of measures of shortening daily advance and horizontal destress boreholes is preferred. The research results can provide a reference for other TBM excavation projects to carry out rockburst risk prevention and mitigation.

1. Introduction

In recent years, there has been an increasing number of tunneling projects in hydropower, transportation, and other projects, and such projects are gradually developing toward deeper depths [1,2]. Rockburst disasters induced by high in situ stress have become increasingly prominent. Rockburst is a complex dynamic geological disaster that occurs when the elastic strain energy accumulated in the rock mass under high stress conditions is suddenly released due to excavation or other external disturbances, causing the rock to fracture and eject [1,3,4]. Rockbursts can cause significant casualties, mechanical damage, delays in construction schedules, and economic losses. For example, the “5.31” extremely intense rockburst that occurred in the twin headrace tunnels of the Neelum–Jhelum hydropower station (hereinafter referred to as N-J) in Pakistan on 31 May 2015 caused serious damage to TBM, resulting in 3 deaths and 17 injuries and delaying the construction period by up to half a year [5]. Due to the strong destructive nature of rockburst disasters and the serious threat they pose to engineering construction and workers, rockburst prevention has been extensively studied and evaluated [1,3,4,5,6,7,8,9,10,11,12,13,14,15] since the first record of rockburst in the Leipzig coal mine tunnel in the South Staffordshire coalfield in England in 1738 [5].
Rockburst prevention consists of two aspects: rockburst prediction and rockburst control or mitigation. The purpose of rockburst prediction is to know the potential occurrence of rockburst risks, such as possibility, intensity, location, time, etc., to take corresponding rockburst control or mitigation measures or even undertake evacuation measures in some emergency situations. Currently, there are many rockburst criteria and rockburst classification methods used to evaluate rockburst risk, such as the strength–stress ratio [16,17], brittleness index [13,18], Hoek method [19], strain energy storage index [20], energy release rate [18,21], failure approach index [7], peak-strength strain energy storage index [22], Qinling tunnel discrimination method [23], critical depth method [13], and distance discrimination method [18]. These methods have achieved varying degrees of success in predicting rockburst in different underground construction sites [13,18]. However, the above methods can only provide an overall assessment of rockburst risk in the engineering area. Due to the heterogeneity of the rock mass and the complexity of the geostress and engineering geological conditions, the overall rockburst risk assessment cannot meet the on-site requirements for rapid and real-time excavation. Microseismic (MS) monitoring, compared to traditional monitoring techniques such as stress and displacement monitoring, has the advantage of providing three-dimensional, real-time continuous monitoring of rock mass damage and microfracturing up to macro failure. Since its inception, many scholars have been dedicated to using it to monitor and evaluate the stability of underground engineering and disaster assessment, including rockburst disasters [24,25,26,27,28,29,30,31,32,33,34,35]. Poplawski [6] proposed a rockburst warning index called ‘departure indexing’ using multiple seismic parameters to evaluate rockburst risk in the Mt Charlotte Mine in Australia. Feng et al. [12] proposed a probabilistic and quantitative rockburst warning method for different rockburst intensities based on long-term microseismic monitoring and analysis of numerous rockburst cases in the Jingping-II Hydropower Station headrace tunnel, providing a valuable tool for the management of rockburst hazards. After decades of efforts by many experts and scholars, there has been significant progress in rockburst risk warning. Rockburst risk warning has developed from qualitative to quantitative measures, and the accuracy of rockburst areas has become more precise. The accuracy of rockburst prediction has gradually improved, and microseismic monitoring has been widely used in rockburst risk warning in mines [6,25,26,28,30], hydropower projects [9,12,27,29,32,33], and transportation tunnels [15,31,34].
‘Rockburst control or mitigation’ mainly involves taking a series of measures to reduce the risk of rockburst and resist the harm caused by rockburst. During the planning and design stage of tunnel engineering, a reasonable tunnel axis, excavation methods (drilling and blasting or TBM excavation), excavation sequence, reasonable section size and shape, and other optimized project layout schemes can be taken to reduce the risk of rockburst. However, once a tunnel enters the substantive excavation stage, only various rockburst control measures can be taken to control or mitigate the risk of rockburst, such as rock mass pre-conditioning, including the most widespread destress blasts [36] and destress boreholes [11], hydraulic fracturing [37], pilot tunnels [7], and strengthening support [1,38]. There are generally two methods for tunnel excavation: drilling and blasting excavation and TBM excavation [39]. Tunnels excavated using the drilling and blasting method have limited mechanical equipment near the working face, making the construction flexible and providing greater flexibility in the selection and implementation of rockburst control measures. However, for tunnels excavated by TBM, due to the limitations of the TBM’s own structure and construction conditions, the flexibility is relatively low, and there are fewer measures to control or mitigate rockburst risks. Moreover, valuable equipment and personnel are relatively concentrated near the face (high-risk area of rockburst), and the degree of damage caused by rockburst danger is far higher than that of tunnels constructed by drilling and blasting methods [5,7]. Moreover, comparing similar tunnels in depth, the risk of rockburst when using TBM excavation is higher than when using the drilling and blasting method [5,40]. Therefore, it is particularly important to determine reasonable control measures for different intensity rockburst risks within the limited control measures of TBM tunnels. At present, there are many studies on the optimization of rockburst control measures, but most of them use numerical simulation methods to optimize the parameters of a single control measure. There are few reports on the optimization of rockburst risk control measures using their in situ performance in controlling rockburst risk. For instance, Yan et al. [41] adopted a widely used numerical indicator of rockburst, the energy release rate (ERR), to investigate rockburst risk using different blasting excavation footage through numerical methods. They believed that blasting excavation footage to 1.5~2.0 m is regarded as the best for controlling rockburst risk in Jinping auxiliary tunnels. Jiang et al. [42] applied numerical simulation to study the effect of rockburst risk mitigation caused by different destress borehole parameters (depth, diameter). They argued that the effect of borehole diameter is more significant than depth and proposed optimized pressure relief hole parameters. The reason there are few reports on optimizing rockburst control measures using on-site data is attributed to the lack of real-time warning and the low success rate of rockburst risk in the past. The rapid development and mature application of microseismic monitoring technology in recent years has made it possible to accurately predict the risk of rockburst in real time and evaluate the effectiveness of rockburst control or mitigation measures.
This study attempts to use a large number of on-site observation rockburst risk control cases and a large amount of MS monitoring data (the total mileage of MS monitoring is approximately 7 km, lasting for 482 days) to derive a reasonable scheme to control the rockburst risk of different intensities in the twin headrace tunnels of the N-J hydropower station. First, the rockburst warning method, warning effect, and rockburst mitigation measures applied in the twin headrace tunnels are analyzed. Ninety-four rockburst mitigation cases are then used to analyze the control effects of different control measures on slight, moderate, and intense rockburst risks. Finally, combining factors such as the time cost and expense cost of different control measures, the optimized control measures for different intensity rockburst risks in the twin headrace tunnels of the N-J hydropower station are proposed.

2. Overview of the N-J Hydropower Project and Microseismic Monitoring

2.1. The Headrace Tunnel of the N-J Hydropower Project

The N-J Hydropower Station is located in Muzaffarabad City, Kashmir, northeastern Pakistan, and the location is shown in Figure 1. The hydropower station is a high-water head of 420 m, runoff type, diversion hydropower station with an installed capacity of 969 MW. The hydropower station is the largest hydropower station in Pakistan, known as the “Three Gorges Project” in Pakistan, and one of the key projects of the “One Belt and One Road” initiative. When the headrace tunnel crosses high mountains, it is arranged as a double track tunnel, while the other parts are arranged as a single-track tunnel, with a total axis length of 28.6 km. The total length of the headrace tunnel is 48.2 km, including the single and double sections of the headrace tunnel and five adit tunnels. The headrace tunnel between the A1 and A3 adits (this part passes through a high mountain) is arranged as a double line tunnel with an axis length of 13.6 km. This section is mainly excavated using two open TBMs, called the TBM696 and TBM697 tunnels, with excavation lengths of 10.4 km and 9.9 km, respectively, as shown by the blue line in Figure 1. The twin TBM tunnels are arranged in parallel, with a diameter of 8.53 m, a longitudinal slope of 0.65%, an axial spacing of 55 m between the twin tunnels, and an azimuth of N 38° E.
From a regional perspective, the N-J hydropower project is located in the Hazara Kashmir tectonic syntaxis in the western Himalayas, where geological activities are relatively active. For example, in 2006, the South Asian earthquake measuring 7.6 on the Richter scale occurred near the project, resulting in more than 80,000 deaths and 100 million persons left homeless. Due to the influence of regional structures, the two headrace tunnels develop synclinal and anticlinal structures, with the anticlinal axes nearly parallel to the stratum trend and intersecting with the tunnel axis at a large angle, 70~90°. During TBM tunneling, sandstone and siltstone appear alternately in an interlayered sandwich shape. The longitudinal-sectional geological diagram of the twin TBM tunnels is shown in Figure 2. Due to the influence of regional tectonics, the in situ stress is relatively high and is mainly in the horizontal direction almost perpendicular to the tunnel axis. The buried depth of the TBM excavation section is 1400~1900 m, and the measured maximum principal stress is 50~108.8 MPa. The average uniaxial compressive strength of sandstone specimens is 86 MPa, with an elastic modulus of 58.1 GPa. The average uniaxial compressive strength of the siltstone specimens is 66 MPa, with an elastic modulus of 40.6 GPa.

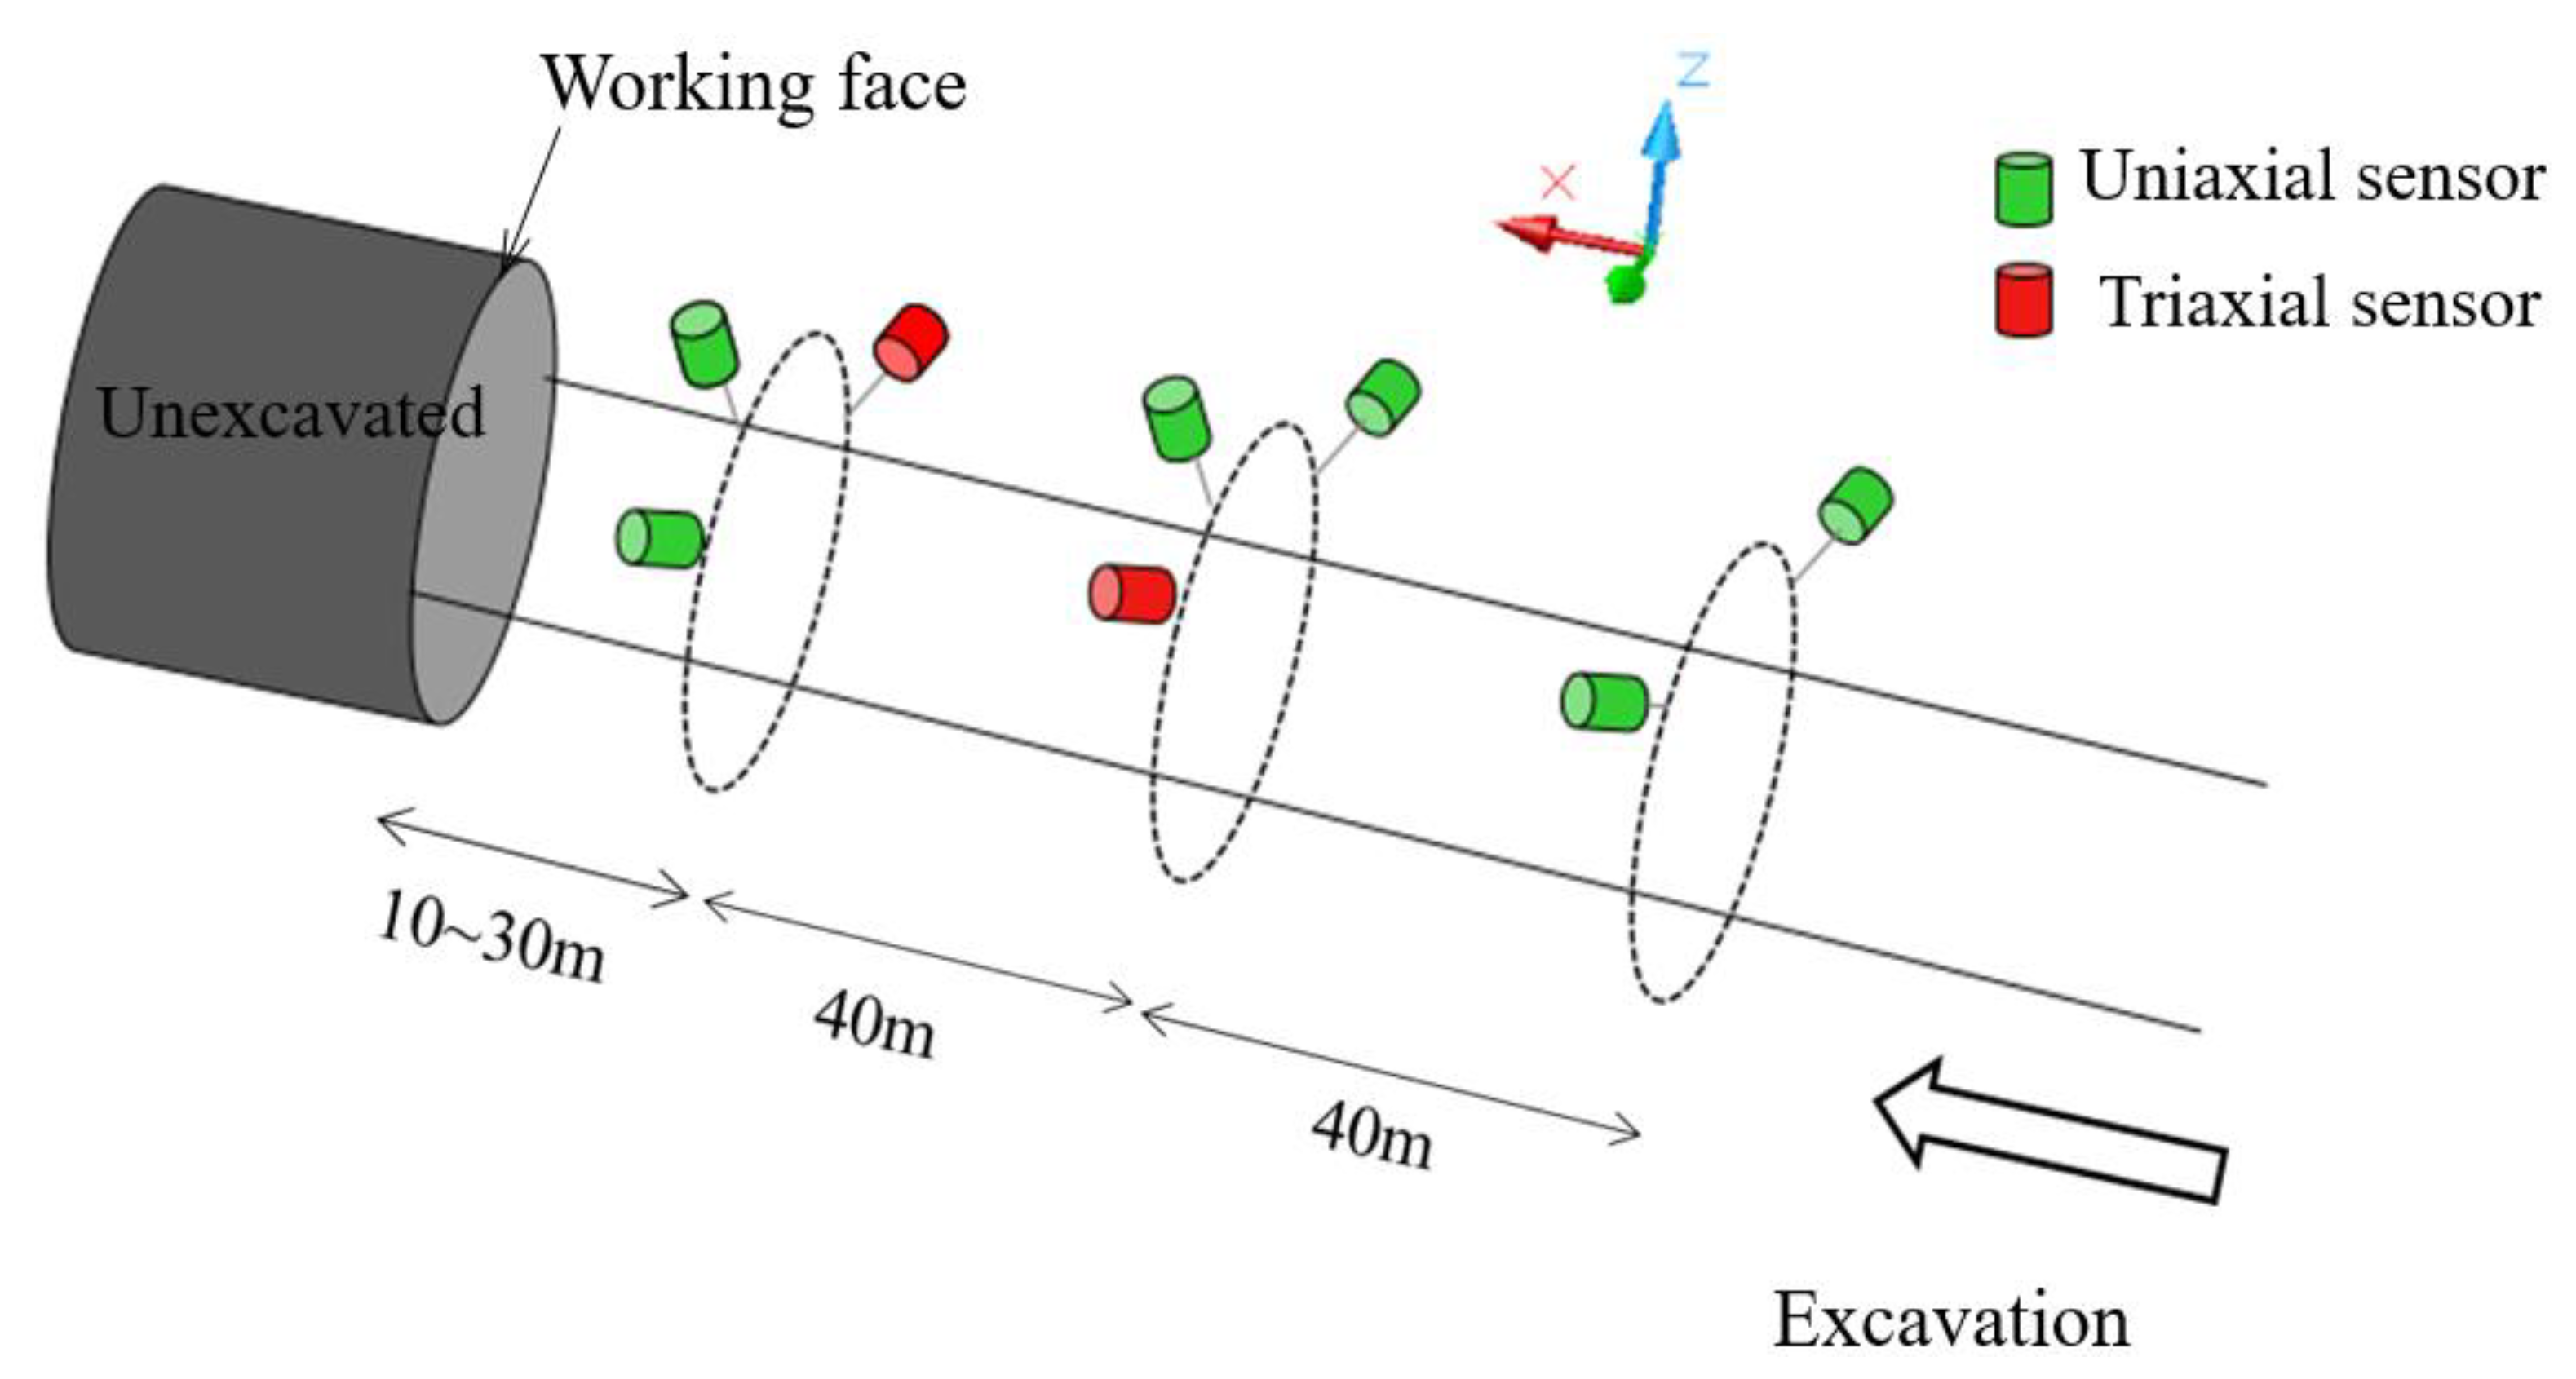
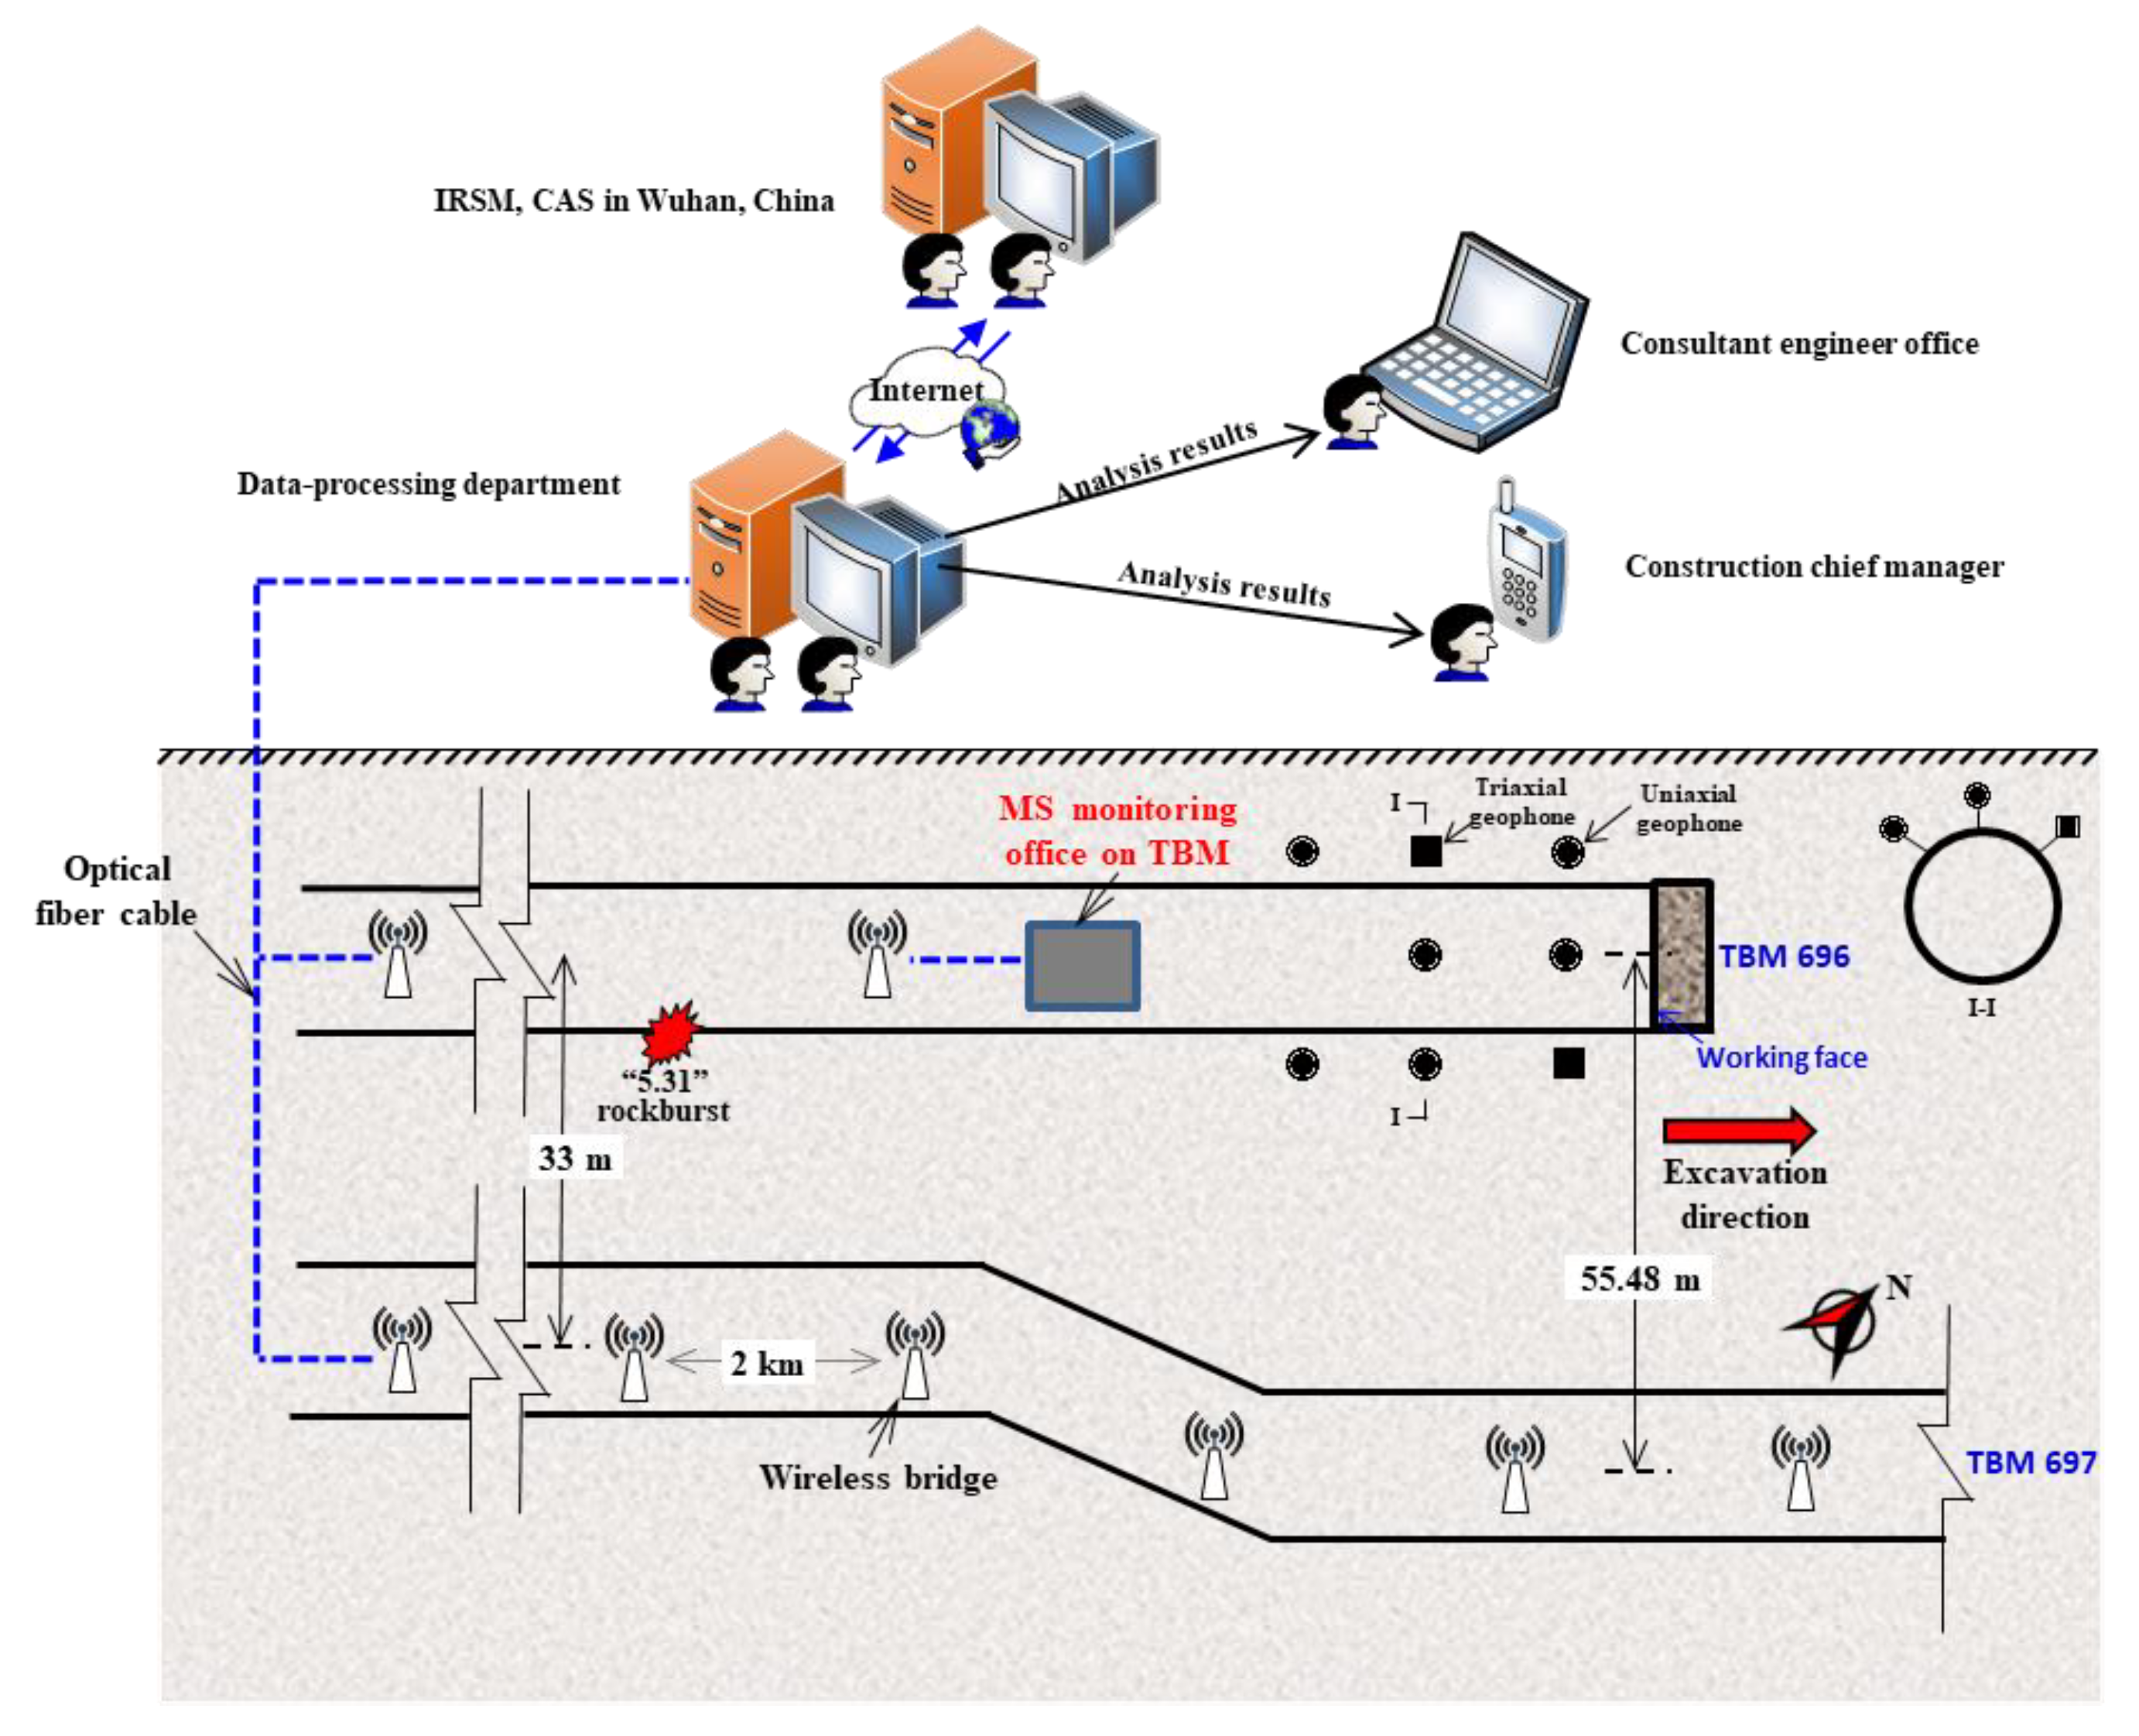
2.2. Microseismic Monitoring

After the “5.31” extremely intense rockburst, to manage the risk of rockburst, reduce workers’ fear of catastrophic rockbursts, and improve work efficiency, twin headrace tunnels, namely, TBM696 and TBM697, were set up in two identical high-performance microseismic monitoring systems produced by the South Africa IMS Company. The total mileage of the MS monitoring reached nearly 7 km, and the cumulative number of monitoring days was 482 days. Each microseismic system consisted of one sever, two geophysical seismometers, a data transmission system (Isplitter, Moxa, optical fiber, DSL, and TP-link), sensors, communication cables, and junction boxes, as shown in Figure 3. According to the microseismic monitoring method recommended by ISRM [43], considering the characteristics of N-J TBM excavation tunnels, eight sensors were arranged in three rows for each tunnel, including two triaxial sensors and six uniaxial sensors, with a frequency range of 10~2000 Hz and a sensitivity of 100 V/m/s.
The MS data collection process includes the following steps: the elastic waves generated by rock fracture migrate and trigger the MS sensors, the geophysical seismometers temporarily record the analog signal and convert it into a digital signal, and the server ultimately records the MS event.
The sensors sleeved on recovery devices were installed in a previously drilled hole with a depth of 3 m, as shown in Figure 3c, and arranged in three sections, with a distance of 40 m between the sections. The first section of sensors is 10~30 m from the face. With every 40 m of advancing toward the face, the last row of sensors will be recovered and relocated to a distance of 10~30 m from the current face. The sensors will move in real time as the face advances to ensure better access to microseismic information about the fracture of the surrounding rock mass near the face. The sensor arrangement is shown in Figure 4.
The microseismic information captured by the MS system was set off in real time to the data-processing and decision-making office on the TBM project camp through wireless transmission in TBM tunnels (approximately 10 km) and fiber transmission outside the tunnel (approximately 3 km). The topological structure of the network system used to monitor the rockburst risk in the twin headrace tunnels is shown in Figure 5. The MS system captures a large number of signals, including useful rock fracture signals (MS events) and useless and numerous noise signals. The fast Fourier transform (FFT) algorithm was adopted to distinguish and filter noise signals (more details about the use of FFT to distinguish signals can be found in [10,27]). When the noses were filtered, the microseismic data were then analyzed manually to obtain information such as the time, location, intensity, failure type, and energy release of rock fractures caused by TBM excavation. Based on this information, the internal stress state and damage condition of the rock mass are inferred, the risk of rockburst can be deduced, and early warning is achieved.

3. Rockburst Risk Mitigation Measures in the Twin Headrace Tunnels

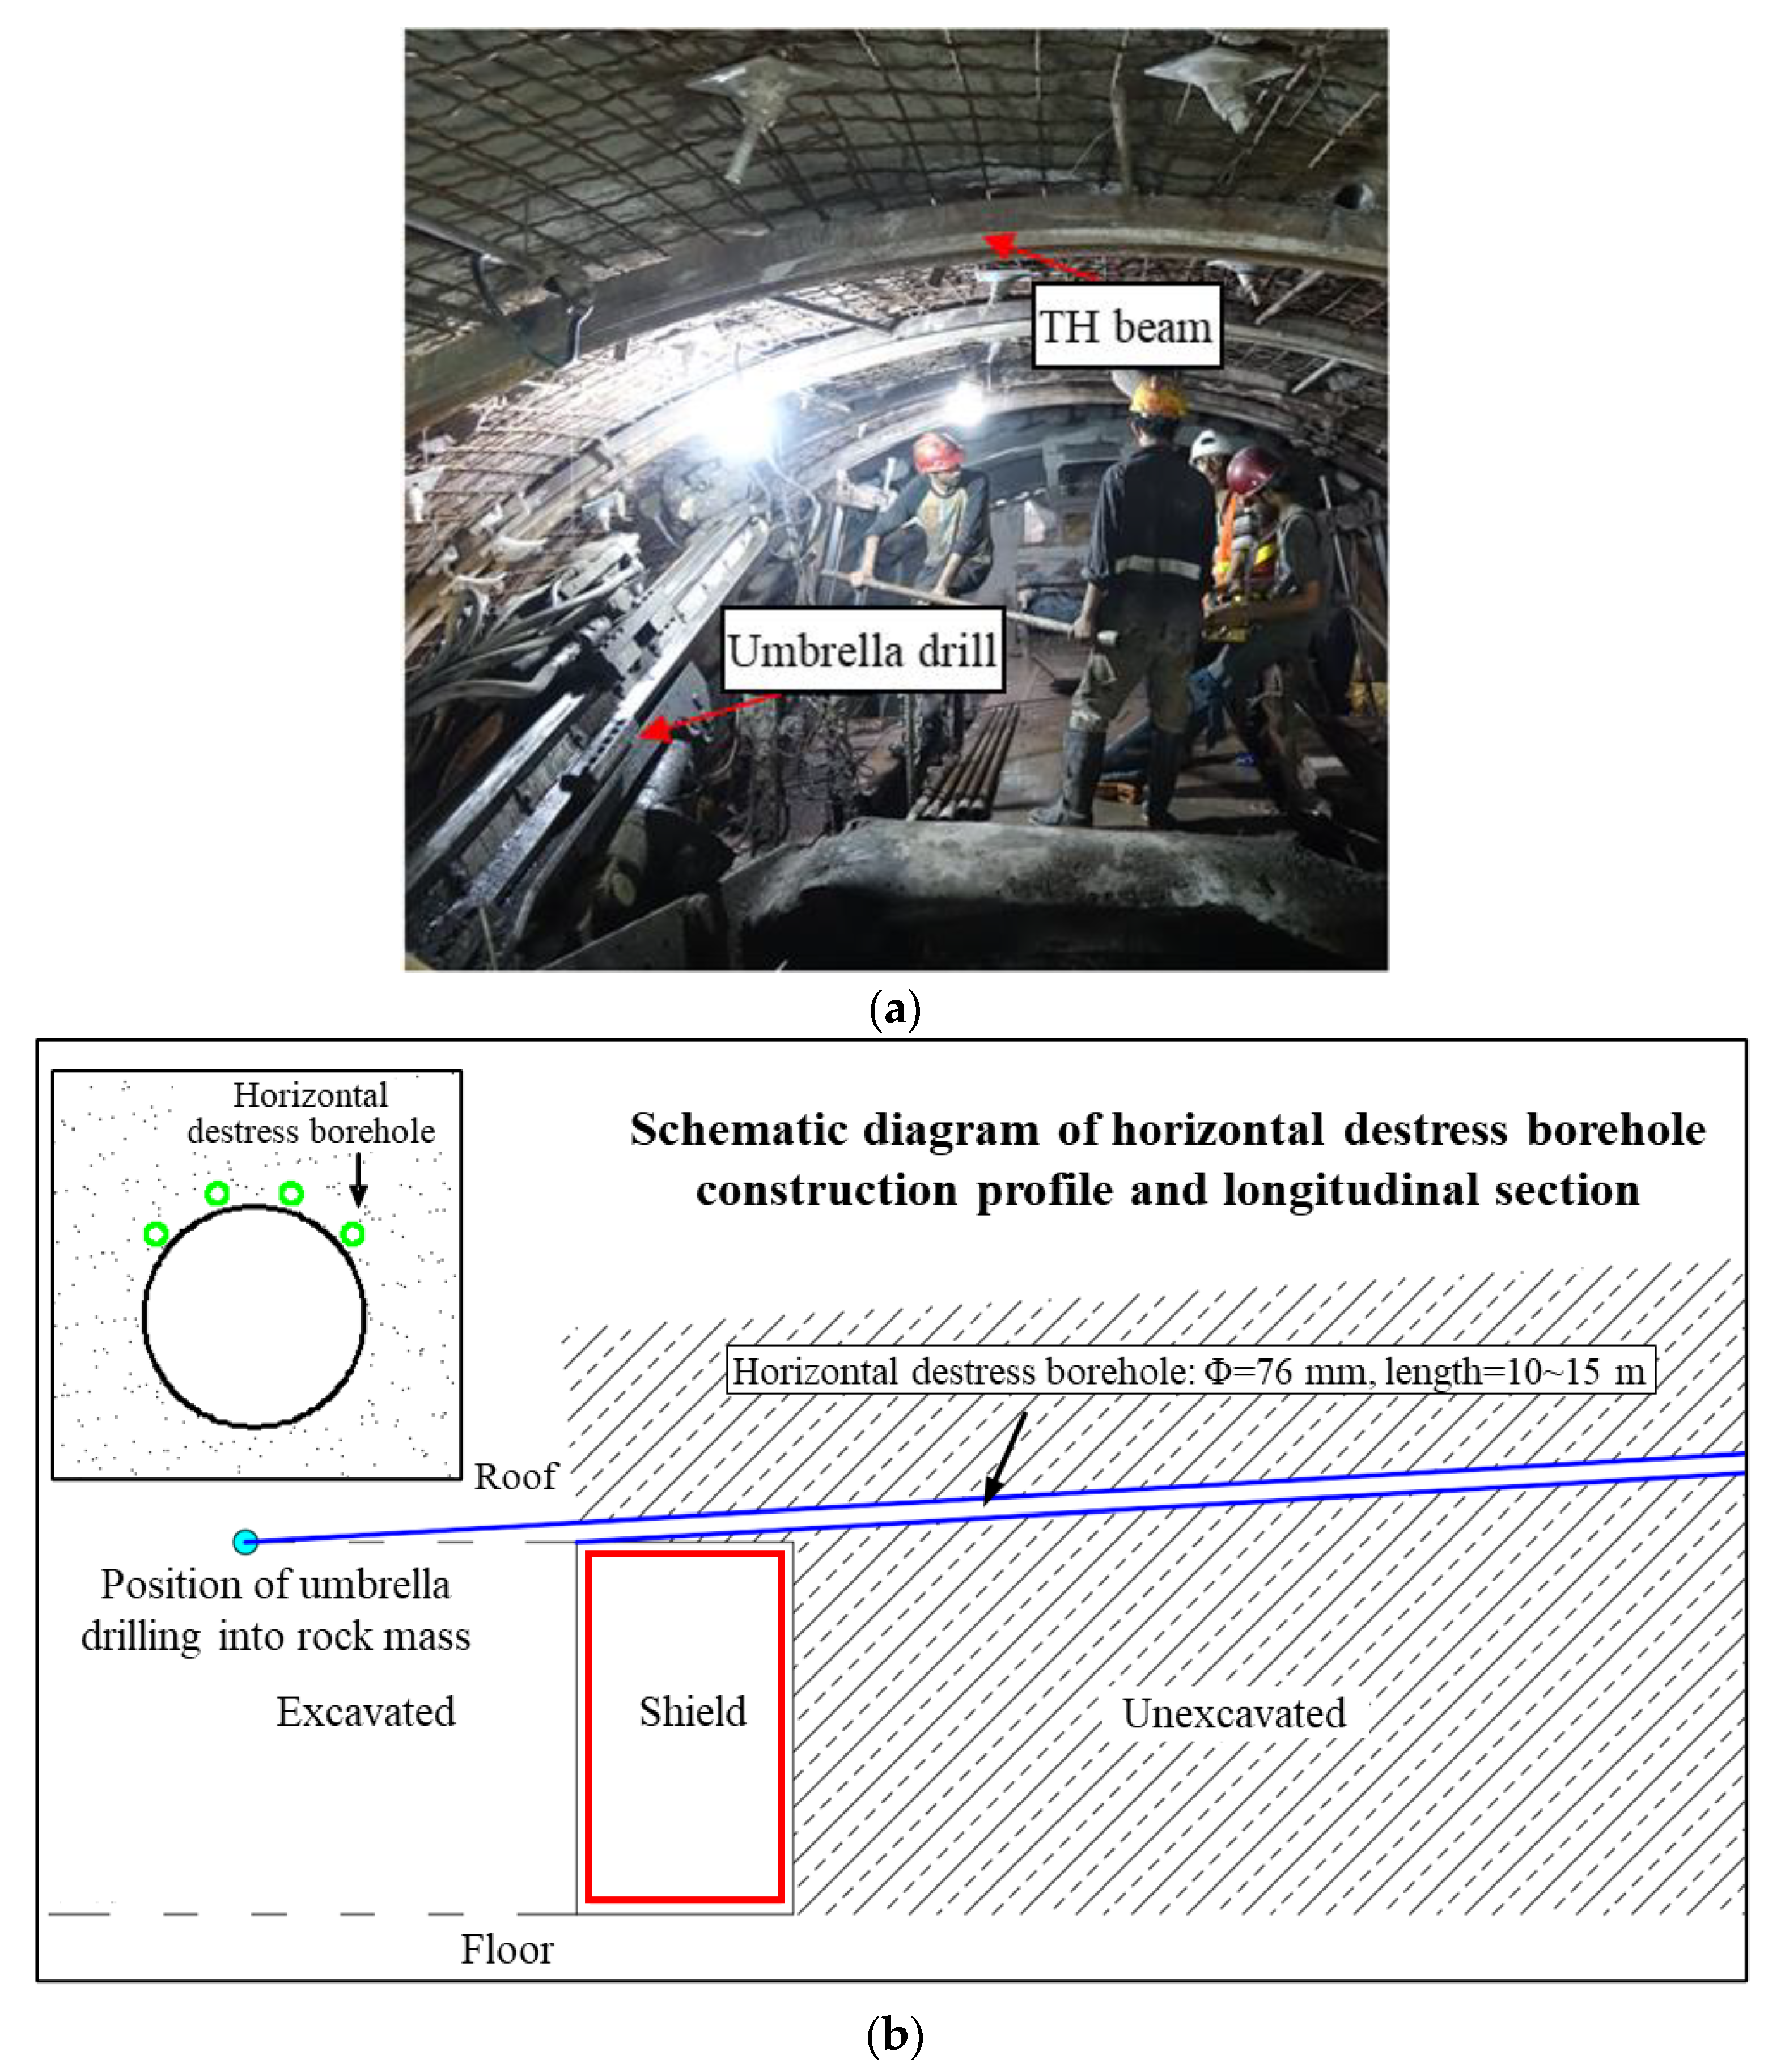
3.1. Rockburst Risk Mitigation Measures and Their Mechanism

Due to the large burial depths (1400~1900 m), high in situ stress (maximum principal stress is 50~108.8 MPa), and large diameter (8.53 m) of the twin headrace tunnels, hundreds of rockbursts ranging from slight to extremely intense occurred during the excavation of the twin headrace tunnels, seriously threatening the safety of on-site personnel and TBM, affecting the project progress and construction management costs [3,5,13]. Hence, it is necessary to take measures to control these hazards. Confined by the structure and working conditions of the TBM itself, rockburst risk control or mitigation measures for TBM tunnels are relatively limited compared to those for tunnels using the drilling and blasting method. In view of the risk of rockburst in twin headrace tunnels, four measures are mainly taken to prevent and mitigate rockburst, including implementing radial destress boreholes, implementing horizontal destress boreholes, shortening the daily advance, and shortening the spacing between TH beams, as well as their combinations.
The radial destress boreholes were constructed by an L1 area drilling rig, with a diameter of 51 mm, a depth of 3.85 m, and a spacing of 1~3 m. The construction layout along the tunnel arch is arranged in a fan shape, as shown in Figure 6. The horizontal destress boreholes were constructed by an umbrella drill, with a depth of 76 mm, generally ranging from 10 to 15 m. The construction layout is shown in Figure 7. Destress boreholes can reduce the risk of rockburst in two ways. On the one hand, the destress boreholes can concentrate the formation stress around the holes, possibly leading to a certain degree of pre-splitting of the deep rock mass, allowing the partial energy release of the rock mass in advance while reducing the integrity of the rock mass, softening the rock mass, and decreasing the capability of the rock mass to carry high stress. On the other hand, the stress concentration area is transferred to the deep part of the surrounding rock, thereby reducing the risk of rockburst in the boundary of the opening.
Shortening the spacing between TH beams is another commonly used rockburst control and mitigation measure for twin headrace tunnels. The TH beam is a type of steel arch frame, using six circular beams with the same length and radian, overlapped by two arch frame clips to form a circle and then support the surrounding rock of the tunnel, as shown in Figure 7a. Shortening the TH beam spacing artificially reduces the TBM single cycle footage, thereby increasing the number of TH beams and reducing the spacing between TH beams. When used to mitigate rockburst risk, the TH spacing is generally reduced to 80~90% of the previous day spacing. Photos of the on-site support of the TH beam are shown in Figure 7a. Shortening the spacing between TH beams is a form of reinforcement support. TH beams, in combination with steel mesh and anchor rods, form a support system that has three main functions on the rock mass: (1) strengthening the rock mass and controlling its expansion; (2) preserving the damaged rock mass and preventing further deterioration; and (3) preserving the damaged rock mass and fixing it onto the stable rock mass [8]. Shortening the spacing between TH beams can effectively enhance the confining pressure on the rock mass near the roof, and TH beams, as a flexible support, have a certain degree of compressibility, which enhances the above three functions to some extent.
When using the method of shortening the daily advance of TBM for control, the excavation rate of TBM is controlled manually, and the second day’s advance is generally 70~80% of the previous day’s advance. Reducing the excavation advance can, to some extent, reduce the disturbance of excavation to the rock mass. It not only reduces the degree of stress superposition in the surrounding rock but also slows down the adjustment of surrounding rock stress, effectively reducing the rate of energy release in the surrounding rock. This makes the strain energy stored in the rock mass release more stable and correspondingly reduces the risk of rockburst.

3.2. Analysis of Time and Expense Cost for Different Rockburst Mitigation Measures

Through long-term on-site field research, a detailed analysis was conducted on the manpower input, time consumption, asset consumption, implementation timing, and impact on production (advance) of each control measure. The analysis results are shown in Table 1.
As shown in Table 1, when implementing radial relief hole control measures, both the time cost and expense cost are relatively low. When implementing horizontal stress relief hole control measures, it takes a longer time and sometimes even affects production. Reducing the advance (shortening the daily advance) directly affects production and has a greater impact on production. When implementing shortening the TH beam mitigation measure, a large amount of manpower is needed. In terms of asset consumption, an additional CNY 14,000 is required for each TH beam used. For example, when excavating an advance of 9 m, if the distance between TH beams is reduced from 1.5 m to 1 m, an additional 3 TH beams are required for support, with an asset consumption of CNY 42,000, and it takes a longer time, which can easily affect production.

4. Analysis of the Control and Mitigation Ability of Different Measures on Rockbursts

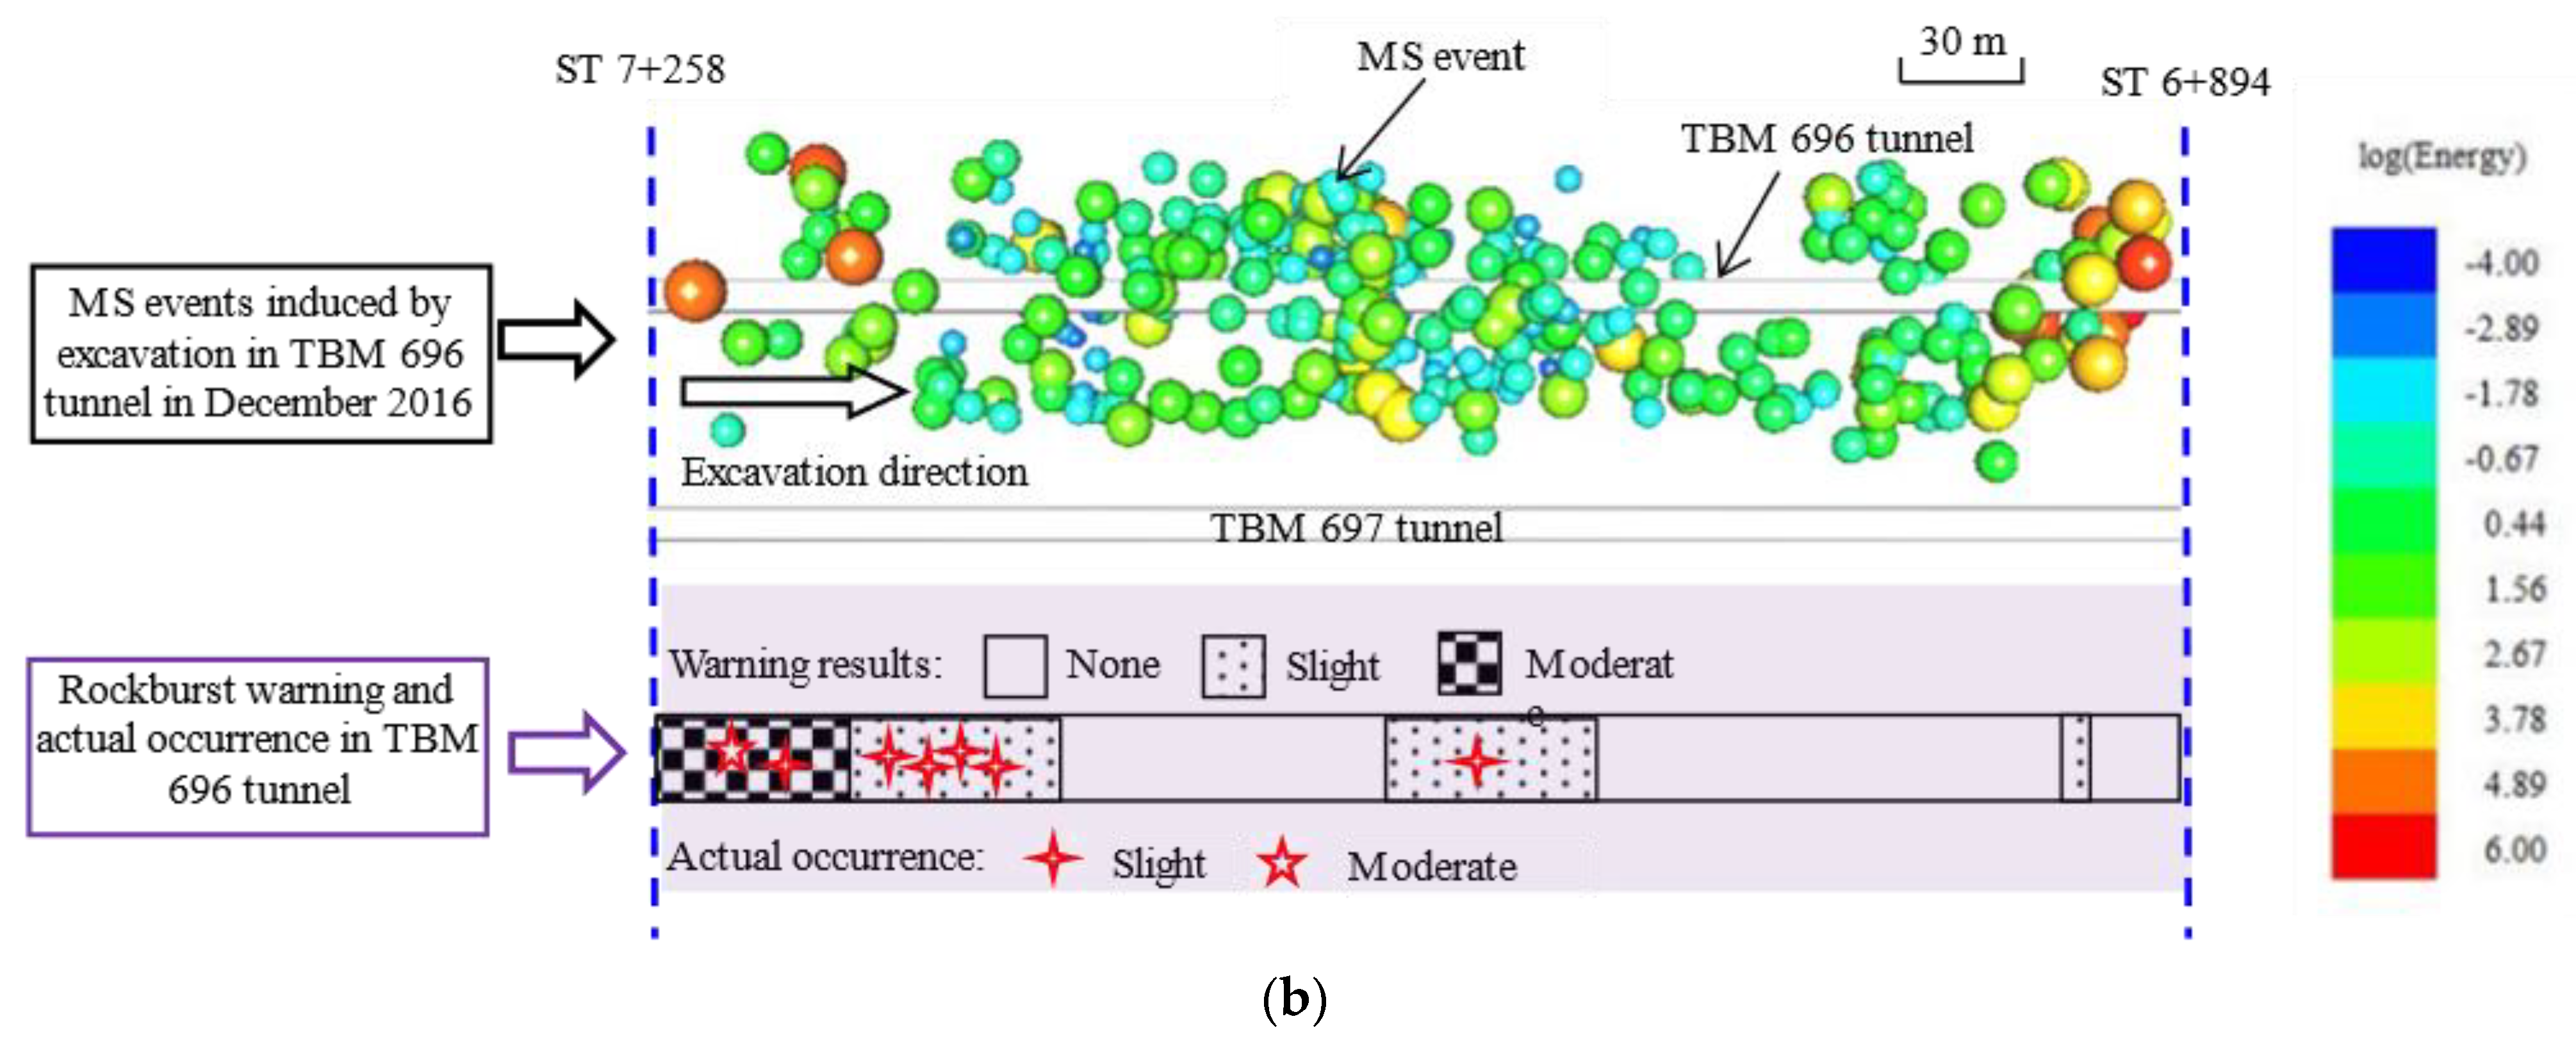
4.1. Rockburst Warning Methods and Warning Effectiveness

Microseismic monitoring technology has been widely used in the early warning of rockburst risks in mines, hydropower stations, and transportation tunnels. Microseismic monitoring can monitor the whole process of rock mass fracture and damage in real time and can infer the stability status of the rock mass, making real-time and accurate warning of rockburst risks possible. Feng et al. [3] conducted a series of studies on microseismic monitoring-based rockburst prediction and warning and proposed a quantitative warning method for rockburst based on microseismic information [12]. This method has been successfully applied in major projects such as the tunnel group of the Jinping-II hydropower station [12] and a railway tunnel in Southwest China [15,34]. Currently, this method has been included in the “Technical code for rockburst risk assessment of hydropower projects” [44], and the detailed quantitative warning method for rockburst can be found in the above research results.
The abovementioned method is used for rockburst warning in twin headrace tunnels, and the warning results are sent to the owner, supervisor, construction party, and other relevant units in the form of daily reports. The warning daily report for the twin headrace tunnels is released at 8:00 a.m. every day to provide reference for construction and management personnel to prevent and control rockburst risks (the two TBM machines undergo maintenance from 8:00 a.m. to 2:00 p.m. every day, and production excavation is carried out at other times). A monthly summary is conducted to summarize the effectiveness of rockburst warning in the form of a monthly report and to dynamically summarize the rockburst and microseismicity patterns to improve the accuracy of rockburst warning results. The accuracy of the on-site rockburst warning based on MS monitoring is very good, with a warning coincidence rate of over 90% for each intensity of rockburst risk warning. The so-called warning coincidence refers to the consistency between the predicted rockburst intensity and the actual rockburst intensity in the warning area.
The upper part of Figure 8a shows microseismicity caused by excavation unloading during TBM excavated chainage ST 7 + 515 to chainage ST 7 + 258 of TBM 696 tunnel in November 2016. The upper part of Figure 8b shows the microseismicity caused by excavation unloading during TBM excavated chainage ST 7 + 258 to chainage ST 6 + 894 of TBM 696 tunnel in December 2016. Based on the MS data monitored by the MS system, rockburst warnings can be made in real time using the rockburst warning method discussed above [3,12]. The lower part of Figure 8a,b shows a comparison between the rockburst warning results based on microseismic monitoring and the actual rockburst occurrence in November and December 2016, respectively. From the upper part of Figure 8a,b, it is observed that the areas with high microseismic event clustering and high microseismic energy release have higher frequencies and intensities of rockburst occurrence. The high-risk rockburst areas are consistent with the highly active microseismic areas. From the lower part of Figure 8a,b, all the rockbursts of different intensities were accurately warned, indicating a high success rate of rockburst warning.

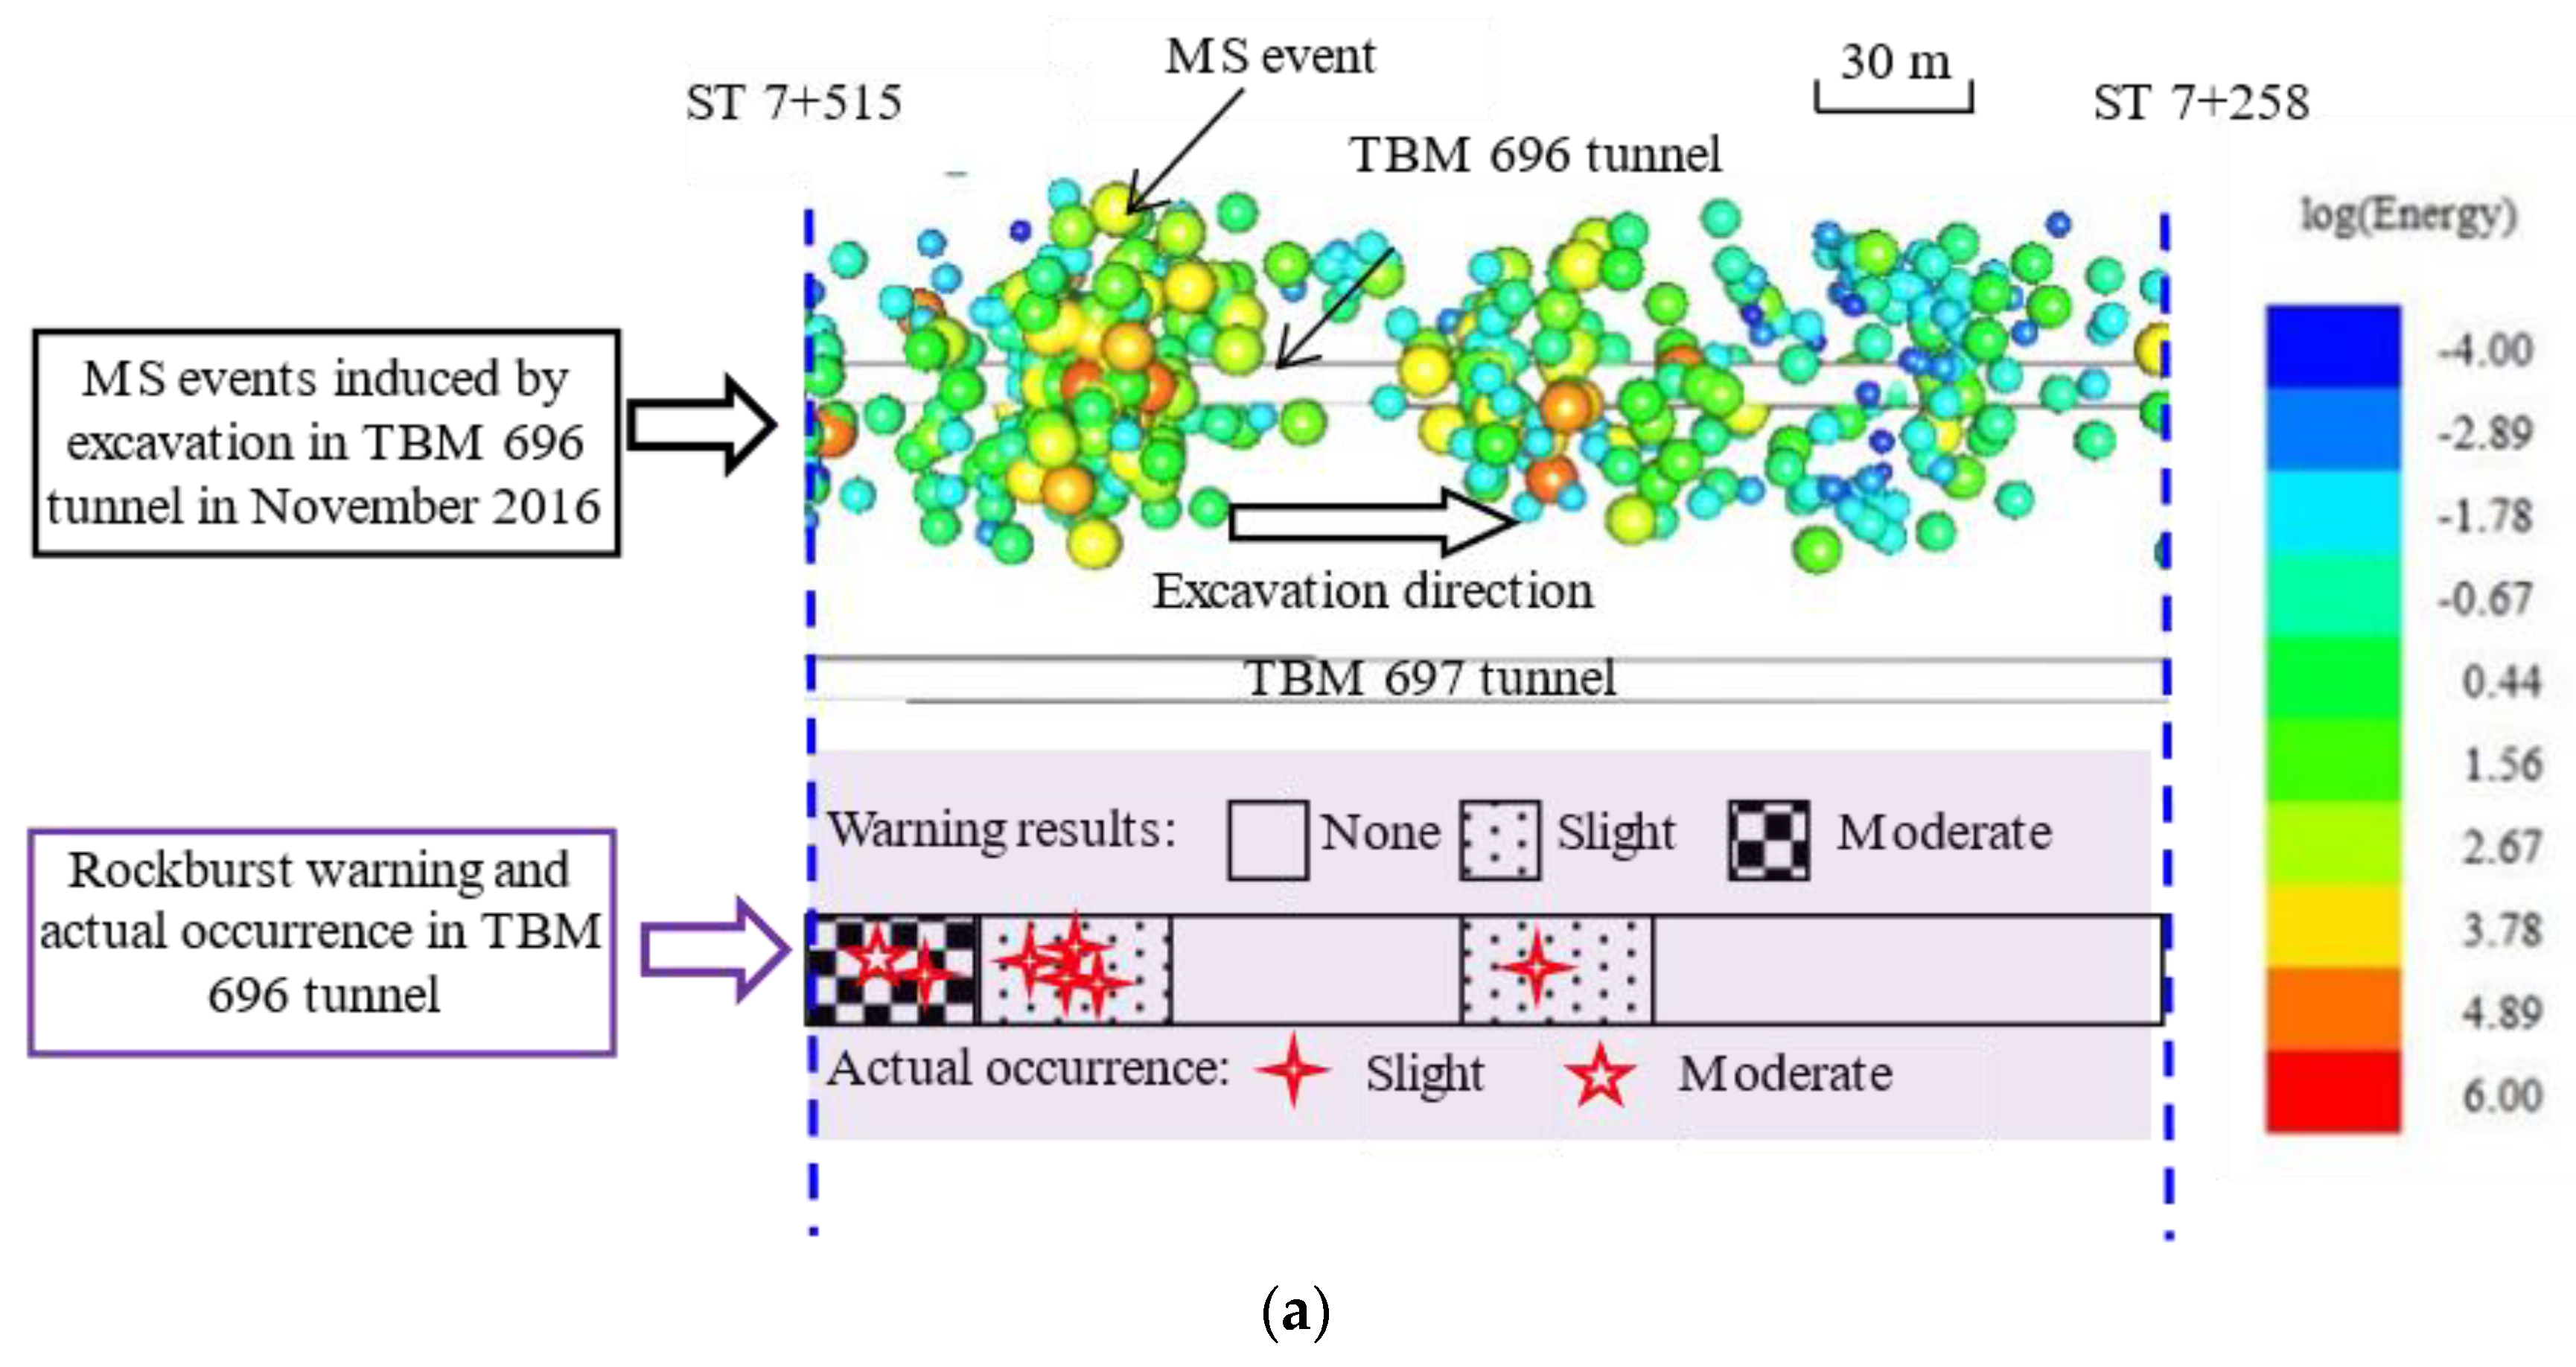
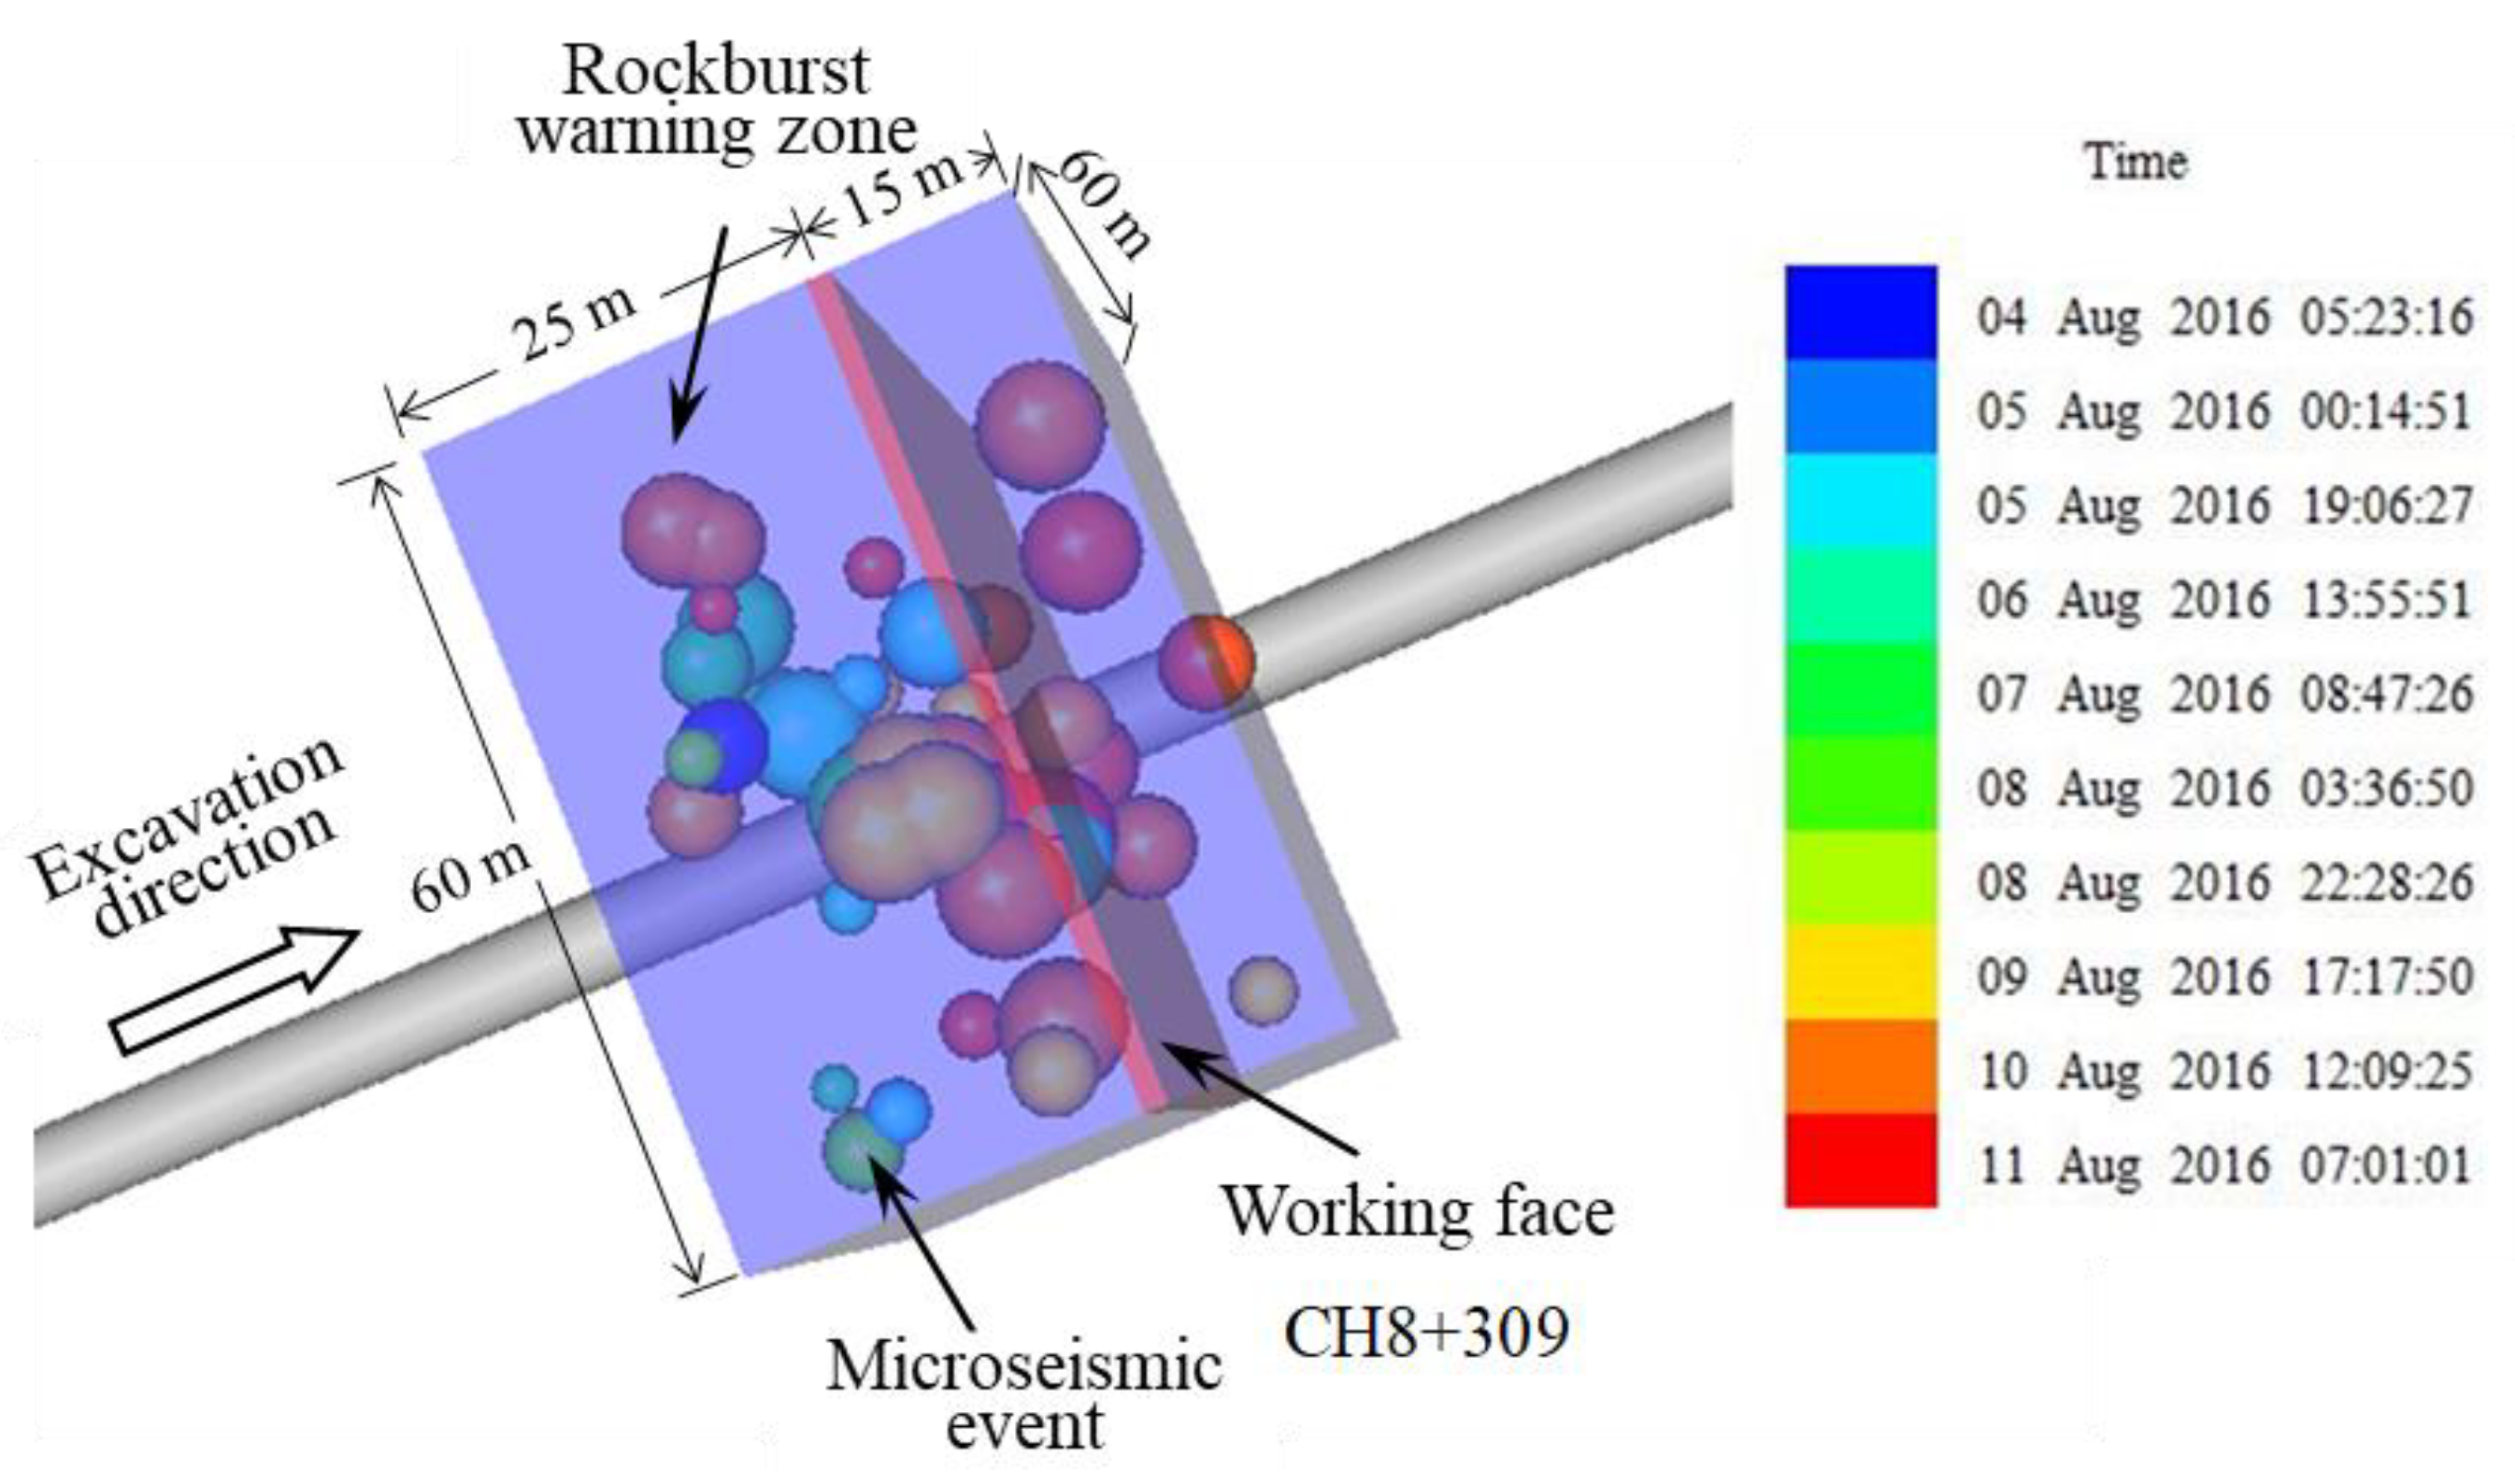
4.2. Rockburst Warning and Mitigation: A Case Report

The following is a case of rockburst warning and mitigation to illustrate the application of warning methods and the implementation process of rockburst control measures.
On 10 August 2016, the TBM696 tunnel was excavated to CH 8 + 309. The lithology and geological exposure of the area are shown in Figure 9. The microseismic monitoring system operated well in this area. According to the quantitative microseismic early warning method for rockburst [12], the six parameters used for microseismic rockburst early warning in the rockburst risk early warning area were obtained, namely, the number of microseismic events on that day, the release energy of microseismic events on that day, the apparent stress of microseismic events on that day, the cumulative number of microseismic events, the cumulative release energy of microseismic events, and the cumulative microseismic apparent volume. According to the rockburst warning method, the dynamic warning zone in the TBM 696 tunnel is shown in Figure 10, with a size of 40 m × 60 m × 60 m. The six parameters were then accordingly derived from the warning zone, and by using the quantitative rockburst warning method, it is known that the probability of an intense rockburst occurring in this area is 15.4%, the probability of a moderate rockburst occurring is 56.8%, the probability of a slight rockburst occurring is 17.7%, and the probability of no rockburst occurring is 10.1%. This means that there is a moderate risk of rockburst in the warning area.
The microseismic data processing and decision-making office of the TBM project camp released a warning result in the daily report that there was moderate rockburst in the warning zone and notified the construction unit of the warning result before 8 am. The constructor took rockburst control and mitigation measures based on the rockburst early warning results, and on 11 August, the on-site control plan of shortening the footage combined with horizontal pressure relief holes was adopted: the footage on the day was reduced from 6.8 m on the previous day to 5.2 m, and four horizontal pressure relief holes were constructed in the manner shown in Figure 7.
After implementing the rockburst control and mitigation measures, the number of microseismic events in the rockburst risk warning area decreased from 19 on the 10th to 9 on the 11th, and the microseismic radiated energy decreased from 2.39 × 10⁴ J on the 10th to 1.21 × 10³ J on the 11th. The spatial distribution of the microseismic events in the warning area before and after the control is shown in Figure 11. It can be seen from Figure 11 that, before the implementation of rockburst control measures, microseismic events showed a clustering pattern. However, after the implementation of rockburst control measures, the spatial distribution of microseismic events showed a discrete pattern, and the microseismic events were mainly low-energy events. The microseismic activity decreased significantly. Due to the implementation of the control and mitigation measures, the rockburst risk was reduced, and no rockburst occurred during the excavation process on 11 August, achieving a good rockburst prevention and control effect.

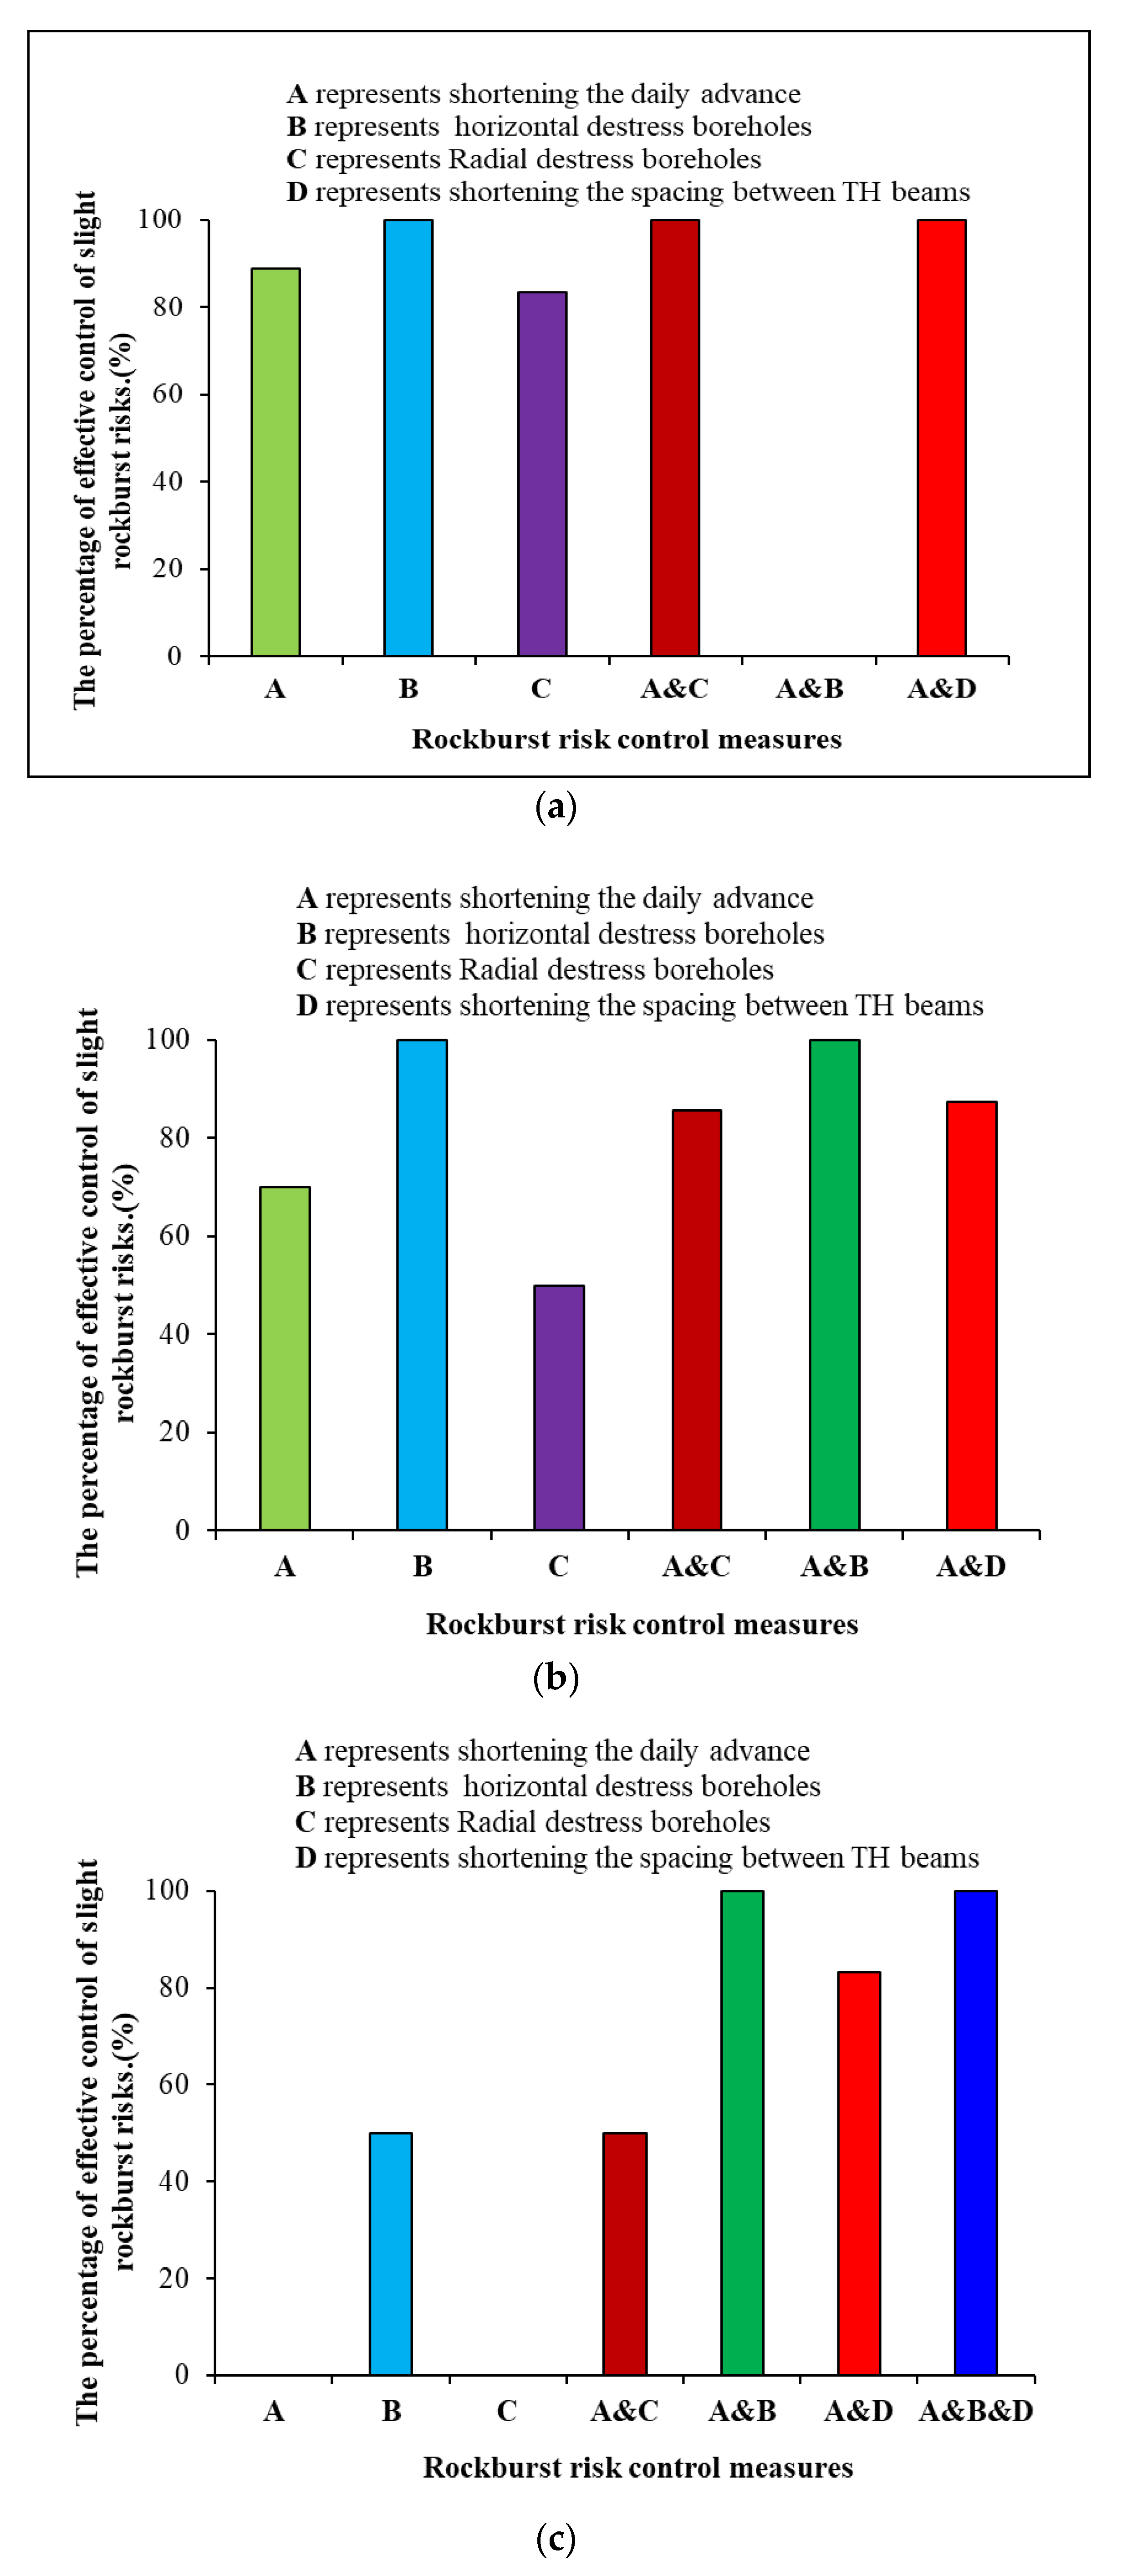
4.3. The Control and Mitigation Effect of Different Mitigation Measures on Rockburst Risks of Different Intensities

As mentioned earlier, based on microseismic monitoring, the rockburst early warning has a high success rate in twin headrace tunnels, with correct rates of over 90% for early warning of rockburst risks of different intensities. Based on that, it can be assumed that the actual occurrence of rockbursts will be consistent with the early warning results when no control or mitigation measures are taken. Before evaluating rockburst control measures, the author screened rockburst control cases, selecting cases with similar excavation support conditions and similar or identical parameters for rockburst control measures. A total of 94 rockburst control and mitigation cases were selected for the twin headrace tunnels, including 21 cases of intense rockburst mitigation, 43 cases of moderate rockburst mitigation, and 30 cases of slight rockburst mitigation. Table 2 shows the distribution of different control or mitigation measures for intense, moderate, and slight rockburst risk mitigation cases. From the table, it is observed that single measures and combined measures are applied to control and mitigate rockburst risks of different intensities. This information reflects that on-site rockburst risk control and mitigation do not show strong rationality, indicating that the measures implemented for different intensity rockburst risks have certain irrationality, and this is not conducive to on-site rockburst risk prevention and mitigation, and thus the control or mitigation measures need to be further optimized.
Figure 12 shows the distribution of the control effects of different control measures for rockburst risks of different intensities. Effective control means that the actual intensity of rockburst occurrence after taking mitigation measures for each intensity of rockburst risk is not higher than slight rockburst (when warning of slight rockburst risk, the control effect is considered effective if no rockburst actually occurs). Based on Figure 12a, it is observed that for slight rockburst risks, both single control measures and combined control measures have good control effects, with effective rates of controlling and mitigating rockburst risks reaching over 80%. For moderate rockburst risks, as shown in Figure 12b, except for the radial unloading hole control measure, all other control measures and combined control measures have effective rates of controlling rockburst risks greater than 80% and have good effects. Based on Figure 12c, it is observed that, for intense rockburst risks, the effective rates of rockburst risk control for horizontal unloading holes and the combination of shortening daily advance and radial unloading holes are relatively low, while the combination of shortening daily advance and horizontal destress boreholes and the combination of shortening daily advance, horizontal destress boreholes, and shortening the TH beam spacing have good control effects.

5. The Optimized Mitigation Measures for Different Intensity Rockburst Risks in the Twin Headrace Tunnels

After comprehensive consideration of different control measures and their combined forms of rockburst risk control effectiveness, as well as time and cost factors, the optimized control or mitigation measures for slight, moderate, and intense rockburst risks of the twin headrace tunnel N-J Hydropower Station are shown in Table 3. The preferred order of measures taken for different intensities of rockburst risk is shown in the table as ① and ②. For example, the best mitigation and control measures for moderate rockburst risk are to construct horizontal destress boreholes, followed by shortened daily advance combined with radial destress boreholes.

6. Conclusions

The rockburst risk of the twin headrace tunnels of the N-J hydropower station is very high. Hundreds of rockbursts ranging from slight to extremely intense occurred during the excavation of the twin TBM tunnels. MS monitoring systems were adopted to provide early warning rockburst risk and guidance for controlling and managing rockburst risk in the twin tunnels. Correspondingly, a large number of on-site first-hand rockburst control cases have been obtained accordingly, providing an excellent opportunity for in-depth research on rockburst control measures using on-site data. This work systematically summarizes the construction parameters, time and expense, and rockburst control ability of different rockburst control measures applied in the N-J hydropower station using 94 on-site rockburst control cases and a large amount of microseismic monitoring data. Based on this, the rockburst control measures for different intensities of rockburst risks were optimized, and the specific conclusions obtained are as follows:
(1)
Four measures are mainly taken to control rockburst risk in twin TBM tunnels, including implementing radial destress boreholes, implementing horizontal destress boreholes, shortening the daily advance, and shortening the spacing between TH beams, as well as their combinations. The control mechanism and the time and expense cost of the rockburst control measures are different from each other. The degree of impact on production is sorted from high to low as shortening the daily advance, shortening the spacing between TH beams, implementing horizontal destress boreholes, and implementing radial destress boreholes.
(2)
MS monitoring has been successfully applied in rockburst early warning and management in twin TBM tunnels. After adopting rockburst control measures, microseismic activity is reduced, energy release from the rock mass is reduced, and rockburst risk is alleviated. Different rockburst control measures have varying degrees of risk mitigation, i.e., varying rockburst control capabilities. Shortening the daily advance, horizontal destress boreholes, and spacing between TH beams are powerful control measures for preventing and controlling rockbursts. The combined control measures have greater control capabilities than a single measure.
(3)
Optimized control or mitigation measures for different intensity rockburst risks in the twin headrace tunnels of the N-J Hydropower Station are proposed. For slight rockburst risk, normal excavation procedures can be followed, as the on-site hazards are relatively small. For moderate rockburst risk, horizontal destress boreholes are the preferred construction method. For intense rockburst risk, the preferred control measure is to shorten daily advance and combine it with horizontal destress boreholes.
There is currently no case of an extremely intense rockburst warning and corresponding control and mitigation measures for the twin headrace tunnels of the N-J hydropower station, making it impossible to obtain reasonable and effective control measures through case analysis. However, based on the relevant analysis results in this paper, it can be inferred that, in response to the potential extremely intense rockburst in the twin headrace tunnels of the N-J project, at least a combination of mitigation measures such as shortening daily advance, (horizontal and vertical) destress boreholes, and shortening the spacing of TH beams should be taken. At the same time, advanced technologies such as laying explosion-proof mesh (passive protection) and constructing energy absorbing anchor bolts should be adopted. The research results provide a valuable reference for rockburst risk prevention and mitigation in the N-J project and similar TBM excavation projects.

Author Contributions

Methodology, resources, supervision, data curation, writing—original draft P.L. (Pengxiang Li); investigation, formal analysis, writing—original draft, supervision, funding acquisition, J.Z.; methodology, investigation, formal analysis, W.B.; validation, writing—review and editing, W.N. and P.L. (Pinpin Liu); methodology, writing—review and editing, M.S. All authors have read and agreed to the published version of the manuscript.

Funding

This research was funded by the National Natural Science Foundation of China under Grant 52209132 and Natural Science Foundation of Shandong Provincial, China, under Grant No. ZR2020ME100.

Institutional Review Board Statement

Not applicable.

Informed Consent Statement

Not applicable.

Data Availability Statement

The data that support the findings of this study are available from the corresponding author upon reasonable request.

Acknowledgments

The authors appreciate the help and assistance from the Beijing Vibroflotation Engineering Co., Ltd., Neelum–Jhelum Consultant (NJC), China Gezhouba Group Co., Ltd., and Bei Fang Investigation, Design & Research Co., Ltd. Xia-Ting Feng, Bing-Rui Chen, Ya-Xun Xiao, Guang-Liang Feng, CEng Gary Peach, and Shuang Tan are also acknowledged for their constructive suggestions and help during the research.

Conflicts of Interest

The authors declare no conflict of interest.

References

  1. Kaiser, P.K.; Cai, M. Design of rock support system under rockburst condition. J. Rock Mech. Geotech. Eng. 2012, 4, 215–227. [Google Scholar] [CrossRef]
  2. Lu, C.; Cai, C. Challenges and Countermeasures for Construction Safety during the Sichuan–Tibet Railway Project. Engineering 2019, 5, 833–838. [Google Scholar] [CrossRef]
  3. Feng, X.T. Rockburst: Mechanism, Monitoring, Warning and Mitigation, 1st ed.; Elsevier-Health Sciences Division: Oxford, UK, 2017. [Google Scholar]
  4. Feng, X.T.; Chen, B.R.; Zhang, C.Q.; Li, S.J.; Wu, S.Y. Mechanism, Warning and Dynamic Control of Rockburst Development Processes, 1st ed.; Science Press: Beijing, China, 2013. (In Chinese) [Google Scholar]
  5. Li, P.-X.; Chen, B.-R.; Xiao, Y.-X.; Feng, G.-L.; Zhou, Y.-Y.; Zhao, J.-S. Rockburst and microseismic activity in a lagging tunnel as the spacing between twin TBM excavated tunnels changes: A case from the Neelum-Jhelum hydropower project. Tunn. Undergr. Space Technol. 2023, 132, 104884. [Google Scholar] [CrossRef]
  6. Poplawski, R.F. Seismic parameters and rockburst hazard at Mt Charlotte mine. Int. J. Rock Mech. Min. Sci. 1997, 4, 1213–1228. [Google Scholar] [CrossRef]
  7. Zhang, C.; Feng, X.; Zhou, H.; Qiu, S.; Wu, W. A Top Pilot Tunnel Preconditioning Method for the Prevention of Extremely Intense Rockbursts in Deep Tunnels Excavated by TBMs. Rock Mech. Rock Eng. 2011, 45, 289–309. [Google Scholar] [CrossRef]
  8. Cai, M. Principles of rock support in burst-prone ground. Tunn. Undergr. Space Technol. 2013, 36, 46–56. [Google Scholar] [CrossRef]
  9. Ma, T.; Tang, C.; Tang, L.; Zhang, W.; Wang, L. Rockburst characteristics and microseismic monitoring of deep-buried tunnels for Jinping II Hydropower Station. Tunn. Undergr. Space Technol. 2015, 49, 345–368. [Google Scholar] [CrossRef]
  10. He, M.; e Sousa, L.R.; Miranda, T.; Zhu, G. Rockburst laboratory tests database—Application of data mining techniques. Eng. Geol. 2015, 185, 116–130. [Google Scholar] [CrossRef]
  11. Mazaira, A.; Konicek, P. Intense rockburst impacts in deep underground construction and their prevention. Can. Geotech. J. 2015, 52, 1426–1439. [Google Scholar] [CrossRef]
  12. Feng, G.-L.; Feng, X.-T.; Chen, B.-R.; Xiao, Y.-X.; Yu, Y. A Microseismic Method for Dynamic Warning of Rockburst Development Processes in Tunnels. Rock Mech. Rock Eng. 2014, 48, 2061–2076. [Google Scholar] [CrossRef]
  13. Li, P.-X.; Feng, X.-T.; Feng, G.-L.; Xiao, Y.-X.; Chen, B.-R. Rockburst and microseismic characteristics around lithological interfaces under different excavation directions in deep tunnels. Eng. Geol. 2019, 260, 105209. [Google Scholar] [CrossRef]
  14. Zhang, W.; Feng, X.-T.; Yao, Z.-B.; Hu, L.; Xiao, Y.-X.; Feng, G.-L.; Niu, W.-J.; Zhang, Y. Development and Occurrence Mechanisms of Fault-Slip Rockburst in a Deep Tunnel Excavated by Drilling and Blasting: A Case Study. Rock Mech. Rock Eng. 2022, 55, 5599–5618. [Google Scholar] [CrossRef]
  15. Niu, W.; Feng, X.-T.; Yao, Z.; Bi, X.; Yang, C.; Hu, L.; Zhang, W. Types and occurrence time of rockbursts in tunnel affected by geological conditions and drilling & blasting procedures. Eng. Geol. 2022, 303, 106671. [Google Scholar]
  16. Russenes, B.F. Analysis of Rock Spalling for Tunnels in Steep Valley Sides. Master’s Thesis, Norwegian Institute of Technology, Trondheim, Norway, 1974. [Google Scholar]
  17. Barton, N.; Lien, R.; Lunde, J. Engineering classification of rock masses for the design of tunnel support. Rock Mech. Rock Eng. 1974, 6, 189–236. [Google Scholar] [CrossRef]
  18. Gong, F.Q.; Wang, Y.L.; Luo, S. Rockburst proneness criteria for rock materials: Review and new insights. J. Cent. South Univ. 2020, 27, 2793–2821. [Google Scholar] [CrossRef]
  19. Hoek, E.; Brown, T. Underground Excavation in Rock; The Institute of Mining and Metallurgy: London, UK, 1980. [Google Scholar]
  20. Kidybiski, A. Bursting liability indices of coal. Int. J. Rock Mech. Min. Sci. 1981, 18, 295–304. [Google Scholar] [CrossRef]
  21. Cook, N.G.W.; Hoek, E.; Pretorius, J.P.G.; Ortlepp, W.D.; Salamon, M.D.G. Rock mechanics applied to the study of rockbursts. J. S. Afr. Inst. Min. Metall. 1966, 66, 435–528. [Google Scholar]
  22. Gong, F.; Yan, J.; Li, X.; Luo, S. A peak-strength strain energy storage index for rock burst proneness of rock materials. Int. J. Rock Mech. Min. Sci. 2019, 117, 76–89. [Google Scholar] [CrossRef]
  23. Zhang, J.J.; Fu, B.J. Rockburst and its criteria and control. Chin. J. Rock Mech. Eng. 2008, 27, 2034–2042. (In Chinese) [Google Scholar]
  24. Zhou, J.; Li, X.; Mitri, H.S. Evaluation method of rockburst: State-of-the-art literature review. Tunn. Undergr. Space Technol. 2018, 81, 632–659. [Google Scholar] [CrossRef]
  25. Alcott, J.M.; Kaiser, P.K.; Simser, B.P. Use of Microseismic Source Parameters for Rockburst Hazard Assessment. Pure Appl. Geophys. 1998, 153, 41–65. [Google Scholar] [CrossRef]
  26. Hudyma, M.; Potvin, Y.H. An Engineering Approach to Seismic Risk Management in Hardrock Mines. Rock Mech. Rock Eng. 2009, 43, 891–906. [Google Scholar] [CrossRef]
  27. Zhao, J.S.; Jiang, Q.; Lu, J.F.; Chen, B.R.; Pei, S.F.; Wang, Z.L. Rock fracturing observation based on microseismic monitoring and borehole imaging: In situ investigation in a large underground cavern under high geo-stress. Tunn. Undergr. Space Technol. 2022, 126, 104549. [Google Scholar] [CrossRef]
  28. Salvoni, M.; Dight, P.M. Rock damage assessment in a large unstable slope from microseismic monitoring—MMG Century mine (Queensland, Australia) case study. Eng. Geol. 2016, 210, 45–56. [Google Scholar] [CrossRef]
  29. Dai, F.; Li, B.; Xu, N.; Fan, Y.; Zhang, C. Deformation forecasting and stability analysis of large-scale underground powerhouse caverns from microseismic monitoring. Int. J. Rock Mech. Min. Sci. 2016, 86, 269–281. [Google Scholar] [CrossRef]
  30. Cao, A.-Y.; Dou, L.-M.; Wang, C.-B.; Yao, X.-X.; Dong, J.-Y.; Gu, Y. Microseismic Precursory Characteristics of Rock Burst Hazard in Mining Areas Near a Large Residual Coal Pillar: A Case Study from Xuzhuang Coal Mine, Xuzhou, China. Rock Mech. Rock Eng. 2016, 49, 4407–4422. [Google Scholar] [CrossRef]
  31. Tang, Z.; Liu, X.; Xu, Q.; Li, C.; Qin, P. Stability evaluation of deep-buried TBM construction tunnel based on microseismic monitoring technology. Tunn. Undergr. Space Technol. 2018, 81, 512–524. [Google Scholar] [CrossRef]
  32. Kumar, V.; Gopalakrishnan, N.; Singh, N.P.; Cherukuri, S. Microseismic monitoring application for primary stability evaluation of the powerhouse of the Tapovan Vishnugad Hydropower Project. J. Earth Syst. Sci. 2019, 128, 169. [Google Scholar] [CrossRef]
  33. Liu, F.; Tang, C.A.; Ma, T.H.; Tang, L.X. Characterizing Rockbursts Along a Structural Plane in a Tunnel of the Hanjiang-to-Weihe River Diversion Project by Microseismic Monitoring. Rock Mech. Rock Eng. 2019, 52, 1835–1856. [Google Scholar] [CrossRef]
  34. Feng, G.-L.; Feng, X.-T.; Xiao, Y.-X.; Yao, Z.-B.; Hu, L.; Niu, W.-J.; Li, T. Characteristic microseismicity during the development process of intermittent rockburst in a deep railway tunnel. Int. J. Rock Mech. Min. Sci. 2019, 124, 104135. [Google Scholar] [CrossRef]
  35. Zhao, J.S.; Jiang, Q.; Pei, S.F.; Chen, B.R.; Xu, D.P.; Song, L.B. Microseismicity and focal mechanism of blasting-induced block falling of intersecting chamber of large underground cavern under high geo-stress. J. Cent. South Univ. 2023, 30, 542–554. [Google Scholar] [CrossRef]
  36. Konicek, P.; Soucek, K.; Stas, L.; Singh, R. Long-hole destress blasting for rockburst control during deep underground coal mining. Int. J. Rock Mech. Min. Sci. 2013, 61, 141–153. [Google Scholar] [CrossRef]
  37. Zhu, Q.; Feng, Y.; Cai, M.; Liu, J.; Wang, H. Interpretation of the extent of hydraulic fracturing for rockburst prevention using microseismic monitoring data. J. Nat. Gas Sci. Eng. 2017, 38, 107–119. [Google Scholar] [CrossRef]
  38. Li, C.C. A new energy-absorbing bolt for rock support in high stress rock masses. Int. J. Rock Mech. Min. Sci. 2010, 47, 396–404. [Google Scholar]
  39. Zhang, M.Y.; Yu, D.M.; Wang, T.Y.; Xu, C. Coupling analysis of tunnel construction safety risks based on N-K model and SD causalitydiagram. Buildings 2023, 13, 1081. [Google Scholar] [CrossRef]
  40. Fan, Y.; Lu, W.; Zhou, Y.; Yan, P.; Leng, Z.; Chen, M. Influence of tunneling methods on the strainburst characteristics during the excavation of deep rock masses. Eng. Geol. 2016, 201, 85–95. [Google Scholar] [CrossRef]
  41. Yan, P.; Zhao, Z.; Lu, W.; Fan, Y.; Chen, X.; Shan, Z. Mitigation of rock burst events by blasting techniques during deep-tunnel excavation. Eng. Geol. 2015, 188, 126–136. [Google Scholar] [CrossRef]
  42. Jiang, B.; Ding, M.; Li, W.; Gu, S.; Ji, H. Investigation on Characteristics and Prevention of Rockburst in a Deep Hard and Soft Compound Stratum Tunnel Excavated Using TBM. Sustainability 2022, 14, 3190. [Google Scholar] [CrossRef]
  43. Xiao, Y.X.; Feng, X.T.; Hudson, J.A.; Chen, B.R.; Feng, G.L.; Liu, J.P. ISRM suggested method for in situ microseismic moni-toring of the fracturing process in rock masses. Rock Mech. Rock Eng. 2016, 49, 343–369. [Google Scholar] [CrossRef]
  44. China Renewable Energy Engineering Institute. Technical Code for Rockburst Risk Assessment of Hydropower Projects NB/T 10143-2019; China Water & Power Press: Beijing, China, 2019. (In Chinese) [Google Scholar]
Figure 1. The location of the Neelum–Jhelum hydropower station (modified from Neelum–Jhelum Consultant).
Buildings 13 01440 g001
Figure 2. Longitudinal-sectional geological diagram of the headrace tunnels (Li et al. [19]).
Buildings 13 01440 g002
Figure 3. Microseismic system used in the twin headrace tunnels: (a) the composition of the MS system (modified from Feng et al. [3]), (b) MS monitoring office on the TBM, and (c) installation of sensors with recovery devices in situ (modified from Li et al. [5]).
Buildings 13 01440 g003
Figure 4. Layout of microseismic sensors in tunnels.
Buildings 13 01440 g004
Figure 5. Diagram illustrating the topological structure of the network used to monitor the microseismic activity in the headrace tunnels of the N-J hydropower station (modified from Li et al. [5]).
Buildings 13 01440 g005
Figure 6. Construction machinery and section layout of the radial destress borehole: (a) the construction equipment of the radial destress borehole and (b) the radial destress borehole cross-sectional layout diagram.
Buildings 13 01440 g006
Figure 7. Construction machinery and section layout of horizontal destress borehole: (a) the construction equipment of the horizontal destress borehole and (b) the horizontal destress borehole sectional layout diagram.
Buildings 13 01440 g007
Figure 8. The microseismicity caused by the TBM excavated chainage ST 7 + 515 to chainage ST 7 + 258 of the TBM 696 tunnel in November and December 2016 (sphere size represents the microseismic energy and larger spheres correspond to higher microseismic energy) and the comparison between rockburst warning and actual results in November and December 2016: (a) November and (b) December.
Buildings 13 01440 g008aBuildings 13 01440 g008b
Figure 9. Lithology and geological information of the rockburst risk control area.
Buildings 13 01440 g009
Figure 10. Temporal and spatial distribution of microseismic events in the rockburst warning area (sphere size represents the microseismic energy, and larger spheres correspond to higher microseismic energy).
Buildings 13 01440 g010
Figure 11. Spatial distribution of intraday microseismic events before and after the implementation of reducing footage combined horizontal relief holes (sphere size represents the microseismic energy and larger spheres correspond to higher microseismic energy): (a) Spatial distribution of microseismic events on 10 August, the day before the implementation of rockburst control measures (the occurrence sequence and time of microseismic events: ① 17:59:00 10 August; ② 22:33:19 10 August; ③ 22:42:10 10 August; ④ 23:02:13 10 August; ⑤ 23: 40:11 10 August; ⑥ 00:13:48 11 August; ⑦ 01:26:45 11 August; ⑧ 03:19:22 11 August; ⑨ 03:31:35 11 August; ⑩ 03:56:01 11 August; ⑪ 04:01:37 11 August; ⑫ 04:32:19 11 August; ⑬ 04:41:05 11 August; ⑭ 04:57:41 11 August; ⑮ 05:22:54 11 August; ⑯ 05:43:17 11 August; ⑰ 06:27:21 11 August; ⑱ 06:42:50 11 August; ⑲ 07:01:01 11 August); and (b) Spatial distribution of microseismic events on 11 August, the day after the implementation of rockburst control measures (the occurrence sequence and time of microseismic events: ① 15:10:09 11 August; ② 18:19:37 11 August; ③ 17:36:25 11 August; ④ 22:23:27 11 August; ⑤ 00:03:41 12 August; ⑥ 01:39:22 12 August; ⑦ 02:30:01 12 August; ⑧ 04:11:56 12 August; ⑨ 05:00:28 12 August).
Buildings 13 01440 g011
Figure 12. Distribution of the control effect of different control measures for different intensities of rockburst risk: (a) control effects of different control measures on the risk of slight rockburst, (b) control effects of different control measures on the risk of moderate rockburst, and (c) control effects of different control measures on the risk of intense rockburst.
Buildings 13 01440 g012
Table 1. Time cost and consumption cost of different rockburst control measures.
Rockburst Control MeasuresInput of ManpowerTime-ConsumingAsset ConsumptionTiming of ImplementationDegree of Impact on Advance Rate
Radial destress boreholes1~2 people2~3 hMachine wearDuring excavation or maintenanceMinor
Horizontal destress boreholes2~3 people5~8 hMachine wearDuring excavation or maintenanceModerate
Shortening the daily advance---During excavationMajor
Shortening the spacing between TH beams4~5 people1~3 h per pieceCNY 14,000 per pieceDuring excavationModerate to Major
Table 2. Case distribution of different control measures for different intensities of rockburst risk.
Rockburst Risk LevelShortening Daily AdvanceHorizontal Destress BoreholesRadial Destress BoreholesShortening Daily Advance & Radial Destress BoreholesShortening Daily Advance & Horizontal Destress BoreholesShortening Daily Advance & Shortening Spacing between TH BeamsShortening Daily Advance & Shortening Spacing between TH Beams & Horizontal Destress BoreholesTotal Number of Cases
Intense-4-246521
Moderate1048768-43
Slight9268-5-30
Table 3. Control measures for different intensity rockburst risks in N-J twin headrace tunnels.
Rockburst Risk LevelControl Measures
Intense① Shortening daily advance & horizontal destress boreholes; ② Shortening daily advance & horizontal destress boreholes & shortening spacing between TH beams
Moderate① Horizontal destress boreholes; ② Shortening daily advance & radial destress boreholes
Slight① Normal procedure; ② Radial destress boreholes; ③ Shortening daily advance
Disclaimer/Publisher’s Note: The statements, opinions and data contained in all publications are solely those of the individual author(s) and contributor(s) and not of MDPI and/or the editor(s). MDPI and/or the editor(s) disclaim responsibility for any injury to people or property resulting from any ideas, methods, instructions or products referred to in the content.

