Article

Development of a Performance Index Model for Evaluation of BIM-Based Stakeholder Management Using Fuzzy Synthetic Evaluation

Department of Civil Engineering, Visvesvaraya National Institute of Technology, Nagpur 440010, India
*
Author to whom correspondence should be addressed.
Buildings 2023, 13(6), 1441; https://doi.org/10.3390/buildings13061441
Submission received: 18 March 2023 / Revised: 28 April 2023 / Accepted: 29 May 2023 / Published: 31 May 2023

Abstract

:
A continuous evaluation of the stakeholder management process can be achieved using definitive key performance indicators (KPIs). An exhaustive literature survey in this direction provided a set of 26 indicators assessed through a questionnaire survey for their possible implications on the stakeholder management process. The survey was conducted among 55 respondents with experience in using building information modeling (BIM) in mega-construction projects. The data were initially analyzed through factor analysis to establish six KPIs. Fuzzy synthetic evaluation (FSE) was used to evaluate the index values of the established KPIs to assess their importance levels. The results presented the KPIs in decreasing order of their index values: asset performance (4.27), open innovation (4.04), project O&M expenses (3.97), design process efficiency (3.95), project execution efficiency (3.90), and stakeholder concerns (3.59). The results generated a stakeholder management process assessment framework and model that provides a clear insight into using an indicator in measuring the specific stakeholder management dimension. The findings of this work can provide definite insight amongst planning managers about the stakeholder management process through the posited indicators. Further, they can adopt measures to improve the stakeholder management process in their respective projects.

1. Introduction

Changing trends in the construction industry have resulted in increased project complexity due to the involvement of numerous stakeholders. It has, therefore, shifted the focus toward the strategies incorporated in managing these stakeholders to evaluate project success [1]. It becomes more challenging in the context of mega-construction projects that are long-duration projects and witnesses the association of numerous stakeholders throughout their life span [2]. Due to this, the existing parameters for judging projects’ success, particularly the iron triangle elements (i.e., time, cost, and quality) [3], fail to suffice the success measurement criteria [4].
Extending these indicators has brought safety and environmental sustainability into the mix. A detailed look at them essentially prompts their impetus in measuring the satisfaction of different stakeholders, i.e., clients, contractors, local communities, environmental organizations, suppliers, etc. [5]. Based on this, numerous studies have been done that have identified several strategies for stakeholder management. These strategies essentially break down into four specific stakeholder management dimensions, i.e., stakeholder identification and categorization, stakeholder communication and collaboration, stakeholder engagement, and stakeholder satisfaction [6,7]. However, fulfilling these strategies has been challenging, and several studies have focused on identifying specific technological tools and processes that can streamline the stakeholder management processes.
Such studies have posited building information modeling (BIM) as a significant technological tool that can provide the impetus for project stakeholders’ management. BIM is explained as a digital model of the building [8] that the stakeholders can use in the planning and execution of their work. Its usage is found to play a central role in improving the communication and collaboration of stakeholders, optimizing their engagement, and leading to elevated satisfaction levels amongst them [9]. For instance, the common data environment (CDE) provided by BIM allows an efficient collaboration and engagement of stakeholders, i.e., the client, designers, and civil and systems contractors, helping obtain an error-free design [10]. Furthermore, by providing a CDE and a comprehensive data repository [11], the use of BIM in projects is envisaged to improve the communication and information flow among the stakeholders. Moreover, the availability of 3-D models helps optimize the project designs, making them energy-efficient through their energy studies [12] and simulations, which prove instrumental in alleviating stakeholder satisfaction.
These instances point toward the role of BIM in the stakeholder management process. However, they do not provide information about the efficiency of the process. They do not establish any benchmarks that can be used to evaluate the stakeholder management process based on some tangible criteria. In addition, there seems to be a lack of definite indicators in the overall stakeholder management literature that can be used to assess the efficiency of the stakeholder management process. Although a study conducted by Oppong and Chan [13] aims to establish a set of 29 indicators for assessing the stakeholder management process in general, these indicators suffer from a few limitations. Primarily, most indicators use a subjective evaluation approach that only tends to assess the stakeholders’ satisfaction qualitatively. Indicators such as “better service delivery” and “sustainable life-cycle performance” only highlighted stakeholders’ satisfaction. However, they fail to provide insight into the quantitative measures or parameters to evaluate the service delivery or sustainable life-cycle performance.
Moreover, these parameters serve as a post-evaluation mechanism and are considered a “lagging” measure that fails to fulfill the idea of continuous improvement [4]. Furthermore, the specified indicators are not accorded substantive differences in importance levels when used for process evaluation. This makes the evaluation and rectification process challenging as the practitioner fails to redirect resources to concerning areas without such knowledge. In addition, few of the proposed indicators overlap their definitions with the success factors characteristics proposed for stakeholder management in the various studies. For instance, the authors propose “effective communication” as a performance indicator to evaluate customer and client satisfaction. However, effective communication between the stakeholders is often deemed a critical success factor (CSF) for efficient stakeholder management in studies by Molwus, Erdogan [14] and Nguyen, Chileshe [6], etc. The similarity of the developed indicator with the established CSF for stakeholder management fails to fulfill the performance indicator criteria to “have a significant impact on one or more of the CSFs,” as specified by Parmenter [15].
Therefore, this study aimed to develop a wider set of indicators that can be used to evaluate the BIM-based stakeholder management process quantitatively. The posited indicators can also help evaluate the stakeholder management process in general as it aims to evaluate the stakeholder management process on its three basic dimensions, i.e., stakeholder communication and collaboration, stakeholder engagement, and stakeholder satisfaction.
The paper is organized in the following order. Section 2 comprises the literature review about the assessment indicators used in this study to assess the stakeholder management process. Section 3 discusses the adopted methodology incorporated in the research. This study used a combination of a questionnaire survey, factor analysis, and fuzzy synthetic evaluation. Section 4 presents the analyzed results and the performance index model formed based on factor analysis and FSE. Section 5 details the developed key performance indicators and their use in assessing the stakeholder management process. This is followed by the main conclusions and the research’s limitations.

2. Literature Review

2.1. BIM-Based Stakeholder Management

Studies focused on assessing the role of BIM on stakeholder management are limited and scarce [10]. BIM’s impact on stakeholder management revolves around improving communication, collaboration, information availability, coordination, engagement, and decision-making [16]. The ability of BIM models to reduce the differences between designers and manufacturers [17] in the generated final models shows the improved level of engagement it can bring. In addition, the clash detection feature of BIM [10], intertwined with its improved design visualization [18], provides a collaborative platform for numerous stakeholders [19], leading to their efficient engagement. This engagement is further supplemented by the improved levels of collaboration between the stakeholders through the availability of a common data environment (CDEs) [20], which allows them to update the models and information in real time and identify and rectify any clashes. BIM models can also save and share the project data seamlessly within the stakeholder group [21], leading to better relaying of important information among the stakeholders, thereby reducing conflicts between them. This leads to increased efficiency in various project stages, leading to overall cost reduction [22]. Looking at the advantages of BIM holistically, it can be used as a tool to improve the efficiency of the overall construction process by having implications on the time and cost of the project.

2.2. Stakeholder Management Process Assessment Indicators in Megaprojects

The construction industry’s main focus has been shifted towards improving performance by following the route of continuous improvement for increasing project and business efficiency [23]. Performance indicators are commonly used in construction projects to assess and provide an outlook on the process and project performance via a benchmarking approach [24]. The continuous evaluation of the process performance requires that the traditional measurement indicators be broadened to assess the subprocess in megaprojects, which are pursued with a wider economic, social, and environmental aspiration [25]. This idea led to the diversification of the measurement indices by including the measures of environmental impacts, safety, asset functioning, innovation, stakeholder satisfaction, etc., with the existing productivity and profitability parameters [26,27]. The involvement of stakeholders in fulfilling these performance measures stresses monitoring individual project processes with an eye on efficient stakeholder management.
Based on this, the operation and maintenance costs [28] and monitoring additional budget incurred due to any rework during the execution [8] can be used to evaluate the project’s cost efficiency, an indicator of profitability and productivity. Information about the asset function is important as the downtime of the project asset impacts the service, which creates a dent in the project’s profitability [29], an indicator of economic performance that reflects stakeholder collaboration [30] and satisfaction. The downtime of the service shows the efficiency of communication between the stakeholders as it reflects the rate of information flow between the operation and maintenance teams about the asset status [31]. Furthermore, the amount of rework during the execution reflects the increase in the project budget and provides insight into the collaboration of stakeholders during the project’s design [32]. Similarly, the time required to get the requisite approvals [33] from competent authorities, the total time incurred on the project’s design [34], and the reduction in the amount of rework used as an evaluative mechanism to judge the adequacy and efficiency of engaging and collaborating with the project stakeholder [35].
Although the above indicators tend to measure the needs and expectations of stakeholders concerning the economic aspect, quantifying measures for the evaluation of environmental and social aspects is also important, indicating stakeholder satisfaction. For instance, the environmental impacts of the project can be judged by waste generation [36], carbon dioxide emissions [27], and the designs of the project [37] as the sub-parameters, which are reflective of the satisfaction of internal and, importantly, the external project stakeholders. Similarly, safety is an important consideration among the project stakeholders (both internal and external). It can be measured by accident and fatality rates at the project site [38].
These indicators help to judge and understand the process performance level, which impels the management of the overall project [39]. The availability of information on performance indicators can also serve as a check mechanism and database to understand the needs and expectations of the stakeholders of the project [40]. Therefore, a thorough list of indicators has been prepared and is presented in Table 1 that can help in the holistic evaluation of the BIM-based stakeholder management process.

3. Research Methodology

We used a varied approach comprising a literature review, expert interaction, and a questionnaire survey. The stepwise adopted research approach is detailed below.
Step 1: Identification of QIs from the literature survey. An extensive literature review was undertaken to understand and identify some important indicators that can be used to judge the different dimensions of the stakeholder management process, i.e., stakeholder identification and categorization, stakeholder communication and collaboration, stakeholder engagement, and stakeholder satisfaction.
Step 2: Judging the efficacy and quantum of a particular indicator in assessing the stakeholder management process. This step used a questionnaire survey to determine the importance of QIs that used a 5-point Likert scale to assess the adequacy and implication of indicators for assessing the stakeholder management process. Before conducting an actual survey, the prepared questionnaire was verified by five experts to assess its adequacy and completeness in answering the research questions. The pilot study with these five respondents resulted in a few modifications in the language to make it more understandable to the wider respondents. One of the important recommendations during the pilot study was eliminating factors used for evaluating stakeholder identification and categorization. All the respondents believed that stakeholder identification is generally based on historical data and is known before the project’s planning. Therefore, having indicators for measuring it would be impractical and worthless in the questionnaire. Keeping that in mind, the indicators used for evaluating the other three stakeholder management dimensions (i.e., stakeholder communication and collaboration, engagement, and satisfaction) were considered. The respondents and experts involved in the pilot study did not participate in the questionnaire survey.
Once the questionnaire had been finalized, the respondents for the survey were identified using purposive sampling and snowballing. The use of this approach was adopted because of two reasons. First, there is no standard availability of the record of construction professionals associated with the specific project management area, in this case, stakeholder management. Second, the scope of this work demanded that the respondents have a working experience on a BIM-enabled megaproject. Initially, four specific projects were chosen through prior contacts that used BIM and fell into the category of megaproject based on their cost (US$1 billion). It resulted in the delivery of 108 questionnaires manually (62) and through Google Forms (46). The respondents to whom the questionnaires were delivered manually were requested for further reference to their colleagues. This again resulted in the delivery of 57 questionnaires through Google Forms. Therefore, 165 questionnaires were sent out during the two months.
After a few reminders and a 2-month time frame, 83 responses were received, reflecting a response rate of around 50%. However, after an initial check, 55 responses fulfilled the study criteria with a response rate of 33%. All the respondents approached for the questionnaire survey had worked on a BIM-enabled project where BIM has been used to improve the existing stakeholder management practices. The projects have internally used BIM to facilitate better communication, collaboration, and engagement with the stakeholder, such as the numerous contractors, various design teams, local government bodies for expediting the approval, some utility service providers, etc. The obtained response rate was adequate, with the norm of a 20–30% response rate in construction research [46]. In addition, it exceeded the requirement of 30 responses bound by the central limit theorem for obtaining legitimate conclusions from research [47]. Table 2 below presents the questionnaire survey’s profile of respondents.
Once the survey data had been obtained, factor analysis was performed on the quantitative indicators to group the interrelated variables into smaller groups [48]. Therefore, this approach was adopted to group the quantitative indicators into critical indicators, referred to as “key performance indicators” (KPI). Although factor analysis performance is based on the prerequisite of sample size ratio to be a minimum of 1:5 [49], certain statistical tests such as KMO, Bartlett’s test of sphericity, and reliability can be performed that can help in judging the adequacy of the dataset for the performance of factor analysis [50]. Obtaining a favorable result in these tests allows the undertaking of factor analysis with full confidence and reliability [51]. At this juncture, it was also essential to determine the analysis approach to deal with the real-world, observable, and incomplete or vague data associated with performance estimation/evaluation [52]. Therefore, considering the challenges of performance evaluation of the stakeholder management process being a highly subjective area, the use of fuzzy set theory was found to be suitable. The fuzzy set theory allows a more comprehensible estimation of factors through a fuzzification and defuzzification process that deals with subjectivities and uncertainties [53]. Based on this, fuzzy synthetic evaluation (FSE) was chosen as the modeling method.

Fuzzy Synthetic Evaluation (FSE)

FSE is a technique belonging to the fuzzy set theory which helps in examining multicriteria decision-making problems [54]. It can handle problems with multiple levels and multiple attributes [51]. Moreover, its ability to handle a Likert scale in a simple questionnaire survey [53], as opposed to using specialized survey instruments in other fuzzy hybrid methods [52], makes it suitable for the requirements and constraints of this study’s objectives. An important benefit of using FSE is its robustness in dealing with the limited sample size without compromising the validity of results [55]. The problem of the limited sample size in construction engineering and management research [52] became more challenging with the scope of this work, which aimed at specifically BIM-enabled megaprojects. The process of carrying out FSE based on the studies of Osei-Kyei, Chan [51], Oppong, Chan [52] are:
1.
Establishment of the set of indicators, criteria, or factors. Π = {I1, I2, I3, … … Im}, where “m” is the number of indicators. In this case, it represents the 26 quantitative indicators used for evaluating the stakeholder management process.
2.
Development of the set of grade alternatives: scaling parameters adopted in the study to judge the efficiency of the indicators in evaluating the stakeholder management process. S = {s1, s2, s3, … … sn}, where “n” is the highest parameter of the adopted scale. In this study, a five-point Likert scale was adopted with the parameters s1 = no agreement, s2 = least agreement, s3 = fair agreement, s4 = agreement, and s5 = strong agreement.
3.
Determination of the weights of the indicators. This is calculated based on the mean of the individual indicators. Wi = {w1, w2, w3, … … wm}, where (0 ≤ w1 ≤ 1).
4.
Computation of the fuzzy evaluation matrix for each indicator (factor). The matrix is represented as R = (rij)mXn, where (rij) is the degree to which an alternative s satisfies the indicator Im.
5.
Determination of the results of the fuzzy evaluation using the weightings and fuzzy evaluation matrix from step 3 and step 4, respectively, using the equation:
D = WiRi
D is the final FSE evaluation matrix and ∘ the fuzzy composition operator.
6.
Obtaining the results through the normalization of the final evaluation matrix using the equation:
I n d e x   f o r   e a c h   K P I = i = 1 5 D X S

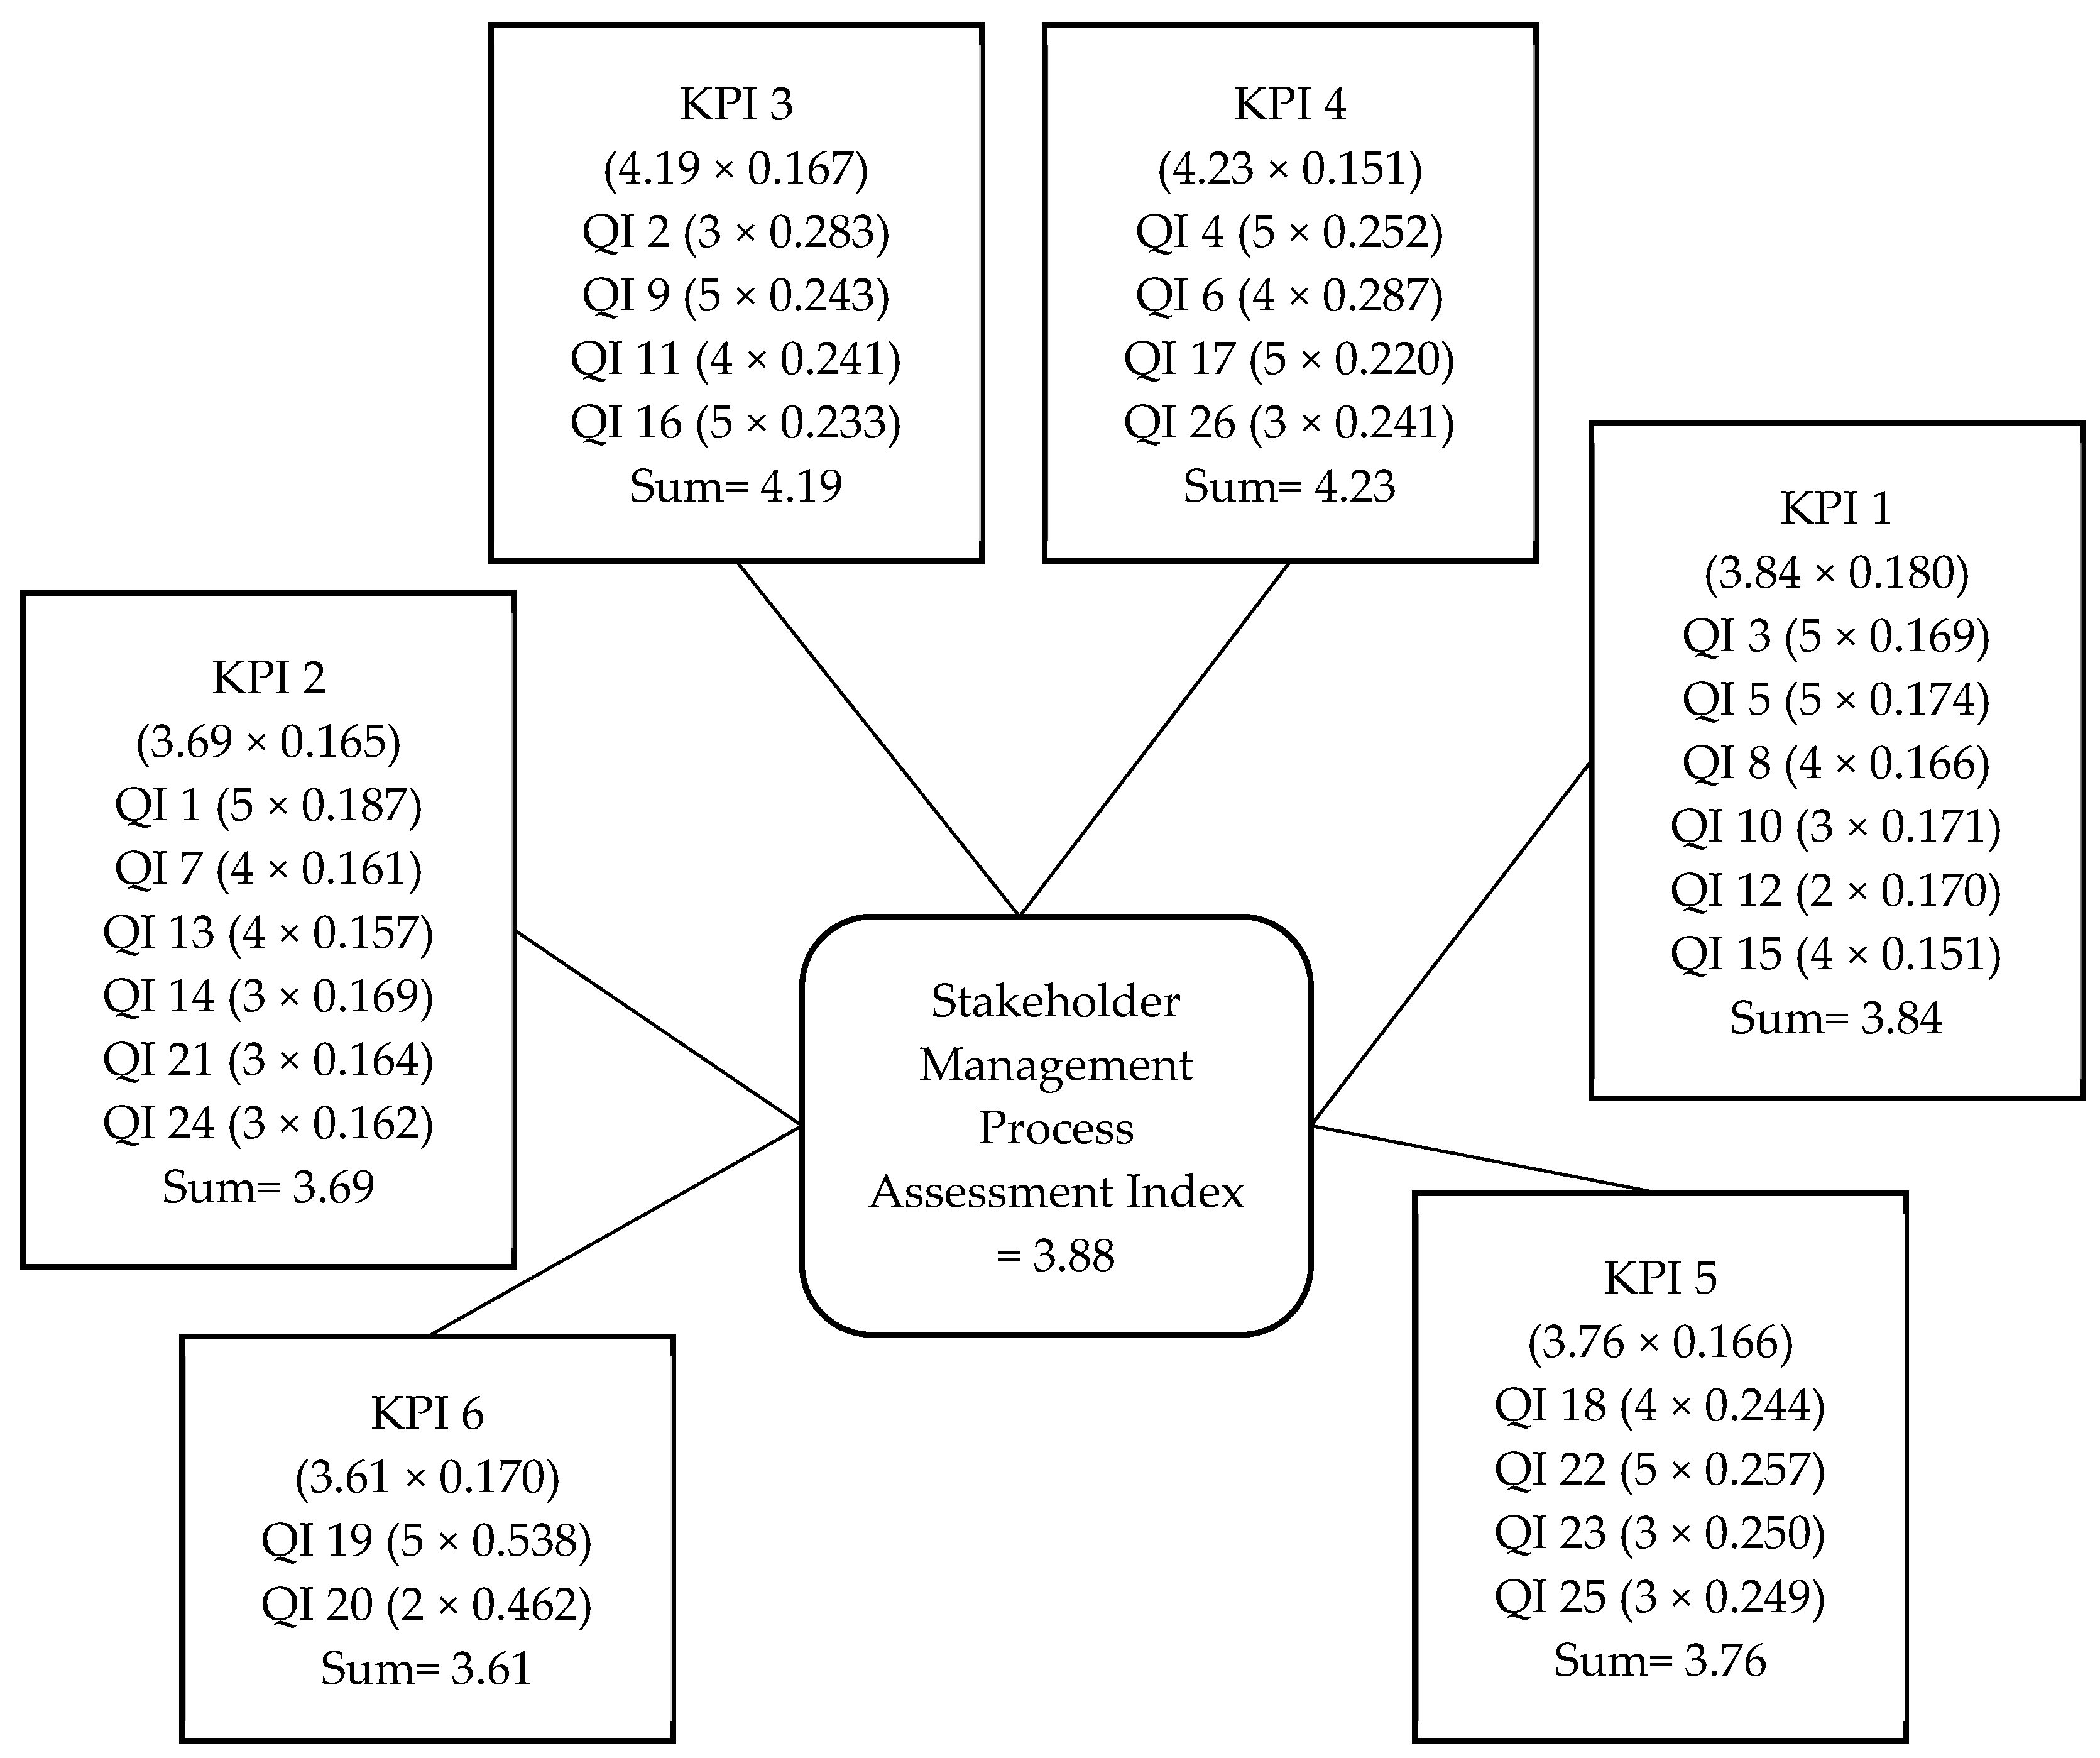
4. Data Analysis and Results

Initially, the means of all the indicators were checked, and these lay in the range of 4.473–3.200. As all the indicators had a mean above 3 (mean of the Likert scale), they were found suitable for further analysis [52]. After the initial factor selection, the statistical test was performed to judge the suitability of the data set for factor analysis. First, Cronbach’s alpha value was determined to ascertain the reliability of the dataset’s internal consistency and the survey instrument. Cronbach’s alpha above 0.7 shows an acceptable level of internal reliability, and the responses are deemed acceptable [56]. Cronbach’s alpha was calculated to be 0.887. Second, the Kendall coefficient of concordance was determined to establish the survey’s consistency and association level of respondents. The value of the KMO test was found to be 0.637 and was thus acceptable (KMO > 0.500 is acceptable) [57]. The Bartlett test showed the approximate χ2 value to be 718.29 with a significance of 0.000. This implied that the correlation matrix differed from the identity matrix [57]. These tests deemed the data suitable for factor analysis.
Factor analysis with a principal factor extraction and varimax rotation yielded a six-factor solution with eigenvalues greater than 1, explaining 63.27% of the total variance. The results of factor analysis, along with means and factor loadings, are presented in Table 3. A glance at the results shows that all the indicators apart from QI 1, QI 6, QI 18, and QI 22 (0.481, 0.481, 0.496, and 0.466, respectively) had a factor loading above 0.5. Even for the four mentioned indicators, the loading is close to 0.5. Therefore, the six-factor solution suits the dataset [52].
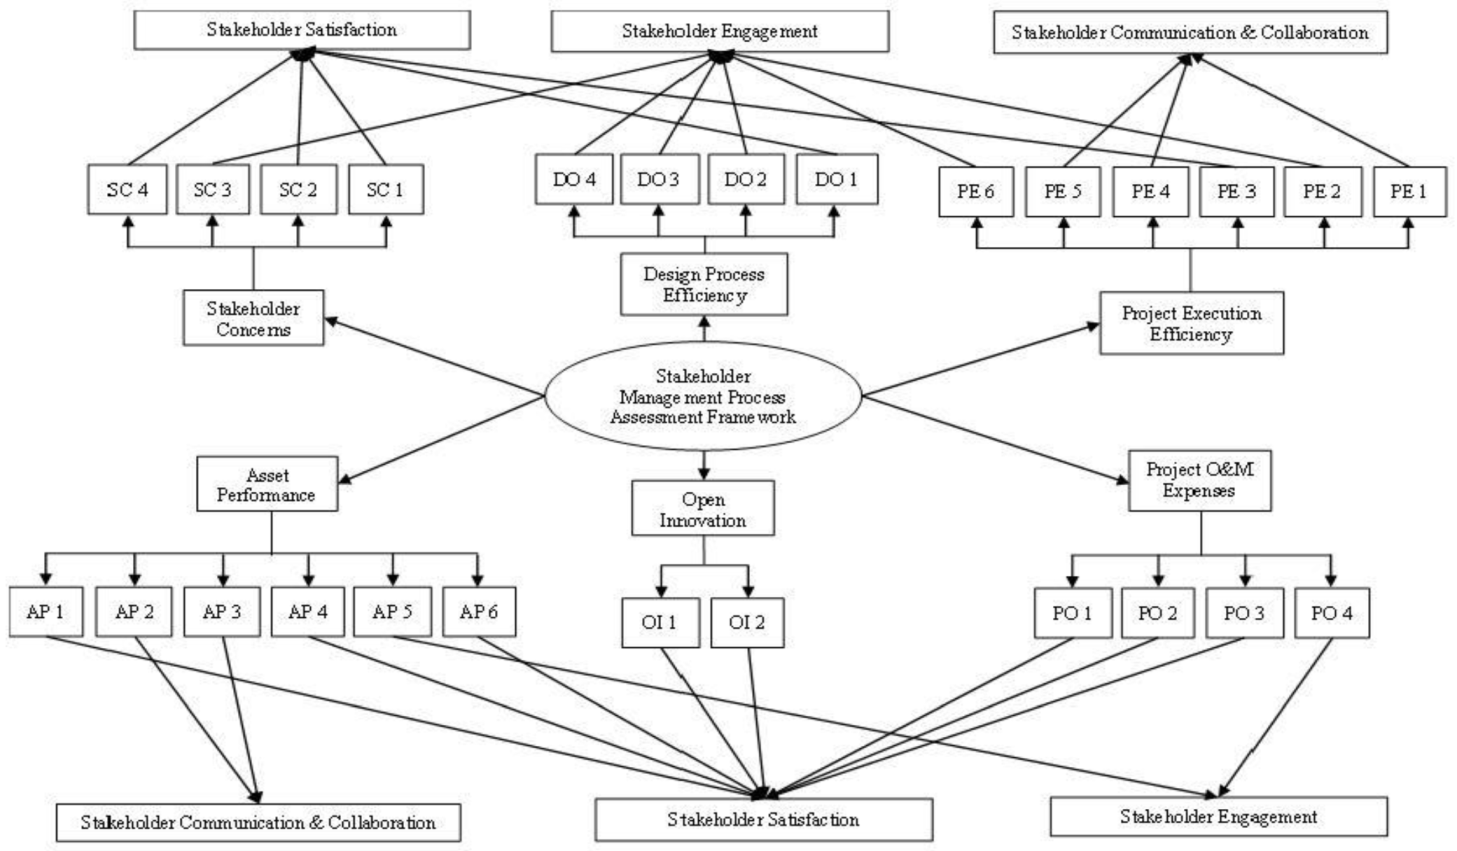
  • Group 1: KPI 1—Asset Performance (AP)
  • Group 2: KPI 2—Project Execution Efficiency (PE)
  • Group 3: KPI 3—Project Operation and Maintenance (O&M) Expenses (PO)
  • Group 4: KPI 4—Stakeholder Concerns (SC)
  • Group 5: KPI 5—Design Process Efficiency (DO)
  • Group 6: KPI 6—Open Innovation (OI)
The six-factor solution further required assessing their importance level for the managers to focus on specific areas to help them prioritize their approach. This was undertaken using fuzzy synthetic evaluation (FSE). The developed FSE model comprised two membership function (MF) levels. QIs are represented by the second level MF while the KPIs are represented through the first level MF. Table 4 presents the computed weightings, the MF of QIs, and the KPIs’ index values.
Step 1—Determination of relative weightings of QIs and KPIs
The weights of each QIs and KPI are calculated with the help of the equation
W i = M i i = 1 5 M i   0     W i     1 ,   W i = 1
Wi is the weighting vector; Mi is the mean score (MS) of a particular indicator (MS). The results are presented under the weightings column in Table 4.
Step 2—Establishment of the MFs for the QIs and KPIs
The MF for the QIs (second level) is established based on the respondents’ ratings (5-point scale) in the questionnaire survey. For example, the results of questionnaire data for QI 19 showed that 43.6% of respondents strongly agreed with the indicator for assessing the satisfaction of stakeholders in connection with the adoption of new technologies that facilitate the saving of cost, 47.3% agreed with the identified indicator, 7.3% somewhat agreed with the indicator, 1.8% had the least agreement, and 0% of the respondents had no agreement.
Based upon this, the MFQI 19 is presented as follows:
M F Q I   19 = 0.000 N o   A g r e e . + 0.018 L e a s t   A g r e e . + 0.073 F a i r   A g r e e . + 0.473 A g r e e . + 0.436 S t r o n g   A g r e e .
The membership function for QI 19 can be (0.000, 0.018, 0.073, 0.473, 0.436). Similarly, other MFs for QIs are determined and are presented in Table 4 under the column “MFs at Level 2.” Further, the MFs of the KPIs are established using the equation, D = WiRi.
D is the final FSE evaluation matrix and ∘ the fuzzy composition operator.
For instance, taking the example of KPI 4, the adopted method is:
D K P I   4 = W K P I   4   O   R K P I   4 = 0.252 ,   0.287 ,   0.220 ,   0.241 × 0.018 0.000 0.545 0.255 0.182 0.000 0.036 0.236 0.327 0.400 0.018 0.327 0.309 0.200 0.145 0.018 0.273 0.164 0.345 0.200 D K P I   4 = 0.013 ,   0.148 ,   0.313 ,   0.285 ,   0.241
Similarly, the KPIs’ MFs are calculated and presented in Table 4 under the column “MFs at Level 1.”
Step 3—Determination of Index Values of KPIs
The index value of each KPI is calculated using Equation (1) and is shown in the “Index Value” column of Table 4. It is calculated as follows:
K P I   4 = i = 1 5 D K P I   4 × S = 0.013 ,   0.148 ,   0.313 ,   0.285 ,   0.241 × 1 ,   2 ,   3 ,   4 ,   5 = 3.59
Step 4—Normalization of the Index Values of KPIs
The last column of Table 4 shows the normalized values of the KPIs, calculated as follows:
K P I   6 n o r m = 4.04 4.27 + 3.90 + 3.97 + 3.59 + 3.95 + 4.04 = 0.170
The results generated a model for evaluating stakeholder management performance, presented in Figure 1. The model assumes managers’ ratings on the indicator’s fulfillment. It uses a 5-point scale where 1 accounts for the assessment’s negative side (not achieving the set target) and 5 is the highest achievement. The scale value is then multiplied by the weights of the QI, and then the sum of the QIs for each KPI (labeled index value) is multiplied by its normalized index value. Finally, the composite value for stakeholder management performance is obtained. The description of the composite value follows the scale adopted by Oppong, Chan [52] in their study of the development of an evaluative process model for external stakeholder management. The scale description follows as ≤1.49 poor, 1.5 ≤ average ≤ 2.49, 2.5 ≤ good ≤ 3.49, 3.5 ≤ very good ≤ 4.49, and ≥4.5 excellent. Alternatively, the scale can also use the parameters specified for any specific project based on the preconceived targets. Moreover, the model is flexible enough for use with a 7-point or a 10-point scale. However, the labeled index value in the model for each KPI must be modified accordingly.

5. Discussions

The index values of the KPIs in descending order are KPI 1 (4.27), KPI 6 (4.04), KPI 3 (3.97), KPI 5 (3.95), KPI 2 (3.90), and KPI 4 (3.59). The index values can help identify the important areas of concern to the managers, who can then plan for some measures to improve the performance of the stakeholder management process.

5.1. KPI 1—Asset Performance

This KPI was found to have the highest index value and forms the most important indicator group in measuring stakeholder management performance. With the vast nature of construction projects, they tend to have numerous assets that need management for smooth running. Project assets are, in most cases, expected to bring in profits [58] and are an integral part of any project functionality. They have a definite life span, suffering wear and tear throughout their service life. Therefore, it is required that these assets are regularly monitored and undergo maintenance as per the requirement to keep them in working condition. The ability of the BIM model to provide a detailed description of assets to the maintenance team through asset tagging plays a huge role in reducing any unwarranted asset failure and asset downtime. An important advantage regarding digital asset monitoring and maintenance is that the O&M team gets the “as-built” models of the project instead of drawings. This enables them to plan the maintenance strategy and adopt the preventive maintenance principle instead of a “fail-and-fix” mechanism. A reduced project asset failure rate reflects the comprehensive information available within the O&M teams that facilitate data-driven decision-making, an important part of smart maintenance [28]. It also reflects the smooth work transition between the execution and O&M teams, thus focusing on improved collaboration and better information flow, aiding the planning, execution, and coordination of maintenance operations [59]. In their work, Brunet, Motamedi [53] point out the importance of communication in easing information availability as a critical factor for productivity gains.
Furthermore, an important indicator of asset performance is the emissions generated by the individual asset and overall facility throughout its life cycle. The energy analysis of the developed facilities through the BIM models enables the project team to devise alternate mechanisms to reduce the energy utilization of the built facility. Adopting alternatives in the form of design modifications or any other alternative strategy aims at reducing carbon emissions. It serves as an important measure of stakeholders’ satisfaction with the facility, as environmental sustainability is of substantial importance in the needs of the major project stakeholders [60]. Finally, the improved asset performance and the fulfillment of the environmental sustainability parameters during the operation essentially point to improved stakeholder satisfaction with the project. It might be the reason for the indicator associated with the “satisfaction of customers with developed facility” to have the least weightage under this construct. Therefore, monitoring the asset state and functioning in the project can provide substantial information about the levels of stakeholder collaboration and information flow between them.

5.2. KPI 6—Open Innovation

Open innovation (OI) is defined as “a distributed innovation process that relies on purposively managed knowledge flows across organizational boundaries, using pecuniary and non-pecuniary mechanisms in line with the organization’s business model to guide and motivate knowledge sharing” [61]. The use of information and communication technology (ICT) applications provides a better avenue for sharing information and a better approach to working with huge amounts of data. It helps establish better communication channels [62]. Using such tools to impart interorganizational collaboration is also in line with the present-day project-delivery approach that requires the involvement of stakeholders outside the project organization’s spectrum. The indicators under this construct reflect the project time and cost savings from using and adopting new technologies. These indicators evaluate stakeholders’ satisfaction as it is important for adopting new technologies or methods in the conventional system. Using such technologies requires huge upfront costs. If the stakeholders, especially the internal stakeholders, are unsure of the benefits (tangible benefits that can be measured) it will bring, they will be skeptical about its acceptance and adoption. Therefore, this KPI not only measures stakeholders’ satisfaction with the use of technology but also serves as an indicator of the adoption of technology itself.

5.3. KPI 3—Project Operation and Maintenance Expenses

The third set of indicators that form this KPI is closely knitted with the essence of KPI 1 associated with the performance of the project assets. Improved efficiency of the project assets tends to impact the overall functioning of the project. A more efficient facility operation (specifically built for commercial usage) improves revenue generation and makes the developed facility profitable. The O&M costs cover a huge portion of the project life-cycle cost, around 55% of the total building costs spread over 40 years [63]. Reduction in the unwarranted O&M expenditure plays a pivotal role in the project’s revenue generation. It is a tangible measure to evaluate the satisfaction of project stakeholders as it reflects on the project’s economic sustainability. Higher revenue generation and less expenditure on the O&M of the project allow the stakeholders to have a substantial upside on their investment [41]. One of the intrinsic processes that reduce O&M costs is the reduction in the unplanned maintenance required in the project, as it plays an important role in increasing the service uptime of the facility. It is reflective of the engagement of the required teams at critical points that monitor the project and its assets thoroughly and regularly [64].

5.4. KPI 5—Design Process Efficiency

The indicators forming this KPI reflect the efficient engagement of the project stakeholders in obtaining an error-free design. The interorganizational efforts witnessed in construction projects to reach the designated objective require the assimilation of stakeholders during the key decision-making process [65]. Engaging the important stakeholders during the project design phase allows for bringing in the varying perception resulting in collective agreements and improved stakeholder coordination [13]. Obtaining “good for construction” (GFC) categorization within the stipulated timelines shows the integration of associated stakeholders efficiently during the designing and project modeling. Moreover, engaging the stakeholders in the project design phase also helps in the design preparation that aids the environmental aspirations from the sustainability point of view among the stakeholders. Fulfilling the environmental considerations through project designs helps evaluate the satisfaction of internal and external stakeholders, such as the local community, environmental NGOs, etc., that strive hard for this aim.

5.5. KPI 2—Project Execution Efficiency

This group assimilated the indicators to help evaluate all three stakeholder management dimensions. An important measure of efficient and optimum stakeholder engagement is witnessed by monitoring the model and design approval time by the requisite authorities. The approval process requires an efficient engagement of important project stakeholders before it is processed and categorized as good for construction (GFC). Another measure of stakeholder engagement is monitoring the design clashes between the various types of work, such as civil, MEP, and utility installation. For a large project requiring various utilities, the associated designers must be in unison to identify and rectify the clashes before the execution of work. However, in the event of any clashes, the time of identification and rectification of such events shows the rate of information flow between the different teams.
Furthermore, streamlined communication and improved work collaboration can be assessed by monitoring the time spent on rework. In addition, the monetary losses in the time and cost witnessed due to rework can be used to evaluate the stakeholders’ satisfaction with the work. Reduced rework chances will bring down the project’s expenditure in that area, bringing satisfaction among the internal stakeholders who strive to keep the project under budget and schedule [41]. In addition, the execution of the project requires obtaining certain new and feasible ideas that can help improve the work’s pace and other benefits. It also serves as a measure of stakeholder collaboration, allowing the brainstorming of ideas and approaches [66]. Once the approach, models, and design are put into place, the construction work requires the timely availability of materials and equipment for the actual construction work. The collaboration between the material supplier and the associated contractors is very important for receiving the desired quantity at the planned schedule and establishing an efficient supply chain.

5.6. KPI 4—Stakeholder Concerns

One of the reasons for the low index value of this KPI dimension is that several stakeholder concerns are addressed through the indicators under other dimensions. For instance, the primary requirement of a project to be on time and within budget is addressed through the reduction in maintenance cost, effective design planning and having the actual design time the same as the predicted one, and environmental concerns. These factors are already accounted for in previous KPIs. Still, the KPI associated with stakeholder concerns is of importance in essence. Successfully negotiating stakeholder expectations reduces their resistance toward the project, which is particularly important for the proper execution of any project [67]. Accounting for the needs and expectations of the stakeholders allows a development of trust that can be used to achieve efficiency in the project work [13]. It is witnessed by developing a better ecosystem for maintaining the data privacy of the stakeholders, especially the designers. The development of trust results in aligning their interests, resulting in a collaborative working environment that enables quick and easy settlement and resolution of conflicts [62], creating a sense of satisfaction.
Another yardstick for assessing satisfaction and an important concern among the stakeholders is safety incidents at the project site. A high safety standard is important to maintain a sense of confidence among the workforce and is essentially pivotal for them to carry out their work without fear. The important advantage of addressing the needs of stakeholders can be learned from the fact that the project faces less social audit from the external stakeholders when their needs are effectively dealt with [68]. It is reflected in the reduced number of complaints associated with the project from stakeholders such as local communities or any external monitoring agencies, etc. Similarly, addressing the needs and demands of internal stakeholders such as project financers keeps them interested in the project and prevents them from creating any unnecessary hindrance toward its execution.
Based on the above discussions, a stakeholder management process assessment framework is conceptualized and is presented in Figure 2. It shows the six KPIs with their grouped indicators and their use in assessing specific stakeholder management dimensions. For instance, KPI 1 (asset performance) had the highest index value. It comprised six quantitative indicators. AP 1, which measures carbon dioxide emissions, quantifies project stakeholders’ need for environmental sustainability. It, therefore, provides a tangible reference to measure stakeholders’ satisfaction with the built facility. AP 6 measures stakeholder satisfaction with the facility covering a wide aspect of operational and environmental efficiency.
The indicators AP 2–AP 5 provide insight into the state of project asset. From the asset failure rate (AP 5) to the time between shutdown and reoperation (AP 2), these show the efficiency of communication, information flow, and engagement between the intended stakeholders. It also reflects inter- and intrateam collaboration by monitoring service downtime (AP 3). For instance, the indicators AP 2 and AP 3 measure the time between the shutdown and reoperation. The less time required for bringing back the project asset in an operational stage shows high and efficient collaboration and communication between the involved teams. Identifying the cause of failure, asset location, and planning for its repairs require great collaboration between the associated teams. Next, the indicator AP 5 measures the time between the failure of project assets. A higher time interval provides an idea about the efficient engagement of the teams during the project’s operation and maintenance. Their planning for the maintenance work and keeping the asset maintenance on schedule through the engagement of respective teams can keep them in working condition and eliminate the possibility of any unwanted failure. The last indicator of the KPI, AP 4, is associated with judging the project’s economic feasibility, an important measure of internal stakeholder satisfaction. A reduced number of unplanned maintenance shows operational efficacy and is directly related to the project’s revenue generation. The internal stakeholder aims at maximizing the revenue for increased profits, leading them towards fulfilling their target of return on their investment.

6. Conclusions and Limitations

This study aimed to propose some KPIs that can be used to evaluate the performance of the stakeholder management process and judge the efficacy and efficiency of the adopted stakeholder management approach. A total of 26 identified QIs through an extensive literature review were grouped under six constructs based on the factor analysis results of the questionnaire data. The evaluation of the constructs followed the factor analysis and individual indicators for their importance levels using fuzzy synthetic evaluation (FSE). The results of FSE showed KPI 1 (asset performance) to be the most important, with an index value of 4.27. It was followed by open innovation (4.04), project operation and maintenance expenses (3.97), design process efficiency (3.95), project execution efficiency (3.90), and stakeholder concerns (3.59). A sample model was prepared that can be used to judge the stakeholder management performance, referred to as the “stakeholder management performance index” (SMPI). In addition, a stakeholder management process assessment framework was developed based on the data that reflect the associated indicators with the specific stakeholder management dimension.
The findings of this study may help practitioners in quantitatively evaluating the stakeholder management process, which otherwise follows a subjective evaluation approach, making it difficult to assess stakeholder management performance correctly. The evaluation can also help managers look at stakeholder management’s lagging and challenging areas. It would help them to formulate a strict plan to overcome those challenges. The developed SMPI can help evaluate the performance of stakeholder management in construction projects objectively and subjectively if the determination of scaling parameters becomes tedious. The objective evaluation can be reached by imparting the definite scaling parameters to the posited indicators. In the case of new projects where establishing initial benchmarks tends to be tedious, a simple scaling system can be used subjectively. Although the study explicitly focused on developing indicators to assess the BIM-based stakeholder management process, the indicators can also be used to evaluate the stakeholder management process in general. While the developed KPIs and their intrinsic QIs resonate with BIM applicability, these indicators primarily aim to assess the three stakeholder management process pillars, i.e., stakeholder communication and collaboration, engagement, and satisfaction, which form the basic premise of any stakeholder management process in the construction industry.
The study has a few limitations. First, the sample employed for the questionnaire and reaching the final index value was small. Although it fulfils the sample size criteria specified by previous studies for efficiently using FSE, still the sample size needs to be broadened for the efficacy of the obtained results on a wider scale. Second, the developed model was not validated with actual project responses. Therefore, it is recommended that such work be conducted with a project-specific focus. This will also allow the development of the scaling parameters for a specific project, making the SMPI a tailored assessment tool for assessing stakeholder management. Finally, the findings of this study are based on responses from Indian construction industry professionals, which might limit its applicability in the wider AEC industry. Therefore, it is recommended that such work be conducted among varying demographics to allow the development of a common model for assessing the stakeholder management process in the AEC industry globally.

Author Contributions

Conceptualization, S.G. and A.T.; methodology, S.G. and A.T.; validation, S.G. and A.T.; formal analysis, S.G.; data curation, S.G.; writing—original draft preparation, S.G.; writing—review and editing, S.G.; supervision, A.T.; project administration, A.T. All authors have read and agreed to the published version of the manuscript.

Funding

This research received no external funding.

Data Availability Statement

The data that support the findings of this study are available on request from the corresponding author. The data are not publicly available, as they contain information that could compromise the privacy of research participants.

Conflicts of Interest

The authors declare no conflict of interest.

References

  1. Liu, Y.; van Nederveen, S.; Hertogh, M. Understanding effects of BIM on collaborative design and construction: An empirical study in China. Int. J. Proj. Manag. 2017, 35, 686–698. [Google Scholar] [CrossRef]
  2. Gaur, S.; Dosapati, S.; Tawalare, A. Stakeholder assessment in construction projects using a CRITIC-TOPSIS approach. Built Environ. Proj. Asset Manag. 2022. ahead-of-print. [Google Scholar] [CrossRef]
  3. Toor, S.-u.-R.; Ogunlana, S.O. Beyond the ‘iron triangle’: Stakeholder perception of key performance indicators (KPIs) for large-scale public sector development projects. Int. J. Proj. Manag. 2010, 28, 228–236. [Google Scholar] [CrossRef]
  4. Mellado, F.; Lou, E.C.; Becerra, C.L.C. Synthesising performance in the construction industry: An analysis of performance indicators to promote project improvement. Eng. Constr. Archit. Manag. 2019. ahead-of-print. [Google Scholar] [CrossRef]
  5. Eyiah-Botwe, E.; Aigbavboa, C.O.; Thwala, W.D. Curbing PPP construction projects’ failure using enhanced stakeholder management success in developing countries. Built Environ. Proj. Asset Manag. 2020, 10, 50–63. [Google Scholar] [CrossRef]
  6. Nguyen, T.H.D.; Chileshe, N.; Rameezdeen, R.; Wood, A. External stakeholder strategic actions in projects: A multi-case study. Int. J. Proj. Manag. 2019, 37, 176–191. [Google Scholar] [CrossRef]
  7. Oyeyipo, O.; Odeyinka, H.; Owolabi, J.; Ojelabi, R. Factors Promoting Stakeholder Management of Building Projects. Int. J. Mech. Eng. Technol. 2019, 10, 42–49. [Google Scholar]
  8. Khanzadi, M.; Sheikhkhoshkar, M.; Banihashemi, S. BIM applications toward key performance indicators of construction projects in Iran. Int. J. Constr. Manag. 2018, 20, 305–320. [Google Scholar] [CrossRef]
  9. Gaur, S.; Tawalare, A. Investigating the Role of BIM in Stakeholder Management: Evidence from a Metro-Rail Project. J. Manag. Eng. 2022, 38, 05021013. [Google Scholar] [CrossRef]
  10. Ahankoob, A.; Manley, K.; Abbasnejad, B. The role of contractors’ building information modelling (BIM) experience in realising the potential values of BIM. Int. J. Constr. Manag. 2019, 22, 588–599. [Google Scholar] [CrossRef]
  11. Ganbat, T.; Chong, H.-Y.; Liao, P.-C. Mapping BIM Uses for Risk Mitigation in International Construction Projects. Adv. Civ. Eng. 2020, 2020, 1–13. [Google Scholar] [CrossRef]
  12. Chandel, S.; Sharma, A.; Marwaha, B.M. Review of energy efficiency initiatives and regulations for residential buildings in India. Renew. Sustain. Energy Rev. 2016, 54, 1443–1458. [Google Scholar] [CrossRef]
  13. Oppong, G.D.; Chan, A.P.C.; Dansoh, A. A review of stakeholder management performance attributes in construction projects. Int. J. Proj. Manag. 2017, 35, 1037–1051. [Google Scholar] [CrossRef]
  14. Molwus, J.J.; Erdogan, B.; Ogunlana, S. Using structural equation modelling (SEM) to understand the relationships among critical success factors (CSFs) for stakeholder management in construction. Eng. Constr. Archit. Manag. 2017, 24, 426–450. [Google Scholar] [CrossRef]
  15. Parmenter, D. Key Performance Indicators: Developing, Implementing, and Using Winning KPIs; John Wiley & Sons: Hoboken, NJ, USA, 2015. [Google Scholar]
  16. Mani, S.; Ahmadi Eftekhari, N.; Hosseini, M.R.; Bakhshi, J. Sociotechnical dimensions of BIM-induced changes in stakeholder management of public and private building projects. Constr. Innov. 2022. ahead-of-print. [Google Scholar] [CrossRef]
  17. Mostafa, S.; Kim, K.P.; Tam, V.W.Y.; Rahnamayiezekavat, P. Exploring the status, benefits, barriers and opportunities of using BIM for advancing prefabrication practice. Int. J. Constr. Manag. 2018, 20, 146–156. [Google Scholar] [CrossRef]
  18. Raouf, A.M.I.; Al-Ghamdi, S.G. Building information modelling and green buildings: Challenges and opportunities. Archit. Eng. Des. Manag. 2018, 15, 1–28. [Google Scholar] [CrossRef]
  19. Olbina, S.; Elliott, J.W. Contributing project characteristics and realized benefits of successful BIM implementation: A comparison of complex and simple buildings. Buildings 2019, 9, 175. [Google Scholar] [CrossRef]
  20. Farnsworth, C.B.; Beveridge, S.; Miller, K.R.; Christofferson, J.P. Application, advantages, and methods associated with using BIM in commercial construction. Int. J. Constr. Educ. Res. 2015, 11, 218–236. [Google Scholar] [CrossRef]
  21. Georgiadou, M.C. An overview of benefits and challenges of building information modelling (BIM) adoption in UK residential projects. Constr. Innov. 2019, 19, 298–320. [Google Scholar] [CrossRef]
  22. Pittard, S.; Sell, P. BIM and Quantity Surveying; Routledge: Abingdon, UK, 2017. [Google Scholar]
  23. Souza, J.P.E.; Alves, J.M. Lean-integrated management system: A model for sustainability improvement. J. Clean. Prod. 2018, 172, 2667–2682. [Google Scholar] [CrossRef]
  24. Ding, Z.; Wang, J.; Zuo, J.; Gong, W. Key Performance Indicators for Regional Construction Supervision Systems in China. Eng. Manag. J. 2017, 29, 179–188. [Google Scholar] [CrossRef]
  25. Rothengatter, W. Megaprojects in transportation networks. Transp. Policy 2019, 75, A1–A15. [Google Scholar] [CrossRef]
  26. Moradi, S.; Ansari, R.; Taherkhani, R. A systematic analysis of construction performance management: Key performance indicators from 2000 to 2020. Iran. J. Sci. Technol. Trans. Civ. Eng. 2022, 46, 15–31. [Google Scholar] [CrossRef]
  27. Angelakoglou, K.; Kourtzanidis, K.; Giourka, P.; Apostolopoulos, V.; Nikolopoulos, N.; Kantorovitch, J. From a comprehensive pool to a project-specific list of key performance indicators for monitoring the positive energy transition of smart cities—An experience-based approach. Smart Cities 2020, 3, 705–735. [Google Scholar] [CrossRef]
  28. Lundgren, C.; Bokrantz, J.; Skoogh, A. Performance indicators for measuring the effects of Smart Maintenance. Int. J. Product. Perform. Manag. 2021, 70, 1291–1316. [Google Scholar] [CrossRef]
  29. Tripathi, K.K.; Hasan, A.; Neeraj Jha, K. Evaluating performance of construction organizations using fuzzy preference relation technique. Int. J. Constr. Manag. 2021, 21, 1287–1300. [Google Scholar] [CrossRef]
  30. Li, Y.; Sun, H.; Li, D.; Song, J.; Ding, R. Effects of Digital Technology Adoption on Sustainability Performance in Construction Projects: The Mediating Role of Stakeholder Collaboration. J. Manag. Eng. 2022, 38, 04022016. [Google Scholar] [CrossRef]
  31. Zhao, J.; Feng, H.; Chen, Q.; Garcia de Soto, B. Developing a conceptual framework for the application of digital twin technologies to revamp building operation and maintenance processes. J. Build. Eng. 2022, 49, 104028. [Google Scholar] [CrossRef]
  32. Do, S.T.; Nguyen, V.T.; Dang, C.N. Exploring the relationship between failure factors and stakeholder coordination performance in high-rise building projects: Empirical study in the finishing phase. Eng. Constr. Archit. Manag. 2022, 29, 870–895. [Google Scholar] [CrossRef]
  33. Zheng, L.; Baron, C.; Esteban, P.; Xue, R.; Zhang, Q.; Yang, S. Using leading indicators to improve project performance measurement. J. Syst. Sci. Syst. Eng. 2019, 28, 529–554. [Google Scholar] [CrossRef]
  34. Mosley, J.C.; Bubshait, A.A. Investigative study of project procurement methods and project performance indicators in Saudi Arabia. Int. J. Constr. Manag. 2021, 21, 845–857. [Google Scholar] [CrossRef]
  35. Bakhshi, S.; Chenaghlou, M.R.; Pour Rahimian, F.; Edwards, D.J.; Dawood, N. Integrated BIM and DfMA parametric and algorithmic design based collaboration for supporting client engagement within offsite construction. Autom. Constr. 2022, 133, 104015. [Google Scholar] [CrossRef]
  36. Stanitsas, M.; Kirytopoulos, K.; Leopoulos, V. Integrating sustainability indicators into project management: The case of construction industry. J. Clean. Prod. 2021, 279, 123774. [Google Scholar] [CrossRef]
  37. Hristov, I.; Chirico, A. The role of sustainability key performance indicators (KPIs) in implementing sustainable strategies. Sustainability 2019, 11, 5742. [Google Scholar] [CrossRef]
  38. Jin, R.; Zou, P.X.W.; Piroozfar, P.; Wood, H.; Yang, Y.; Yan, L.; Han, Y. A science mapping approach based review of construction safety research. Saf. Sci. 2019, 113, 285–297. [Google Scholar] [CrossRef]
  39. Radovanović, D.; Holst, C.; Belur, S.B.; Srivastava, R.; Houngbonon, G.V.; Le Quentrec, E.; Miliza, J.; Winkler, A.S.; Noll, J. Digital literacy key performance indicators for sustainable development. Soc. Incl. 2020, 8, 151–167. [Google Scholar] [CrossRef]
  40. Chinyio, E.; Olomolaiye, P. Construction Stakeholder Management; John Wiley & Sons: Hoboken, NJ, USA, 2009. [Google Scholar]
  41. Ingle, P.V.; Mahesh, G. Construction project performance areas for Indian construction projects. Int. J. Constr. Manag. 2022, 22, 1443–1454. [Google Scholar] [CrossRef]
  42. Urbinati, A.; Landoni, P.; Cococcioni, F.; De Giudici, L. Stakeholder management in open innovation projects: A multiple case study analysis. Eur. J. Innov. Manag. 2021, 24, 1595–1624. [Google Scholar] [CrossRef]
  43. Habibi, M.; Kermanshachi, S.; Rouhanizadeh, B. Identifying and measuring engineering, procurement, and construction (EPC) key performance indicators and management strategies. Infrastructures 2019, 4, 14. [Google Scholar] [CrossRef]
  44. Li, Y.; O’Donnell, J.; García-Castro, R.; Vega-Sánchez, S. Identifying stakeholders and key performance indicators for district and building energy performance analysis. Energy Build. 2017, 155, 1–15. [Google Scholar] [CrossRef]
  45. Goodman, M.S.; Ackermann, N.; Bowen, D.J.; Thompson, V. Content validation of a quantitative stakeholder engagement measure. J. Community Psychol. 2019, 47, 1937–1951. [Google Scholar] [CrossRef] [PubMed]
  46. Akintoye, A. Analysis of factors influencing project cost estimating practice. Constr. Manag. Econ. 2000, 18, 77–89. [Google Scholar] [CrossRef]
  47. Ott, R.L.; Longnecker, M.T. An Introduction to Statistical Methods and Data Analysis; Cengage Learning: Boston, MA, USA, 2015. [Google Scholar]
  48. Brown, T.A. Confirmatory Factor Analysis for Applied Research; Guilford Publications: New York, NY, USA, 2015. [Google Scholar]
  49. Lingard, H.; Rowlinson, S. Letter to the editor. Constr. Manag. Econ. 2006, 24, 1107–1109. [Google Scholar] [CrossRef]
  50. Ahadzie, D.; Proverbs, D.; Olomolaiye, P. Critical success criteria for mass house building projects in developing countries. Int. J. Proj. Manag. 2008, 26, 675–687. [Google Scholar] [CrossRef]
  51. Osei-Kyei, R.; Chan, A.P.; Ameyaw, E.E. A fuzzy synthetic evaluation analysis of operational management critical success factors for public-private partnership infrastructure projects. Benchmarking Int. J. 2017, 24, 2092–2112. [Google Scholar] [CrossRef]
  52. Oppong, G.D.; Chan, A.P.; Ameyaw, E.E.; Frimpong, S.; Dansoh, A. Fuzzy evaluation of the factors contributing to the success of external stakeholder management in construction. J. Constr. Eng. Manag. 2021, 147, 04021142. [Google Scholar] [CrossRef]
  53. Ogunrinde, O.; Nnaji, C.; Amirkhanian, A. Developing Automation Adoption Readiness Index for Quality Management Focused on Highway Construction. J. Infrastruct. Syst. 2021, 27, 04020049. [Google Scholar] [CrossRef]
  54. Owusu, E.K.; Chan, A.P.; Darko, A. Evaluating the corruption susceptibility index of infrastructure procurement and management in the developed context: The case of Hong Kong. J. Infrastruct. Syst. 2021, 27, 05021006. [Google Scholar] [CrossRef]
  55. Ameyaw, E.E.; Chan, A.P.; Owusu-Manu, D.-G.; Edwards, D.J.; Dartey, F. A fuzzy-based evaluation of financial risks in build–own–operate–transfer water supply projects. J. Infrastruct. Syst. 2017, 23, 04017033. [Google Scholar] [CrossRef]
  56. Tawalare, A.; Laishram, B.; Thottathil, F. Relational partnership in public construction organizations: Front-line employee perspective. J. Constr. Eng. Manag. 2020, 146, 04019086. [Google Scholar] [CrossRef]
  57. Norusis, M. SPSS 16.0 Advanced Statistical Procedures Companion; Prentice Hall Press: Upper Saddle River, NJ, USA, 2008. [Google Scholar]
  58. Opara, G.; Nwaukwa, J.; Uloko, F.; Oborindo, C. Predicting Asset Maintenance Failure Using Supervised Machine Learning Techniques. World J. Innov. Res. 2021, 11, 28–34. [Google Scholar] [CrossRef]
  59. Al-Kasasbeh, M.; Abudayyeh, O.; Liu, H. An integrated decision support system for building asset management based on BIM and Work Breakdown Structure. J. Build. Eng. 2021, 34, 101959. [Google Scholar] [CrossRef]
  60. Carvajal-Arango, D.; Bahamón-Jaramillo, S.; Aristizábal-Monsalve, P.; Vásquez-Hernández, A.; Botero, L.F.B. Relationships between lean and sustainable construction: Positive impacts of lean practices over sustainability during construction phase. J. Clean. Prod. 2019, 234, 1322–1337. [Google Scholar] [CrossRef]
  61. Chesbrough, H.; Lettl, C.; Ritter, T. Value creation and value capture in open innovation. J. Prod. Innov. Manag. 2018, 35, 930–938. [Google Scholar] [CrossRef]
  62. Mésároš, P.; Mandičák, T.; Spišáková, M.; Behúnová, A.; Behún, M. The Implementation Factors of Information and Communication Technology in the Life Cycle Costs of Buildings. Appl. Sci. 2021, 11, 2934. [Google Scholar] [CrossRef]
  63. Weerasinghe, A.S.; Ramachandra, T.; Rotimi, J.O. Towards sustainable commercial buildings: An analysis of operation and maintenance (O&M) costs in Sri Lanka. Smart Sustain. Built Environ. 2022, 11, 454–468. [Google Scholar]
  64. Matarneh, S.T.; Danso-Amoako, M.; Al-Bizri, S.; Gaterell, M.; Matarneh, R. Building information modeling for facilities management: A literature review and future research directions. J. Build. Eng. 2019, 24, 100755. [Google Scholar] [CrossRef]
  65. Xue, R.; Baron, C.; Vingerhoeds, R.; Esteban, P. Enhancing Engineering Project Management Through Process Alignment. Eng. Manag. J. 2022, 34, 230–248. [Google Scholar] [CrossRef]
  66. Yeung, J.F.Y.; Chan, A.P.C.; Chan, D.W.M.; Li, L.K. Development of a partnering performance index (PPI) for construction projects in Hong Kong: A Delphi study. Constr. Manag. Econ. 2007, 25, 1219–1237. [Google Scholar] [CrossRef]
  67. Heydari, M.; Rahim, F.A.M.; Aziz, N.M. Developing a Model to Evaluate the Impact of Initiation Activities on Project Success in Iran by Considering Managing Stakeholder Engagement as a Moderator. Iran. J. Sci. Technol. Trans. Civ. Eng. 2022, 46, 397–418. [Google Scholar] [CrossRef]
  68. Berthin, G. A Practical Guide to Social Audit as a Participatory Tool to Strengthen Democratic Governance; Transparency, and Accountability, United Nations Development Programme UNDP Regional Centre Panama: New York, NY, USA, 2011. [Google Scholar]
Figure 1. Stakeholder management process assessment index model.
Buildings 13 01441 g001
Figure 2. Stakeholder management process assessment framework.
Buildings 13 01441 g002
Table 1. Identified quantitative indicators to assess stakeholder management performance.
No.Quantitative Indicators (QI)Mosley and Bubshait [34]Ingle and Mahesh [41]Oppong, Chan [13]Urbinati, Landoni [42]Stanitsas, Kirytopoulos [36]Habibi, Kermanshachi [43]Moradi, Ansari [26]Lundgren, Bokrantz [28]Hristov and Chirico [37]Khanzadi, Sheikhkhoshkar [8]Li, O’Donnell [44]Goodman, Ackermann [45]Angelakoglou, Kourtzanidis [27]Zheng, Baron [33]
QI 1.Number of external ideas generated with the consultation of stakeholders
QI 2.Reduction in operation and maintenance costs
QI 3.Emissions (carbon dioxide) during the processes
QI 4.Number of safety incidents on the project site
QI 5.The time between shutdown and reoperation in the event of any asset failure
QI 6.Number of complaints from the consumers on account of project effectiveness
QI 7.Number of design clashes resulting in rework and waste generation
QI 8.Asset/service downtime
QI 9.Asset downtime cost
QI 10.Number of unplanned and non-forecast maintenance
QI 11.Maintenance cost as a percentage of total service revenue
QI 12.Mean time between failure (total operating time/number of failures)
QI 13.Cost of rework expressed as a percentage of project completion cost
QI 14.Rework/defect rectification time
QI 15.Satisfaction of customers with the developed facility
QI 16.Number and cost of unplanned maintenance tasks
QI 17.On-time work completion
QI 18.Achieving project designs as per the required aesthetics, visual permeability, density, and height
QI 19.Innovations/technological advancements toward saving project costs are expressed as a percentage of project completion cost
QI 20.Innovations/technological advancements toward saving project time are expressed as a percentage of project completion time
QI 21.Delivery accuracy
QI 22.Percentage of design solutions fulfilling environmental standards
QI 23.Change between actual design time and predicted design time
QI 24.Time required for the approvals
QI 25.Percentage of drawings that are clear, comprehensive, and well-defined
QI 26.Data privacy and security
Table 2. Respondents of the Study.
Questionnaire Survey Respondents
VariablesNumberPercentage (%)
Nature of Organization/Project Sector
Public3156.4
Private2443.6
Work Experience
<5 Years47.3
5–10 Years35.5
10–15 Years916.4
15–20 Years1527.3
20+ Years2443.6
Work Experience on Mega Construction Project
<5 Years1629.1
5–10 Years1832.7
10–15 Years1425.5
15+ Years712.7
Nature of Project
Metro and other RRTS Projects2647.3
Building projects, including housing projects1120.0
Bridges, road, and highway projects1018.2
Others814.5
Table 3. Results of factor analysis.
No.Factor Analysis (Principal Component Analysis)Mean Score
LoadingEigen Value% Variance ExplainedCum. % Variance ExplainedQIKPI
KPI 1 3.697 (7.121)14.218 (27.389)14.218 (27.389) 4.261
QI 30.622 4.309
QI 50.725 4.436
QI 80.711 4.236
QI 100.793 4.364
QI 120.665 4.345
QI 150.553 3.873
KPI 2 3.454 (2.377)13.283 (9.143)27.501 (36.532) 3.891
QI 10.481 4.364
QI 70.540 3.764
QI 130.618 3.673
QI 140.628 3.945
QI 210.665 3.818
QI 240.638 3.782
KPI 3 2.801 (2.209)10.773 (8.495)38.274 (45.027) 3.945
QI 20.671 4.473
QI 90.600 3.836
QI 110.737 3.800
QI 160.598 3.673
KPI 4 2.504 (1.812)9.631 (6.970)47.905 (51.996) 3.559
QI 40.662 3.582
QI 60.481 4.091
QI 170.742 3.127
QI 260.571 3.436
KPI 5 2.030 (1.524)7.808 (5.862)55.713 (57.859) 3.945
QI 180.496 3.855
QI 220.466 4.055
QI 230.575 3.945
QI 250.764 3.927
KPI 6 1.965 (1.407)7.557 (5.411)63.270 (63.270) 4.018
QI 190.606 4.327
QI 200.775 3.709
Table 4. Index values of QIs and KPIs.
No.CodesWeightingsEstimated Membership Functions (MFs)IndexNormalized Value
QIKPIMFs at Level 2 (QIs)MFs at Level 1 (KPIs)
KPI 1 0.180 0.0180.0140.1060.4050.4574.270.180
QI 3AP 10.169 0.0180.0000.1270.3640.491
QI 5AP 20.174 0.0180.0000.0000.4910.491
QI 8AP 30.166 0.0180.0000.1640.3640.455
QI 10AP 40.171 0.0180.0000.0180.5270.436
QI 12AP 50.170 0.0180.0000.1090.3640.509
QI 15AP 60.151 0.0180.0910.2360.3090.345
KPI 2 0.165 0.0180.0390.2420.4240.2783.900.165
QI 1PE 10.187 0.0000.0180.0180.5450.418
QI 7PE 20.161 0.0180.0180.2730.5640.127
QI 13PE 30.157 0.0180.0730.3450.3450.218
QI 14PE 40.169 0.0180.0910.2180.2730.400
QI 21PE 50.164 0.0360.0000.3090.4180.236
QI 24PE 60.162 0.0180.0360.3270.3820.236
KPI 3 0.167 0.0140.1340.1060.3590.3873.970.167
QI 2PO 10.283 0.0180.0000.0550.3450.582
QI 9PO 20.243 0.0180.1450.1270.4000.309
QI 11PO 30.241 0.0000.2180.0910.3640.327
QI 16PO 40.233 0.0180.2000.1640.3270.291
KPI 4 0.151 0.0130.1480.3130.2850.2413.590.151
QI 4SC 10.252 0.0180.0000.5450.2550.182
QI 6SC 20.287 0.0000.0360.2360.3270.400
QI 17SC 30.220 0.0180.3270.3090.2000.145
QI 26SC 40.241 0.0180.2730.1640.3450.200
KPI 5 0.167 0.0140.0230.3210.2880.3543.950.166
QI 18DO 10.244 0.0180.0000.4550.1640.364
QI 22DO 20.257 0.0180.0000.2180.4360.327
QI 23DO 30.250 0.0180.0730.2730.2180.418
QI 25DO 40.249 0.0000.0180.3450.3270.309
KPI 6 0.170 0.0080.1190.0900.3890.3944.040.170
QI 19OI 10.538 0.0000.0180.0730.4730.436
QI 20OI 20.462 0.0180.2360.1090.2910.345
Disclaimer/Publisher’s Note: The statements, opinions and data contained in all publications are solely those of the individual author(s) and contributor(s) and not of MDPI and/or the editor(s). MDPI and/or the editor(s) disclaim responsibility for any injury to people or property resulting from any ideas, methods, instructions or products referred to in the content.

