
Make TOD More Bicycling-Friendly: An Extended Node-Place Model Incorporating a Cycling Accessibility Index

Abstract
:1. Introduction
2. Literature Review
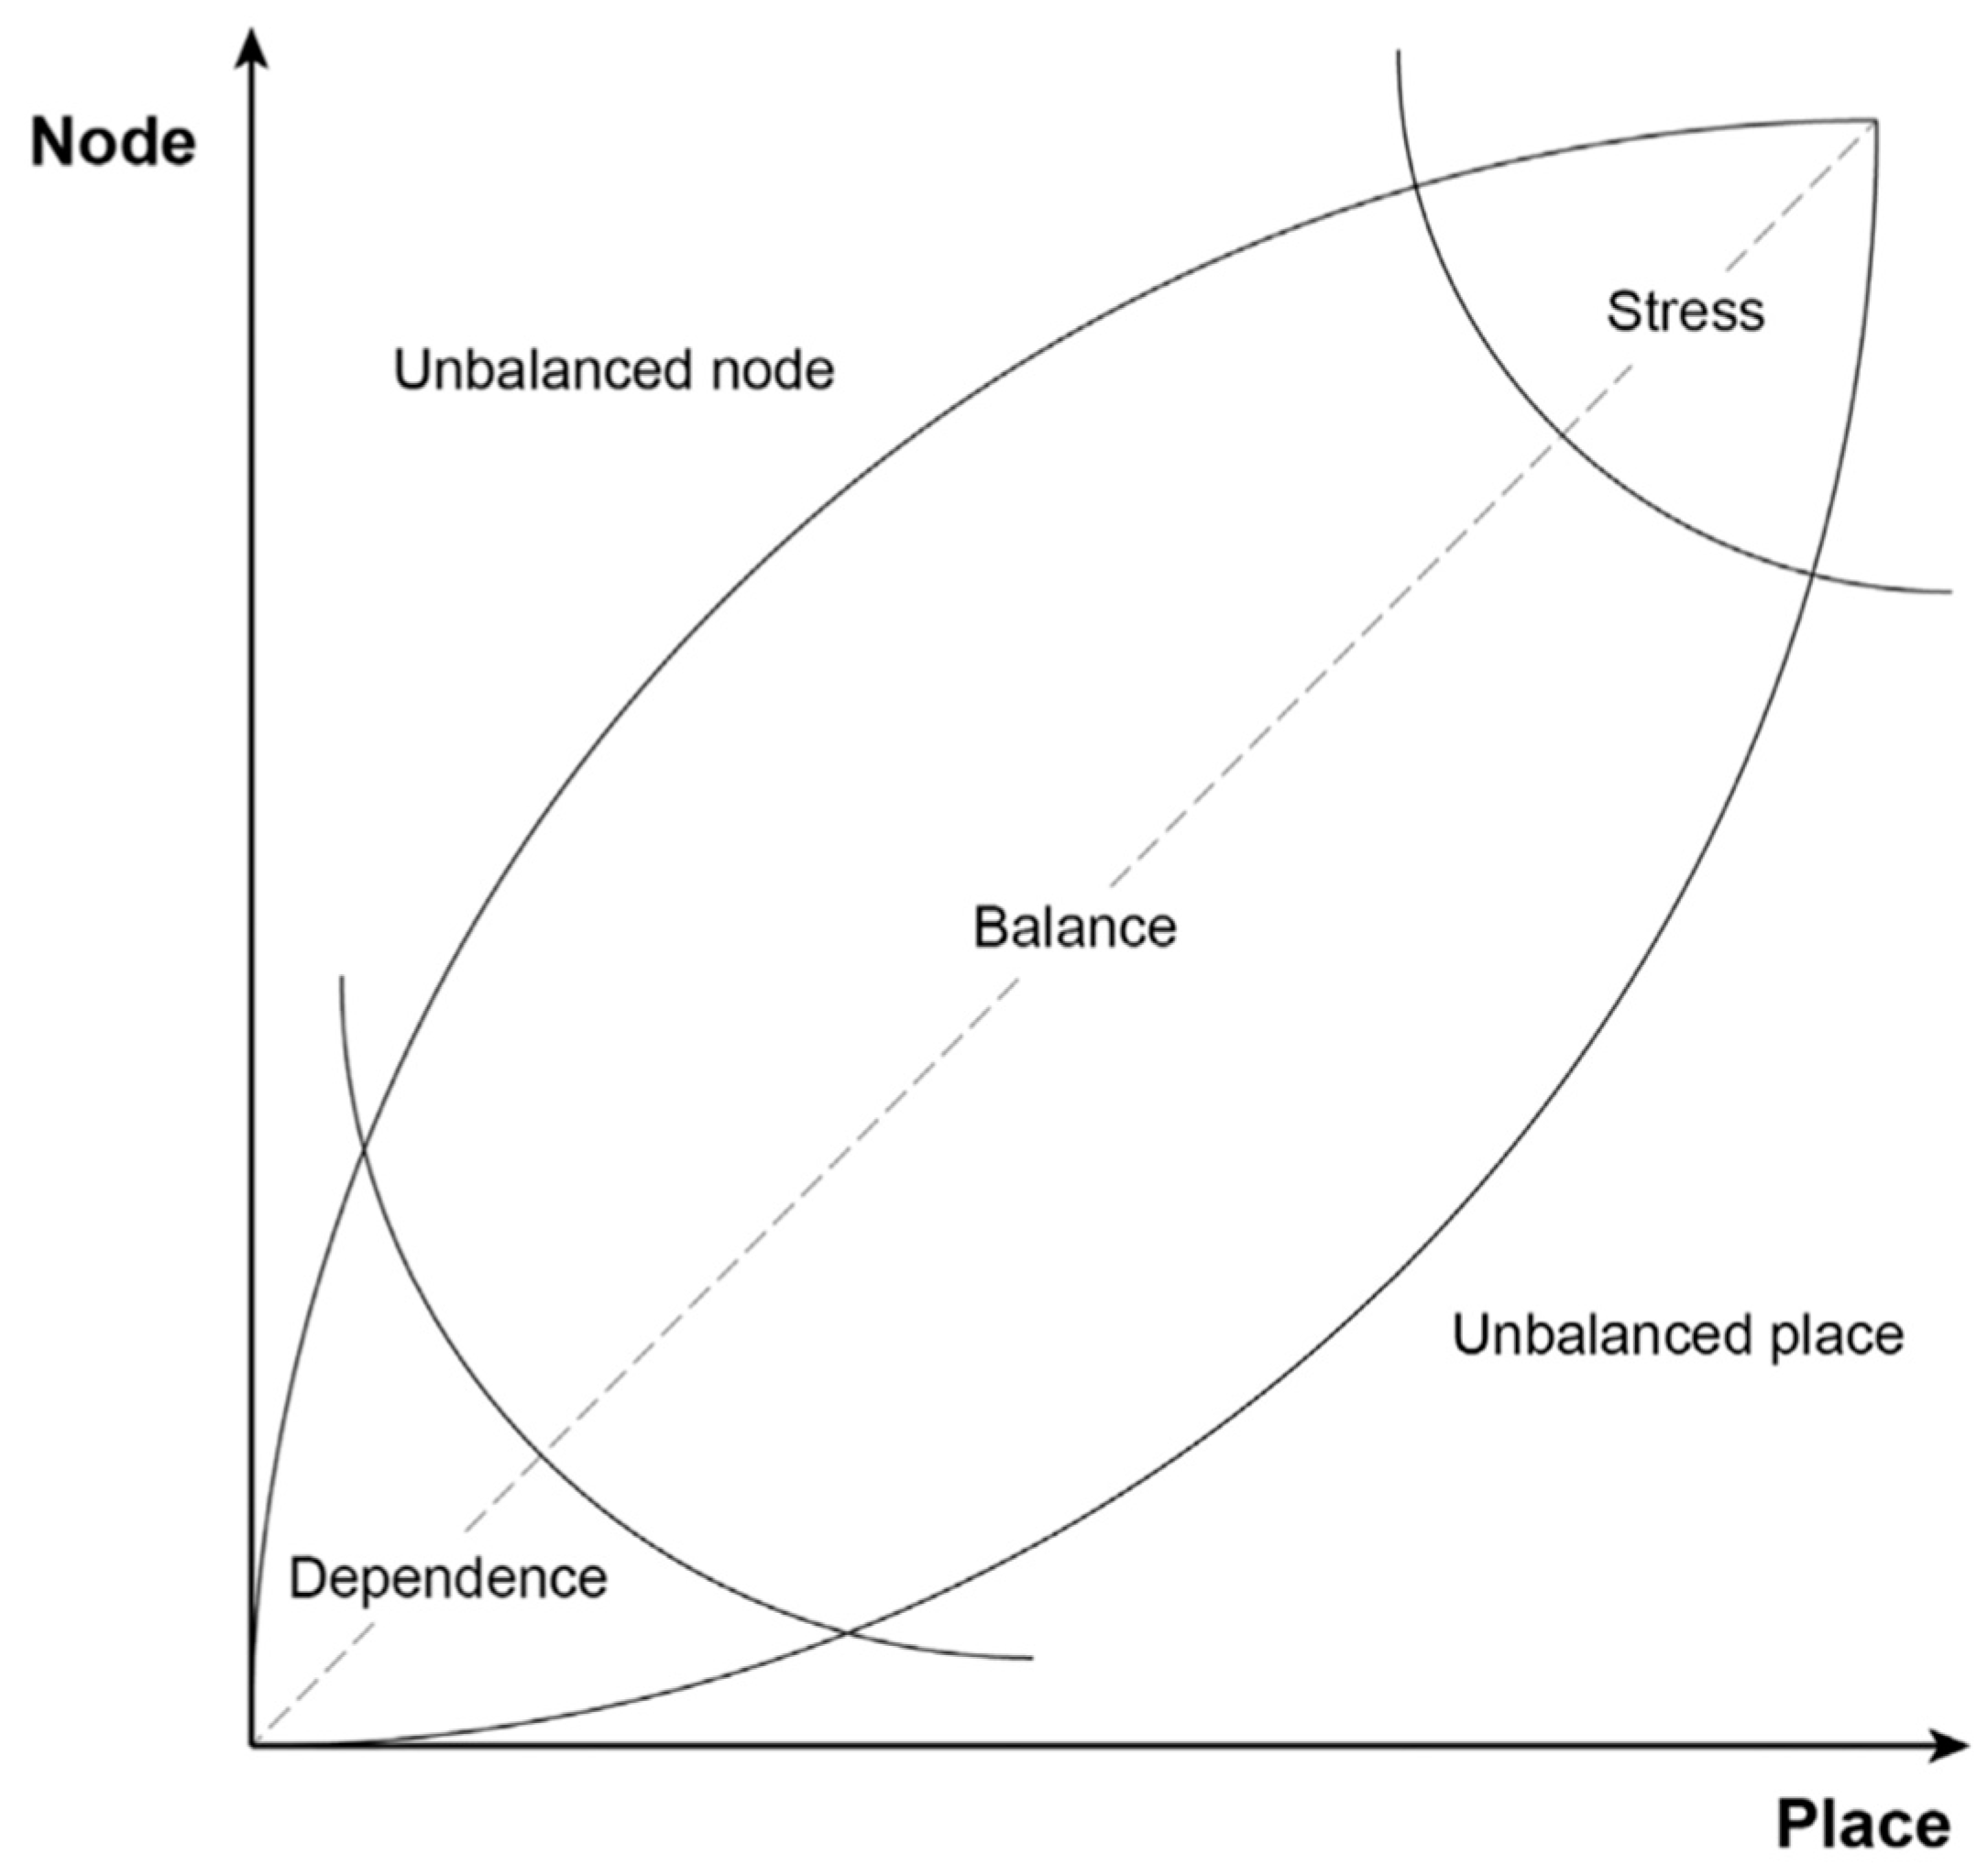
2.1. Node-Place Model
2.2. Extended Node-Place Models
3. Study Area and Data
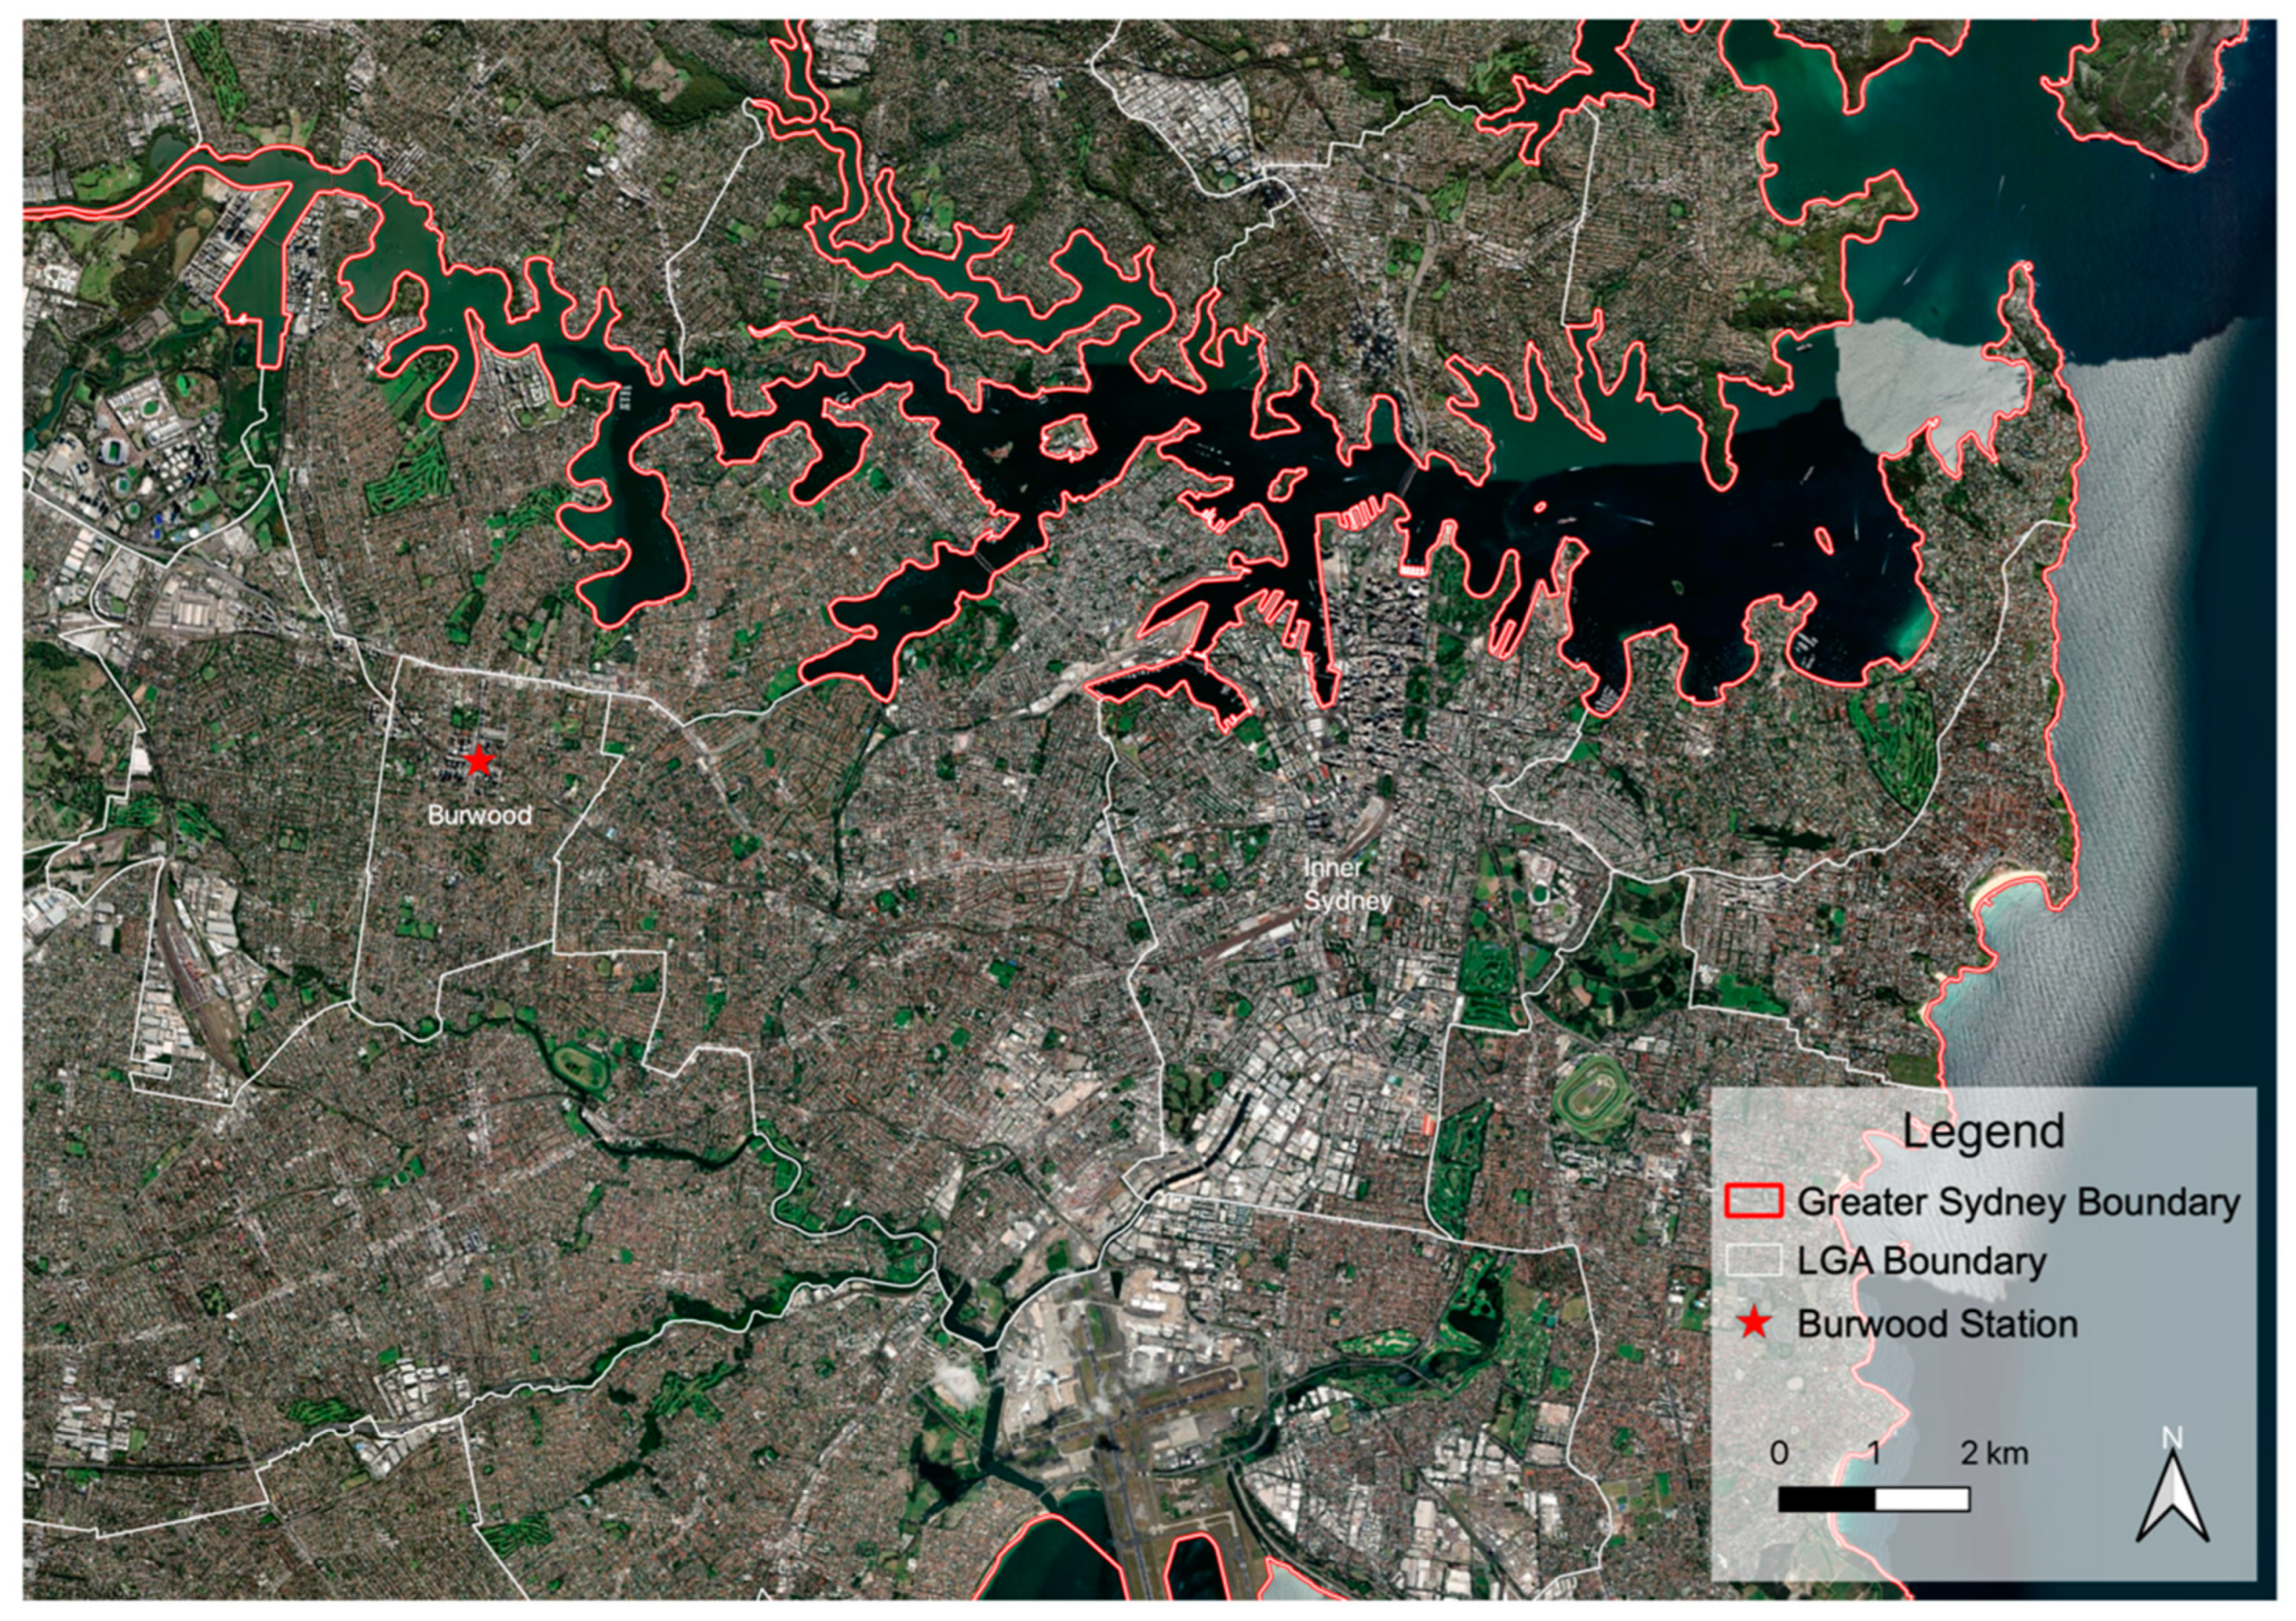
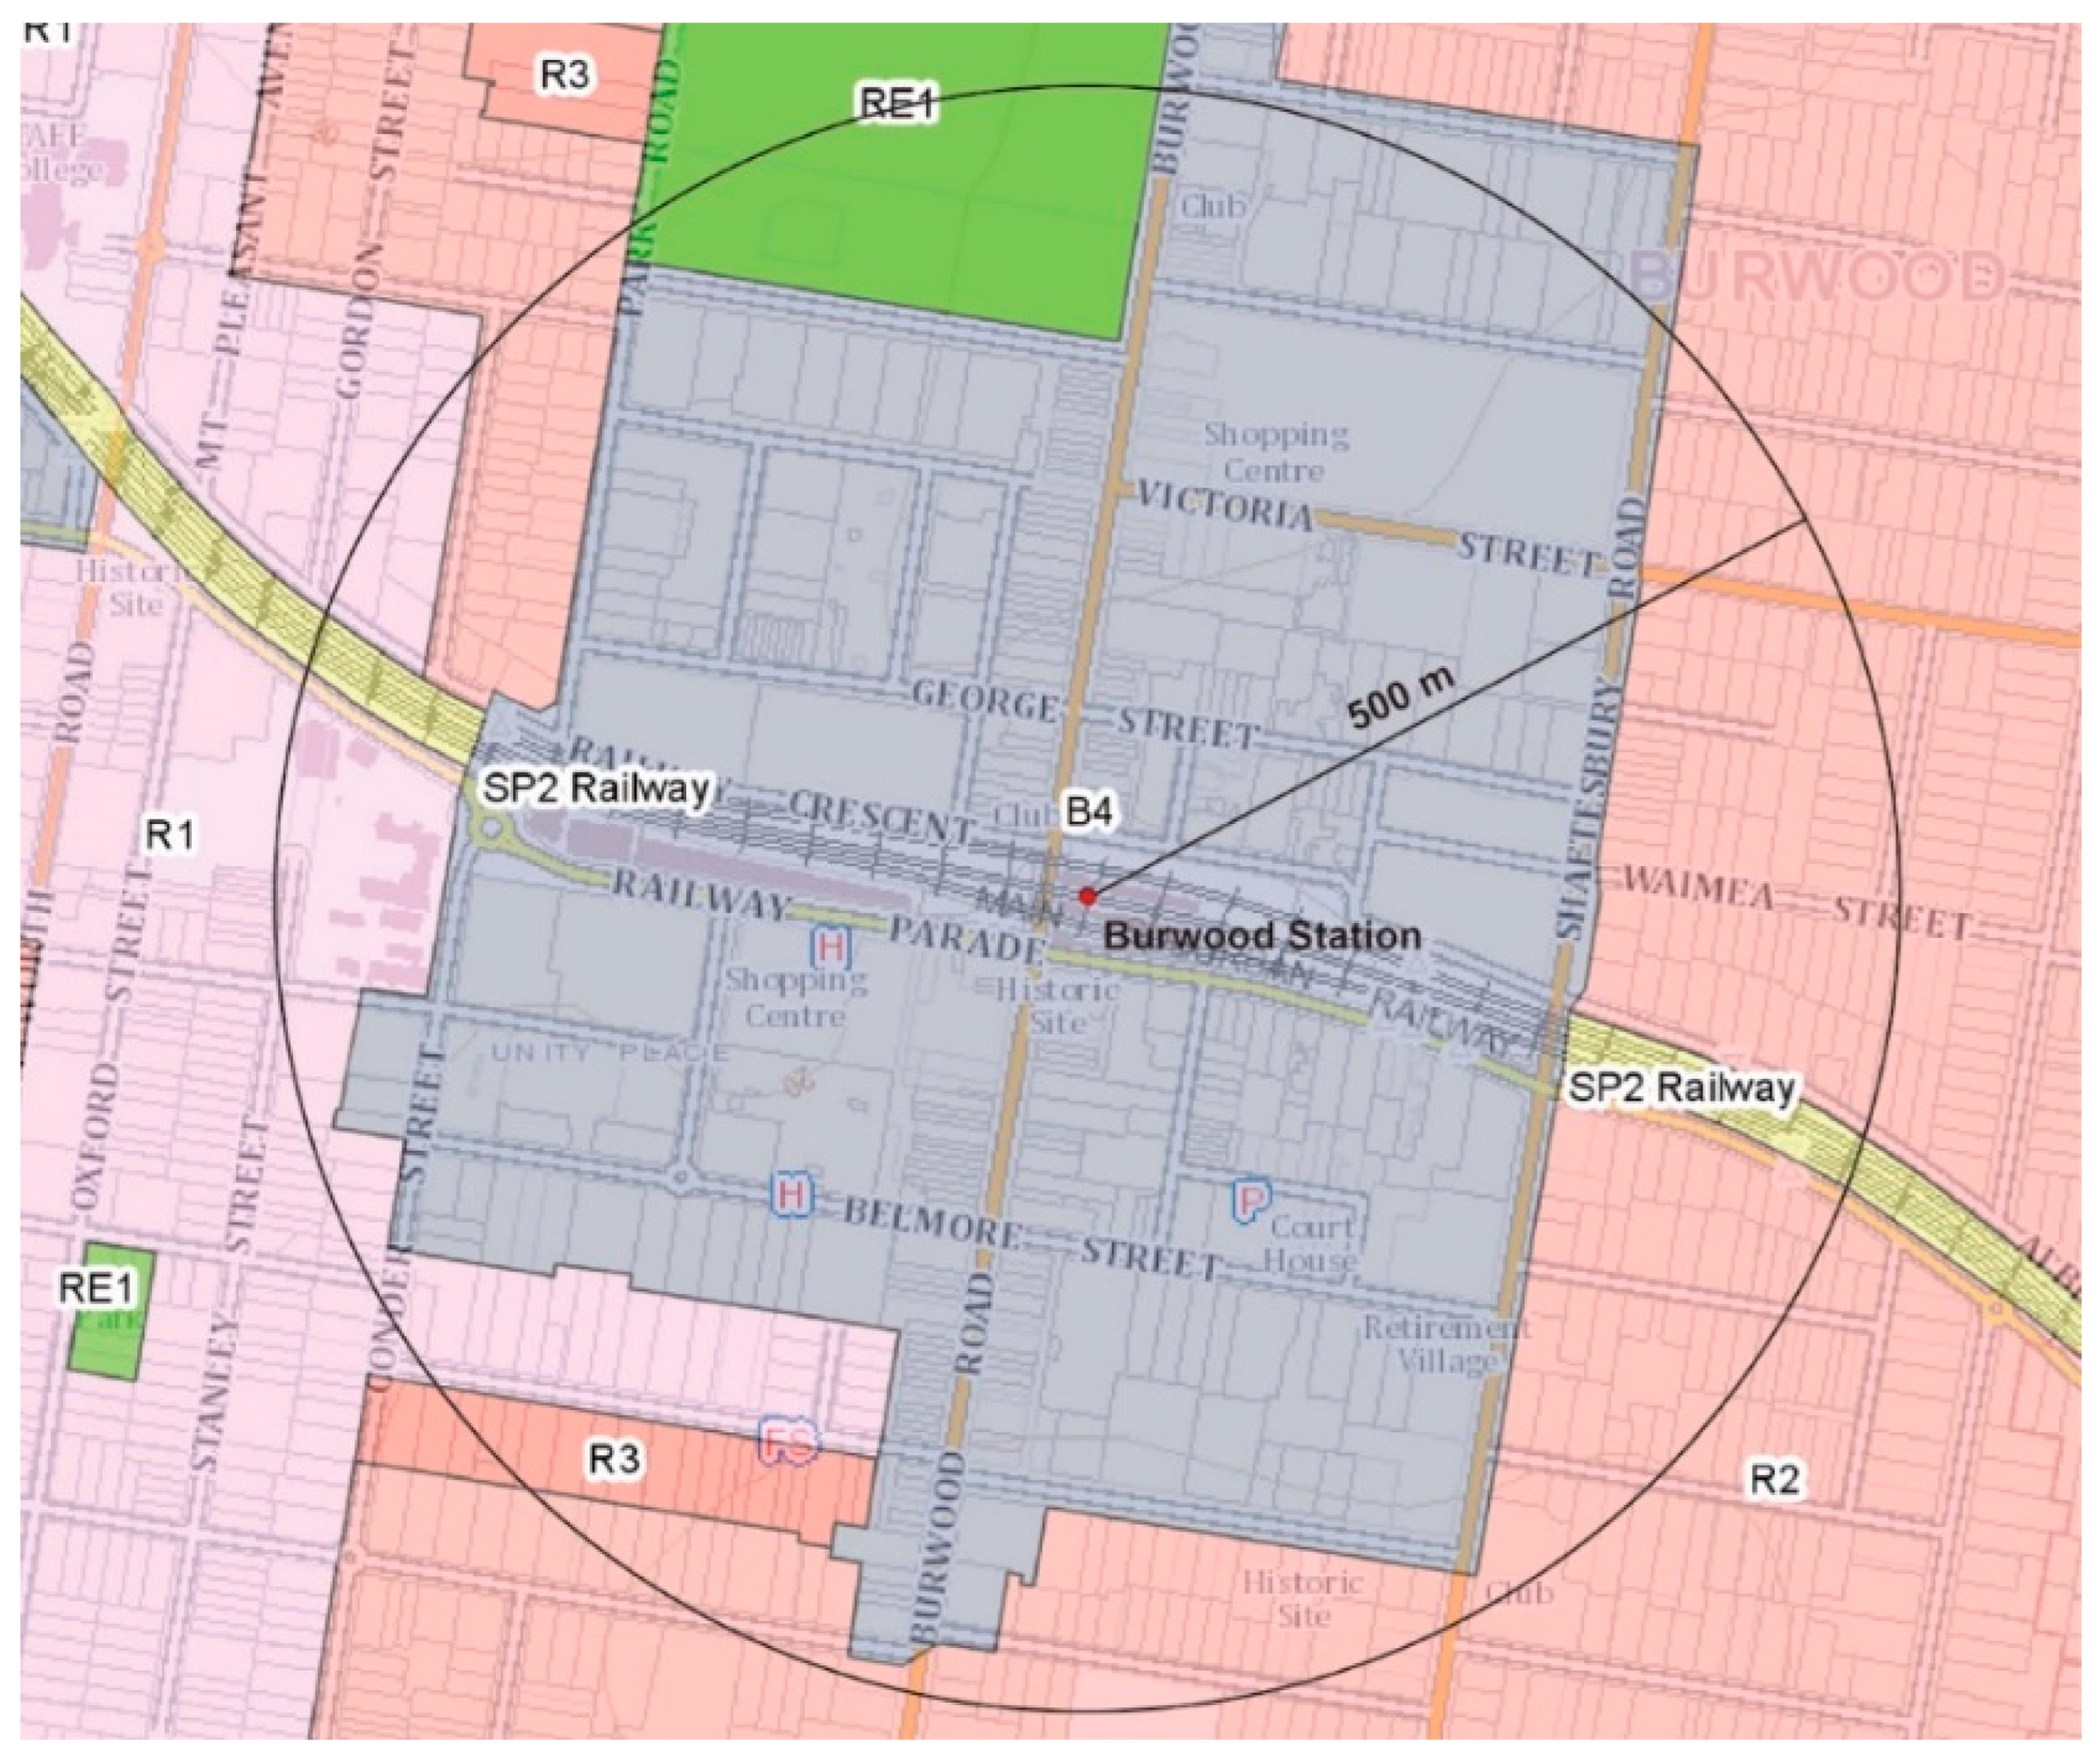
3.1. Study Area
3.2. Data
4. Modelling
4.1. Node Index
4.2. Place Index
4.3. Design Index
4.4. TOD Typology of the Burwood Station Area
5. Conclusions
Author Contributions
Funding
Data Availability Statement
Conflicts of Interest
References
- Suzuki, H.; Murakami, J.; Hong, Y.-H.; Tamayose, B. Financing Transit-Oriented Development with Land Values; World Bank Publications: Washington, DC, USA, 2015. [Google Scholar]
- Angel, S.; Parent, J.; Civco, D.L.; Blei, A.; Potere, D. The Dimensions of Global Urban Expansion: Estimates and Projections for All Countries, 2000–2050. Prog. Plan. 2011, 75, 53–107. [Google Scholar] [CrossRef]
- Rodríguez-Pose, A.; Storper, M. Housing, Urban Growth and Inequalities: The Limits to Deregulation and Upzoning in Reducing Economic and Spatial Inequality. Urban Stud. 2020, 57, 223–248. [Google Scholar] [CrossRef]
- Calthorpe, P. The Next American Metropolis: Ecology, Community, and the American Dream; Princeton Architectural Press: New York, NY, USA, 1993. [Google Scholar]
- Cervero, R. City CarShare: First-Year Travel Demand Impacts. Transp. Res. Rec. J. Transp. Res. Board 2003, 1839, 159–166. [Google Scholar] [CrossRef]
- Dittmar, H.; Ohland, G. The New Transit Town: Best Practices in Transit-Oriented Development; Island Press: Washington, DC, USA, 2004. [Google Scholar]
- Chen, F.; Wu, J.; Chen, X.; Wang, J. Vehicle kilometers traveled reduction impacts of Transit-Oriented Development: Evidence from Shanghai City. Transp. Res. Part D Transp. Environ. 2017, 55, 227–245. [Google Scholar] [CrossRef]
- Nasri, A.; Zhang, L. The analysis of transit-oriented development (TOD) in Washington, D.C. and Baltimore metropolitan areas. Transp. Policy 2014, 32, 172–179. [Google Scholar] [CrossRef]
- Shatu, F.; Kamruzzaman, M. Investigating the Link between Transit Oriented Development and Sustainable Travel Behavior in Brisbane: A Case-Control Study. J. Sustain. Dev. 2014, 7, 61–70. [Google Scholar] [CrossRef]
- Choi, Y.; Guhathakurta, S. Do people walk more in transit-accessible places? J. Transp. Land Use 2020, 13, 343–365. [Google Scholar] [CrossRef]
- Higgins, C.D.; Kanaroglou, P.S. A latent class method for classifying and evaluating the performance of station area transit-oriented development in the Toronto region. J. Transp. Geogr. 2016, 52, 61–72. [Google Scholar] [CrossRef]
- Noland, R.B.; DiPetrillo, S. Transit-oriented development and the frequency of modal use. J. Transp. Land Use 2015, 8, 21–44. [Google Scholar] [CrossRef]
- Chatman, D.G. Does TOD need the T? On the importance of factors other than rail access. J. Am. Plan. Assoc. 2013, 79, 17–31. [Google Scholar] [CrossRef]
- Dill, J. Survey of Merrick TOD Residents Final Report; Portland State University: Portland, OR, USA, 2005. [Google Scholar]
- Chow, A.S.Y. Urban Design, Transport Sustainability and Residents’ Perceived Sustainability: A Case Study of Transit-oriented Development in Hong Kong. J. Comp. Asian Dev. 2014, 13, 73–104. [Google Scholar] [CrossRef]
- Ettema, D.; Nieuwenhuis, R. Residential self-selection and travel behaviour: What are the effects of attitudes, reasons for location choice and the built environment? J. Transp. Geogr. 2017, 59, 146–155. [Google Scholar] [CrossRef]
- Renne, J.L.; Curtis, C.; Bertolini, P.L.; Hesse, P.D.M.; Knowles, P.R. Transit Oriented Development: Making it Happen; Taylor & Francis Group: Oxon, UK, 2009. [Google Scholar]
- Cervero, R. Transit-Oriented Development in the United States: Experiences, Challenges, and Prospects; Transportation Research Board: Washington, DC, USA, 2004. [Google Scholar]
- Lee, J.; Choi, K.; Leem, Y. Bicycle-based transit-oriented development as an alternative to overcome the criticisms of the conventional transit-oriented development. Int. J. Sustain. Transp. 2015, 10, 975–984. [Google Scholar] [CrossRef]
- Lee, J.Y.; Leem, Y.T.; Lee, S.H. Analysis of u-bike service and itspriorities. J. Korean Soc. Transp. 2010, 28, 7–17. [Google Scholar]
- Ibraeva, A.; de Correia GH, A.; Silva, C.; Antunes, A.P. Transit-oriented development: A review of research achievements and challenges. Transp. Res. Part A Policy Pract. 2020, 132, 110–130. [Google Scholar] [CrossRef]
- Su, S.; Zhang, H.; Wang, M.; Weng, M.; Kang, M. Transit-oriented development (TOD) typologies around metro station areas in urban China: A comparative analysis of five typical megacities for planning implications. J. Transp. Geogr. 2020, 90, 102939. [Google Scholar] [CrossRef]
- Bertolini, L. Nodes and places: Complexities of railway station redevelopment. Eur. Plan. Stud. 1996, 4, 331–345. [Google Scholar] [CrossRef]
- Bertolini, L. Spatial Development Patterns and Public Transport: The Application of an Analytical Model in the Netherlands. Plan. Pract. Res. 1999, 14, 199–210. [Google Scholar] [CrossRef]
- Lyu, G.; Bertolini, L.; Pfeffer, K. Developing a TOD typology for Beijing metro station areas. J. Transp. Geogr. 2016, 55, 40–50. [Google Scholar] [CrossRef]
- Vale, D.S.; Viana, C.M.; Pereira, M. The extended node-place model at the local scale: Evaluating the integration of land use and transport for Lisbon’s subway network. J. Transp. Geogr. 2018, 69, 282–293. [Google Scholar] [CrossRef]
- Zhang, Y.; Marshall, S.; Manley, E. Network criticality and the node-place-design model: Classifying metro station areas in Greater London. J. Transp. Geogr. 2019, 79, 102485. [Google Scholar] [CrossRef]
- Caset, F.; Vale, D.S.; Viana, C.M. Measuring the Accessibility of Railway Stations in the Brussels Regional Express Network: A Node-Place Modeling Approach. Netw. Spat. Econ. 2018, 18, 495–530. [Google Scholar] [CrossRef]
- Bertolini, L. Station Areas as Nodes and Places in Urban Networks: An Analytical Tool and Alternative Development Strategies. In Railway Development; Physica-Verlag Heidelberg Publisher: Heidelberg, Germany, 2008. [Google Scholar] [CrossRef]
- Vale, D.S. Transit-oriented development, integration of land use and transport, and pedestrian accessibility: Combining node-place model with pedestrian shed ratio to evaluate and classify station areas in Lisbon. J. Transp. Geogr. 2015, 45, 70–80. [Google Scholar] [CrossRef]
- Cao, Z.; Asakura, Y.; Tan, Z. Coordination between node, place, and ridership: Comparing three transit operators in Tokyo. Transp. Res. Part D Transp. Environ. 2020, 87, 102518. [Google Scholar] [CrossRef]
- Pezeshknejad, P.; Monajem, S.; Mozafari, H. Evaluating sustainability and land use integration of BRT stations via extended node place model, an application on BRT stations of Tehran. J. Transp. Geogr. 2020, 82, 102626. [Google Scholar] [CrossRef]
- Schlossberg, M.; Brown, N. Comparing Transit-Oriented Development Sites by Walkability Indicators. Transp. Res. Rec. 2004, 1887, 34–42. [Google Scholar] [CrossRef]
- Wegener, M.; Fuerst, F. Land Use Transport Interaction: State of the Art. SSRN Electron. J. 2004. Available online: http://www.ssrn.com/abstract=1434678 (accessed on 26 November 2022). [CrossRef]
- Dou, M.; Wang, Y.; Dong, S. Integrating Network Centrality and Node-Place Model to Evaluate and Classify Station Areas in Shanghai. ISPRS Int. J. Geo-Inf. 2021, 10, 414. [Google Scholar] [CrossRef]
- Burwood City Council. History and Heritage. 2022. Available online: https://www.burwood.nsw.gov.au/Our-Council/Our-Burwood/History-and-Heritage (accessed on 13 August 2022).
- Australian Bureau of Statistics. 2021 Burwood, Census All Persons QuickStats. 2022. Available online: https://www.abs.gov.au/census/find-census-data/quickstats/2021/LGA11300 (accessed on 13 August 2022).
- NSW Government. ePlanning Spatial Viewer. 2022. Available online: https://www.planningportal.nsw.gov.au/spatialviewer/#/find-a-property/address (accessed on 28 December 2022).
- Nazemi, M.; van Eggermond, M.; Erath, A.; Schaffner, D.; Joos, M.; Axhausen, K.W. Studying bicyclists’ perceived level of safety using a bicycle simulator combined with immersive virtual reality. Accid. Anal. Prev. 2020, 151, 105943. [Google Scholar] [CrossRef]
- Obregón-Biosca, S.A.; Hernández-García, M. Prediction of urban cyclists’ intentions to ride on the pedestrian lane and against the traffic flow: A sociodemographic and psychosocial approach. Transp. Res. Interdiscip. Perspect. 2022, 14, 100626. [Google Scholar] [CrossRef]


| Indicators | Description | |
|---|---|---|
| Node index | Number of directions served by railway | n1 = number of directions served by train |
| Daily frequency of train services | n2 = daily frequency of train services | |
| Number of directions served by other public transport | n4 = number of bus services offered at the station | |
| Number of station platforms | n5 = number of platforms of each station | |
| Car park availability | n6 = existence of public car parking at the station (yes/no) | |
| Place index | Number of residents | p1 = number of residents within 500 m from the station |
| Number of workers in the retail, hotel, and catering sectors | p2 = Number of workers in the retail, hotel, and catering sectors within 500 m from the station | |
| Number of workers in the education, health, culture sectors | p3 = number of workers in the education, health, and culture sectors within 500 m from the station | |
| Number of workers in the administration and services sectors | p4 = number of workers in the administration and services sectors within 500 m from the station | |
| Number of workers in the industry and distribution sectors | p5 = number of workers in the industry and distribution sectors within 500 m from the station | |
| Degree of functional mix | ||
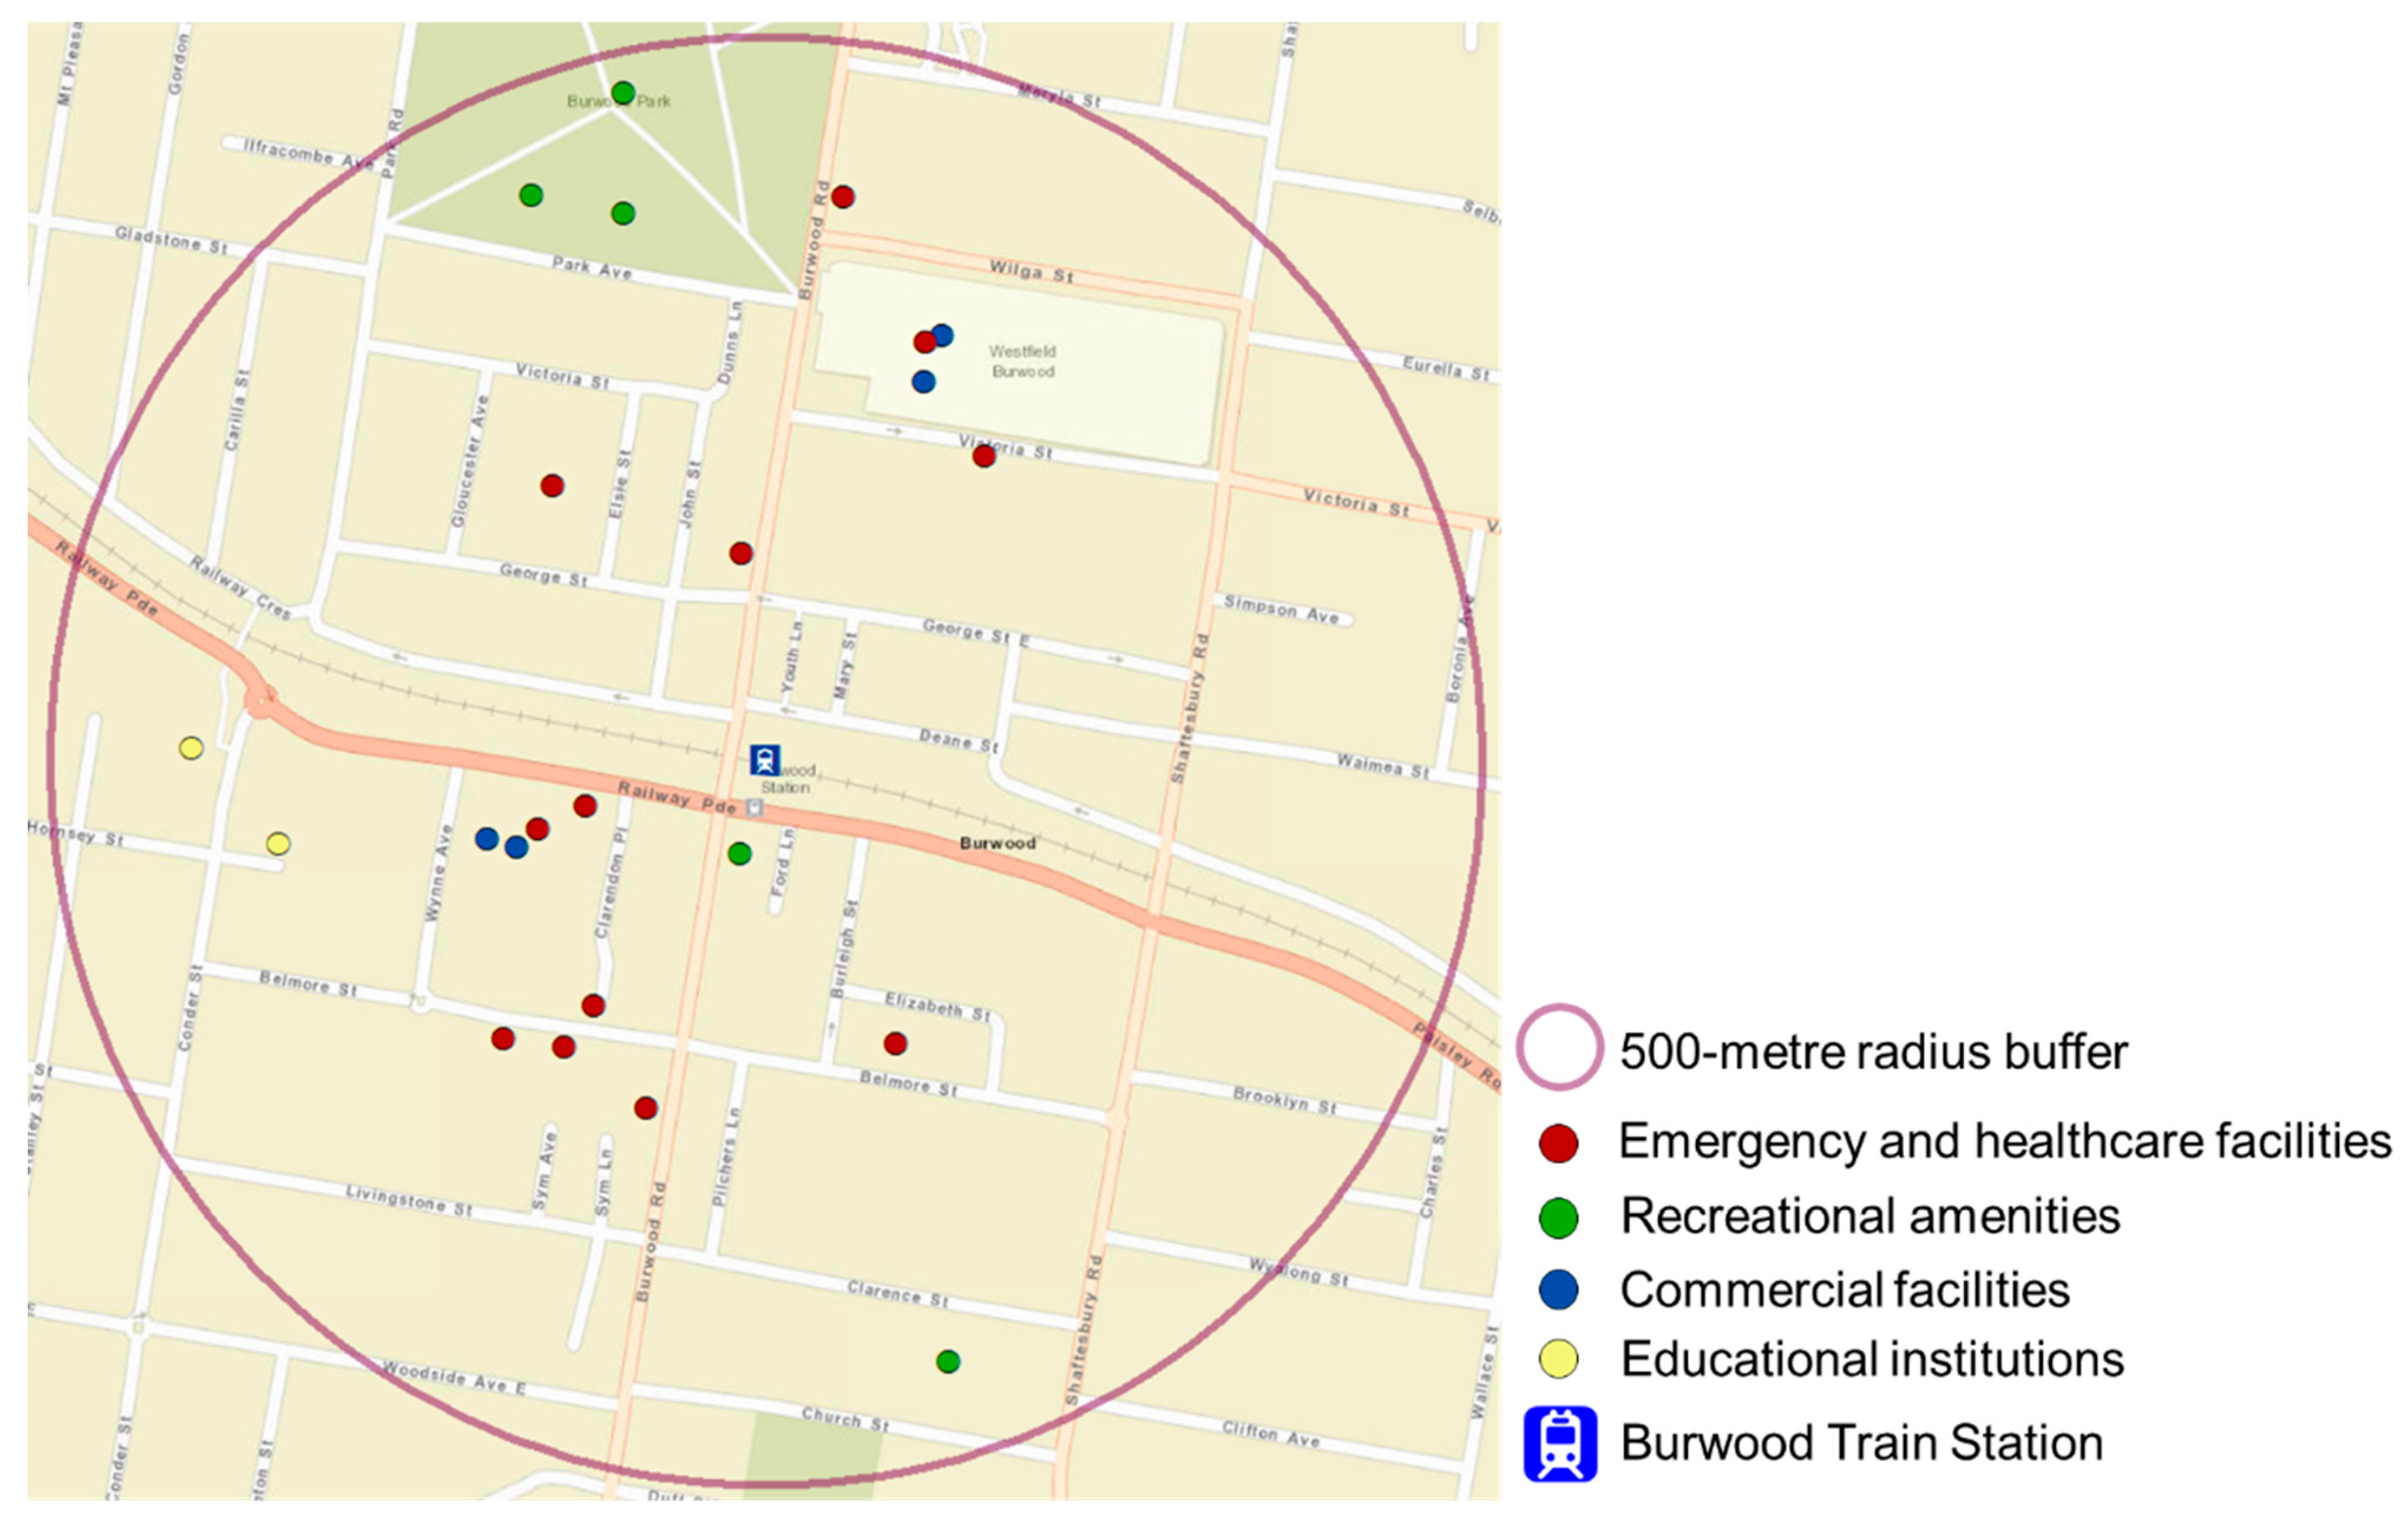
| Number of points of interest | p7 = numbers of points of interest within 500 m from the station | |
| Variety of points of interest | p8 = variety of points of interest within 500 m from the station | |
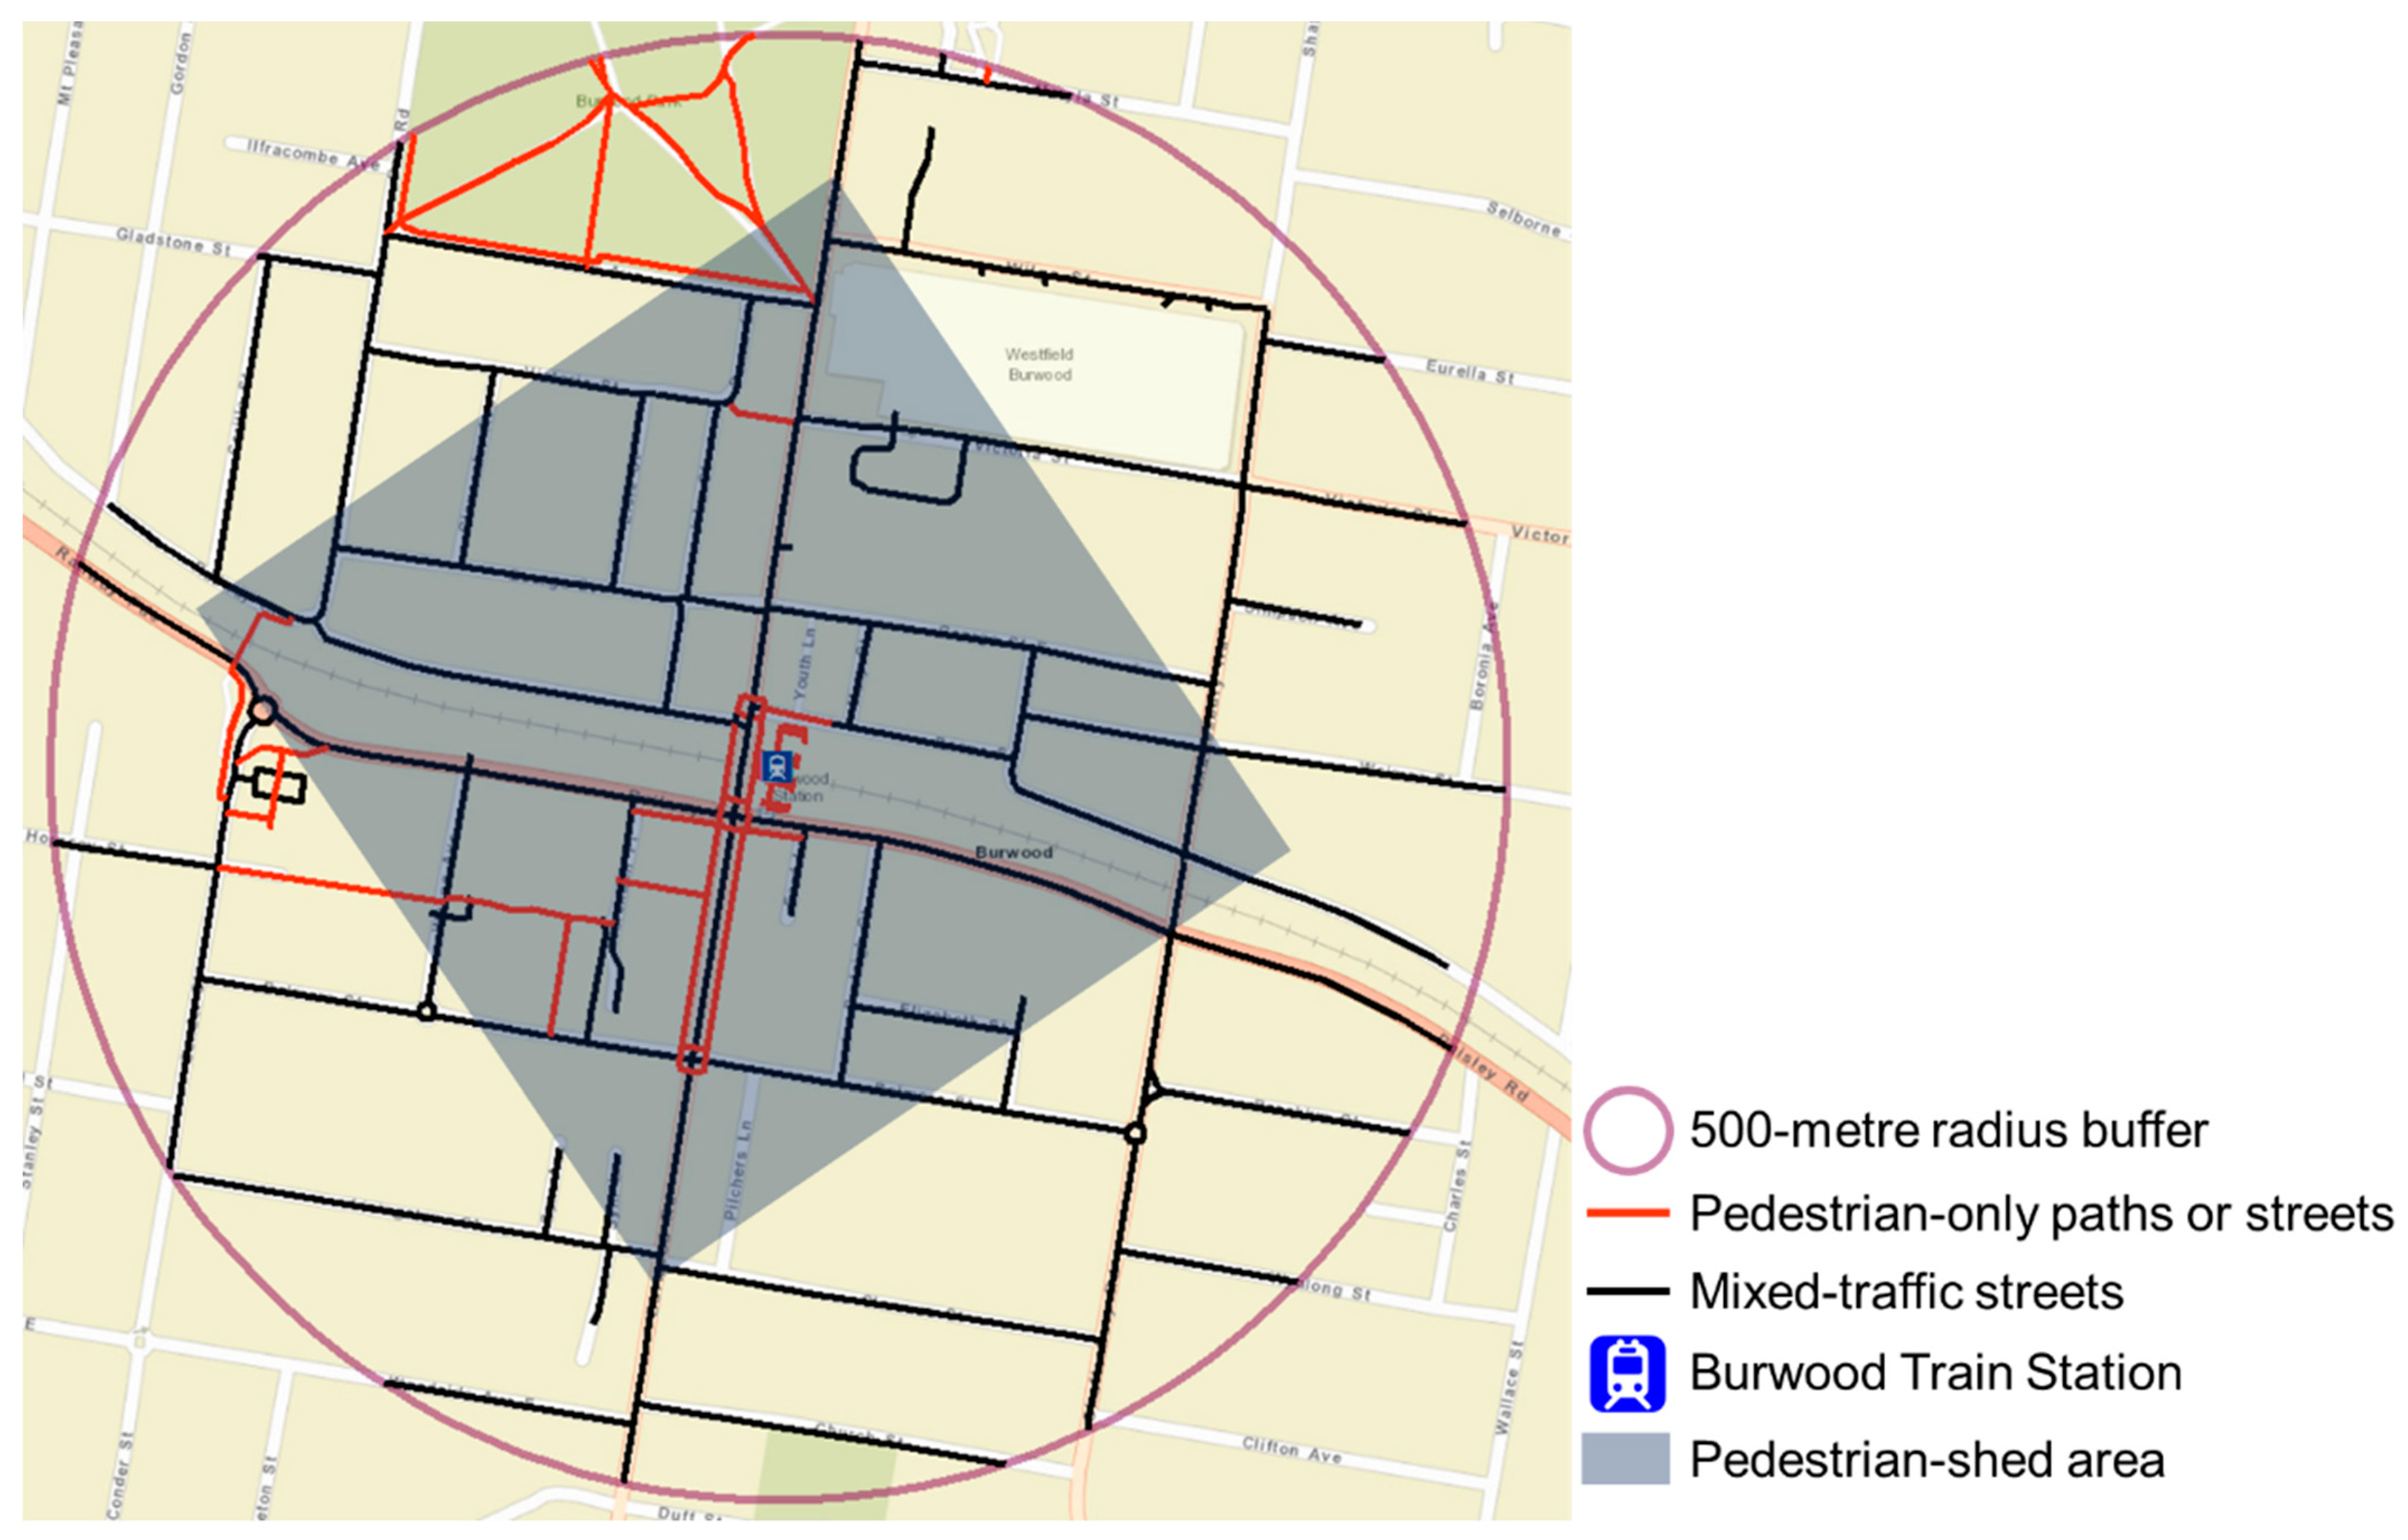
| Design index | Pedestrian shed ratio | d1 = covered area within a five-minute walk from the station |
| Accessible pedestrian network length | d2 = length of the accessible pedestrian path within 500 m boundary from the station | |
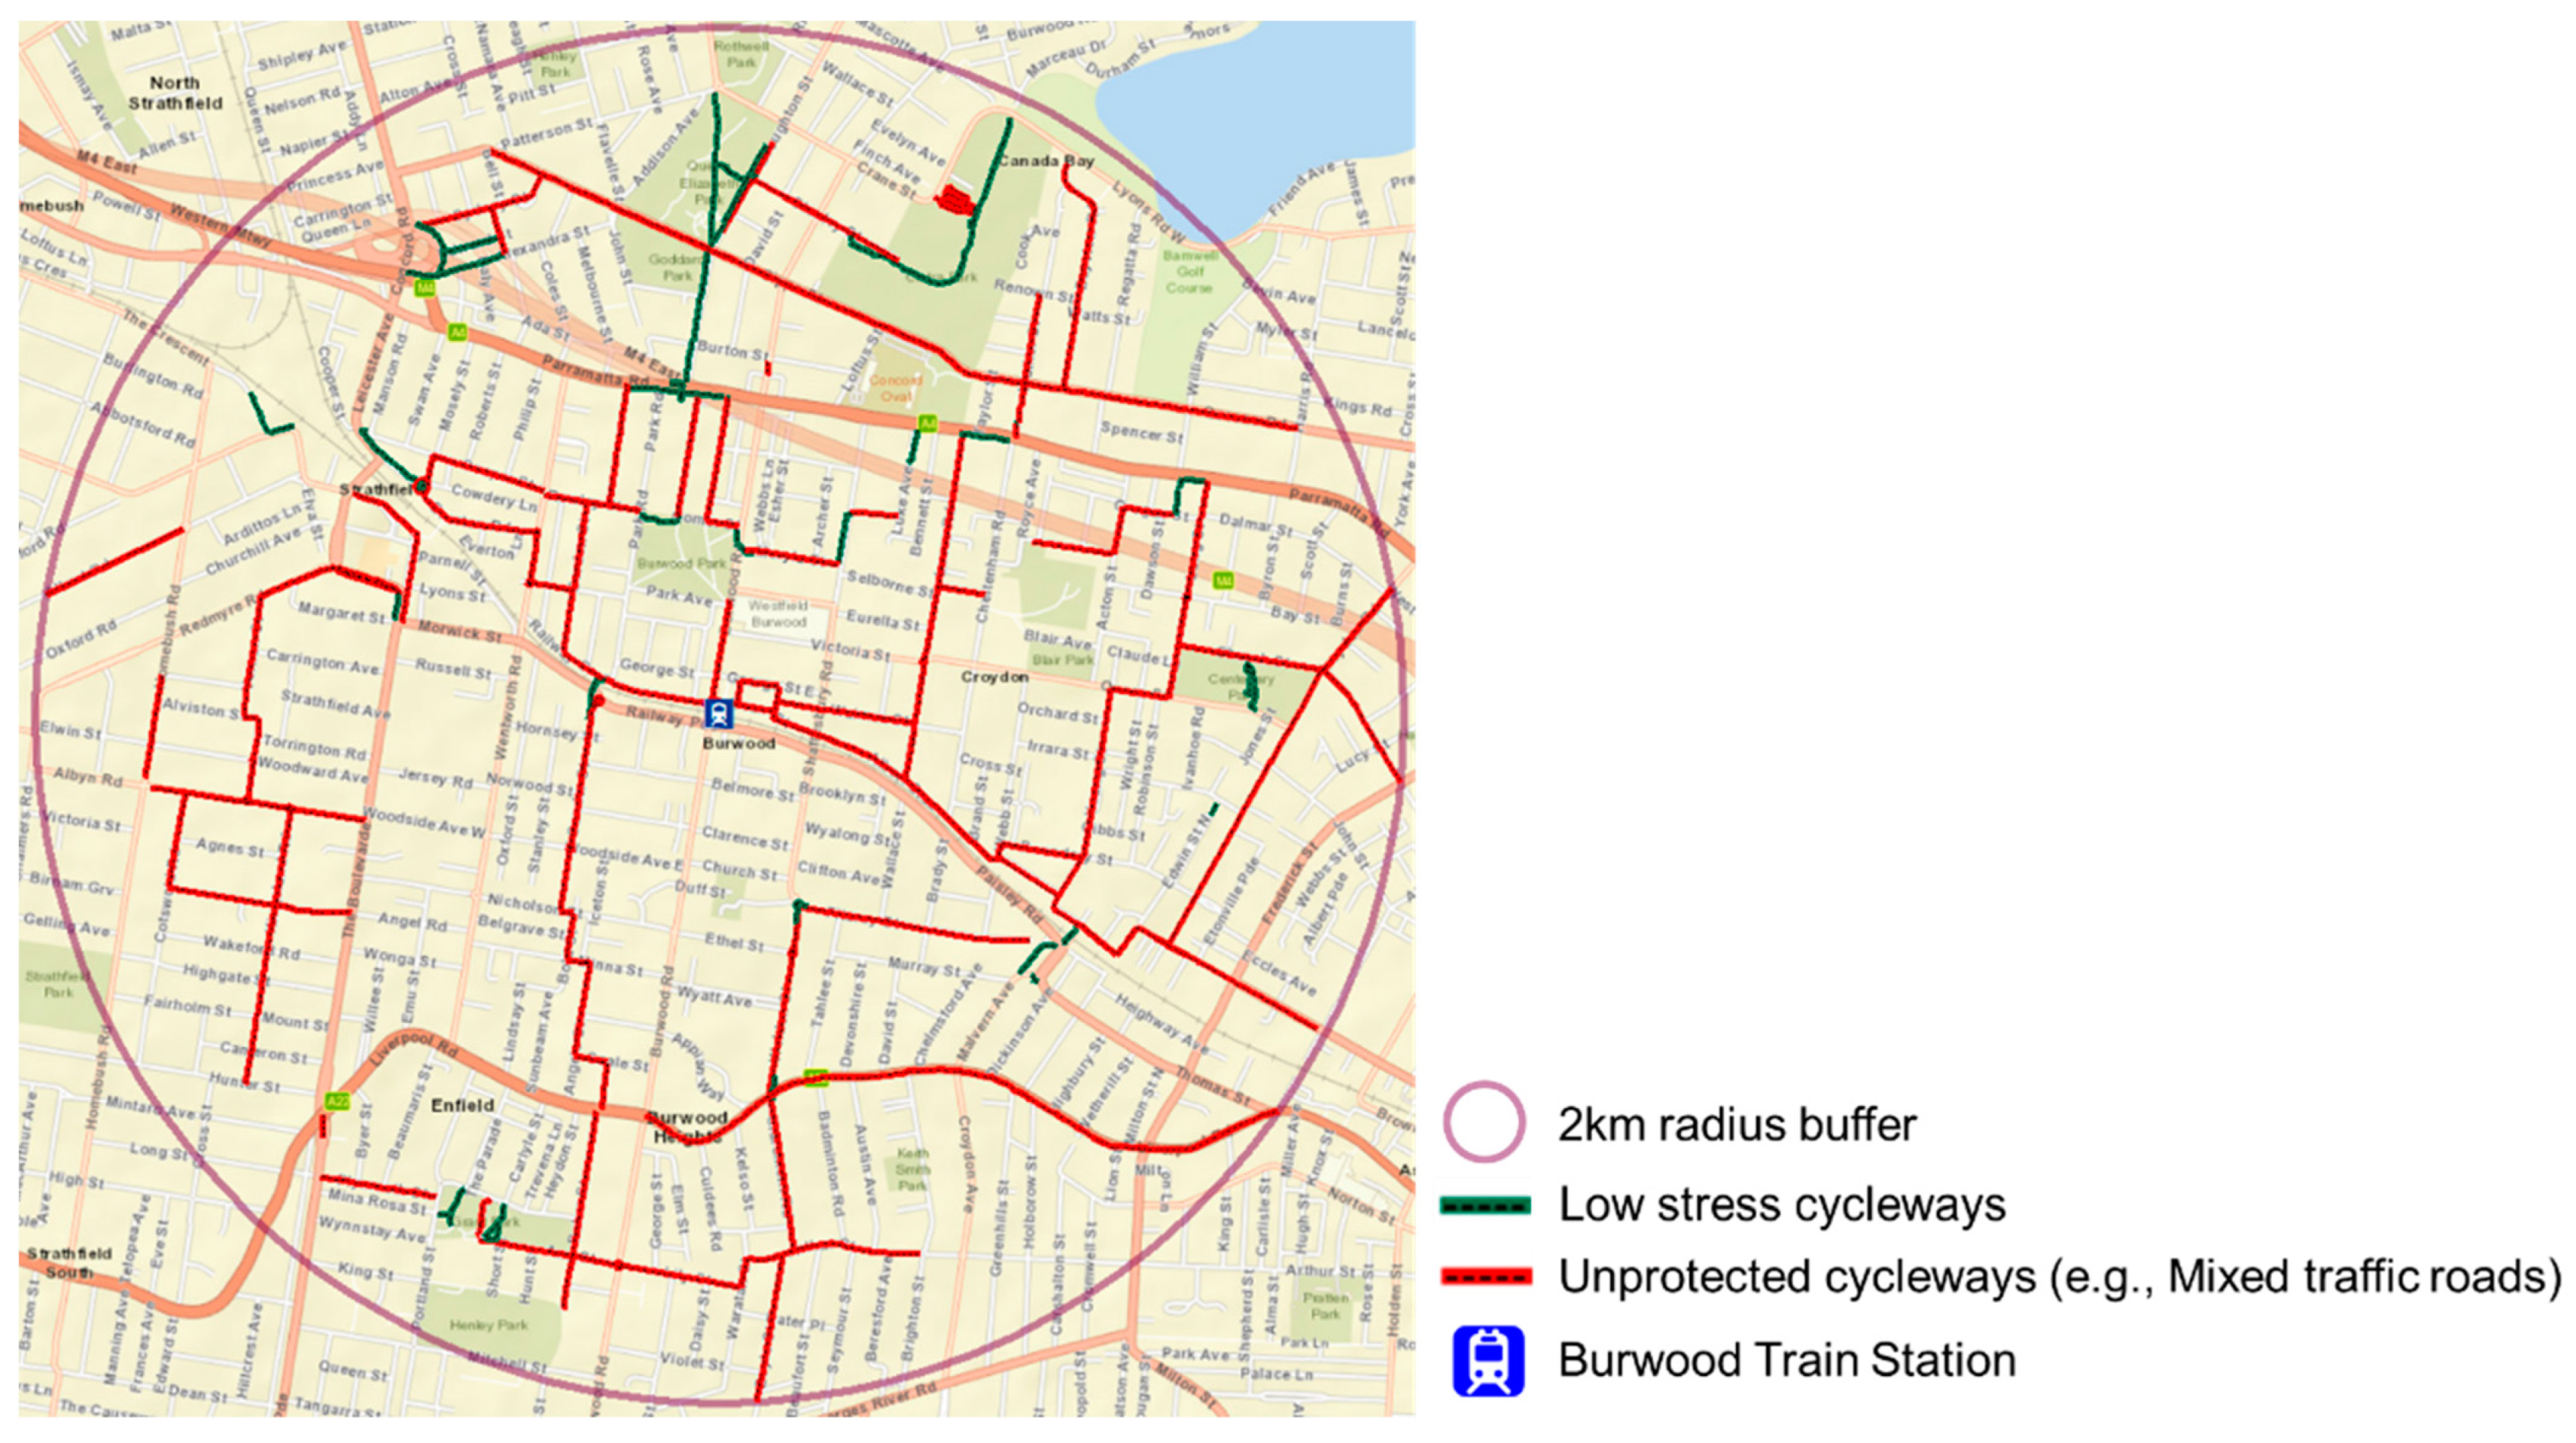
| Accessible cycling network length | d3 = length of cycling lanes (only selected types) within 2000 m boundary from the station | |
| Cycling accessibility | d4 = numbers of points of interest accessible via cycling lanes (only selected types) within 2000 m boundary from the station |
| Before Considering Cycling Factors | After Considering Cycling Factors | |
|---|---|---|
| Node | 0.258 | 0.258 |
| Place | 0.355 | 0.355 |
| Design | 0.781 | 0.547 |
Disclaimer/Publisher’s Note: The statements, opinions and data contained in all publications are solely those of the individual author(s) and contributor(s) and not of MDPI and/or the editor(s). MDPI and/or the editor(s) disclaim responsibility for any injury to people or property resulting from any ideas, methods, instructions or products referred to in the content. |
© 2023 by the authors. Licensee MDPI, Basel, Switzerland. This article is an open access article distributed under the terms and conditions of the Creative Commons Attribution (CC BY) license (https://creativecommons.org/licenses/by/4.0/).
Share and Cite
Zhang, M.; Lee, J. Make TOD More Bicycling-Friendly: An Extended Node-Place Model Incorporating a Cycling Accessibility Index. Buildings 2023, 13, 1240. https://doi.org/10.3390/buildings13051240
Zhang M, Lee J. Make TOD More Bicycling-Friendly: An Extended Node-Place Model Incorporating a Cycling Accessibility Index. Buildings. 2023; 13(5):1240. https://doi.org/10.3390/buildings13051240
Chicago/Turabian StyleZhang, Mengyuan, and Jinwoo (Brian) Lee. 2023. "Make TOD More Bicycling-Friendly: An Extended Node-Place Model Incorporating a Cycling Accessibility Index" Buildings 13, no. 5: 1240. https://doi.org/10.3390/buildings13051240