Article

The COVID-19 Sentiment and Office Markets: Evidence from China

1
Bartlett School of Sustainable Construction, University College London, 1-19 Torrington Place, London WC1E 7HB, UK
2
School of Built Environment, University of New South Wales, Sydney, NSW 2052, Australia
3
Department of City and Regional Planning, University of North Carolina at Chapel Hill, Chapel Hill, NC 27514, USA
*
Author to whom correspondence should be addressed.
Buildings 2022, 12(12), 2100; https://doi.org/10.3390/buildings12122100
Submission received: 19 October 2022 / Revised: 16 November 2022 / Accepted: 23 November 2022 / Published: 30 November 2022
(This article belongs to the Collection Cities and Infrastructure)

Abstract

:
This study examines the impact of COVID-19 sentiment on office building rents and vacancy rates in China with a COVID-19 sentiment index constructed based on Baidu search queries on COVID-19-related keywords. We analyzed the data of office buildings and economic data from 2013 Q3 to 2022 Q2 in seven major Chinese cities with a two-stage Error Correction Model framework. We found that a heightened level of COVID-19 sentiment significantly and adversely affects the Chinese office buildings market. Specifically, office building rents decrease more than 8% if a city is exposed to an increase of one unit of COVID-19 sentiment for an entire quarter. The interaction terms model further reveals that the COVID-19 sentiment has a more substantial impact on office building rents where office vacancy is higher, reflecting an asymmetric effect. The findings here support the fear sentiment hypothesis. The findings suggest that a heightened level of investors’ COVID-19 sentiment resulted in a deterioration of office rents, reinforcing the role of investors’ sentiment in the pricing of office buildings. The findings suggest that investors should consider investor sentiment, particularly COVID-19 sentiment, in their decision-making.

1. Introduction

In 2021, China’s national office building net absorption rate exceeded 7.43 million square meters with an overall office vacancy of 23%; the supply of office building space is expected to peak in 2022, exceeding 9.5 million square meters of new supplies in the pipeline (CBRE [
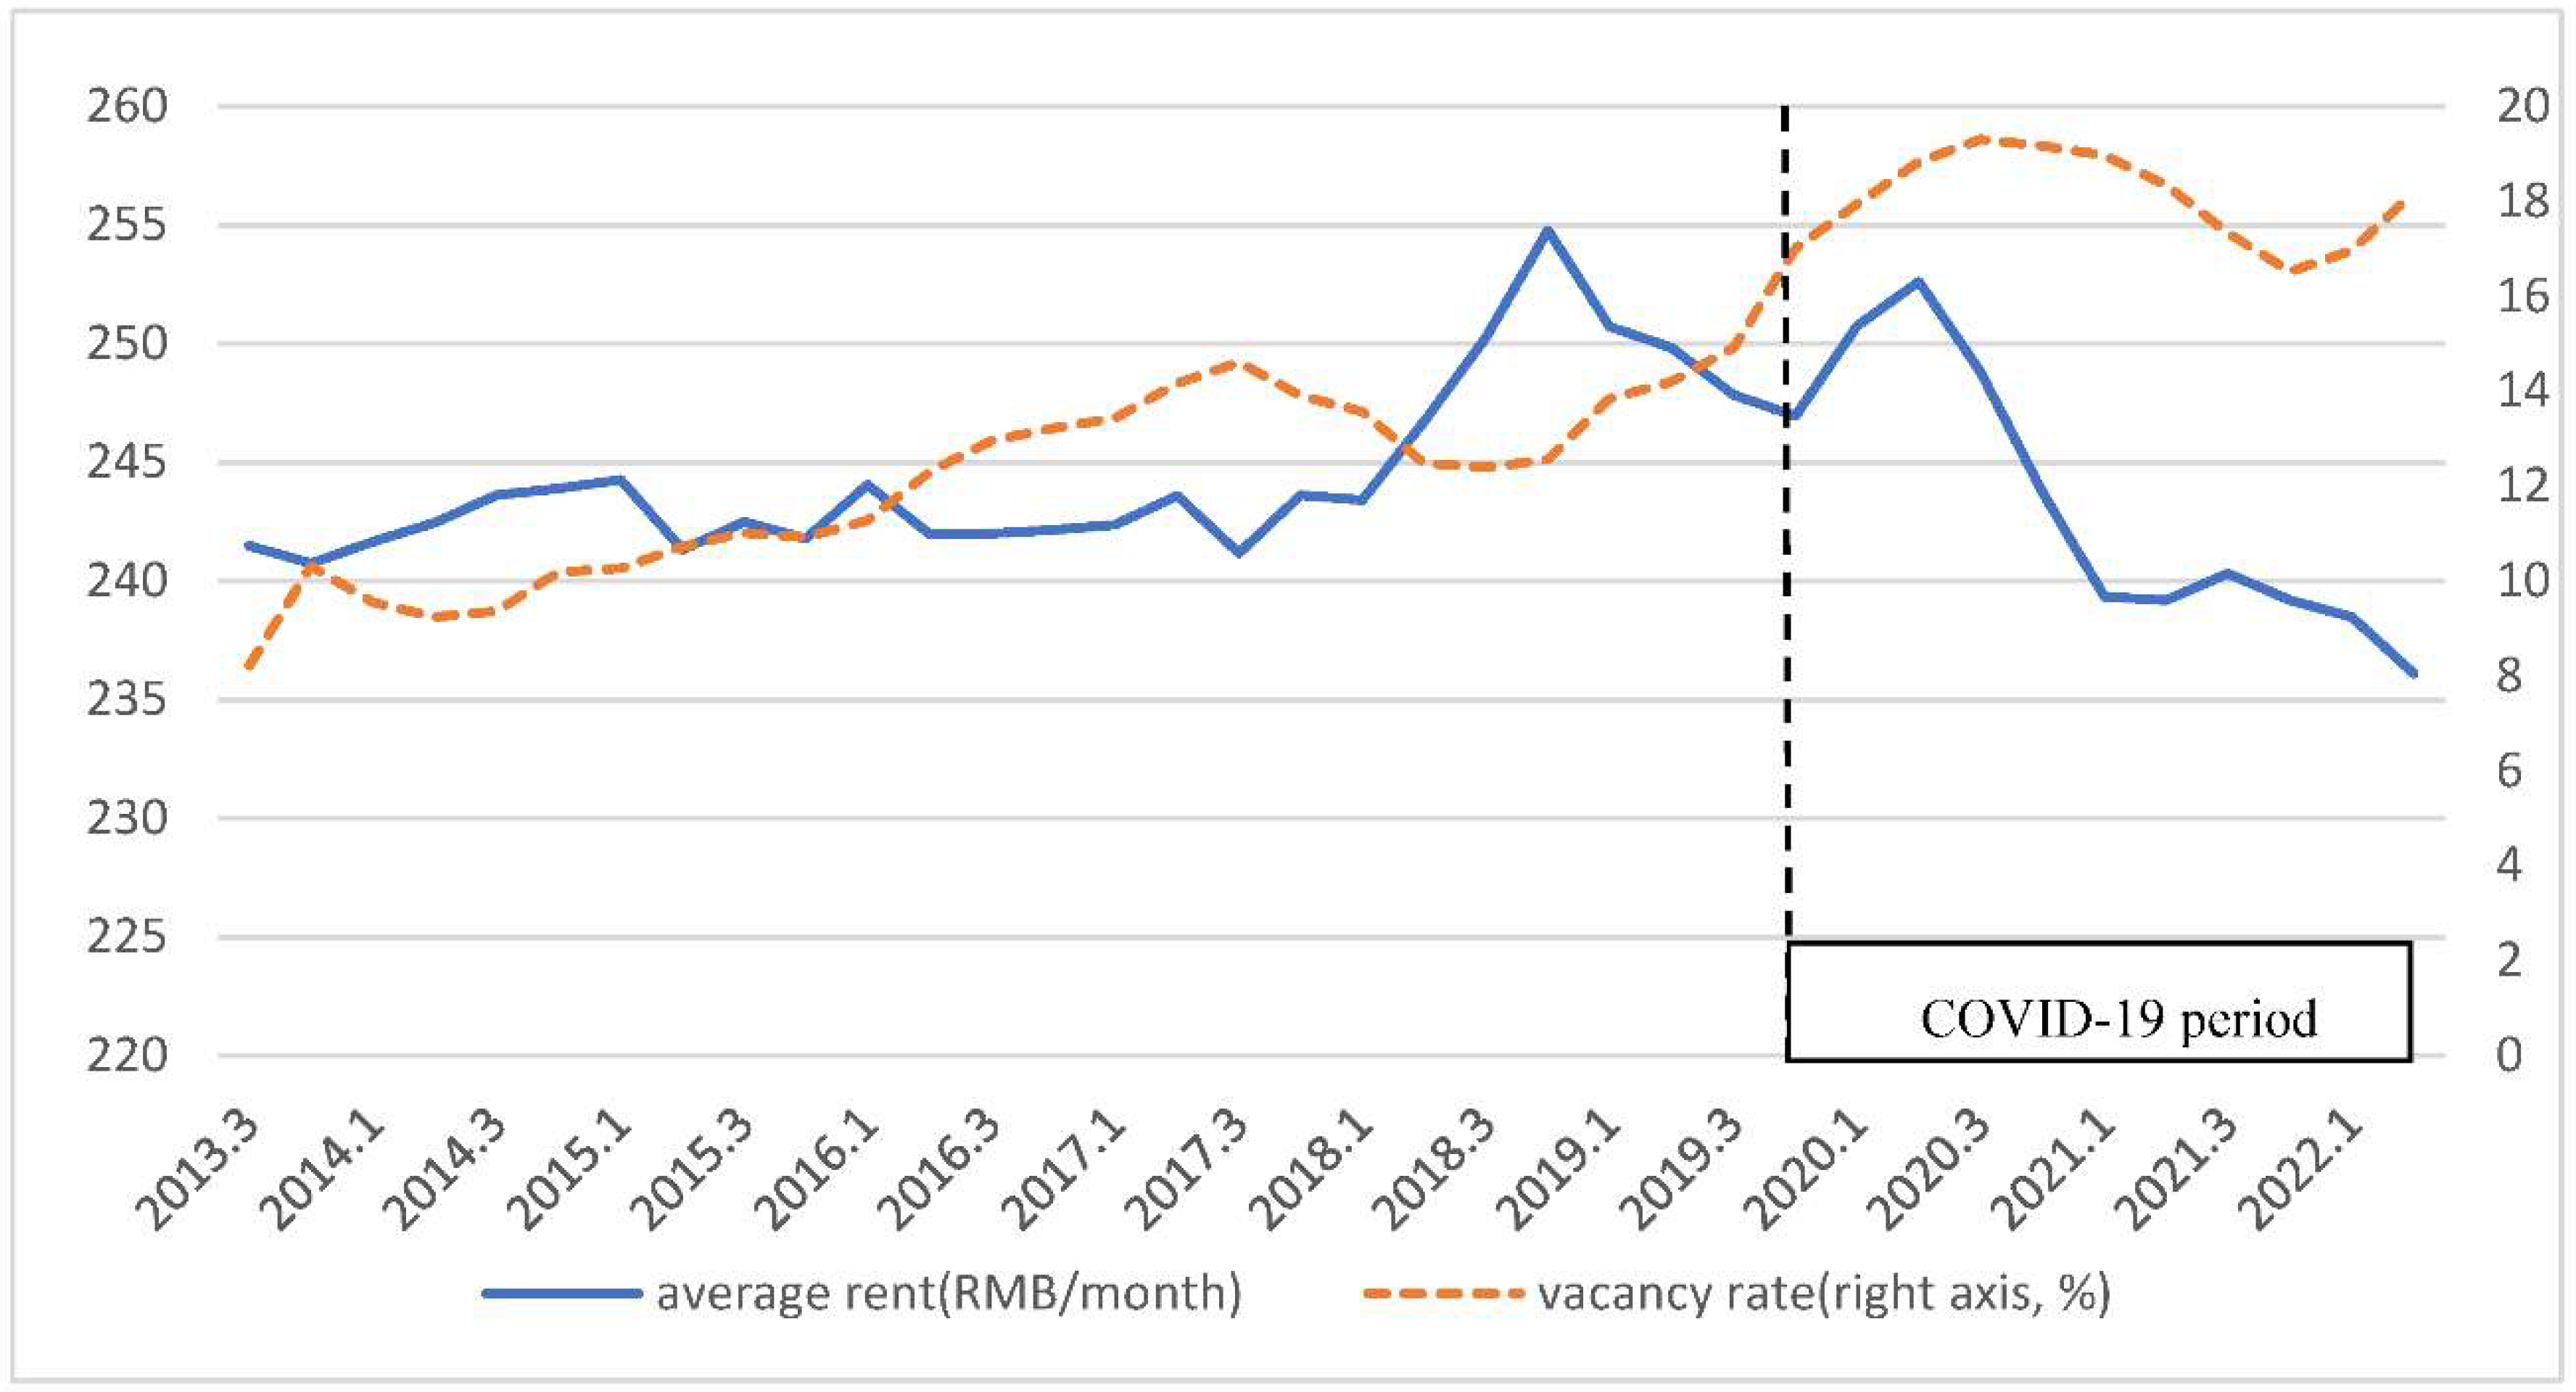
1]). The accelerating vacancy rates in the Chinese office market, particularly in first-tier and second-tier cities, have caused extensive concerns among investors and policymakers (Figure 1). To address the high vacancy rate in the Chinese office market, the Ministry of Housing and Urban-Rural Development of China implemented a new policy that encouraged local governments to convert vacant commercial real estate into rental housing in 2017 (MHURD, 2017) (https://www.mohurd.gov.cn/gongkai/fdzdgknr/tzgg/201707/20170720_232676.html, accessed on 19 October 2022). While this policy aims to support the development of rental housing, it also indicates the high office buildings market vacancy rate in recent years in China. The onset of the COVID-19 pandemic further exacerbated this issue. The recent two years have seen the lasting effect of COVID-19 on China’s economy and office market; the office rent in major cities has declined sharply, and the vacancy rate remains high.
Importantly, various governments adopted COVID suppression or COVID-Zero policies. These policies would have an impact on investors’ sentiment. Naturally, this raises the question of whether the onset of COVID-19 directly affects real estate, particularly the direct office buildings sector. Although COVID-19 sentiment has a direct influence on China’s economic growth and urban development (Wang et al. [2]), no study has been devoted to its impact on the office sector. Furthermore, COVID-19-induced work-from-home (WFH) may lead to a permanent change of structure (Davis et al. [3]). Both these two factors may result in a decline in office buildings demand and further market change. However, two competing hypotheses have been proposed in the mainstream literature on the impact of COVID-19. Chen et al. [4] asserted that COVID-19 should have a significant negative impact. This is in line with the fear sentiment hypothesis that was proposed by Da et al. [5]. On the other hand, Nayaran et al. [6] offered contradicting empirical evidence in which a positive effect is evident. They attributed this to the adoption of various governments’ stimulus policies to cushion the negative repercussions of unprecedented events such as COVID-19. Further, He et al. [7] found that the impact of COVID-19 is not uniform. Specifically, they demonstrated that COVID-19 has a divergence effect in different sectors, highlighting the importance of sectorial studies.
Nevertheless, to the best of our knowledge, no study has been dedicated to assessing the impact of sentiment regarding COVID-19 on commercial properties. The impact of COVID-19 sentiment on real estate, therefore, is somewhat under-researched. This raises the following questions: (1) Does the onset of COVID-19 have an effect on the office markets? (2) Would the effect, if any, lead to a deterioration of office rents or an improvement of office rents? This research aims to fill the research gaps by examining the influence of COVID-19 sentiment on the office market rent in China. However, one could argue that these policies were short-lived, coming to an end with the availability of vaccines. As such, the short-lived COVID suppression policies might have a negligible effect on office buildings. This is particularly true for the office sector, as direct real estate is an illiquid asset with a prolonged transaction period (Lee and Lee [8]). Unlike many countries, the Chinese property market offers a unique dataset as it has undergone a prolonged period of COVID-Zero policy. This unique dataset allows us to examine sentiment regarding COVID-19 more effectively.
This study assesses the dynamics of office market rent and rental vacancy in seven cities in China: Beijing, Shanghai, Tianjin, Shenzhen, Guangzhou, Chongqing, and Chengdu. A two-stage Error Correction Model (ECM) is utilized to determine the short-run and long-run adjustments of rents and vacancy rates. We find that a heightened level of COVID-19 sentiment has an adverse and considerable effect on the Chinese office buildings market in the long run. The findings are consistent with Chen et al. [4] for Bitcoins, for which COVID-19 fear sentiment has resulted in exacerbation of market volatility; thereby, a negative return should be documented. The finding is also in line with the notion of high investor sentiment in the behavioral finance literature (Da et al. [5]; Tetlock [9]). Further, COVID sentiment has a more substantial impact on office buildings rents where office vacancy is higher, reflecting an asymmetric effect. We also found that city-level gross domestic product (GDP) is a crucial variable determining office rent in China and an effective self-adjustment mechanism between rent and GDP growth. However, the supply market is mainly inefficient, and the high volume of office buildings in recent years and decreasing economic growth rate account for the high vacancy rates in China.
This study contributes to the buildings and real estate literature in a number of ways. Firstly, this is probably the first attempt to examine how COVID-19 sentiment would have an impact on direct real estate, particularly the office sector. Specifically, property plays a critical role in the broader economy, and it has emerged as a key element of the capital market (Lee et al. [10]). Despite extensive studies that have examined the impact of COVID-19 on the financial market, little study has been devoted to the direct real estate market. Allan et al. [11] Hoesli and Malle [12] are exceptions. Allan et al. [10] provided some preliminary results to show that the Asia–Pacific region commercial property rent declined severely in regions exposed to the OVID-19 pandemic. Unlike Allan et al. [10], we focus on COVID-19 sentiment for the first time. This provides a more complete view of investors’ sentiment as COVID-19 sentiment would be better captured by COVID-19-related keyword searches. As posited by the investors’ fear sentiment hypothesis of Chen et al. [5], sentiment itself should be the major channel to create price adjustment, if any, instead of total deaths and confirmed cases of COVID-19. This is particularly true in China as China has low number of total COVID-19 deaths and confirmed cases as a result of its COVID-Zero policy. However, Hoesli and Malle [12] provided a commentary on the shock of COVID-19 on the European market without any empirical evidence due to the short history datasets. Extending their study, the empirical evidence of COVID-19 sentiment is provided for the first time. As such, this study complements not only the property literature on COVID-19 in general but also the literature on the effect of COVID-19 on the economic and financial systems in particular. Second, using relatively recent data from the Chinese office market, we confirm that there is a relatively efficient rent adjustment process. Finally, this study contributes to the limited studies on office rent modelling during the COVID-19 era. Extensive studies have been placed on REITs modelling, but few studies have been devoted to office. This study offers an enhanced understanding of the office market performance during COVID-19.
The remainder of this paper is organized as follows. The second section contains a literature review. In the third section, we describe the data and the statistical description, and then, we introduce the method. The fourth section provides the detailed results of our analysis. In the end, a conclusion is presented.

2. Literature Review

2.1. Office Market Research

Early research on the office market focuses on identifying the key variable that drives office market rent and changes in vacancy rates. Wheaton & Torto [13] confirmed the existence of a robust vacancy rental adjustment mechanism in the office market similar to that found in housing markets. The vacancy rate was also studied explicitly in early research (Sanderson et al. [14]). In 1999, Hendershott et al. [15] adopted an equilibrium-based dynamic adjustment model to assess the office sector in London. Recently, the office markets of major world cities have been examined, including those of Dublin (McCartney [16]), and Paris (Bruneau & Cherfouh [17]), and a self-adjusting mechanism between office rent and economic growth has been proven to exist in many large cities. Office building attributes have also been proved to be important factors in determining office quality and performance (Ho et al. [18]).
The asymmetry effect in the office market has also been widely examined. Research on the London office market showed that office rental adjustment is asymmetric, as it depends both on the direction of supply and demand shocks and on the state of the office space market at the time of each shock (Hendershott et al. [15]). Chau & Wong [19] found that information asymmetry significantly influences rent equilibrium in Hong Kong; indeed, information asymmetry about the quality of real estate assets leads to slower rent adjustments in response to external shocks. Recent research proved that asymmetric adjustments exist in the Warsaw office market, as a demand shock had a stronger impact on rent when the market vacancy rate was low (Nowak et al. [20]).
Furthermore, the inflation hedge ability and capitalization rate of office buildings has also been examined in previous research ((Newell et al. [21]; Hoesli et al. [22]; van der Vlist et al. [23]). Some new concepts, such as sustainable rent for office buildings, have been developed in very recent research (Crosby et al. [24]). Numerous studies on green office buildings also show a performance premium both in value and rent (Newell et al. [25]; Onishi et al. [26]). Previous research has also examined office market returns and their determinants (Hordijk et al. [27]; Wang & Hartzell [28]); however, due to the lack of data on office building prices (unlike residential properties, office buildings are less frequently transacted. This also highlights the importance of a dedicated study on office buildings), we will only examine office rent and vacancy rate determinants in this paper. Despite extensive studies of the office sector (An et al. [29]; Lee et al. [30]; Crosby et al. [23]; Khan et al. [31]) and housing markets [32,33] internationally, empirical research on Chinese office buildings has been relatively lacking, in part due to its short history as China only adopted its “open door” policy in the late 1970s (Hui et al. [34]; Zhang et al. [35]). Early research examined Shanghai office rent equilibrium and the related submarkets (Ke & White [36]; White & Ke [37]), and a comparison study was conducted for the Beijing and Shanghai office markets (Ke & White [38]). Recently, research has focused on market maturity (Ke & Sieracki [39]) and retail rent (Ke & Wang [40]) in China. However, the vacancy rate and rent dynamic mechanism of China’s office market in recent years are still somewhat under-researched despite investors and policymakers urgently need to gain knowledge on the developments of this market, especially in a post-COVID-19 environment.

2.2. COVID-19 and Real Estate Markets

When it comes to COVID-19 influence on real estate, Ling et al. [41] found commercial real estate (CRE) portfolios see a significantly abnormal return decrease when their assets are exposed to COVID-19 cases. Milcheva [42] found real estate equity performance is primarily affected by COVID-19, while the most affected sectors in the US are retail and hotels, and it has a stronger effect on the Asian office sector. Rosenthal et al. [43] found commercial real estate rent is decreasing in city centers while it is rising in the suburbs, and the effect of COVID on real estate market in “transit cities” relies heavily on subway and light rail. Gupta et al. [44] found COVID-19 brought a flattening of the bid–rent curve across US metropolitan areas, especially in areas where work-from-home is more prevalent. Research also shows that the preference for low density community is rising, which has been both proved in US and China housing markets (D’Lima et al. [45]; Liu& Su [46]).
The influence of COVID-19 on the office market has also been examined by Hoesli and Malle [10]. They found retail and hospitality properties and office buildings had been largely affected by COVID-19, while the residential and industrial sectors have been less affected. In China, COVID-19 has been proven to have a significant influence on the stock market (Liu et al. [47]) and housing market (Huang et al. [48]), while its impact on the office market is still unknown. Since office buildings are not as easily and frequently traded as housing, it is very difficult to capture the impact of COVID-19 on the capital value of office buildings. Therefore, a study of its influence on office rent is required.

2.3. Hypotheses Development

Although the mainstream literature has shown that COVID-19, an unprecedent event, would have an impact of asset pricing, there is no consensus on how COVID-19 affects asset pricing. Furthermore, recent research shows COVID-19 influence on real estate equity varies from countries (Milcheva [40]; Shen et al. [49]). Recent research of Li & Wan [50] argues that there is no significant evidence on the spatial impact of remote working, as the share of remote working in Beijing appears low after about one-year of recovery. It is not clear if COVID-19 has a huge influence on the office market in China. Therefore, two competing hypotheses in the literature have been discussed.
As discussed by the fear sentiment hypothesis of Da et al. [5], the unprecedent events would increase the level of fear among investors. Importantly, the COVID-19 fear sentiment is expected to result in exacerbation of market volatility; thereby, negative repercussions on the market are expected (Chen et al. [4]). Therefore, this is reasonable to posit the following hypothesis:
Hypothesis 1: 
The onset of the COVID-19 pandemic has a negative impact on the office markets.
The hypothesis one is formulated based on the assumption that COVID-19 might have negative influence on economic and induce a decline in office demand. However, the Chinese government is committed to its COVID-Zero policy, which might minimize the effect of COVID-19 on the property market, particularly in the early stage of the pandemic. Further, the Chinese government has implemented a series of policies to weaken the impact of COVID-19 on the economy, apart from its general policy of creating a COVID-Zero environment. For instance, the central Chinese government has raised RMB3.65 trillion (or US $547.5 billion) to boost infrastructure development for 2022. Further, the package also urged local governments to boost infrastructure spending via the issuance of special-purpose bonds (SPBs) (SouthChinaMorningPost [51]. It also had some direct property-based policy. For example, The State Council of the People’s Republic of China implement a new policy to promote the implementation of rent reduction or exemption policies for micro- and small-sized enterprises and individual industrial and commercial households in the service industry (State Council, 2022 [52] http://www.gov.cn/zhengce/zhengceku/2022-10/12/content_5717962.htm, accessed on 19 October 2022). These policies may help reduce the adverse influence of COVID-19 on the office market. In fact, these polices might lead to some stabilization to the market. This is in line with the argument of Phan and Narayan [53]. As such, an alternative hypothesis is formulated:
Hypothesis 2: 
The onset of the COVID-19 pandemic leads to a stabilization effect on the office markets.
A test of these two competing hypotheses would allow us to have a greater under-standing of how COVID-19 affects the office real estate market. In addition, this also contributes to the debate on whether these unprecedent events would have a positive or negative impact on the asset pricing.

3. Data and Methodology

3.1. Data

The data from the seven examined Chinese cities used in this paper consist of three parts, their details are in Table 1. The quarterly office data (A-class office from 2013 Q1 to 2022 Q2) are from Savills China (https://en.savills.com.cn, accessed on 15 August 2022). The office data include three variables: office rent, vacancy rate and total stock in each period. The seasonal GDP of the seven cities is obtained from the National Bureau of Statistics of China (http://www.stats.gov.cn/english/, accessed on 19 October 2022), stock price and risk-free rate in robust test analysis are from Investing.com (https://uk.investing.com/, accessed on 19 October 2022). We also analyzed the influence of COVID-19 sentiment on housing rent in the same city and research period as comparison; the housing rent and price index are from Centaline Property (http://ccdata.com.cn, accessed on 19 October 2022). These cities are categorized into tier 1 cities (Beijing, Shanghai, Guangzhou and Shenzhen) and tier two cities (Tianjin, Chengdu and Chongqing). (By recognizing the presence of property submarkets, these seven cities are further classified based on the levels of GDP and population. This allows us to shed more light on the impact of COVID-19 sentiment on the office sector. https://en.wikipedia.org/wiki/Chinese_city_tier_system, accessed on 19 October 2022.) Tier 1 cities have a higher GDP and population scale than second-tier cities. These first-tier cities also have higher office rent and lower vacancy rates than tier 2 cities over the study period.
The COVID-19 sentiment index was constructed based on the Baidu Search Index (https://index.baidu.com/, accessed on 19 October 2022), a similar method of COVID-19 sentiment construction has been applied by previous research (Wan, et al. [54]). We collected the weekly search times of this special vocabulary in Chinese “City Name + epidemic” from January 2020 to June 2022. If the epidemic search in each city was higher than its average value during the whole research period (Figure 2), we defined the COVID-19 sentiment exposure index as 1, otherwise 0. Thereafter, we converted the weekly COVID-19 exposure index into a seasonal index, taking the average value. Figure 2 shows that these seven cities recorded a huge COVID-19 exposure increase in January 2022, when Beijing reported its first locally transmitted Omicron variant case (https://www.theguardian.com/world/2022/jan/15/beijing-reports-first-its-locally-transmitted-omicron-variant-case, accessed on 19 October 2022).
The summary statistics of all variables used in this research are in Table 2. We calculate each city’s annual rent growth and average vacancy rates from 2013 Q3 to 2022 Q2; the results are shown in Table 3. Beijing and Shanghai have relative high office rent growth and lower vacancy rate than other cities, and second-tier cities with high office supply, such as Chongqing and Tianjin, have the highest vacancy rate.

3.2. Methodology

This study applies a two-stage error correction model (ECM) to model the dynamics of rents and vacancy rates over the long and short run, which consists of two parts, the office rent long term determinants model and the short-term adjustment model. In the long-term model, office rent is determined by key demand and supply factors, which are economic growth (measured by GDP) and office space supply (measured by total office stock). However, real office rent is not always equal to equilibrium rent (estimated by the long-term rent model); office building contracts usually get a term for fixed rent (Baum & Hartzell [55]). The gap between equilibrium rent and real rent is considered the rent gap, measured by the error term in the long-term model. The idea of an ECM model is to put the lagged value of the rent gap into the office rent short-term adjust model, if the previous period office rent is too high compared with the economic fundamentals, the office rent increase in the next period should be lower (with a negative coefficient statics significant), so the actual office rent will be too far from the equilibrium level. We are using the ECM model to examine COVID-19 sentiment regarding office rent as ECM is a reliable method to model the office market and was widely used in previous research, with minimum potential error when building the model for office rent. Specifically, we added COVID-19 sentiment into our model, which is relatively new in office market research.
Following previous research on the office markets in London and Hong Kong, the demand for office space can be expressed with the following Cobb-Douglas function:
D R ,   E = λ 0 R λ r   E λ e
where R denotes office rent and E is the demand variable, GDP was used as a demand indicator, it allows us to control the economy expansion (or contraction) of a city. Then, we obtain the following:
D R * ,   E = 1 v * S
where S is the total stock of office space. R * and v * are the long-run equilibrium real rent and vacancy rates, respectively. Corresponding historical data of R and E were used to assess the following equation:
l n R t = α 0 + β 1 l n G D P t + β 2 l n S t o c k t + β 3 V a c a n c y t + β 4 C O V I D t +   δ i + ε t
where the l n R t , l n G D P t and l n S t o c k t are the natural logarithm of office rent, gross domestic product (GDP) and office building stock, separately. C O V I D t is a city-level COVID-19 exposure index based on the Baidu Search Index (details on this are explained in the previous section), which is a measure of COVID-19 sentiment, which proved to have huge influence on finance market (Narayan et al. [6]). Following Chen et al. [4], the sentiment hypothesis is in line with the behavioral finance literature, and it is hypothesized that a negative and significant coefficient is documented as fear sentiment would have an adverse impact. δ i is the variable for the city fixed effect, whilst ε t is the error term, the same meaning in the following equations.
We also add a cross term of vacancy and COVID-19 sentiment (COVID-19 exposure index) in the model 3 to identify the moderating effect of vacancy rate on the interaction between COVID-19 and rent, and β 9 is the variable of interest.
l n R t = α 1 + β 5 l n G D P t + β 6 l n S t o c k t + β 7 V a c a n c y t + β 8 C O V I D t + β 9 C O V I D t * V a c a n c y t +   δ i + ε 2 t
We define the estimated value of ε t as the ECM variable, representing the gap between actual rent and equilibrium rent. Thus, the adjusted model for rent, over the short run, is as follows:
Δ l n R t = α 2 + β 10 Δ l n G D P t + β 11 Δ l n S t o c k t + β 12 Δ V a c a n c y t + β 13 Δ C O V I D t + β 14 E C M t 1 +   δ i + γ 1 t
β 14 is the variable of interest. An effective self-adjustment mechanism exists if β 14 is between 0 and −1 and statistically significant. γ t is the error term. We also put “𝐶𝑂𝑉𝐼𝐷𝑡 ∗ 𝑉𝑎𝑐𝑎𝑛𝑐𝑦𝑡” in this formula in our early analysis.
We assume that vacancy rate changes are influenced by both the vacancy rate during the previous period and the rent adjustment process:
Δ V a c a n c y t = α 3 + β 15 V a c a n c y t 1 + β 16 Δ l n G D P t + β 17 Δ l n S t o c k t + β 18 Δ C O V I D t + β 19 E C M t 1 +   δ i + γ 2 t
We assume that the new supply is influenced by the market conditions in the previous period, which are determined by both the vacancy rate and the rent gap (ECM) during the previous period. Therefore, we estimate the following equation:
Δ l n S t o c k t = α 4 + β 20 V a c a n c y t 1 + β 21 E C M t 1 +   δ i + γ 3 t
Finally, to compare the influence of COVID-19 sentiment on other real estate rent, we estimate using the following model:
l n H o u s i n g   R e n t t = α 5 + β 22 l n G D P t + β 23 Δ l n H o u i s n g   P r c e t + β 24 C O V I D t +   δ i + ε 3 t
where l n H o u s i n g   R e n t t is the natural logarithm of housing rent in each city. Following the previous research on housing rent analysis, we put the housing price increase rate in our housing rent model to control the housing price movement on rent dynamics (Engsted et al. [56]). β 24 is the variable of interest, as we want to know if COVID-19 sentiment has a similar influence on housing rent and office building rent.

4. Results and Discussion

4.1. Rent Long-Term Determinants and Short-Term Adjustment

The long-term determinants of the office rent model in seven cities are estimated using Equations (3) and (4). Detailed results are given in Table 4. The adjusted R-squared values of the equations are relatively high in our all-cities data analysis, as more samples are available for our analysis of all office buildings. The rent determinants of office buildings are very comparable in all cities. Specifically, city-level GDP is the crucial variable that determines rent growth, which complies with previous research on US and European office markets (Broumen & Jennen [57,58]). We also find that vacancy rate and stock increase have a more substantial effect on office rents in tier 1 cities than in tier 2 cities, which has not been examined by previous research.
The COVID term coefficient in column 1 of Table 4 shows office rent decreases by more than 8% if one city is exposed to a heightened COVID-19 sentiment for an entire quarter. Results suggest that COVID-19 fear sentiment due to increased search interest in COVID-19 has weakened office rent. The findings are consistent with those of Chen et al. [4], according to which COVID-19 fear sentiment has resulted in exacerbation of market volatility; thereby, a negative return should be documented. The finding is also in line with the notion of high investor sentiment in the behavioral finance literature (Da et al. [5]; Tetlock [9]).
Further, the COVID-19 effect on the office sector was not uniform in that more substantial price correction was documented in tier 2 cities compared with tier 1 cities. Results here are intuitively appealing as tier 2 cities have a much higher average vacancy rate (32.95%) compared to tier 1 cities (11.14%). The interaction terms model (columns 4 to 6) further confirms that COVID-19 sentiment substantially impacts office rent where office vacancy is higher, reflecting an asymmetric effect. The asymmetric effect of COVID-19 sentiment is consistent with the finding of Qian et al. [59] who found an asymmetric effect of COVID-19 on housing prices.
Table 5 columns 1 to 3 report the result of the office rent short-term to adjust the model in Equation (5). We use the residual of Equation (3) as an ECM term and add its lagged value into the office rent short-term adjust model. The coefficient of lagged ECM term ranges from −0.079 to −0.122, and the coefficient of ECM (−1) is statistically significant at least the 5% level. It means that if actual office rent is higher than its long-run equilibrium level, office rent will decrease in the next period, showing an effective self-adjustment mechanism between rent and market fundamentals. We also put “𝐶𝑂𝑉𝐼𝐷𝑡 ∗ 𝑉𝑎𝑐𝑎𝑛𝑐𝑦𝑡” in this formula in our early analysis (the results are reported in Table 5 columns 4 to 6), but it did not improve our explanation of ΔlnR, the results are fairly consistent with the finding of Equation (5).
The use of ECM allows us to gauge whether the impact of COVID-19 has a long-lasting effect on commercial properties or if its impact, if any, is transitory. In Equation (3), β 4 identified the influence of COVID-19 sentiment on office rent in the long run. It indicates how much office rent will change if COVID-19 sentiment increases.
While in Equation (5), β 13 identified the influence of COVID-19 sentiment on office rent in the short term. The coefficient of this variable is negative, suggesting that COVID-19 sentiment has an adverse impact on office rents in China. However, this does not do so to a statistically significant extent, reflecting that COVID-19 sentiment provides a weak explanation of the office rent movement in a short run. This also highlights that COVID-19 sentiment has a long-lasting effect on office rents, although it has a weak explanatory power regarding short-term rent movements. Divergence results between long run and short run have also been documented by Hoesli et al. [24] and Al-Masum and Lee [60].

4.2. Vacancy Rate Changes, Supply Analysis

Equations (6) and (7) assess whether office rent dynamics influence vacancy rates and office stock changes to offer a fuller understanding of the dynamics of the Chinese office sector. β 19 and β 21 are the key variables to observe. Detailed results are reported in Table 5 and Table 6.
Table 6 shows that the previous period value negatively influences vacancy rate changes in most office markets. While new supply increases significantly increase the vacancy rate, the stock increase greatly influences the vacancy rate, especially in tier2 cities. In Table 5, column 1, one lag value of the ECM term (the gap between actual office rent and its equilibrium value) is 0.051 and is statistically significant at the 5% level; it shows that if previous office rent is too high from market fundamentals, vacancy rate tends to increase.
Table 7 shows that both the previous period value and rent have a positive influence on stock changes. It means office stock is not reacting properly to vacancy rate, especially in tier 1 cities. Results here are different from the findings of Chau and Wong based on the Hong Kong office market, indicating the inefficiency of the China office supply market. In tier 2 cities, the stock increase effectively reacts to the high office rent gap, suggesting a high electricity supply in office buildings. It also explains why tier 2 cities get a relatively higher supply and vacancy rate than tier 1 cities.

4.3. Robust Test and Further Analysis

To ensure the robustness of our baseline results, several robustness checks were undertaken. Firstly, we replaced GDP with stock price (Shanghai Index, SSEC) and risk-free rate. Both variables have been seen as key variables to capture macroeconomic activities (Hoesli et al. [12]; Lee et al. [61]). Equity price was selected as previous research has proved a close connection between stock market dynamic and real estate performance in China (Liu & Su [62], Qian et al. [59]). Previous research also showed the risk-free rate has a significant influence on real estate rent (Lai & Van Order [63], Campbell et al. [64]). The results are reported in Table 8. The results are fairly consistent with the baseline results in which the findings showed that COVID-19 sentiment has a significant negative impact on office rent. Further, a stronger COVID-19 impact is evident in cities with a higher office vacancy rate. This confirms the robustness of our baseline results.
Then, we estimate Equation (8) to assess whether housing rent is influenced by COVID-19 sentiment. The results are reported in Table 9. The COVID term coefficient in Table 9, column 1, shows housing rent decreases by 7.7% if one city is exposed to heightened COVID-19 sentiment for an entire quarter. The results are very similar in amount to its influence on office rent. However, its influence on housing rent in second tier cities is much higher (housing rent decreases about 13% if a tier 2 city is exposed to COVID-19). These findings are very close to our office rent model result in Table 3. Results here confirmed that the COVID-19 pandemic has a significant impact on the property market.

5. Conclusions

This paper applies a two-stage ECM framework to assess the impact of COVID-19 sentiment on the long-run and short-run dynamics of office rents and vacancy rates in seven major cities in China. We also constructed a COVID-19 sentiment index using Baidu search queries on coronavirus-related words and further examined its influence on office rent and the vacancy rate.
Numerous key findings have been identified. COVID-19 sentiment emerges as a key determinant of the office market. Office rent decreased more than 8% by COVID-19 fear sentiment as a result of an increase in search interest in COVID-19 keywords for an entire quarter, and it has a more decisive influence on the office market in tier 2 cities than in tier 1 cities. The interaction terms model further confirms that COVID sentiment substantially impacts office rent where office vacancy is higher (tier 2 cities), suggesting an asymmetric effect exists. The findings support the assertion of Chen et al. [
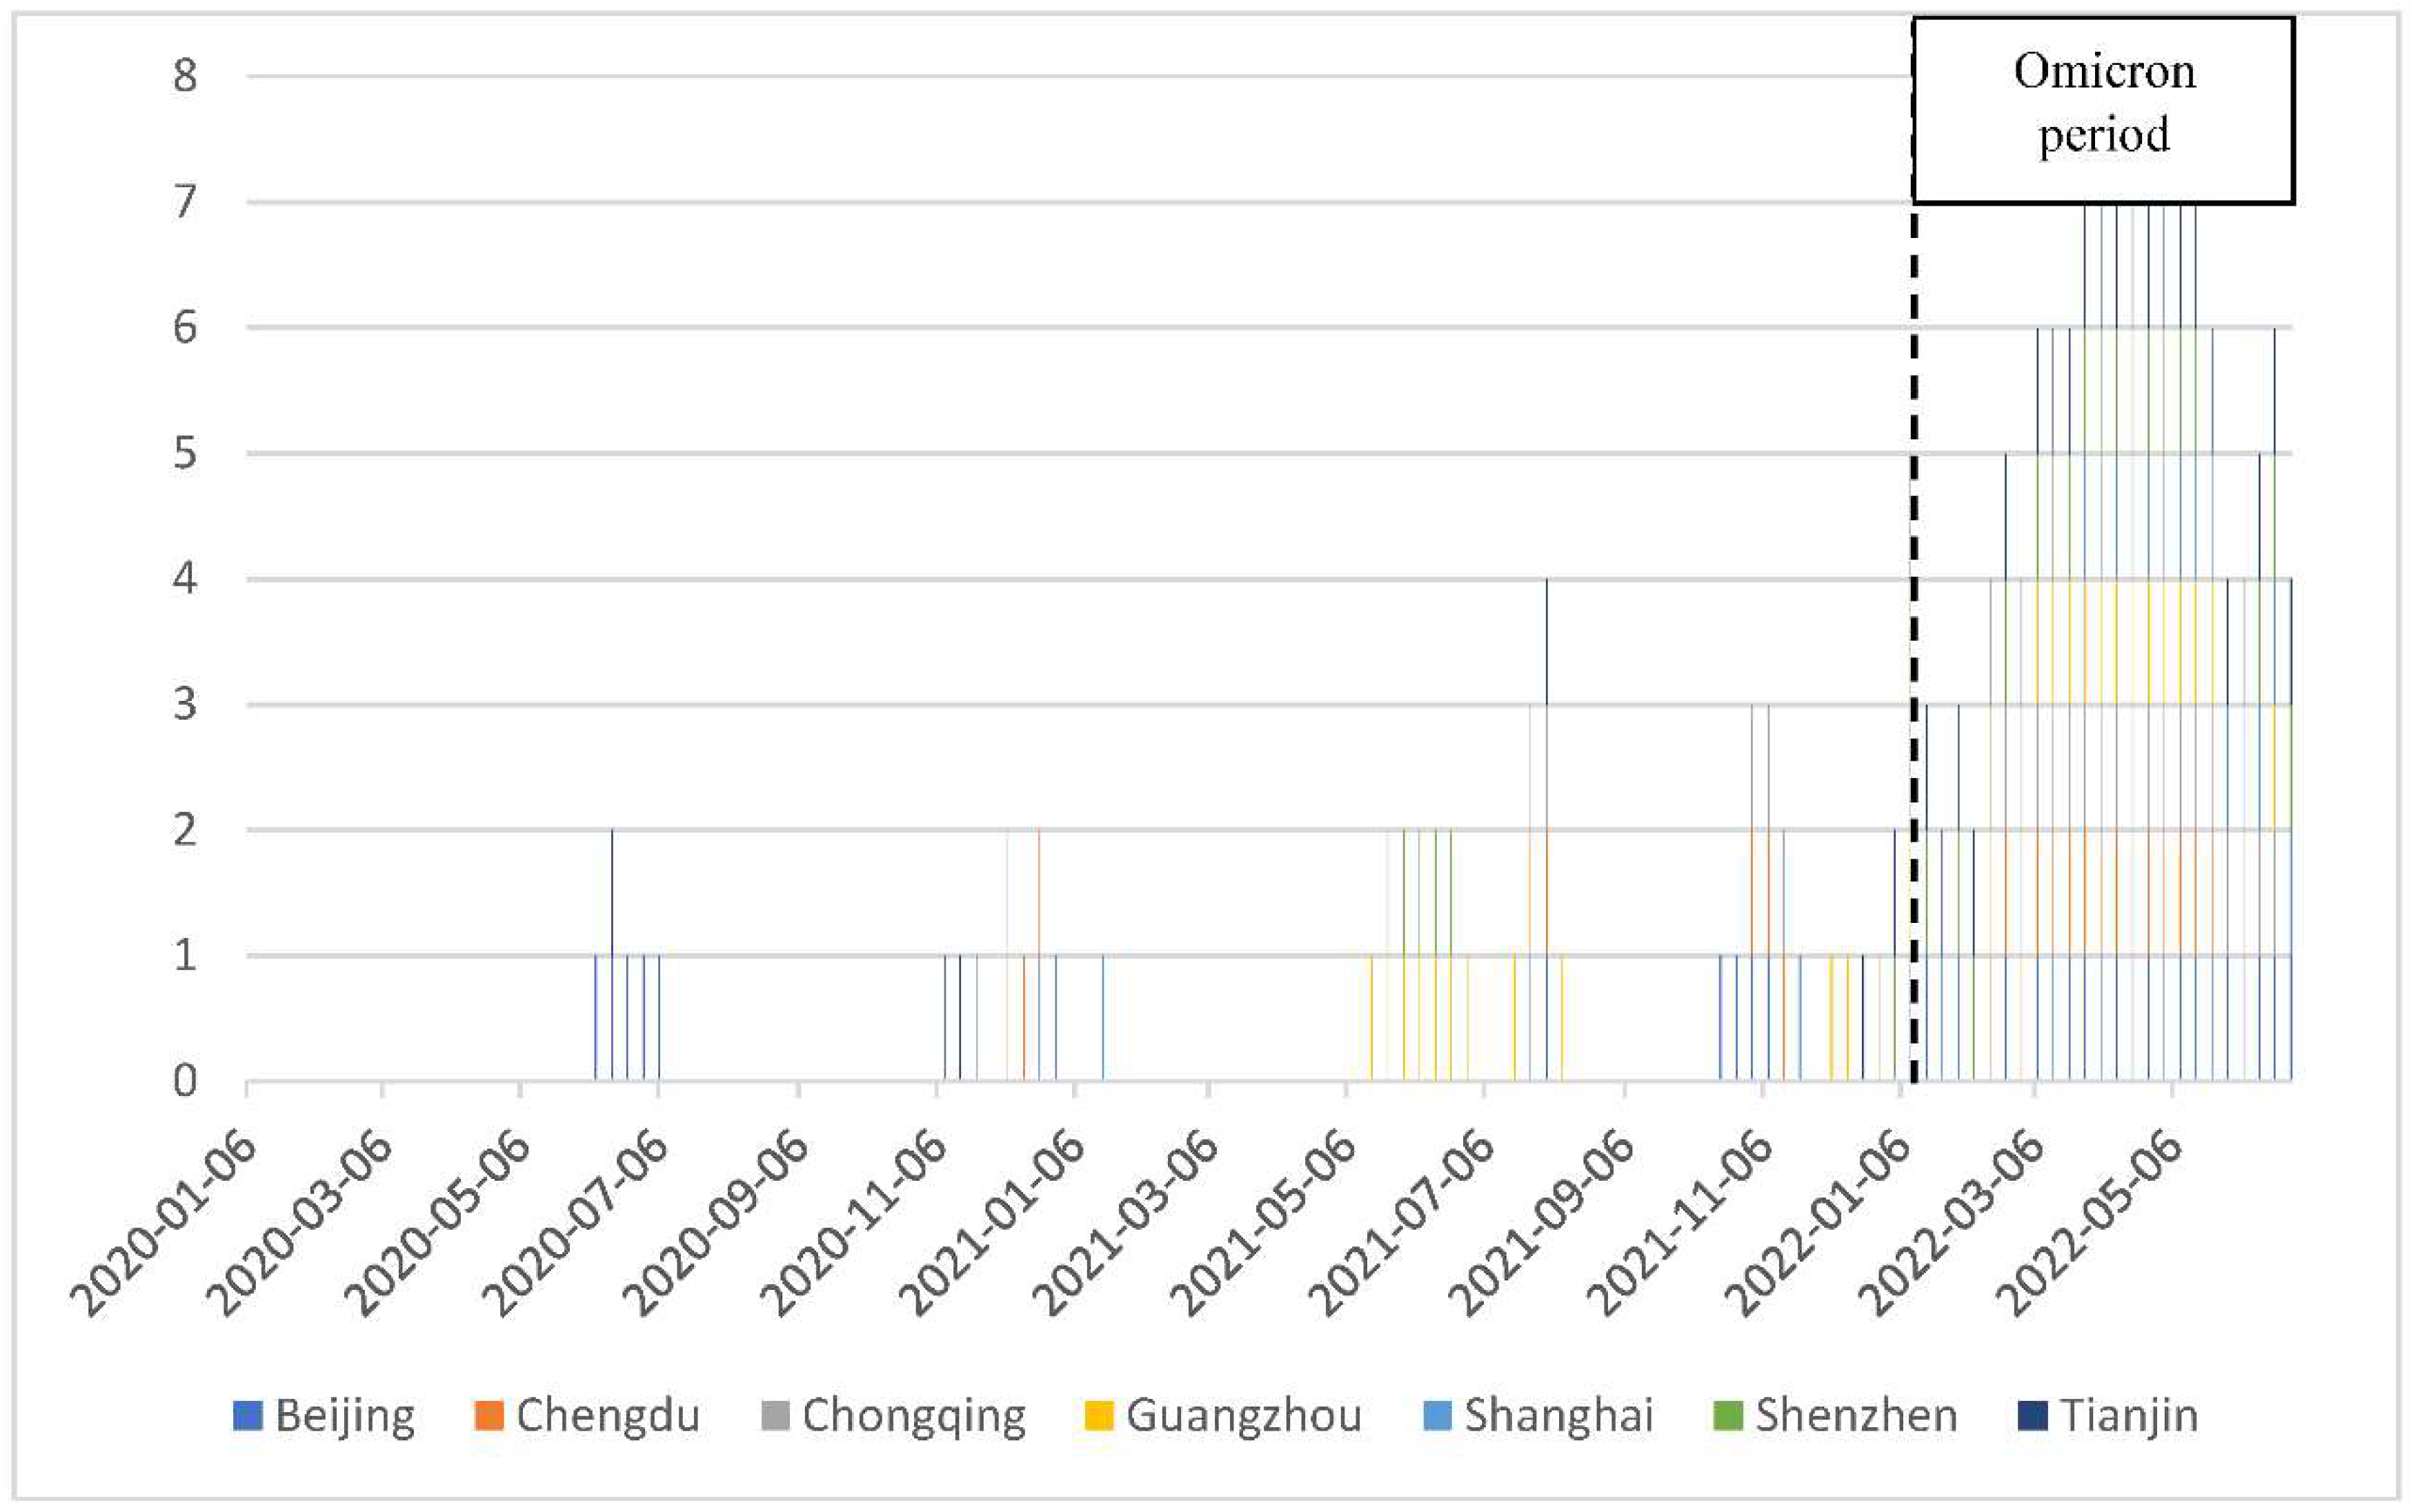
4] that fear sentiment leads to hostile asset prices, thereby creating a softening office building market. Specifically, this study offers a fuller understanding of COVID-19 sentiment’s influence on the office sector, particularly in China. The study confirmed that COVID-19 sentiment does have a significant influence on property market performance. This also shows that COVID-19 may have a significant negative influence on the office market, especially after Omicron started to spread across the country in 2022.
These findings have some profound implications for investors’ investment strategies. The finding suggests that investors should monitor the COVID-19 sentiment in their decision-making. Notably, the constructed COVID-19 exposure index offers a piece of important information to investors that should be considered. Furthermore, investors should also acknowledge the presence of submarkets and asymmetric effects as second-tier cities with higher vacancy rates are more sensitive to the movements prompted by COVID-19 sentiment. Although our study highlights the importance of considering COVID-19 sentiment in determining the rent of office buildings, it is still unclear whether the potential change of new ways of work (such as work-from-home) would alter our findings. Further research should be conducted to ascertain this.
Our findings here also support the fear sentiment hypothesis of Da et al. [5], and we proved that sentiment also plays an important role in explaining property performance, as it does in the finance market. Finally, we suggested that further research could examine the long-term effect of COVID-19-induced change (such as work-from-home) on the property market. Further, micro-level buildings’ attributes and performance data can be applied to identify the influence of COVID-19 on the property market at a disaggregated level. Specifically, the disaggregated studies offer further insights into property market dynamics (Bangura and Lee [65] and Dunse and Jones [66]). Our study focuses on COVID-19 sentiment, but the influence of sentiment on other topics, such as climate change, can be further examined in the post-COVID period.

Author Contributions

Conceptualization, S.W. and C.L.L.; methodology, S.W. and Y.S.; formal analysis, S.W. and C.L.L.; data curation, S.W.; writing—original draft preparation, S.W., C.L.L.; writing—review and editing, C.L.L.; supervision, Y.S. and C.L.L.; project administration, C.L.L. All authors have read and agreed to the published version of the manuscript.

Funding

This research received no external funding.

Data Availability Statement

Not applicable.

Acknowledgments

The early version of this paper was presented at the 2021 Virtual Joint Real Estate Conference by ARES, GCREC and AREUEA in July 2021. The first author thanks Peng Chien-Wen at National Taipei University for his comments and advice, the usual disclaimer applies.

Conflicts of Interest

The authors declare no conflict of interest.

References

  1. CBRE,2022. 2022 China Real Estate Market Outlook. Available online: https://www.cbre.com/insights/reports/2022-china-real-estate-market-outlook (accessed on 18 October 2022).
  2. Wang, X.; Wang, L.; Zhang, X.; Fan, F. The spatiotemporal evolution of COVID-19 in China and its impact on urban economic resilience. China Econ. Rev. 2022, 74, 101806. [Google Scholar] [CrossRef] [PubMed]
  3. Davis, M.A.; Ghent, A.C.; Gregory, J.M. The Work-from-Home Technology Boon and Its Consequences; National Bureau of Economic Research: Cambridge, MA, USA, 2021. [Google Scholar]
  4. Chen, C.; Liu, L.; Zhao, N. Fear sentiment, uncertainty, and bitcoin price dynamics: The case of COVID-19. Emerg. Mark. Financ. Trade 2020, 56, 2298–2309. [Google Scholar] [CrossRef]
  5. Da, Z.; Engelberg, J.; Gao, P. The Sum of All FEARS Investor Sentiment and Asset Prices. Rev. Financ. Stud. 2015, 28, 1–32. [Google Scholar] [CrossRef] [Green Version]
  6. Narayan, P.K.; Phan, D.H.B.; Liu, G. COVID-19 lockdowns, stimulus packages, travel bans, and stock returns. Financ. Res. Lett. 2021, 38, 101732. [Google Scholar] [CrossRef] [PubMed]
  7. He, P.; Sun, Y.; Zhang, Y.; Li, T. COVID–19′s impact on stock prices across different sectors—An event study based on the Chinese stock market. Emerg. Mark. Financ. Trade 2020, 56, 2198–2212. [Google Scholar] [CrossRef]
  8. Lee, C.L.; Gumulya, N.; Bangura, M. The Role of Mandatory Building Efficiency Disclosure on Green Building Price Premium: Evidence from Australia. Buildings 2022, 12, 297. [Google Scholar] [CrossRef]
  9. Tetlock, P.C. Giving Content to Investor Sentiment: The Role of Media in the Stock Market. J. Financ. 2007, 62, 1139–1168. [Google Scholar] [CrossRef]
  10. Lee, C.L.; Stevenson, S.; Cho, H. Listed real estate futures trading, market efficiency, and direct real estate linkages: International evidence. J. Int. Money Financ. 2022, 127, 102693. [Google Scholar] [CrossRef]
  11. Allan, R.; Liusman, E.; Lu, T.; Tsang, D. The COVID-19 Pandemic and Commercial Property Rent Dynamics. J. Risk Financ. Manag. 2021, 14, 360. [Google Scholar] [CrossRef]
  12. Hoesli, M.; Malle, R. Commercial real estate prices and COVID-19. J. Eur. Real Estate Res. 2021, 15, 295–306. [Google Scholar] [CrossRef]
  13. Wheaton, W.C.; Torto, R.G. Vacancy rates and the future of office rents. Real Estate Econ. 1988, 16, 430–436. [Google Scholar] [CrossRef]
  14. Sanderson, B.; Farrelly, K.; Thoday, C. Natural vacancy rates in global office markets. J. Prop. Investig. Financ. 2006, 24, 490–520. [Google Scholar] [CrossRef]
  15. McCartney, J. Short and long-run rent adjustment in the Dublin office market. J. Prop. Res. 2012, 29, 201–226. [Google Scholar] [CrossRef]
  16. Bruneau, C.; Cherfouh, S. Long-run equilibrium for the Greater Paris office market and short-run adjustments. J. Prop. Res. 2015, 32, 301–323. [Google Scholar] [CrossRef]
  17. Hendershott, P.H.; Lizieri, C.M.; MacGregor, B.D. Asymmetric adjustment in the city of London office market. J. Real Estate Financ. Econ. 2010, 41, 80–101. [Google Scholar] [CrossRef] [Green Version]
  18. Ho, D.; Newell, G.; Walker, A. The importance of property-specific attributes in assessing CBD office building quality. J. Prop. Investig. Financ. 2005, 23, 424–444. [Google Scholar] [CrossRef]
  19. Newell, G.; MacFarlane, J.; Walker, R. Assessing energy rating premiums in the performance of green office buildings in Aus-tralia. J. Prop. Investig. Financ. 2014, 32, 352–370. [Google Scholar] [CrossRef]
  20. Onishi, J.; Deng, Y.; Shimizu, C. Green Premium in the Tokyo Office Rent Market. Sustainability 2021, 13, 12227. [Google Scholar] [CrossRef]
  21. Chau, K.W.; Wong, S.K. Information asymmetry and the rent and vacancy rate dynamics in the office market. J. Real Estate Financ. Econ. 2016, 53, 162–183. [Google Scholar] [CrossRef]
  22. Nowak, K.; Gluszak, M.; Belniak, S. Dynamics and asymmetric rent adjustments in the office market in warsaw. Int. J. Strat. Prop. Manag. 2020, 24, 428–440. [Google Scholar] [CrossRef]
  23. Newell, G. The inflation-hedging characteristics of Australian commercial property: 1984–1995. J. Prop. Financ. 1996, 7, 6–20. [Google Scholar] [CrossRef]
  24. Hoesli, M.; Lizieri, C.; MacGregor, B. The inflation hedging characteristics of US and UK investments: A multi-factor error cor-rection approach. J. Real Estate Financ. Econ. 2008, 36, 183–206. [Google Scholar] [CrossRef] [Green Version]
  25. van der Vlist, A.J.; Francke, M.K.; Schoenmaker, D.A.J. Agglomeration Economies and Capitalization Rates: Evidence from the Dutch Real Estate Office Market. J. Real Estate Financ. Econ. 2021, 1–23. [Google Scholar] [CrossRef]
  26. Crosby, N.; Devaney, S.; Lizieri, C.; Mansley, N. Modelling sustainable rents for estimation of long-term or fundamental values of commercial real estate. J. Prop. Res. 2021, 39, 30–55. [Google Scholar] [CrossRef]
  27. Hordijk, A.; De Kroon, H.; Theebe, M. Long-run return series for the European continent: 25 years of Dutch commercial real estate. J. Real Estate Portf. Manag. 2004, 10, 217–230. [Google Scholar]
  28. Wang, S.; Hartzell, D. Real Estate Return in Hong Kong and its Determinants: A Dynamic Gordon Growth Model Analysis. Int. Real Estate Rev. 2021, 24, 113–138. [Google Scholar] [CrossRef]
  29. An, X.; Deng, Y.; Fisher, J.D.; Hu, M.R. Commercial Real Estate Rental Index: A Dynamic Panel Data Model Estimation. Real Estate Econ. 2015, 44, 378–410. [Google Scholar] [CrossRef]
  30. Lee, C.L.; Lee, M.L. Do European real estate stocks hedge inflation? Evidence from developed and emerging markets. Int. J. Strateg. Prop. Manag. 2014, 18, 178–197. [Google Scholar] [CrossRef] [Green Version]
  31. Khan, M.A.; Wang, C.C.; Lee, C.L. A framework for developing green building rating tools based on Pakistan’s local context. Buildings 2021, 11, 202. [Google Scholar] [CrossRef]
  32. Wang, J.; Lee, C.L.; Shirowzhan, S. Macro-Impacts of Air Quality on Property Values in China—A Meta-Regression Analysis of the Literature. Buildings 2021, 11, 48. [Google Scholar] [CrossRef]
  33. Wang, J.; Lee, C.L. The value of air quality in housing markets: A comparative study of housing sale and rental markets in China. Energy Policy 2022, 160, 112601. [Google Scholar] [CrossRef]
  34. Hui, E.C.M.; Chan, K.K.K. Foreign direct investment in China’s real estate market. Habitat Int. 2014, 43, 231–239. [Google Scholar] [CrossRef]
  35. Zhang, J.; Lee, C.L.; Chan, N. The Asymmetric Effect of Institutional Quality on Chinese Outward Real Estate Investment. Int. J. Strat. Prop. Manag. 2019, 23, 435–449. [Google Scholar] [CrossRef] [Green Version]
  36. Ke, Q.; White, M. An econometric analysis of Shanghai office rents. J. Prop. Investig. Financ. 2009, 27, 120–139. [Google Scholar] [CrossRef]
  37. White, M.; Ke, Q. Investigating the dynamics of, and interactions between, Shanghai office submarkets. J. Prop. Res. 2014, 31, 26–44. [Google Scholar] [CrossRef] [Green Version]
  38. Ke, Q.; White, M. A Tale of Two Chinese Cities: The Dynamics of Beijing and Shanghai Office Markets. J. Real Estate Portf. Manag. 2013, 19, 31–47. [Google Scholar] [CrossRef]
  39. Ke, Q.; Sieracki, K. Market maturity: China commercial real estate market. J. Prop. Investig. Financ. 2015, 33, 4–18. [Google Scholar] [CrossRef]
  40. Ke, Q.; Wang, W. The factors that determine shopping centre rent in Wuhan, China. J. Prop. Investig. Financ. 2016, 34, 172–185. [Google Scholar] [CrossRef]
  41. Ling, D.C.; Wang, C.; Zhou, T. A first look at the impact of COVID-19 on commercial real estate prices: Asset-level evidence. Rev. Asset Pricing Stud. 2020, 10, 669–704. [Google Scholar] [CrossRef]
  42. Milcheva, S. Volatility and the Cross-Section of Real Estate Equity Returns during Covid-19. J. Real Estate Financ. Econ. 2021, 65, 293–320. [Google Scholar] [CrossRef]
  43. Rosenthal, S.S.; Strange, W.C.; Urrego, J.A. JUE insight: Are city centers losing their appeal? Commercial real estate, urban spatial structure, and COVID-19. J. Urban Econ. 2022, 127, 103381. [Google Scholar] [CrossRef]
  44. Gupta, A.; Mittal, V.; Peeters, J.; Van Nieuwerburgh, S. Flattening the curve: Pandemic-Induced revaluation of urban real estate. J. Financ. Econ. 2021, 146, 594–636. [Google Scholar] [CrossRef]
  45. D’Lima, W.; Lopez, L.A.; Pradhan, A. COVID-19 and housing market effects: Evidence from U.S. shutdown orders. Real Estate Econ. 2021, 50, 303–339. [Google Scholar] [CrossRef]
  46. Liu, S.; Su, Y. The impact of the COVID-19 pandemic on the demand for density: Evidence from the US housing market. Eco-Nomics Lett. 2021, 207, 110010. [Google Scholar] [CrossRef]
  47. Liu, H.; Wang, Y.; He, D.; Wang, C. Short term response of Chinese stock markets to the outbreak of COVID-19. Appl. Econ. 2020, 52, 5859–5872. [Google Scholar] [CrossRef]
  48. Huang, N.; Pang, J.; Yang, Y. JUE Insight: COVID-19 and Household Preference for Urban Density in China. J. Urban Econ. 2022, 103487. [Google Scholar] [CrossRef] [PubMed]
  49. Shen, H.; Fu, M.; Pan, H.; Yu, Z.; Chen, Y. The impact of the COVID-19 pandemic on firm performance. Emerging Markets Finance and Trade 2020, 56, 2213–2230. [Google Scholar] [CrossRef]
  50. Li, L.; Wan, L. Understanding the Spatial Impact of COVID-19: New Insights from Beijing after One Year into Post-Lockdown Recovery. SSRN 2021, 3908277. [Google Scholar] [CrossRef]
  51. SCMP. What does China’s move to relax hukou residency curbs mean for the property sector? 2022. South China Morning Post. Available online: https://www.scmp.com/property/hong-kong-china/article/3005615/what-does-chinas-move-relax-residency-curbs-mean-property (accessed on 28 November 2022).
  52. State Council. The notice to further support the relief and development of small and medium-sized enterprises and individual industrial and commercial housing rent in 2022 2022. In State Council of China. Available online: http://www.gov.cn/zhengce/zhengceku/2022-10/12/content_5717962.htm (accessed on 19 October 2022).
  53. Phan DH, B.; Narayan, P.K. Country responses and the reaction of the stock market to COVID-19—A preliminary exposition. Emerg. Mark. Financ. Trade 2020, 56, 2138–2150. [Google Scholar] [CrossRef]
  54. Wan, D.; Xue, R.; Linnenluecke, M.; Tian, J.; Shan, Y. The impact of investor attention during COVID-19 on investment in clean energy versus fossil fuel firms. Financ. Res. Lett. 2021, 43, 101955. [Google Scholar] [CrossRef]
  55. Baum, A.E.; Hartzell, D. Real Estate Investment: Strategies, Structures, Decisions; Wiley: Hoboken, NJ, USA, 2021. [Google Scholar]
  56. Engsted, T.; Pedersen, T.Q. Predicting returns and rent growth in the housing market using the rent-price ratio: Evidence from the OECD countries. J. Int. Money Financ. 2015, 53, 257–275. [Google Scholar] [CrossRef]
  57. Brounen, D.; Jennen, M. Asymmetric properties of office rent adjustment. J. Real Estate Financ. Econ. 2009, 39, 336–358. [Google Scholar] [CrossRef] [Green Version]
  58. Brounen, D.; Jennen, M. Local office rent dynamics. J. Real Estate Financ. Econ. 2009, 39, 385. [Google Scholar] [CrossRef] [Green Version]
  59. Qian, X.; Qiu, S.; Zhang, G. The impact of COVID-19 on housing price: Evidence from China. Financ. Res. Lett. 2021, 43, 101944. [Google Scholar] [CrossRef]
  60. Al-Masum, A.; Lee, C.L. Modelling housing prices and market fundamentals: Evidence from the Sydney housing market. Int. J. Hous. Mark. Anal. 2019, 12, 746–762. [Google Scholar] [CrossRef]
  61. Lee, C.L.; Stevenson, S.; Lee, M.L. Low-frequency volatility of real estate securities and macroeconomic risk. Account. Financ. 2018, 58, 311–342. [Google Scholar] [CrossRef]
  62. Liu, Y.S.; Su, C.W. The relationship between the real estate and stock markets of China: Evidence from a nonlinear model. Appl. Financ. Econ. 2010, 20, 1741–1749. [Google Scholar] [CrossRef]
  63. Lai, R.N.; Van Order, R.A. A Tale of Two Countries: Comparing the US and Chinese Housing Markets. J. Real Estate Financ. Econ. 2020, 61, 505–547. [Google Scholar] [CrossRef]
  64. Campbell, S.D.; Davis, M.A.; Gallin, J.; Martin, R.F. What moves housing markets: A variance decomposition of the rent–price ratio. J. Urban Econ. 2009, 66, 90–102. [Google Scholar] [CrossRef]
  65. Bangura, M.; Lee, C.L. The determinants of homeownership affordability in Greater Sydney: Evidence from a submarket analysis. Hous. Stud. 2021, 1–27. [Google Scholar] [CrossRef]
  66. Dunse, N.; Jones, C. The existence of office submarkets in cities. J. Prop. Res. 2002, 19, 159–182. [Google Scholar] [CrossRef]
Figure 1. Average Rent and Vacancy Rate (Stock Weighted) of Seven Cities in China (Sources: Savills China, 2022).
Buildings 12 02100 g001
Figure 2. Weekly COVID-19 Exposure in 7 Chinese cities (Baidu Search Index).
Buildings 12 02100 g002
Table 1. Key variables and data Resource.
VariablesDefinition and FunctionResource/
Built Method
OfficerentA-class office average rent, the key indicator of office market performance Savills China
vacancy rateProportion of vacancy A class buildings in the office buildings stock of a city
stockTotal available buildings within a city in each period, a measure of office market scale.
EconomicGDPGross domestic product, it is the key variables to measure economic prosperity of an economic, a widely used office market demand variable.National Bureau of Statistics of China
Stock priceShanghai Composite (SSEC), we use stock price as an demand variable for office space in robust test Investing.com
Interest rateWe use 10-year China government bond yield as a measure of risk-free rate; it might have influence on office rent
COVIDCOVID sentiment Measure of public concern of COVID-19, a sentiment index based on Baidu search queries on COVID-19-related keywordBuilt from Baidu Search data
Table 2. Descriptive statistics of key variables.
VariablesMeanStd. Dev.MinMaxObservations
Rent (RMB/m2/month)187.486.2181.70369252
GDP (100 million RMB)56542040223811250252
Stock (104 m2)590.4447.761.401590252
Vacancy0.2050.1280.03500.524252
COVID-19 Exposure0.05650.18501252
Housing Rent (RMB/m2/month)65.8329.5925.17121.30252
Housing Price (RMB/m2)34,978.8419,719.927280.5478,588.07252
Table 3. Key variable of 7 Chinese cities from 2013 Q3 to 2022 Q2 (%).
Tier 1 CitiesTier 2 Cities
BeijingShanghaiGuangzhouShenzhenTianjinChengduChongqing
Yearly Rent Increase Rate1.051.270.62−1.99−2.66−0.67−1.55
Average Vacancy Rate8.3811.119.4915.6032.6428.2837.93
Yearly Stock Increase Rate5.412.038.0711.2412.209.3815.19
Yearly GDP Increase Rate9.108.367.489.560.869.8810.07
COVID-19 Exposure5.793.474.404.175.093.943.47
Housing Rent Increase Rate4.246.270.374.77−0.112.791.57
Housing Price Increase Rate9.2612.9013.2125.714.3315.1210.53
Table 4. The Results of Office Rent Long-term Determinants.
Dependent Variable: lnRent
(1)(2)(3)(4)(5)(6)
All CitiesTier 1 CitiesTier 2 CitiesAll CitiesTier 1 CitiesTier 2 Cities
lnGDP0.117 ***0.329 ***0.0520.102 ***0.316 ***0.016
(0.022)(0.029)(0.037)(0.022)(0.028)(0.037)
lnStock−0.136 ***−0.190 ***−0.122 ***−0.126 ***−0.178 ***−0.111 ***
(0.019)(0.034)(0.021)(0.019)(0.033)(0.020)
Vacancy−0.000−0.937 ***0.163 *−0.032−0.899 ***0.169 *
(0.062)(0.090)(0.092)(0.061)(0.088)(0.087)
COVID−0.083 ***−0.037 *−0.100 ***0.149 **0.198 ***0.570 ***
(0.021)(0.022)(0.030)(0.062)(0.075)(0.191)
COVID*vacancy −1.026 ***−1.394 ***−2.240 ***
(0.258)(0.426)(0.629)
Constant5.744 ***4.310 ***4.829 ***5.806 ***4.338 ***5.057 ***
(0.155)(0.185)(0.256)(0.151)(0.179)(0.251)
City fixedYesYesYesYesYesYes
Observations252144108252144108
R-squared0.9850.9790.9050.9860.9800.915
Note: *** p < 0.01, ** p < 0.05, * p < 0.1, standard errors in parentheses.
Table 5. Office rent short-term adjustment.
Dependent Variable: Δ l n R e n t
(1)(2)(3)(4)(5)(6)
All_CityTier1_CityTier2_CityAll_CityTier1_CityTier2_City
Δ lnStock 0.041−0.0220.0310.043−0.0260.032
(0.034)(0.067)(0.042)(0.034)(0.068)(0.042)
Δ lnGDP −0.019−0.021−0.006−0.019−0.021−0.008
(0.017)(0.025)(0.024)(0.017)(0.025)(0.024)
Δ Vacancy −0.097−0.412 ***0.031−0.099−0.422 ***0.031
(0.067)(0.111)(0.087)(0.067)(0.111)(0.087)
Δ COVID −0.014−0.014−0.015−0.008−0.001−0.002
(0.010)(0.011)(0.019)(0.029)(0.037)(0.145)
Δ COVID * vacancy −0.027−0.083−0.053
(0.122)(0.201)(0.462)
ECM (−1)−0.079 ***−0.122 ***−0.111 **−0.084 ***−0.126 ***−0.130 ***
(0.024)(0.042)(0.044)(0.025)(0.044)(0.046)
Constant0.0030.005−0.0010.0030.005−0.001
(0.004)(0.003)(0.004)(0.004)(0.003)(0.004)
Observations245140105245140105
R-squared0.0880.1880.0790.0920.1880.093
city fixedYesYesYesYesYesYes
Note: *** p < 0.01, ** p < 0.05; standard errors in parentheses.
Table 6. Office vacancy rate change determinants.
Dependent Variable: Δ V a c a n c y
(1)(2)(3)
All CitiesTier 1 CitiesTier 2 Cities
Vacancy(−1)−0.073 ***−0.047 *−0.091 **
(0.021)(0.026)(0.035)
Δ lnGDP −0.019−0.005−0.027
(0.016)(0.019)(0.027)
Δ lnStock 0.174 ***0.0360.203 ***
(0.031)(0.053)(0.043)
COVID0.0090.0110.004
(0.007)(0.007)(0.013)
ECM_rent(−1)0.051 **0.0300.073
(0.023)(0.033)(0.048)
Constant0.007 *0.006 *0.019 *
(0.004)(0.003)(0.011)
City fixedYesYesYes
Observations245140105
R-squared0.1870.0430.261
Note: *** p < 0.01, ** p < 0.05, * p < 0.1, standard errors in parentheses.
Table 7. Stock change adjustment model result.
Dependent Variable: Δ l n S t c o k
(1)(2)(3)
All CitiesTier 1 CitiesTier 2 Cities
Vacancy(−1)0.076 *0.067 *0.078
(0.044)(0.040)(0.079)
ECM_rent(−1)0.082 *−0.0260.187 *
(0.048)(0.050)(0.110)
Constant0.0070.0070.002
(0.008)(0.005)(0.024)
City fixedYesYesYes
Observations245140105
R-squared0.0690.1120.046
Note: * p < 0.1, standard errors in parentheses.
Table 8. Robust tests for office rent models.
Dependent Variable: lnrent
(1)(2)(3)(4)
SSECSSEC
Crossterm
InterestInterest
Crossterm
lnShanghai Index0.050 **0.047 **
(0.025)(0.024)
Risk free rate −2.254 **−2.118 **
(1.025)(0.984)
lnStock−0.088 ***−0.085 ***−0.092 ***−0.089 ***
(0.018)(0.017)(0.018)(0.017)
vacancy−0.050−0.082−0.057−0.088
(0.065)(0.063)(0.065)(0.063)
COVID−0.067 ***0.208 ***−0.074 ***0.199 ***
(0.022)(0.063)(0.022)(0.063)
Covid×vacancy −1.226 *** −1.219 ***
(0.263) (0.263)
Constant6.056 ***6.048 ***6.560 ***6.527 ***
(0.181)(0.174)(0.147)(0.141)
City fixedYesYesYesYes
Observations252252252252
R-squared0.9830.9850.9830.985
Note: *** p < 0.01, ** p < 0.05, standard errors in parentheses.
Table 9. Housing rent long-term determinants.
Dependent Variable: l n H o u s i n g   R e n t
(1)(2)(3)
All_CityTier1_CityTier2_City
Δ lnHouisng   Price 0.198 **0.577 ***0.034
−0.089−0.171−0.087
GDP2.744 ***3.114 ***2.477 ***
−0.19−0.285−0.229
COVID−0.077 **−0.051−0.129 ***
−0.031−0.044−0.041
Constant−1.326 ***−2.144 ***−1.717 ***
−0.415−0.622−0.48
City fixedYesYesYes
Observations245140105
R-squared0.9790.8870.932
Note: *** p < 0.01, ** p < 0.05, standard errors in parentheses.
Publisher’s Note: MDPI stays neutral with regard to jurisdictional claims in published maps and institutional affiliations.

