Article

Numerical Assessment on Continuous Reinforced Normal-Strength Concrete and High-Strength Concrete Beams

1
School of Civil Engineering and Architecture, Wuhan University of Technology, Wuhan 430070, China
2
Department of Civil Engineering, Zhejiang University, Hangzhou 310058, China
3
CEMMPRE, ARISE, Department of Civil Engineering, University of Coimbra, 3030-788 Coimbra, Portugal
*
Authors to whom correspondence should be addressed.
Buildings 2023, 13(5), 1157; https://doi.org/10.3390/buildings13051157
Submission received: 6 April 2023 / Revised: 19 April 2023 / Accepted: 21 April 2023 / Published: 27 April 2023

Abstract

:
High-strength concrete (HSC) has been broadly applied to various civil structures for its advantages including high compressive strength and excellent durability and creep resistance. However, the brittleness of HSC raises concern about its use in practice. So far study on continuous reinforced HSC beams is limited. This work investigates the structural response of reinforced HSC continuous beams, and the results are compared with those of the counterparts made of normal-strength concrete (NSC). By applying a finite element method verified by experimental data, a comprehensive assessment is performed on two-span reinforced NSC and HSC (compressive strengths of 30, 60 and 90 MPa) continuous beams. A wide range of flexural reinforcement ratios are used to cover both under-reinforced and over-reinforced beams. The results show that reinforced HSC beams exhibit better flexural performance in terms of ultimate load, deformation, flexural ductility and moment redistribution, when compared to reinforced NSC beams. Formulae relating flexural ductility and moment redistribution with either neutral axis depth or tensile steel strain are suggested.

1. Introduction

The high compressive strength is the primary characteristic distinguishing high-strength concrete (HSC) from normal-strength concrete (NSC). Even though there is no definitive boundary between HSC and NSC, concrete with compressive strength of 55 MPa or above is normally termed as HSC according to ACI [1]. In addition to high compressive strength, HSC possesses a range of attractive merits such as improved bond between concrete and reinforcement [2,3], excellent durability [4] and creep resistance [5] and reduced size of concrete elements, when compared to NSC. Nowadays HSC has been widely applied to various civil structures such as tall buildings, long-span bridges and marine engineering.
On the other hand, HSC is more brittle, showing steeper stress–strain diagram and smaller ultimate strain, when compared to NSC. As ductile characteristic is of crucial importance to structures especially in seismic regions, there arise concerns on the utilization of HSC in practice. Numerous experimental [6,7,8,9,10], numerical [11,12,13] and theoretical works [14,15,16,17,18,19,20] have been carried out to examine flexural ductility of single-span reinforced HSC members. A few researchers have also evaluated the shear [21] and torsional behavior [22,23] of single-span reinforced HSC members. Previous research showed that in spite of the brittleness of HSC, reinforced HSC members with reasonably arranged steel bars exhibited favorable ductile ability.
In continuous concrete beams, the ability to redistribute bending moments is also a major concern for the use of HSC. Laboratory tests on plastic rotational capacity and moment redistribution of continuous reinforced HSC beams were performed in Coimbra [24,25]. The main variables of the tests were the contents of longitudinal tension steel bars and transverse reinforcement. It was shown that reinforced HSC beams with tensile steel ratios not greater than 2.9% exhibited favorable deformation behavior and adequate capacities to redistribute bending moments. In addition, moment redistribution depended highly on the stiffness difference of key sections. Such experimental observations were later verified by numerical studies on reinforced HSC continuous beams [26,27,28]. Increasing the concrete confinement level improved moment redistribution in continuous beams made of NSC [29], but the concrete confinement had a marginal effect on moment redistribution in continuous reinforced HSC beams if these beams had sufficient plastic rotational capacities [30].
The literature review shows that although some efforts have been made, study on continuous reinforced HSC beams is limited. In particular, little work has addressed the effect of using HSC instead of NSC in continuous reinforced concrete beams. Lou et al. [27] discussed the redistribution behavior of reinforced NSC and HSC continuous beams, while other important aspects of behavior (e.g., ductility) were not covered in their study. Moreover, both flexural ductility and moment redistribution are related to neutral axis depth or tensile strain in steel bars, but their quantitative relationships are yet to be identified.
The present work focuses on reinforced HSC continuous beams with various tensile steel ratios and the results are compared with the counterparts made of NSC. A finite element model is verified with available experimental data. A comparative assessment is performed to evaluate the comprehensive response of continuous reinforced NSC and HSC beams. The concrete compressive strength varies between 30 and 90 MPa to cover both NSC and HSC, and the reinforcement ratio ranges widely to cover both under-reinforced and over-reinforced beams. Based on the data of numerical simulations, formulae relating flexural ductility and moment redistribution with either neutral axis depth or tensile steel strain are suggested.

2. Materials and Method

2.1. Material Laws

For concrete in compression, the stress–strain law recommended by Eurocode 2 [31] has been proved to be well applicable to both NSC and HSC, and therefore, is adopted herein. The stress–strain law is expressed by
σ c f c m = k η η 2 1 + ( k 2 ) η
where  η = ε c / ε c 0 ; σc and εc are concrete stress and strain, respectively;  f c m = f c k + 8 , in MPa;  k = 1.05 E c ε c 0 / f c m ε c 0 ( ) = 0.7 f c m 0.31 < 2.8 E c = 22 ( f c m / 10 ) 0.3 , in GPa; fck is the characteristic cylinder compressive strength; Ec is the elastic modulus, depending on the concrete grade [32]. Note that Equation (1) is subject to that  ε c ε u , where εu is the ultimate compressive strain determined by
ε u ( ) = 3.5   for   f c k 50   MPa 2.8 + 27 ( 98 f c m ) / 100 4   for   f c k > 50   MPa
According to Equation (1), HSC with fck equal to or greater than 90 MPa does not exhibit a descending branch of the stress–strain curve. This could be justified by the highly brittle behavior of the material.
The stress–strain law for concrete in tension is indicated by
σ c = E c ε c   for   ε c ε c r f t 1 0.2 ε c ε c r 1   for   ε c r < ε c 5 ε c r f t 0.3 0.02 ε c ε c r   for   5 ε c r < ε c 15 ε c r 0   for   ε c > 15 ε c r
where εcr is the cracking strain; and ft is the tensile strength calculated from
f t = 0.3 f c k 2 / 3   for   concrete   class   not   above   C 50 / 60 2.12 ln ( 1 + f c m / 10 )   for   concrete   class   above   C 50 / 60
The stress–strain law for steel bars is represented by the following equation:
σ s = E s ε s   for   ε s ε y f y + E s h ( ε s ε y )   for   ε s > ε y
where σs and εs are stress and strain of steel bars, respectively; fy and εy are yield strength and strain, respectively; Esh = 0.015 Es; and Es is the elastic modulus.

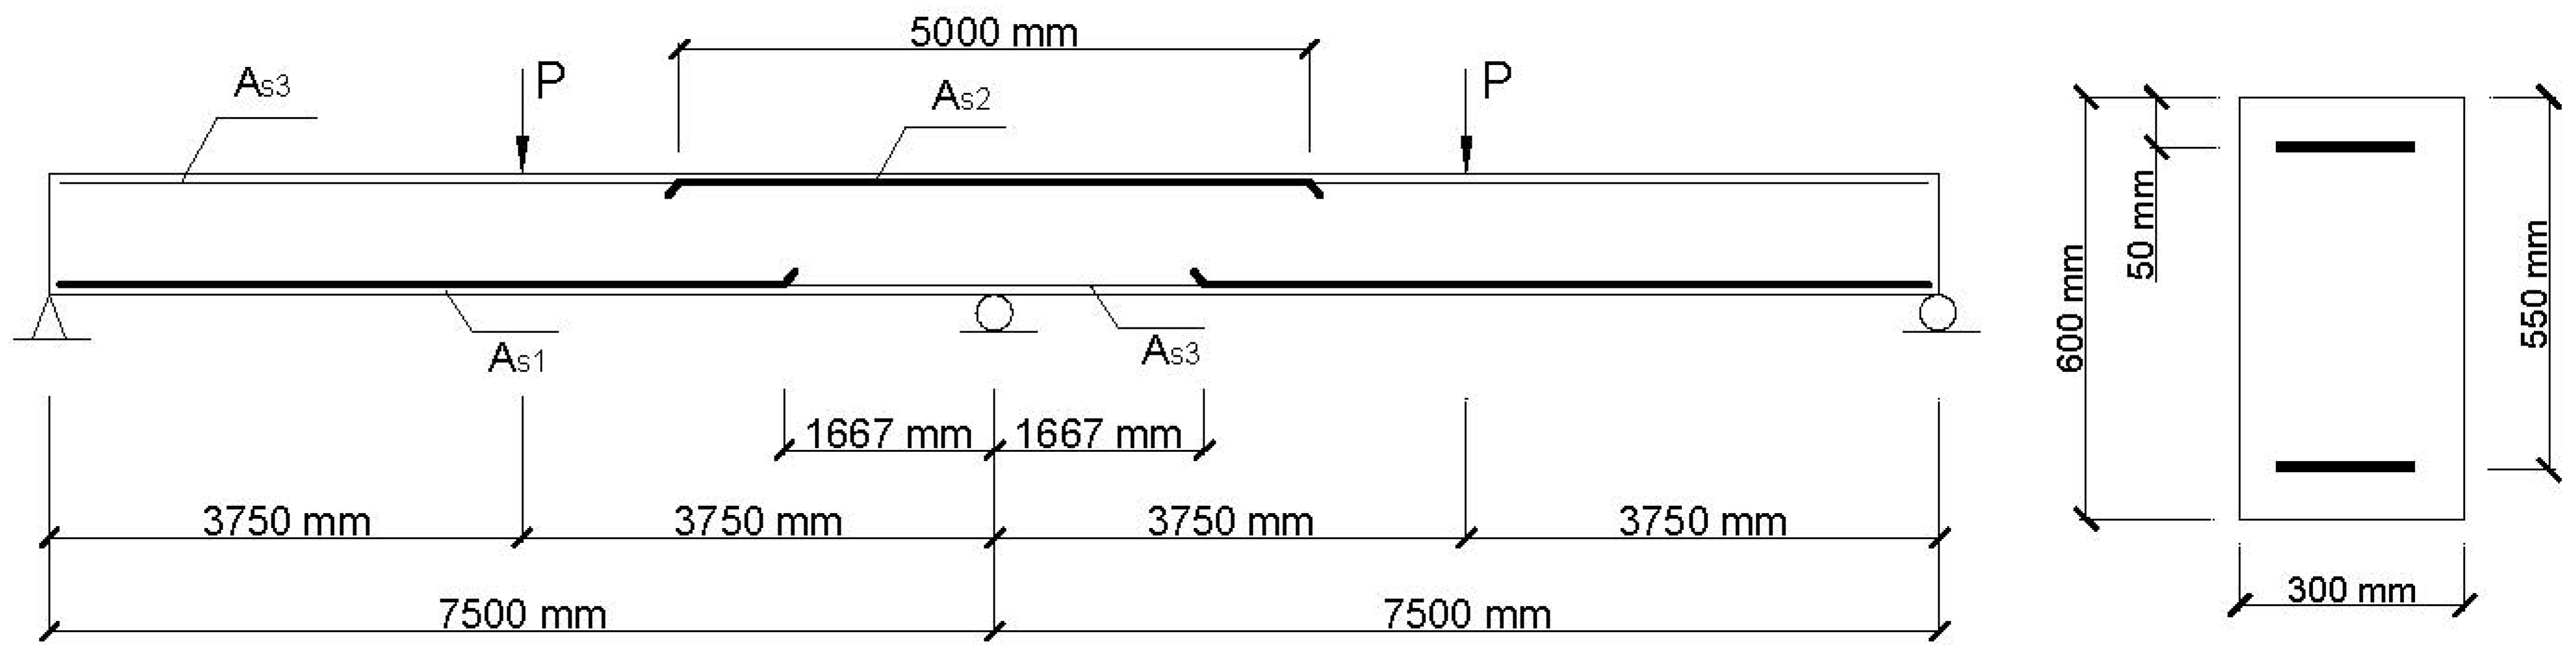
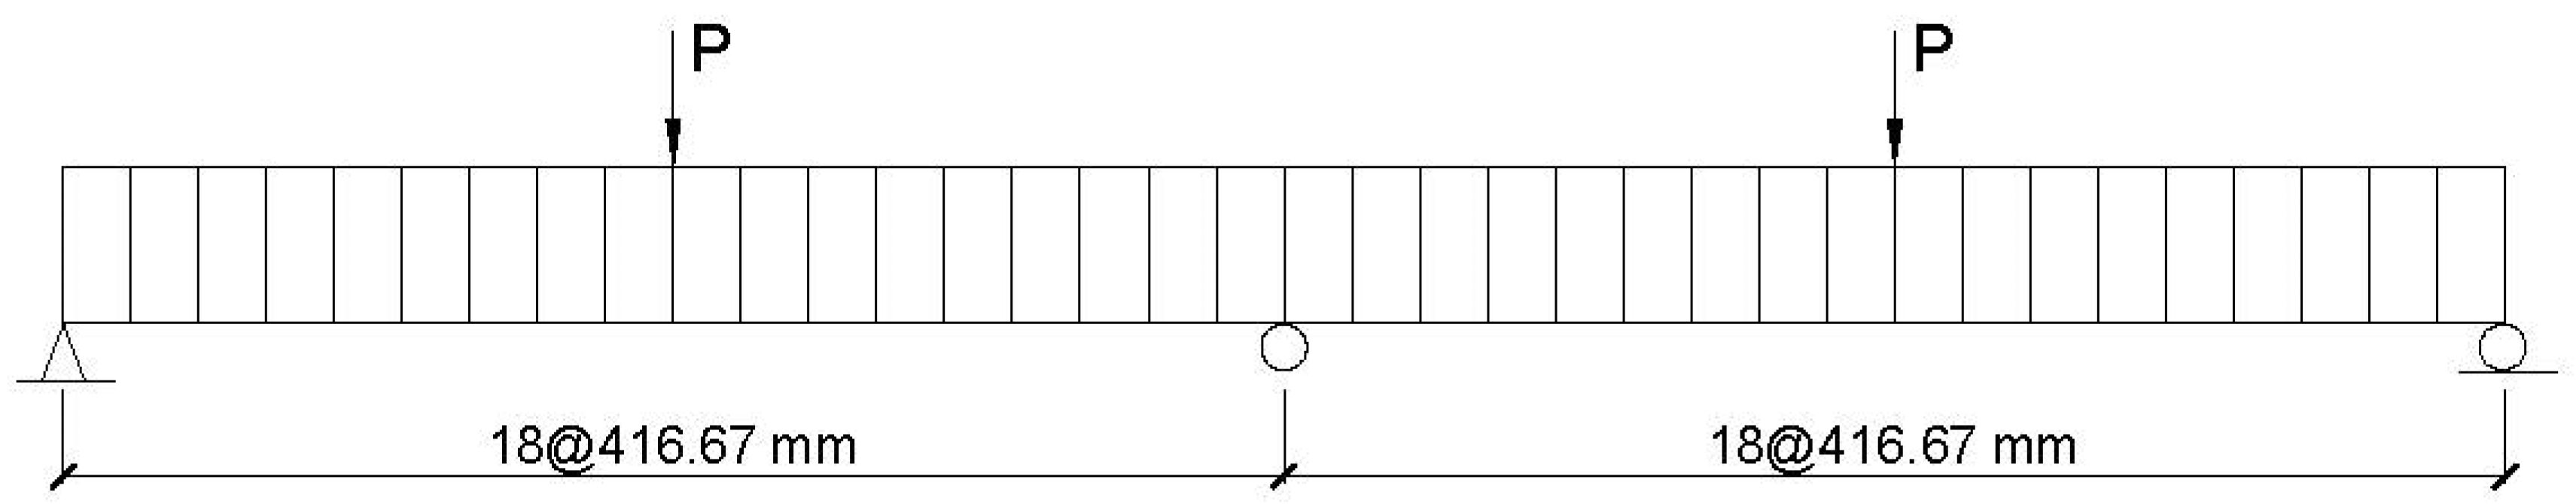
2.2. Finite Element Method

The finite element method is based on the pre-generated moment–curvature relationship, by which the nonlinear material laws of concrete steel bars are introduced. The method assumes that a plane section remains plane after deformation and that there is perfect bond between reinforcing steel and concrete. The moment–curvature relationship is generated by means of cross-sectional analysis by satisfying force equilibrium and strain compatibility.
Considering a two-nodal plane Timoshenko beam element and applying linear interpolation, the transverse displacement w and rotation θ within an element are
w = N 1 w 1 + N 2 w 2
θ = N 1 θ 1 + N 2 θ 2
where
N 1 = ( l x ) / l ,   N 2 = x / l
where l is element length; subscripts 1 and 2 signify end nodes.
The element equilibrium equations are
P e = K e u e
where ue and Pe are element nodal displacements and equivalent nodal loads, respectively; and
K e = l B b T ( E I ) B b d x + l B s T ( G A / k s ) B s d x
in which EI and GA are flexural and shear stiffness, respectively; ks is the shear correction factor; and
B b = 0 d N 1 d x 0 d N 2 d x
B s = d N 1 d x N 1 d N 2 d x N 2
After assembling the structure equilibrium equations and imposing appropriate boundary conditions, an incremental approach combined with the Newton–Raphson algorithm is employed for numerical solution. Detailed formulation of the finite element method and solution procedure can be referred to [26]. A computer program implementing the finite element method was developed in Fortran. The program is able to perform nonlinear analysis of continuous reinforced NSC and HSC beams from zero loads up to the ultimate limit state.
It is noted that the softening tensile stress–strain behavior of concrete may lead to strong mesh-dependency. A novel concrete constitutive model was recently developed to reduce the mesh-size sensitivity [33]. For the beam element model used in this study, it has been demonstrated that an element length of around 0.5–1.0 times the cross-sectional depth is reasonable for nonlinear analysis of concrete beams [26,30].

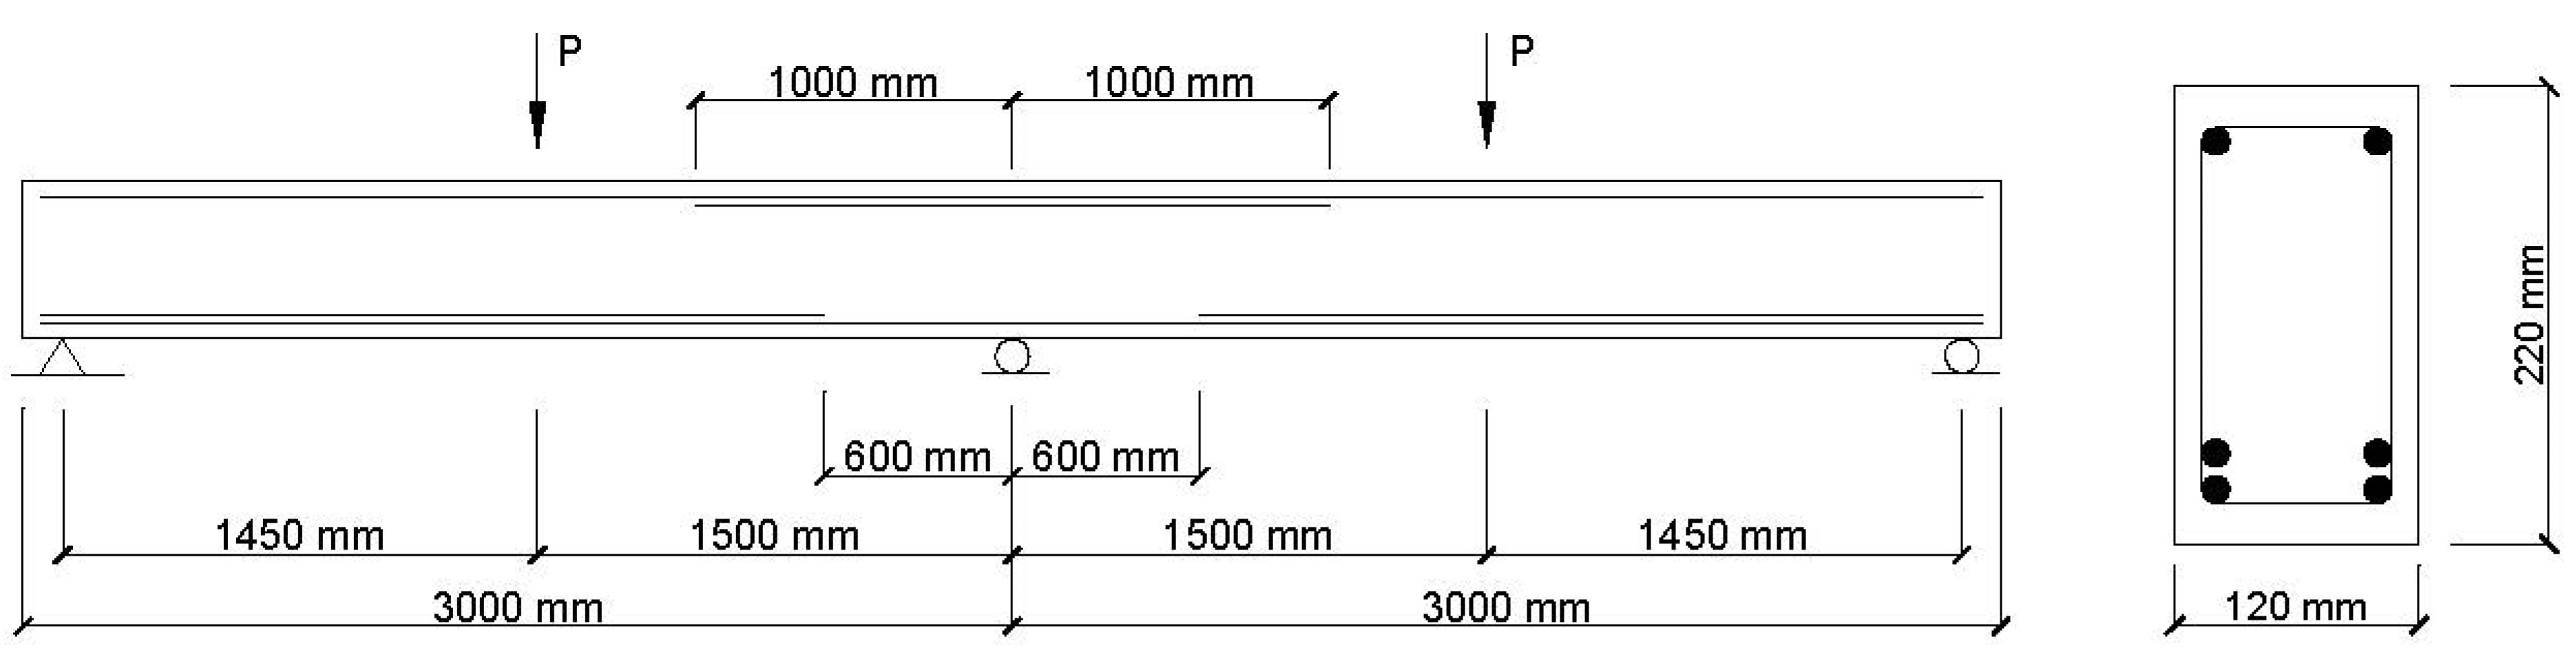
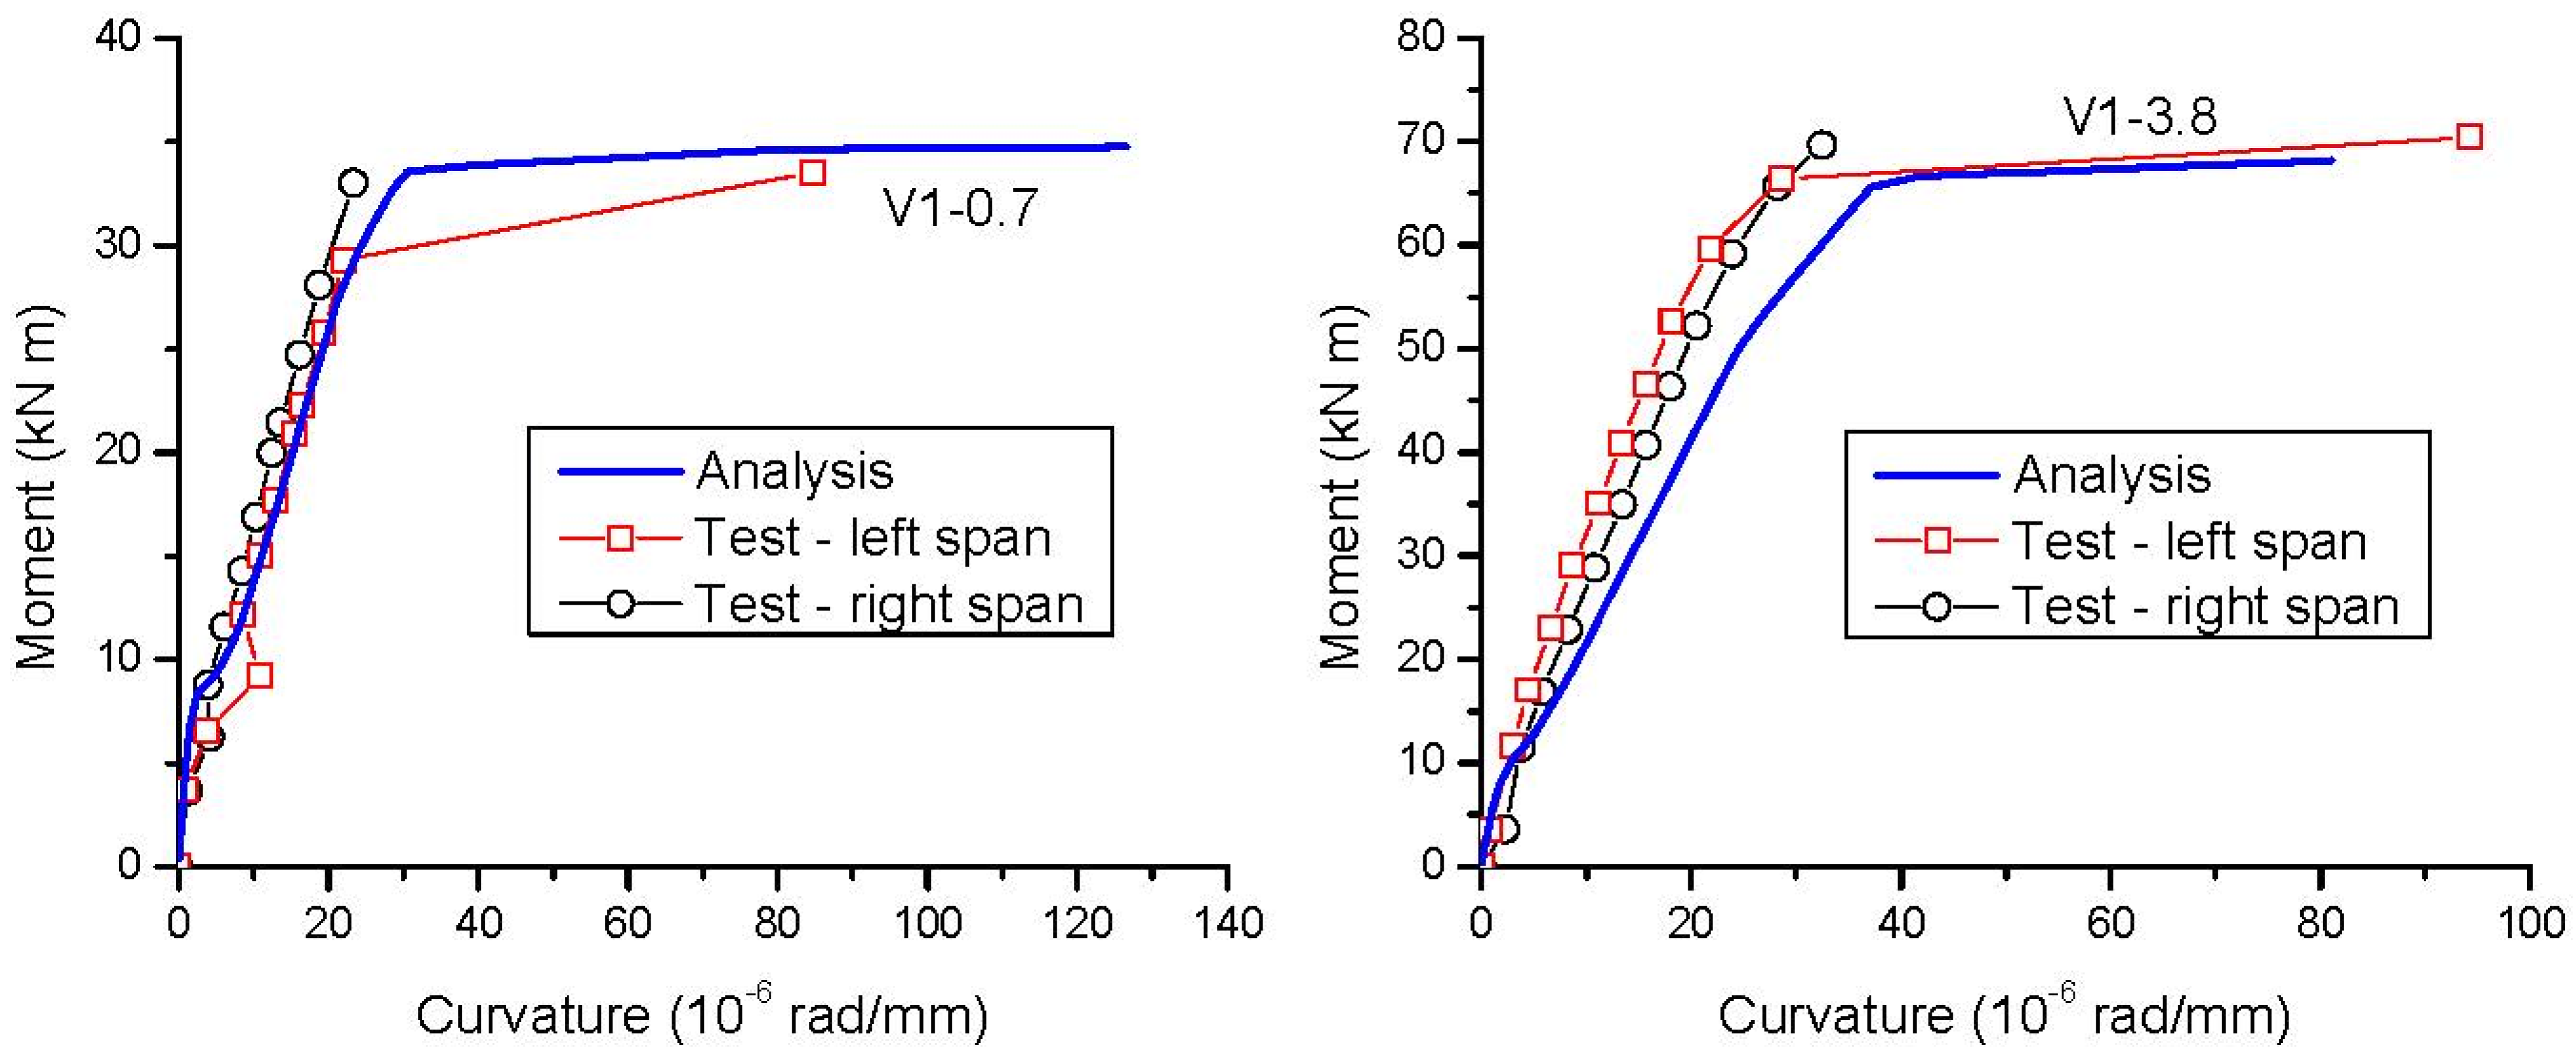
2.3. Comparison with Experimental Data

Two reinforced HSC continuous beam specimens [24,25], designated as V1-0.7 and V1-3.8, have been analyzed (see Figure 1). The two-span specimens had a rectangular cross section of 120 × 220 mm. Each of the clear spans was 2950 mm, subjected to a concentrated load, distancing 1500 mm from the center support. In Specimen V1-0.7, two longitudinal deformed steel bars of 10 mm in diameter were provided at both top and bottom layers over the entire length. Two additional deformed steel bars of 12 mm in diameter were provided at the bottom layer over the positive moment zones. In Specimen V1-3.8, two longitudinal deformed steel bars of 16 mm in diameter at the top layer and 12 mm in diameter at the bottom layer were provided over the entire length. In addition, two 16 mm diameter deformed steel bars at the top layer over the negative moment zone, and two 20 mm diameter deformed steel bars at the bottom layer over the positive moment zone, were also provided. The yield strength of steel bars was 569 MPa. The cylinder compressive strength of concrete was 71 MPa.
The loads were applied through a hydraulic jack. Load cells were installed under the supports to measure the support reactions, by which the moment over the span could be calculated. Mechanical stain gauges were attached to the surface at different levels of key cross sections of the beams to obtain the strains during the loading. The curvature was then calculated according to the strains at the bottom and top fibers of a section. Therefore, the complete moment–curvature relationship of the tests was determined.
Figure 2 compares the predicted moment–curvature behavior at the span critical section (i.e., loading point) with the test results for the two specimens. It is noted that the post-yielding curvature at the right span was not adequately measured in the tests. It can be observed that despite some discrepancy, the finite element method reproduces well the test data over the entire ranges of loading. In particular, the numerical and test results regarding the yielding and ultimate moments are in perfect agreement.

3. Results and Discussion

Figure 3 shows the details of two-span reinforced NSC and HSC beams used for the present study. Three concrete grades are considered, namely fck = 30, 60, and 90 MPa. A wide range of tensile steel ratios are used, i.e., ρs2 = 0.73–4.0%, and ρs2/ρs1 = 0.8, where ρs1 and ρs2 are tensile steel ratios over positive and negative moment zones, respectively. The compressive steel ratio over both positive and negative moment zones, ρs3, is 0.36%. The elastic modulus and yield strength of steel bars are 200 GPa and 530 MPa, respectively. The finite element model of the continuous beams is illustrated in Figure 4.

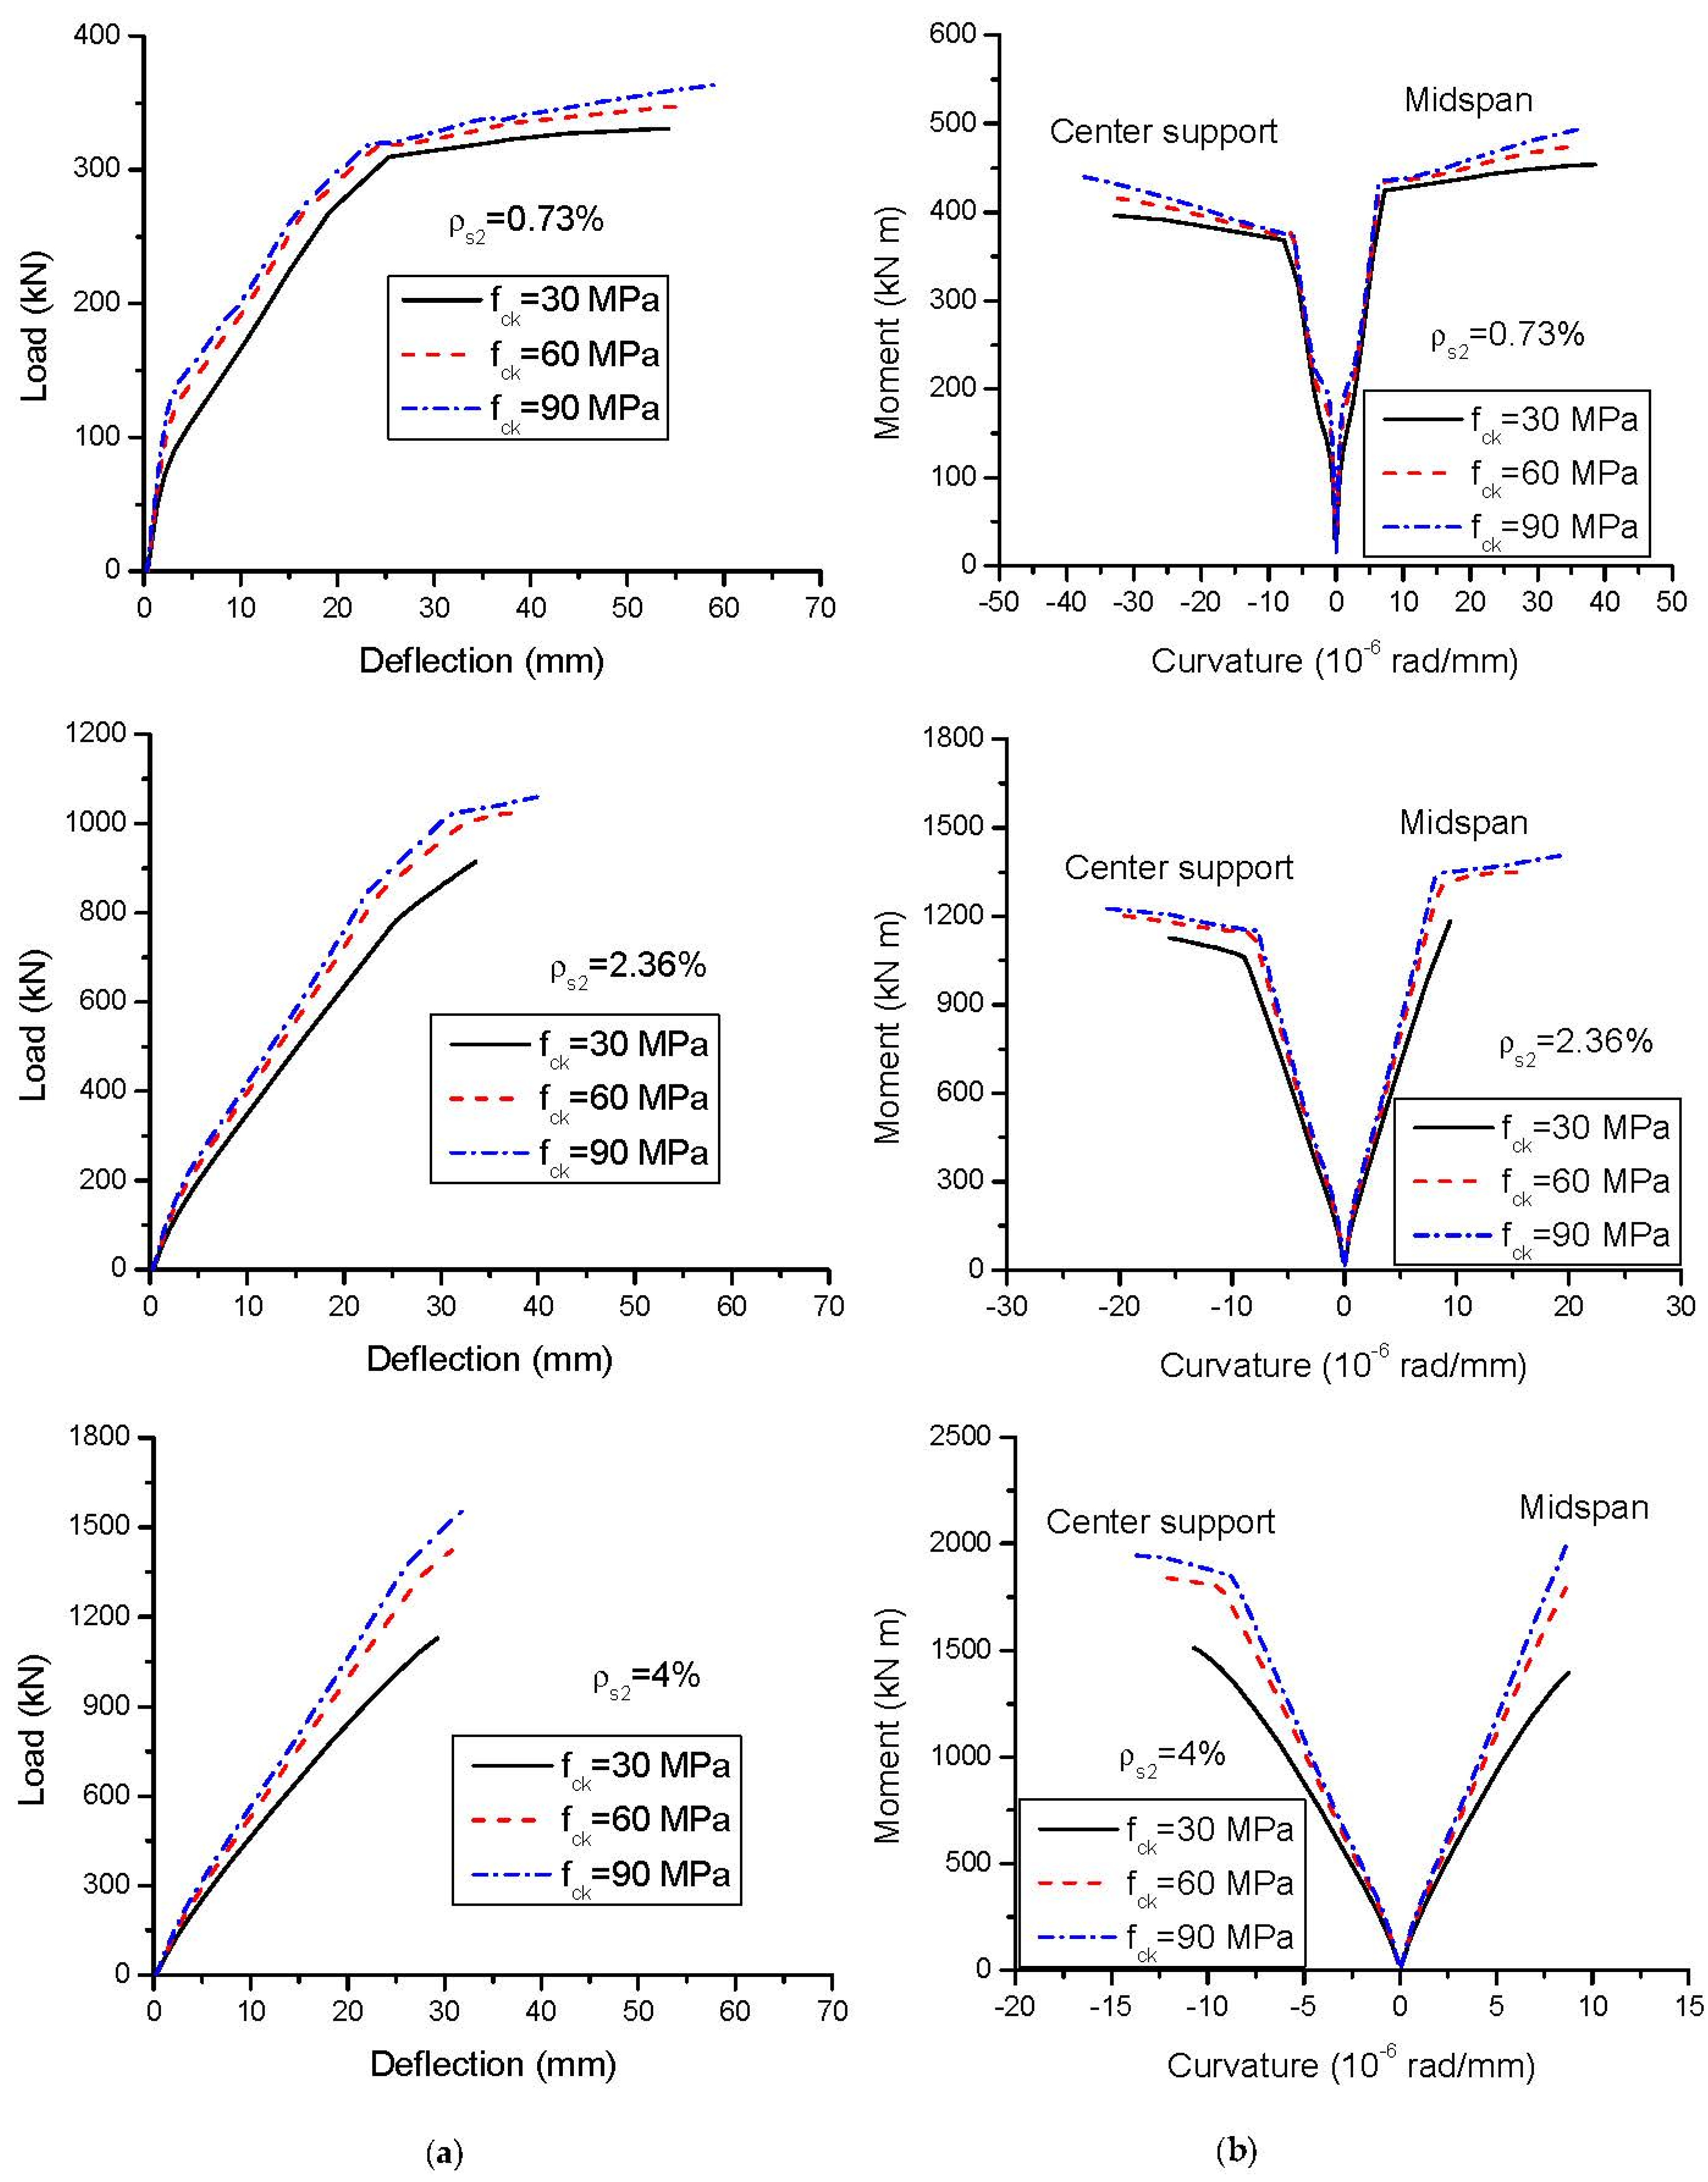
3.1. Load versus Deformation

Figure 5a,b show the load-deflection and moment–curvature curves of reinforced NSC and HSC beams with different steel ratios, respectively. Prior to final failure caused by concrete crushing at the critical section, the beams with a low steel ratio (e.g., ρs2 = 0.73%) typically experience several phases in sequence, i.e., first cracking at center support, second cracking at midspan, first yielding at center support and second yielding at midspan. As a result, these beams exhibit three distinct stages concerning the moment–curvature behavior of a cross-section (see Figure 5b), i.e., elastic stage, post-cracking stage and post-yielding stage. The load-deflection behavior appears to be primarily influenced by the second cracking and second yielding (see Figure 5a). In other words, the first cracking and first yielding do not have a notable impact on the load-deflection behavior of continuous beams. As the steel ratio increases, the rotational capacity of the beams decreases. When the steel ratio reaches or surpass the balanced ratio, plastic hinges over critical section(s) may not develop. For example, for reinforced NSC beams, there is no formation of plastic hinges at midspan when ρs2 = 2.36%, and at both midspan and center support when ρs2 = 4.0%. For reinforced HSC beams, plastic hinges do not occur at midspan when ρs2 = 4.0%, as evidenced by lack of post-yielding stage of the load-deflection behavior or moment–curvature behavior (midspan). Because of the higher tensile strength and elastic modulus of HSC, reinforced HSC beams exhibit higher cracking load and flexural stiffness than reinforced NSC beams.
The variation in ultimate load (Pu) and moment (Mu) with varying steel ratio for reinforced NSC and HSC beams is presented in Table 1 and Figure 6, respectively. At ρs2 = 0.73%, the discrepancy of ultimate load or moment between reinforced NSC and HSC beams is slight, attributed to the full development of both positive and negative plastic hinges in these beams. The increase in ultimate load or moment with increasing steel ratio is more pronounced for reinforced HSC beams than for reinforced NSC beams, attributed to the fact that reinforced HSC beams are able to better develop plastic hinges than reinforced NSC beams. As a result, at a high steel ratio (e.g., ρs2 = 4.0%), the ultimate load or moment of reinforced HSC beams is substantially higher than that of reinforced NSC beams. The variation in ultimate deflection (Δu) with varying steel ratio for reinforced NSC and HSC beams is presented in Figure 7 and Table 1. It is seen that the ultimate deflection decreases with increasing steel ratio. For a given steel ratio, the ultimate deflection of reinforced HSC beams is higher than that of reinforced NSC beam.
The flexural ductility can be quantified by
μ κ = κ u κ y
where μκ is the curvature ductility factor; κu and κy are curvature at ultimate and yielding, respectively. The values of κy, κu, and μκ (center support) are presented in Table 1. Figure 8 shows the variation in curvature ductility factor with varying steel ratio for reinforced NSC and HSC beams. The higher the steel ratio, the lower the flexural ductility. Despite the higher brittleness of HSC material, reinforced HSC beams exhibits better ductile behavior than reinforced NSC beams. The ductility factors of reinforced HSC beams with fck = 60 and 90 MPa are 1.11–1.55 and 1.21–1.91 times that of reinforced NSC beams (fck = 30 MPa), respectively.

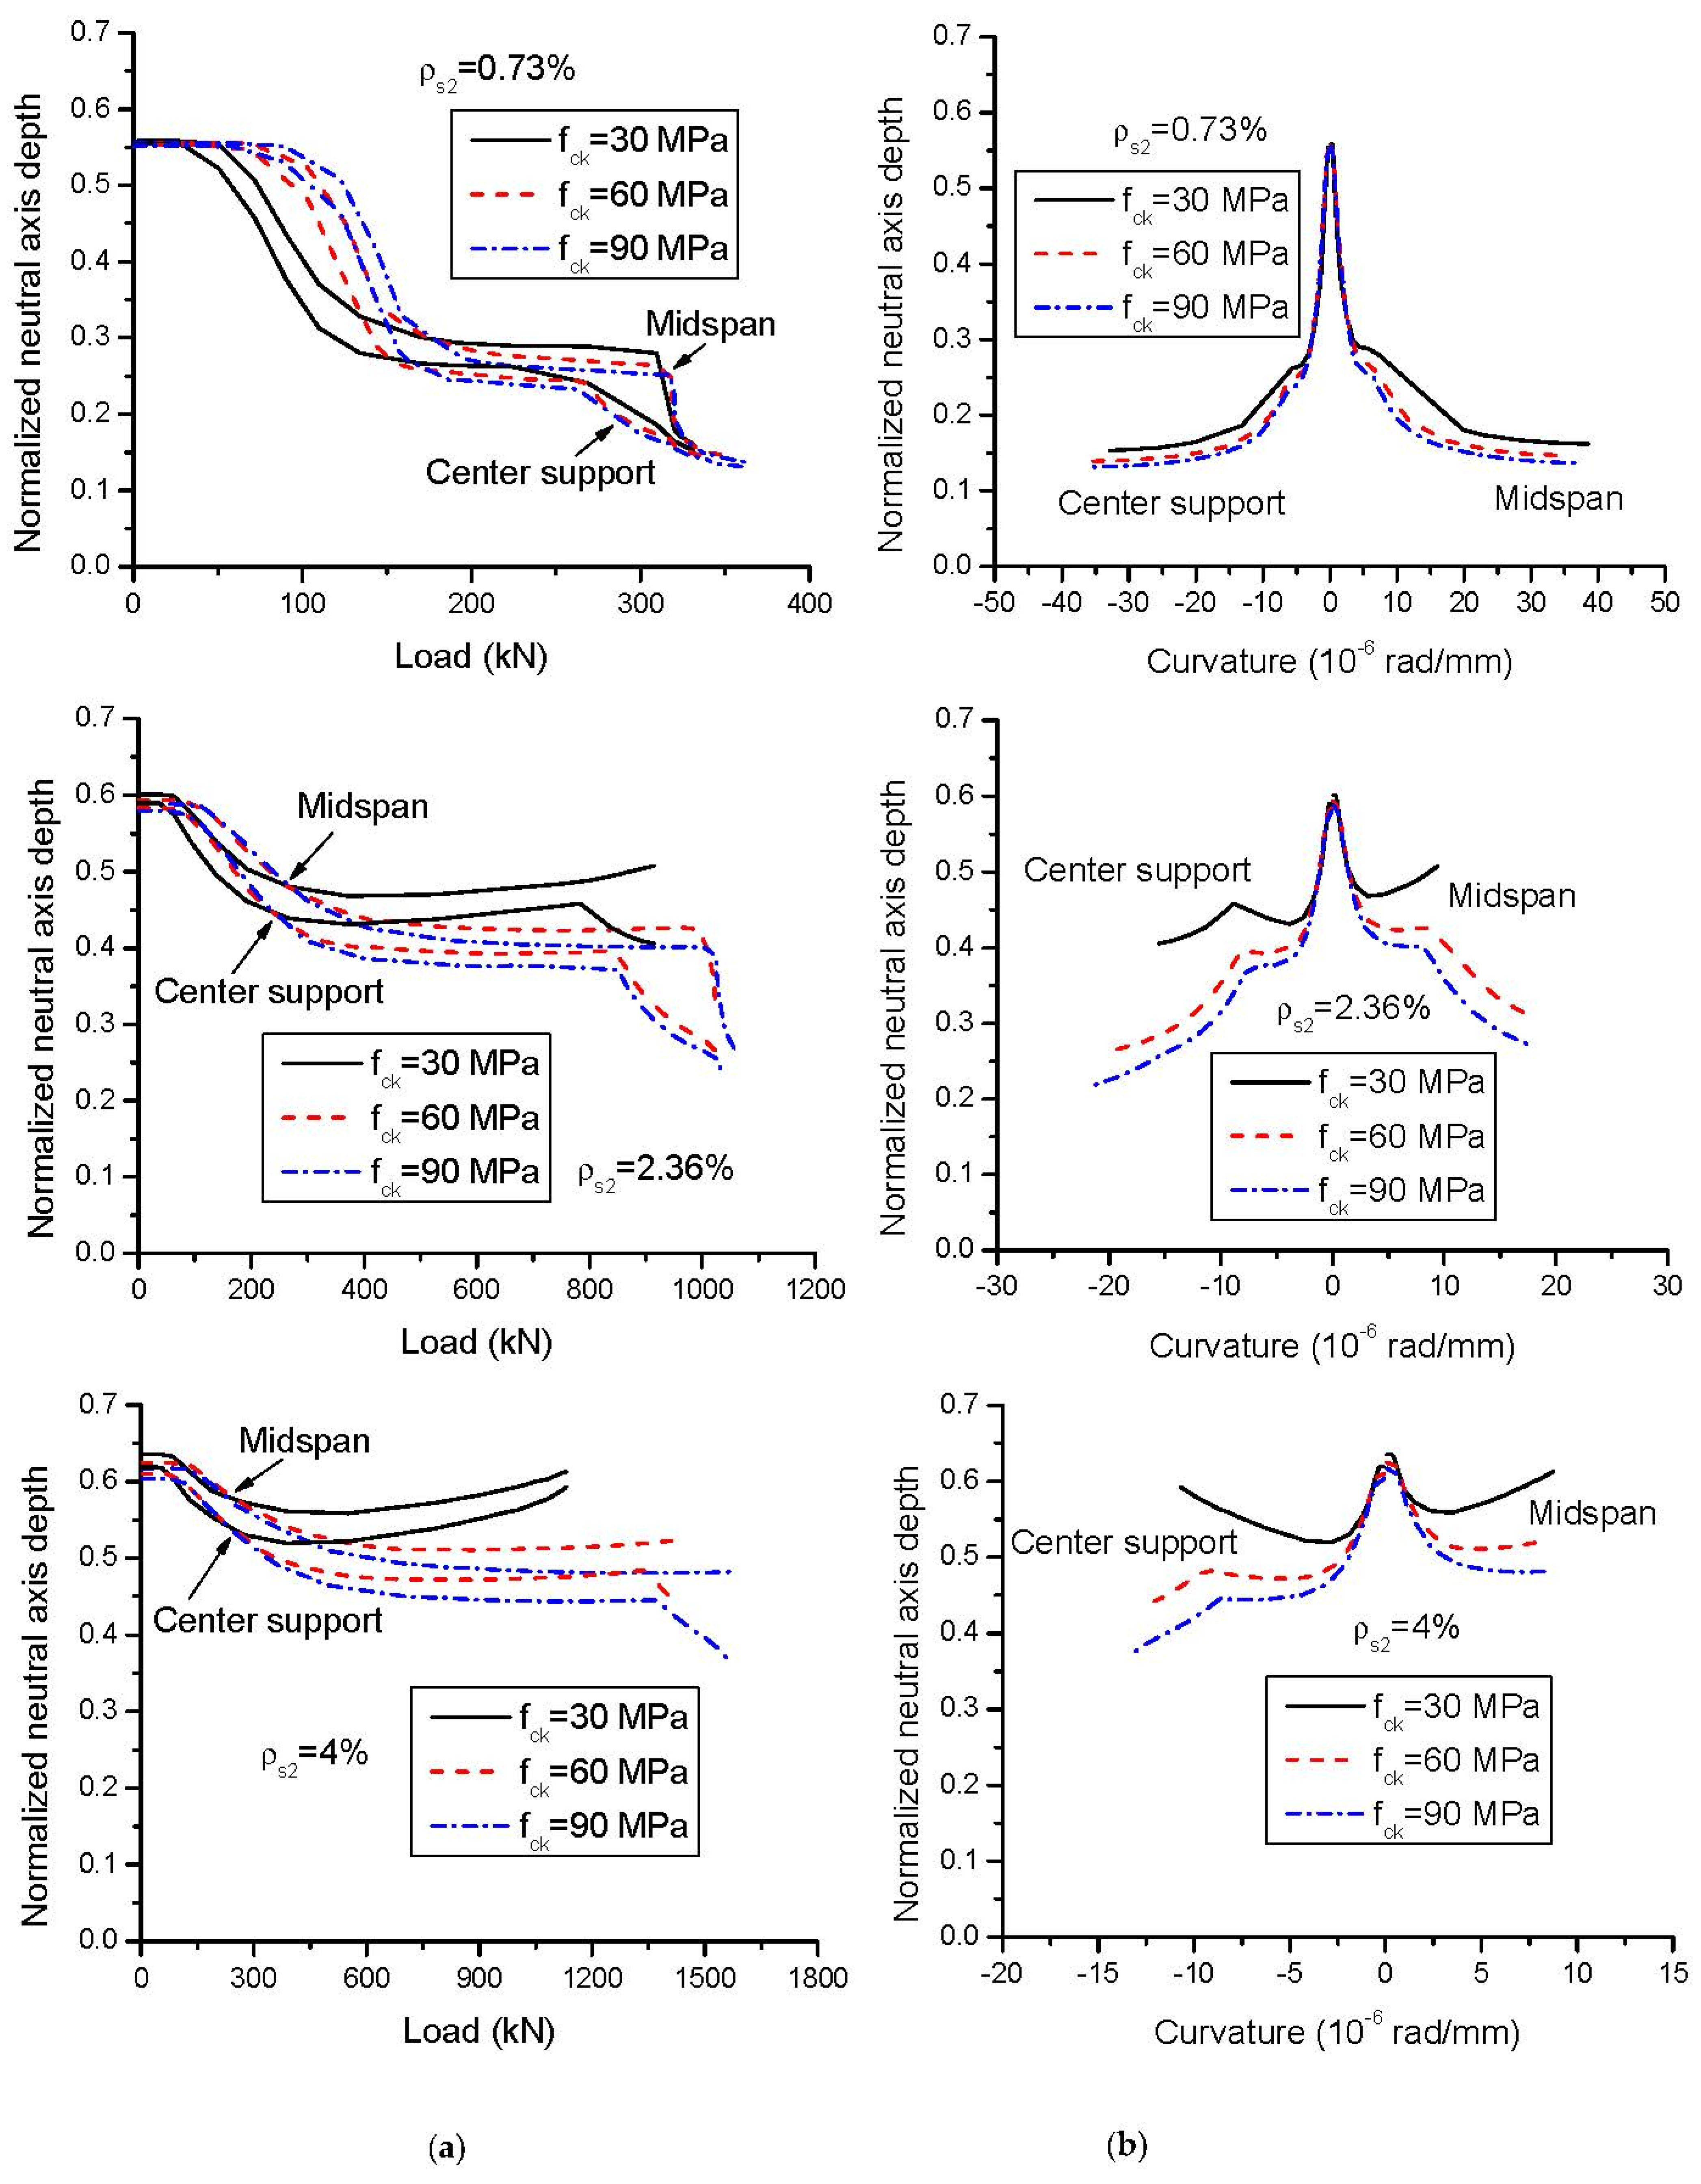
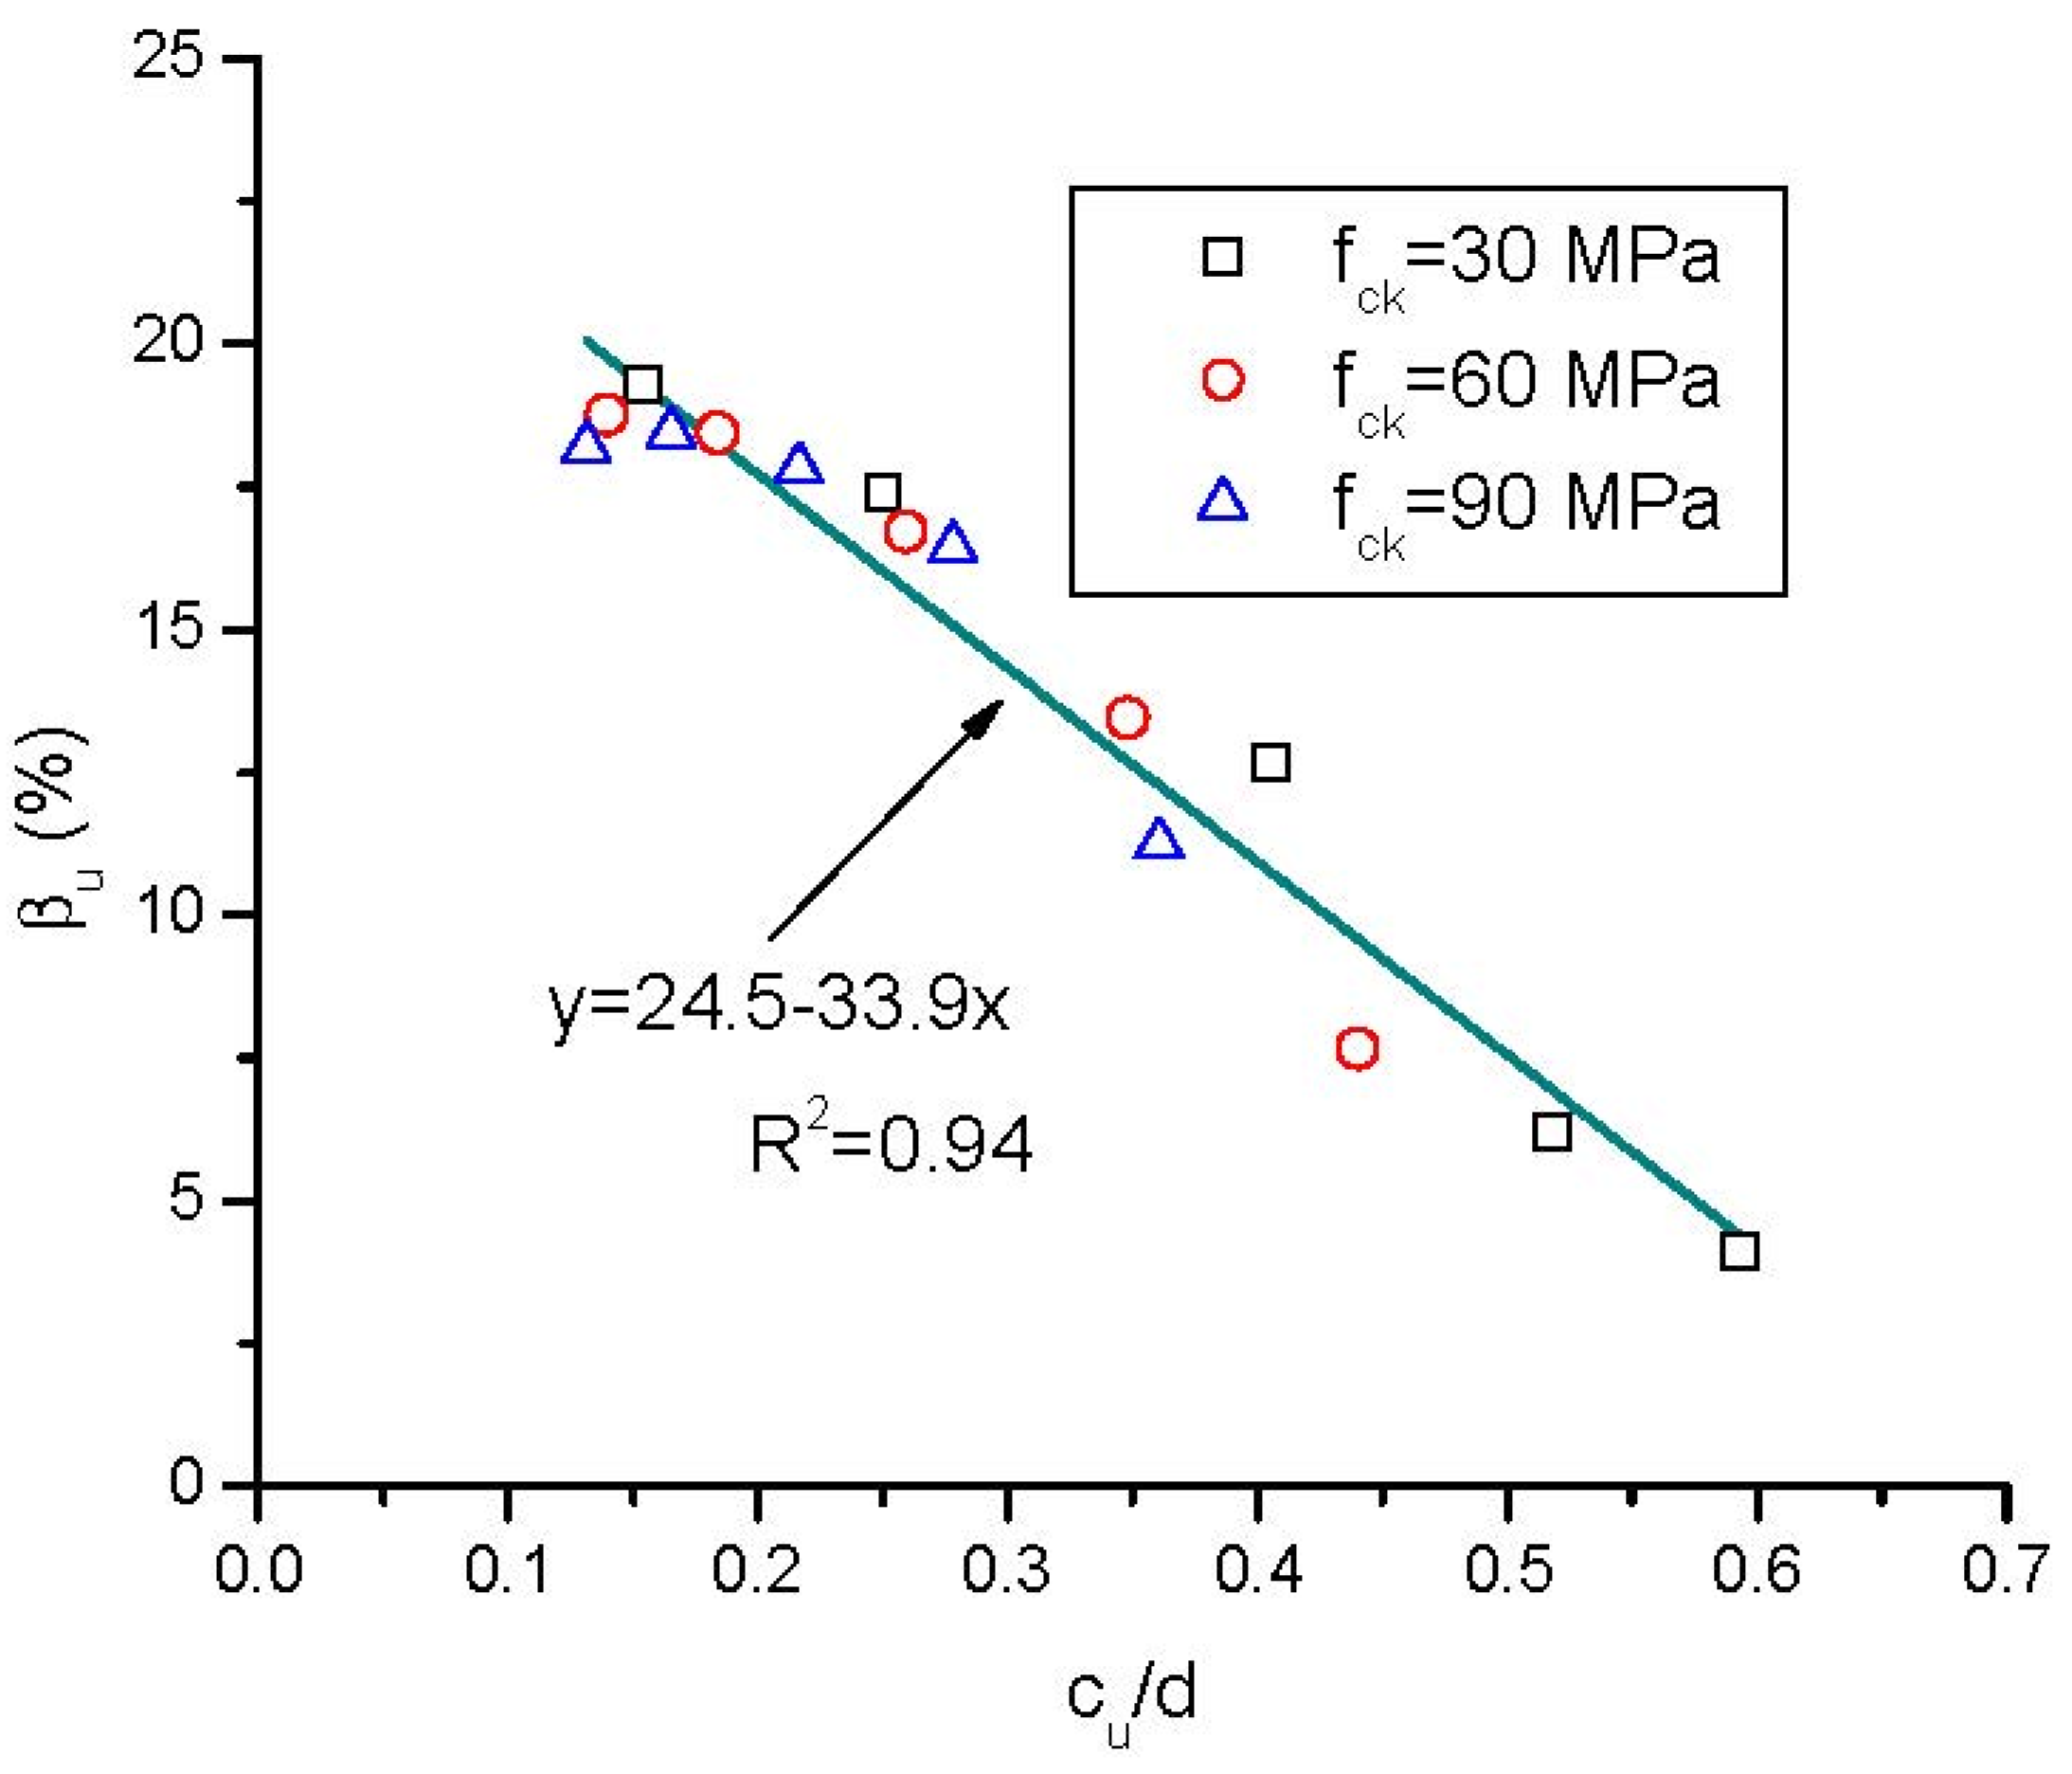
3.2. Neutral Axis Depth

Figure 9a shows the load versus normalized neutral axis depth relationship for reinforced NSC and HSC beams with different steel ratios. The normalized neutral axis depth is defined as the ratio of neutral axis depth to the effective depth of a cross section. The neutral axis depth is calculated according to the concrete strain at the extreme compressive fiber and the curvature of a cross section. Prior to cracking, the neutral axis does not shift, locating at the centroidal axis of a cross section (transformed section). For a given steel ratio, the equivalent concrete area contributed by steel bars for reinforced HSC beams is smaller than that of reinforced NSC ones. As a result, the initial neutral axis depth in reinforced HSC beams is lower than that in reinforced NSC beams. The difference is noticeable at a high steel ratio (e.g., ρs2 = 4.0%) but marginal at a low steel ratio (e.g., ρs2 = 0.73%). At a given load level, there is a larger neutral axis depth at midspan compared to that at center support due to a higher steel ratio. Figure 9b shows the curvature versus normalized neutral axis depth relationship for reinforced NSC and HSC beams with different steel ratios. The behavior is markedly influenced by concrete cracking and steel yielding. At a given curvature over the post-cracking stage, reinforced HSC beams exhibit lower neutral axis depth than reinforced NSC beams.
The variation in neutral axis depth at ultimate (cu/d) with varying steel ratio for reinforced NSC and HSC beams is shown in Figure 10. The values of cu/d are also presented in Table 1. For a low steel ratio, the cu/d difference between reinforced NSC and HSC beams is slight, e.g., at ρs2 = 0.73%, cu/d = 0.15, 0.14 and 0.13 for fck = 30, 60 and 90 MPa, respectively. The increase in cu/d with increasing steel ratio for reinforced HSC beams is less pronounced than that for reinforced NSC beams. As a result, reinforced HSC beams show smaller cu/d than reinforced NSC beams, especially notable at a high steel ratio. At ρs2 = 4.0%, the cu/d values of reinforced HSC beams with fck = 60 and 90 MPa are 74% and 61% of that of reinforced NSC beams (fck = 30 MPa).
Figure 11 shows the μκ-cu/d relationship at the center support of reinforced NSC and HSC beams. The graph demonstrates that the ductility decreases as cu/d increases. According to the fit curve, the relationship between flexural ductility and neutral axis depth may be expressed as follows:
μ κ = 9.1 33.2 ( c u / d ) + 33.7 ( c u / d ) 2

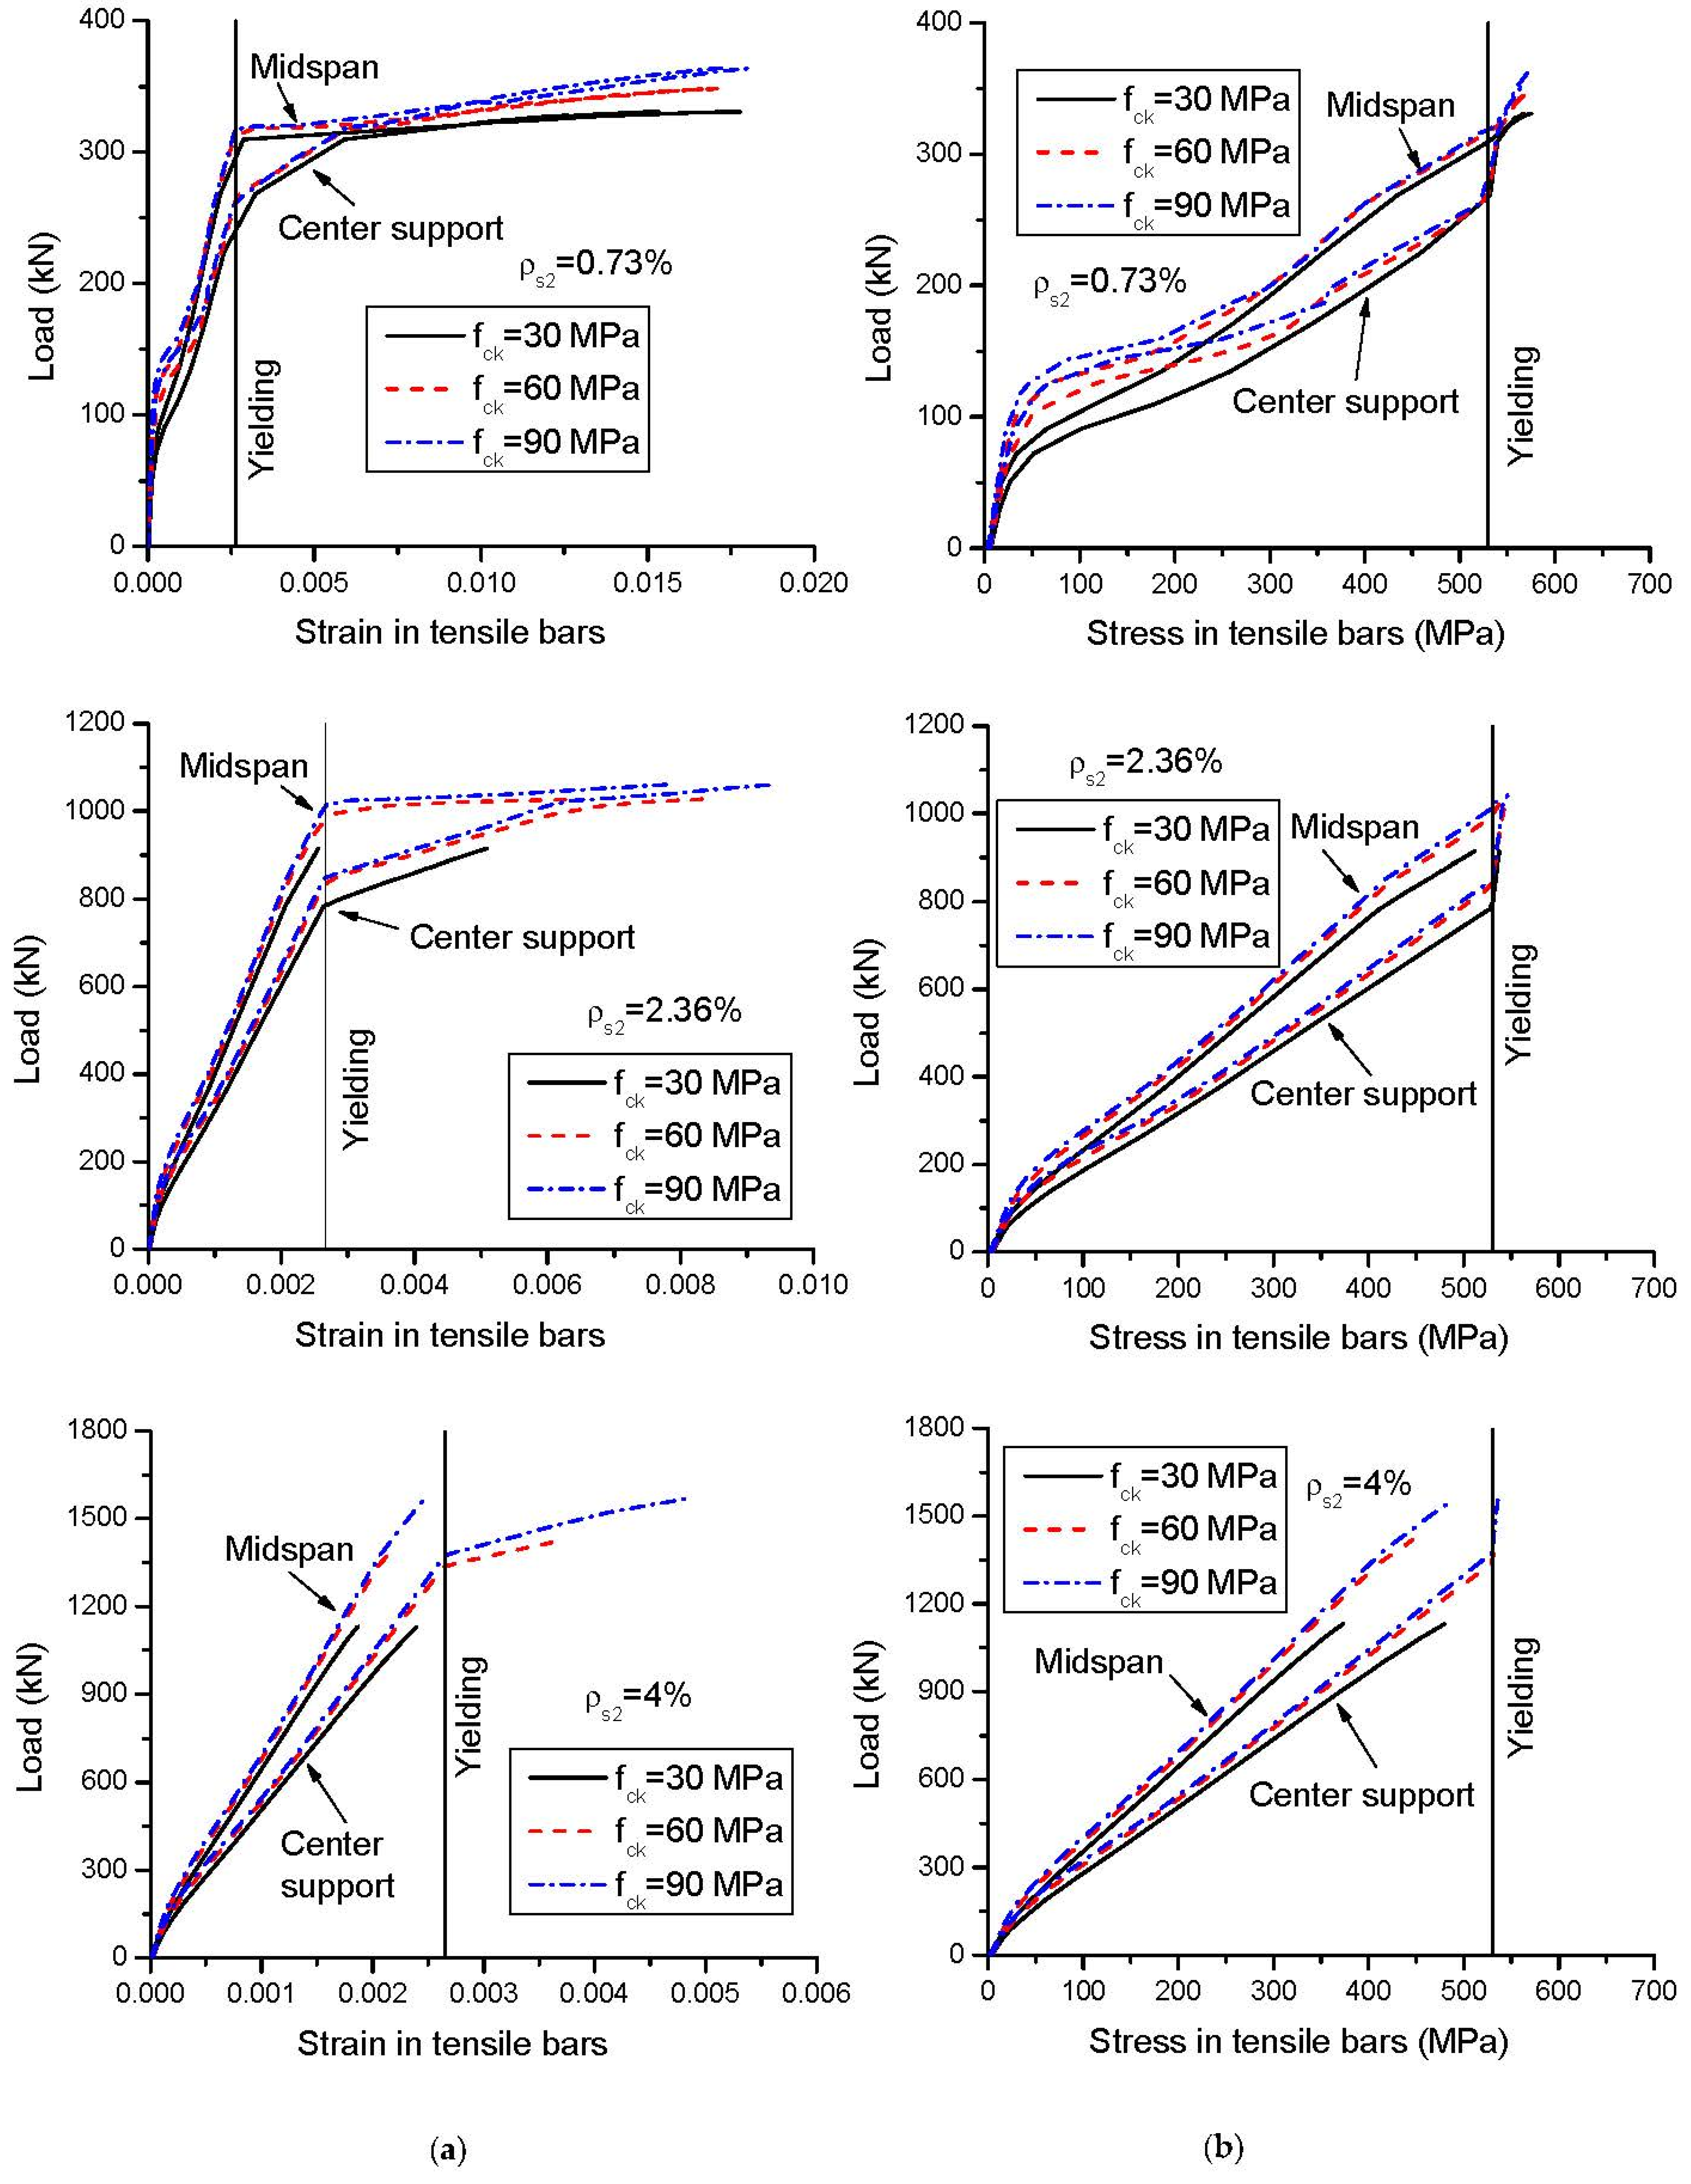
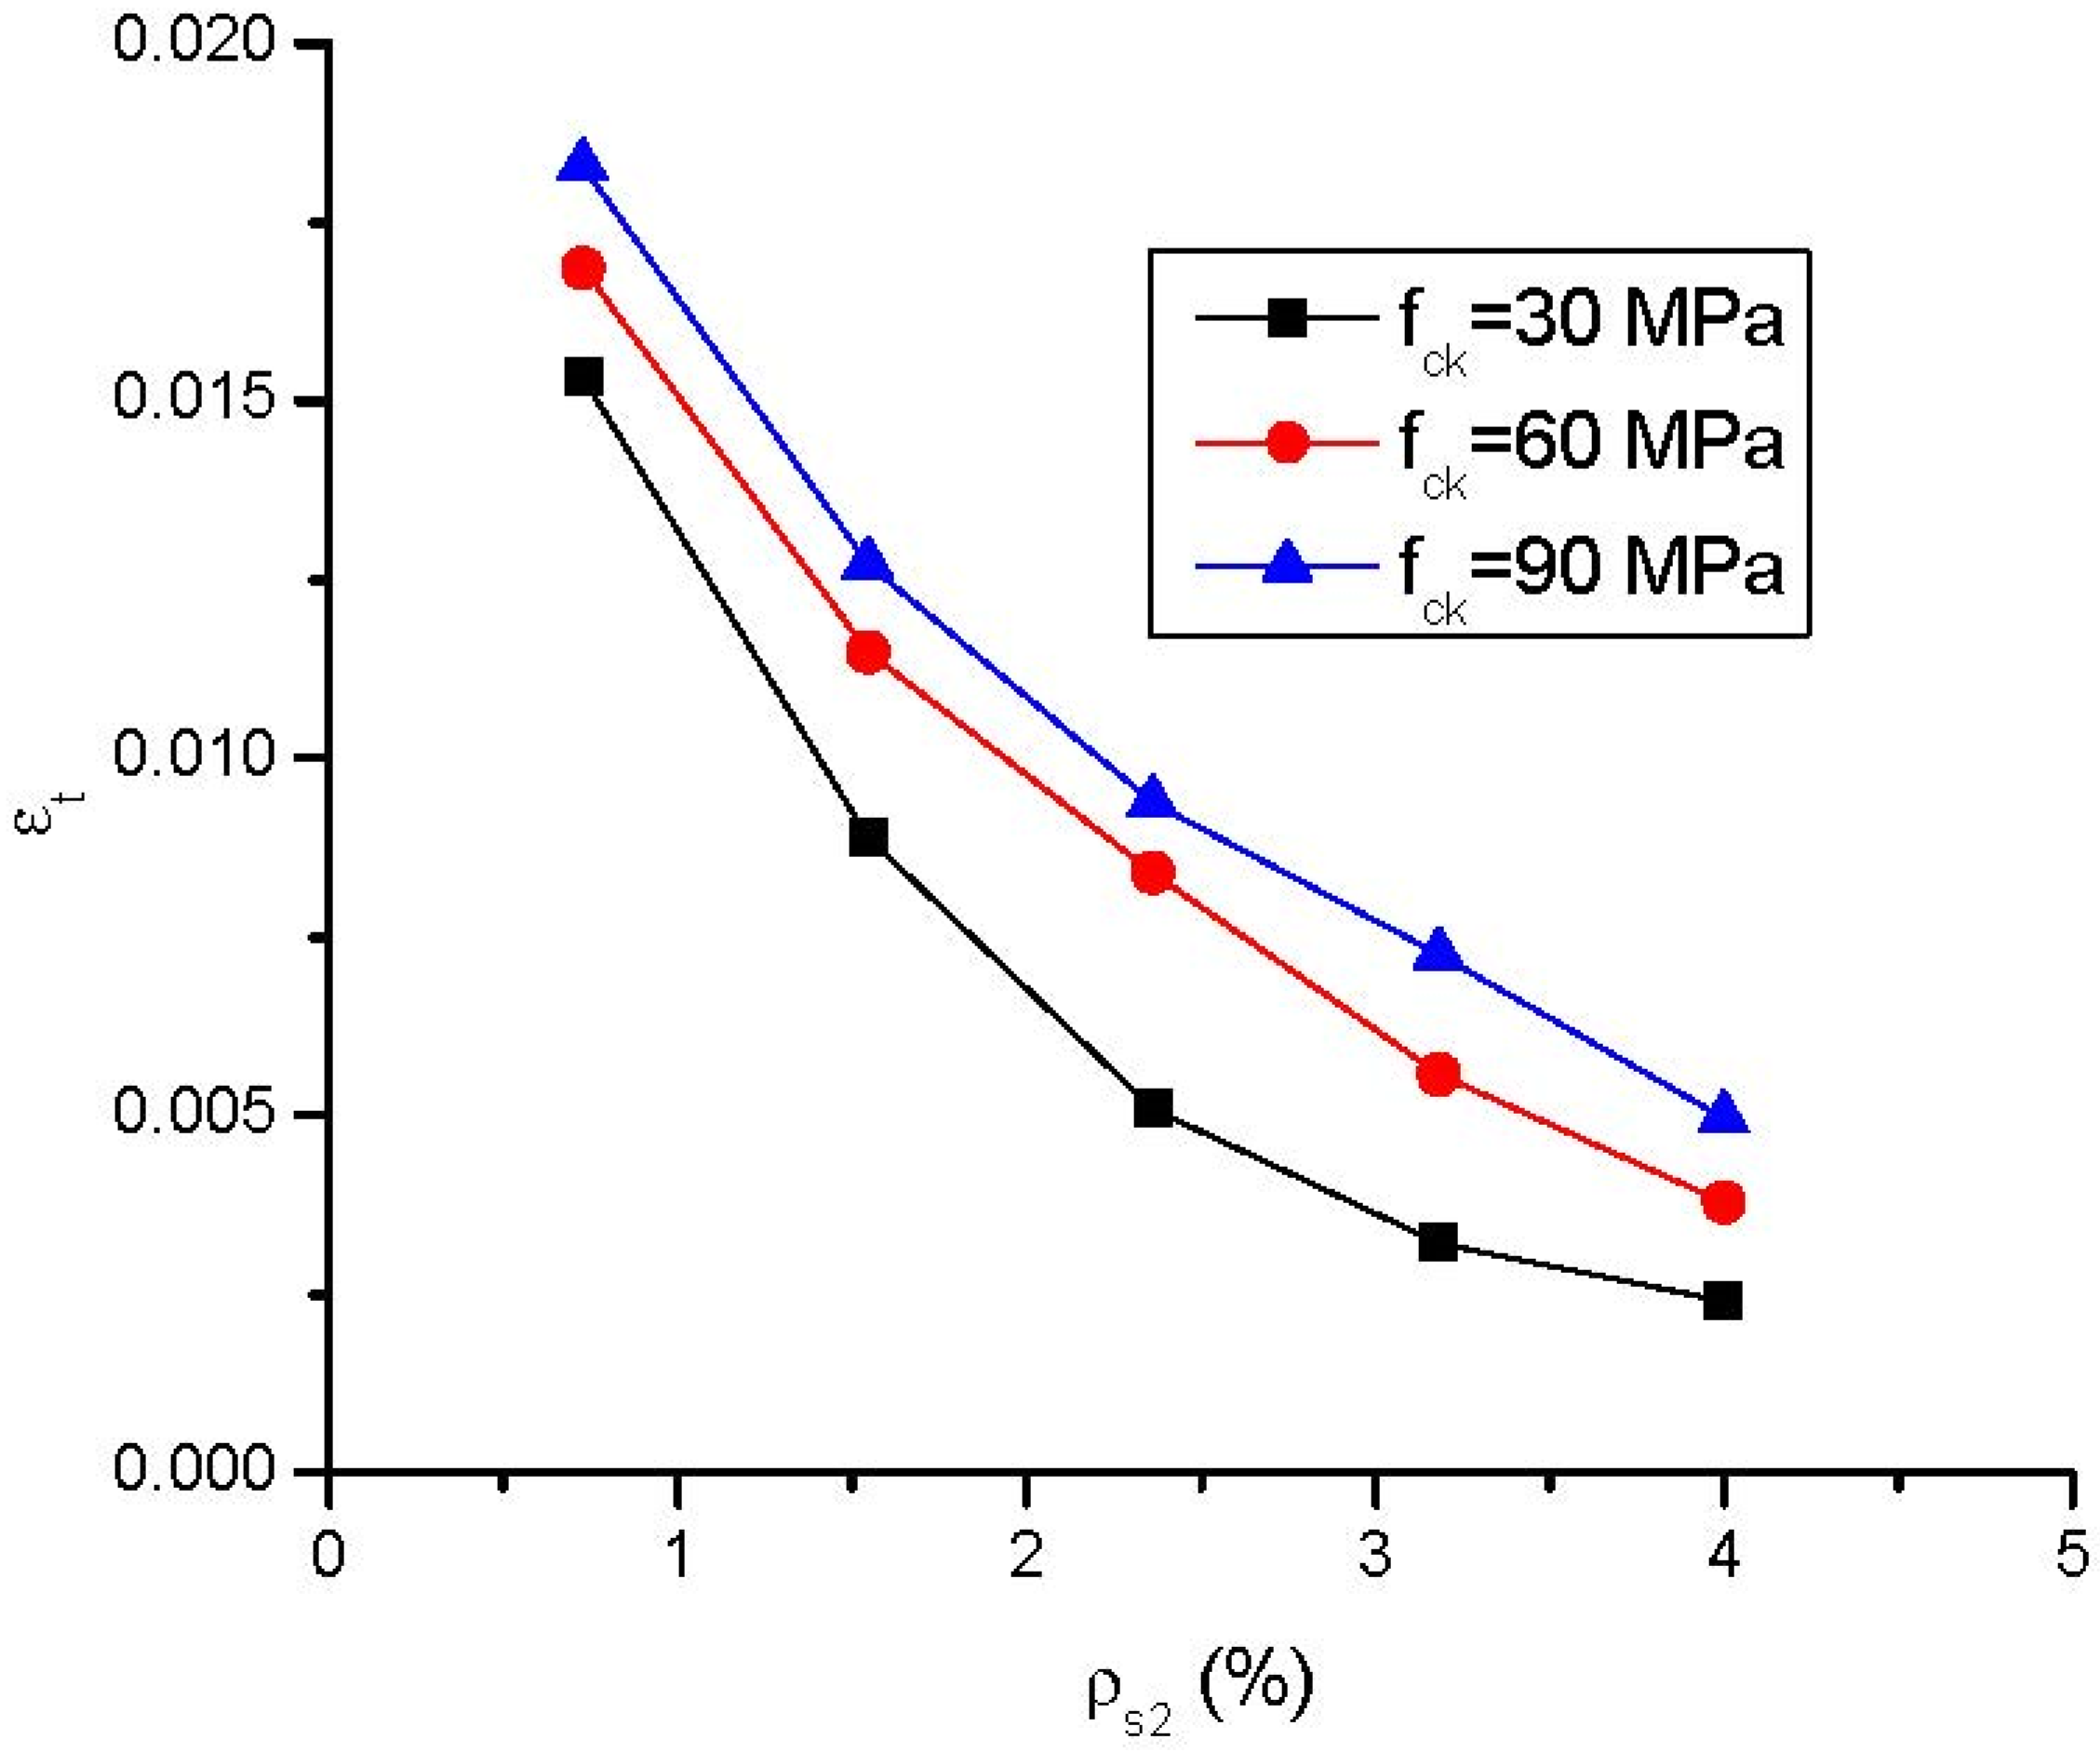
3.3. Strain and Stress in Steel Bars

Figure 12 shows the strain and stress developments of tensile steel bars in reinforced NSC and HSC beams with different steel ratios. As demonstrated in Figure 12a, yielding at center support leads to a significantly faster increase in the steel strain in this section but has practically no impact on the steel strain development at midspan. On the other hand, yielding at midspan (if any) increases significantly the strain development of steel bars at both midspan and center support. At a given service load level, HSC leads to a lower strain or stress in tensile steel bars than NSC. After the steel bars reach their yielding stress of 530 MPa, as demonstrated in Figure 12b, the increase in stress is very limited despite the substantial increase in strain in accordance with the stress–strain law of material.
The variation in strain in tensile steel bars at ultimate (εt) with varying steel ratio for reinforced NSC and HSC beams is presented in Figure 13 and Table 1. The value of εt decreases with increasing steel ratio. At a given steel ratio, HSC leads to a higher εt than NSC. The ultimate strains in tensile steel bars in reinforced HSC beams with fck = 60 and 90 MPa are 1.1–1.73 and 1.19–2.26 times that in reinforced NSC beams (fck = 30 MPa).
Figure 14 shows the μκ-εt relationship at the center support of reinforced NSC and HSC beams. It is seen that the ductility factor increases almost linearly with increasing εt. Based on the linear fit, the relationship between ductility factor and strain in tensile steel bars may be expressed by
μ κ = 0.011 + 324.8 ε t

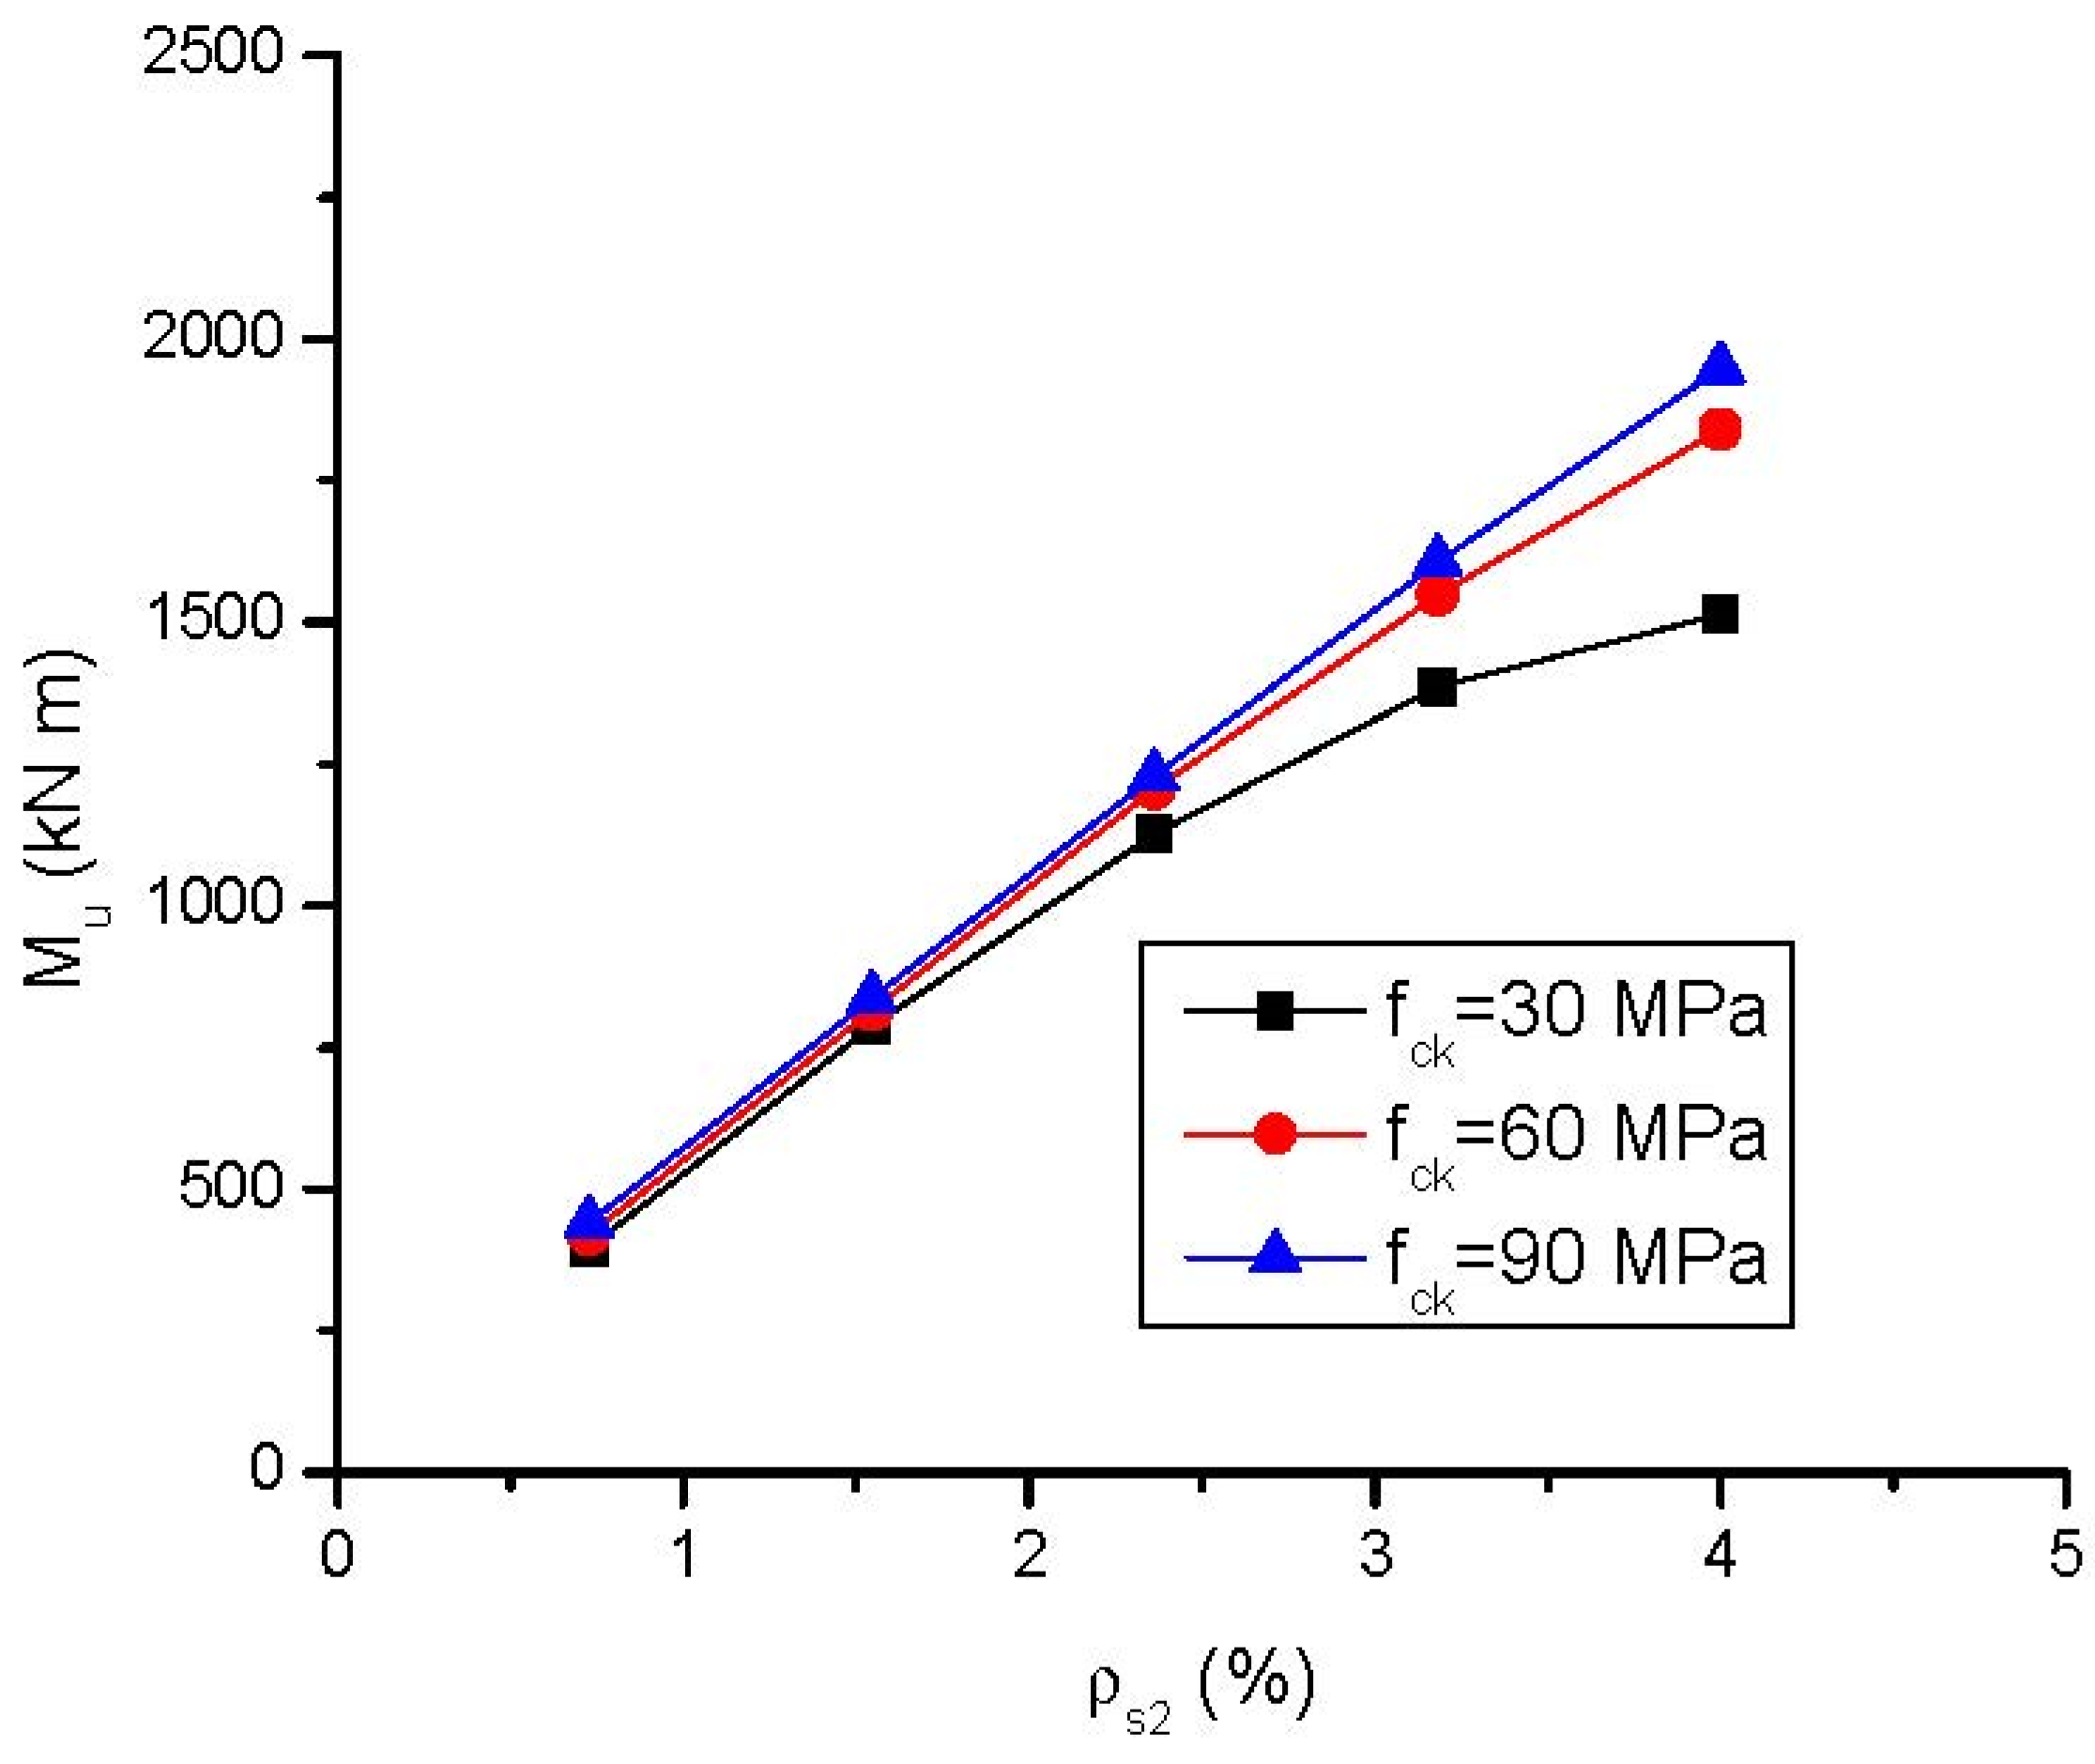
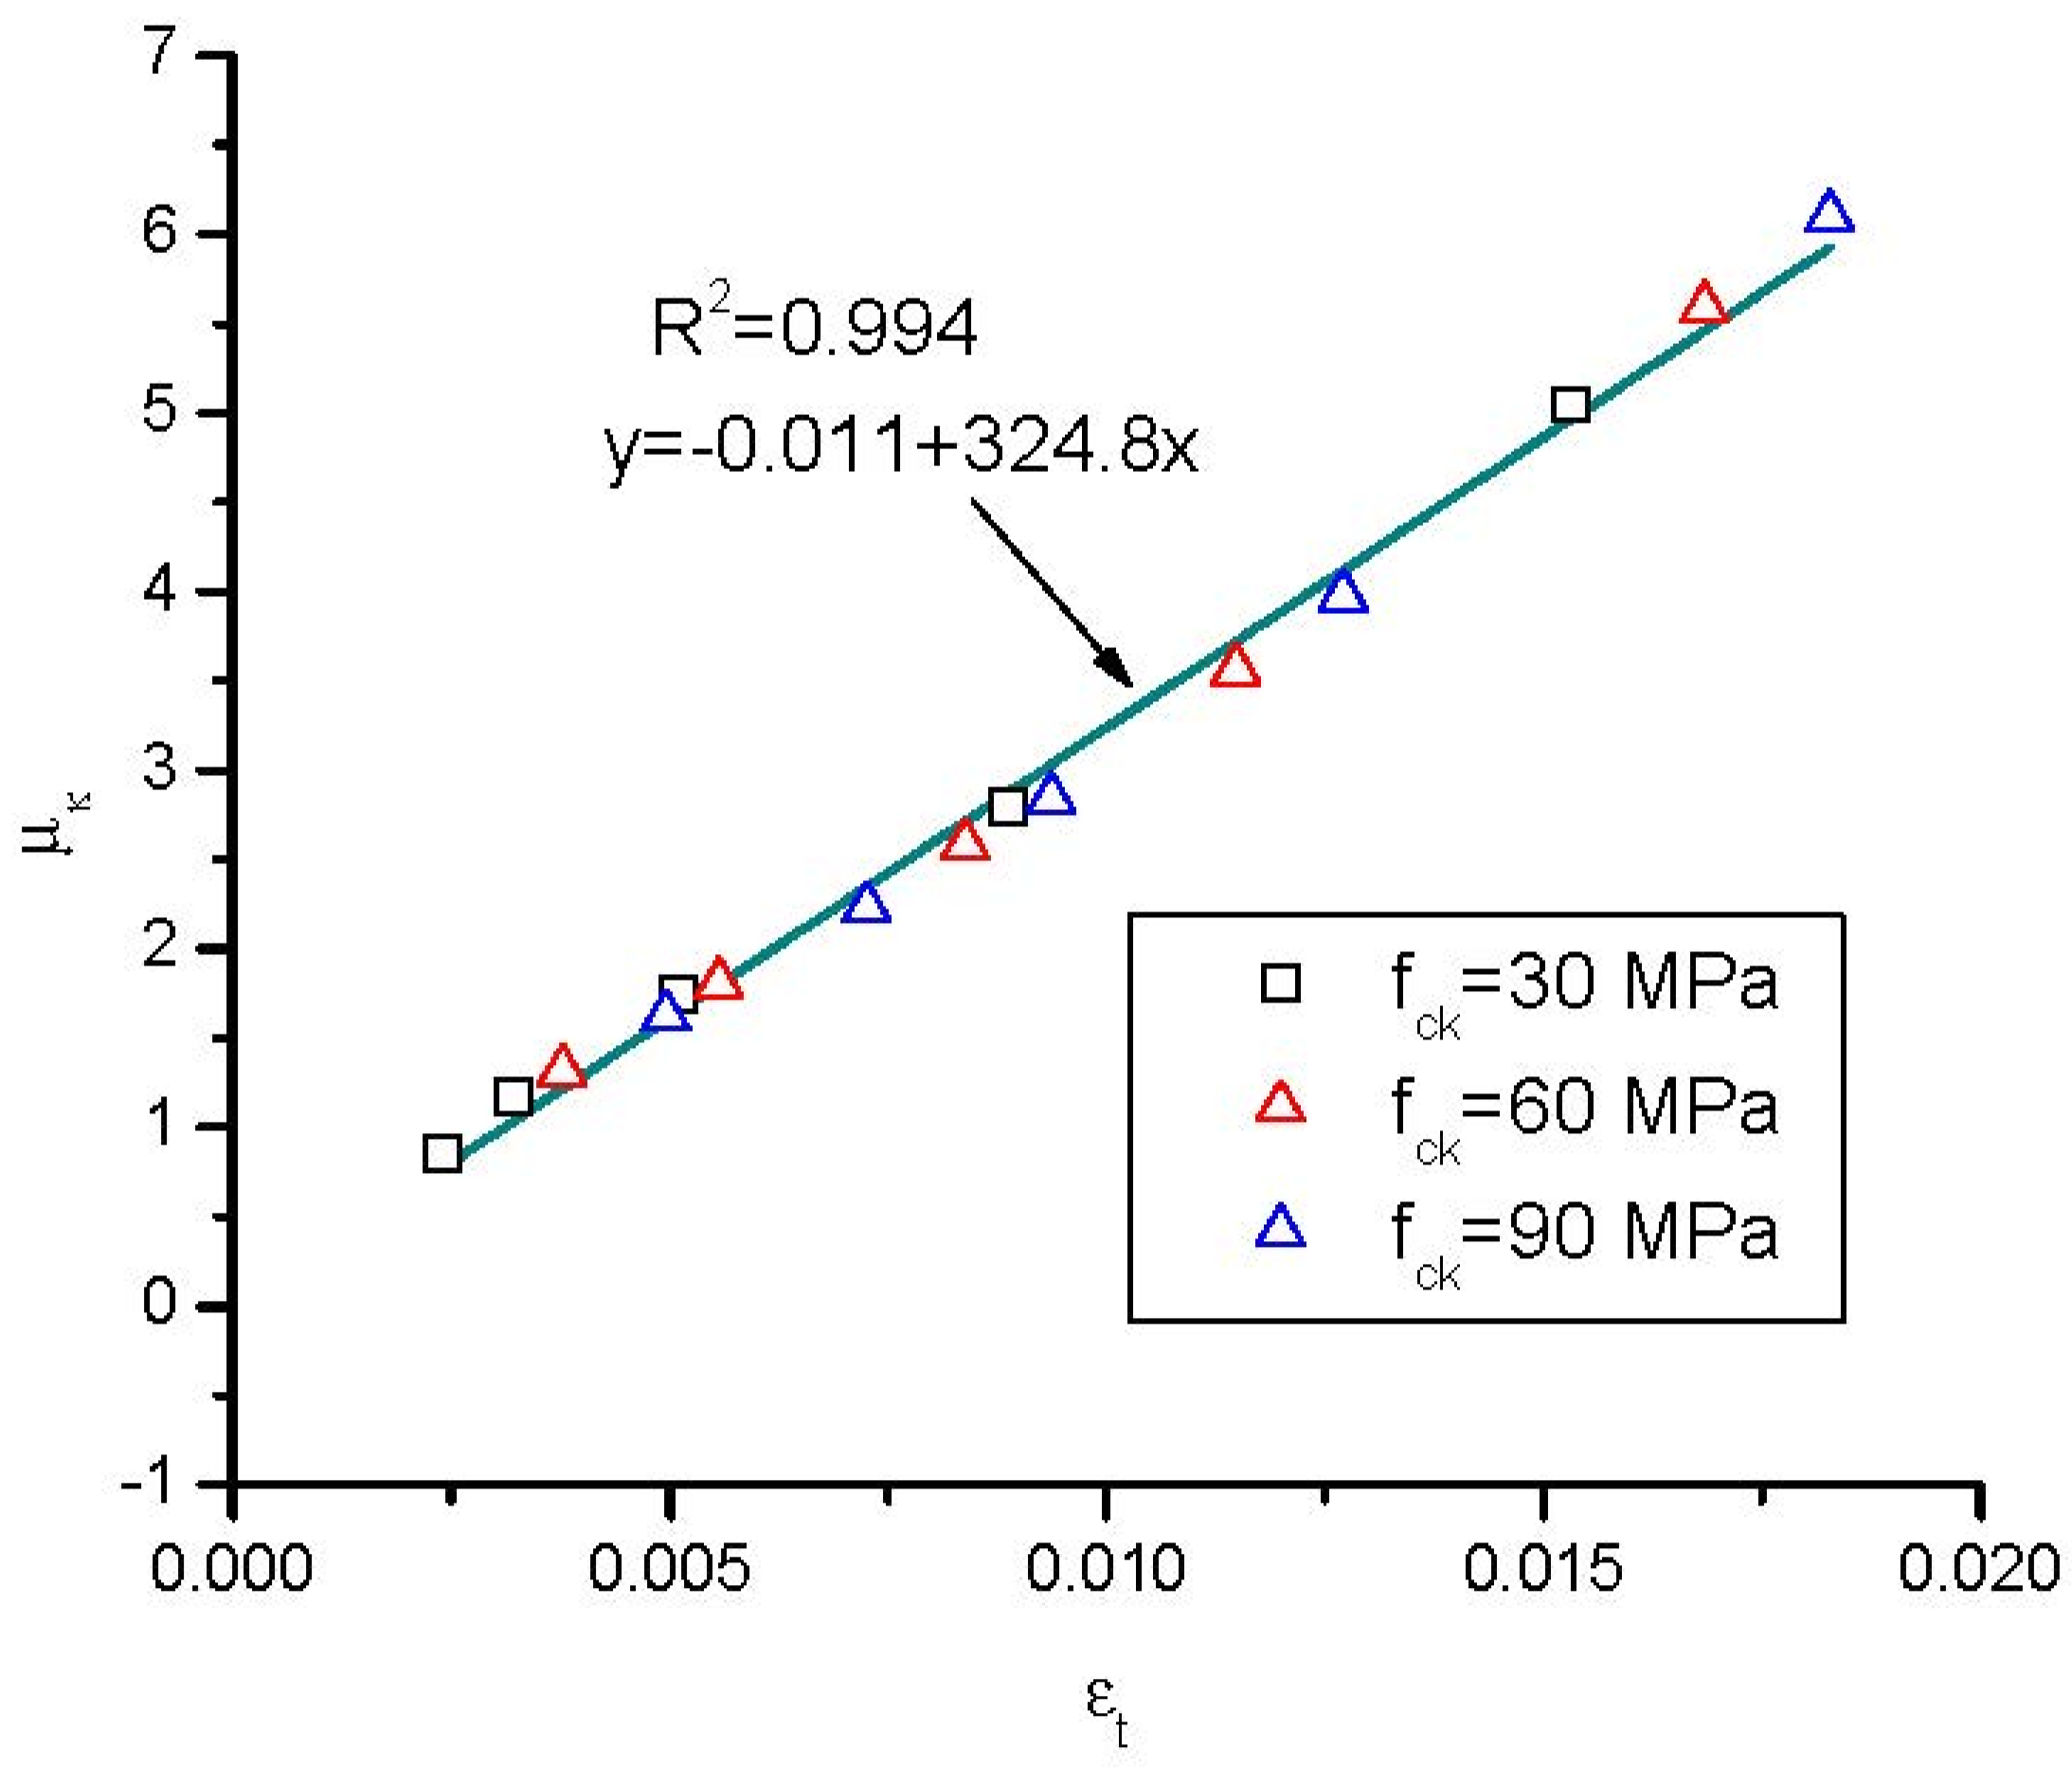
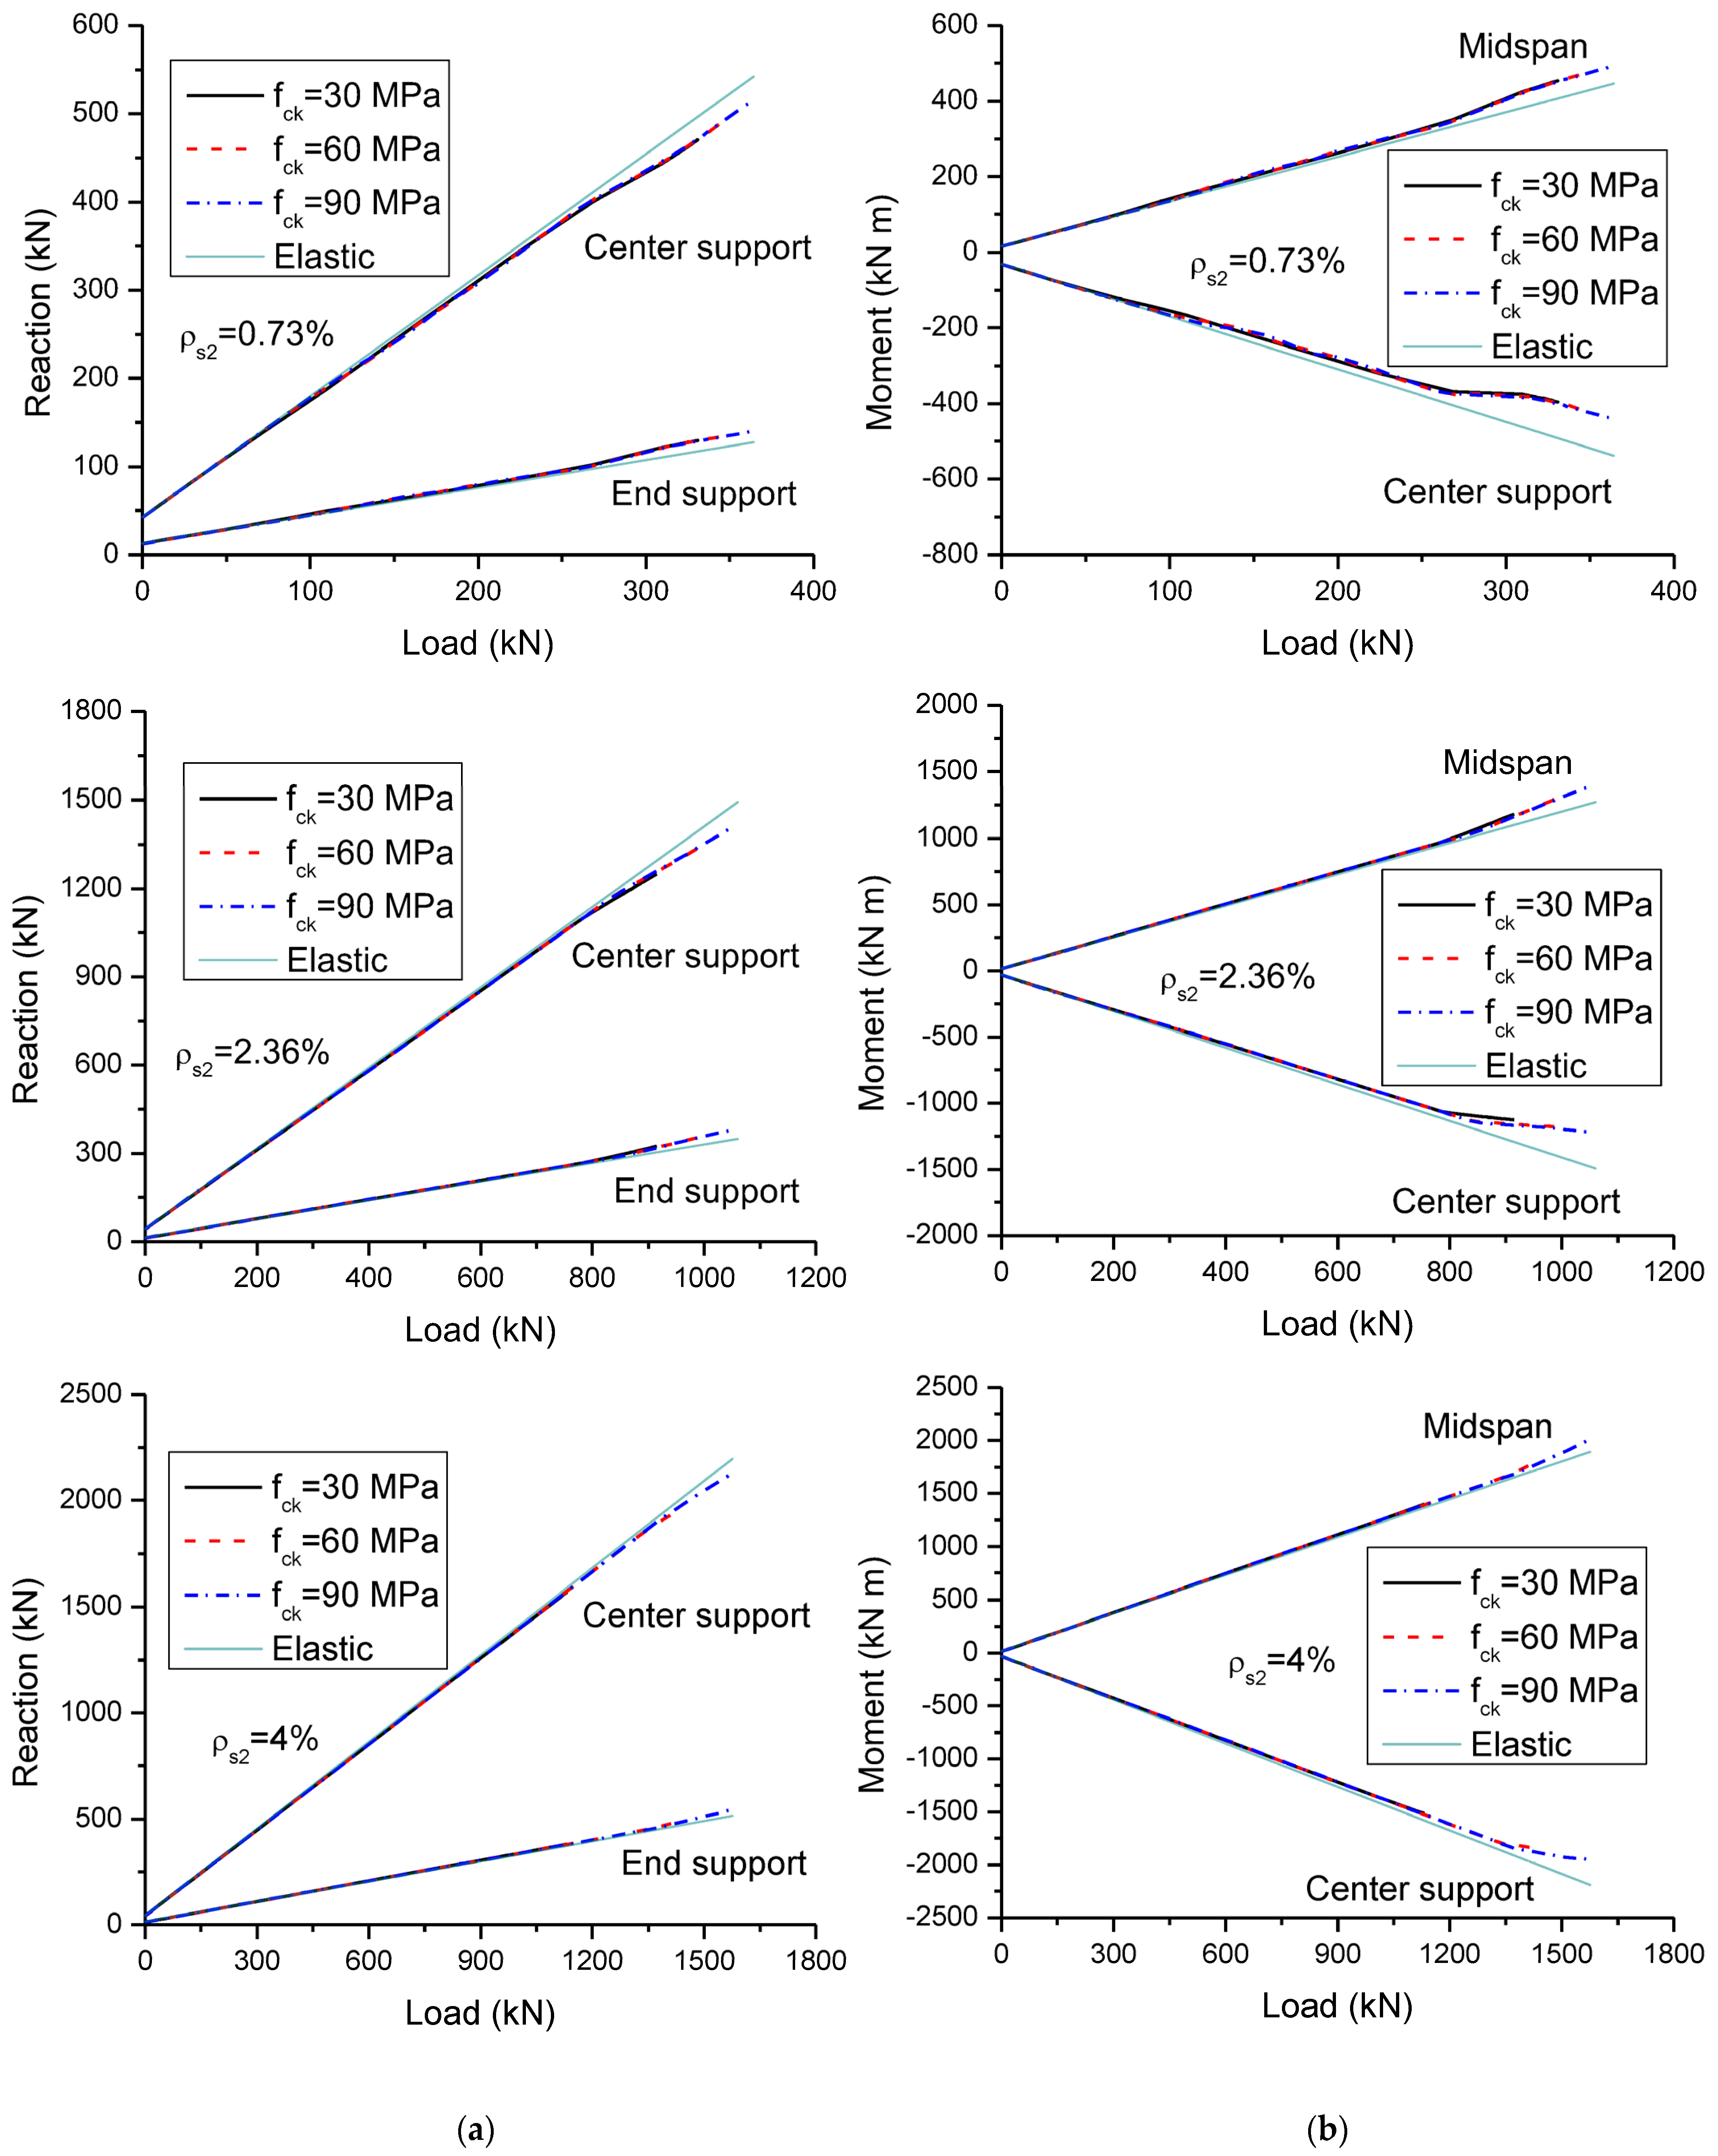
3.4. Moment Redistribution

Figure 15a,b demonstrate the developments of support reaction and bending moment for reinforced NSC and HSC beams with different steel ratios, respectively. In addition to the actual reactions or moments obtained by a nonlinear finite element analysis, the elastic ones are also plotted. The graphs show that the evolution of actual reactions or moments is identical to the elastic one until the first cracking of concrete. After that, the actual and elastic ones deviate because of redistribution of moments. This deviation is more pronounced for a lower steel ratio, indicating higher moment redistribution. For certain load level, the reaction or moment difference between reinforced NSC and HSC beams appears to be unimportant, indicating similar moment redistribution. However, the ultimate load of reinforced HSC beams may be significantly higher than that of reinforced NSC beams as discussed previously, indicating that moment redistribution at ultimate for reinforced NSC and HSC beam may be different.
The degree of moment redistribution at ultimate is expressed by
β u = 1 M u M e
where Mu and Me are ultimate and elastic moments, respectively.
Table 2 presents a list of Mu, Me and βu for reinforced NSC and HSC beams. Moment redistribution is negative at midspan and positive at center support. Moment redistribution at midspan is around 0.6 times that at center support. The change in moment redistribution with varying steel ratio for reinforced HSC beams appears to be less pronounced than that for reinforced NSC beams. Reinforced HSC beams generally exhibit higher moment redistribution than reinforced NSC beams, particularly at a high steel ratio. The explanation is that reinforced HSC beams exhibit better ductile behavior than reinforced NSC beams as discussed previously.
Figure 16 and Figure 17 show the βu-cu/d and βu-εt relationships at the center support of reinforced NSC and HSC beams, respectively. According to the fit curves, the moment redistribution may be related to the neutral axis depth by
β u ( % ) = 24.5 33.9 ( c u / d )
and to the strain in tensile steel bars by
β u ( % ) = 2.21 + 3263.5 ε t 120,054.4 ε t 2

4. Conclusions

Based on comprehensive assessments on continuous reinforced NSC and HSC beams with various tensile steel ratios by using a validated finite element method, the following conclusions are drawn:
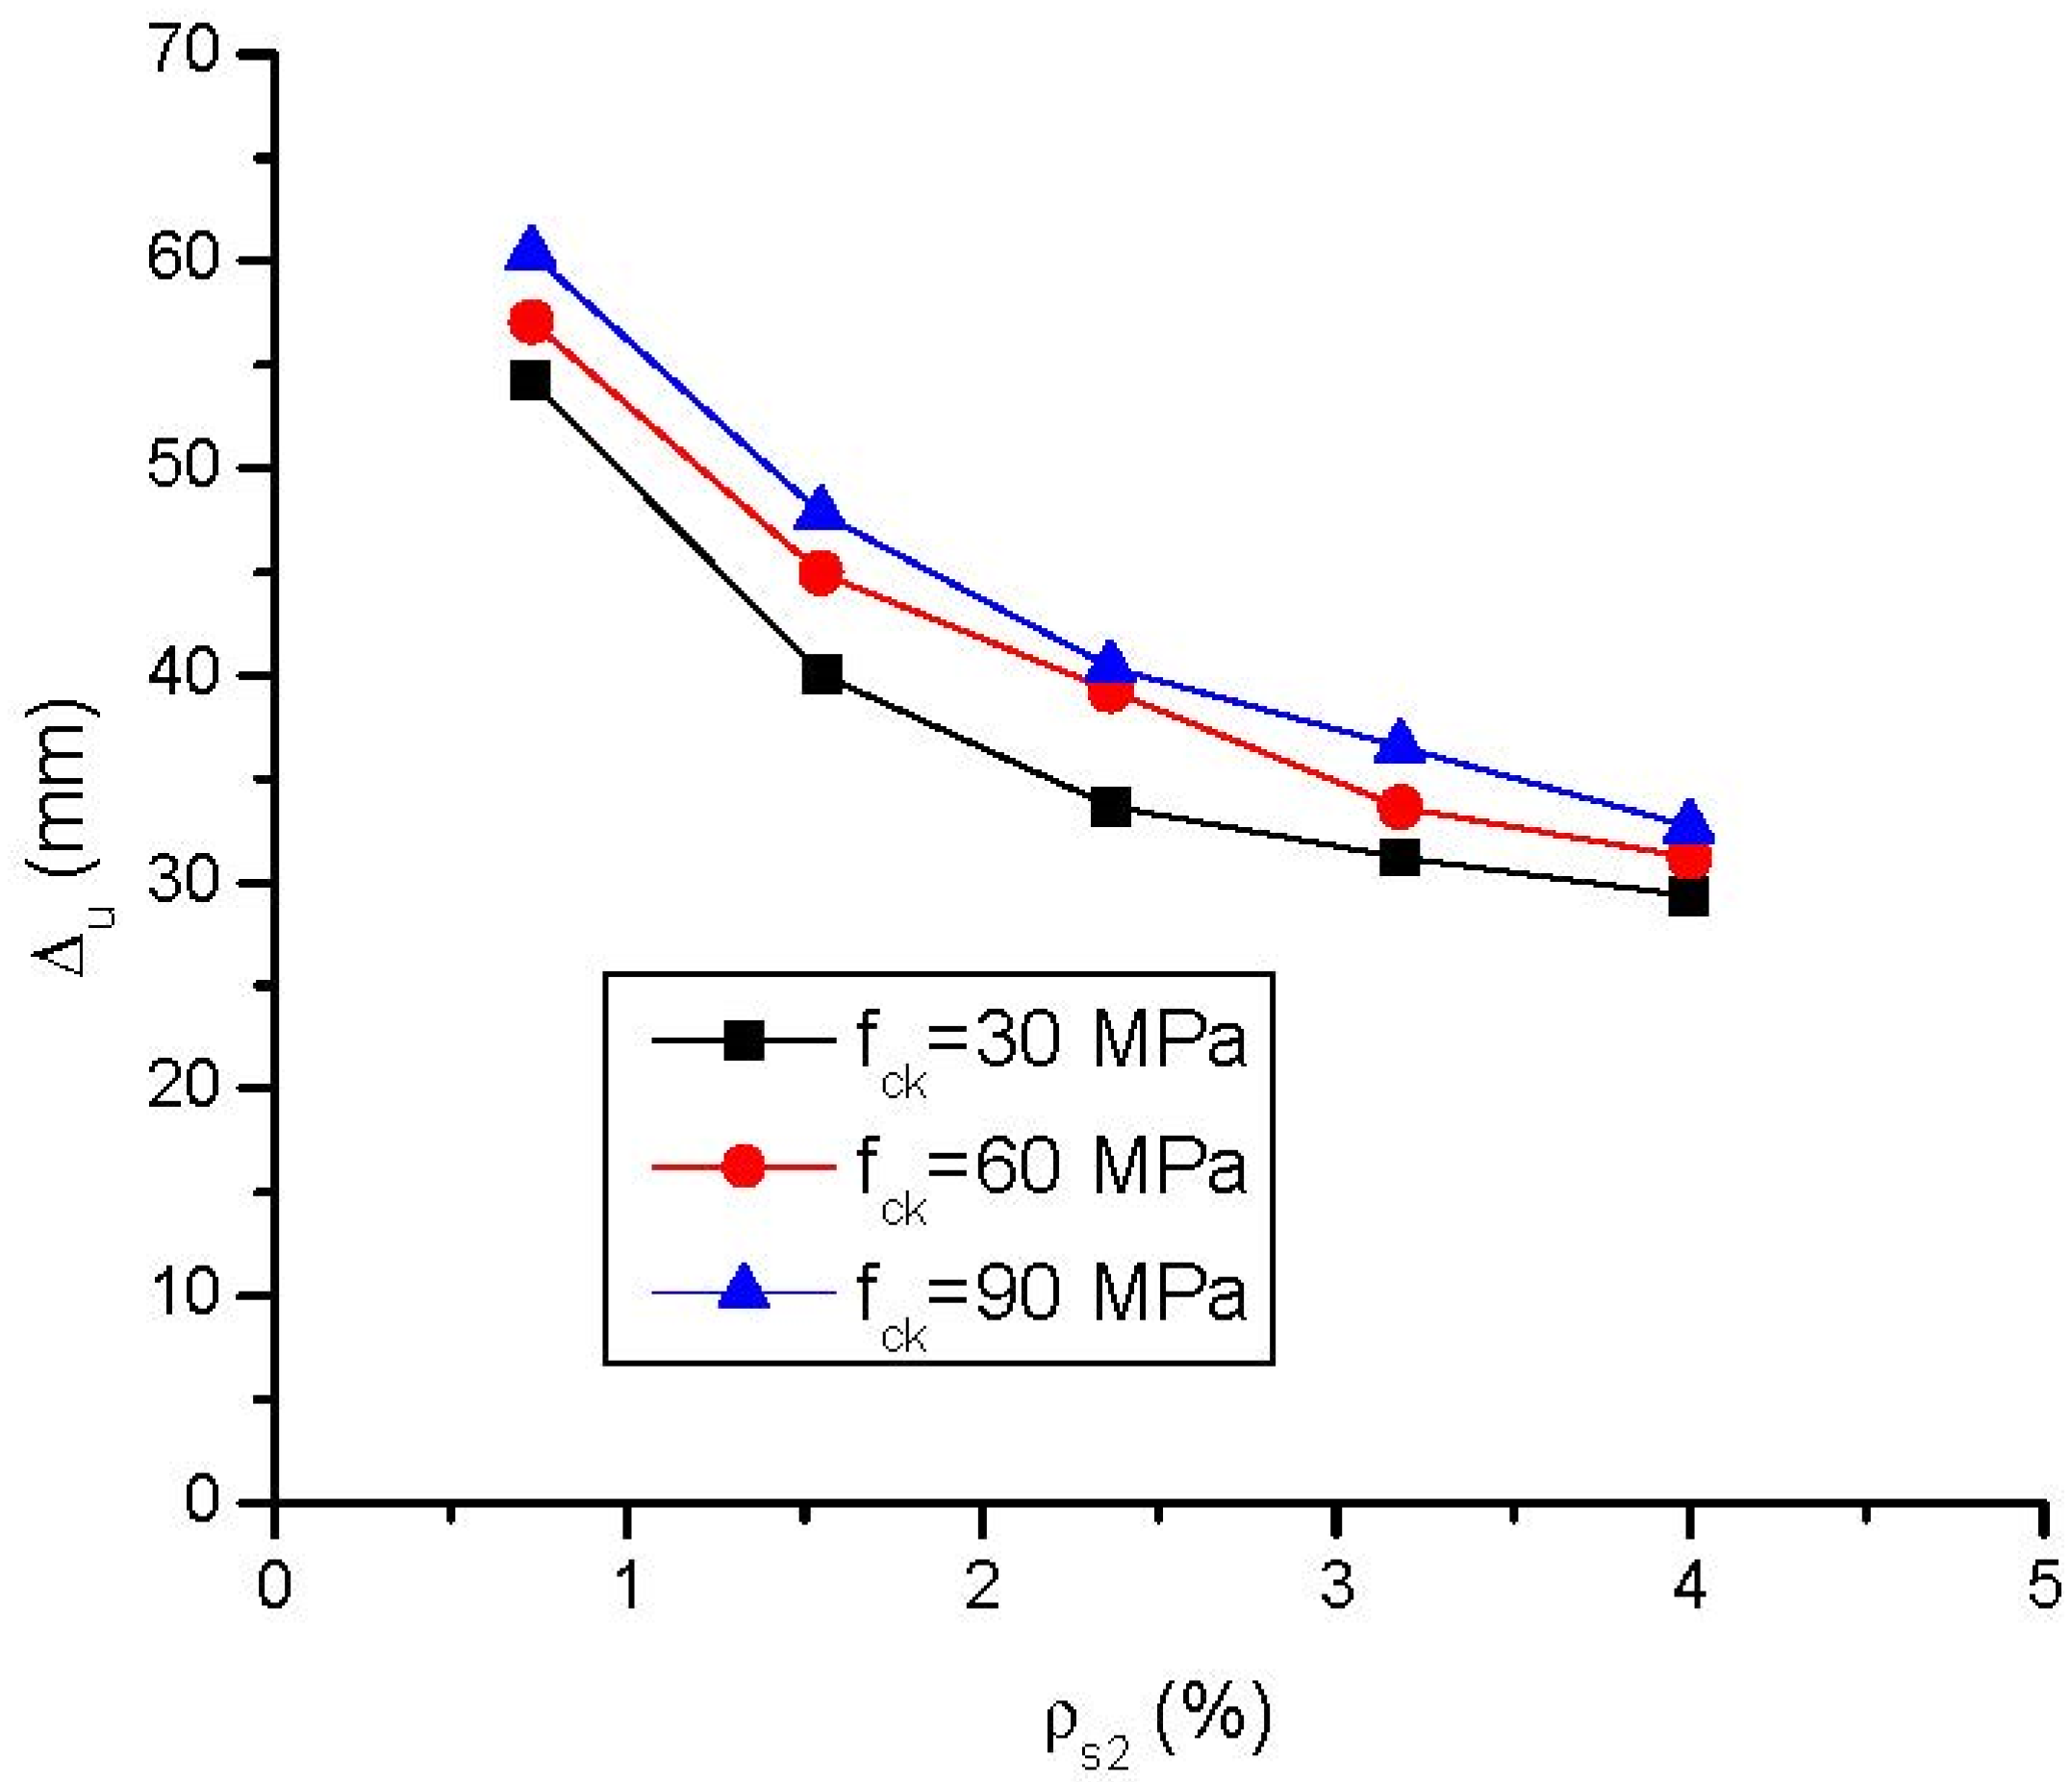
  • Reinforced HSC beams exhibit higher ultimate load and deflection than reinforced NSC beams. The load difference between NSC and HSC beams is increasingly notable with increasing steel ratio.
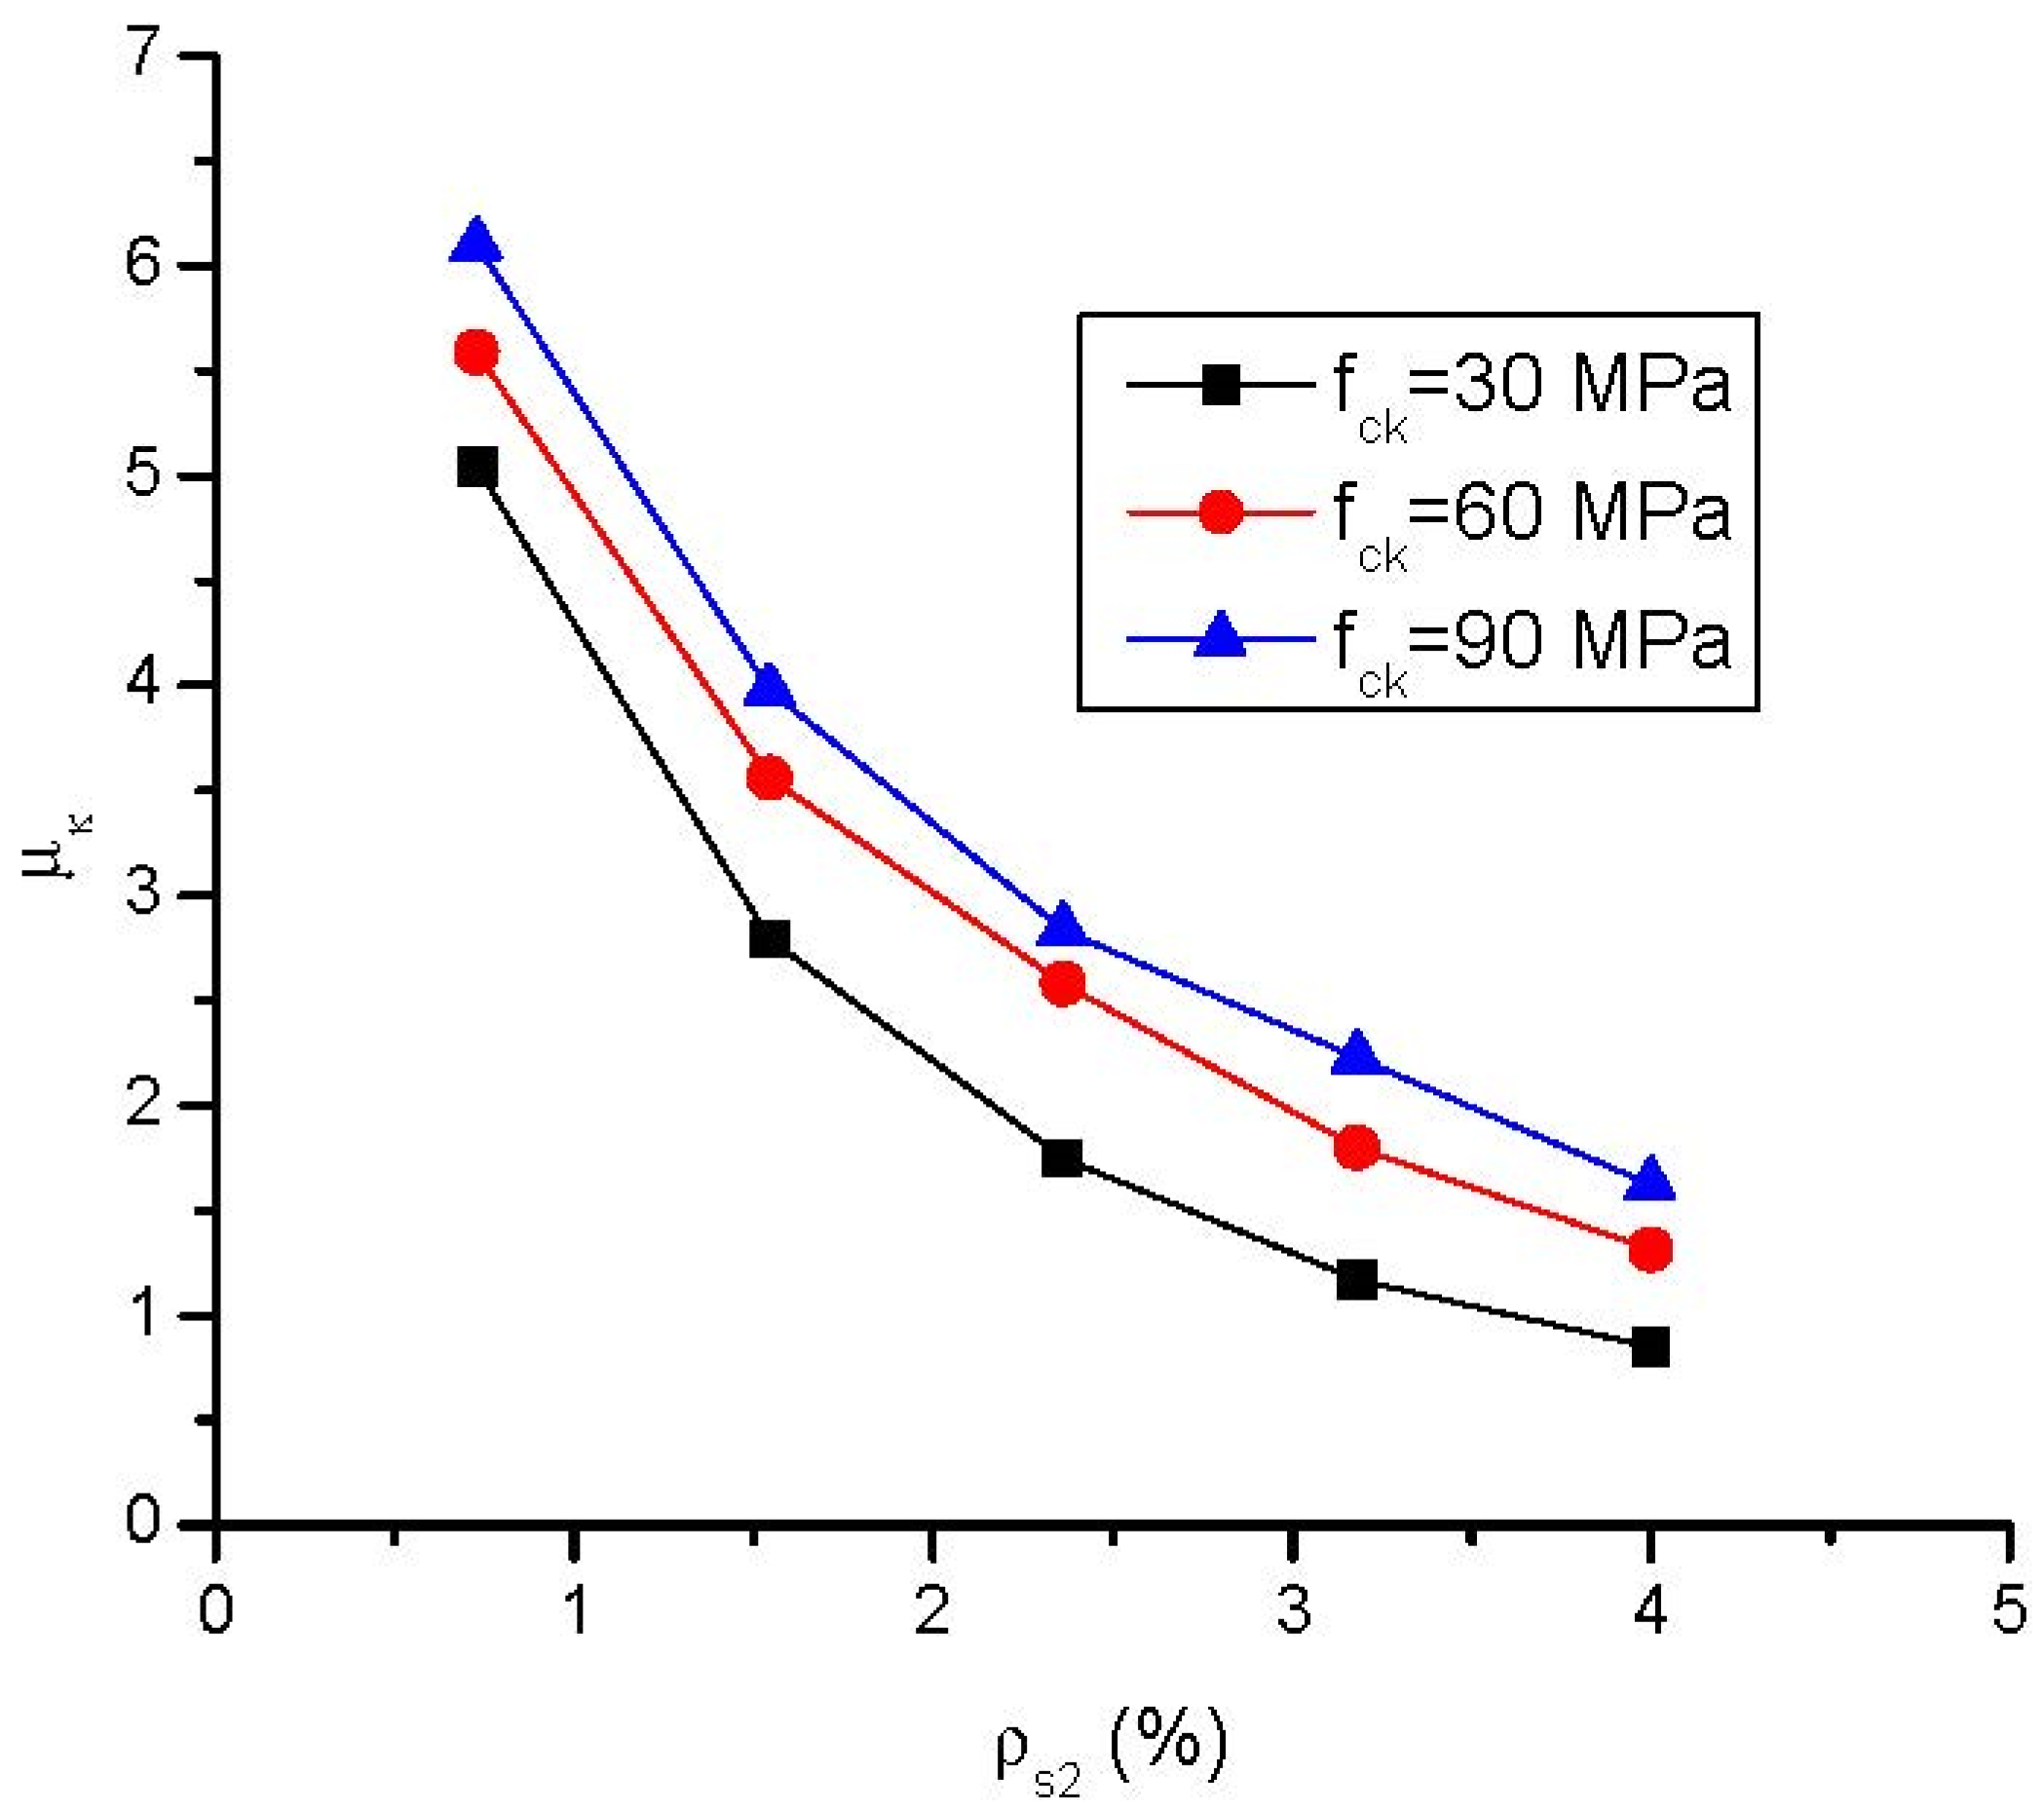
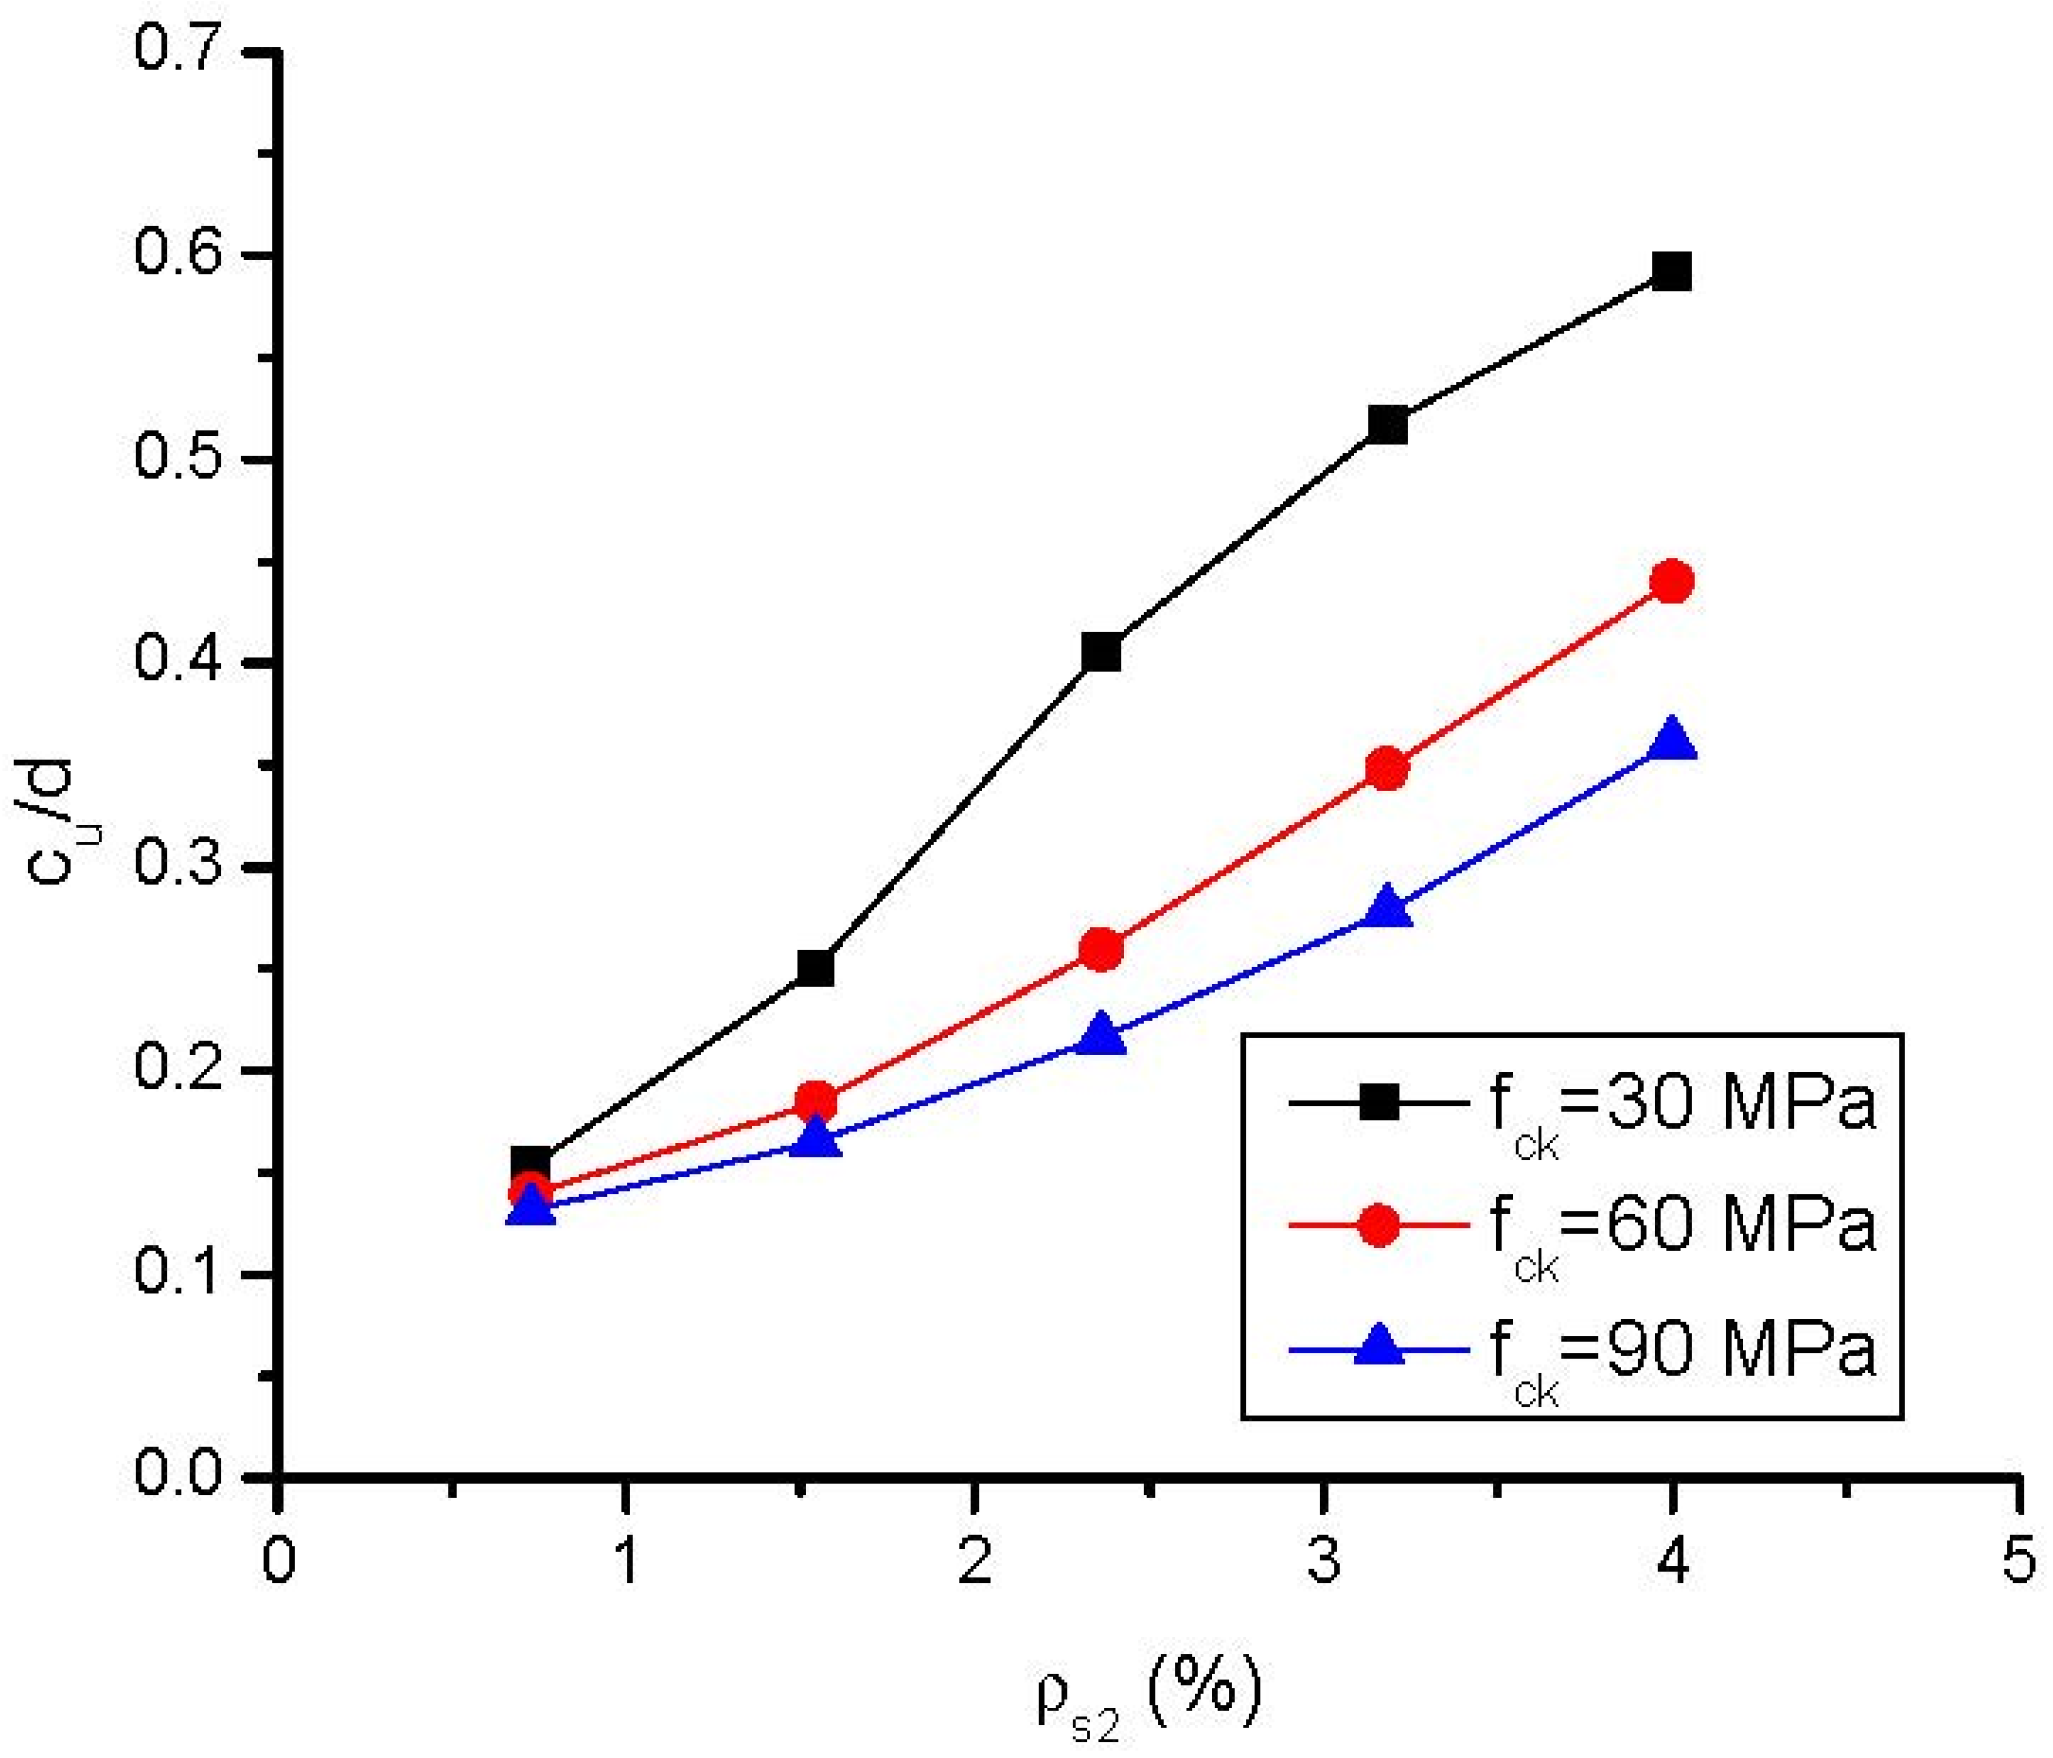
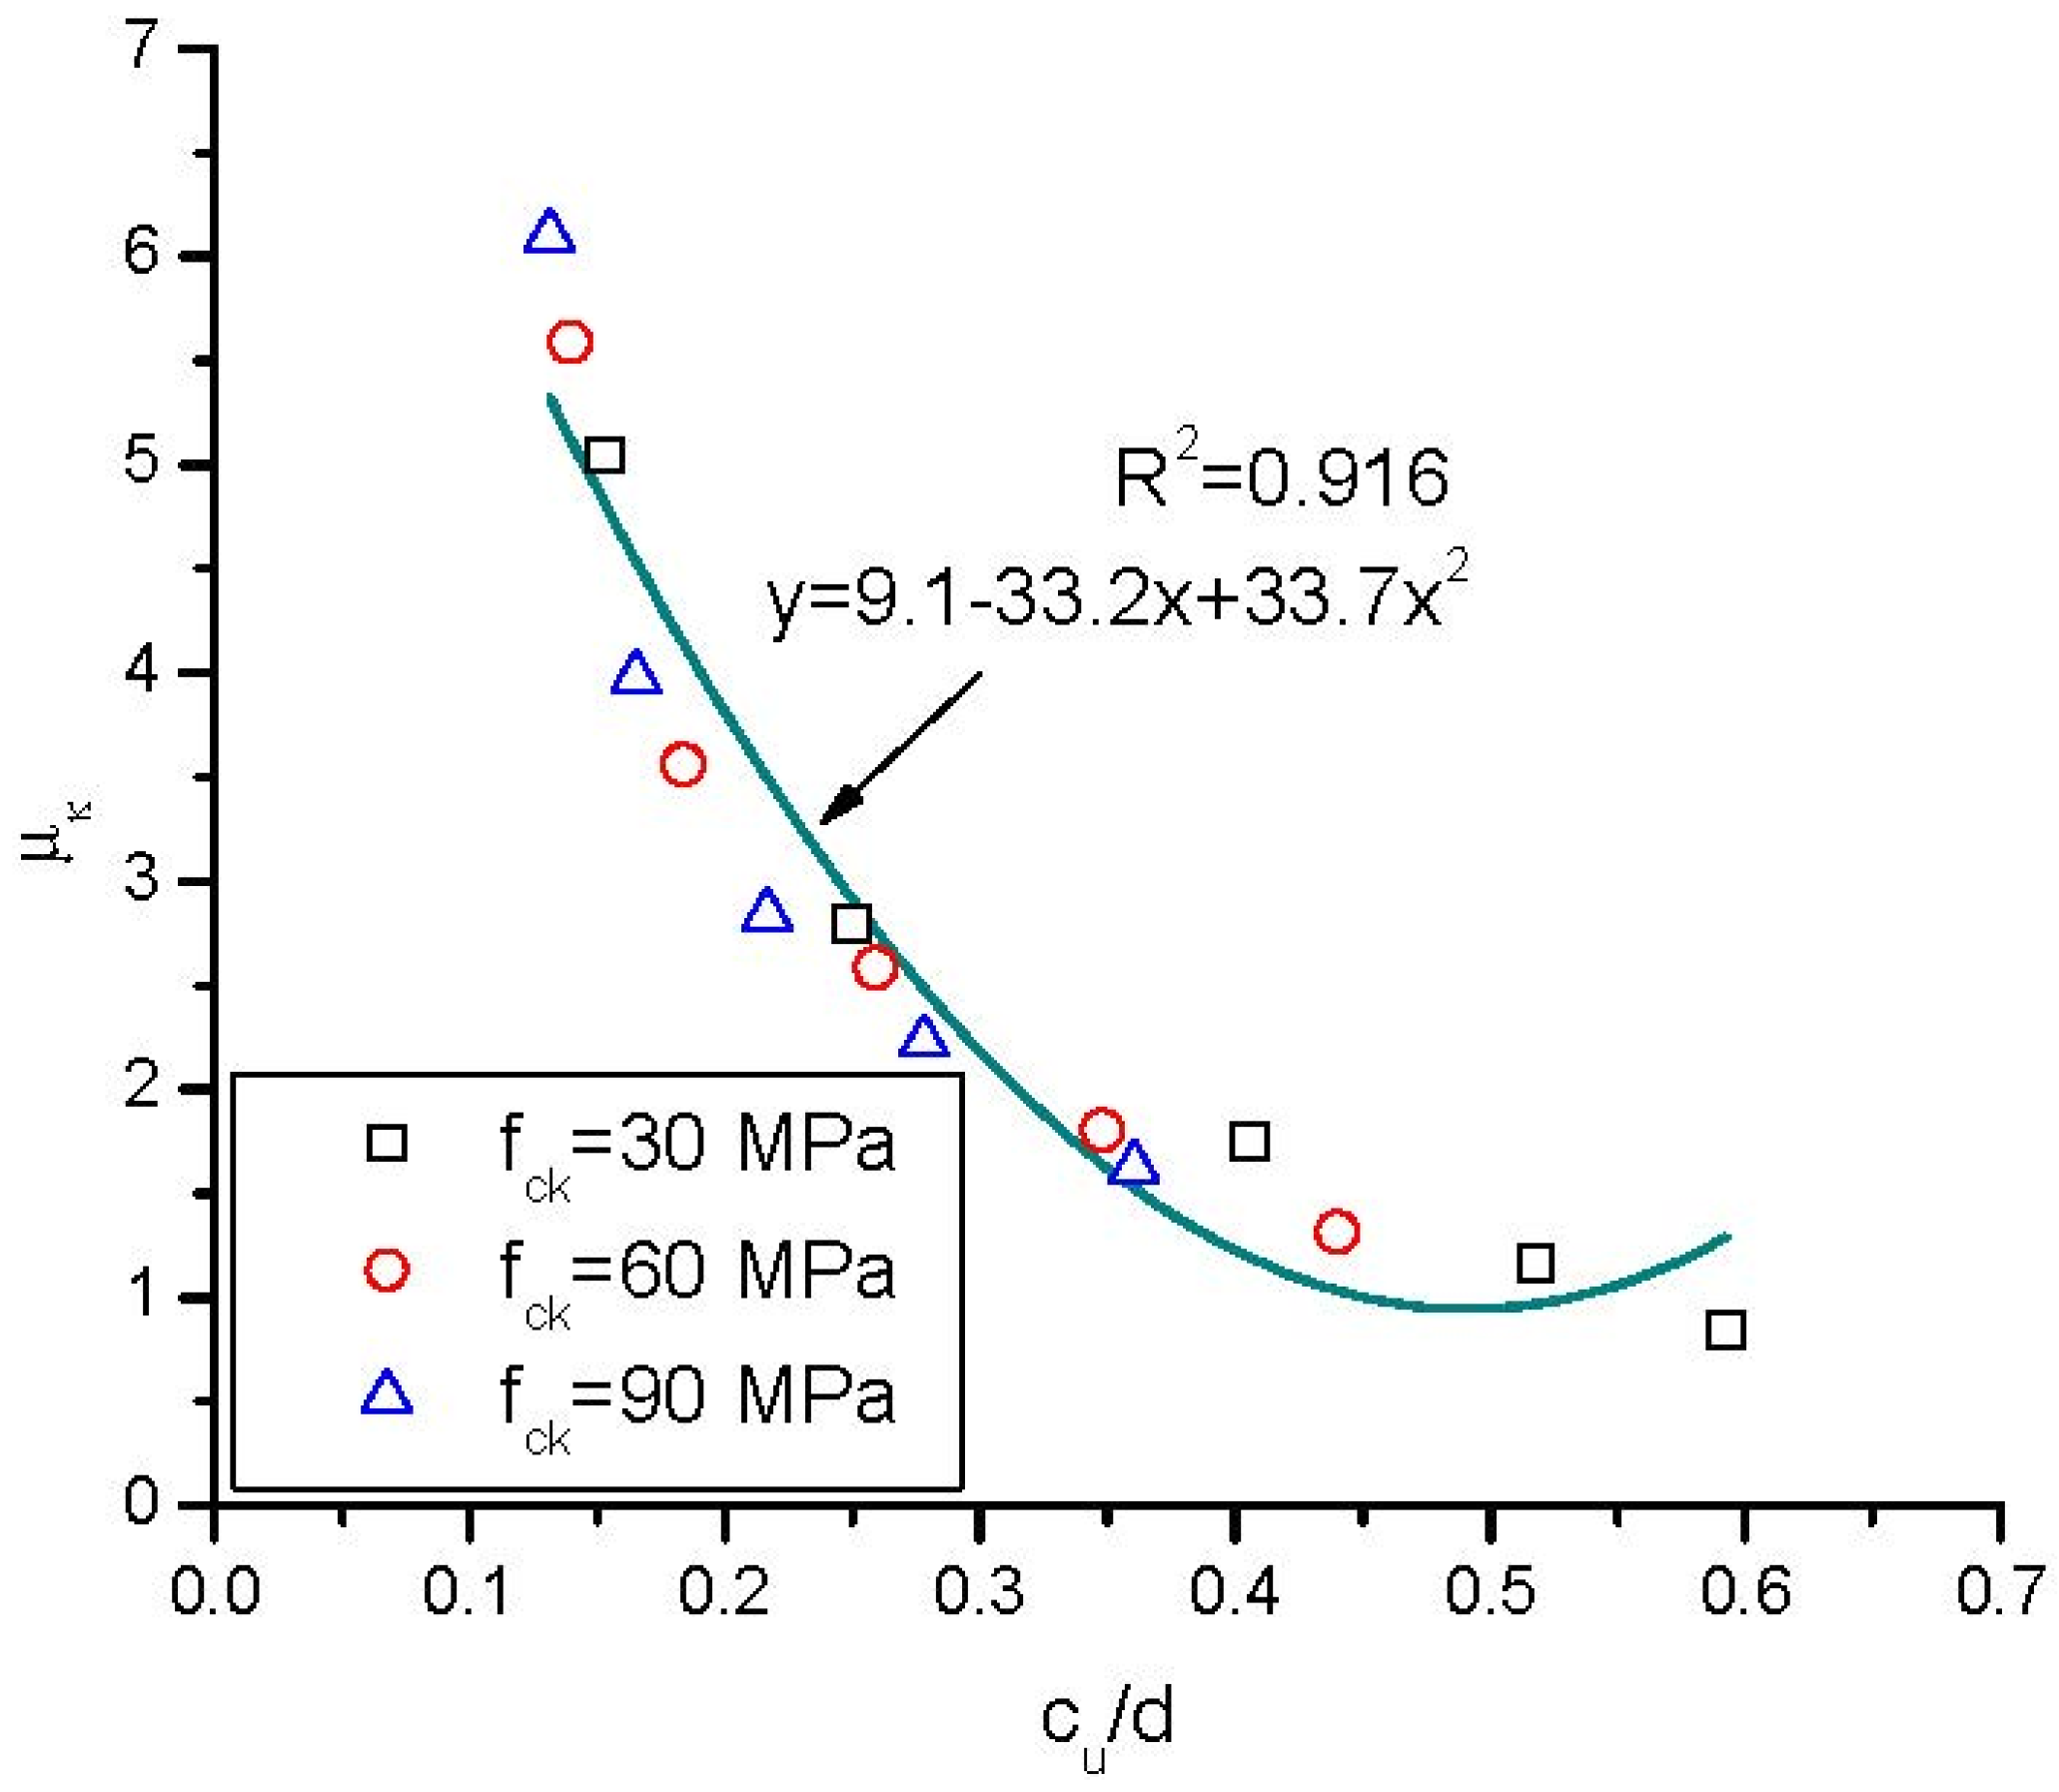
  • Reinforced HSC beams have higher flexural ductility despite the higher brittleness of HSC material compared to reinforced NSC beams. For ρs2 = 0.73–4.0%, reinforced HSC beams (fck = 90 MPa) show 21–91% higher curvature ductility factor than reinforced NSC beams (fck = 30 MPa).
  • Reinforced HSC beams exhibit lower neutral axis depth at ultimate than reinforced NSC beams, especially notable at a high steel ratio. The ultimate strain in tensile steel bars in reinforced HSC beams is obviously higher than that of reinforced NSC ones.
  • At the same load level, the difference between support reactions or bending moments in reinforced HSC and NSC beams is marginal, indicating similar moment redistribution in these beams. At ultimate, reinforced HSC beams have higher moment redistribution than reinforced NSC beams, except for ρs2 = 0.73%.
  • Both flexural ductility and moment redistribution are closely related to the neutral axis depth or strain in tensile steel bars at ultimate. Based on the data of the analysis, practical formulae reflecting their relationships are suggested.

Author Contributions

Conceptualization, M.P. and T.L.; Methodology, M.P.; Software, S.S.; Validation, T.L.; Formal Analysis, S.S.; Investigation, S.S.; Resources, T.L.; Data Curation, S.S.; Writing—Original Draft Preparation, S.S. and T.L.; Writing—Review and Editing, M.P.; Visualization, M.P.; Supervision, T.L. All authors have read and agreed to the published version of the manuscript.

Funding

This research was funded by Portuguese Foundation for Science and Technology, grants number 2022.04729.CEECIND, UIDB/00285/2020 and LA/P/0112/2020.

Data Availability Statement

Not applicable.

Conflicts of Interest

The authors declare no conflict of interest.

References

  1. ACI Committee 318. Building Code Requirements for Structural Concrete (ACI 318-19) and Commentary (ACI 318R-19); American Concrete Institute: Farmington Hills, MI, USA, 2019. [Google Scholar]
  2. Buch, S.H.; Suhail, R. Bond-slip behaviour of deformed rebars in normal and high strength concrete at elevated temperature—A review. Aust. J. Struct. Eng. 2022, 23, 189–204. [Google Scholar] [CrossRef]
  3. Diab, A.M.; Hussein, M.A.; Elyamany, H.E.; Al Ashy, H.M. Properties of pull-out bond strength and concept to assess ultimate bond stress of NSC and HSC. Mag. Concr. Res. 2014, 66, 877–895. [Google Scholar] [CrossRef]
  4. Yuan, T.F.; Hong, S.H.; Choi, J.S.; Yoon, Y.S. Evaluation on the microstructure and durability of high-strength concrete containing electric arc furnace oxidizing slag. Materials 2021, 14, 1304. [Google Scholar] [CrossRef] [PubMed]
  5. Hong, S.H.; Choi, J.S.; Yuan, T.F.; Yoon, Y.S. A review on concrete creep characteristics and its evaluation on high-strength lightweight concrete. J. Mater. Res. Technol. 2023, 22, 230–251. [Google Scholar] [CrossRef]
  6. Bernardo, L.F.A.; Lopes, S.M.R. Neutral axis depth versus flexural ductility in high-strength concrete beams. J. Struct. Eng. 2004, 130, 452–459. [Google Scholar] [CrossRef]
  7. Galano, L.; Vignoli, A. Strength and ductility of HSC and SCC slender columns subjected to short-term eccentric load. ACI Struct. J. 2008, 105, 259–269. [Google Scholar]
  8. Ko, M.Y.; Kim, S.W.; Kim, J.K. Experimental study on the plastic rotation capacity of reinforced high strength concrete beams. Mater. Struct. 2001, 34, 302–311. [Google Scholar] [CrossRef]
  9. Salih, A.M.; Mohammed, A.A. Minimum flexural reinforcement steel ratios of high-strength concrete beams. Adv. Civ. Eng. 2022, 2022, 5612790. [Google Scholar] [CrossRef]
  10. Ma, C.K.; Sulaiman, M.F.; Apandi, N.; Awang, A.Z.; Omar, W.; Jaw, S.W. Ductility and stiffness of slender confined reinforced high-strength concrete columns under monotonic axial load. Measurement 2019, 146, 838–845. [Google Scholar] [CrossRef]
  11. Ahmed, M.; Sheikh, M.N.; Hadi, M.N.S.; Liang, Q.Q. Numerical simulation of axially loaded square high-strength concrete short columns with steel equal-angles as longitudinal reinforcement. Eng. Struct. 2023, 276, 115391. [Google Scholar] [CrossRef]
  12. Arslan, G.; Cihanli, E. Curvature ductility prediction of reinforced high-strength concrete beam sections. J. Civ. Eng. Manag. 2010, 16, 462–470. [Google Scholar] [CrossRef]
  13. Lam, J.Y.K.; Ho, J.C.M.; Kwan, A.K.H. Flexural ductility of high-strength concrete columns with minimal confinement. Mater. Struct. 2009, 42, 909–921. [Google Scholar] [CrossRef]
  14. Kassoul, A.; Bougara, A. Maximum ratio of longitudinal tensile reinforcement in high strength doubly reinforced concrete beams designed according to Eurocode 8. Eng. Struct. 2010, 32, 3206–3213. [Google Scholar] [CrossRef]
  15. Bouzid, H.; Kassoul, A. Curvature ductility prediction of high strength concrete beams. Struct. Eng. Mech. 2018, 66, 195–201. [Google Scholar]
  16. Haytham, B.; Amar, K. Curvature ductility of high strength concrete beams. J. Mater. Eng. Struct. 2017, 4, 155–167. [Google Scholar]
  17. Bouzid, H.; Kassoul, A. Curvature ductility of high strength concrete beams according to Eurocode 2. Struct. Eng. Mech. 2016, 58, 1–19. [Google Scholar] [CrossRef]
  18. Bai, Z.Z.; Au, F.T.K. Flexural ductility design of high-strength concrete beams. Struct. Des. Tall Spec. Build. 2013, 22, 521–542. [Google Scholar] [CrossRef]
  19. Tamayo, J.L.P.; Garcia, G.O. Reassessment of the flexural behavior of high-strength reinforced concrete beams under short-term loads. SN Appl. Sci. 2021, 3, 204. [Google Scholar] [CrossRef]
  20. Shaaban, I.G.; Mustafa, T.S. Towards efficient structural and serviceability design of high-strength concrete T-beams. Proc. Inst. Civ. Eng. Struct. Build. 2021, 174, 836–848. [Google Scholar] [CrossRef]
  21. Kim, S.W. Prediction of Shear strength of reinforced high-strength concrete beams using compatibility-aided truss model. Appl. Sci. 2021, 11, 10585. [Google Scholar] [CrossRef]
  22. Al-Faqra, E.; Murad, Y.; Jaber, M.A.; Shatarat, N. Torsional behaviour of high strength concrete beams with spiral reinforcement. Aust. J. Struct. Eng. 2021, 22, 266–276. [Google Scholar] [CrossRef]
  23. Bernardo, L.; Lopes, S.; Teixeira, M. Experimental study on the torsional behaviour of prestressed HSC hollow beams. Appl. Sci. 2020, 10, 642. [Google Scholar] [CrossRef]
  24. Carmo, R.N.F.; Lopes, S.M.R. Ductility and linear analysis with moment redistribution in reinforced high-strength concrete beams. Can. J. Civ. Eng. 2005, 32, 194–203. [Google Scholar] [CrossRef]
  25. Carmo, R.N.F.; Lopes, S.M.R. Available plastic rotation in continuous high-strength concrete beams. Can. J. Civ. Eng. 2008, 35, 1152–1162. [Google Scholar] [CrossRef]
  26. Lou, T.; Lopes, S.M.R.; Lopes, A.V. FE modeling of inelastic behavior of reinforced high-strength concrete continuous beams. Struct. Eng. Mech. 2014, 49, 373–393. [Google Scholar] [CrossRef]
  27. Lou, T.; Lopes, S.M.R.; Lopes, A.V. Evaluation of moment redistribution in normal-strength and high-strength reinforced concrete beams. J. Struct. Eng. 2014, 14, 04014072. [Google Scholar] [CrossRef]
  28. Lou, T.; Lopes, S.M.R.; Lopes, A.V. Effect of relative stiffness on moment redistribution in reinforced high-strength concrete beams. Mag. Concr. Res. 2017, 69, 716–727. [Google Scholar] [CrossRef]
  29. El-Mogy, M.A.T. Behaviour of Continuous Concrete Beams Reinforced with FRP Bars. Ph.D. Thesis, University of Manitoba, Winnipeg, MB, Canada, 2011. [Google Scholar]
  30. Lou, T.; Lopes, S.M.R.; Lopes, A.V. Redistribution of moments in reinforced high-strength concrete beams with and without confinement. Struct. Eng. Mech. 2015, 55, 379–398. [Google Scholar] [CrossRef]
  31. EN 1992-1-1; Eurocode 2: Design of Concrete Structures—Part 1-1: General Rules and Rules for Buildings. European Committee for Standardization: Brussels, Belgium, 2004.
  32. Bonopera, M.; Chang, K.C. Elastic modulus of prestressed and reinforced concrete beams in Taiwan under dynamic flexural loading. J. Chin. Inst. Civ. Hydraul. Eng. 2021, 33, 83–92. [Google Scholar]
  33. Yuen, T.Y.P.; Wen, T.H.; Hung, C.C.; Zhang, H.; Pham, P.A.H.; Deng, Y. An eigendecomposition-based and mesh-sensitivity reduced constitutive model for nonlinear analysis of concrete structures under non-proportional cyclic loading. J. Build. Eng. 2022, 47, 103875. [Google Scholar] [CrossRef]
Figure 1. Continuous HSC beam specimens.
Buildings 13 01157 g001
Figure 2. Comparison of predicted moment–curvature curves with test data.
Buildings 13 01157 g002
Figure 3. Continuous beams for numerical investigations.
Buildings 13 01157 g003
Figure 4. Finite element model of continuous beams.
Buildings 13 01157 g004
Figure 5. Deformation of NSC and HSC beams. (a) Load versus midspan deflection; (b) moment versus curvature.
Buildings 13 01157 g005
Figure 6. Variation in ultimate moment (center support) with varying steel ratio.
Buildings 13 01157 g006
Figure 7. Variation in ultimate deflection at midspan with varying steel ratio.
Buildings 13 01157 g007
Figure 8. Variation in curvature ductility factor (center support) with varying steel ratio.
Buildings 13 01157 g008
Figure 9. Development of neutral axis depth. (a) Load versus neutral axis depth; (b) curvature versus neutral axis depth.
Buildings 13 01157 g009
Figure 10. Variation in neutral axis depth at ultimate (center support) with varying steel ratio.
Buildings 13 01157 g010
Figure 11. Relationship between curvature ductility factor and neutral axis depth.
Buildings 13 01157 g011
Figure 12. Strain and stress in tensile steel bars. (a) Load versus steel strain; (b) load versus steel stress.
Buildings 13 01157 g012
Figure 13. Variation in tensile steel strain at ultimate (center support) with varying steel ratio.
Buildings 13 01157 g013
Figure 14. Relationship between curvature ductility factor and tensile steel strain.
Buildings 13 01157 g014
Figure 15. Reaction and moment development. (a) Load versus reaction; (b) load versus moment.
Buildings 13 01157 g015
Figure 16. Relationship between moment redistribution and neutral axis depth.
Buildings 13 01157 g016
Figure 17. Relationship between moment redistribution and tensile steel strain.
Buildings 13 01157 g017
Table 1. Values of typical response of NSC and HSC beams.
fck (MPa)ρs2 (%)Pu (kN)Δu (mm)κy
(10−6 rad/mm)
κu
(10−6 rad/mm)
μκcu/dεt (%)
300.72330.754.3−6.52−32.915.050.151.53
1.55667.040.1−7.71−21.552.800.250.89
2.36914.933.6−8.89−15.561.750.410.51
3.181055.531.2−10.36−12.121.170.520.32
4.01131.329.3−12.62−10.710.850.590.24
600.72348.357.1−6.37−35.615.590.141.69
1.55700.444.9−7.19−25.603.560.181.15
2.361027.639.3−7.98−20.602.580.260.84
3.181279.833.6−8.61−15.531.800.350.56
4.01432.331.2−9.34−12.281.320.440.38
900.72364.460.4−6.28−38.286.100.131.83
1.55719.147.8−6.96−27.693.980.171.27
2.361060.740.4−7.67−21.752.840.220.94
3.181374.636.5−8.21−18.292.230.280.73
4.01577.032.7−8.69−14.111.620.360.50
Table 2. Values related to moment redistribution in NSC and HSC beams.
fck (MPa)ρs2 (%)Mu (kN m)Me (kN m)βu (%)
MidspanSupportMidspanSupportMidspanSupport
300.72453.6−396.3406.3−491.0−11.719.3
1.55888.7−786.9805.8−952.7−10.317.4
2.361183.9−1126.51102.3−1289.7−7.412.7
3.181317.6−1386.11271.6−1478.1−3.66.2
4.01396.5−1512.91363.9−1578.1−2.44.1
600.72475.1−419.2426.7−516.0−11.318.8
1.55936.9−815.9844.6−1000.5−10.918.5
2.361355.7−1205.21234.7−1447.3−9.816.7
3.181657.1−1548.41536.7−1789.1−7.813.5
4.01796.9−1840.61720.5−1993.5−4.47.7
900.72494.6−440.8445.6−538.7−11.018.2
1.55961.0−837.9866.2−1027.4−10.918.5
2.361406.3−1228.51273.1−1494.9−10.517.8
3.181806.1−1605.91648.1−1922.0−9.616.4
4.02014.6−1947.91891.2−2194.8−6.511.2
Disclaimer/Publisher’s Note: The statements, opinions and data contained in all publications are solely those of the individual author(s) and contributor(s) and not of MDPI and/or the editor(s). MDPI and/or the editor(s) disclaim responsibility for any injury to people or property resulting from any ideas, methods, instructions or products referred to in the content.

