Article

Flexural Stiffness and Crack Width of Partially Prestressed Beams with Unbonded Tendons

by
Bernardo T. Terán-Torres
1,
Adolfo A. Elías-Chávez
1,
Pedro L. Valdez-Tamez
1,
Jose A. Rodríguez-Rodríguez
2 and
César A. Juárez-Alvarado
1,*
1
Facultad de Ingeniería Civil, Universidad Autónoma de Nuevo León, C. Pedro de Alba s/n, San Nicolás de los Garza 66450, Nuevo León, Mexico
2
Programa de Ingeniería Civil, Universidad Autónoma de Zacatecas, Jardín Juárez #147 Centro Histórico, Zacatecas 98000, Zacatecas, Mexico
*
Author to whom correspondence should be addressed.
Buildings 2023, 13(11), 2717; https://doi.org/10.3390/buildings13112717
Submission received: 3 October 2023 / Revised: 26 October 2023 / Accepted: 26 October 2023 / Published: 28 October 2023

Abstract

:
The original concept of “Total Prestress” consists of creating compressions in concrete without generating tension stresses for service load, while in "Partially Prestressed” elements, tensions are allowed in the service stage, which would produce some cracking depending on applied loads that will be taken with non-prestressed reinforcement. Using criteria and design recommendations can guarantee maximum flexural capacity and admissible serviceability requirements of partially prestressed elements; however, there is insufficient research for estimating more accurately the required parameters for the design and review of these types of elements. Because of this, the present investigation consisted in the realization of experimental studies in continuous partially prestressed beams with unbonded tendons for the evaluation of the flexural behavior for different stages of load determining the actual stresses and the strains taking into account the structural stiffness decrease and its effect on deflections. The dimensions of the specimens were selected based on common dimensions presented on slabs. The tested specimens considered variables such as the relationship between the length of the continuous spans, the cross-section, and the partial prestressing ratio. Afterward, equations were proposed to predict the decrease in the structural stiffness, depending on the degree of cracking, the type of cross-section, the partial prestressing ratio, and the magnitude of the applied load and the tension and compression stresses to estimate the probable deflections for a particular loading stage. The crack width equation presented a difference of −16% to +18% with respect to the experimental data, while the flexural stiffness equation showed a highly accurate correlation to the experimental data.

1. Introduction

In recent years, continuous post-tensioned structures with unbonded tendons have been used more frequently, especially in elements with low depths such as continuous slabs in one and two directions, to cover large spans and reduce costs, and therefore it has also been necessary to have a better-quality control in the construction of these types of elements. Partially prestressed concrete (PPC) members subjected to service loads will exhibit tensile stresses in some zones that will lead to cracking and, with this, to the consequent decrease in their stiffness, which is related to the increase in deflections depending on the percentage of loads acting on the member [1].
Particularly, for the serviceability stage, the acting stresses should be compared concerning the allowable values of tension and compression according to the recommendations of the current codes [2,3]; however, the tensile stresses could exceed these limits in the case of PPC members if the crack width is below the maximum allowable value. The increase in stress values in PPC members generates an increase in the degree of cracking; hence, it is very important to evaluate and control the crack widths and their spacing [4]. Studies to evaluate these criteria are limited due to the different factors that affect the development of cracking in these members.
Given this situation, other factors that influence the behavior of PPC members are the stresses of the unbonded tendons, the compressive strength of the concrete, the yield strength of the reinforcing and prestressing steel, the partial prestressing ratio, the span-to-span ratio, the trajectory of the tendons, the type of loads and the load distribution pattern in continuous elements, and the stresses in the cables after prestressing losses. To take these factors into account, for several years, different studies have been carried out regarding the determination of the failure and serviceability limit states, although most of the studies carried out have focused on the determination of the flexural strength [5]. Other studies [6,7] concluded that the American Concrete Institute ACI-318 equations for predicting stresses in prestressing tendons for the flexural strength stage have poor correlation with experimental results and may not be conservative in some cases.
Despite the aforementioned studies that refer to the behavior of prestressed members with bonded or unbonded tendons under service loads, in general, most of the investigations of these types of members have focused on defining or modifying the expressions to determine the flexural strength [8,9,10,11,12,13,14,15,16,17,18,19,20] mainly involving the determination of the stresses that occur in the prestressing steel for this strength stage. For instance, in [8], an equation to compute the ultimate stress based on the presence and absence of bonds was presented. An analytical model determined to compute the flexural strength and the deflection based on a simplified curvature distribution was developed in [9]. In addition, [10] presents a modification to the equation for the stress based on prestressing steel, high-strength concrete, and partial reinforcement. An empirical equation to calculate the ultimate stress in unbonded tendons with the inclusion of the amount of non-prestressed reinforcement was developed in [11]. An analytical model was developed to explain the mechanism of the member span–depth ratio parameter and its effect on the ultimate stress in unbonded members [12]. It was shown that the presence of bonded non-prestressed reinforcement has a marked influence on the flexural behavior of unbonded beams and the related increase in stress in the prestressed steel at the ultimate load [13]. The percentage of reinforcement, shape of members, strength of concrete, span–depth ratio, and initial stress in the strands were studied in [14,15] where a predicting equation was also developed. The variation in stress in prestressed steel under service load as well as the ratio of the length of the equivalent deformation region to the neutral axis depth at the critical section of unbonded partially prestressed concrete beams under service load were presented in [16]. Based on plastic region length and the concept of the collapse mechanism in continuous members predicting ultimate stress, equations were developed [17,18]. Based on compatibility and equilibrium, the ultimate flexural capacity of beams was determined from the models [19,20].
There are also other studies [21,22,23,24,25,26,27,28], in which mathematical models are proposed to estimate the bending behavior of PPC members, internally and externally. For instance, in [21], a set of design expressions was developed for externally prestressed beams under elastic and inelastic states; these equations were dependent on the tendon eccentricity and on the neutral axis depth. Furthermore, models that predict the initial behavior, before and after cracking, service load behavior, and ultimate strength, along with the moment redistribution for continuously unbonded post-tensioned concrete members, were developed [22,23,24]. These models were accurate for a wide range of members, including externally and internally prestressed members, diverse tendon profiles, reinforcement ranges, diverse section shapes, and loading patterns. In [25], a model for the ultimate strength of prestressed members with unbonded tendons was presented; it also provided a reasonably good estimation of the ultimate strength of over-reinforced members and high-strength concrete members. In addition, a simple method to calculate the stress in external tendons for continuous beams with or without symmetrical loading from the deformation of the strengthened member was presented in [26]. A numerical model developed to predict the full-range nonlinear response, as well as the time-dependent service load behavior of continuous beams prestressed with internal unbonded tendons, was developed in [27]. Both geometric and material nonlinearities were considered. A model to estimate the required partial prestressing based mainly on the crack control of concrete was proposed [28]. Nonetheless, as previously mentioned, most of these investigations deal only with the flexural behavior of these types of members.
Research has been developed for the prediction of cracking and deflections in prestressed beams in which a mathematical model was also proposed to estimate the crack width correlated with the obtained deflections, which were compared with the deflections calculated with theoretical formulas. The presence of conventional reinforcing steel has a significant effect on crack control because there is a more uniform distribution of cracks with smaller spacings, and the deflections are fewer compared to similar members without conventional reinforcing steel. However, only prestressed members with bonded tendons were considered in these studies [29,30,31,32]. For unbonded tendons, only simple supported beam bridges were considered in these studies [33,34]. In the former, a simply supported PC beam was composed of a parabolic tendon and high-strength concrete, where short- and long-term prestressing losses were measured for approximately 9.5 months through the vibration response, and finite element modeling was also used to predict the dynamics of the girders; the latter focuses on the flexural response of two reduced-scale, post-tensioned, PC bridge girders, prestressed with two different jacking forces and tested under a four-point bending configuration, and these were also modeled with the finite element method to represent the actual behavior of the specimens.
Both experimental and analytical studies have been carried out for the determination of deflections in simply supported prestressed elements with bonded and unbonded tendons [35,36,37,38]. The cracking of continuous-reinforced concrete members and the cracking of simply supported prestressed members were also investigated by generating an equation to estimate the crack width [39]. This research study concludes that the crack width and its spacing increase until reaching a load level between 60 and 70% of the ultimate load. After this load, the crack width increases without the appearance of new cracks. The aforementioned equation can be applied to continuous reinforced concrete members, but it would not apply to continuous prestressed members until sufficient experimental data are available to support this equation. Most of the mentioned studies have focused on the study of simply supported members with bonded tendons and, in contrast, there are few experimental and analytical studies related to continuous PPC members with unbonded tendons.
Therefore, the present research study was conducted to assess the relationship between the loss of cross-section stiffness and the determination of crack width and cracking degree for the negative and positive moment zones, taking into account the relationship between adjacent spans, the magnitude of the loads, and the partial prestressing ratio, because the loss of stiffness will consequently influence the increase in deflections. Hence, a set of equations to obtain the stiffness factor and the crack width are determined to define the degree of deflection of continuous members (such as one- and two-way slabs) and the degree of cracking, respectively. These equations provide the means to evaluate the deflections and cracking for partially prestressed members with unbonded tendons for structures commonly found in slabs.

2. Materials and Experimental Program

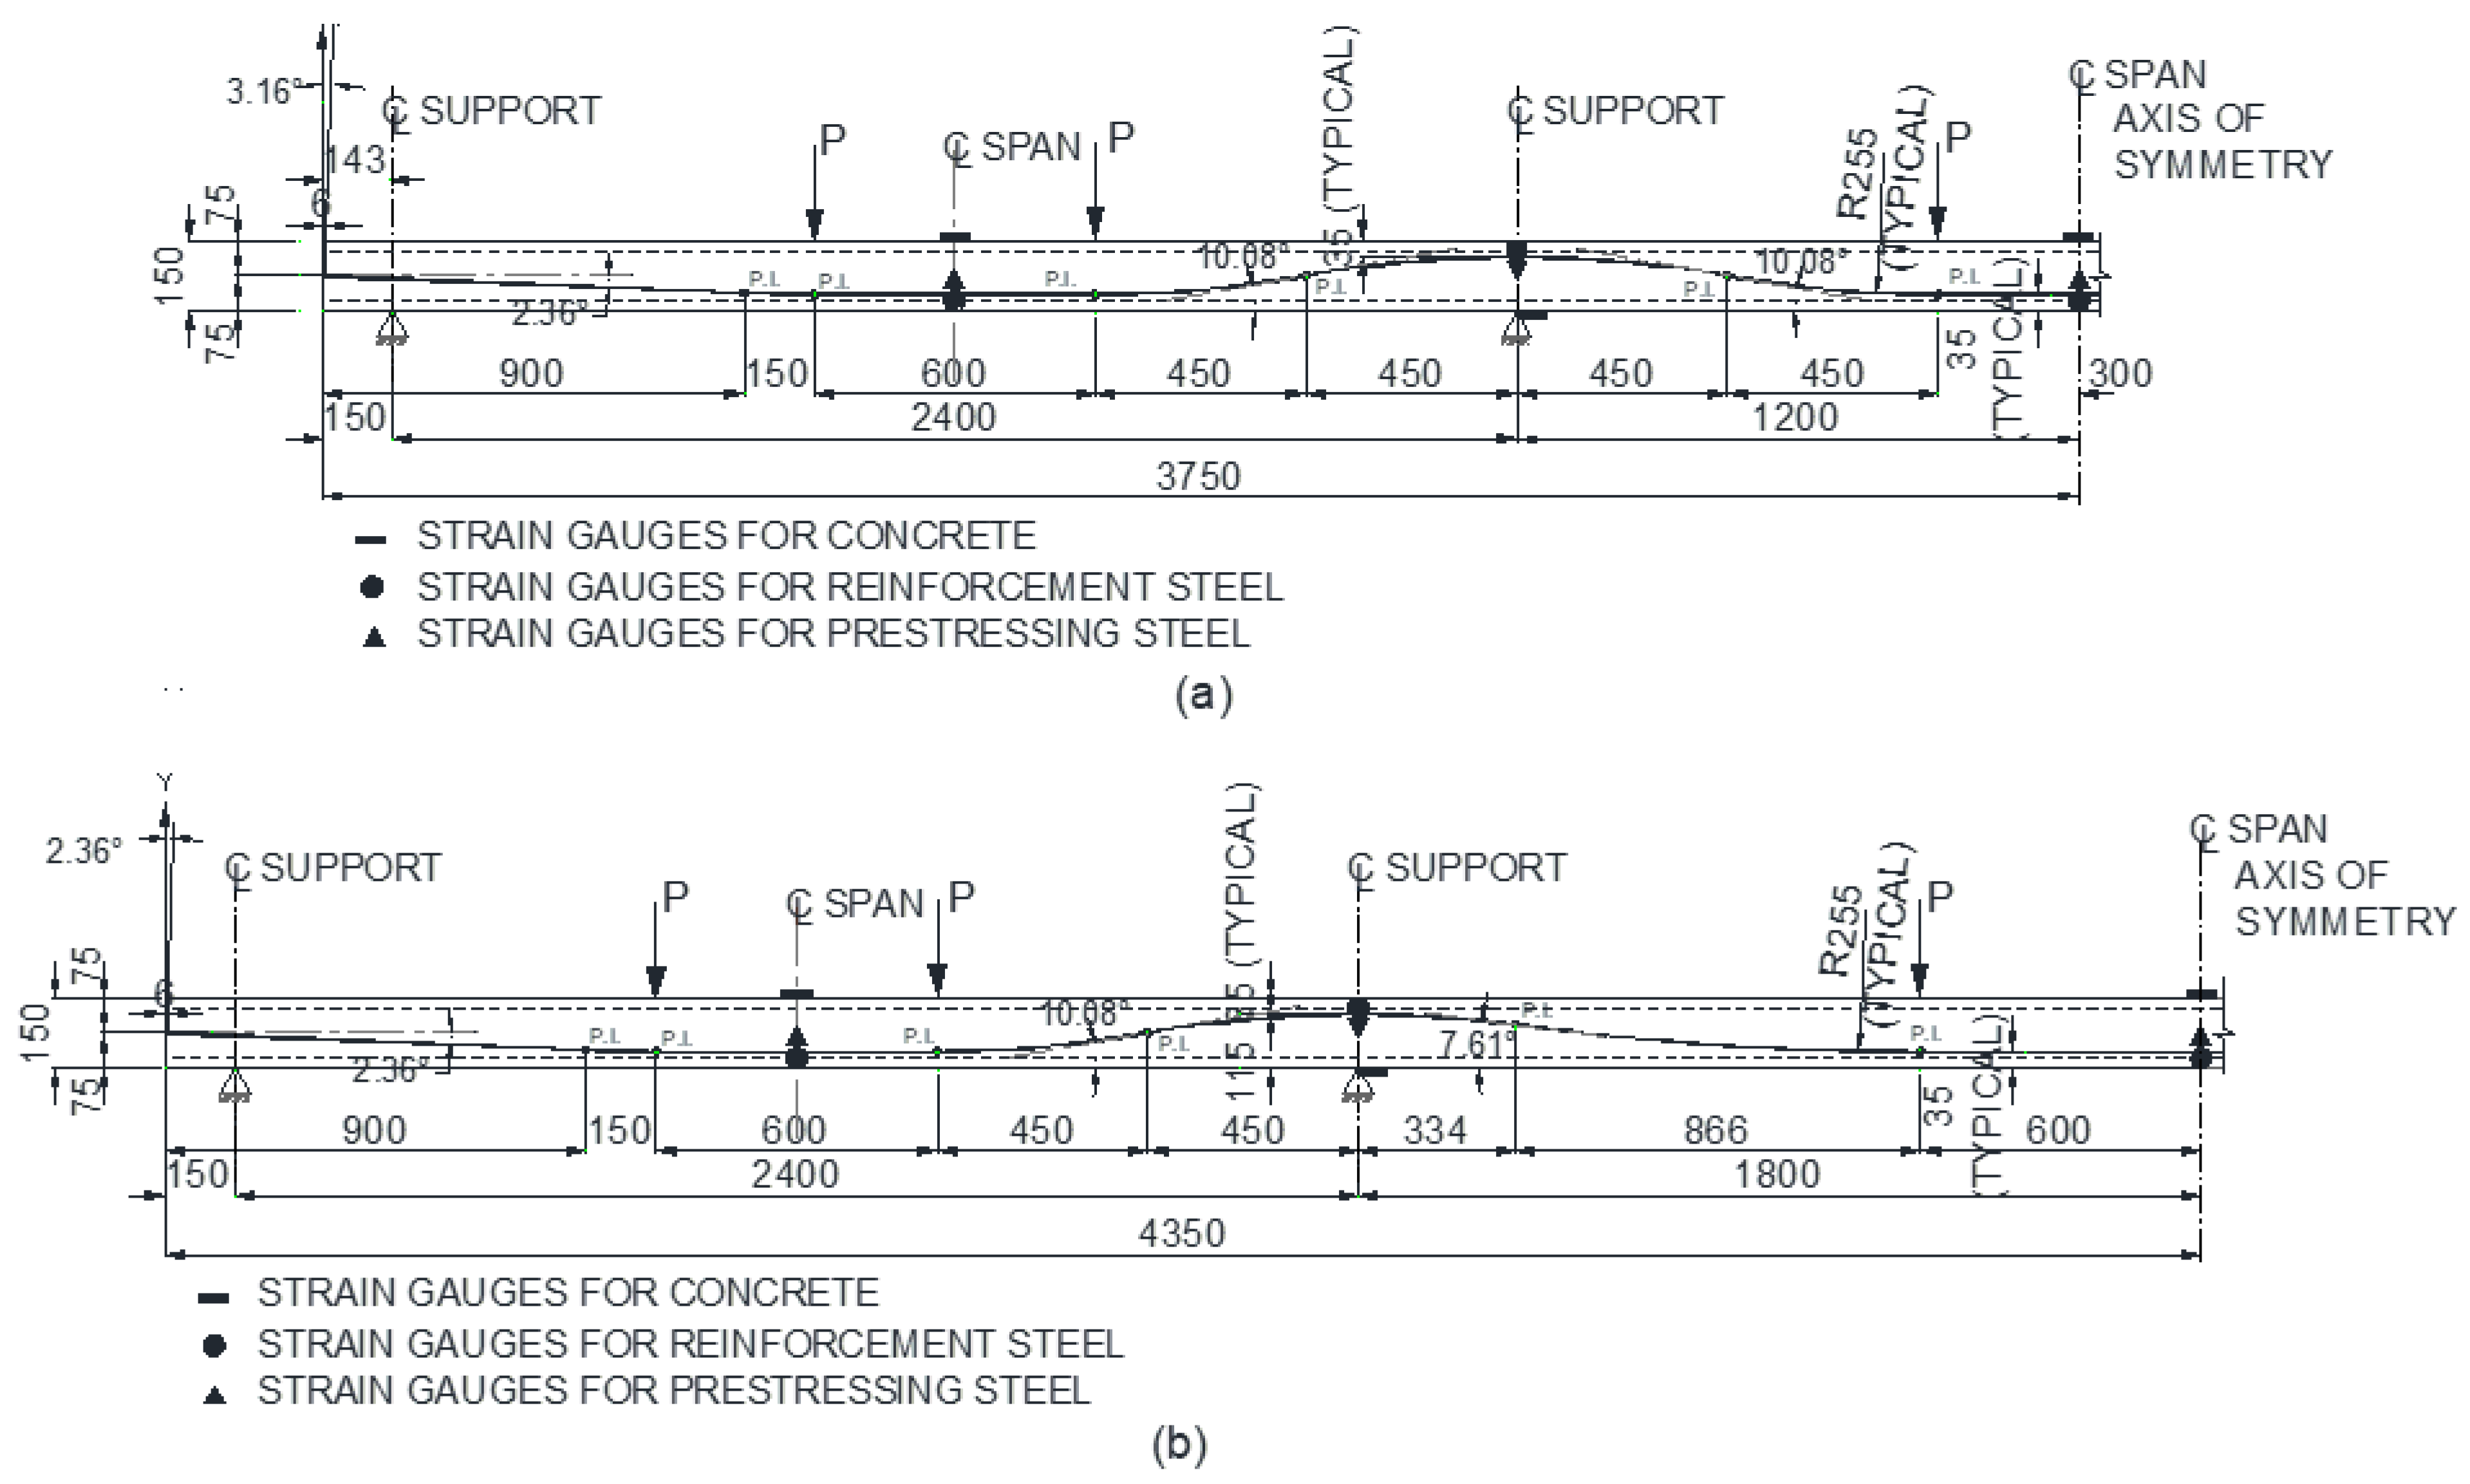
2.1. Specimens for Tests

Sets of 12 beams were fabricated in duplicate. The first set had a solid rectangular cross-section of 150 mm × 300 mm depth–width, respectively. The second set had a cross-section of 150 mm × 500 mm formed by two longitudinal ribs (“inverted U”). The two sets had lengths of 7500 mm and 8700 mm. Both sets of beams were continuously supported with spans of 2400-2400-2400 mm and 2400-3600-2400 mm, considering the different partial prestressing ratios (PPRs) as identified in Table 1.
The cross-sections of the beams were established by trying to simulate solid (150 × 300 mm) and ribbed (150 × 500 mm) members. In both cases, the web width was 300 mm. The length of the strong floor used for the tests limited the lengths of the beams. The beam sizes were selected to represent structural elements as close to reality as possible.

2.2. Materials for the Fabrication of Beams

All beams were reinforced with two 10 mm diameter Grade 270 (fpu = 193 MPa) 7-wire low-relaxation prestressing steel strands under ASTM A-416 [40], with 8 mm (5/16″) diameter Grade 60 (fy = 420 MPa) corrugated bars, according to ASTM A-615 [41], as longitudinal reinforcement in different amounts according to the partial prestressing ratio, and with 6 mm (1/4″) diameter Grade 40 (fy = 280 MPa) smooth round steel stirrups as shear reinforcement. Normal-weight concrete with a minimum compressive strength f’c at 28 days of 35 MPa was used. The cables were tensioned with two hydraulic jacks simultaneously using a barrel–wedge anchorage. The dead anchors were “U”-shaped and were built with an A-36 structural steel plate (fy = 258 MPa) using a 200 mm diameter circular tube in 25 mm segments (Figure 1).

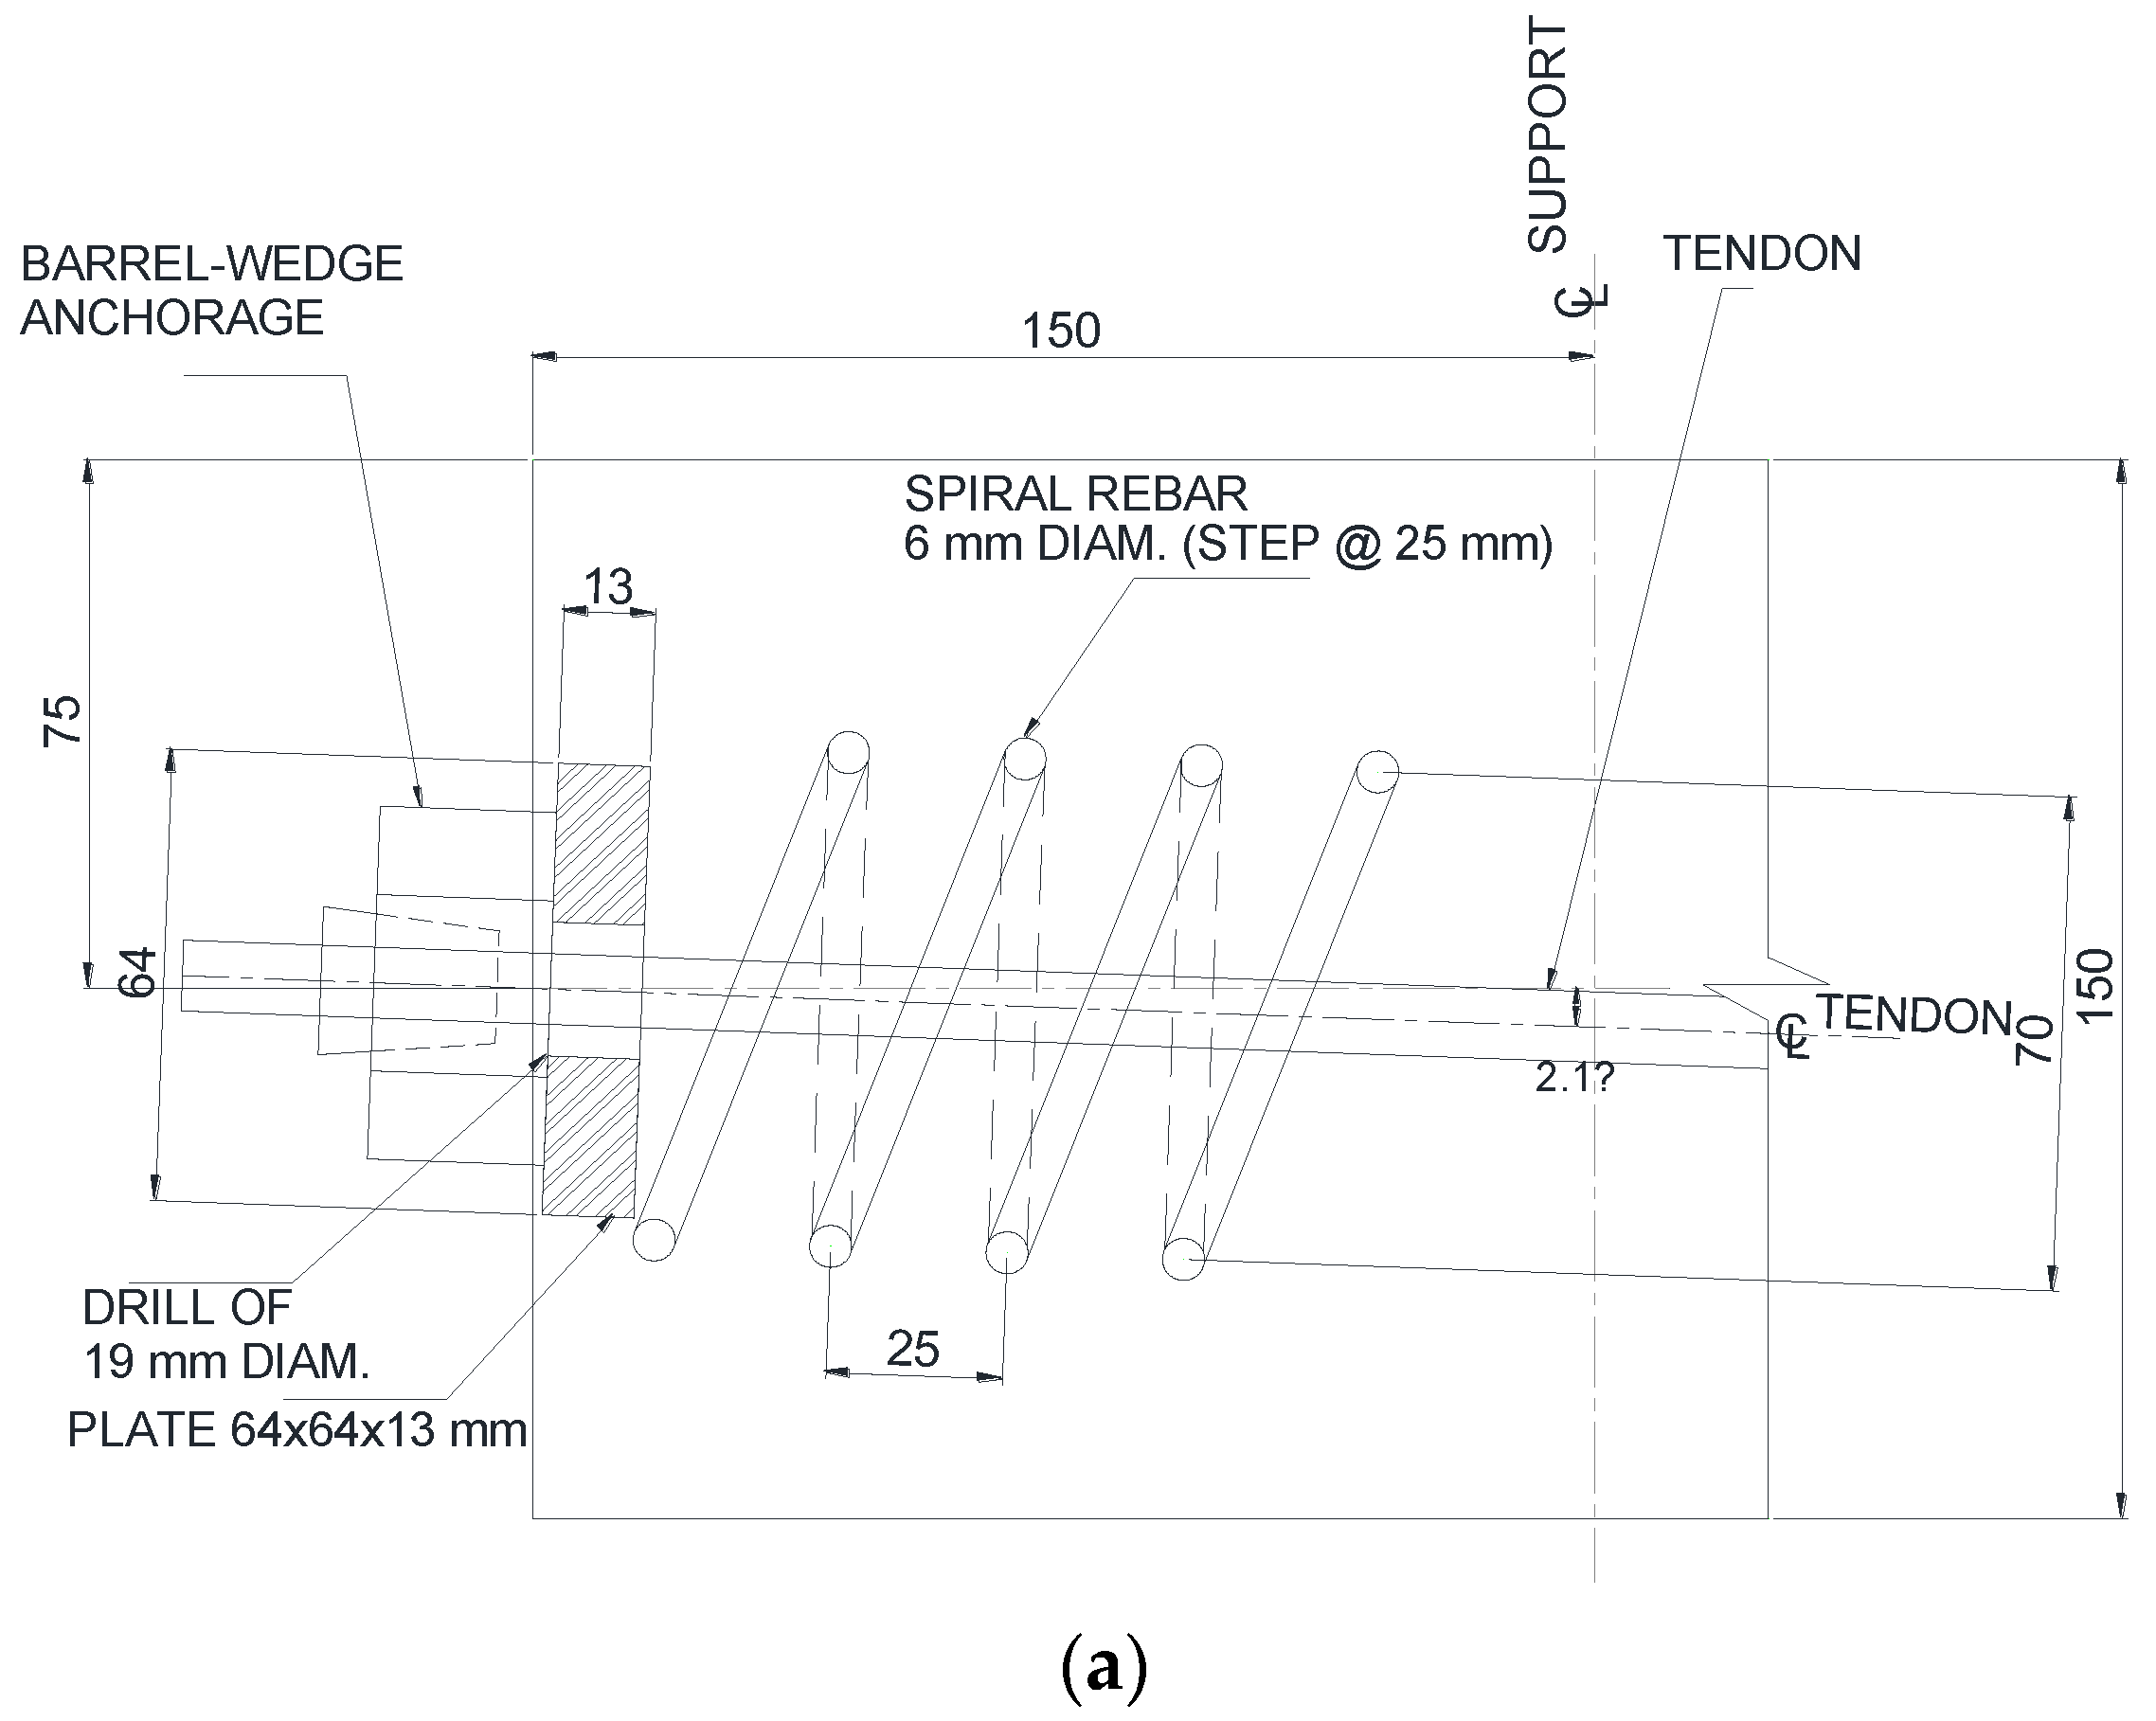
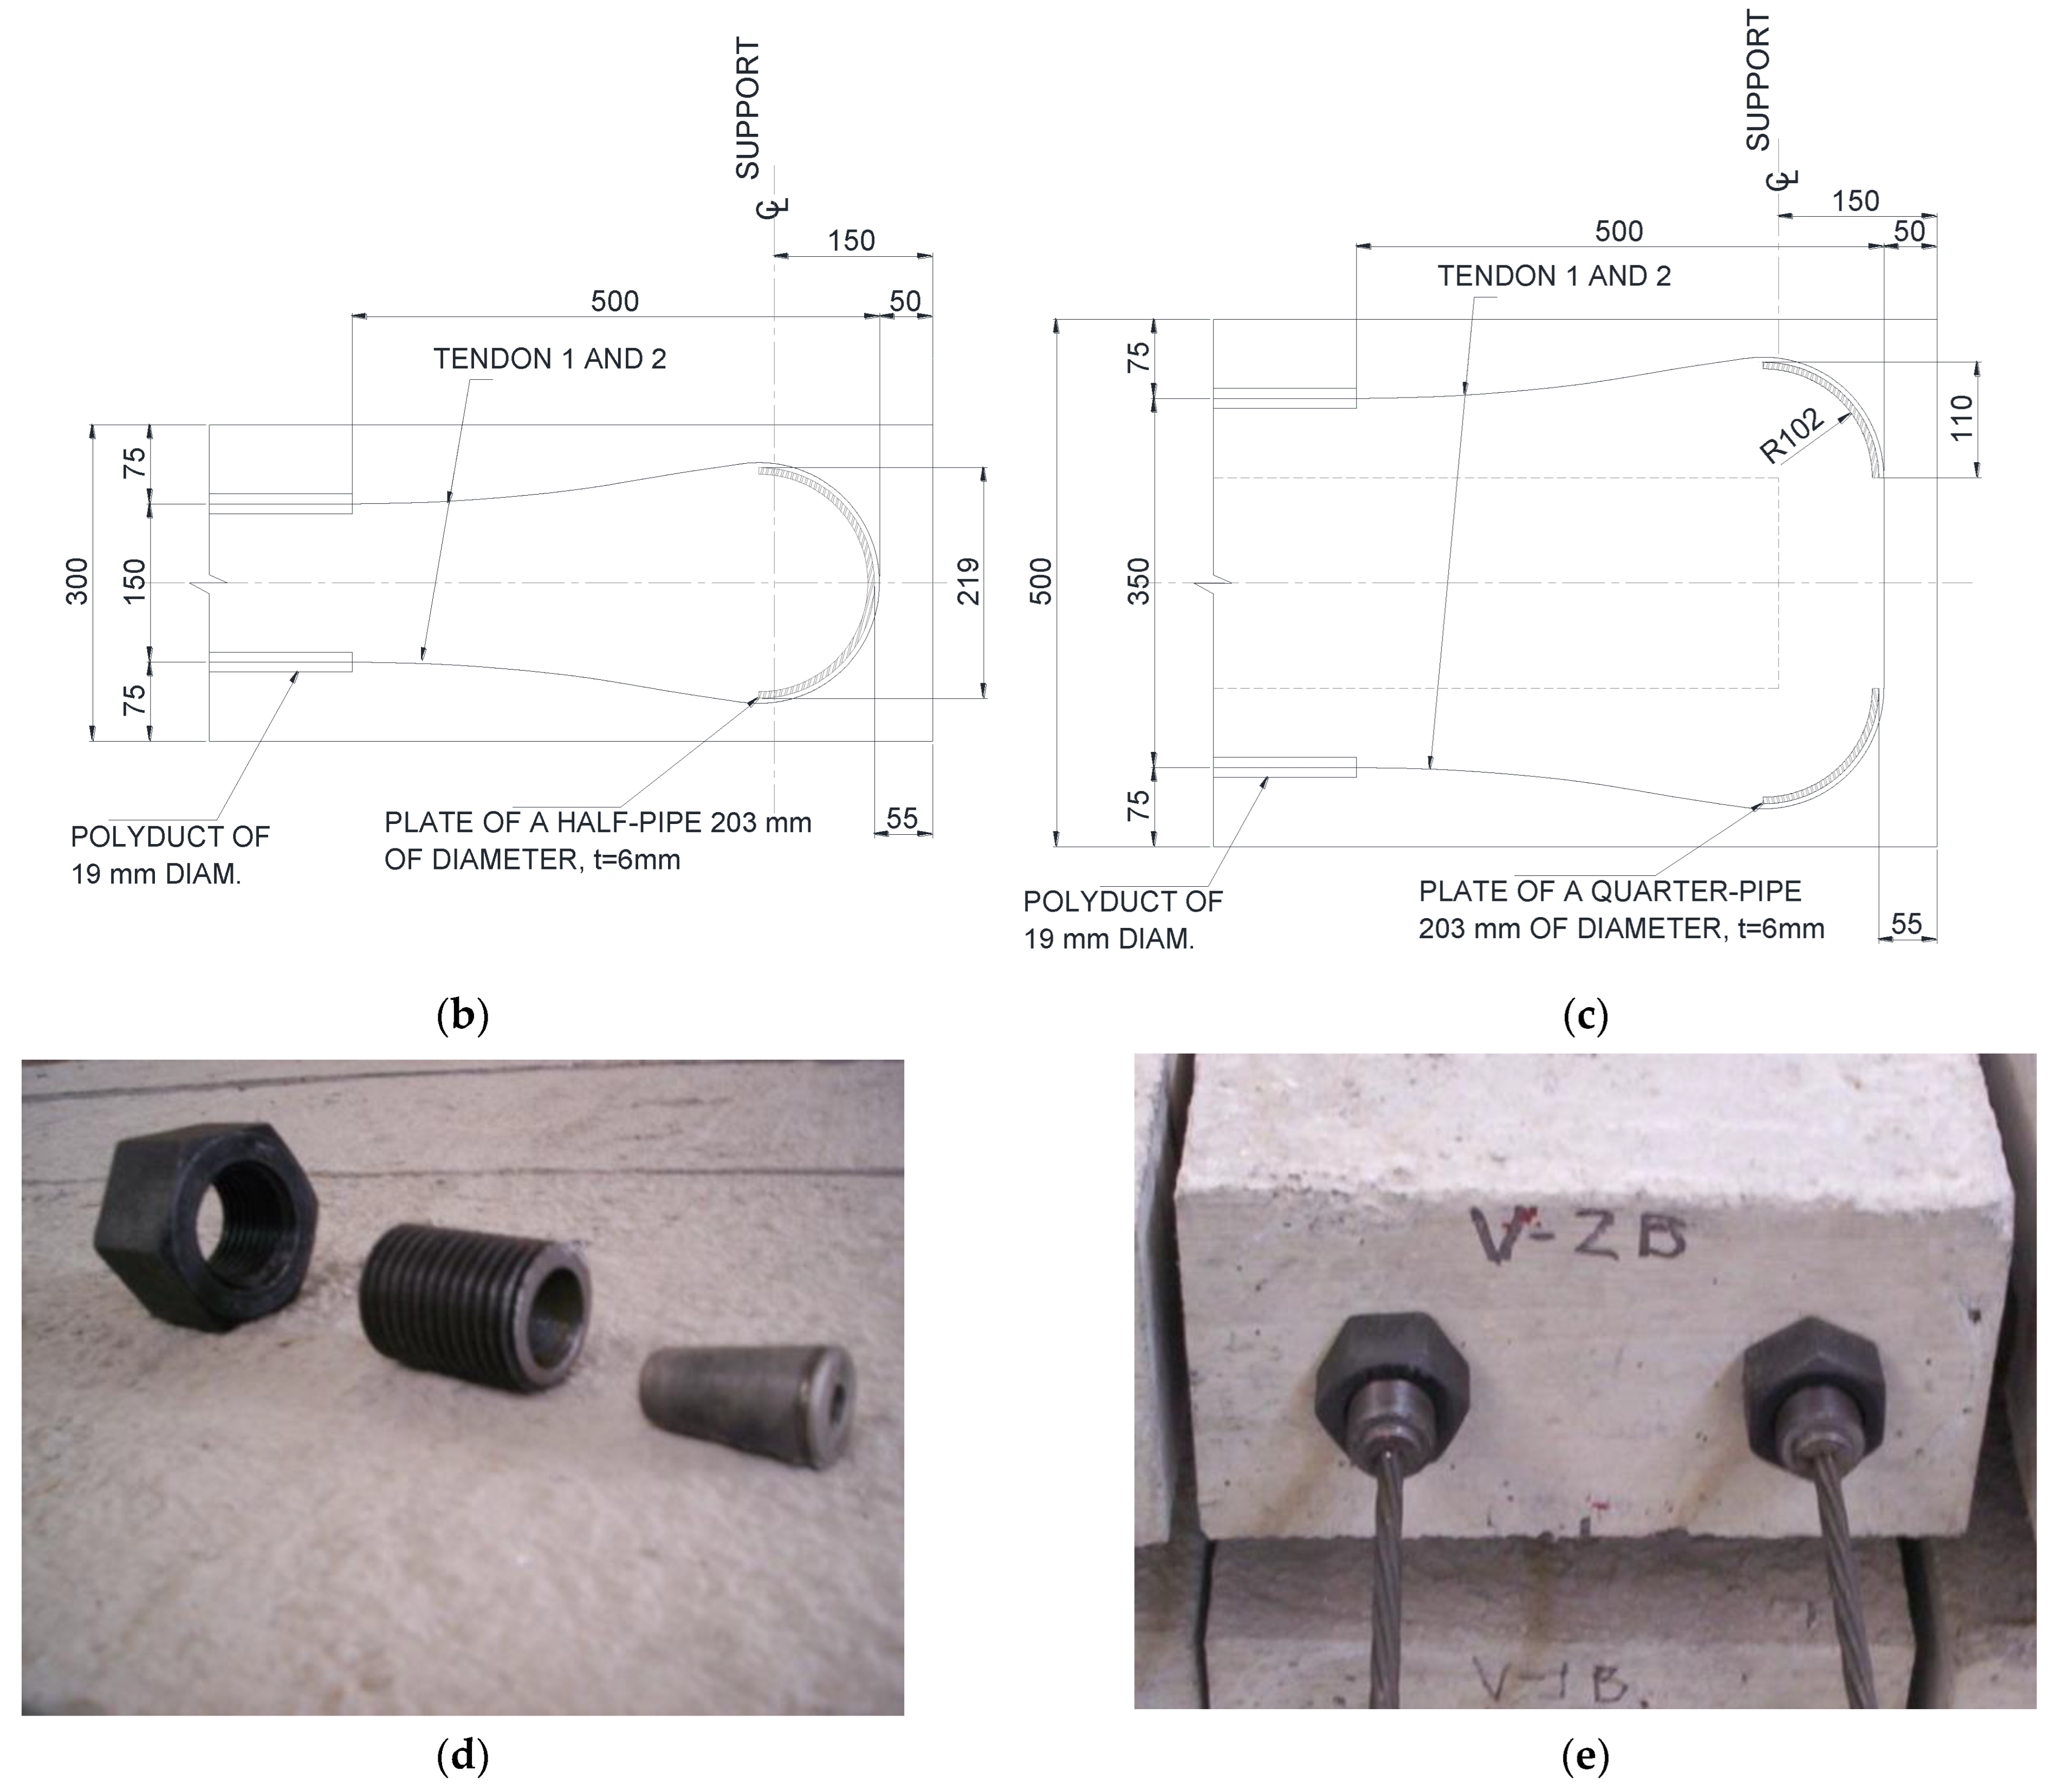
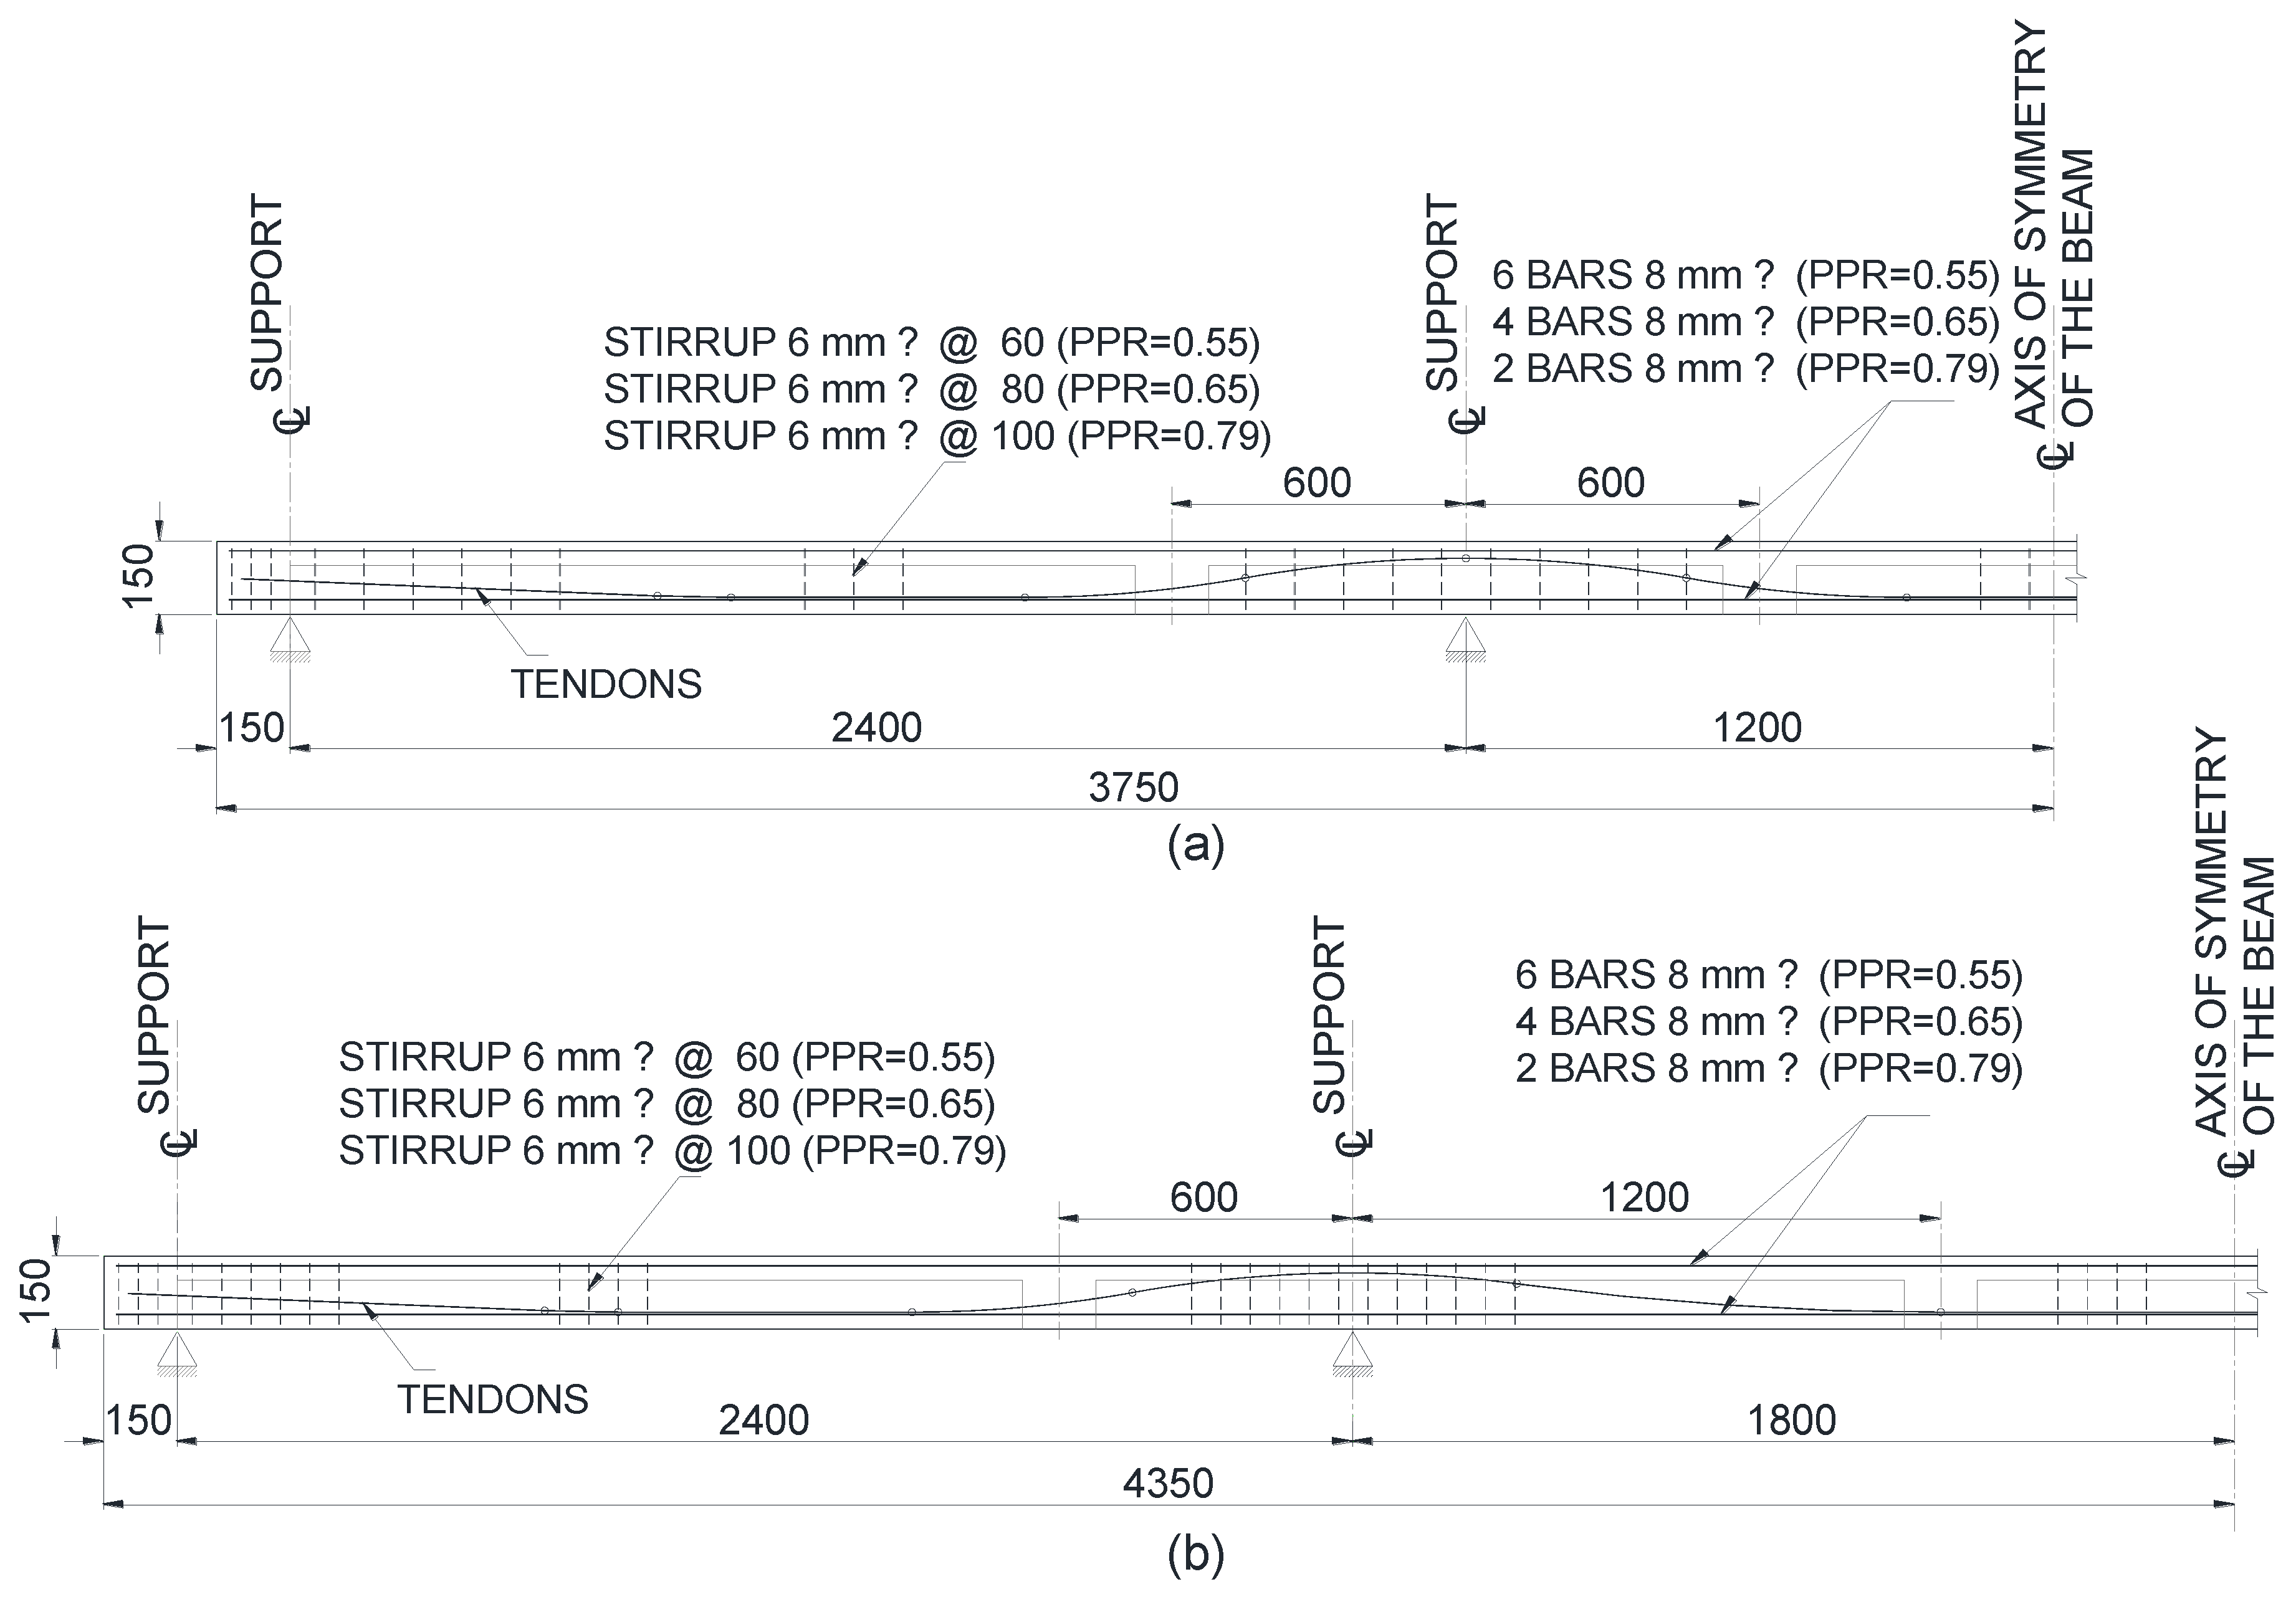
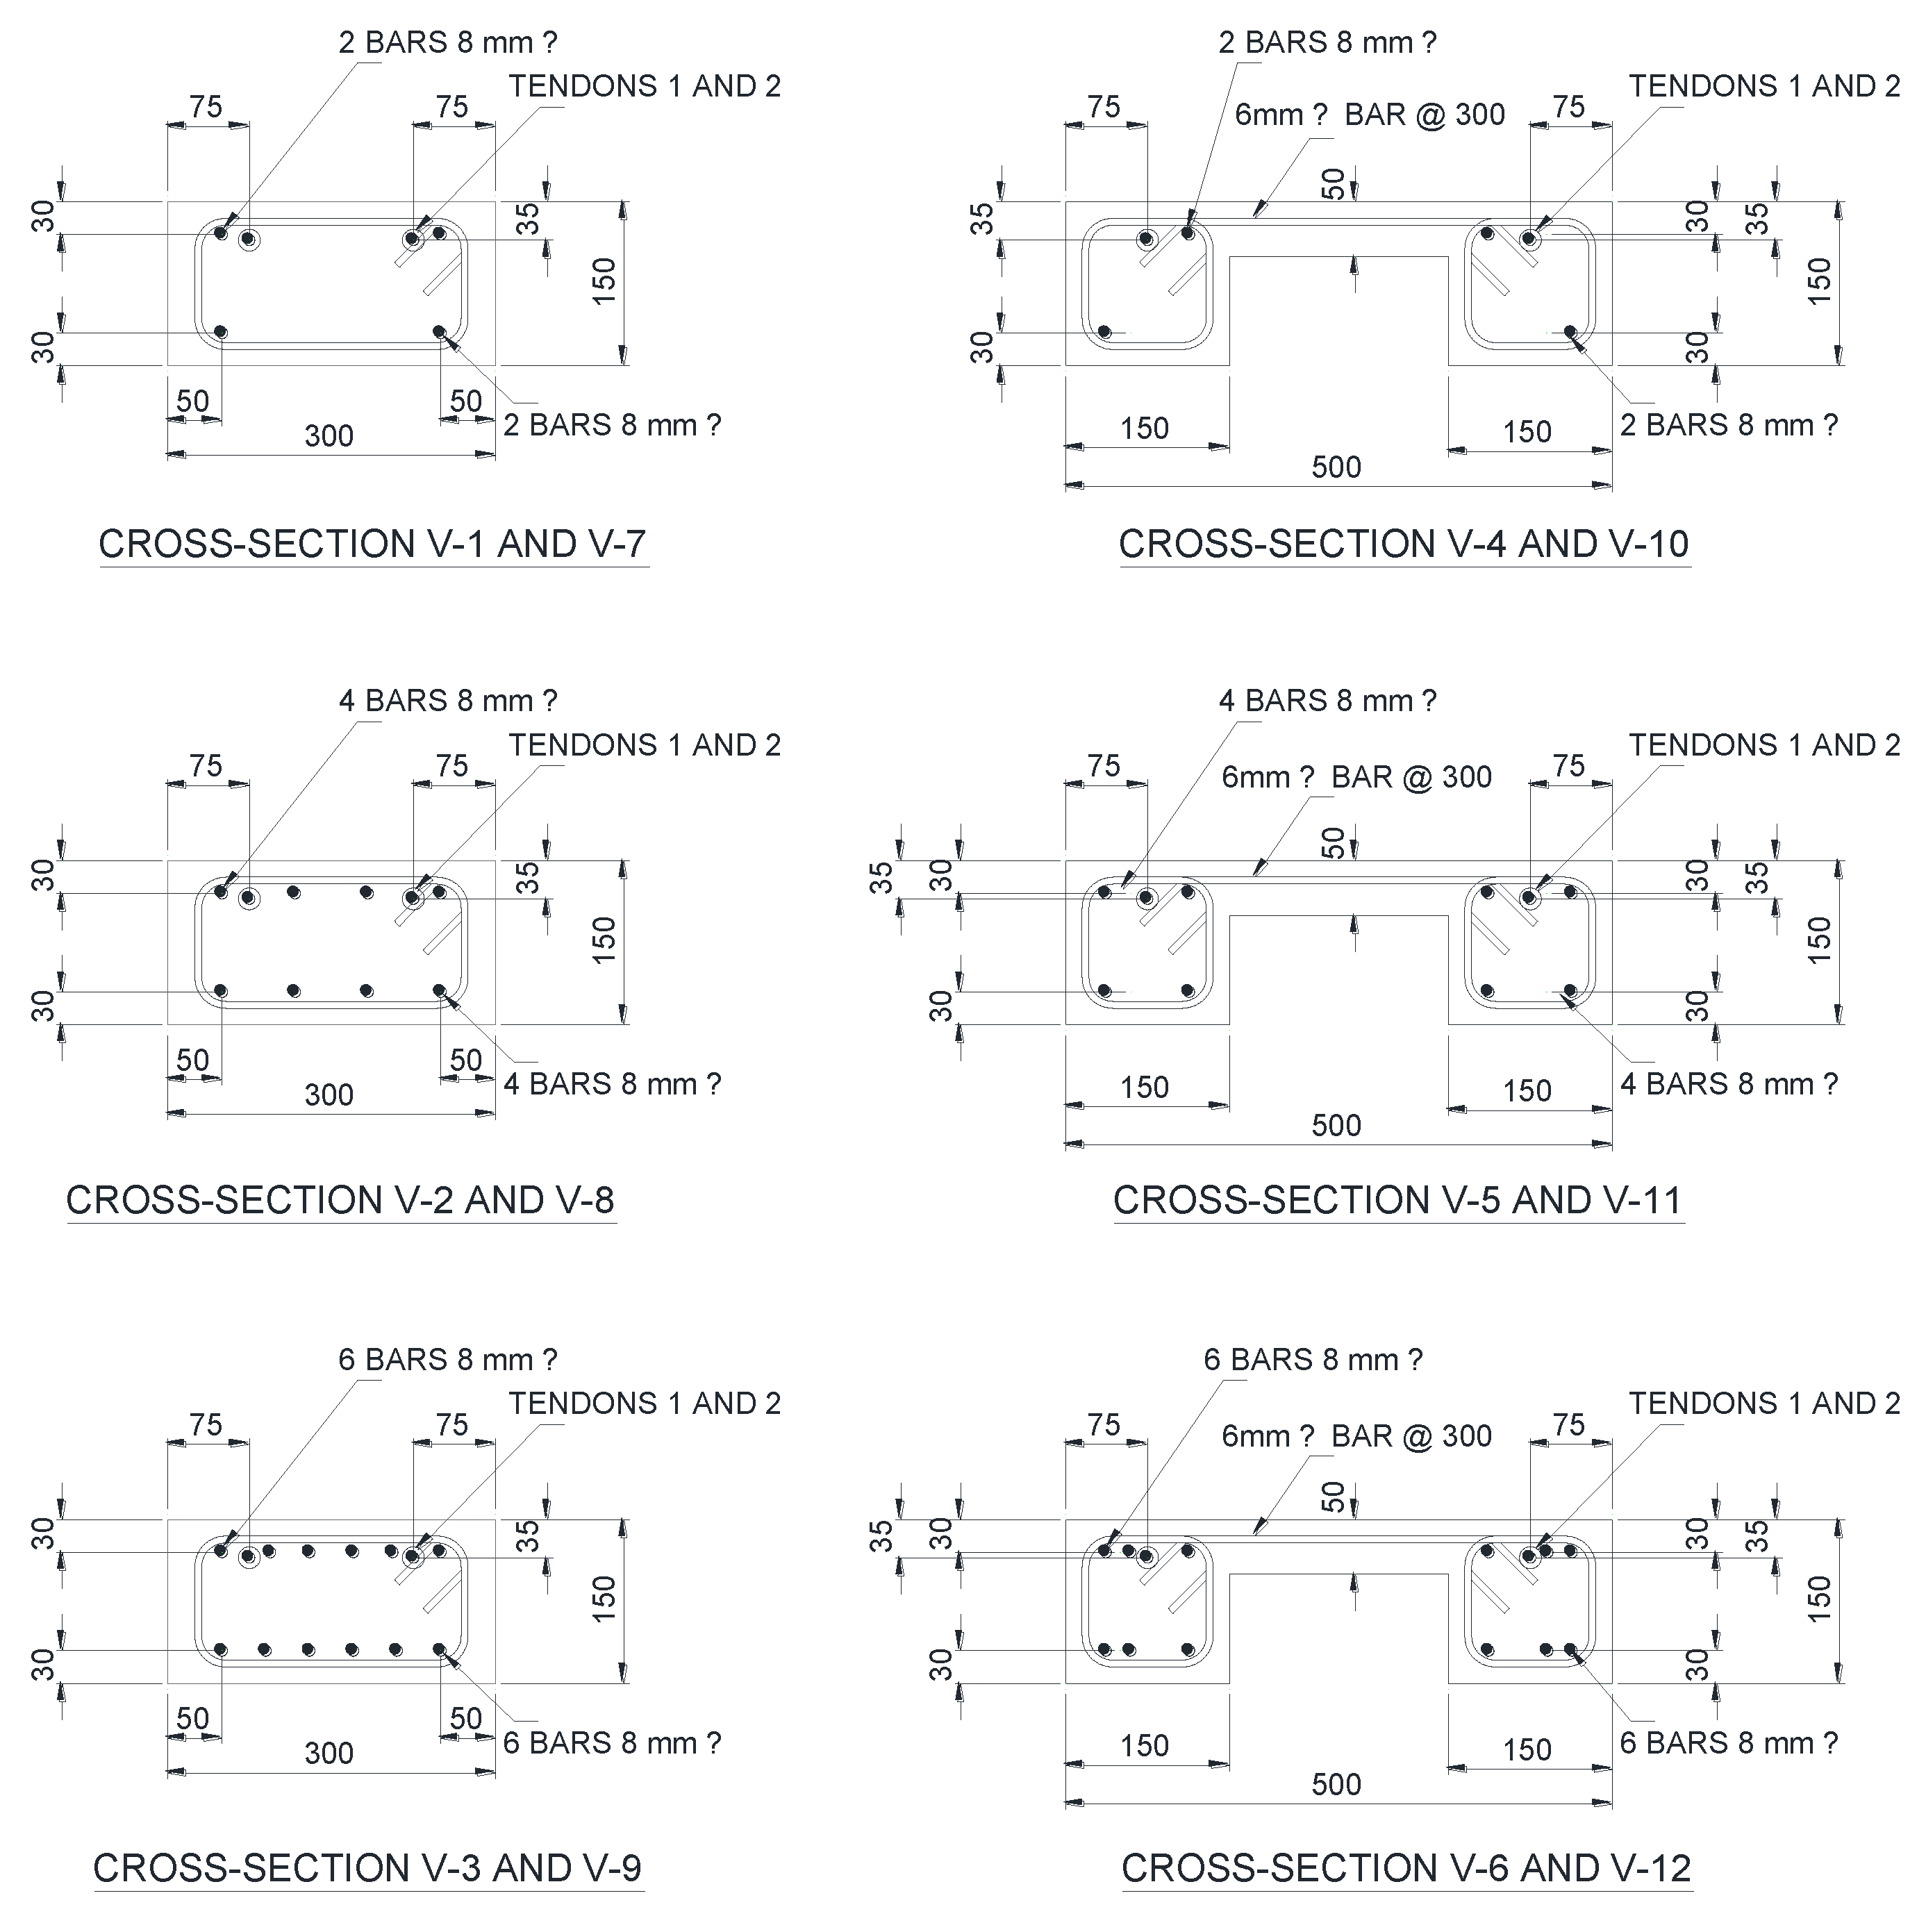
2.3. Description of Specimens

Figure 2 and Figure 3 show the overall dimensions and cross-sections, respectively, as well as the number of prestressing steel cables and the longitudinal reinforcing steel configuration which varies according to the partial prestressing ratio (PPR). The trajectory of the prestressing cables for the continuous beams is shown in Figure 4. It follows a parabolic configuration over its length according to the positive and negative moment zones, except for a straight-line trajectory of 600 mm at the center of the 2400 mm spans, and another straight line at the middle-third of the central span for the beams with the intermediate span of 3600 m, where concentrated loads were applied.
The instrumentation of the beams used unit strain gauges for conventional reinforcing steel and prestressing steel, placed before concrete pouring in the zones indicated in Figure 4. In addition, strain gauges for concrete were placed in the same zones. Deformations were monitored during the application of the test loads, including the transfer stage of the prestressing.

2.4. Fabrication of Concrete Beams

Concrete fabrication for the 24 beams was carried out following ASTM C-31 [42]. A water–cement ratio (W/C) of 0.5 was used in all cases. Casting was performed in a single pouring operation for each set of two twin beams in a single day. A target strength f′c of 35 MPa and a 200 +/−10 mm slump were considered. Concrete samples were made in 100 × 200 mm cylinders, one pair for each mix, for concrete strength at different ages according to ASTM C-39 [43] and tests were also performed to determine the modulus of elasticity according to ASTM C-469 [44]. Concrete samples were made in 76 mm × 76 mm × 280 mm bars to verify concrete shrinkage according to ASTM C-157 [45]. After casting the beams, normal curing was carried out by placing curing blankets that were constantly moistened for 7 days. The number of mixes produced for each pair of beams varied between 9 and 14, depending on their dimensions, and the quantities of materials also varied slightly depending on the moisture content of the coarse and fine aggregates at the time of casting (Table 2).

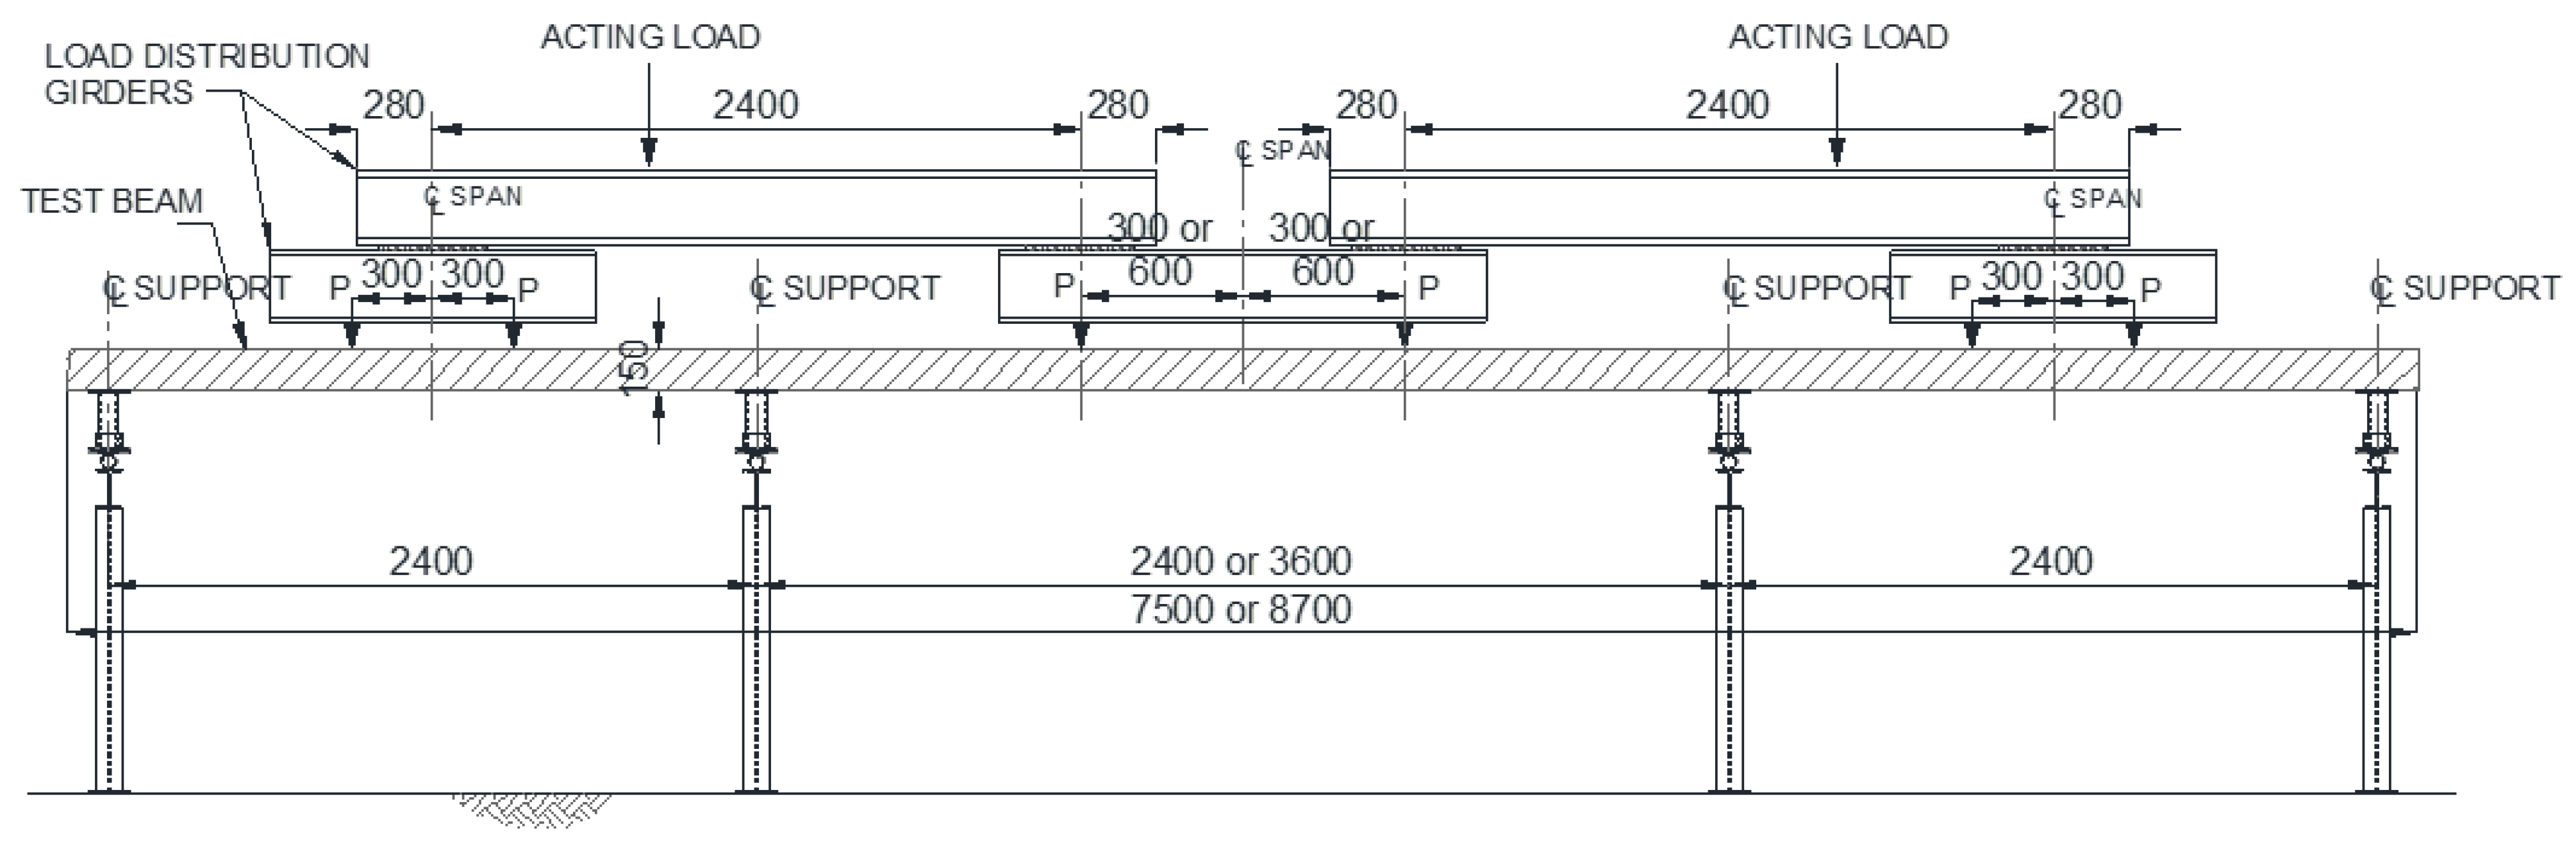
2.5. Testing of Beams

Concentrated loads were applied to each span at the center of the 2400 m spans and to the thirds of the 3600 mm spans (see Figure 5). The load was applied in increments of 10.08 kN distributed over the beams at the six points indicated in Figure 5 until the failure load was attained. Displacement transducers were placed at the centers of the three spans in each of the beams for the measurement of deflections at the different load stages mentioned. At the same time, displacement transducers were also used at the ends of the beams to measure the shortening or elongation during the tests.
During the tests, data acquisition equipment was used to record data readings from the different sensors for each load increment. Also, the amount and distribution of cracking were observed, and crack widths were measured with a portable optical microscope at 50× magnification for each of the aforementioned load stages.

3. Analysis and Discussion of Results

The concrete compressive strength f′c used in this research followed the results of the tests indicated in Table 3 for each of the types of beams tested.
The strains in the reinforcing steel, the prestressing steel, and the concrete were obtained employing unit strain gauges placed in the positive and negative moment zones for each load increment until the maximum failure load was reached. In addition, the deflections at the center of the three spans, the longitudinal elastic shortenings, and the degree of cracking were measured, including the crack widths, for each load application level and were analytically related to the theoretical deflections of the beams with the same characteristics of the beams used in the tests.

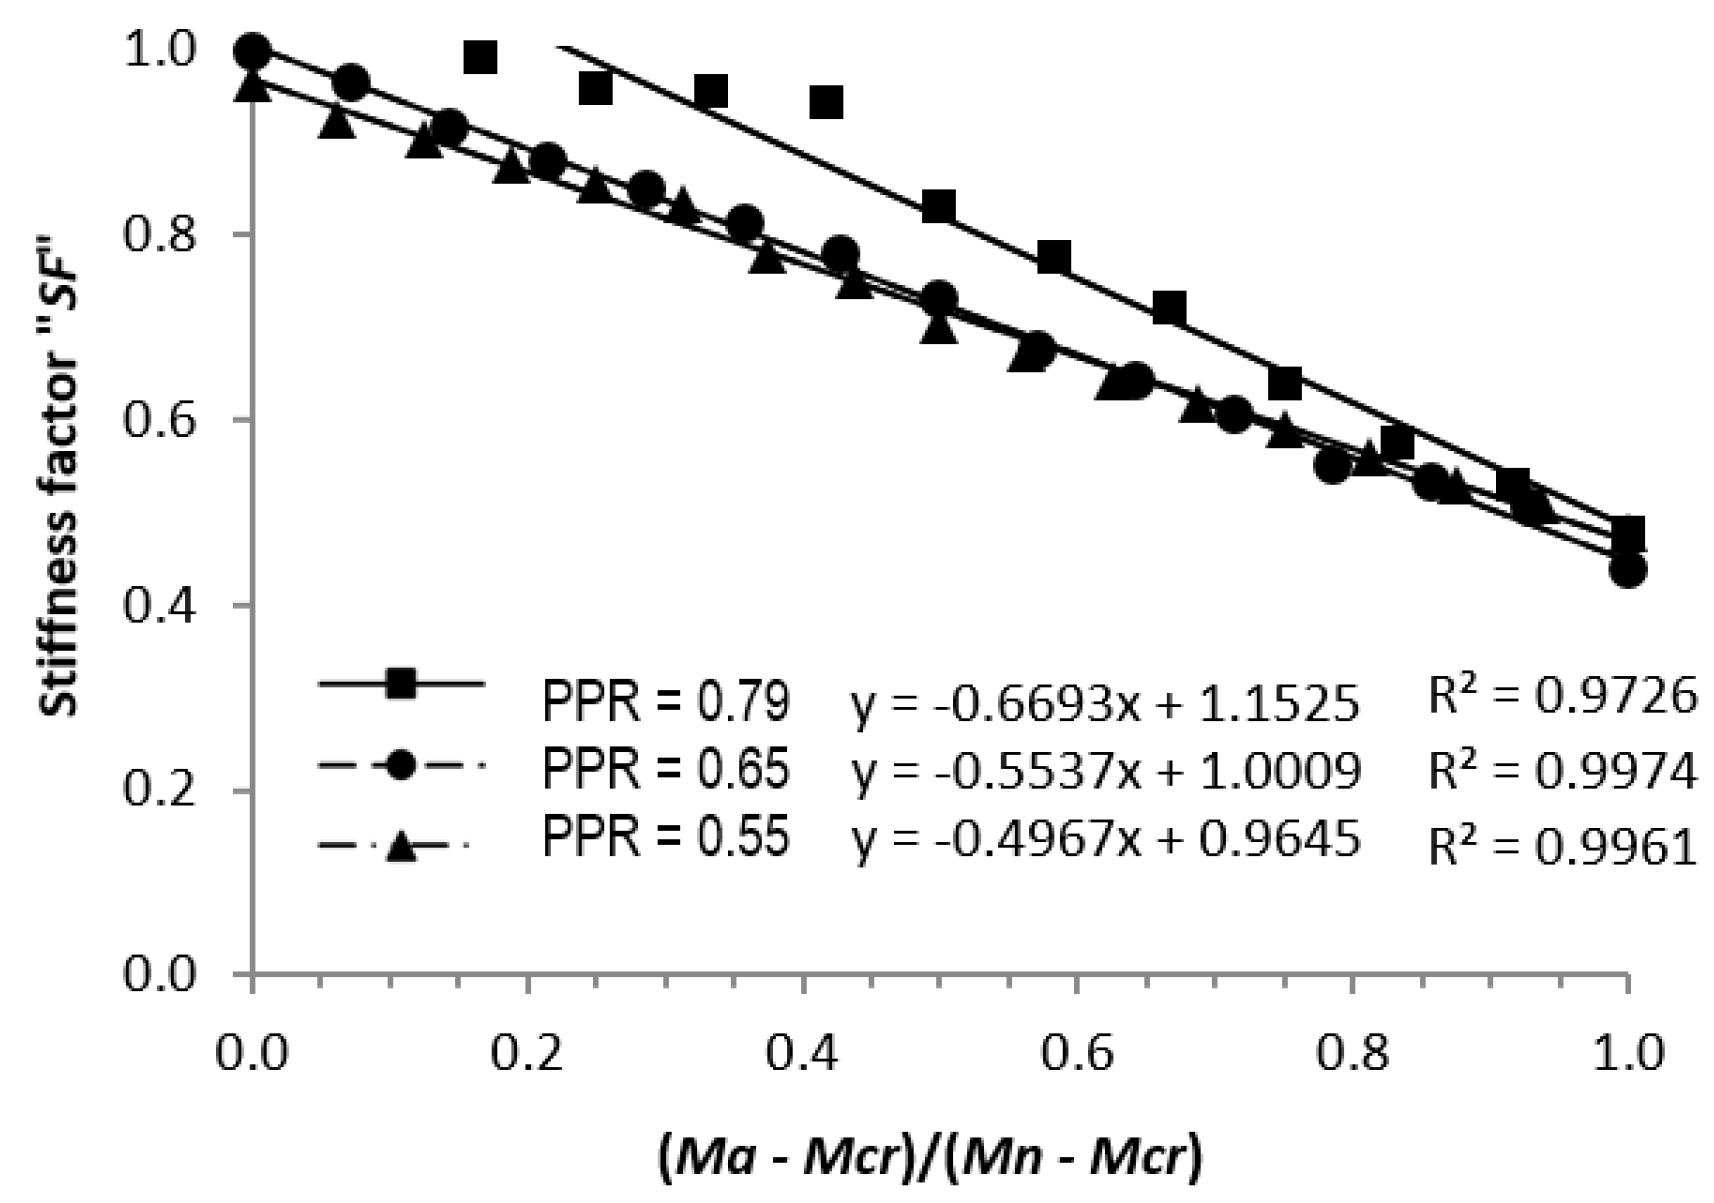
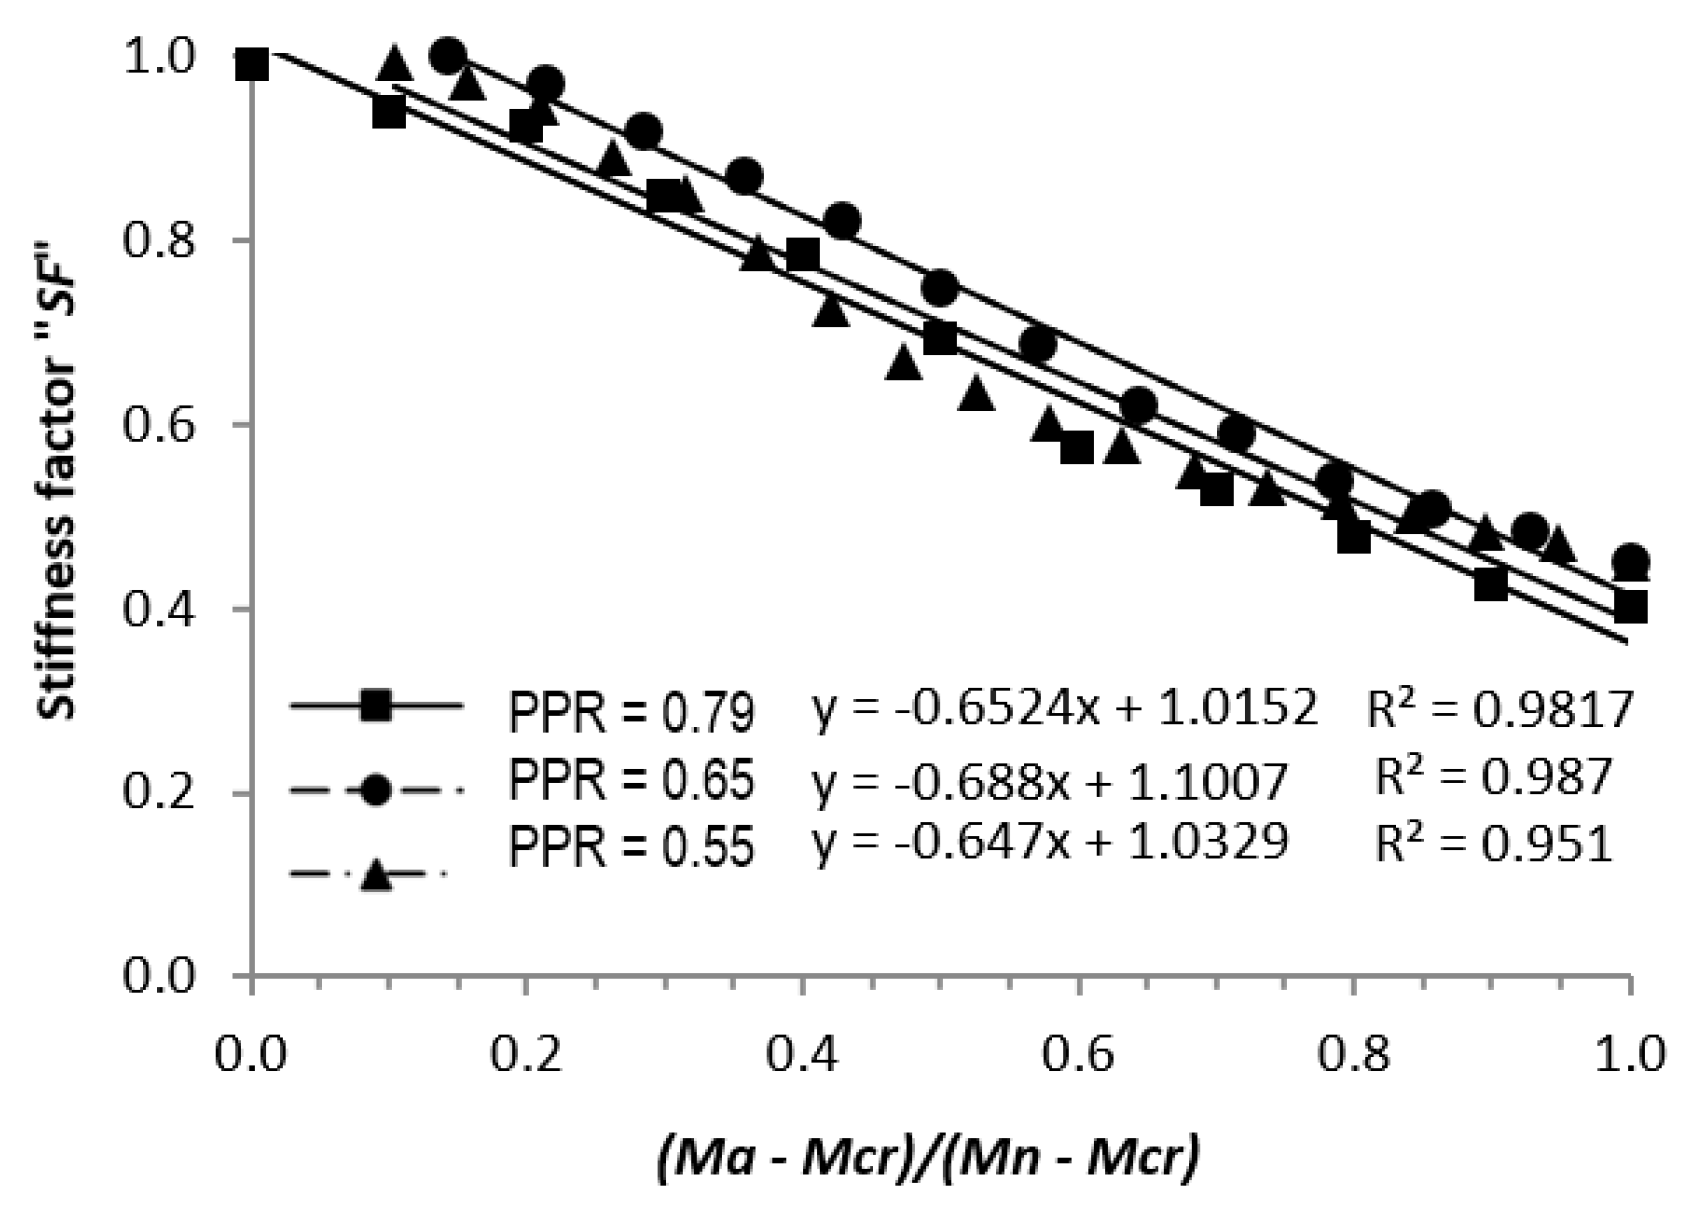
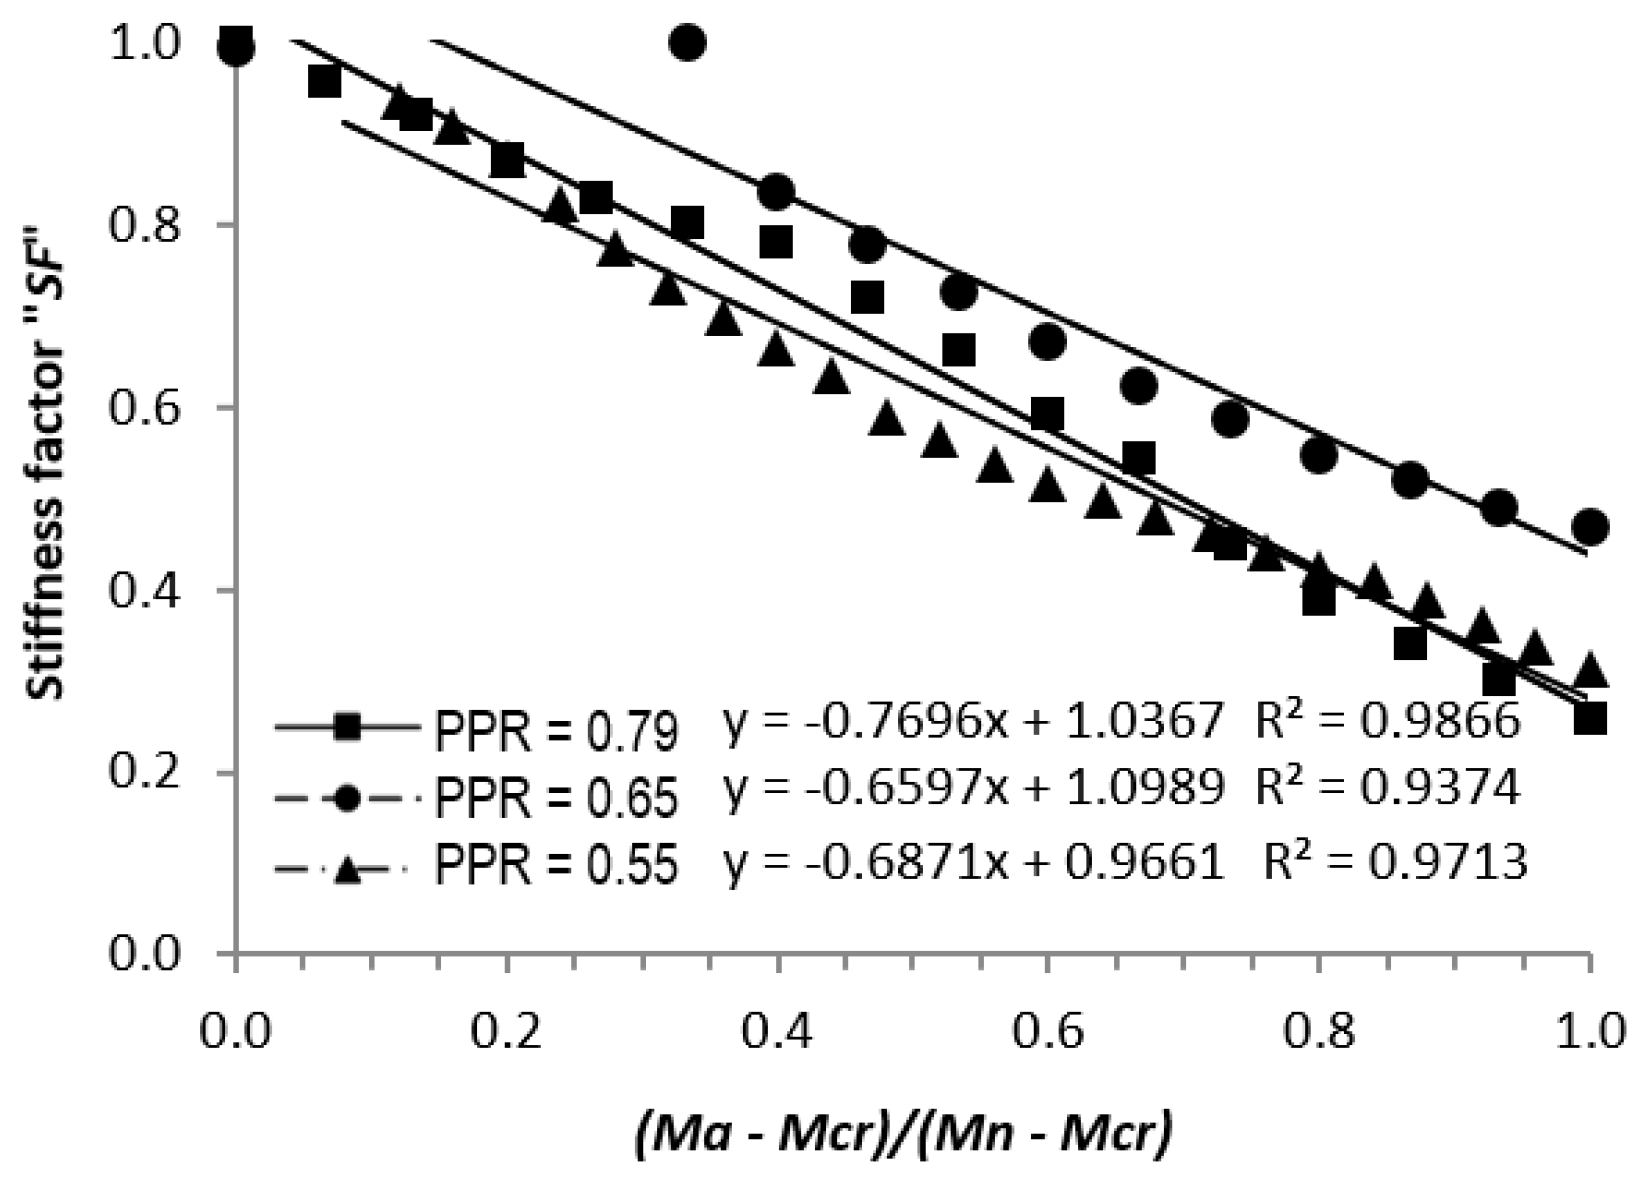
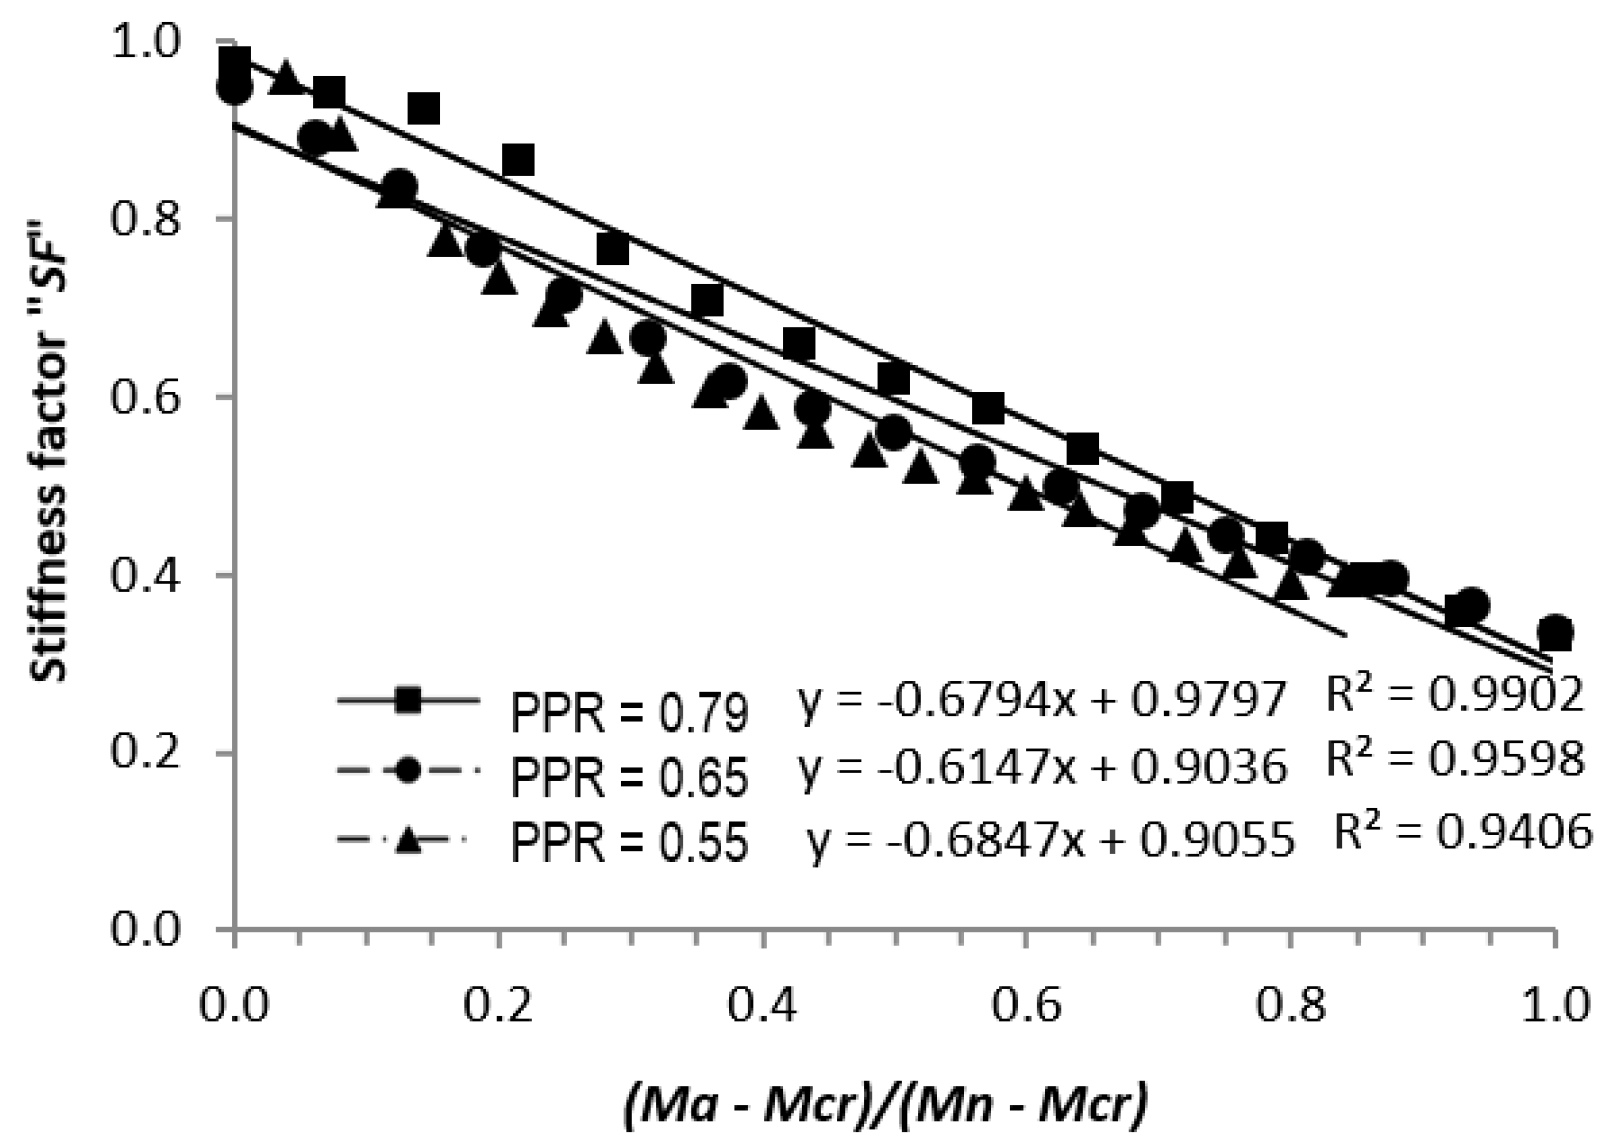
3.1. Flexural Stiffness

From these data, the moment diagrams were elaborated and related to the stresses in the materials and to the deflections. The moment–curvature diagrams were also obtained considering the cross-section at the center of the span and, additionally, the deflections were determined theoretically without considering the decrease in the stiffness of the element, that is, considering the gross inertia of the cross-section and the modulus of elasticity of the concrete obtained from the samples of the cylinders that were tested for this study. These results were compared with the deflections acquired during the tests, which showed a decrease in stiffness as illustrated in Figure 6, Figure 7, Figure 8, Figure 9, Figure 10, Figure 11, Figure 12 and Figure 13. In each of these graphs, the curves corresponding to beams with three different partial prestressing ratios (PPRs) are shown and it is observed, in most cases, that the decrease in stiffness starts when the first cracking appears; however, in some few cases, the decrease in stiffness also occurred, to a lesser degree, in the absence of cracks at the centers of the span but with cracking on the supports.
On the ordinates of these graphs (Figure 6, Figure 7, Figure 8, Figure 9, Figure 10, Figure 11, Figure 12 and Figure 13), the stiffness factor “SF” is indicated, and, on the abscissa, the applied load is indicated as a function of the moment ratio (Ma-Mcr)/(Mn-Mcr), where the moment Ma is the moment for which the bending stiffness at any loading stage is to be determined, Mcr is the cracking moment that was obtained when the first crack was observed for each particular zone, and Mn is the maximum bending moment that was determined when the yield stress was first reached in the conventional steel for that zone. In these same graphs, trend lines were included from the onset of cracking to the application of the load that produced the onset of the yield stress in the conventional reinforcing steel. The correlation of these straight lines ranged from 0.94 to 0.99, which indicates that it is suitable to consider a linear behavior to estimate the decrease in stiffness of the tested beams.
In these graphs (Figure 6, Figure 7, Figure 8, Figure 9, Figure 10, Figure 11, Figure 12 and Figure 13), the stiffness factor “SF” takes the value of one if there are no cracks, i.e., when the acting moment (Ma) is equal to the cracking moment (Mcr). As the acting moment (Ma) increases, the stiffness factor begins to decrease until this acting moment Ma reaches the nominal resisting moment of the beam Mn. The graphs are prepared for different acting moments (Ma) from Mcr to Mn and the results obtained represent the decrease in the moment of inertia of the cross-section of these types of beams tested, indicating that cracking of the cross-section would develop with the increase in applied loads.
In general, the slope of these straight lines, in the same zone of the beams, is similar for the three different partial prestressing ratios (PPRs) and, also, it is observed that the decrease in stiffness varies from 55% to 72% of the stiffness value of the uncracked cross-section depending on the type of beam. Specifically, the value of the stiffness “SF”, with respect to the uncracked concrete sections, and independently of the type of cross-section, decreases on average for exterior spans up to 45% and for interior spans up to 72%.
In all cases, linear behavior is observed for any type of cross-section and for each positive or negative moment zone. Each figure includes the equation of a straight line for each beam with different values of the PPR, which indicates that the decrease in stiffness is linear from the point when the moment cracking occurs until the acting moment reaches the maximum nominal moment Mn. This information represents the stiffness behavior of partially prestressed beams with unbonded tendons.
Regarding what was previously discussed and according to Figure 6, Figure 7, Figure 8, Figure 9, Figure 10, Figure 11, Figure 12 and Figure 13, and regarding the relationship between the decrease in stiffness of partially prestressed members with unbonded tendons, considering the uncracked and cracked inertias of their cross-sections, the degree of cracking, and the partial prestressing ratio (PPR), involved in the maximum bending moment (Mn), Equation (1) was proposed to determine the stiffness factor “SF”. In this equation, the terms in parentheses involving moments and inertias are the slopes of the straight lines in the previous graphs and the unit value represents the stiffness factor “SF” at the initiation of the cracking of the cross-section at the center of the span considered. The proposed equation, to determine the stiffness value (SF), is as follows:
S F = 1 M a M c r M n M c r 1 I c r I g
where
  • SF = Stiffness factor as a function of the elastic modulus of concrete (Ec) and the gross moment of inertia (Ig).
  • Ma = Acting moment at the stage where deflection is to be determined.
  • Mcr = Cracking moment obtained during the application of the test loads.
  • Mn = Bending moment strength.
  • Ig = Gross moment of inertia of the cross-section.
  • Icr = Moment of inertia of the transformed cracked section.
In addition, the above expression considers that the minimum stiffness factor of any cross-section as a function of “EI” is at the instant when the yield stress in the conventional steel first occurs, which is also consistent with the maximum moment present; however, the stiffness continues to decrease with the application of additional loads; but, for purposes of estimating deflections for service loads, the equation would be valid from the onset of cracking until the onset of yielding is reached in the conventional reinforcing steel. Because the proposed equation involves the bending resistant moment, which is determined with the stress measured at the yield stress of the conventional steel in the beam, and on which the partial prestressing ratio and the cracking moment also depend, this equation would be valid for PPR ratios from 0.55 to 0.79 and span-to-depth ratios between 16 and 24, according to the beams tested and the results obtained in this research study.

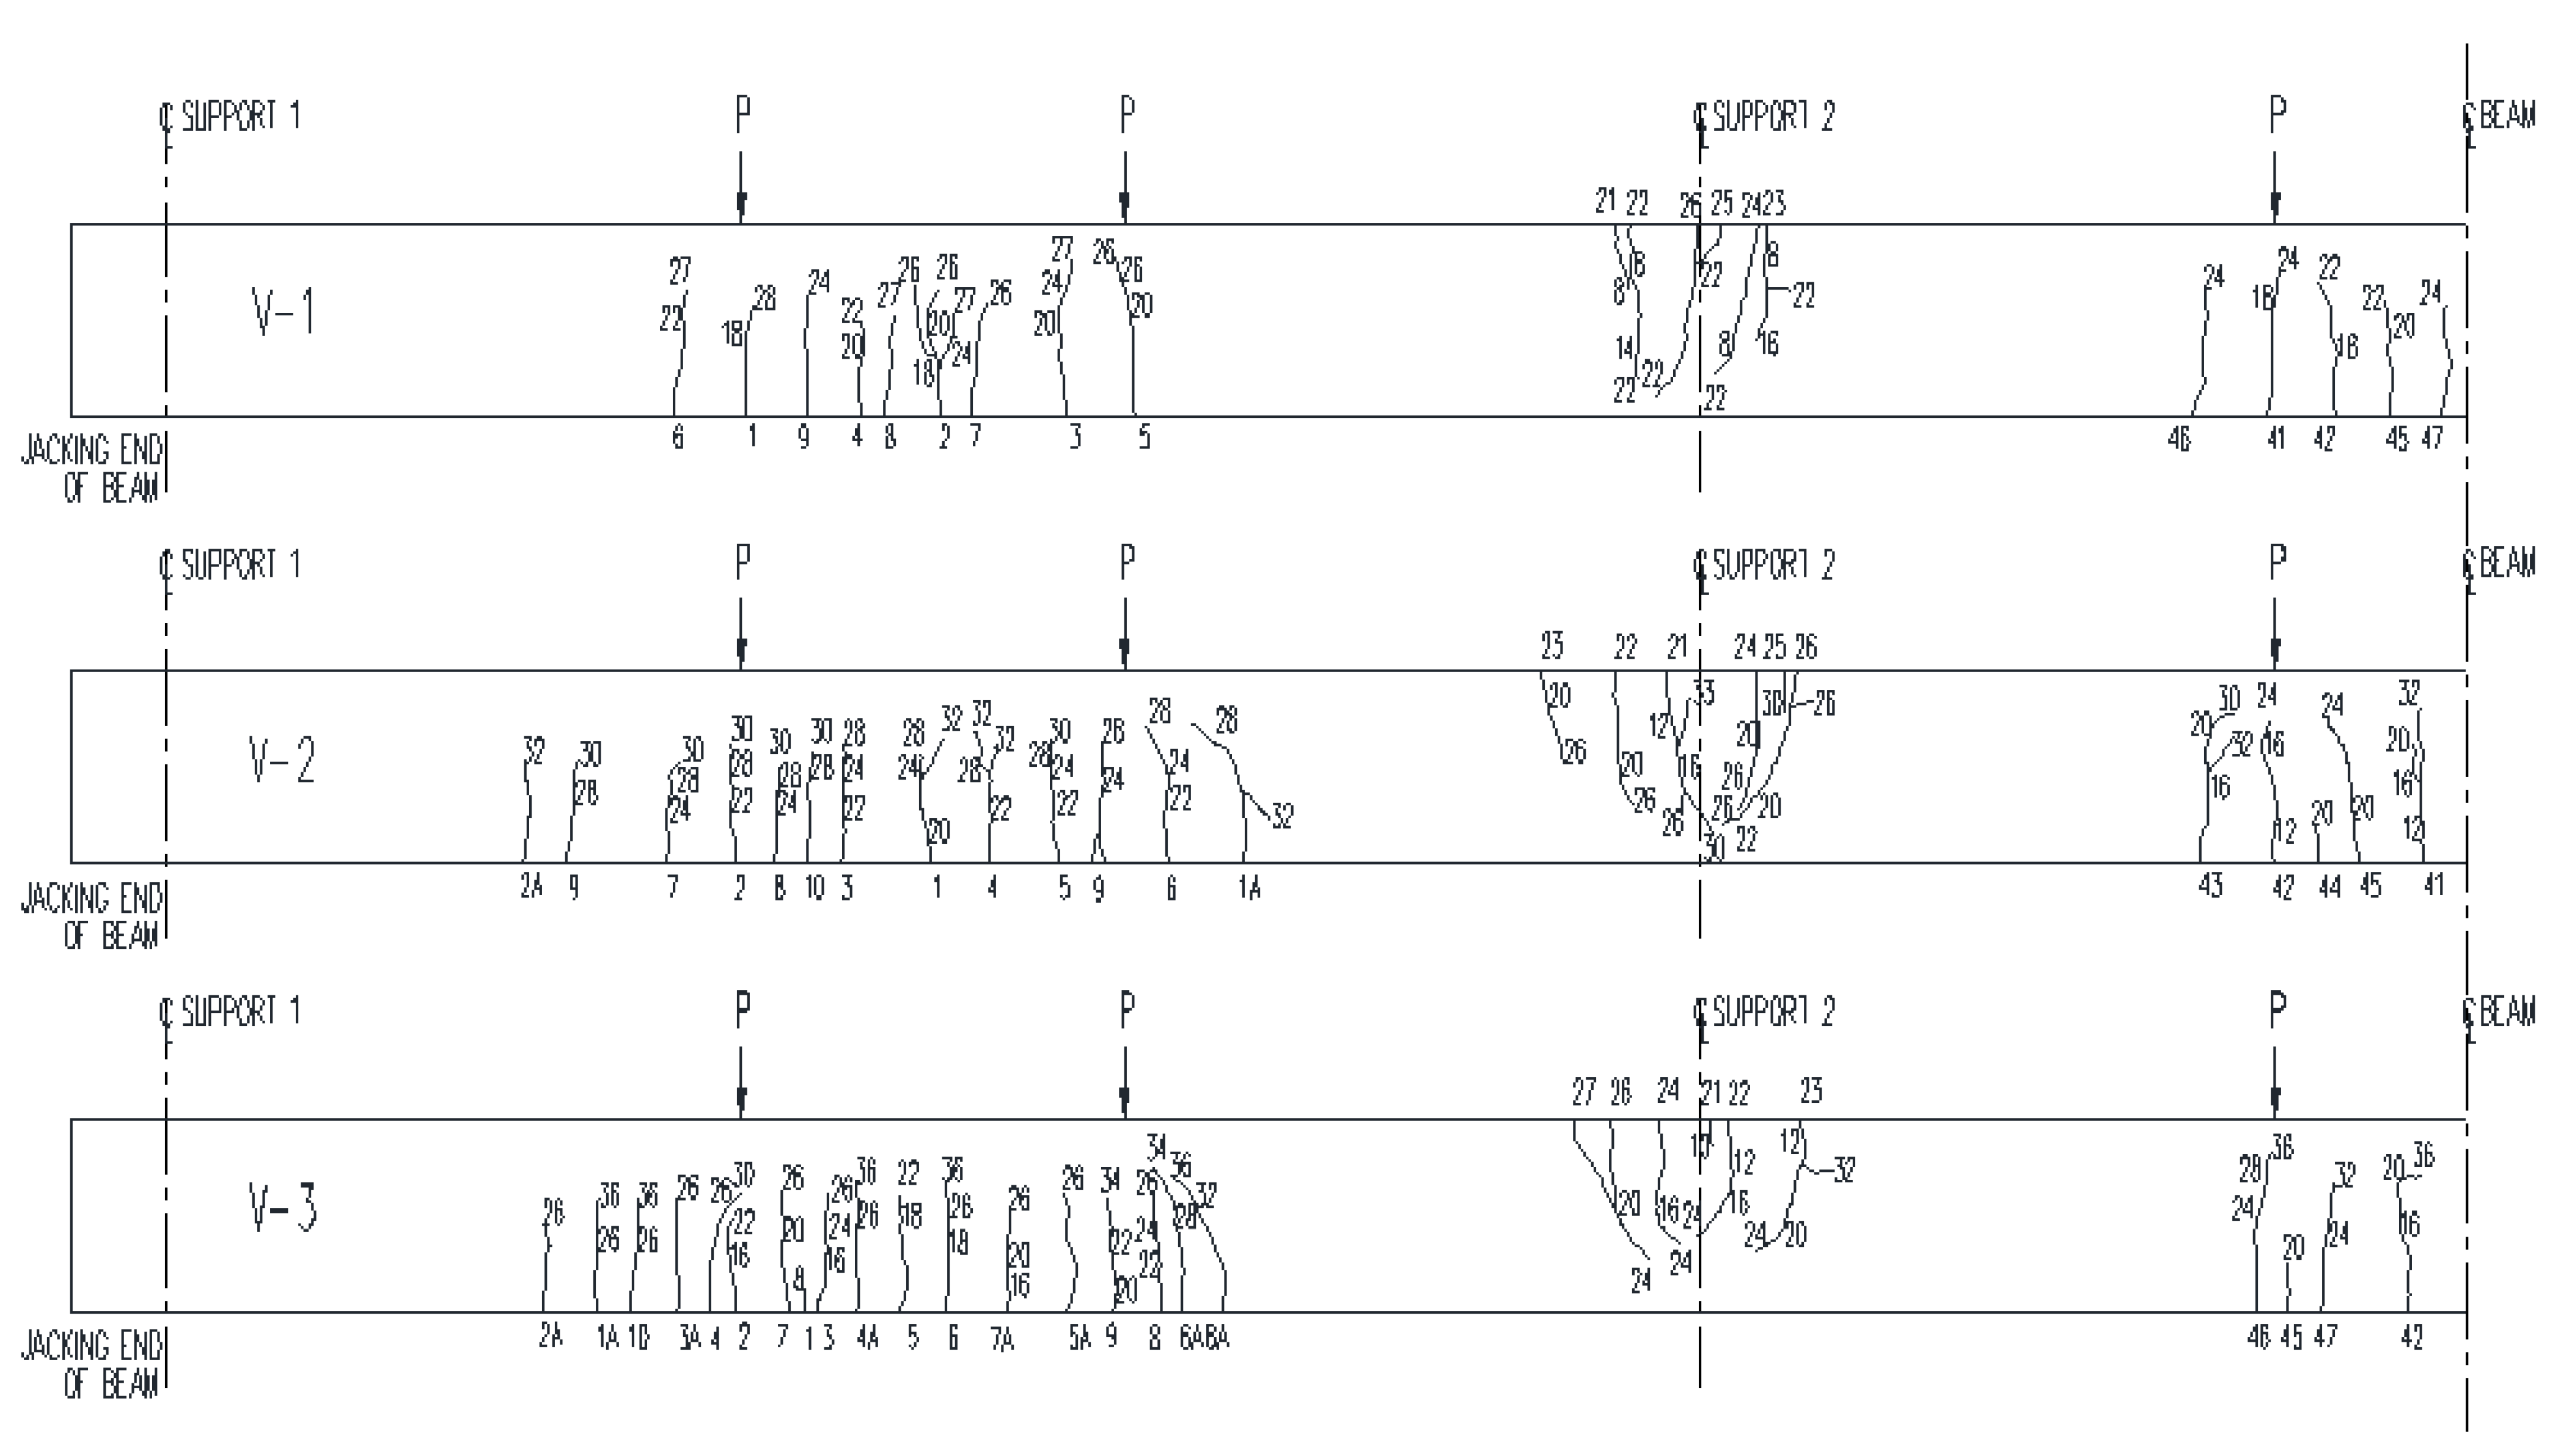
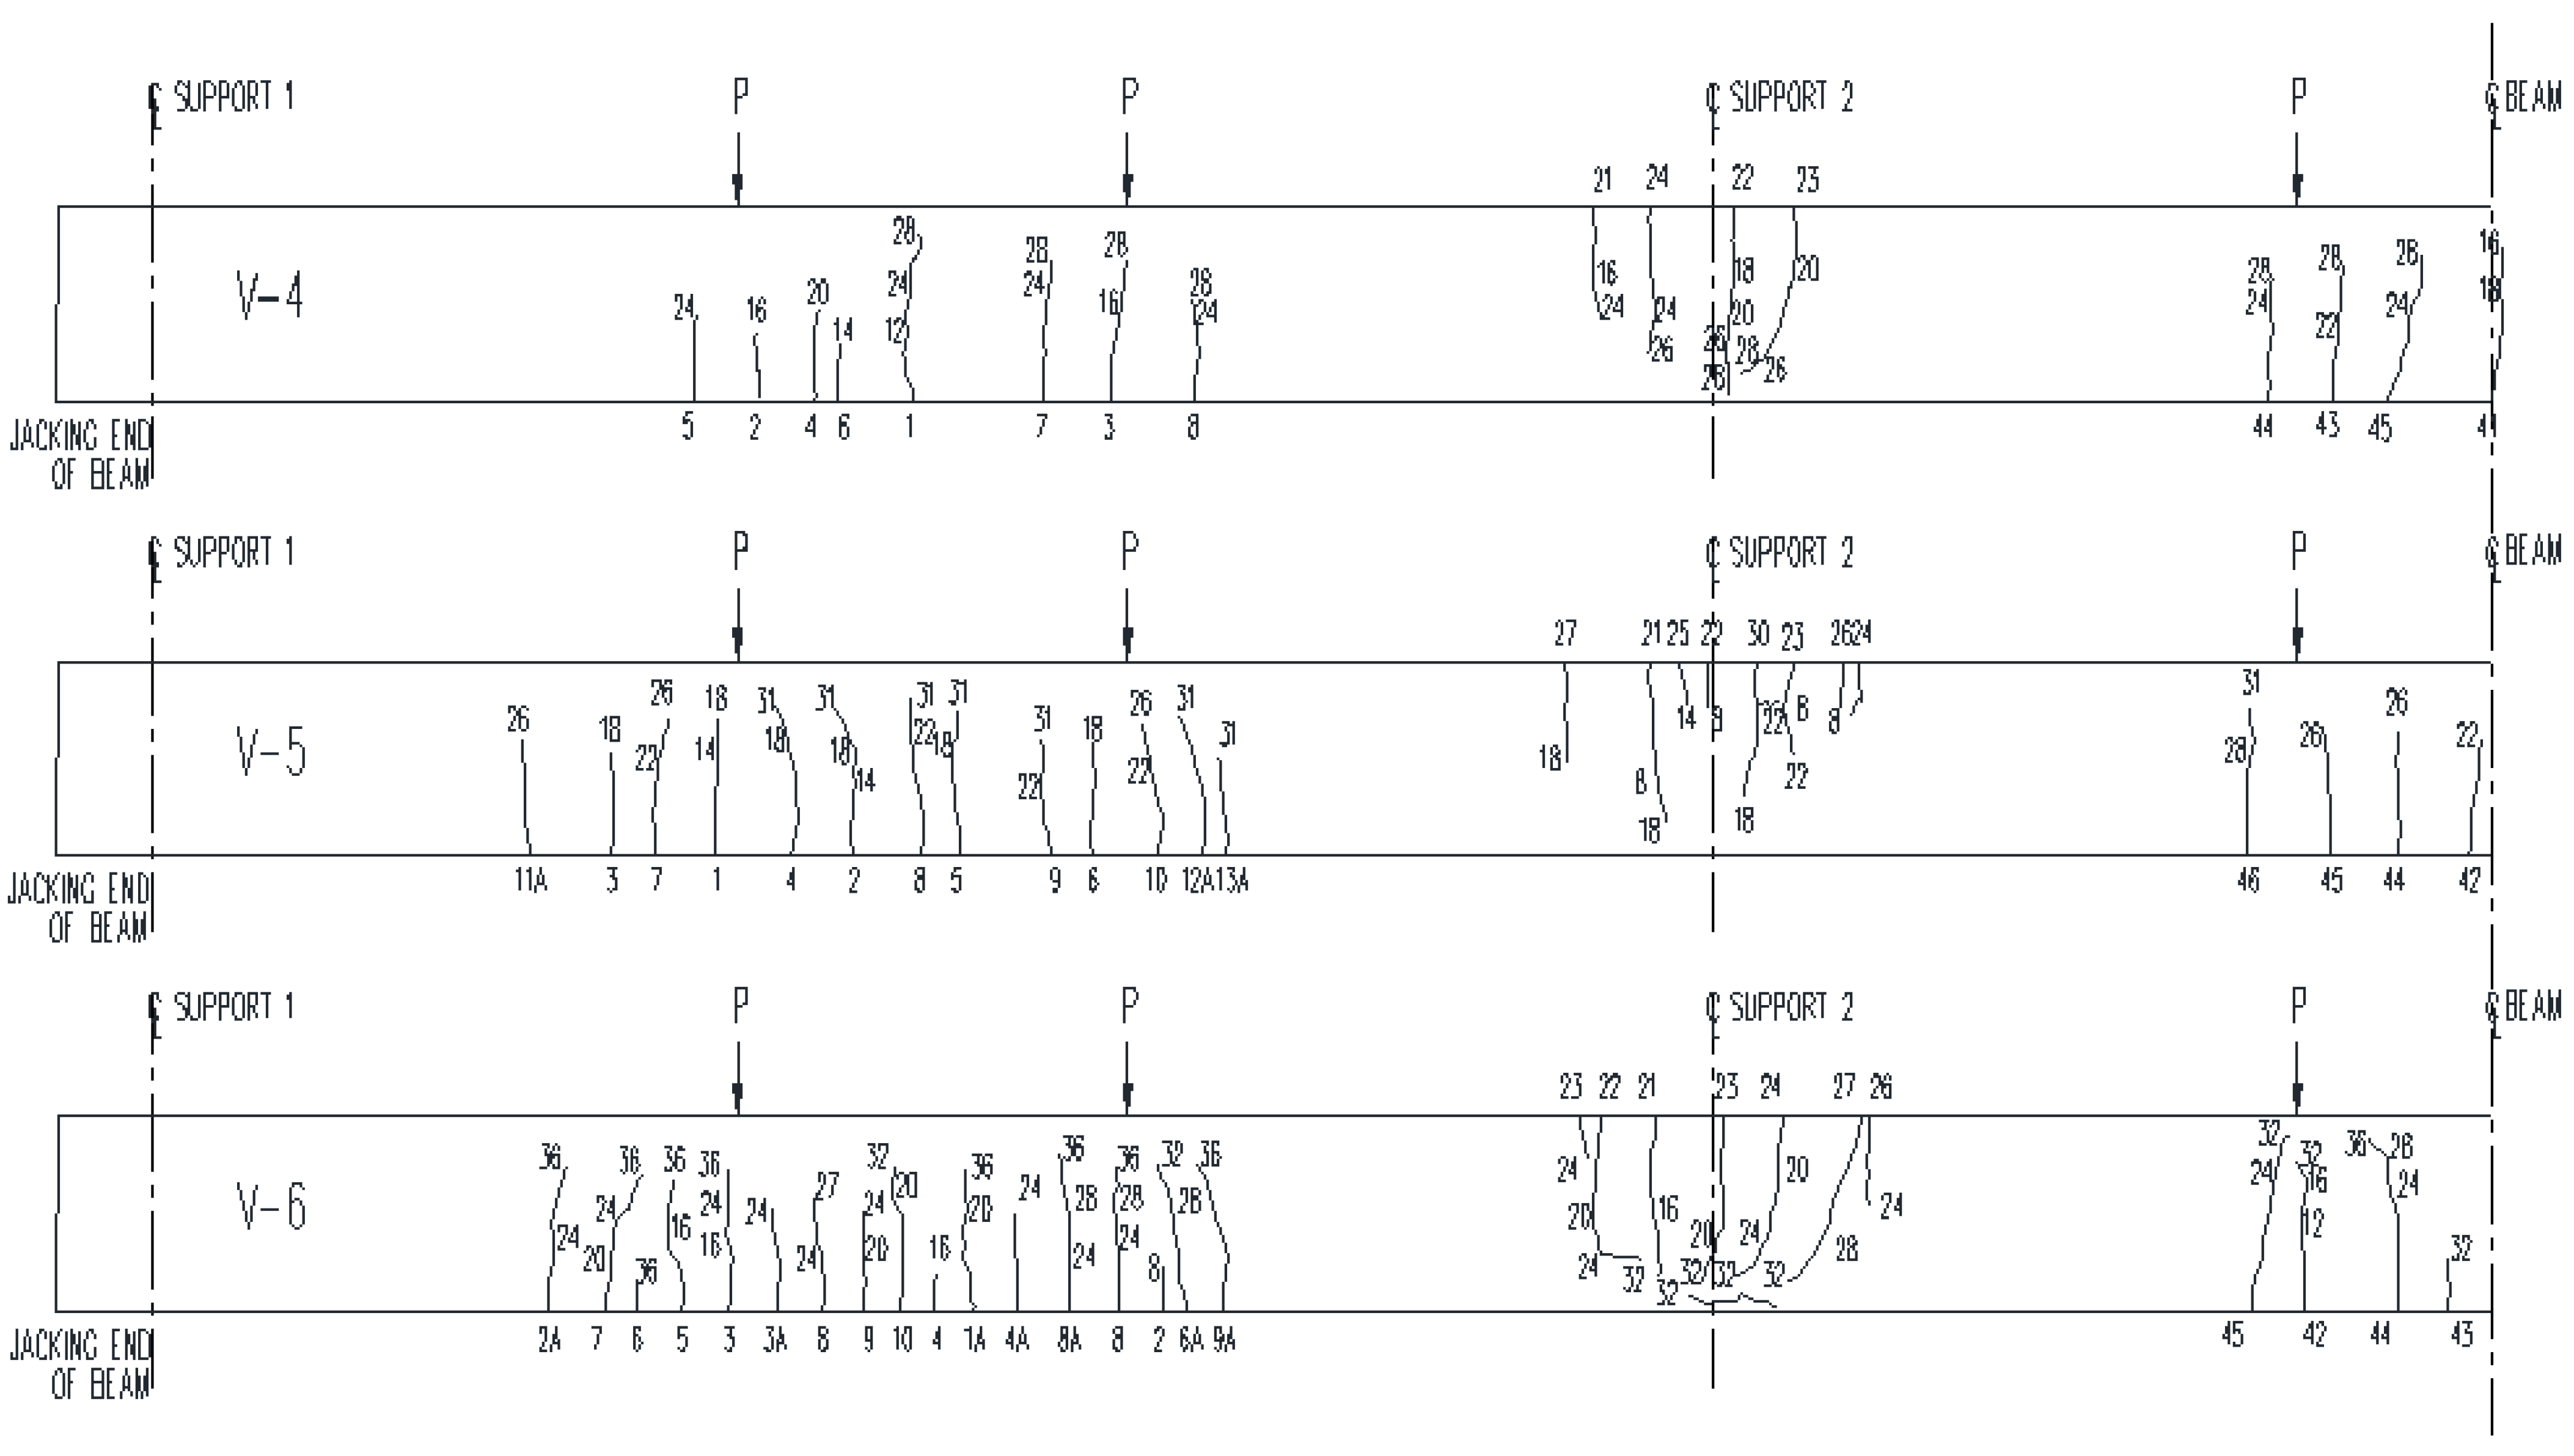
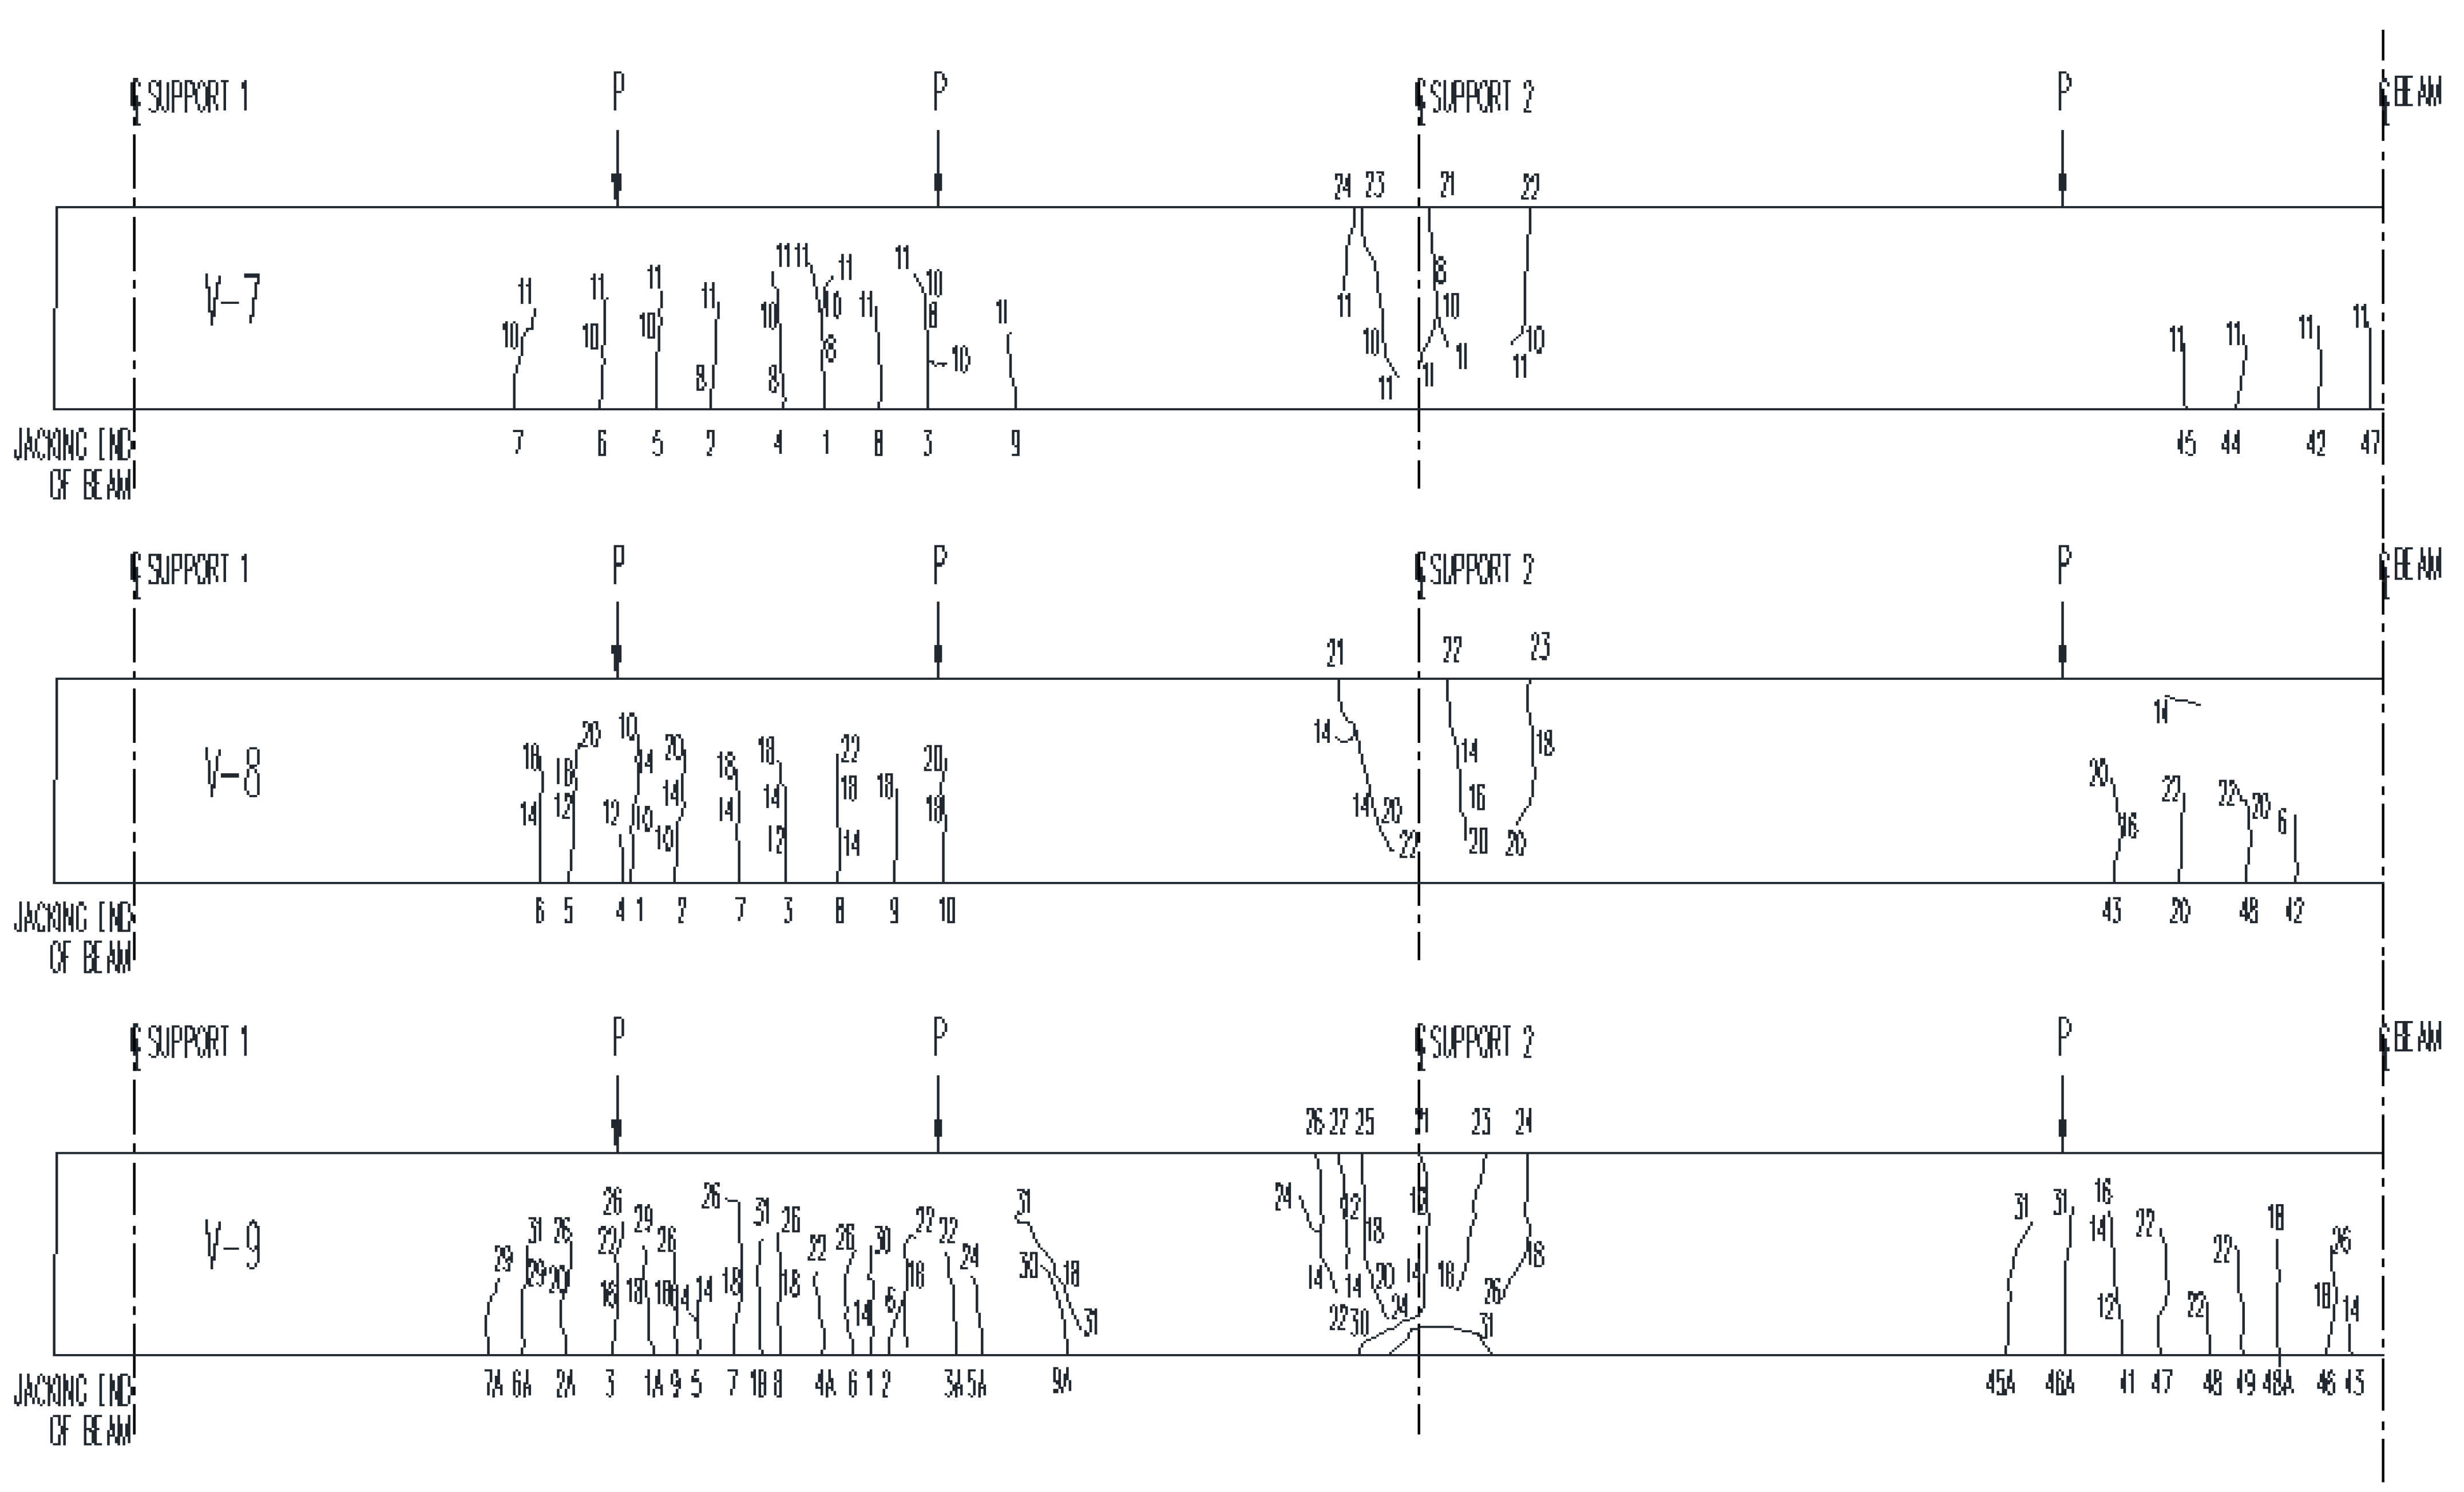
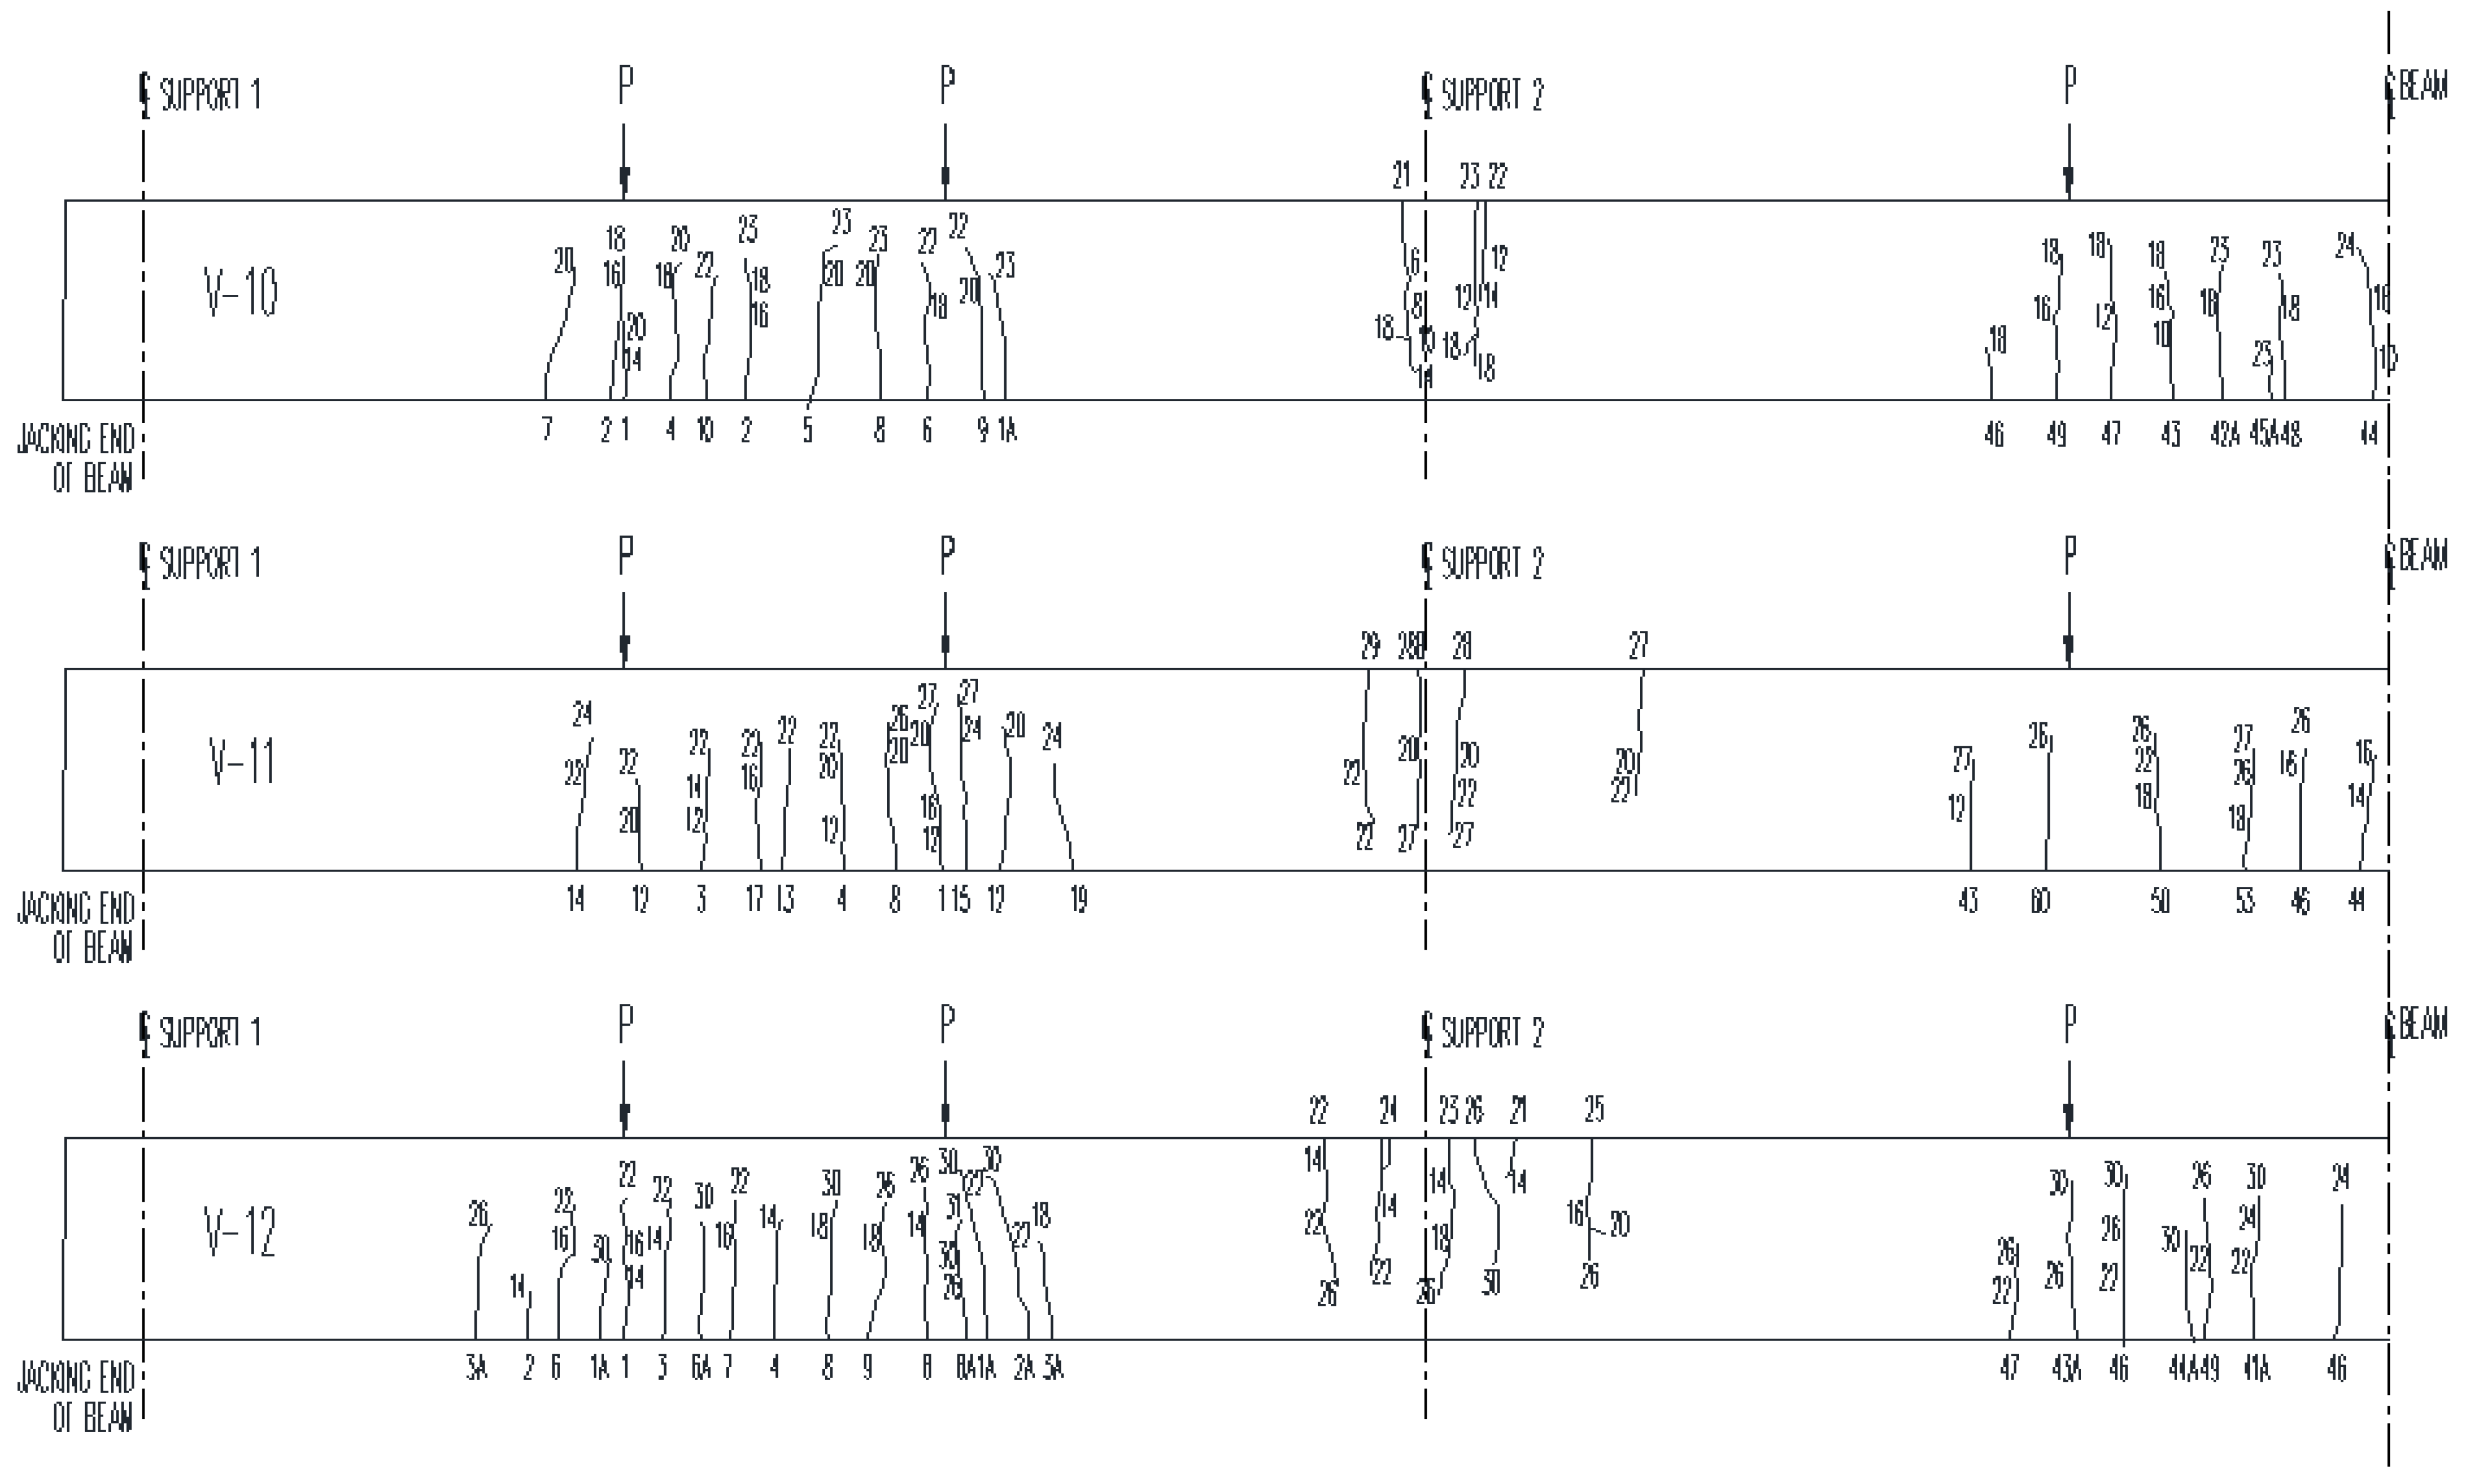
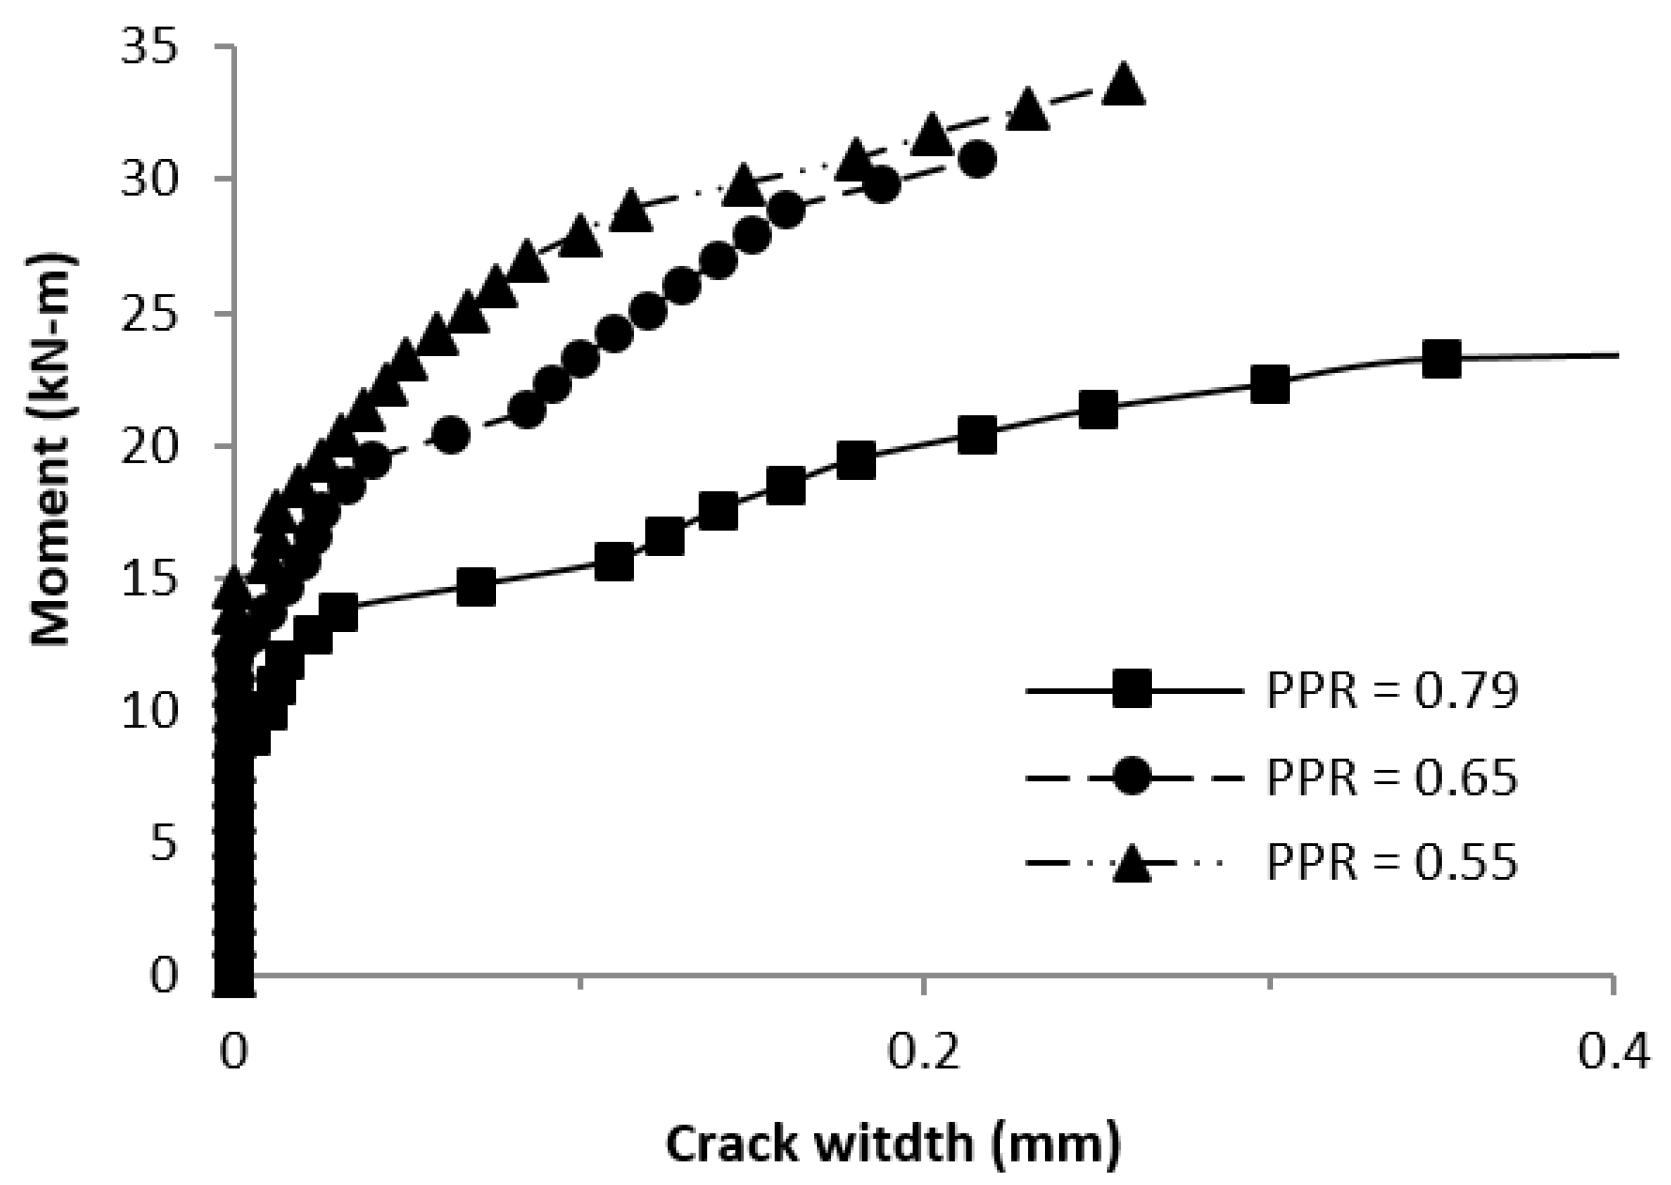
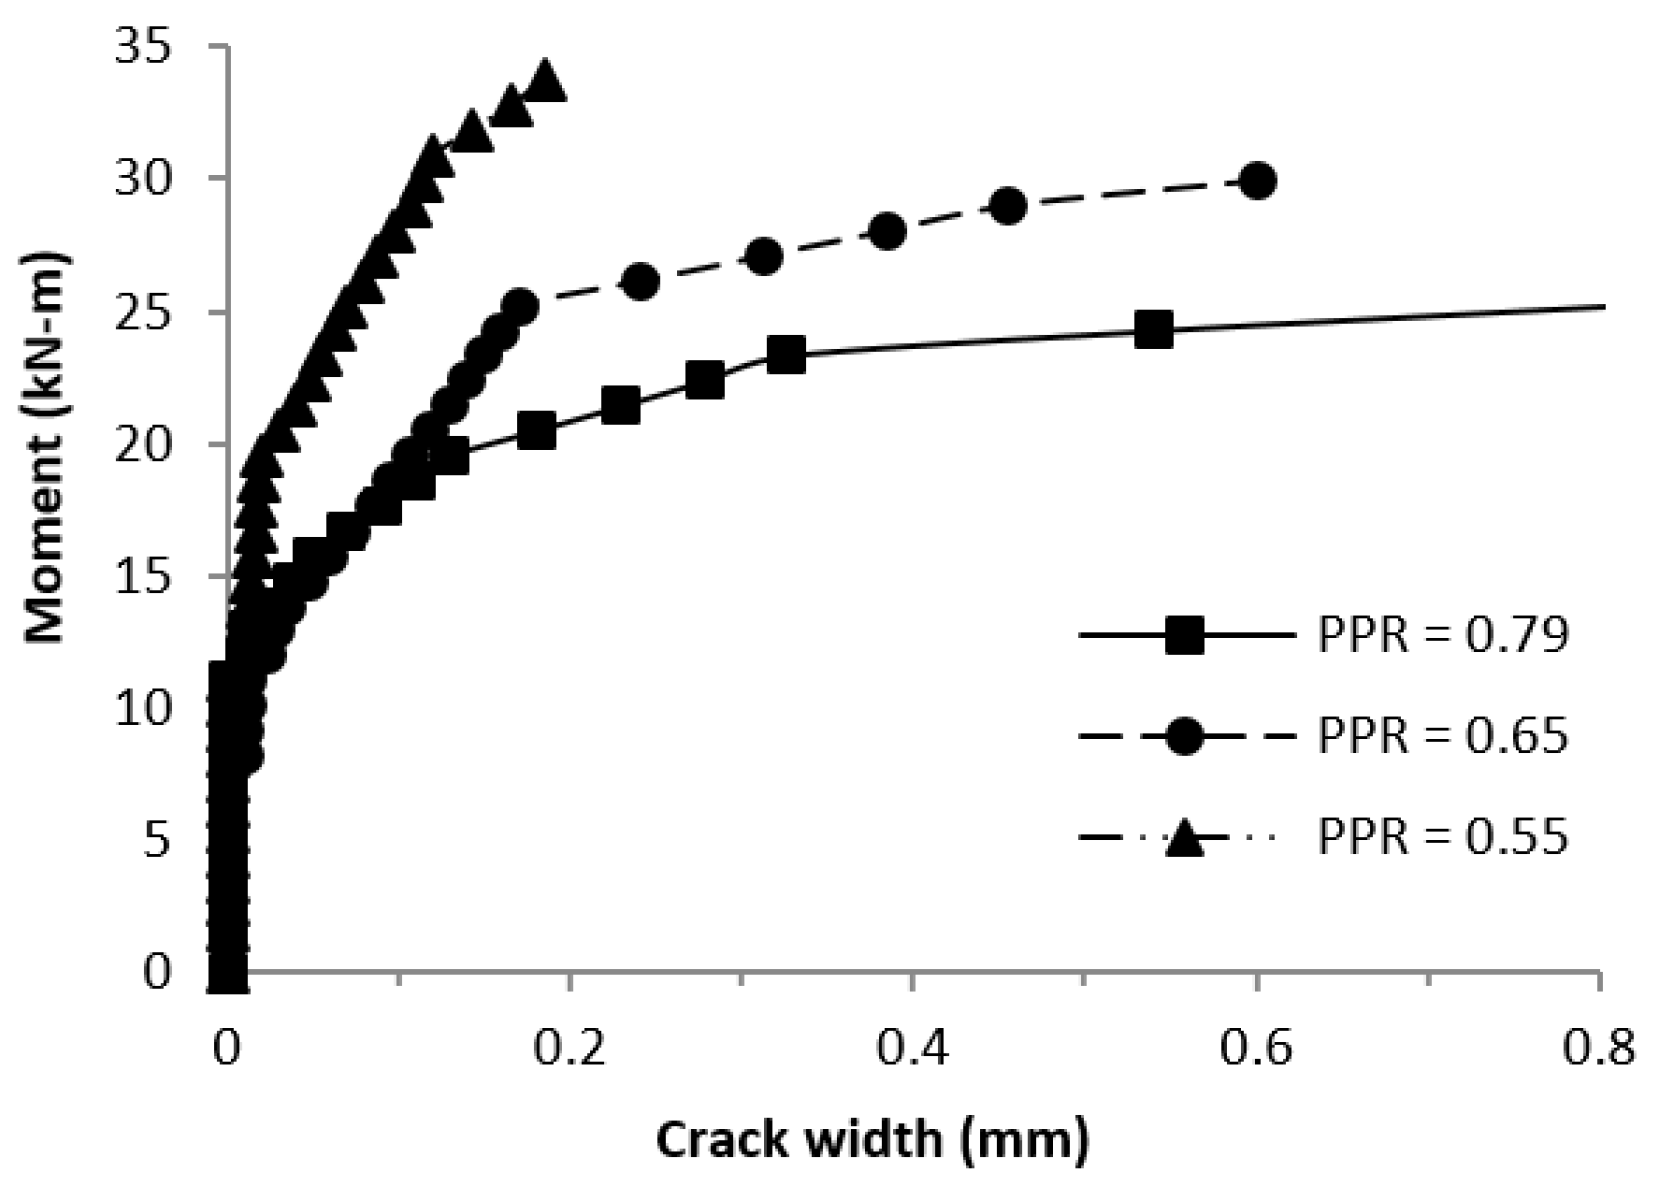
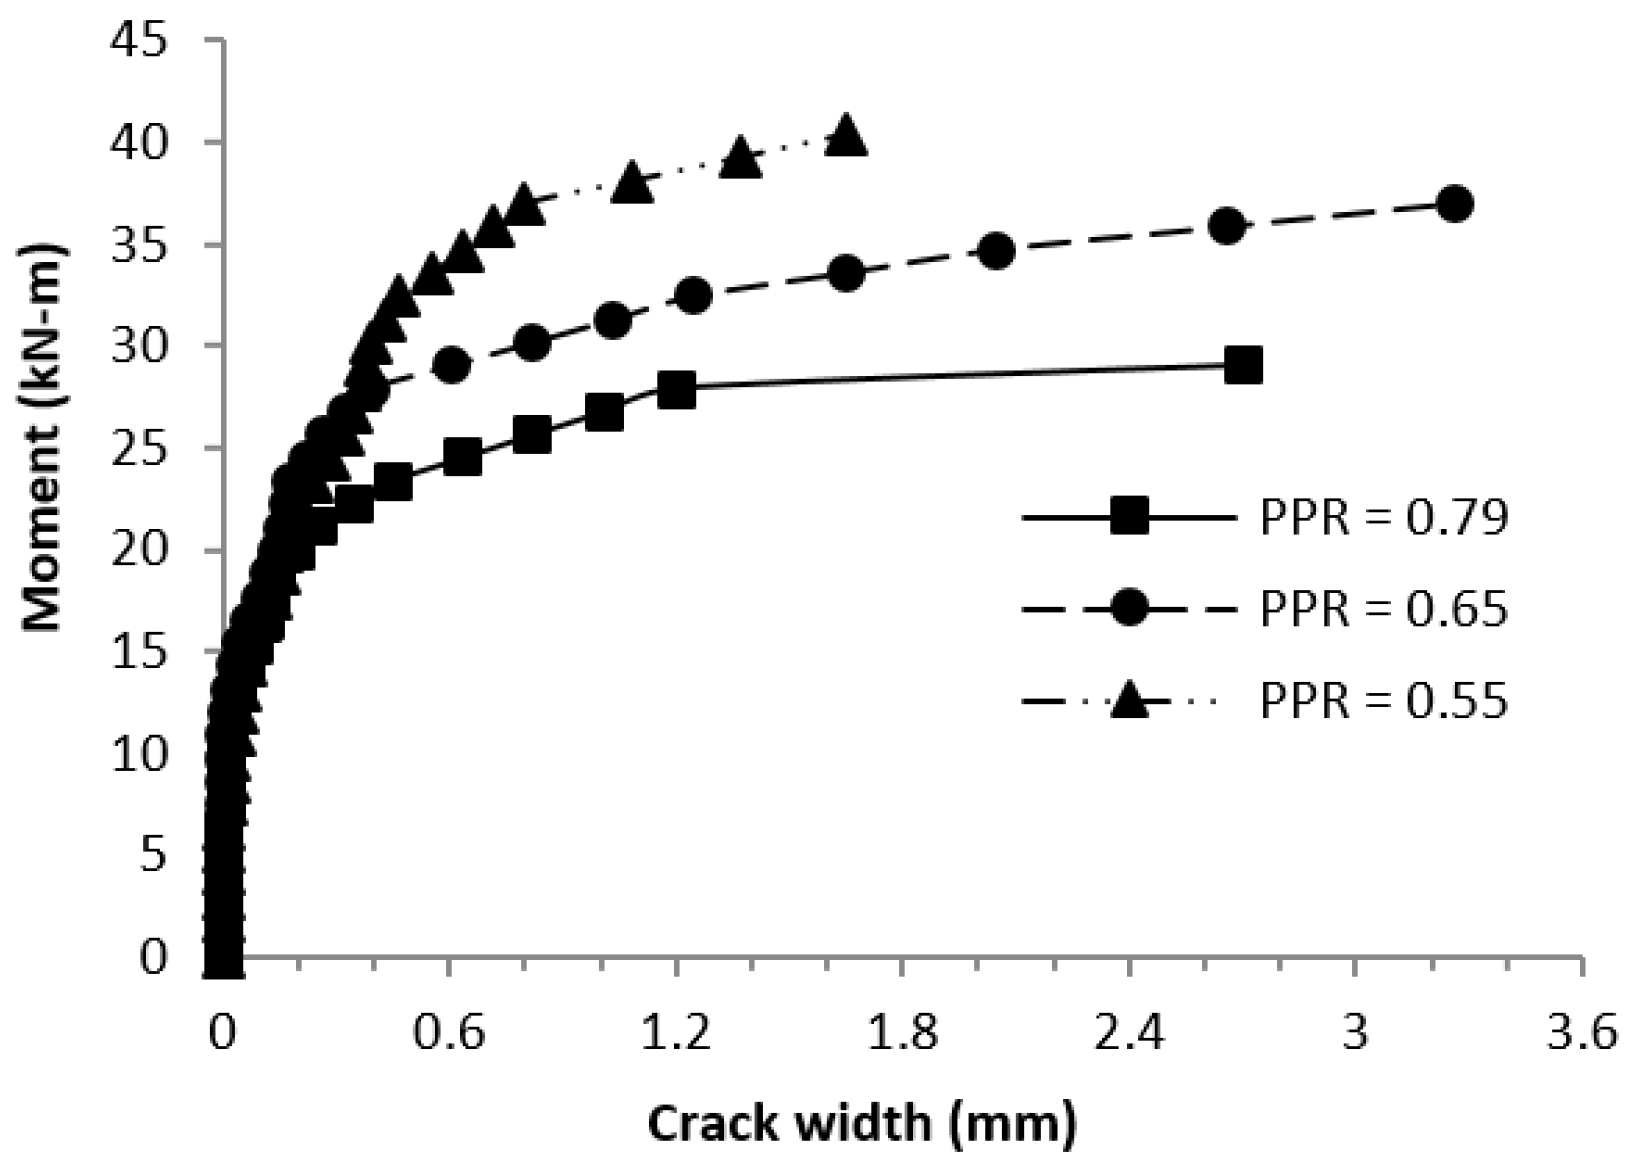
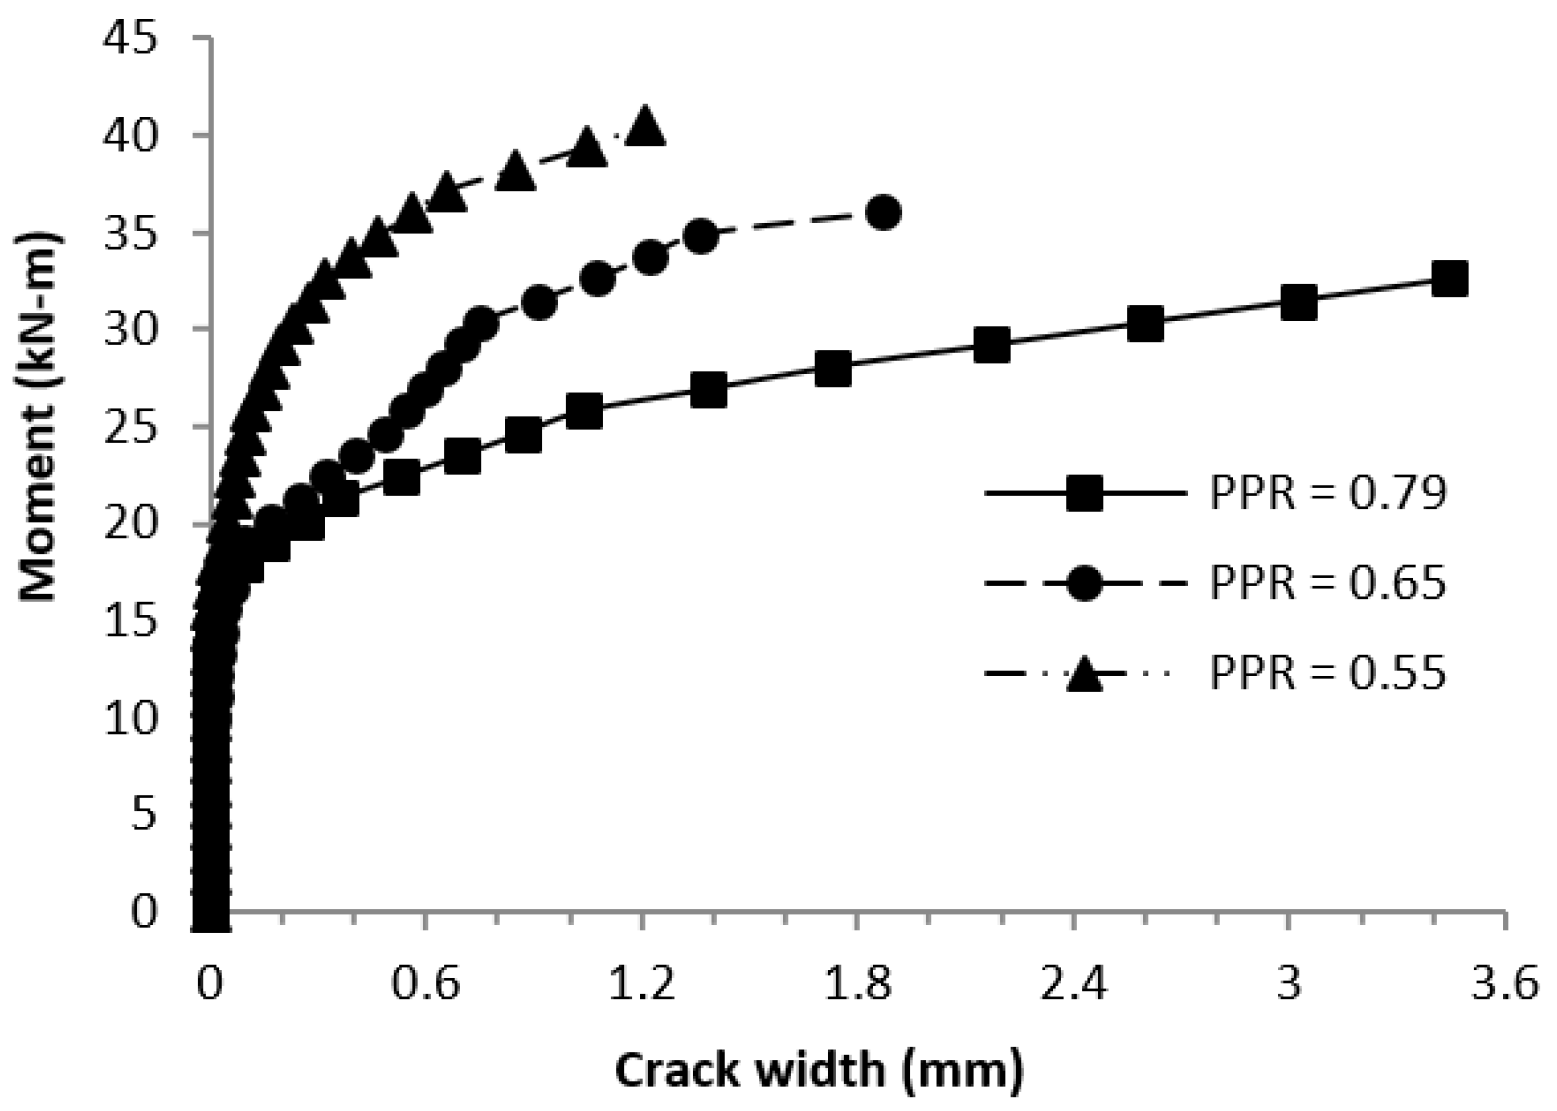
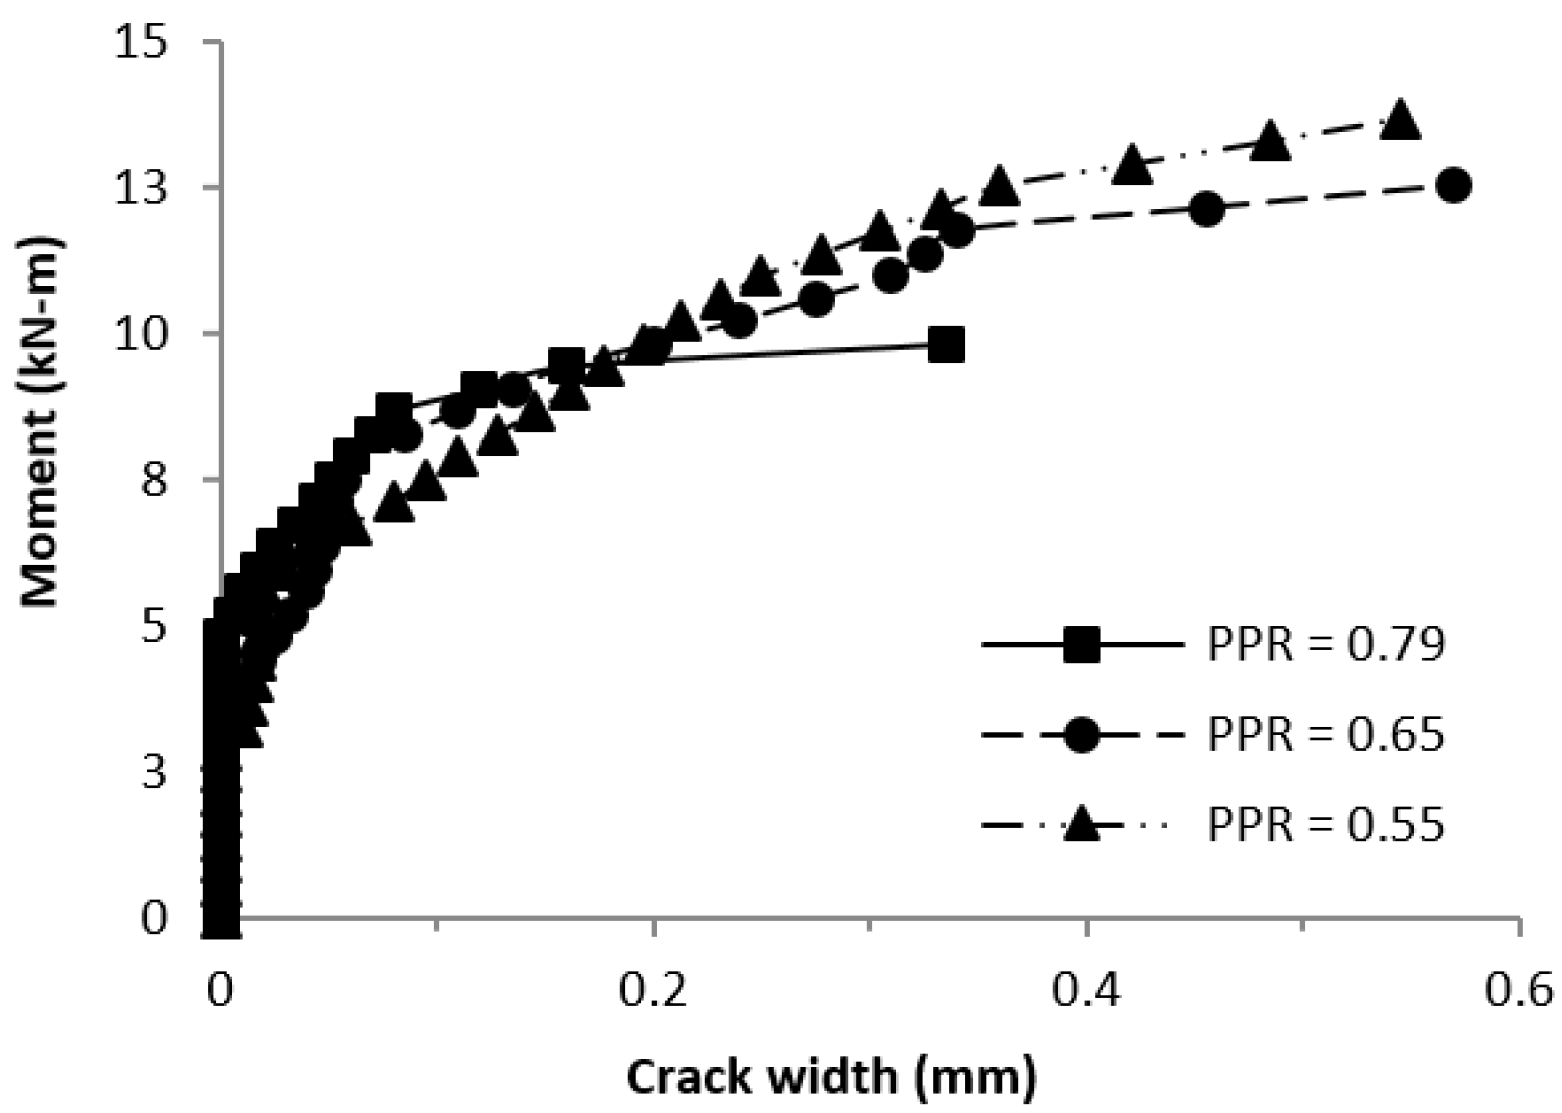
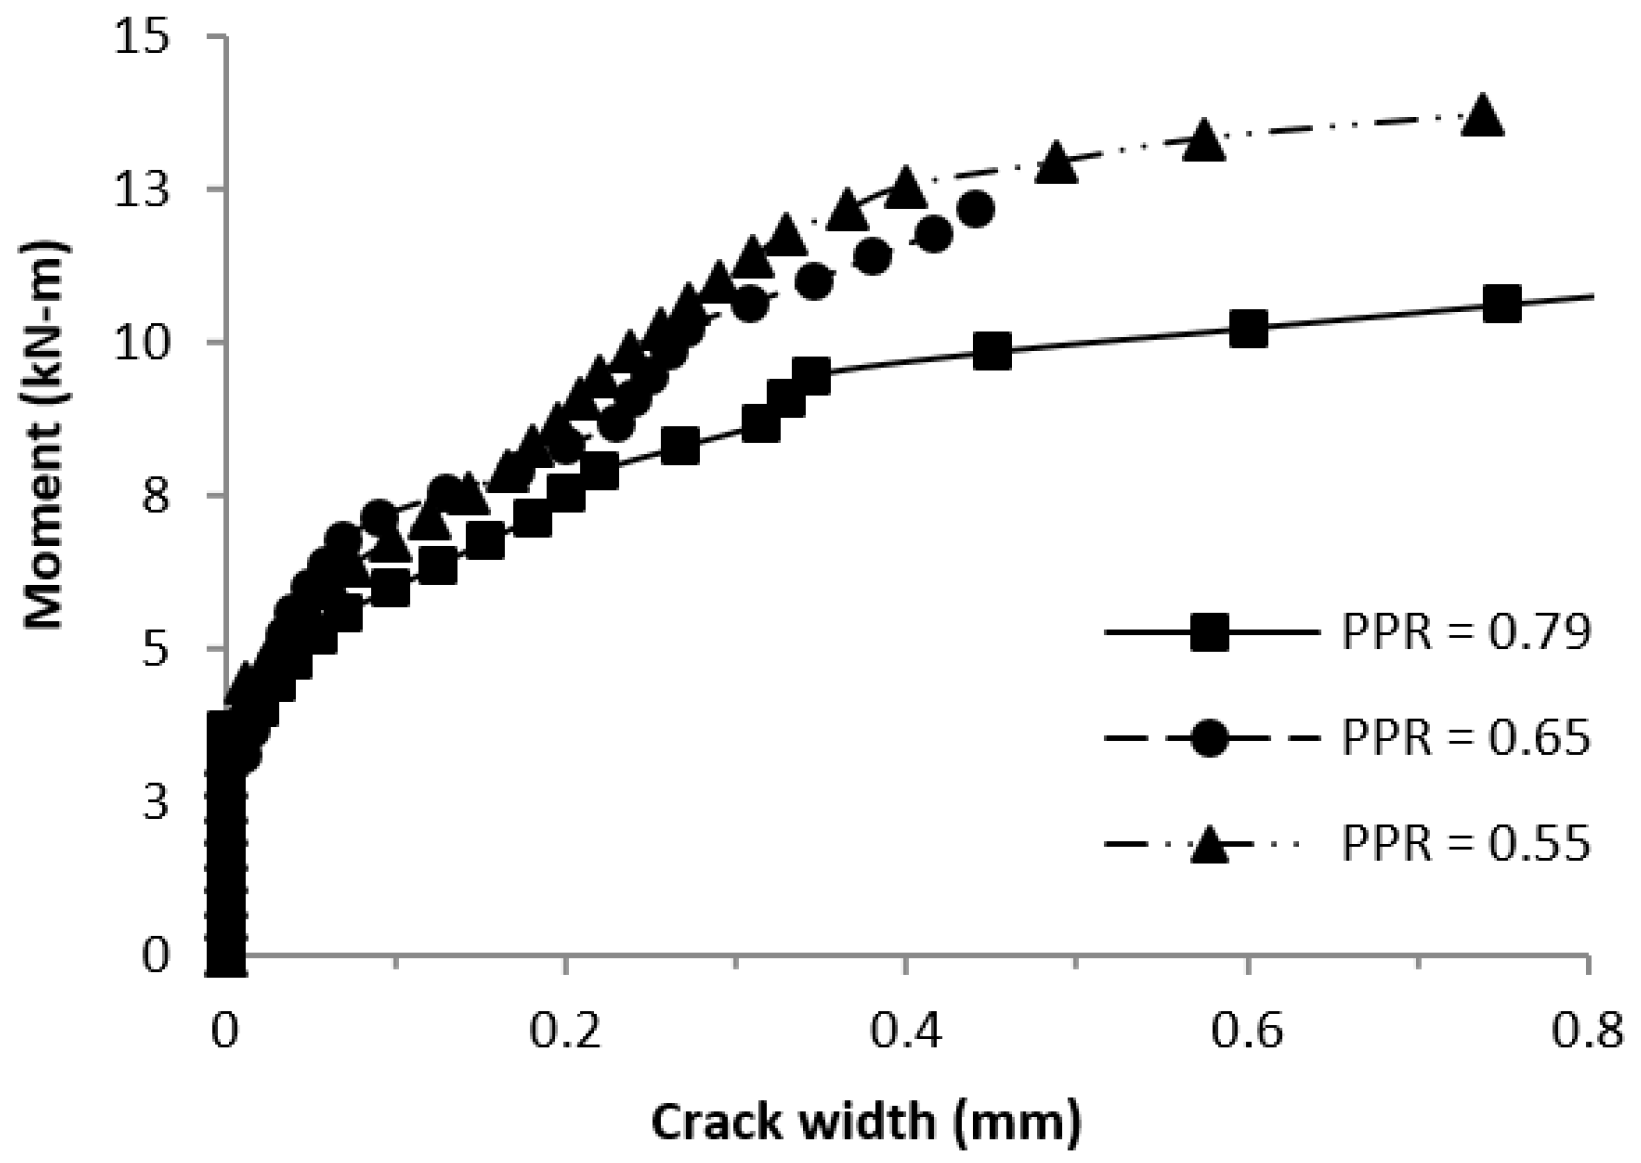
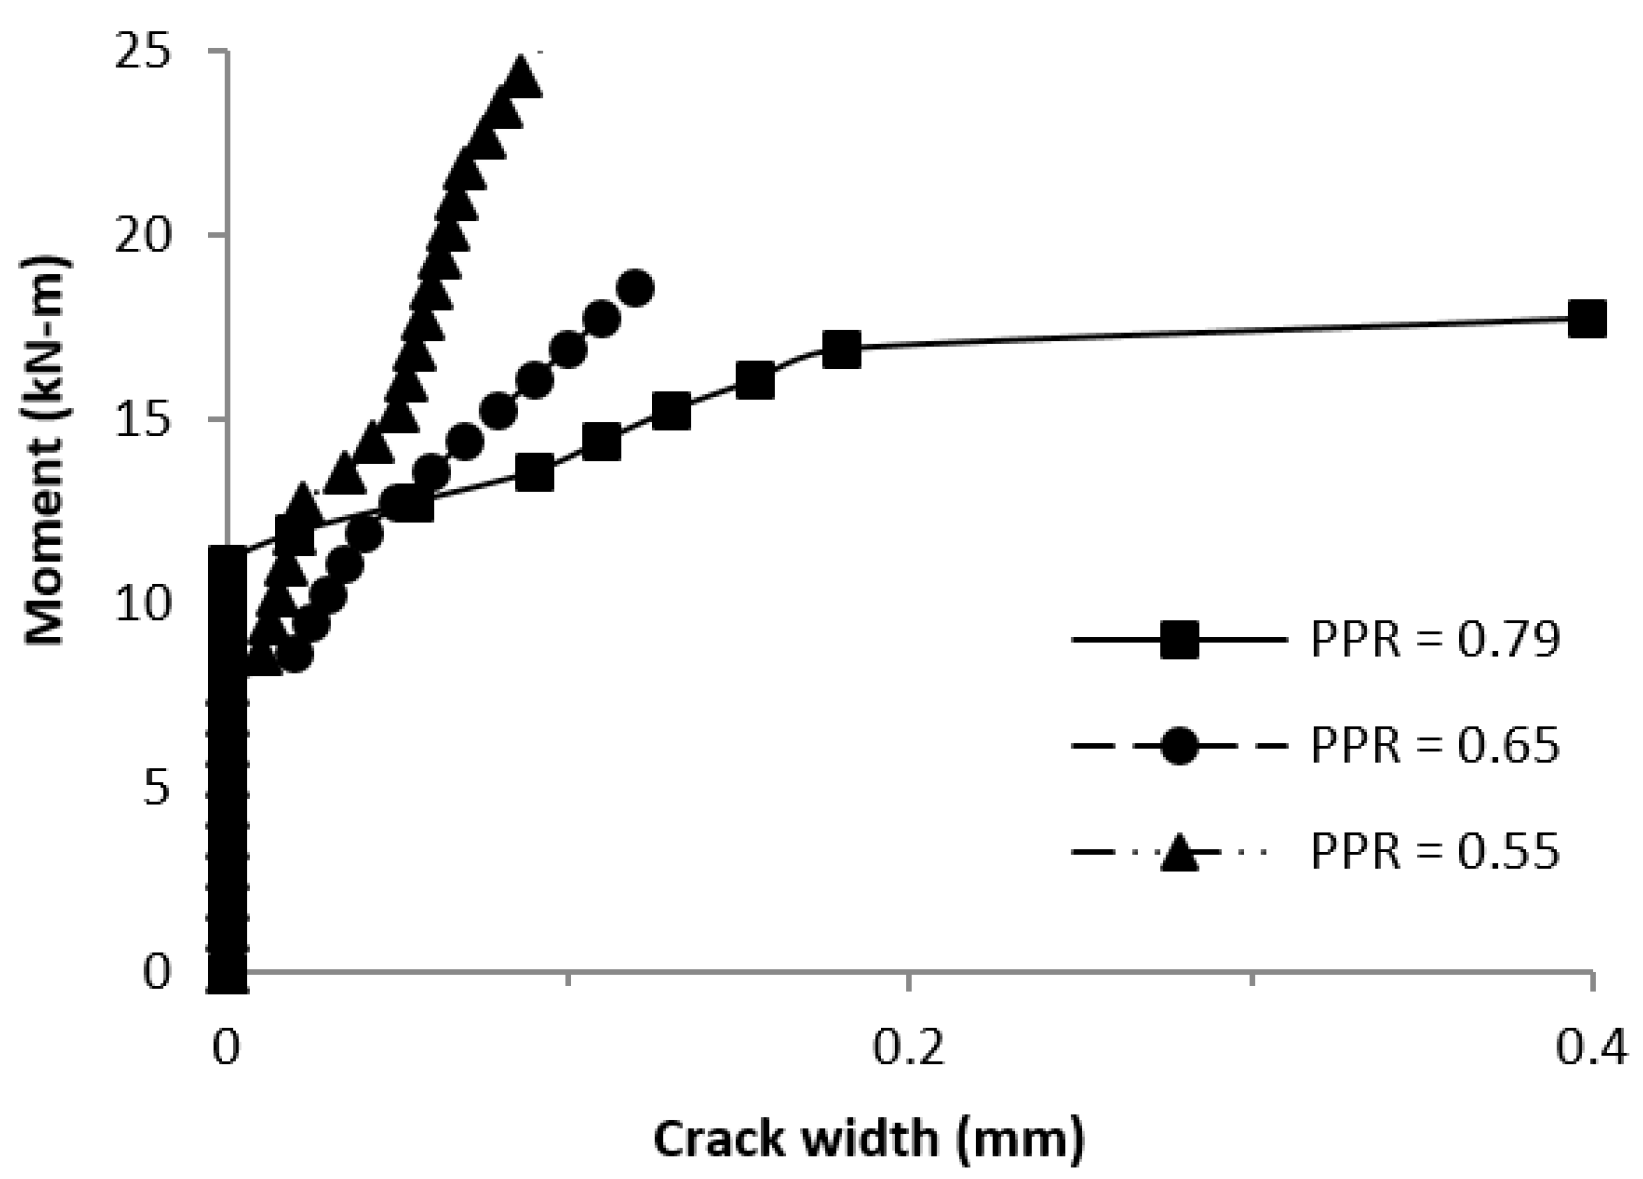
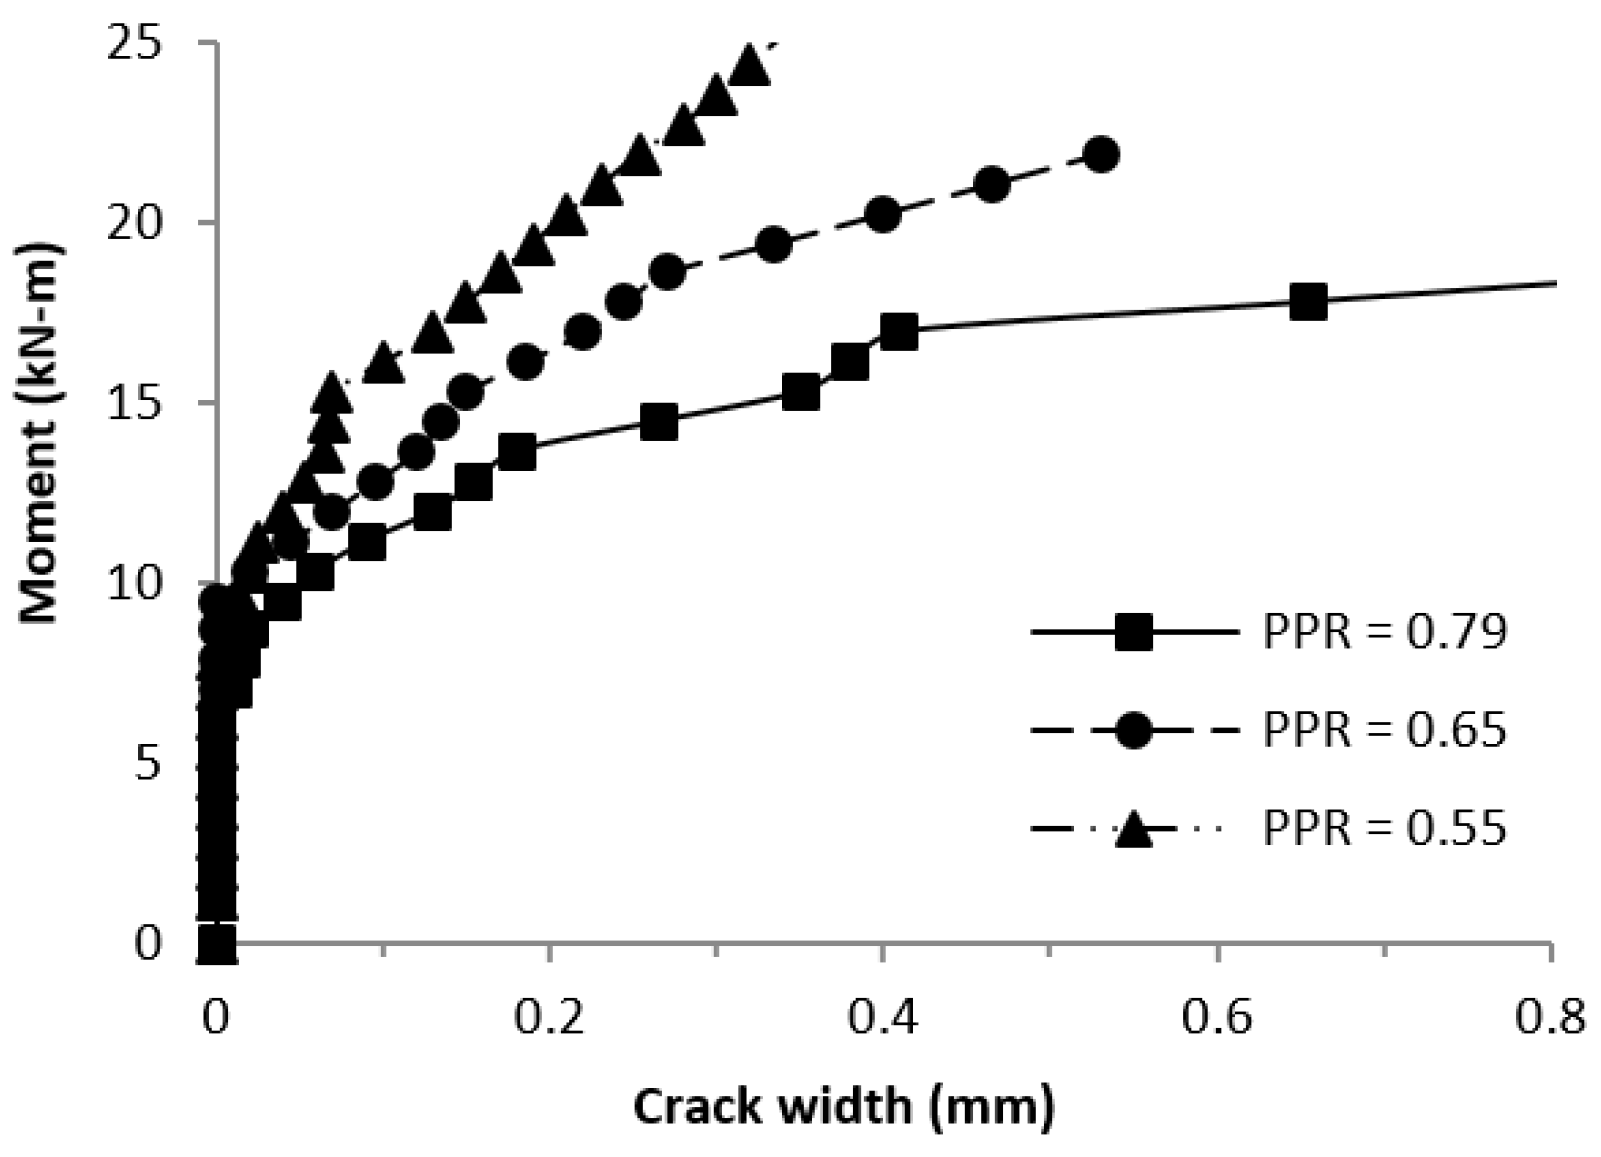
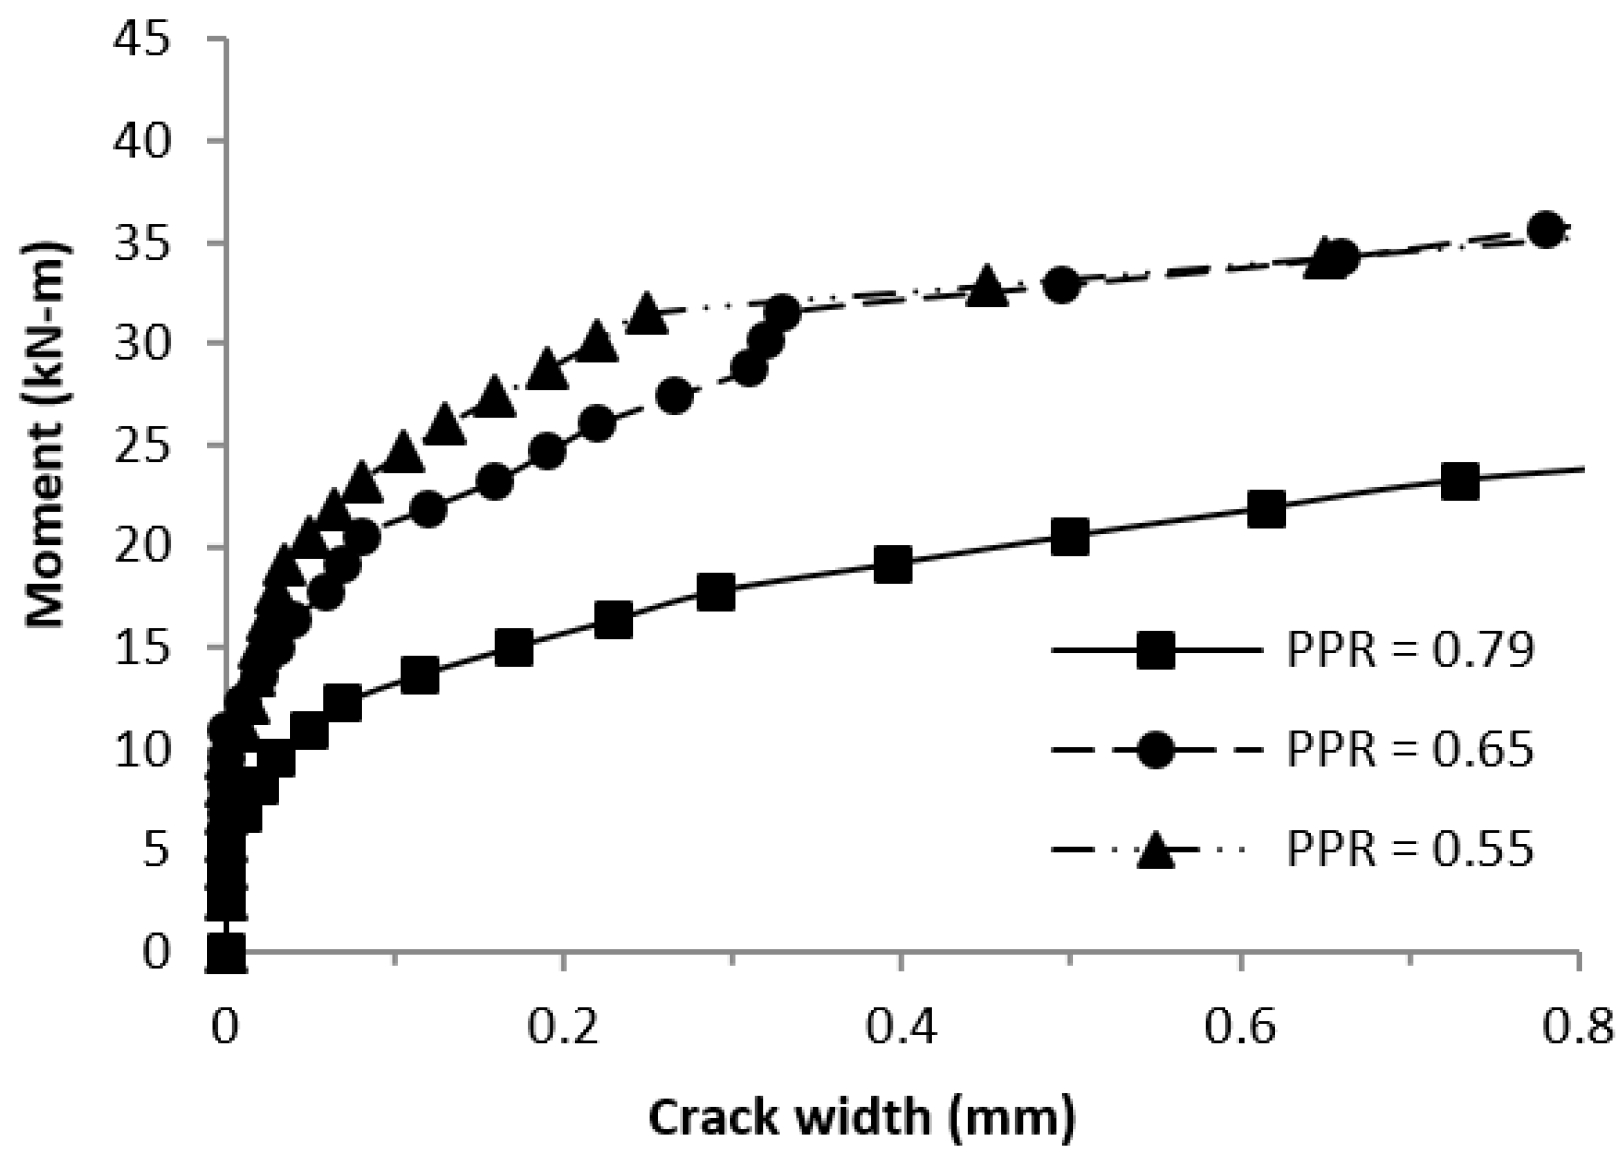
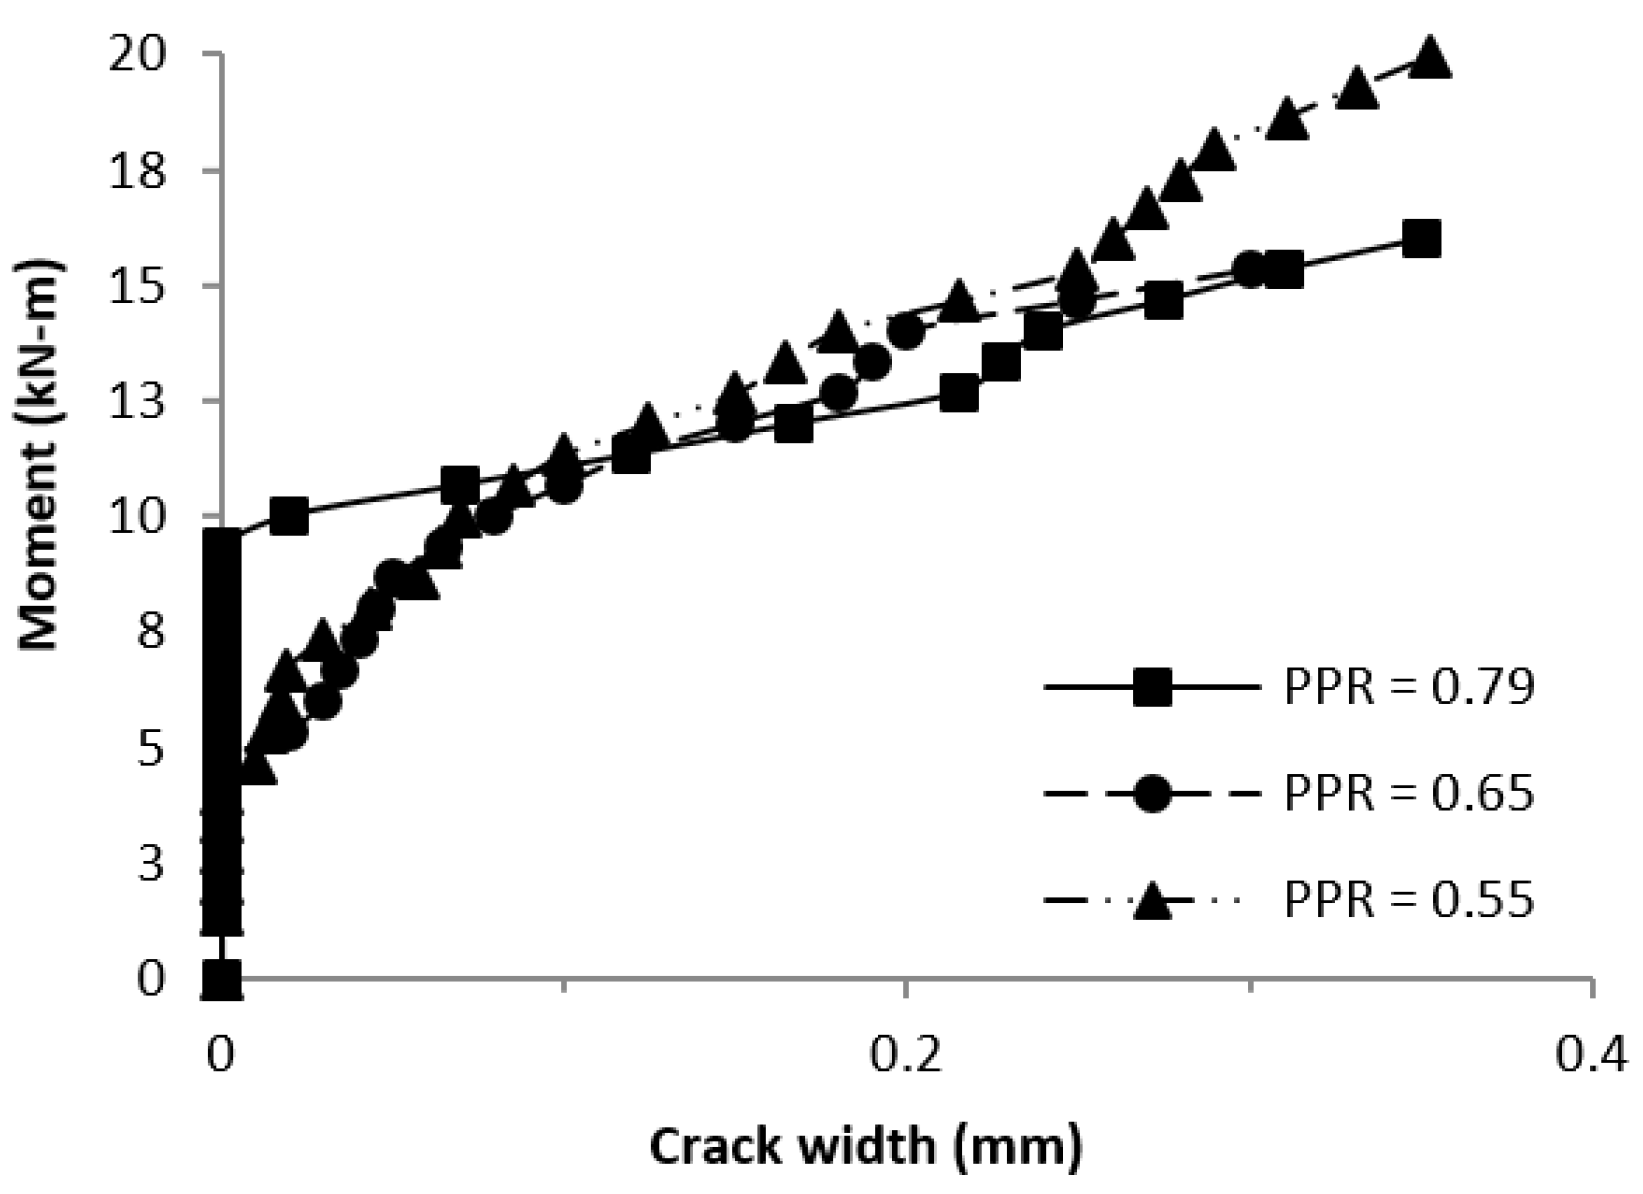
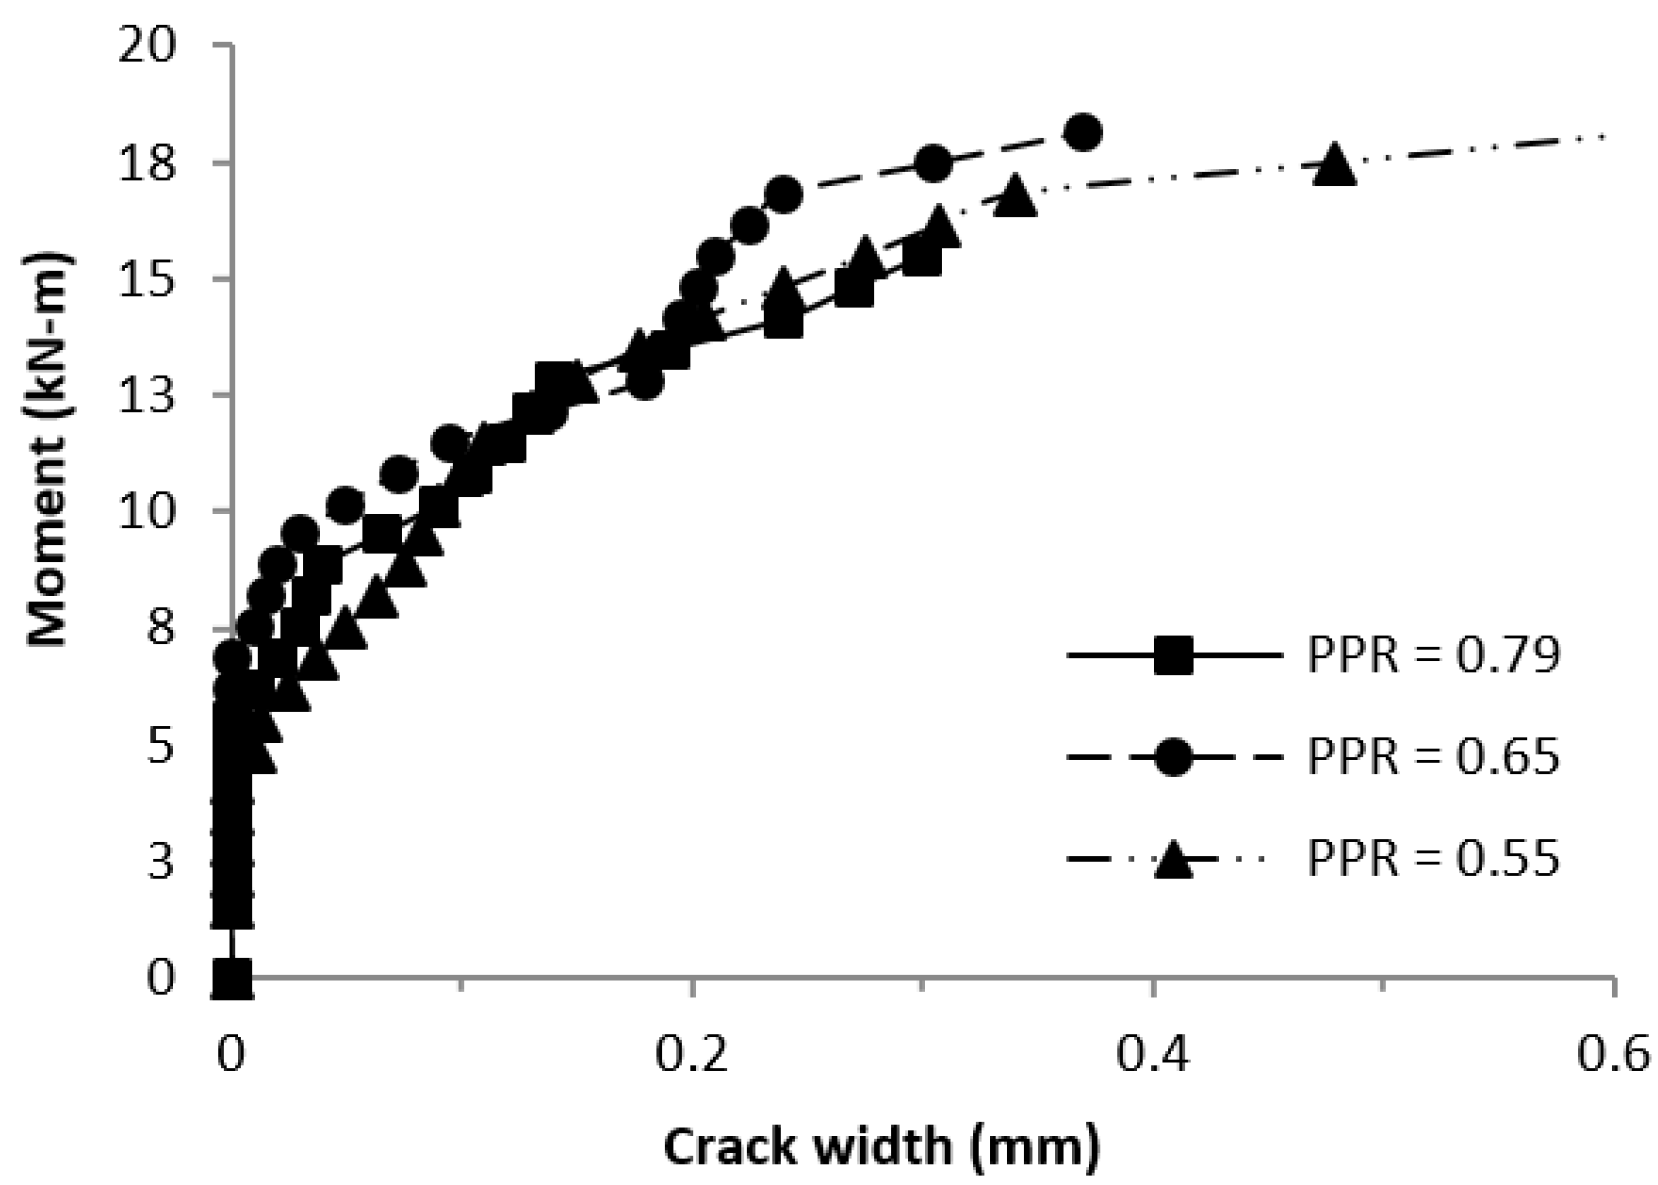
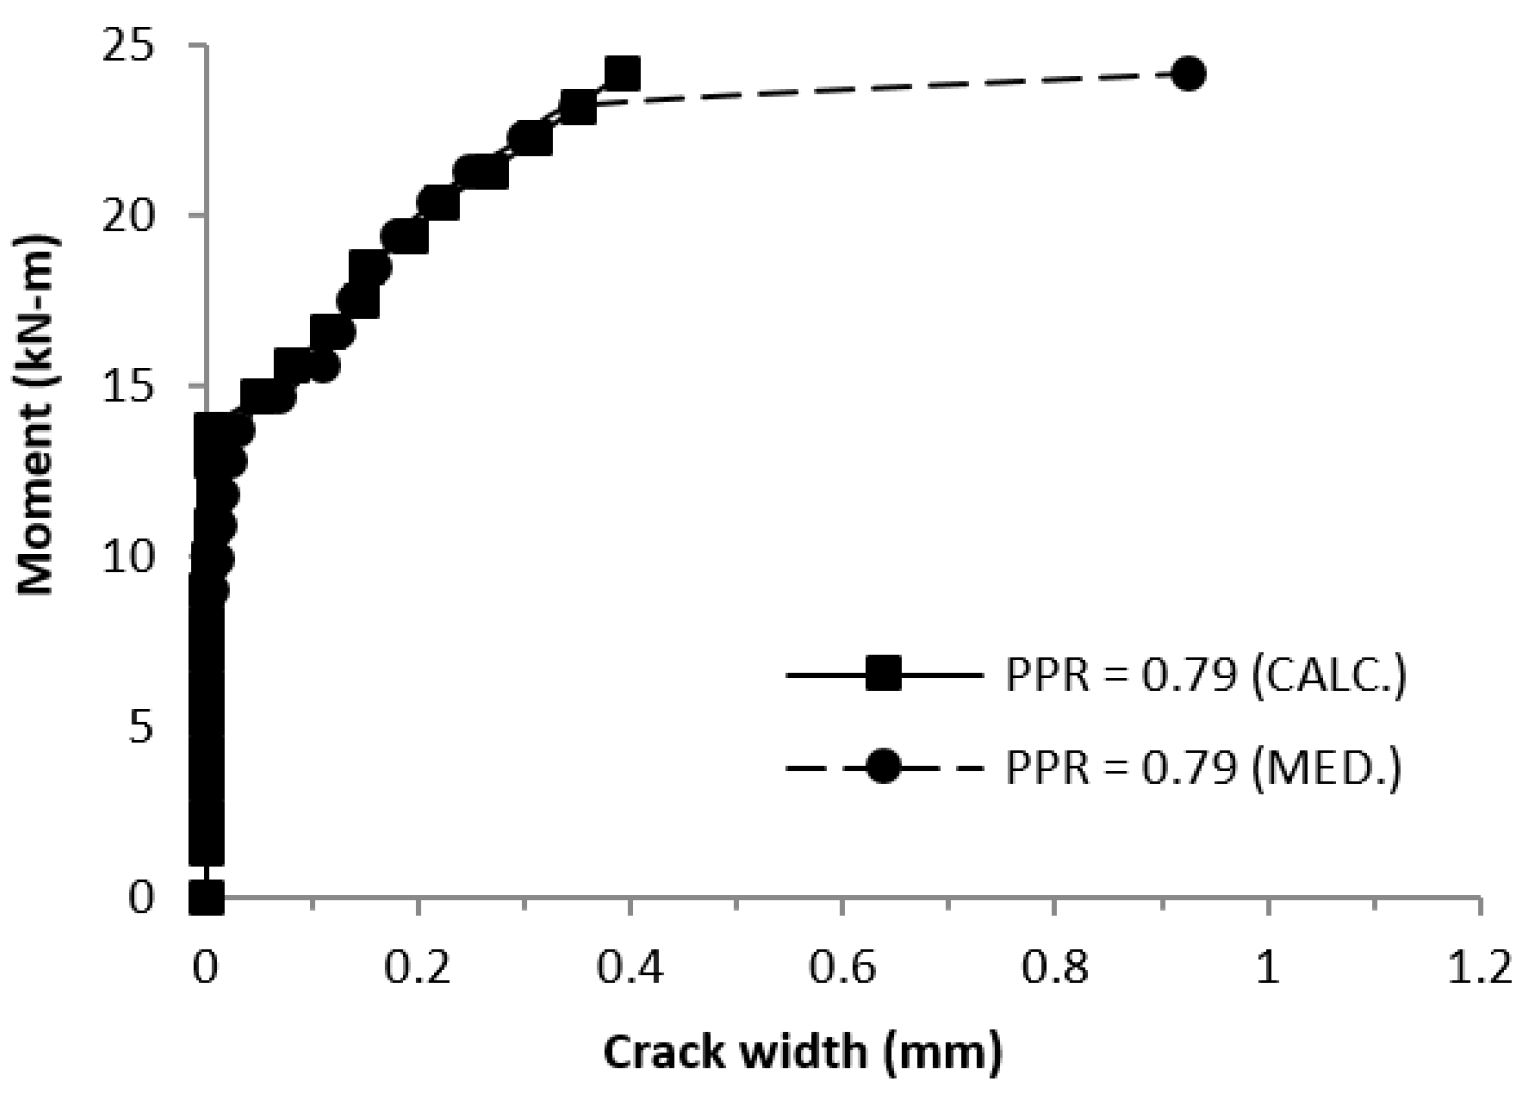
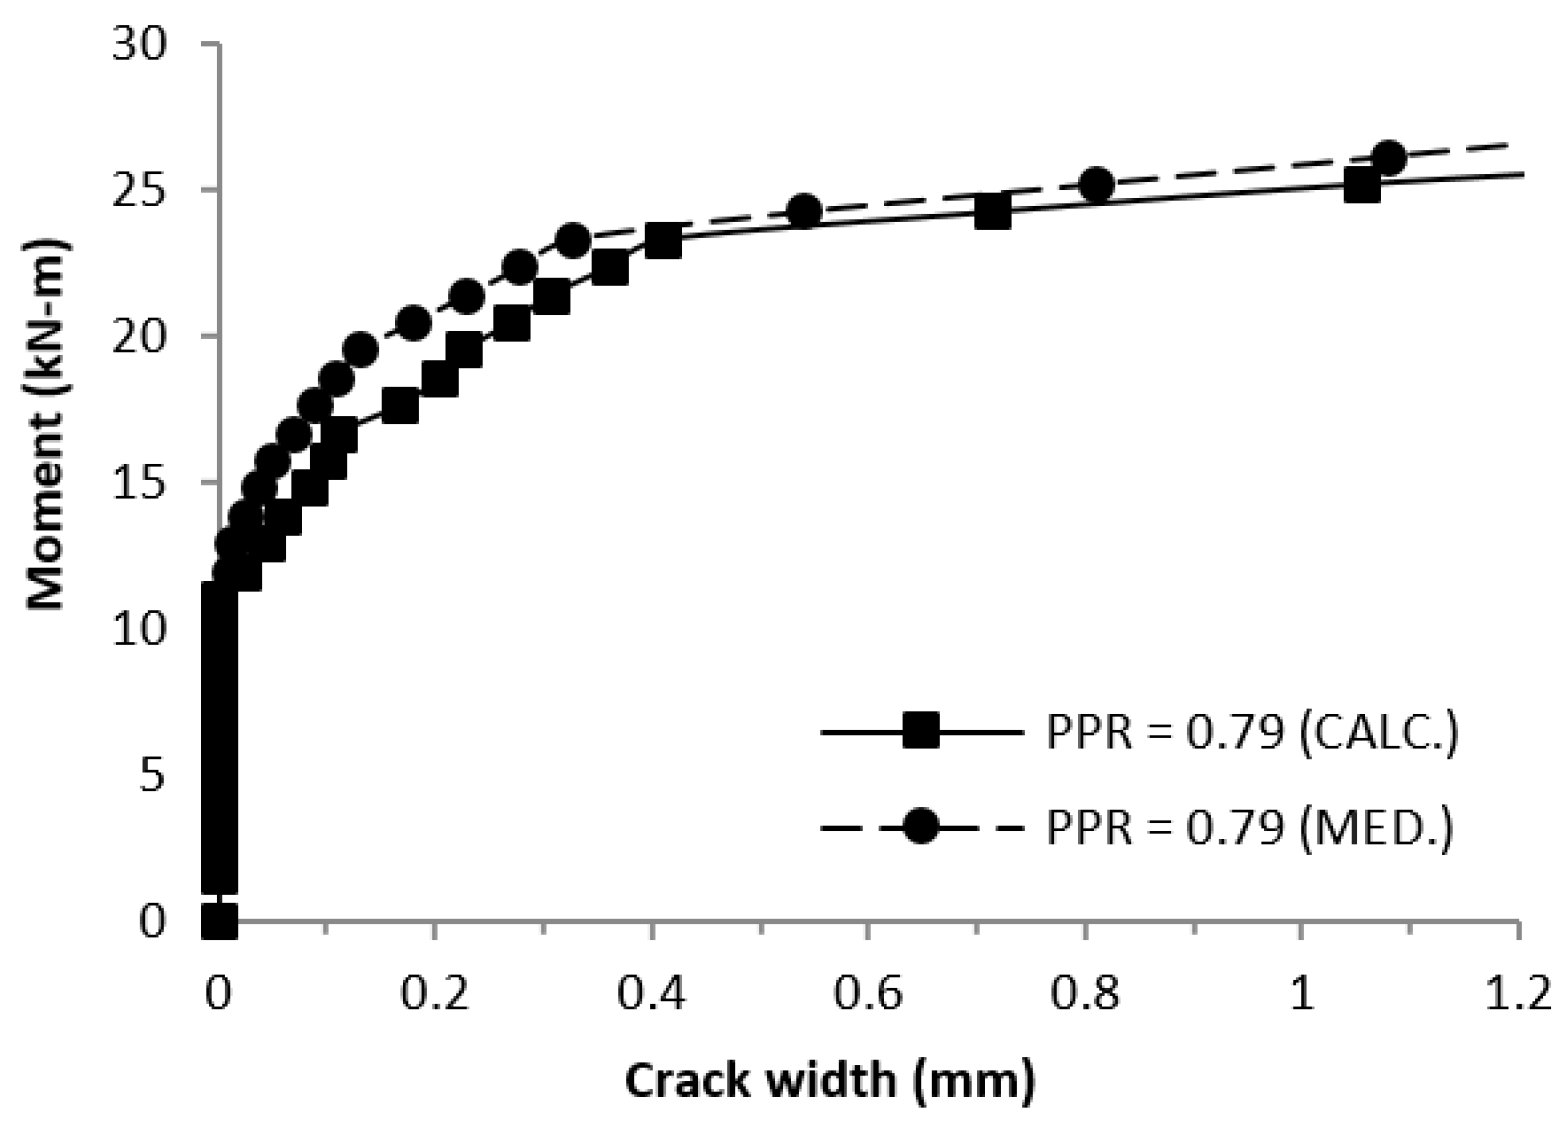
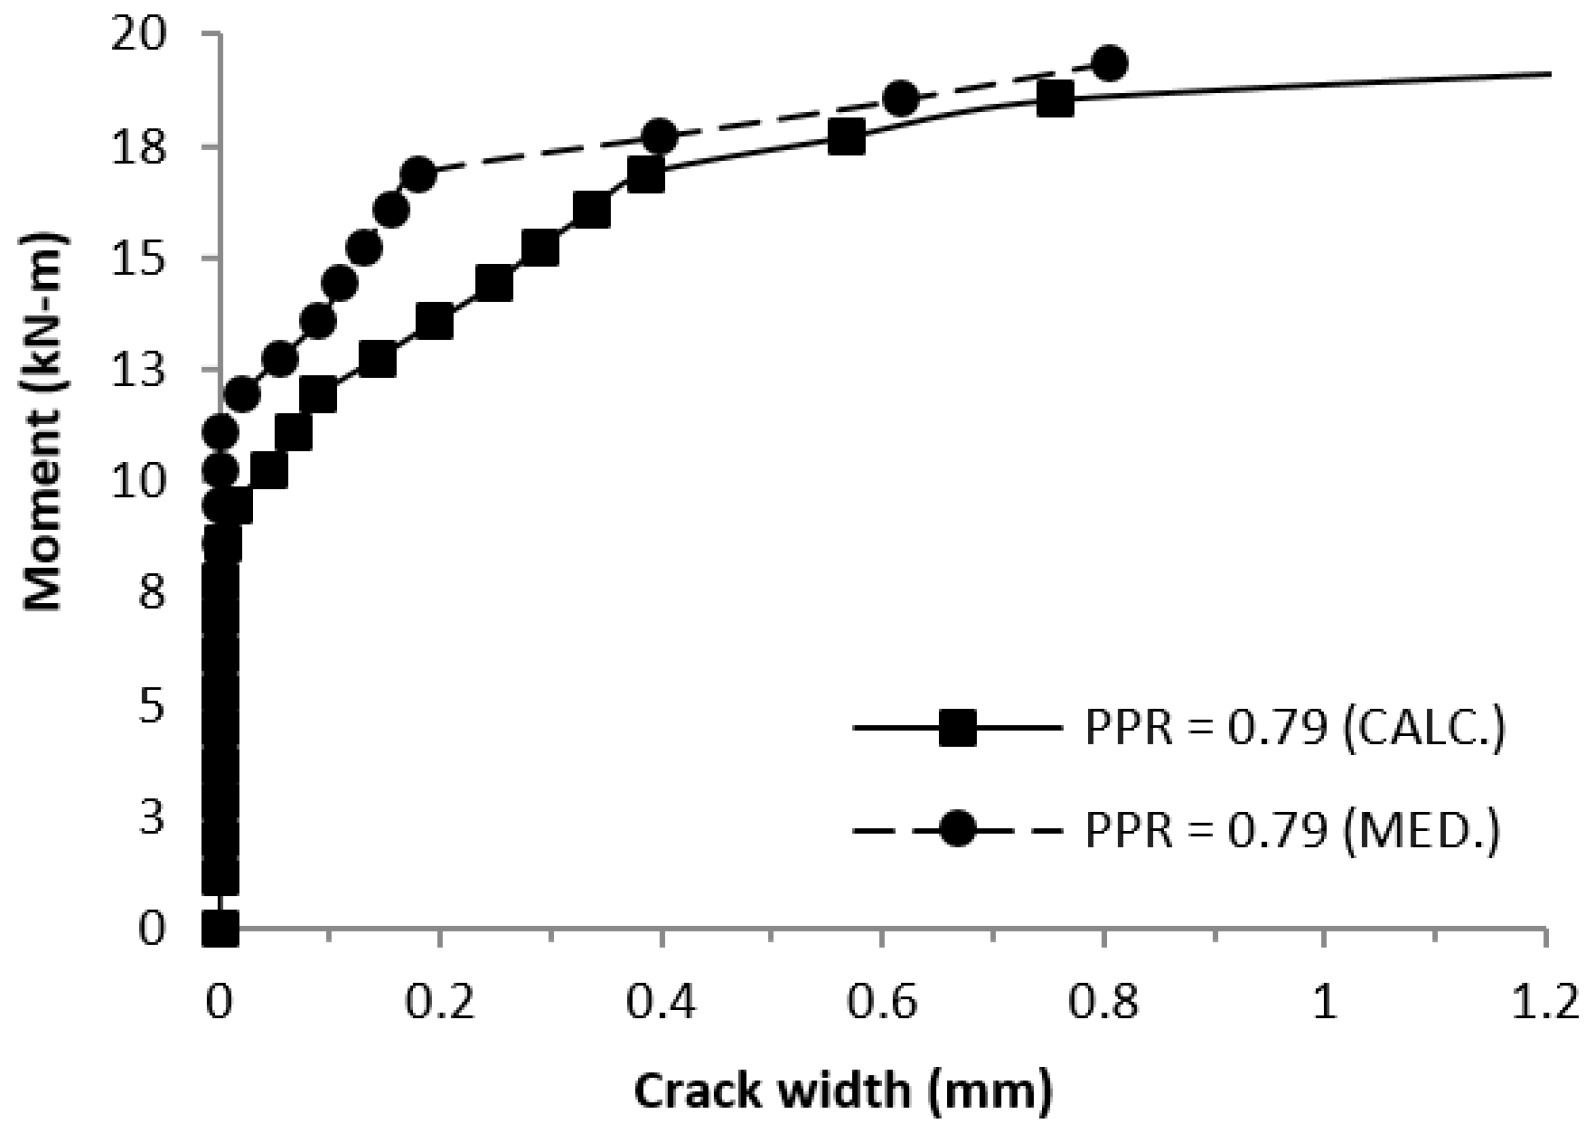
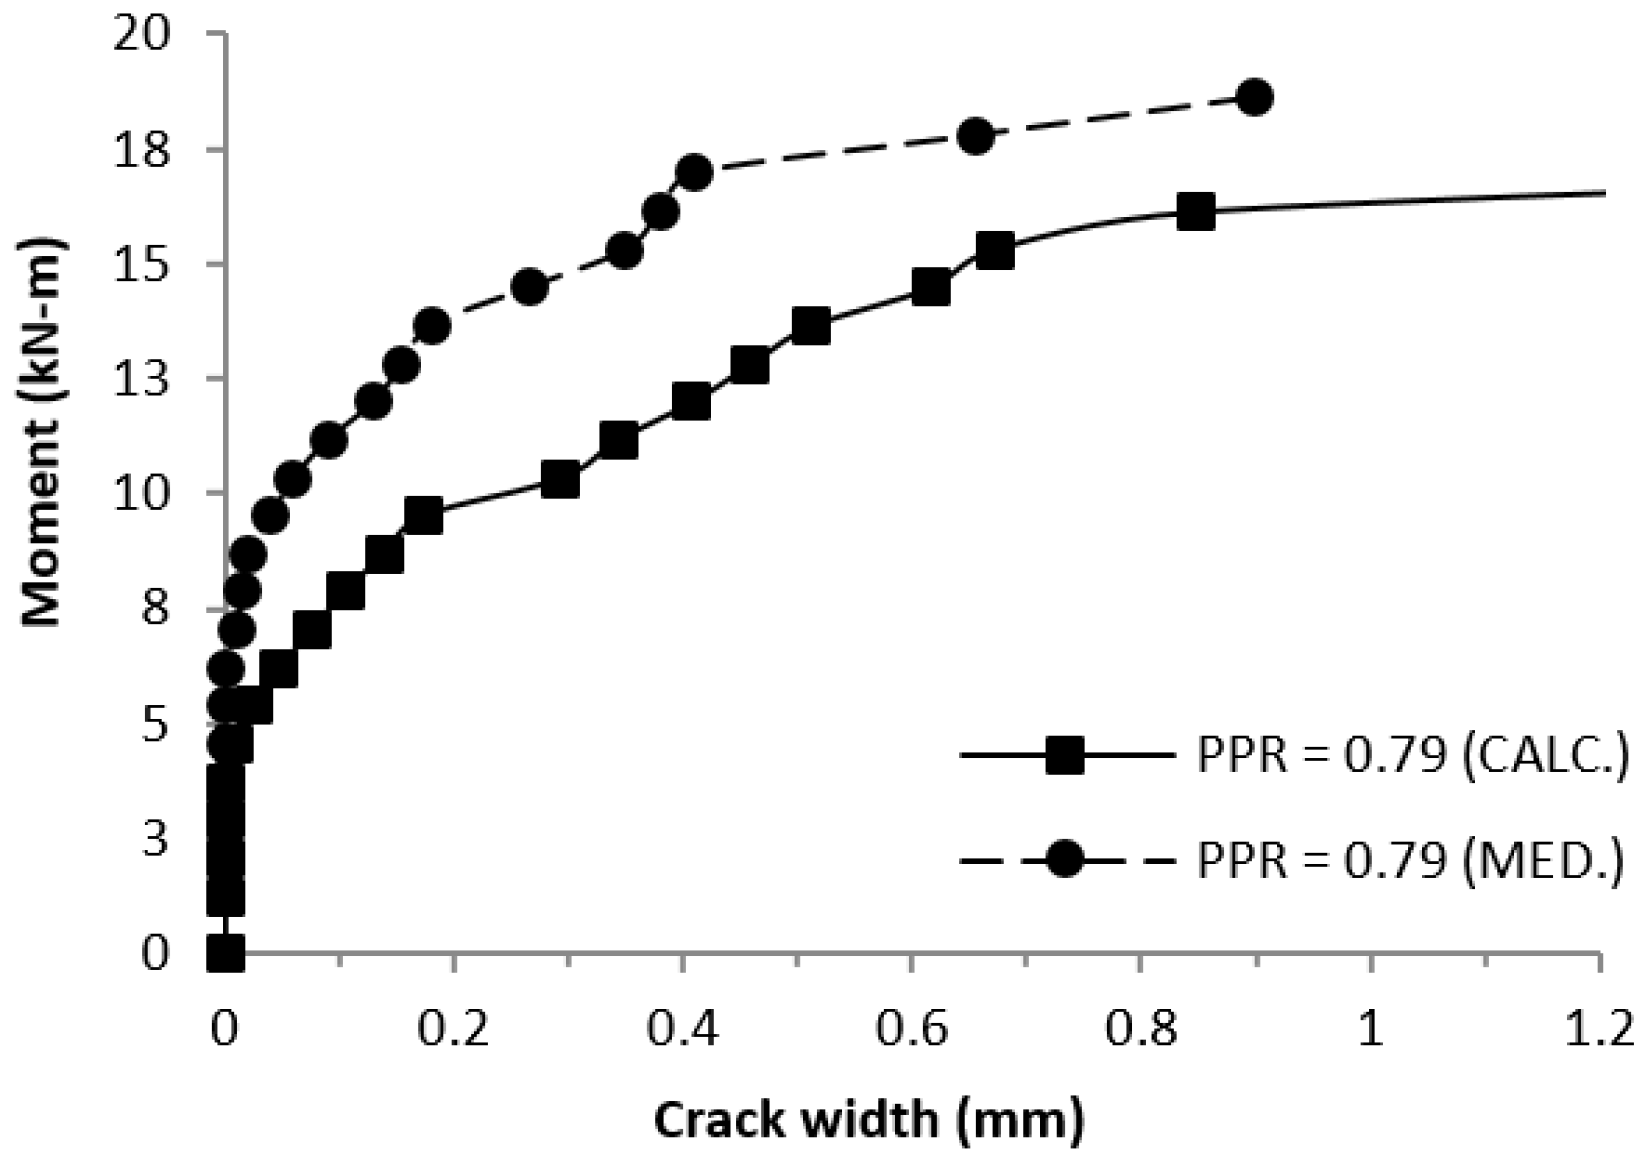
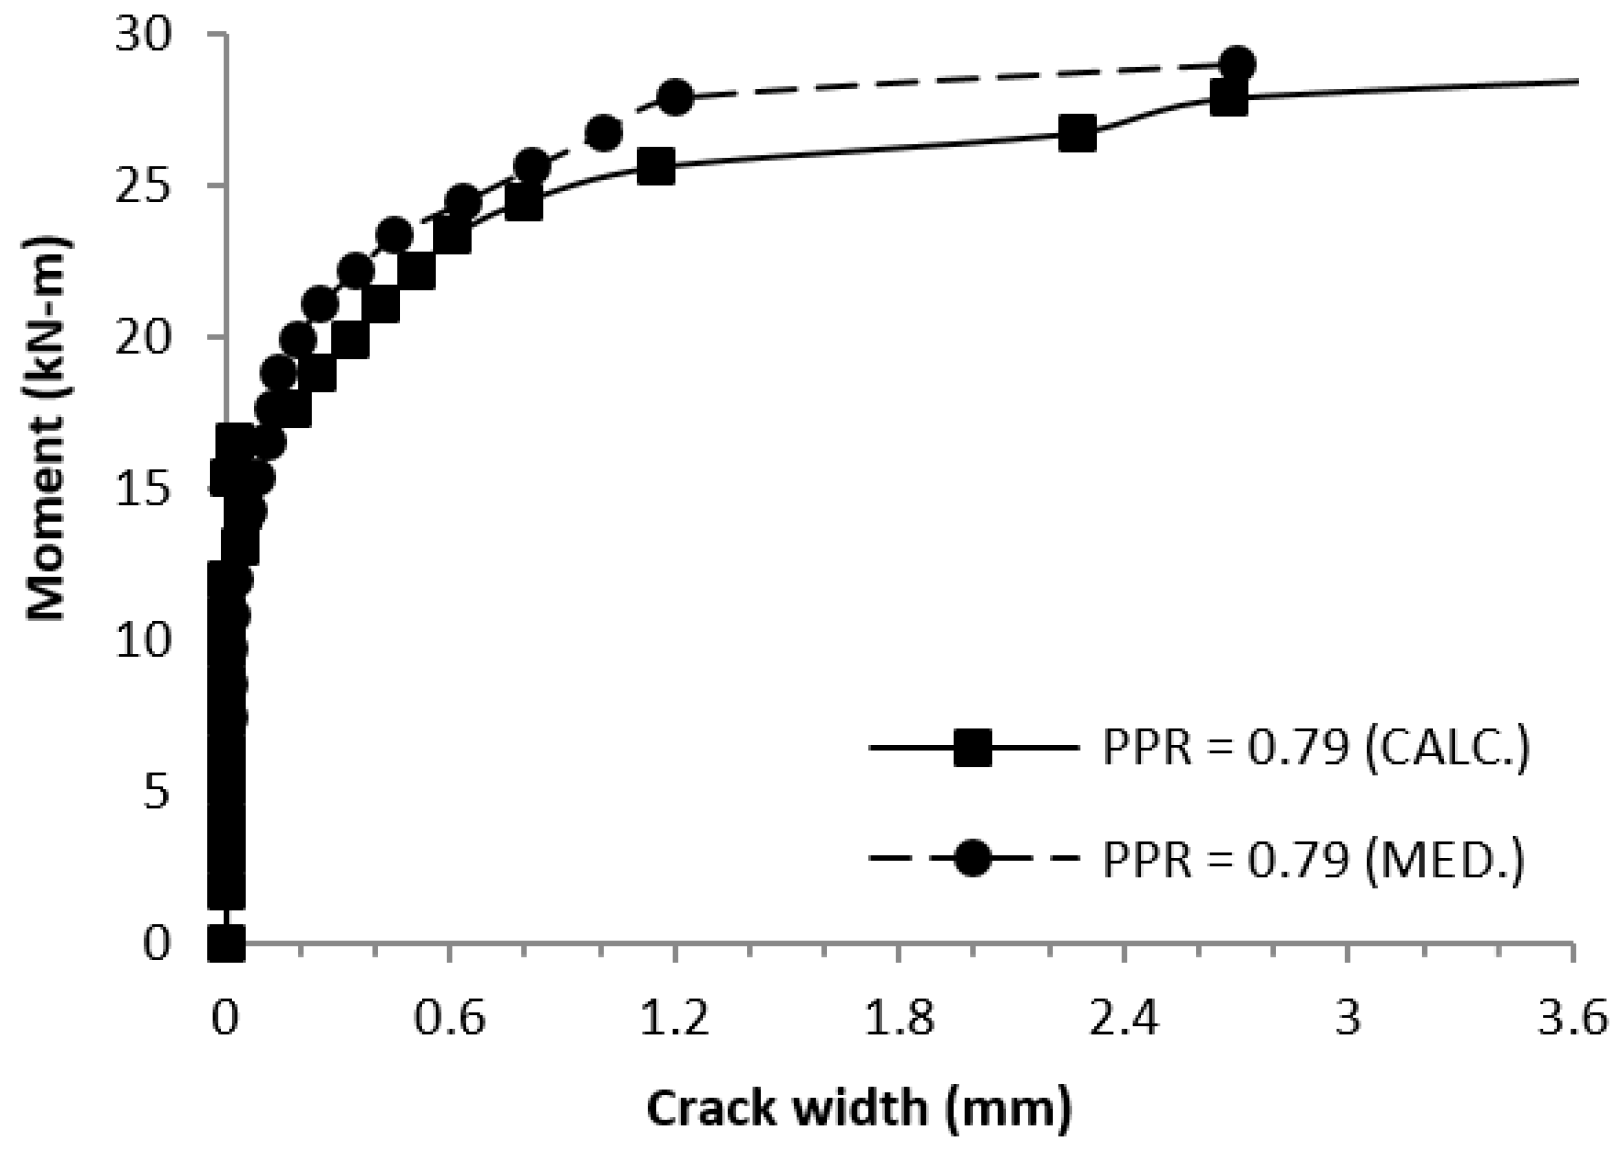
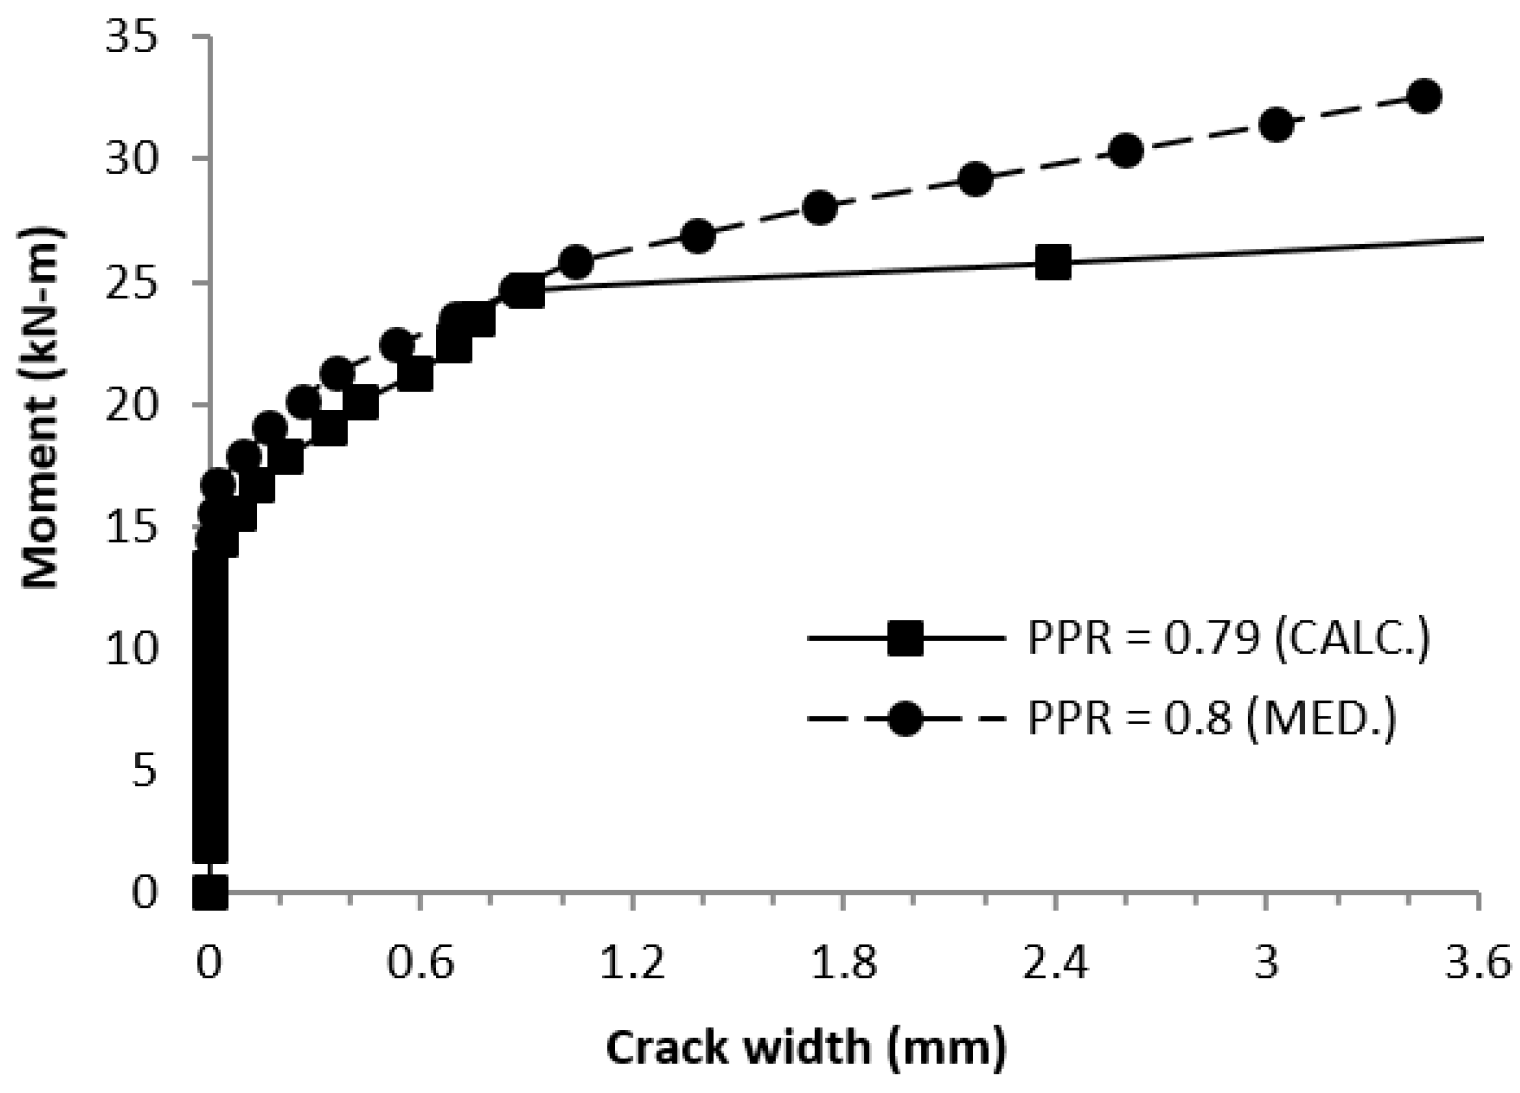
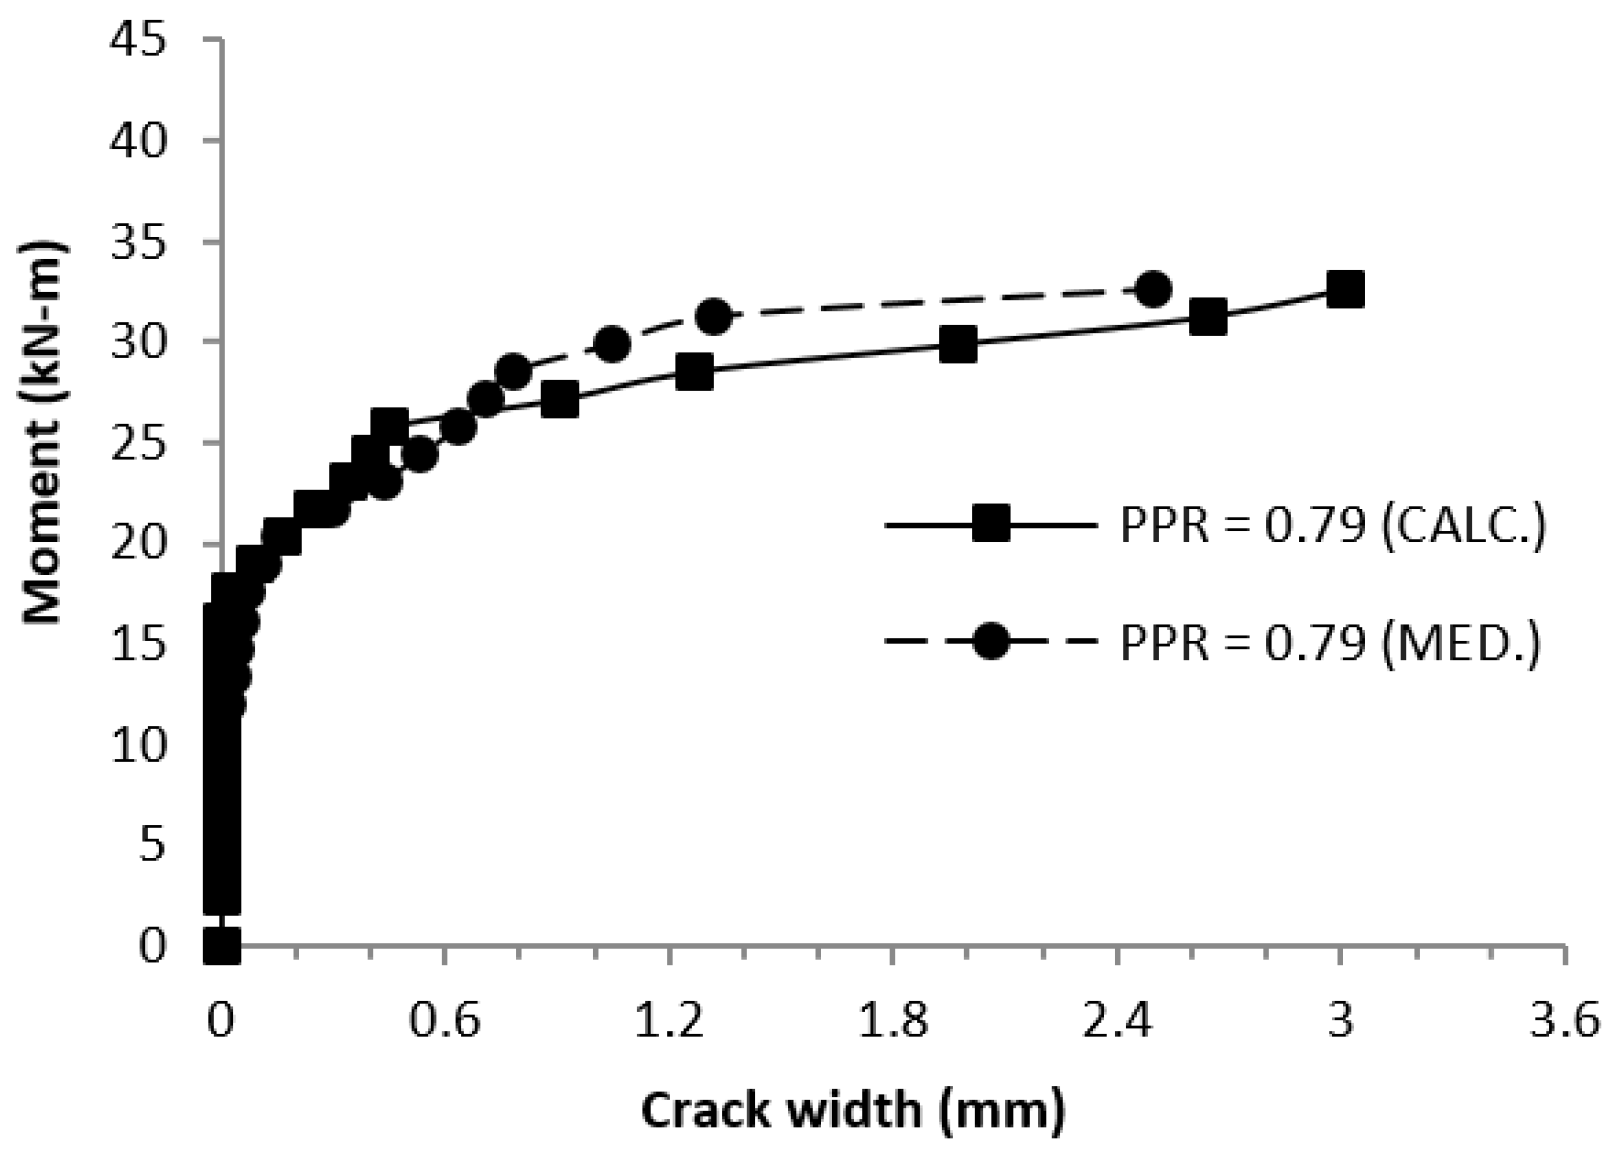
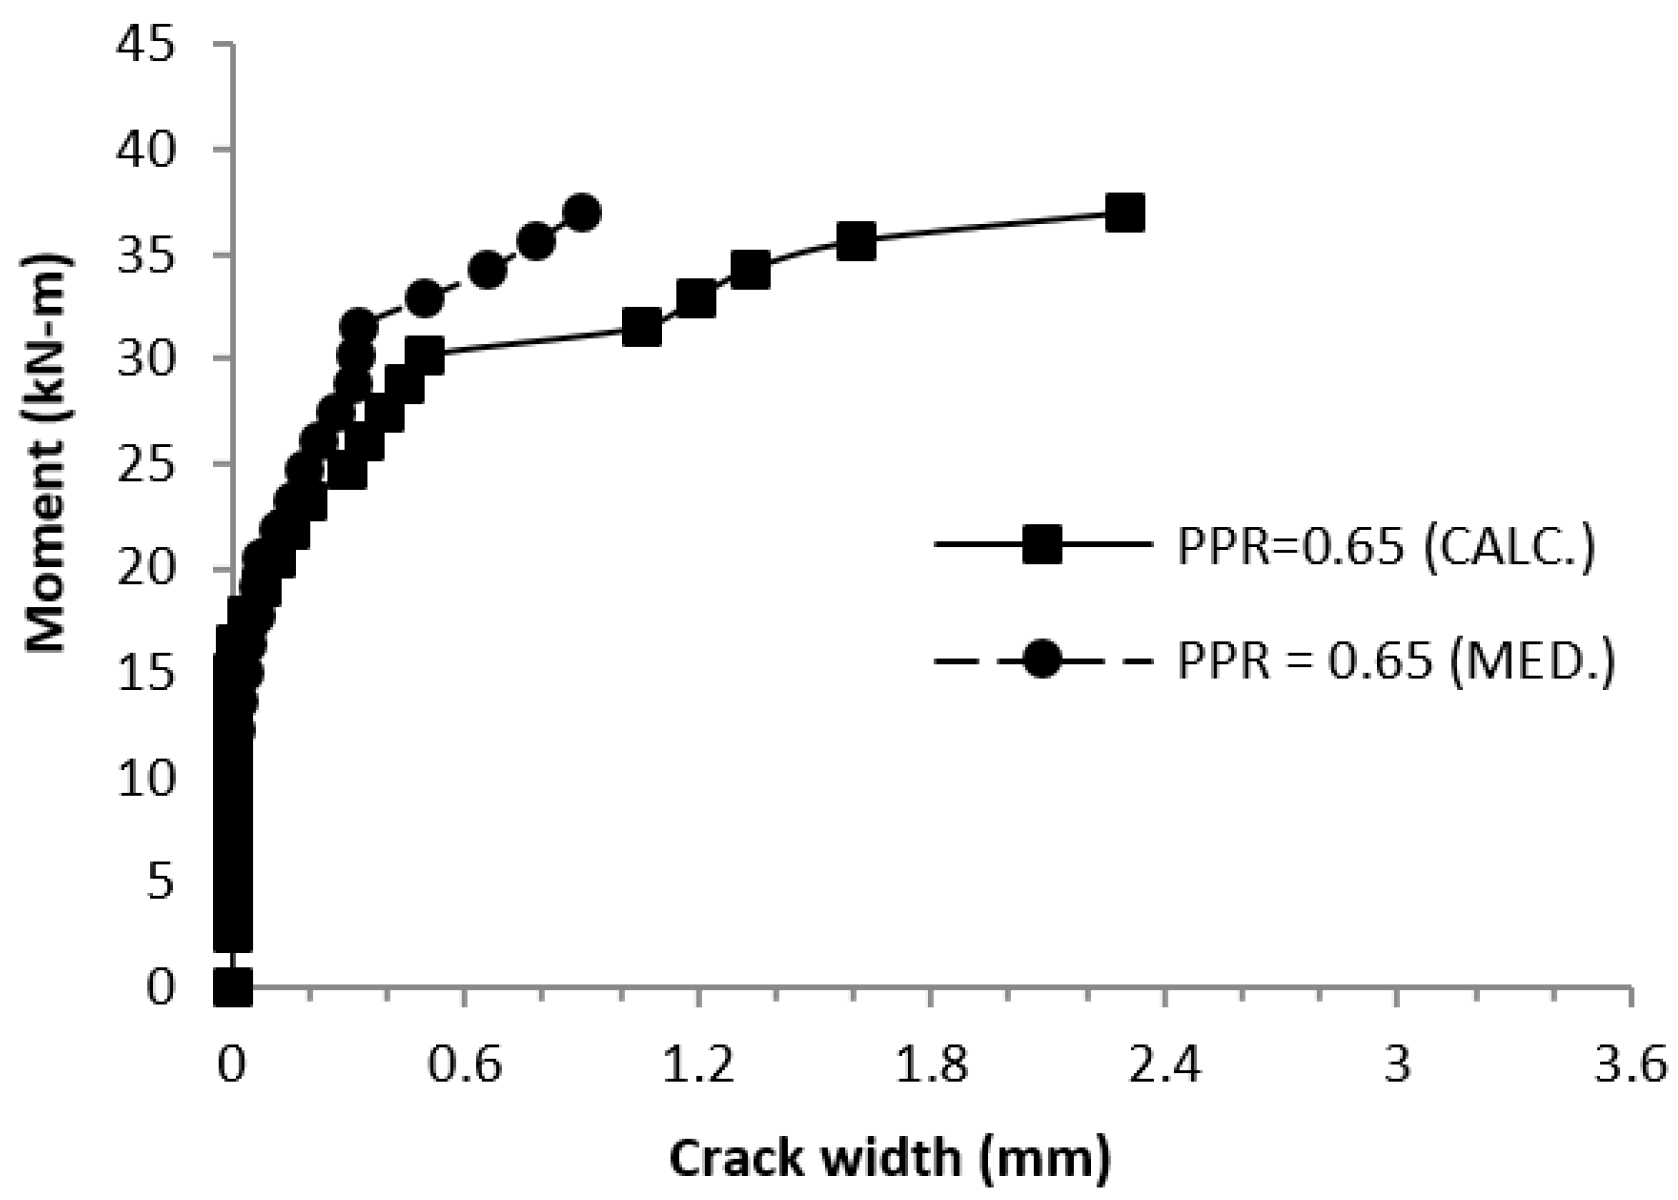
3.2. Crack Width and Cracking Distribution

Regarding cracking, data were obtained from the cracks that appeared during the beam tests, which are shown in Figure 14, Figure 15, Figure 16 and Figure 17. The results of these figures correspond to the data obtained from the 12 types of beams, where only half of the elevation of each beam is shown to observe this information more clearly, even though the distribution of the cracks is similar on both sides of the beams. In these figures, the number of the cracks outside the perimeter that delimits the contour of the beams is indicated and, also, next to each crack, the identification number of the applied load level according to the growth of each crack is indicated.
Crack widths were recorded for the different load levels (for each increment of 10.08 kN); however, in the figures above, the information on the cracks with the largest width and the longest length for each zone was included. Figure 14, Figure 15, Figure 16 and Figure 17 show the crack distribution, and it can be observed that the crack spacing decreases as the partial prestressing ratio (PPR) decreases, i.e., with more non-prestressed reinforcing steel, the crack spacing is smaller and it can also be observed that the number of cracks is larger as the PPR decreases. The average crack spacing obtained for the positive moment zones was 95 mm for PPR = 0.79, 83 mm for PPR = 0.65, and 66 mm for PPR = 0.55 and, for the negative moment zones, it was 58 mm for PPR = 0.79, 53 mm for PPR = 0.65, and 47 mm for PPR = 0.55. It was also observed that the crack width is greater when the PPR is higher, i.e., when there is a lesser amount of conventional reinforcing steel.
From Figure 18, Figure 19, Figure 20, Figure 21, Figure 22, Figure 23, Figure 24, Figure 25, Figure 26, Figure 27, Figure 28 and Figure 29, it can be observed that the crack widths, for the same bending moment, were slightly larger for the inverted “U” section than for the rectangular section in all zones of the beam; however, for the maximum failure load stage, the largest crack widths developed in the inverted “U” section for the centers of the spans because this concrete section has a compression width of 500 mm and the location of its neutral axis is located at a greater distance with respect to the fiber in tension compared to the 300 mm wide rectangular section of the beam; and, in contrast, on the supports, the crack widths were larger for the rectangular section because, in this zone, the width of the concrete in tension was greater than the inverted “U” section (500 mm). It was also observed that in the supports, for the maximum load stage applied to the beams, the crack width was much larger (up to 3.6 mm) with respect to the crack width of the span centers (up to 1.2 mm) because, in general, the moments occurring in the supports are larger in relation to the moments in the span centers, so it can be considered that the crack widths are directly related to the cross-section and the moment of each particular zone.
Based on this information, an analogy was made with empirical expressions [46] that consider the unit deformations in the concrete in the tension zone and, for the present investigation, the concrete compression strains and the tension strains in the conventional reinforcing steel obtained from the tests were taken into account for each particular zone, and, in this manner, the following equation was proposed to determine the crack width.
ω = K w ε c t ε c r · d c A b · P P R 3
where
  • ω = crack width in mm.
  • εct = unit strain in the extreme fiber in tension of the concrete for the stage in which the crack width is determined, obtained by compatibility of strains between the concrete and conventional reinforcing steel.
  • εcr = unit strain in the extreme fiber in the tension of the concrete at the instant of cracking ( = 2 f c / E c ) , calculated with the compressive strength f′c and modulus of elasticity of concrete Ec which were obtained experimentally.
  • dc = location of the centroid of the conventional reinforcing steel with respect to the fiber in tension.
  • Ab = area of conventional reinforcing steel in tension included in the cross-section = 2dc b.
  • b = beam width.
  • PPR = partial prestressing ratio.
  • Kw = 1.3 for positive moment zones and 2.2 for negative moment zones.
For the above equation, the cover (dc) and the area of the reinforcing steel of the tension zone included in the cross-section (Ab) were taken into consideration according to the traditional expressions used to estimate the crack width [4,46] and, additionally, the unit strain in the concrete when the first crack occurred was taken into consideration; and the partial prestressing ratio (PPR) was involved to consider the amount of conventional reinforcing steel. Furthermore, the “Kw” factors were proposed based on the difference between the measured crack widths and the widths determined by this expression (Equation (2)), and the graphs in Figure 30, Figure 31, Figure 32, Figure 33, Figure 34, Figure 35, Figure 36 and Figure 37 were obtained in which this comparison is carried out. In these graphs (Figure 30, Figure 31, Figure 32, Figure 33, Figure 34, Figure 35, Figure 36 and Figure 37), it is observed that the crack width determined analytically with this equation would be on the conservative side by obtaining higher values for the same acting moment. For the crack widths calculated with this expression, in some cases, there is a difference of up to 89% greater with respect to the crack width measured for the outer span centers and up to 94% greater for the case of the inner supports. The “Kw” factors included in the above expression (Equation (2)) could be reduced to make this difference smaller; however, they would no longer be conservative values in most instances.
On the other hand, when reaching a crack width of 0.4 mm, which corresponds to the admissible value for interior exposure, when considering Equation (2) and relating it to the bending moment, the variation would be from −9% to 18% with respect to the acting moment obtained during the tests for beams with equal spans (2.4-2.4-2.4 m) and, for the case of beams with different spans (2.4-3.6-2.4 m), the moment reached when a crack width of 0.4 mm is present varies from −16% to 3% with respect to the moment obtained during the tests. In other studies [29,47], equations have been proposed that estimate the crack width as a function of the difference in the stresses produced in the prestressing wires for the phase considered with respect to the effective stress after losses (Δfps); however, in the previously proposed equation (Equation (2)), the strain in the concrete fiber in tension (εct) is directly related to this difference in stress considering the compatibility of unit deformations of the corresponding cross-section.
In the particular case of the rectangular section beams, with a partial prestressing ratio PPR = 0.79, for the exterior spans and at the supports, a significant increase in crack width was observed at the end of the applied load (Figure 30, Figure 32, Figure 36 and Figure 37) due to the small amount of the conventional reinforcing steel area considered (two rebars) and they presented a large strain after having reached their elastic limit. Moreover, the information on crack distribution (Figure 30, Figure 31, Figure 32, Figure 33, Figure 34, Figure 35, Figure 36 and Figure 37) was correlated with the crack width obtained from the experimental data, taking into account the crack spacing obtained for the span centers (Equation (3)) and on the supports (Equation (4)).
ω = ε c t ε c r · S c r a c k
ω = 3 ε c t ε c r · S c r a c k
Because the proposed equation to determine the crack width (Equation (2)) is related to the unit strains of a cross-section of a partially prestressed concrete member, which depend directly on the acting moment (Ma) for a considered loading stage, this same moment can be involved in the determination of the crack width (Equation (3)); this same moment can be involved in the proposed equation to determine the stiffness factor “SF” of the cross-section, which would be multiplied by the uncracked inertia and by the modulus of elasticity of the concrete to obtain the flexural stiffness (SF ∙ E ∙ I), and with this factor, the deflections at the center of the span can be determined.
In general, in the previous graphs (Figure 30, Figure 31, Figure 32, Figure 33, Figure 34, Figure 35, Figure 36 and Figure 37), the acting moment Ma is represented in the ordinates, which is related to the crack width indicated on the abscissa for the different types of beams that were tested. It is shown that as the acting moment Ma increases with respect to the cracking moment Mcr, the crack width also begins to increase following the behavior of the proposed equation, which was compared to the crack widths obtained during the tests of the beams.
Future research will consider analyzing different case studies using finite element software to validate the equations described in this article. It is considered to use different variables such as span length, cross sections, and different partial prestress ratios primarily, among others.

4. Conclusions

Based on the results discussed in this article, the following conclusions can be drawn:
(1) The relationship that exists between the flexural stiffness and the degree of cracking of a partially prestressed concrete element with unbonded tendons, for a particular cross-section, depends on the compatibility of strain between the conventional bonded steel and the concrete, on the stresses in the linearly varying prestressing cables, on the flexural strength, on the inertia of the cracked and uncracked transformed section, and, mainly, on the distribution of the conventional steel in the tension zone that is a function of the partial prestressing ratio and the cracking stress of the concrete. Furthermore, it was found that it decreases from the onset of cracking. A scientific proposal is made using the model established by Equation (1), which is suitable for determining the flexural stiffness factor (SF) of a continuous partially prestressed beam with unbonded tendons, which was verified by the experimental results obtained from the tested beams. The flexural stiffness of these types of members is obtained by multiplying the stiffness factor “SF” from the above equation (Equation (1)), the modulus of elasticity of the concrete, and the uncracked gross moment of inertia of the cross-section (SF∙E∙I), which would be involved in the determination of deflections.
(2) To determine the crack width of a partially prestressed beam, Equation (2) was proposed, which involves the distribution of conventional reinforcing steel in the tension zone, the partial prestressing ratio (PPR), and the unit strains in the tension zone of the concrete. This equation was verified according to the crack widths obtained experimentally during the tests with a difference of −16% to +18%, which are a function of the unit strains occurring in the concrete in a cracked tension zone and for the loading stage under consideration.
(3) The relationship between the flexural stiffness and the degree of cracking of a partially prestressed concrete element with unbonded tendons, for a particular cross-section, depends on the compatibility of the unit strains between the conventional bonded reinforcing steel and the concrete, on the stresses in the linearly varying prestressing cables, on the flexural strength, on the inertia of the cracked and uncracked transformed section, on the distribution of the conventional reinforcing steel in the tension zone which is a function of the partial prestressing ratio, and on the cracking stress of the concrete.
(4) For an intermediate loading stage, between crack initiation and bending resistance, the crack width would be estimated with Equation (2) for the corresponding acting moment and this same moment would be involved in Equation (1) to establish the stiffness factor “SF”; in this manner, the flexural stiffness and deflections at the span center would also be determined as a function of the geometry of the element and its cross-section.
(5) The models proposed for the determination of flexural stiffness and crack widths, for service loads, can be used to estimate these same parameters theoretically, with adequate accuracy, using the stresses in the prestressing steel estimated in the current codes, the strains obtained from a strain compatibility analysis, and the geometry of the corresponding cross-section.
(6) The information obtained in this research could also be applied to slabs in one or two directions and scale tests could be carried out on these types of structural elements using the equations proposed for the stiffness factor (SF) and for obtaining the crack widths, making the adjustments that are pertinent for these types of structural elements.

Author Contributions

Conceptualization, A.A.E.-C. and C.A.J.-A.; Formal analysis, B.T.T.-T. and C.A.J.-A.; Investigation, A.A.E.-C.; Methodology, B.T.T.-T. and A.A.E.-C.; Validation, C.A.J.-A., P.L.V.-T. and J.A.R.-R.; Writing—original draft, B.T.T.-T., A.A.E.-C. and C.A.J.-A.; Writing—review and editing, B.T.T.-T., J.A.R.-R. and P.L.V.-T. All authors have read and agreed to the published version of the manuscript.

Funding

This research was funded by the Consejo Nacional de Humanidades, Ciencia y Tecnología (CONAHCYT), supported within the framework of the “Fondo Sectorial de Investigación para la Educación SEP-CONAHCYT”, with the financial aid and support given through the project number CB-2012-01-179504, and the “Programa de Apoyo a la Investigación Científica y Tecnológica (PAICYT 2010) of the UANL”, with the initial financial support for this research given through the project number IT559-1.

Institutional Review Board Statement

Not applicable.

Informed Consent Statement

Not applicable.

Data Availability Statement

The data presented in this study are openly available at http://eprints.uanl.mx/id/eprint/15700 (accessed on 20 May 2016).

Acknowledgments

The authors would like to thank Facultad de Ingeniería Civil (FIC) and the Instituto de Ingeniería Civil (IIC), of the Universidad Autónoma de Nuevo León (UANL), overseen by Luis Manuel Aranda and Pedro L. Valdez Tamez, for their support and the infrastructures provided for the development of this research work.

Conflicts of Interest

The authors declare no conflict of interest.

Abbreviations

AbArea of conventional steel in tension.
bBeam width.
dcCentroid of conventional reinforcement steel.
EcElastic modulus of concrete.
f′cCompressive strength.
fpuUltimate tensile strength of tendons.
fseStress after losses.
fyYield strength.
IcrMoment of inertia cracked section.
IgMoment of inertia.
KwFactor.
MaActing moment.
McrCracking moment.
MnMaximum bending moment.
PPCPartially prestressed concrete.
PPRPartial prestressing ratios.
SFStiffness factor.
W/CWater–Cement ratio.
ΔfpsEffective stress after losses.
εctUnit strain in extreme fiber in tension.
εcrUnit cracking strain.
ωCrack width.

References

  1. Naaman, A.E. Analysis and Design of Partially Prestressed Concrete Beams: Fundamentals; University of Michigan: Ann Arbor, MI, USA, 2012. [Google Scholar]
  2. ACI Committee 318. Building Code Requirements for Structural Concrete (ACI-318-2014) and Commentary; American Concrete Institute: Farmington Hills, MI, USA, 2014. [Google Scholar]
  3. ACI-ASCE Committee 423. Recommendations for Concrete Members with Unbonded Tendons; ACI-ASCE Committee Report 423.3R-05; American Concrete Institute: Farmington Hills, MI, USA, 2005. [Google Scholar]
  4. ACI Committee 224. Control of Cracking in Concrete Structures; ACI Committee Report 224R-01; American Concrete Institute: Farmington Hills, MI, USA, 2001. [Google Scholar]
  5. Naaman, A.E.; Harajli, M.; Wight, J. Analysis of Ductility in Partially Prestressed Concrete Flexural Members. PCI J. 1986, 31, 64–87. [Google Scholar]
  6. Allouche, E.; Campbell, I.; Green, M.; Soudki, K. Tendon Stress in Continuous Unbonded Prestressed Concrete Members-Part 1: Review of Literature. PCI J. 1998, 12, 86–93. [Google Scholar]
  7. Allouche, E.; Campbell, I.; Green, M.; Soudki, K. Tendon Stress in Continuous Unbonded Prestressed Concrete Members-Part 2: Parametric Study. PCI J. 1999, 44, 60–78. [Google Scholar]
  8. Mattock, A.; Yamazaki, J.; Kattula, B. Comparative Study of Prestressed Concrete Beams, with and Without Bond. ACI Struct. J. 1971, 68, 116–125. [Google Scholar]
  9. Tam, A.; Pannell, F.N. Ultimate Moment of Resistance of Unbonded Partially Prestressed Reinforced Concrete Beams. Mag. Concr. Res. 1976, 28, 203–208. [Google Scholar]
  10. Mattock, A. Modification of ACI Code Equation for Stress in Bonded Prestressed Reinforcement at Flexural Ultimate. ACI Struct. J. 1984, 81, 331–337. [Google Scholar]
  11. Tao, X.; Du, G. Ultimate Stress of Unbonded Tendons in Partially Prestressed Concrete Beams. PCI J. 1985, 31, 72–91. [Google Scholar]
  12. Harajli, M.; Hijazi, S. Evaluation of the Ultimate Steel Stress in Partially Prestressed Concrete Members. PCI J. 1991, 36, 62–82. [Google Scholar]
  13. Campbell, T.I.; Chouinard, K.L. Influence of Nonprestressed Reinforcement on the Strength of Unbonded Partially Prestressed Concrete Members. ACI Struct. J. 1991, 88, 546–551. [Google Scholar]
  14. Chakrabarti, P.; Whang, T.; Brown, W.; Arsad, K.; Amezeua, E. Unbonded Post-Tensioning Tendons and Partially Prestressed Beams. ACI Struct. J. 1994, 91, 616–625. [Google Scholar]
  15. Chakrabarti, P. Ultimate Partially Stress for Unbonded Post-Tensioning Tendons in Prestressed Beams. ACI Struct. J. 1995, 92, 689–697. [Google Scholar]
  16. Au, F.T.K.; Du, J.S.; Cheung, Y.K. Service load analysis of unbonded partially prestressed concrete members. Mag. Concr. Res. 2005, 57, 199–209. [Google Scholar]
  17. Diep, B.; Niwa, J. Prediction of Loading-Induced Stress in Unbonded Tendons at Ultimate. Doboku Gakkai Ronbunshuu E 2006, 62, 428–483. [Google Scholar]
  18. Harajli, M. Tendon Stress at Ultimate in Continuous Unbonded Post-Tensioned Members: Proposed Modification of ACI 318, Equatipns (18-4) and (18-5). ACI Struct. J. 2012, 109, 183–192. [Google Scholar]
  19. Hussien, O.F.; Elafandy, T.H.K.; Abdelrahman, A.A.; Baky, S.A.A.; Nasr, E.A. Behavior of bonded and unbonded prestressed normal and high strength concrete beams. HBRC J. 2012, 8, 239–251. [Google Scholar]
  20. Zhou, W.; Zheng, W. Unbonded Tendon Stresses in Continuous Post Tensioned Beams. ACI Struct. J. 2014, 111, 525–536. [Google Scholar]
  21. He, Z.; Liu, Z. Stresses in External and Internal Unbonded Tendons: Unified Methodology and Design Equations. J. Struct. Eng. (ASCE) 2010, 136, 1055–1065. [Google Scholar]
  22. Lou, T.; Lopes, S.; Lopes, A. Flexural Response of Continuous Concrete Beams Prestressed with External Tendons. J. Bridge Eng. 2013, 18, 525–537. [Google Scholar]
  23. Kim, K.; Lee, D. Nonlinear analysis method for continuous post-tensioned concrete members with unbonded tendons. Eng. Struct. 2012, 40, 487–500. [Google Scholar]
  24. Kim, K.; Lee, D. Flexural behavior model for post-tensioned concrete members with unbonded tendons. Comput. Concr. 2012, 10, 241–258. [Google Scholar]
  25. Lee, D.; Kim, K. Flexural strength of prestressed concrete members with unbonded tendons. Struct. Eng. Mech. Int. J. 2011, 38, 675–696. [Google Scholar]
  26. Ghallab, A. Calculating ultimate tendon stress in externally prestressed continuous concrete beams using simplified formulas. Eng. Struct. 2013, 119, 417–430. [Google Scholar]
  27. Lou, T.; Lopes, S.; Lopes, A. Nonlinear and time-dependent analysis of continuous unbonded prestressed concrete beams. Comput. Struct. 2013, 10, 166–176. [Google Scholar]
  28. Karayannis, C.G.; Constantin, E.C. Design of partially prestressed concrete beams based on the cracking control provisions. Eng. Struct. 2013, 48, 402–416. [Google Scholar]
  29. Nawy Edward, G.; Huang, P.T. Crack and Deflection Control of Pretensioned Prestressed Beams. PCI J. 1977, 22, 30–47. [Google Scholar]
  30. Branson, D.E.; Trost, H. Application of the I-Effective Method in Calculating Deflections of Partially Prestressed Members. PCI J. 1982, 27, 62–77. [Google Scholar]
  31. Branson, D.E.; Shaikh, A.F. Deflection of Partially Prestressed Members; SP-86; American Concrete Institute: Detroit, MI, USA, 1985; pp. 323–363. [Google Scholar]
  32. Chern, J.; You, C.; Bazant, Z. Deformation of Progressively Cracking Partially Prestressed Concrete Beams. PCI J. 1992, 37, 74–84. [Google Scholar]
  33. Bonopera, M.; Liao, W.C.; Perceka, W. Experimental–theoretical investigation of the short-term vibration response of uncracked prestressed concrete members under long-age conditions. Structures 2022, 35, 260–273. [Google Scholar]
  34. Galano, S.; Losanno, D.; Miluccio, G.; Parisi, F. Multidimensional nonlinear numerical simulation of post-tensioned concrete girders with different prestressing levels. Struct. Concr. 2023, 1–22. [Google Scholar] [CrossRef]
  35. Tadros, M.; Ghali, A.; Meyer, A. Prestressed Loss and Deflection of Precast Concrete Member. PCI J. 1985, 30, 114–141. [Google Scholar]
  36. Gribniak, V.; Cervenka, V.; Kaklauskas, G. Deflection Prediction of Reinforced Concrete Beams by Design Codes and Computer Simulation. Eng. Struct. 2013, 56, 2175–2186. [Google Scholar]
  37. Harajli, M.; Alameh, A. Deflection of Progressively Cracking Partially Prestressed Concrete Flexural Members. PCI J. 1989, 34, 94–128. [Google Scholar]
  38. Harajli, M.H.; Kanj, M.Y. Service Load Behavior of Concrete Members Prestressed with Unbonded Tendons. J. Struct. Eng. ASCE 1992, 118, 2569–2589. [Google Scholar]
  39. Chowdhury, S. Damping Characteristics of Reinforced and Partially Prestressed Concrete Beams. Ph.D. Thesis, Griffith University, Queensland, Australia, 1999. [Google Scholar]
  40. ASTM A416/A416M; Standard Specification of steel strand, Uncoated Seven-Wire for Prestressed Concrete. American Society for Testing and Materials: West Conshohocken, PA, USA, 2010.
  41. ASTM A615/A615M; Standard Specification for Deformed and Plain Carbon-Steel Bars for Concrete Reinforcement. American Society for Testing and Materials: West Conshohocken, PA, USA, 2009.
  42. ASTM C31/C31M; Standard Practice for Making and Curing Concrete Test Specimens in the Field. American Society for Testing and Materials: West Conshohocken, PA, USA, 2010.
  43. ASTM C39/C39M; Standard Test Method for Compressive Strength of Cylindrical Concrete Specimens. American Society for Testing and Materials: West Conshohocken, PA, USA, 2011.
  44. ASTM C469/C469M; Standard Test Method for Static Modulus of Elasticity and Poisson’s Ratio of Concrete in Compression. American Society for Testing and Materials: West Conshohocken, PA, USA, 2010.
  45. ASTM C157/C157M; Standard Test Method for Length Change of Hardened Hydraulic Cement, Mortar and Concrete. American Society for Testing and Materials: West Conshohocken, PA, USA, 2008.
  46. Meier, W.S.; Gergely, P. Flexural Crack Width in Partially Prestressed Concrete Beams. J. Struct. Div. 1981, 107, 429–433. [Google Scholar]
  47. Gergely, P.; Lutz, L.A. Maximum Crack Width in Reinforced Concrete Flexural Member, Causes, Mechanism, and Control of Cracking in Concrete; SP-20; American Concrete Institute: Detroit, MI, USA, 1968; pp. 87–117. [Google Scholar]
Figure 1. Prestressing steel anchorage: (a) anchorage in the jacking end zone; (b) dead anchor in 300 × 150 mm beams; (c) dead anchor in 500 × 150 mm beams; (d) barrel–wedge Freyssinet anchorage; (e) jacking end in 300 × 150 mm beams.
Buildings 13 02717 g001aBuildings 13 02717 g001b
Figure 2. Elevations of continuous beams with the reinforcing steel configuration: (a) 7500 mm in length; (b) 8700 mm in length.
Buildings 13 02717 g002
Figure 3. Cross-sections of beams.
Buildings 13 02717 g003
Figure 4. Location of loads, post-tension cable trajectory, and location of strain gauges in continuous beams: (a) 7500 mm in length; (b) 8700 mm in length.
Buildings 13 02717 g004
Figure 5. Acting load configuration.
Buildings 13 02717 g005
Figure 6. “SF” vs. (Ma-Mcr)/(Mn-Mcr), cross-section 300 × 150 mm, exterior span (V-1, V-2 y V-3).
Buildings 13 02717 g006
Figure 7. “SF” vs. (Ma-Mcr)/(Mn-Mcr), cross-section 500 × 150 mm, exterior span (V-4, V-5 y V-6).
Buildings 13 02717 g007
Figure 8. “SF” vs. (Ma-Mcr)/(Mn-Mcr), cross-section 300 × 150 mm, interior span (V-1, V-2 y V-3).
Buildings 13 02717 g008
Figure 9. “SF” vs. (Ma-Mcr)/(Mn-Mcr), cross-section 500 × 150 mm, interior span (V-4, V-5 y V-6).
Buildings 13 02717 g009
Figure 10. “SF” vs. (Ma-Mcr)/(Mn-Mcr), cross-section 300 × 150 mm, exterior span (V-7, V-8 y V-9).
Buildings 13 02717 g010
Figure 11. “SF” vs. (Ma-Mcr)/(Mn-Mcr), cross-section 500 × 150 mm, exterior span (V-10, V-11 y V-12).
Buildings 13 02717 g011
Figure 12. “SF” vs. (Ma-Mcr)/(Mn-Mcr), cross-section 300 × 150 mm, interior span (V-7, V-8 y V-9).
Buildings 13 02717 g012
Figure 13. “SF” vs. (Ma-Mcr)/(Mn-Mcr), cross-section 500 × 150 mm, interior span (V-10, V-11 y V-12).
Buildings 13 02717 g013
Figure 14. Typical crack locations in beams V-1, V-2, and V-3 (300 × 150 mm). Half elevation left side.
Buildings 13 02717 g014
Figure 15. Typical location of cracks in beams V-4, V-5, and V-6 (500 × 150 mm). Half elevation left side.
Buildings 13 02717 g015
Figure 16. Typical location of cracks in beams V-7, V-8, and V-9 (300 × 150 mm). Half elevation left side.
Buildings 13 02717 g016
Figure 17. Typical location of cracks in beams V-10, V-11, and V-12 (500 × 150 mm). Half elevation left side.
Buildings 13 02717 g017
Figure 18. Moment vs. crack width, cross-section 300 × 150 mm, exterior span (V-1, V-2, V-3).
Buildings 13 02717 g018
Figure 19. Moment vs. crack width, cross-section 500 × 150 mm, exterior span (V-4, V-5, V-6).
Buildings 13 02717 g019
Figure 20. Moment vs. crack width, cross-section 300 × 150 mm, interior support (V-1, V-2, V-3).
Buildings 13 02717 g020
Figure 21. Moment vs. crack width, cross-section 500 × 150 mm, interior support (V-4, V-5, V-6).
Buildings 13 02717 g021
Figure 22. Moment vs. crack width, cross-section 300 × 150 mm, interior span (V-1, V-2, V-3).
Buildings 13 02717 g022
Figure 23. Moment vs. crack width, cross-section 500 × 150 mm, interior span (V-4, V-5, V-6).
Buildings 13 02717 g023
Figure 24. Moment vs. crack width, cross-section 300 × 150 mm, exterior span (V-7, V-8, V-9).
Buildings 13 02717 g024
Figure 25. Moment vs. crack width, cross-section 500 × 150 mm, exterior span (V-10, V-11, V-12).
Buildings 13 02717 g025
Figure 26. Moment vs. crack width, cross-section 300 × 150 mm, interior support (V-7, V-8, V-9).
Buildings 13 02717 g026
Figure 27. Moment vs. crack width, cross-section 500 × 150 mm, interior support (V-10, V-11, V-12).
Buildings 13 02717 g027
Figure 28. Moment vs. crack width, cross-section 300 × 150 mm, interior span (V-7, V-8, V-9).
Buildings 13 02717 g028
Figure 29. Moment vs. crack width, cross-section 500 × 150 mm, interior span (V-10, V-11, V-12).
Buildings 13 02717 g029
Figure 30. Moment vs. crack width, cross-section 300 × 150 mm, span 1, PPR = 0.79 (V-1).
Buildings 13 02717 g030
Figure 31. Moment vs. crack width, cross-section 500 × 150 mm, span 1, PPR = 0.79 (V-4).
Buildings 13 02717 g031
Figure 32. Moment vs. crack width, cross-section 300 × 150 mm, span 1, PPR = 0.79 (V-7).
Buildings 13 02717 g032
Figure 33. Moment vs. crack width, cross-section 500 × 150 mm, span 1, PPR = 0.79 (V-10).
Buildings 13 02717 g033
Figure 34. Moment vs. crack width, cross-section 300 × 150 mm, support 2, PPR = 0.79 (V-1).
Buildings 13 02717 g034
Figure 35. Moment vs. crack width, cross-section 500 × 150 mm, support 2, PPR = 0.79 (V-4).
Buildings 13 02717 g035
Figure 36. Moment vs. crack width, cross-section 300 × 150 mm, support 2, PPR = 0.79 (V-7).
Buildings 13 02717 g036
Figure 37. Moment vs. crack width, cross-section 500 × 150 mm, support 2, PPR = 0.65 (V-10).
Buildings 13 02717 g037
Table 1. Identification of continuous beams.
Continuous Spans of 2400-2400-2400 mm
Cross-Section 150 mm × 300 mmCross Section 150 mm × 500 mm
TypePPRTypePPR
V-10.79V-40.79
V-20.65V-50.65
V-30.55V-60.55
Continuous spans of 2400-3600-2400 mm
Cross-section 150 mm × 300 mmCross section 150 mm × 500 mm
TypePPRTypePPR
V-70.79V-100.79
V-80.65V-110.65
V-90.55V-120.55
Table 2. Concrete proportioning.
BEAM No.123456789101112
MATERIALS:
Water (kg/m3)152.9152.9152.9163.1170.3159.7162.2163.2149.7141.7166.7163.8
Cement (kg/m3)294.3294.3294.3313.9313.9294.3313.9313.9313.9294.3313.9313.9
Coarse aggregate (kg/m3)615.9615.9617.9660.3658.3617.1658.9659.1660.3617.1658.3658.9
Fine aggregate (kg/m3)757.5757.5755.8810.2804.9754.6812.4811.3823.6772.3807.9810.2
Reducing additive (mL)294294275808075808080130130130
% Absorption Coarse Ag.0.6340.6340.6340.6340.6340.6340.6340.6340.6340.6340.6340.634
% Absorption Fine Ag.2.252.252.252.252.252.252.252.252.252.252.252.25
% Moisture coarse Ag.0.10.050.320.50.20.250.30.310.50.20.210.3
% Moisture fine Ag.11.71.461.320.660.71.61.47331.061.35
Vol. concrete/mix (L)78.9578.9578.9584.2184.2178.9584.2184.2184.2178.9584.2184.21
No. of mixes (2 beams)999111112101010141313
Table 3. Concrete strength of beams.
SpecimensCompressive Strength at 28 Days (MPa)
V-140.3
V-240.7
V-337.0
V-436.3
V-535.1
V-636.0
V-736.9
V-839.3
V-934.8
V-1041.0
V-1139.7
V-1239.2
Disclaimer/Publisher’s Note: The statements, opinions and data contained in all publications are solely those of the individual author(s) and contributor(s) and not of MDPI and/or the editor(s). MDPI and/or the editor(s) disclaim responsibility for any injury to people or property resulting from any ideas, methods, instructions or products referred to in the content.

