
Evaluation of Web Shear Design Procedures for Precast Prestressed Hollow Core Slabs
 ,
,
Abstract
:1. Introduction
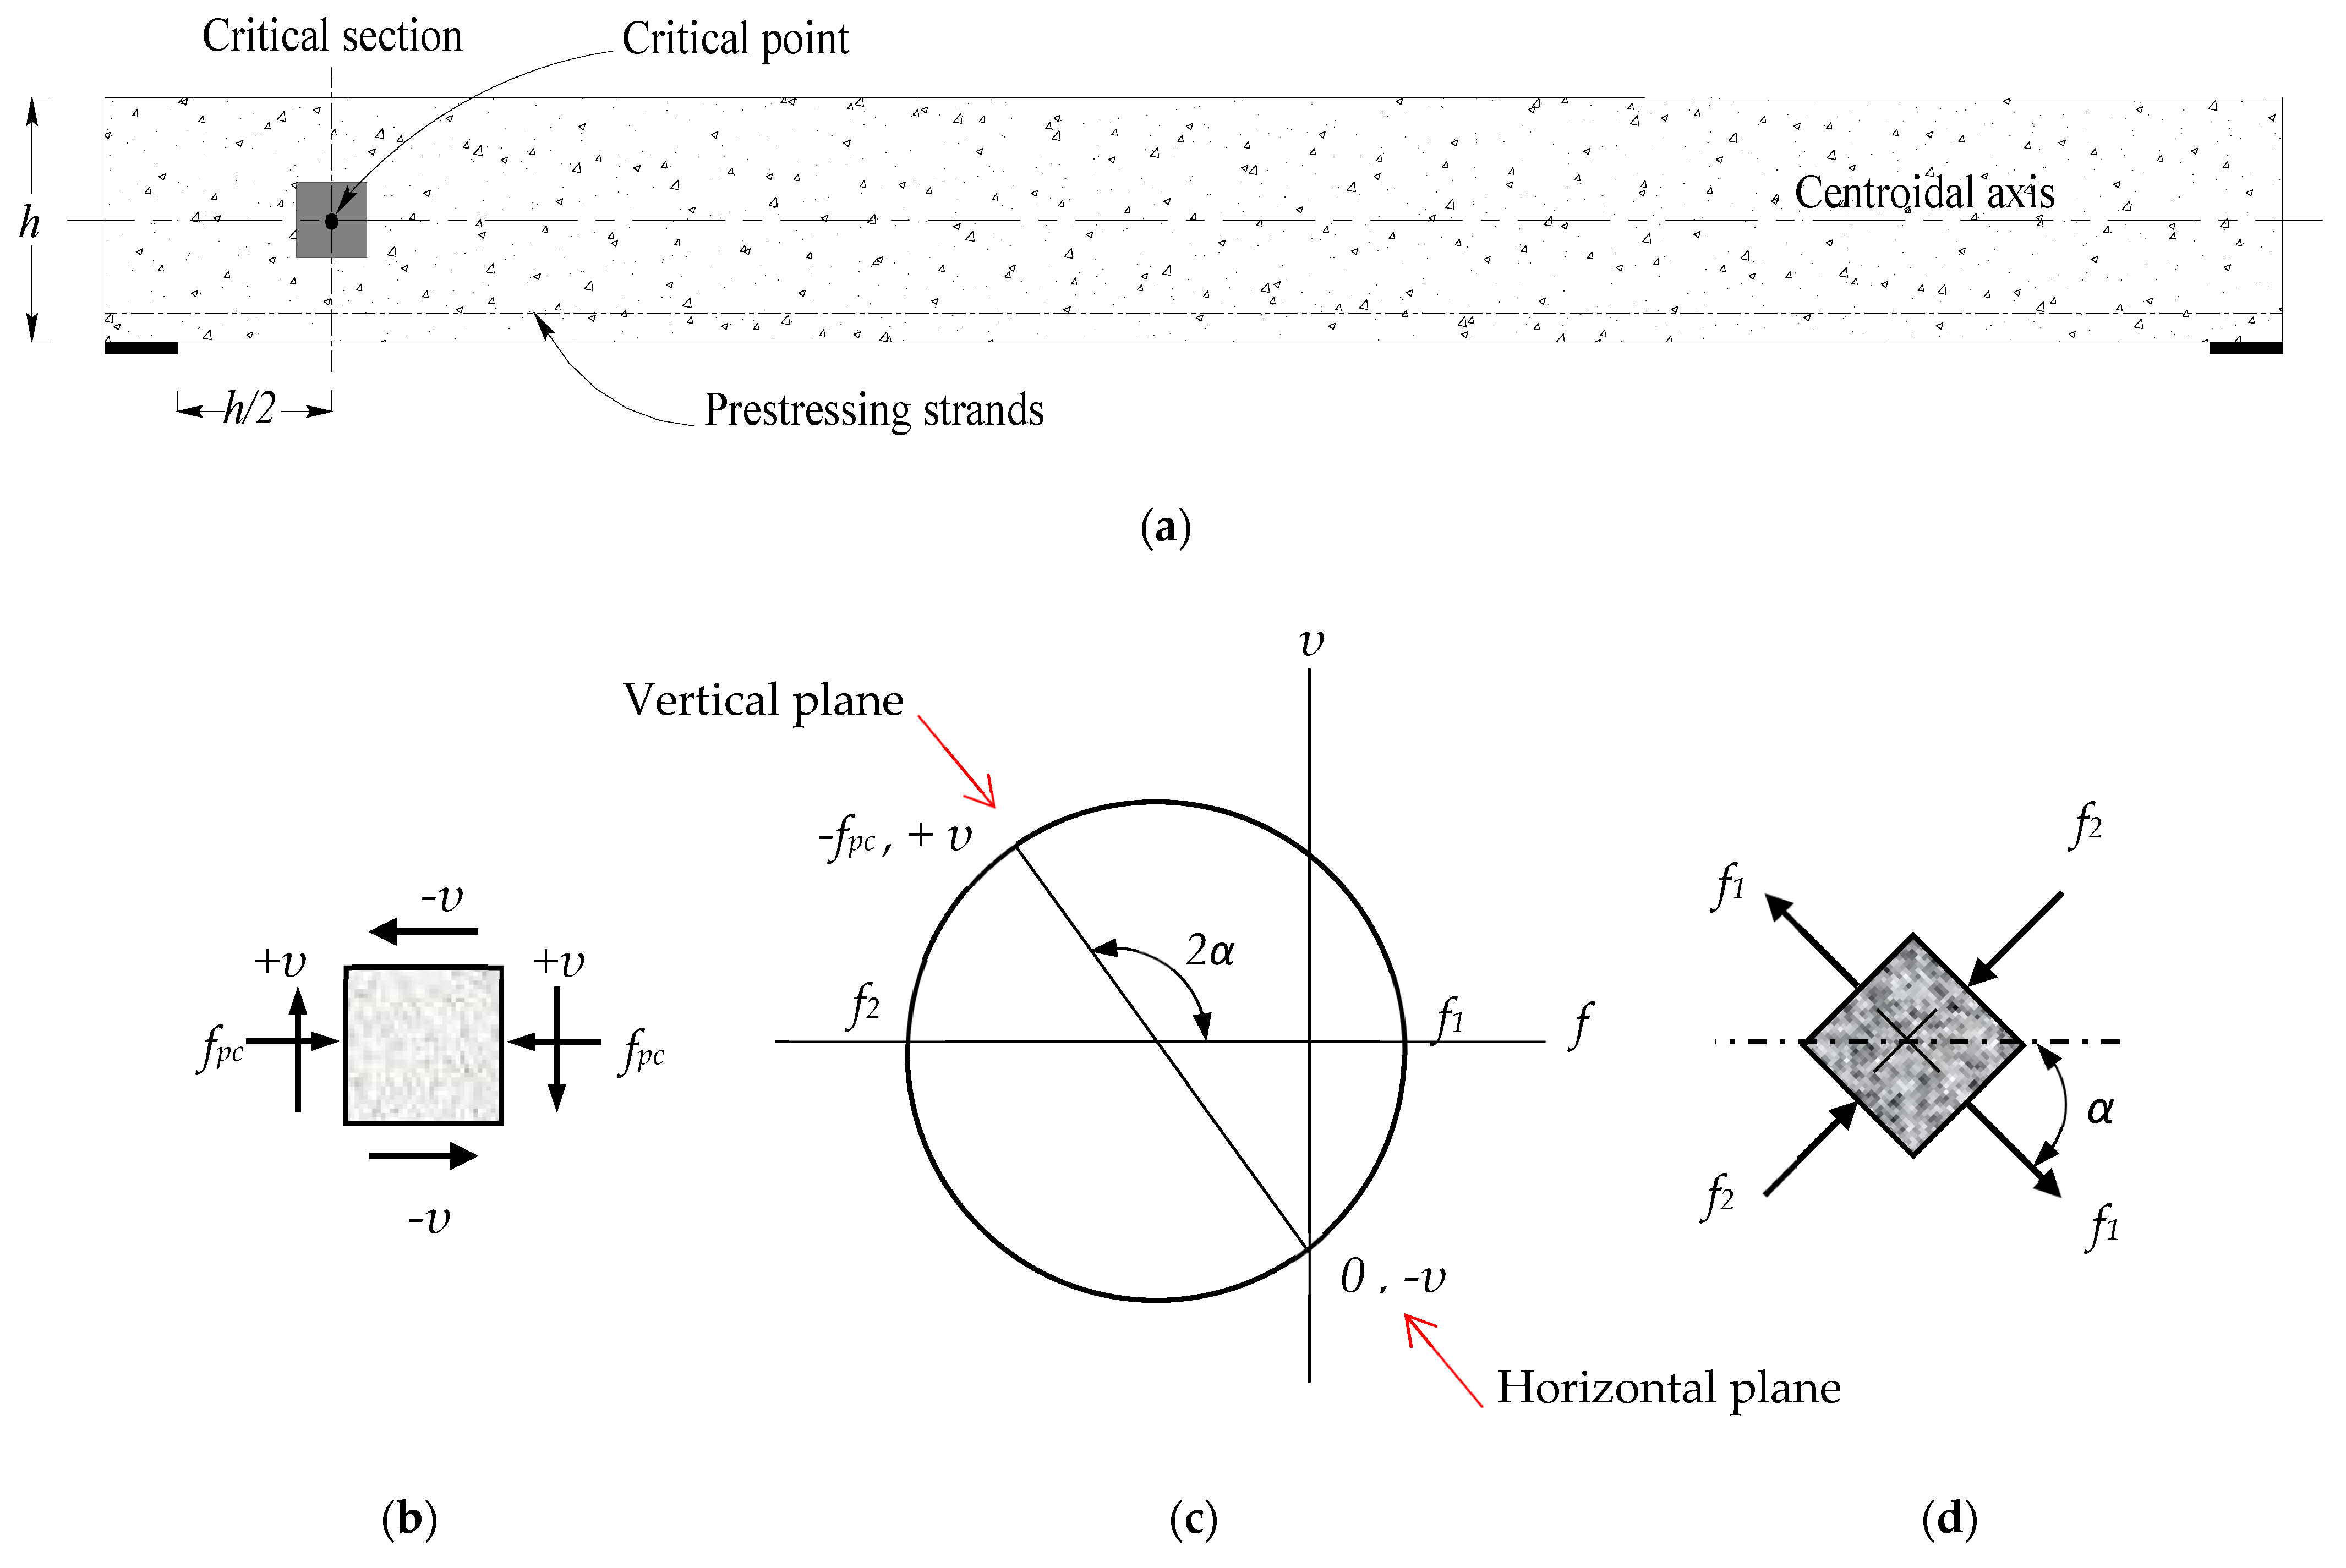
2. Theoretical Background
3. Overview of the Web Shear Design Equations for Prestressed HCS
3.1. The ACI 318 Code
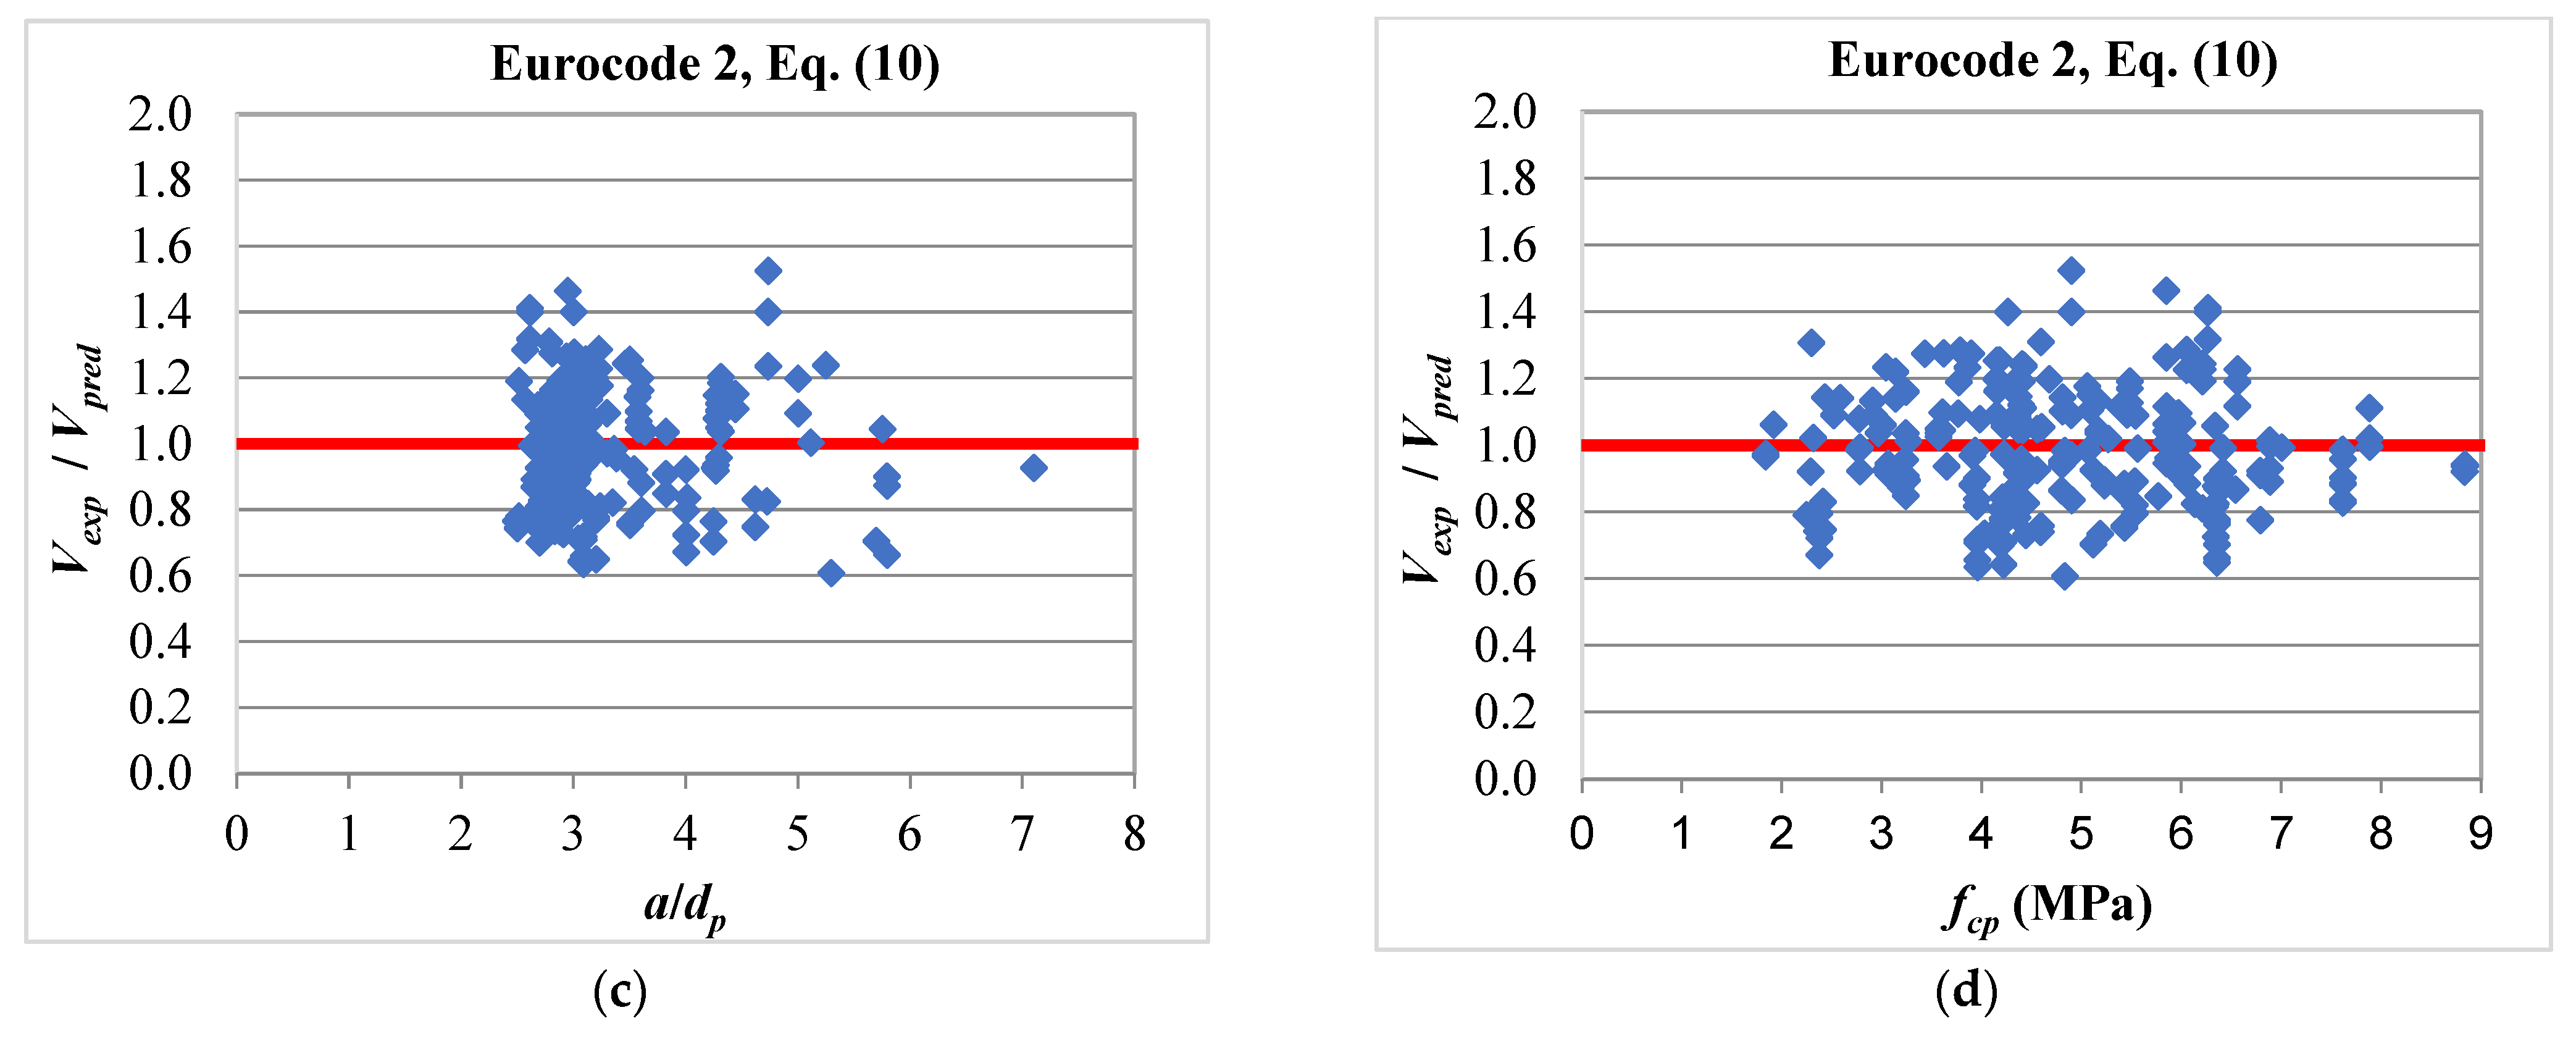
3.2. Eurocode 2
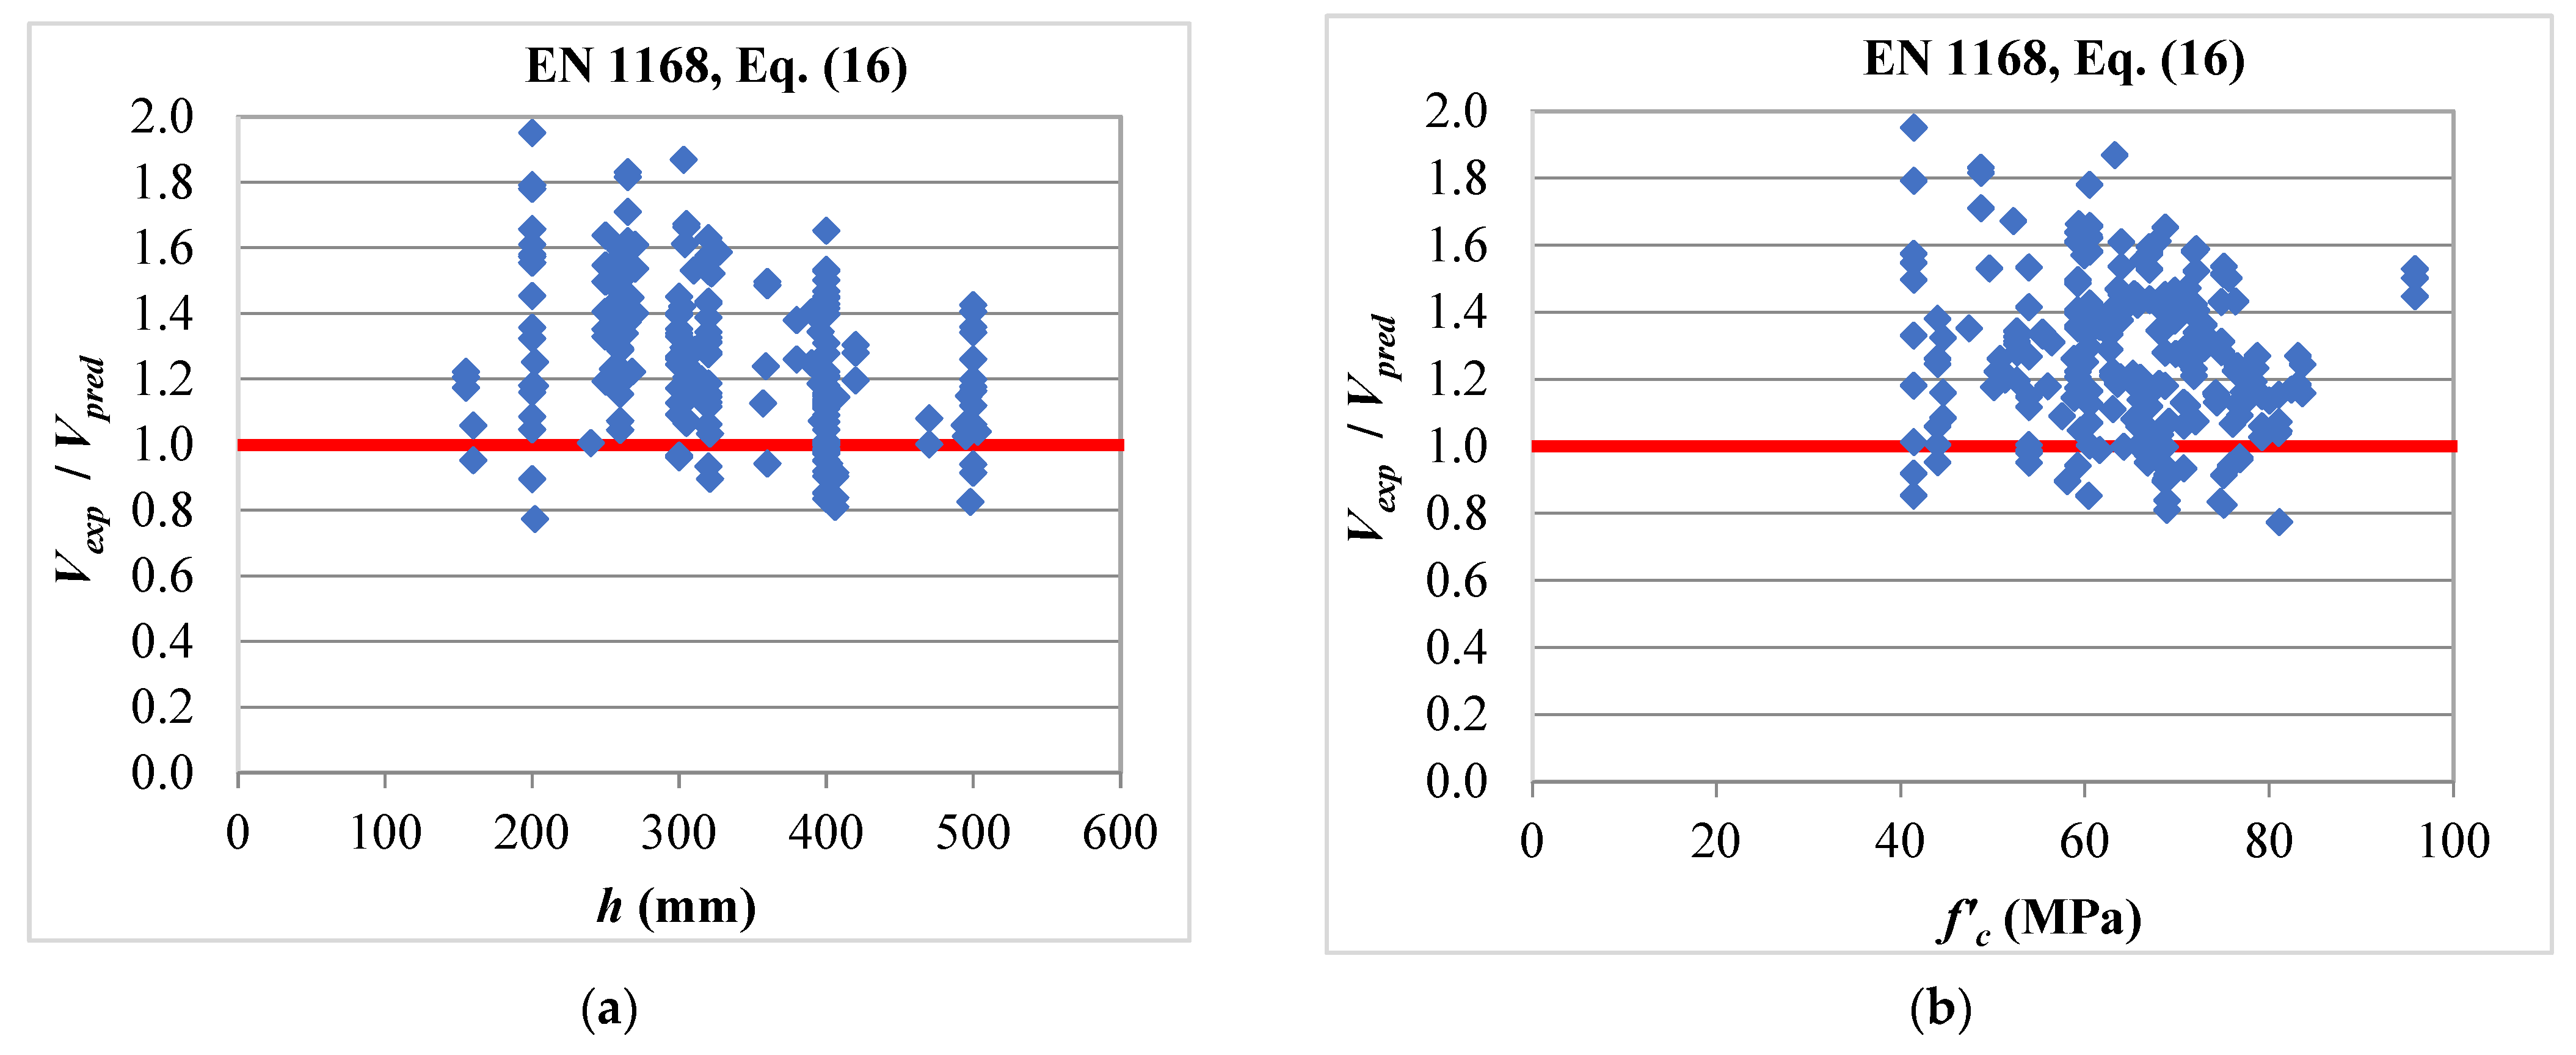
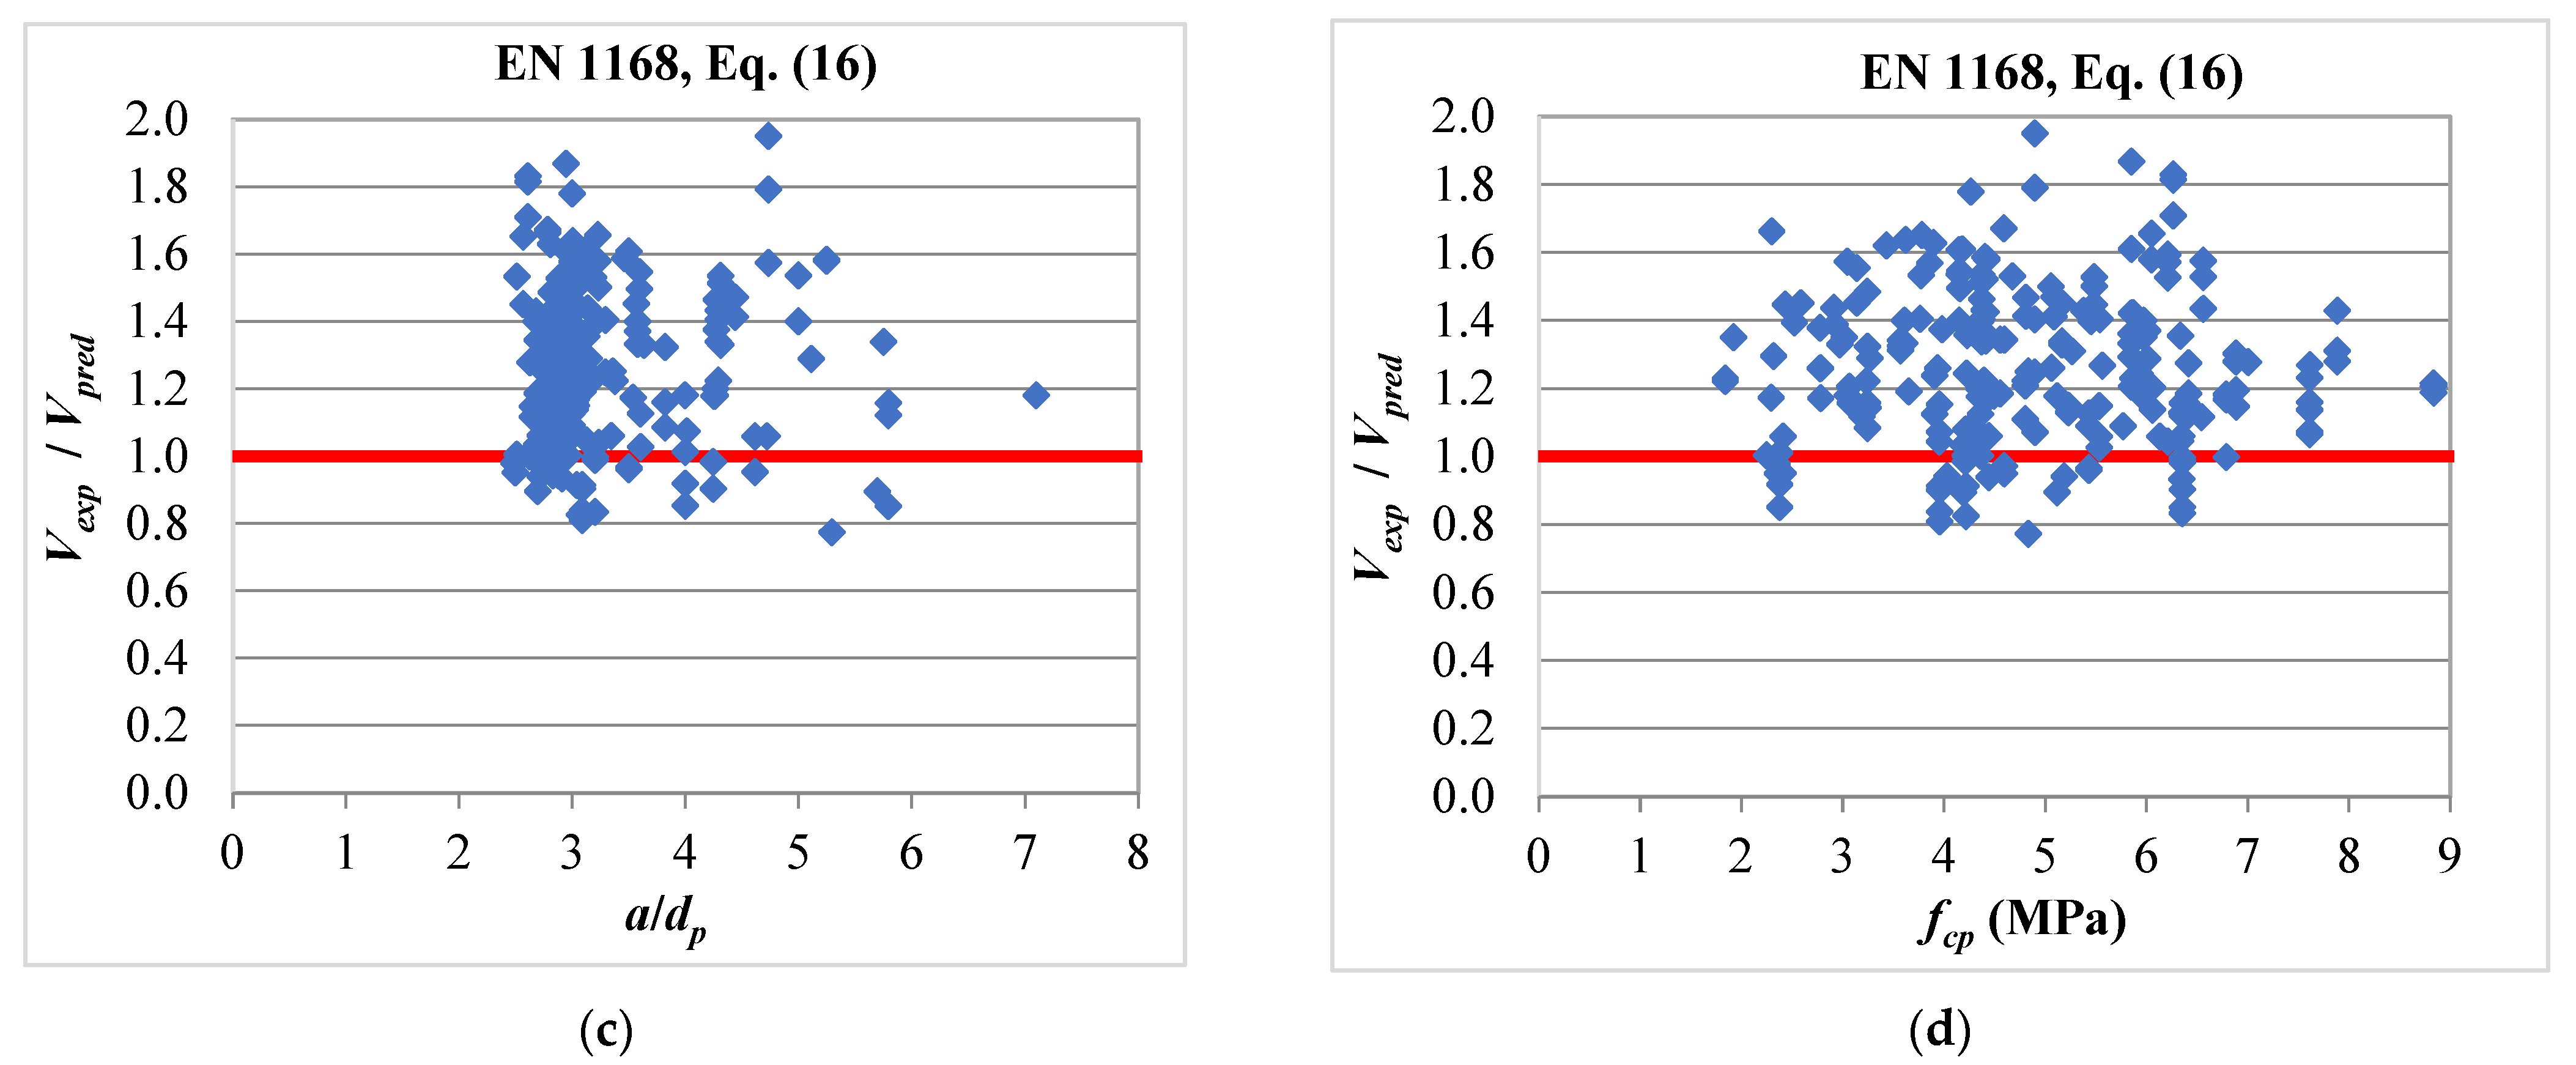
3.3. European Standard EN 1168
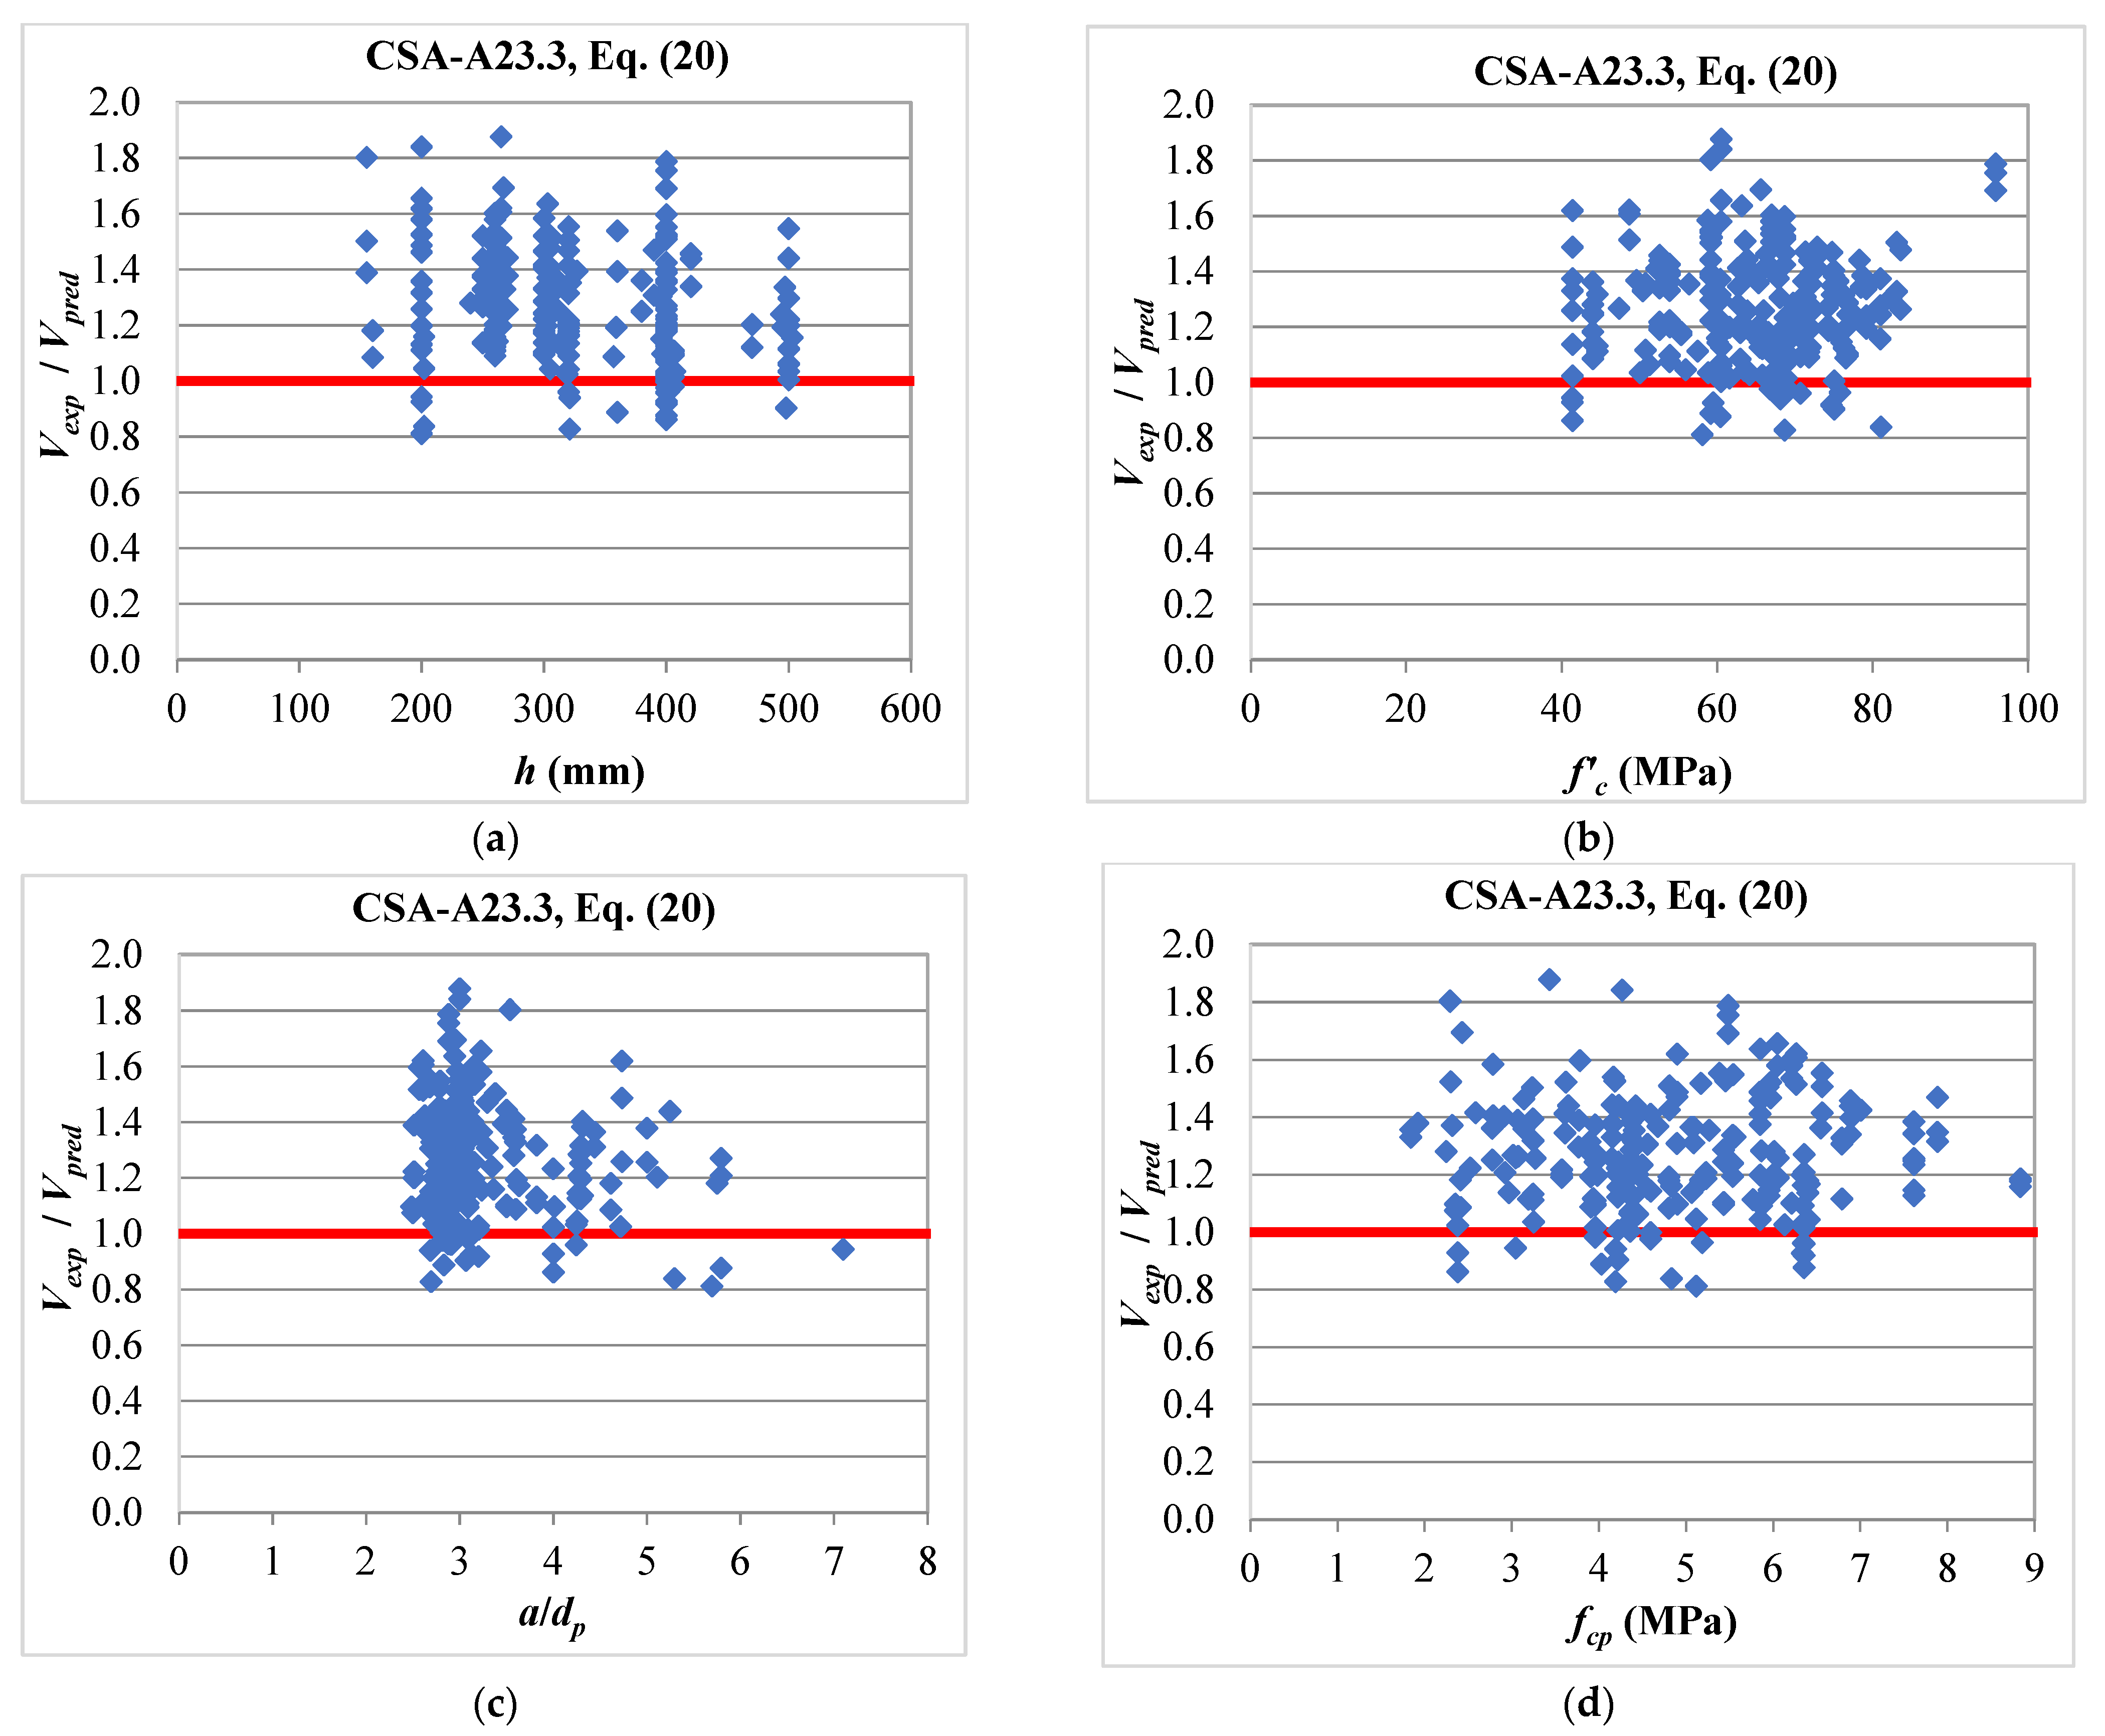
3.4. Canadian Standard CSA-A23.3
3.5. AASHTO LRFD Design Specifications
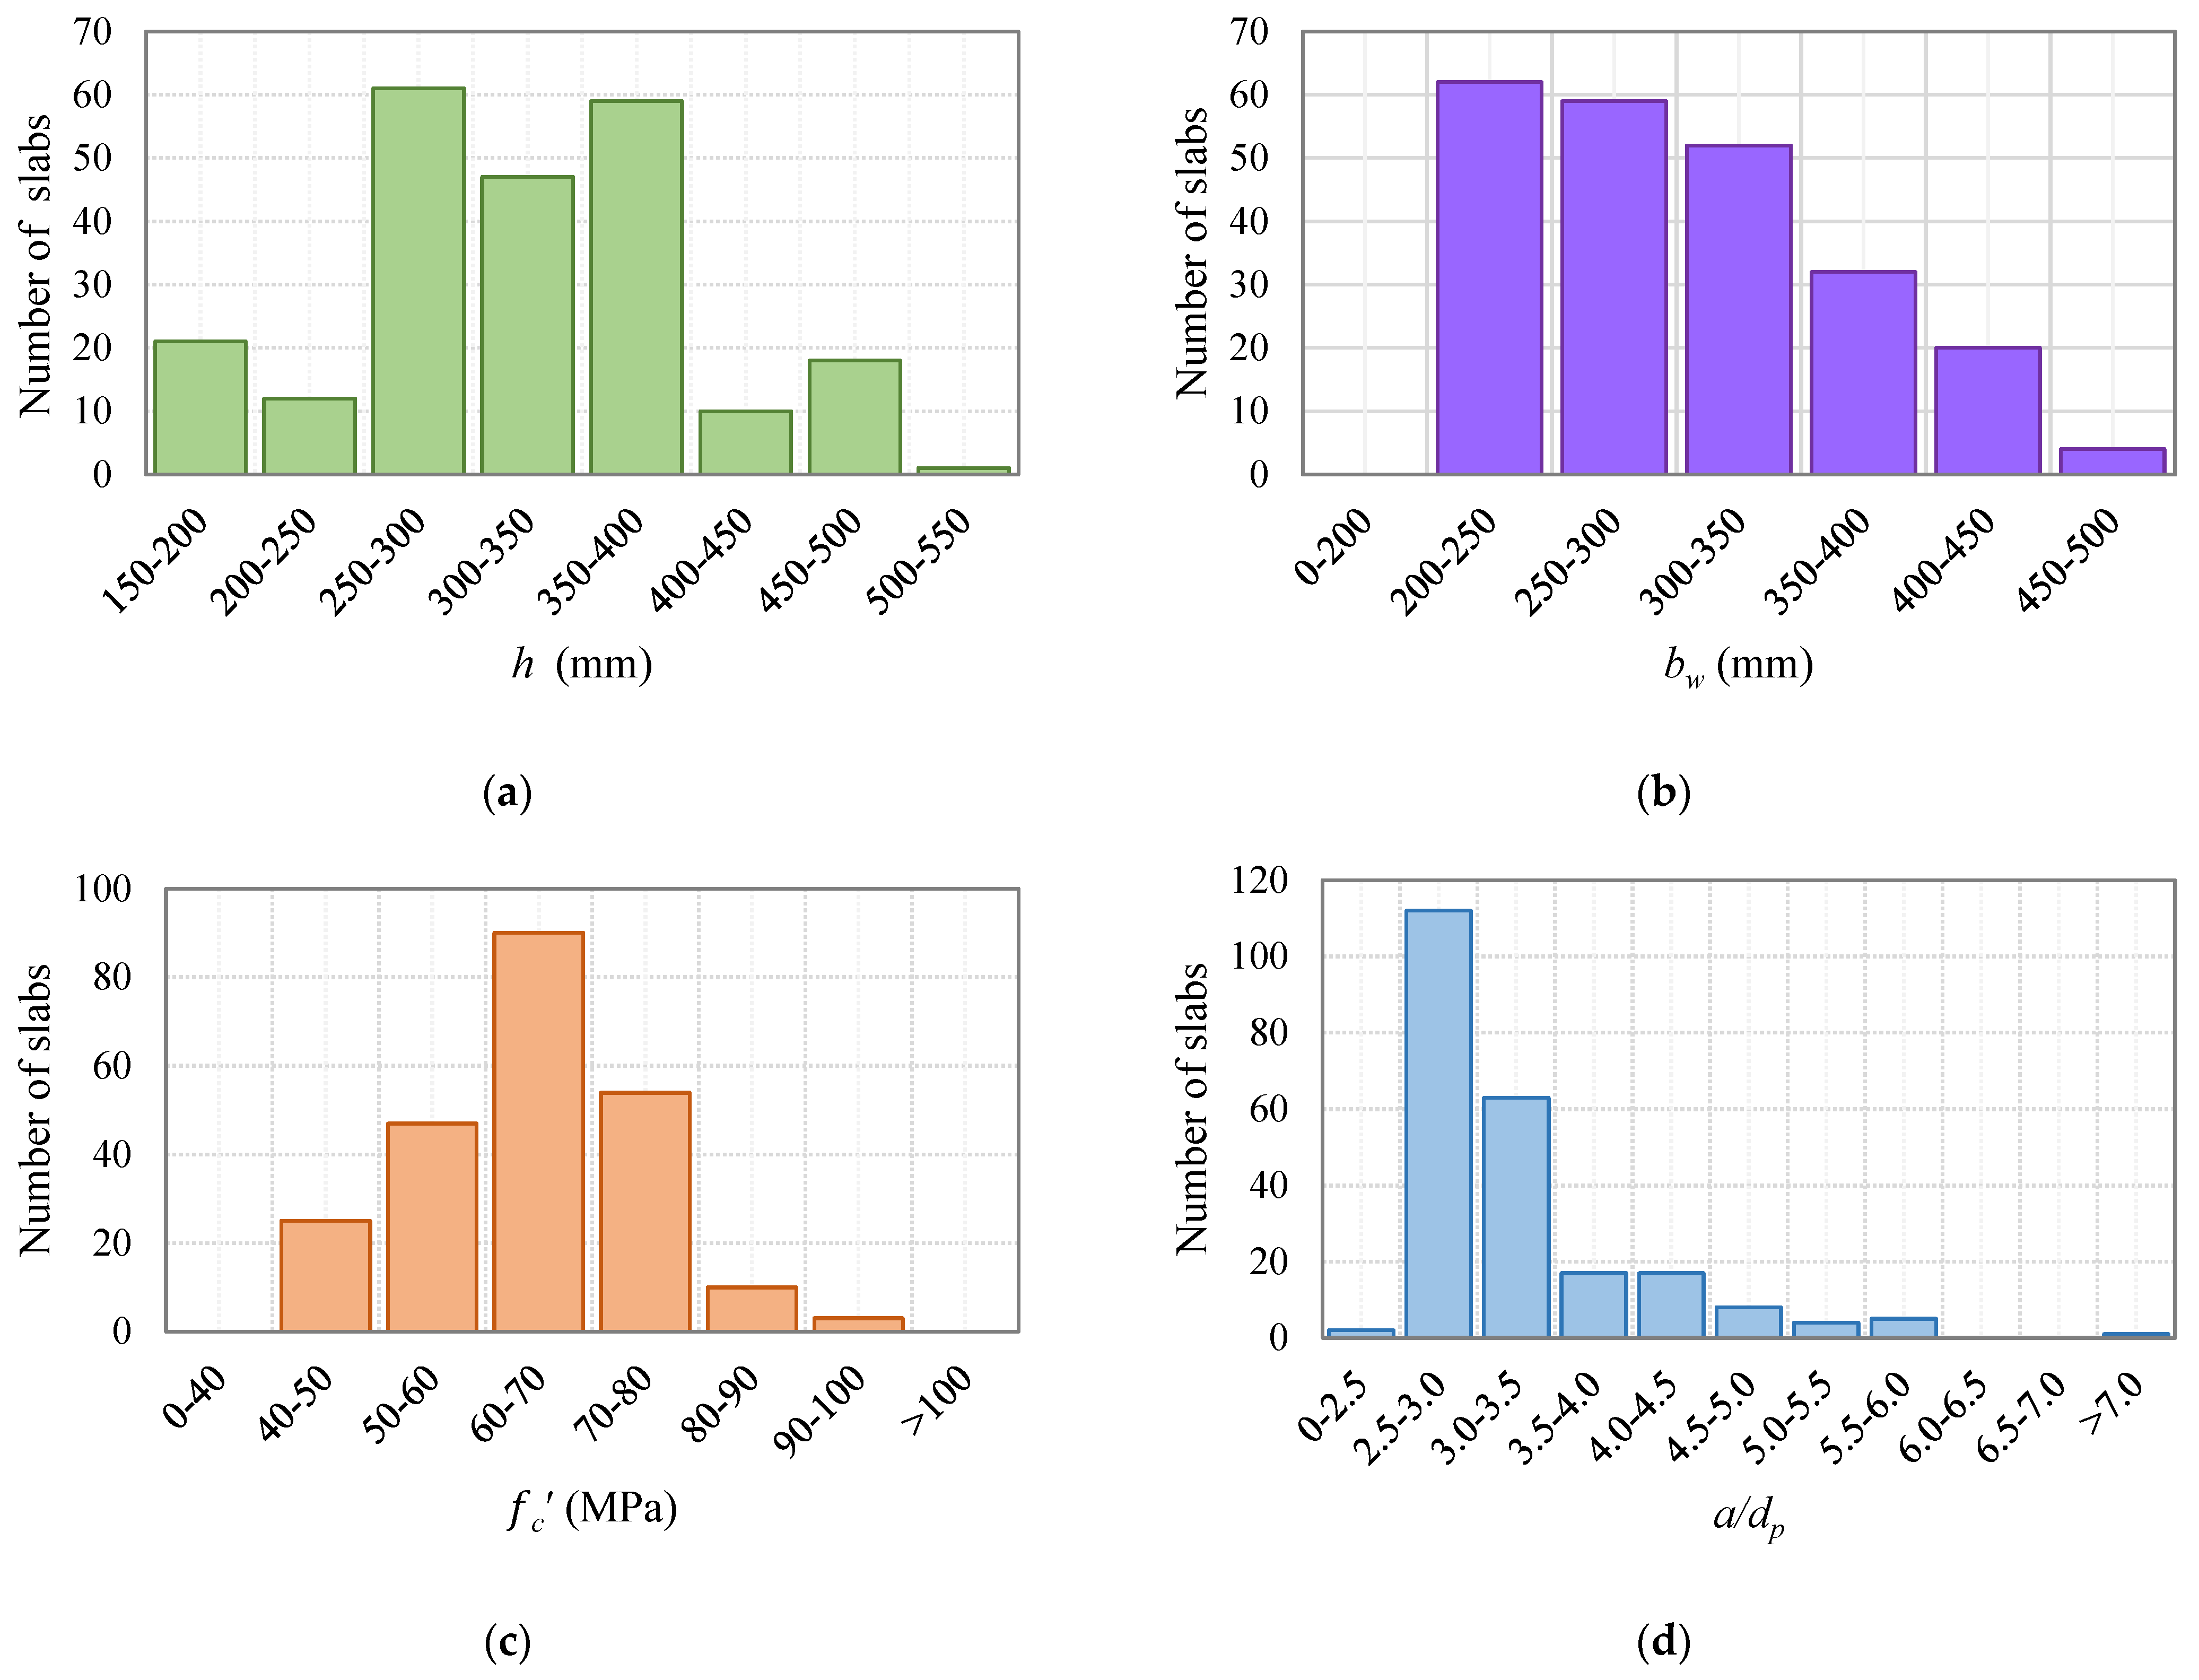
4. Experimental Database
5. Evaluation of the Design Procedures Using the Experimental Database
6. Proposed Modifications to Design Procedures
6.1. Proposed Modifications to the ACI 318
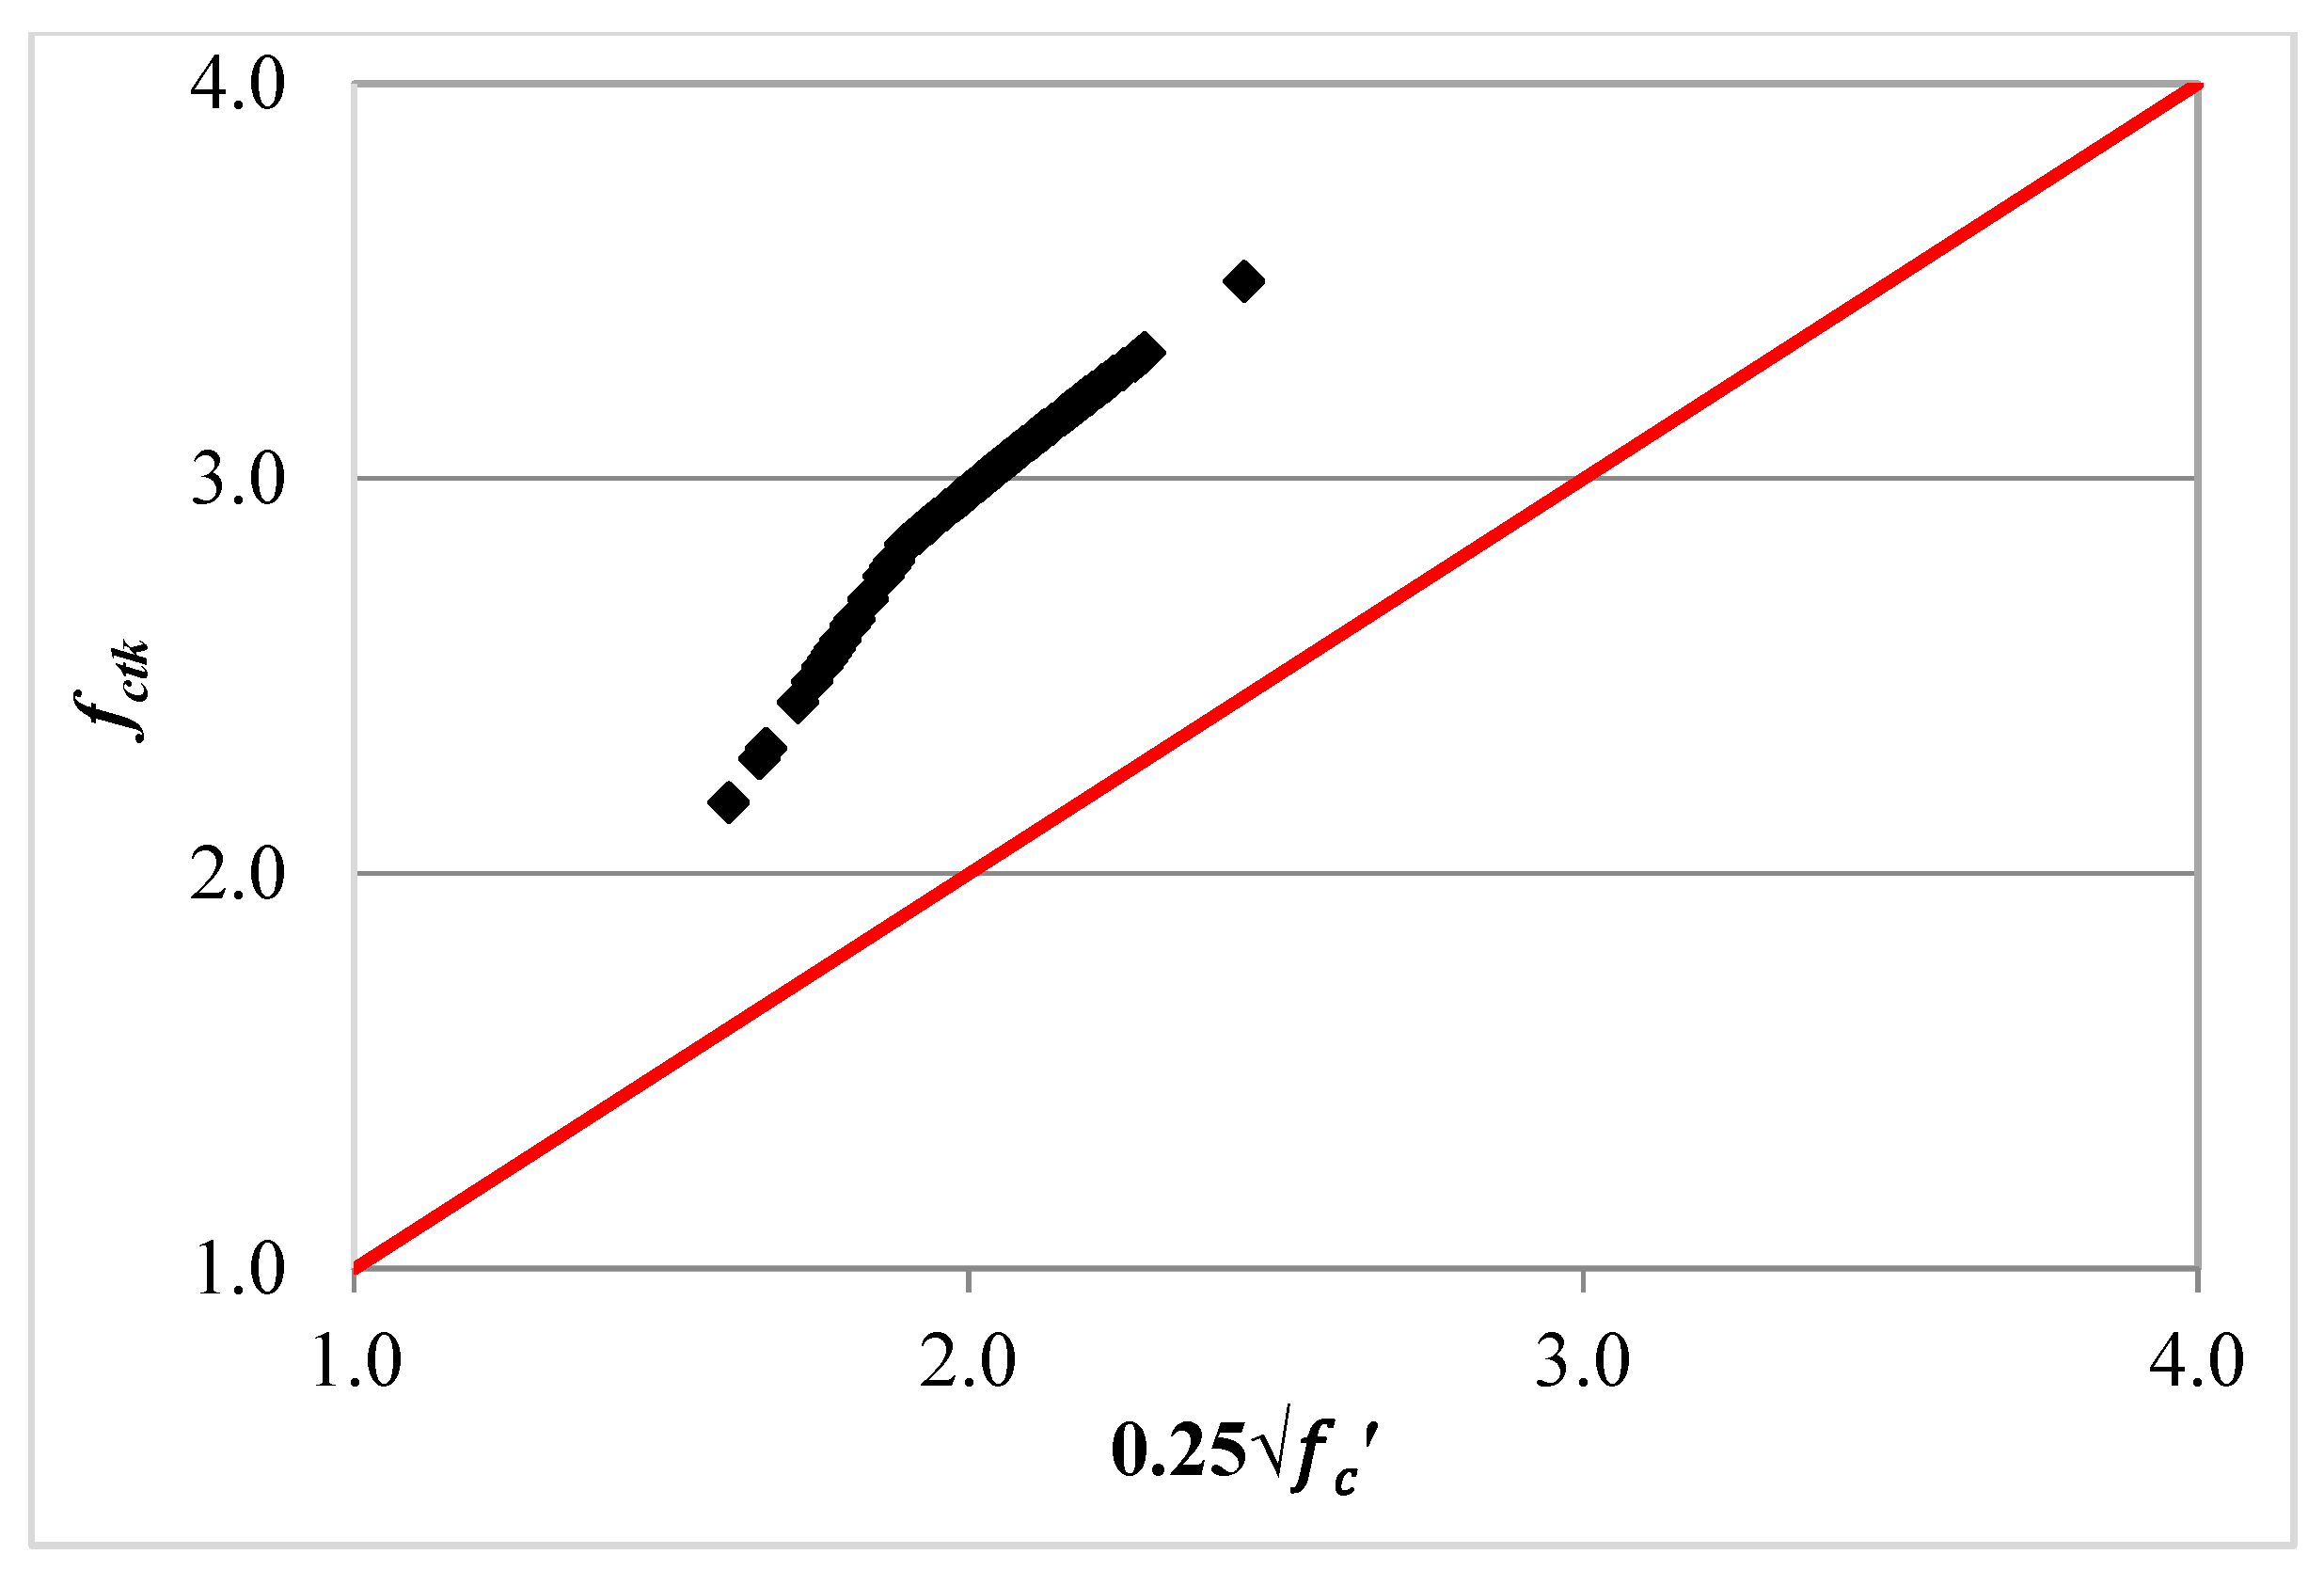
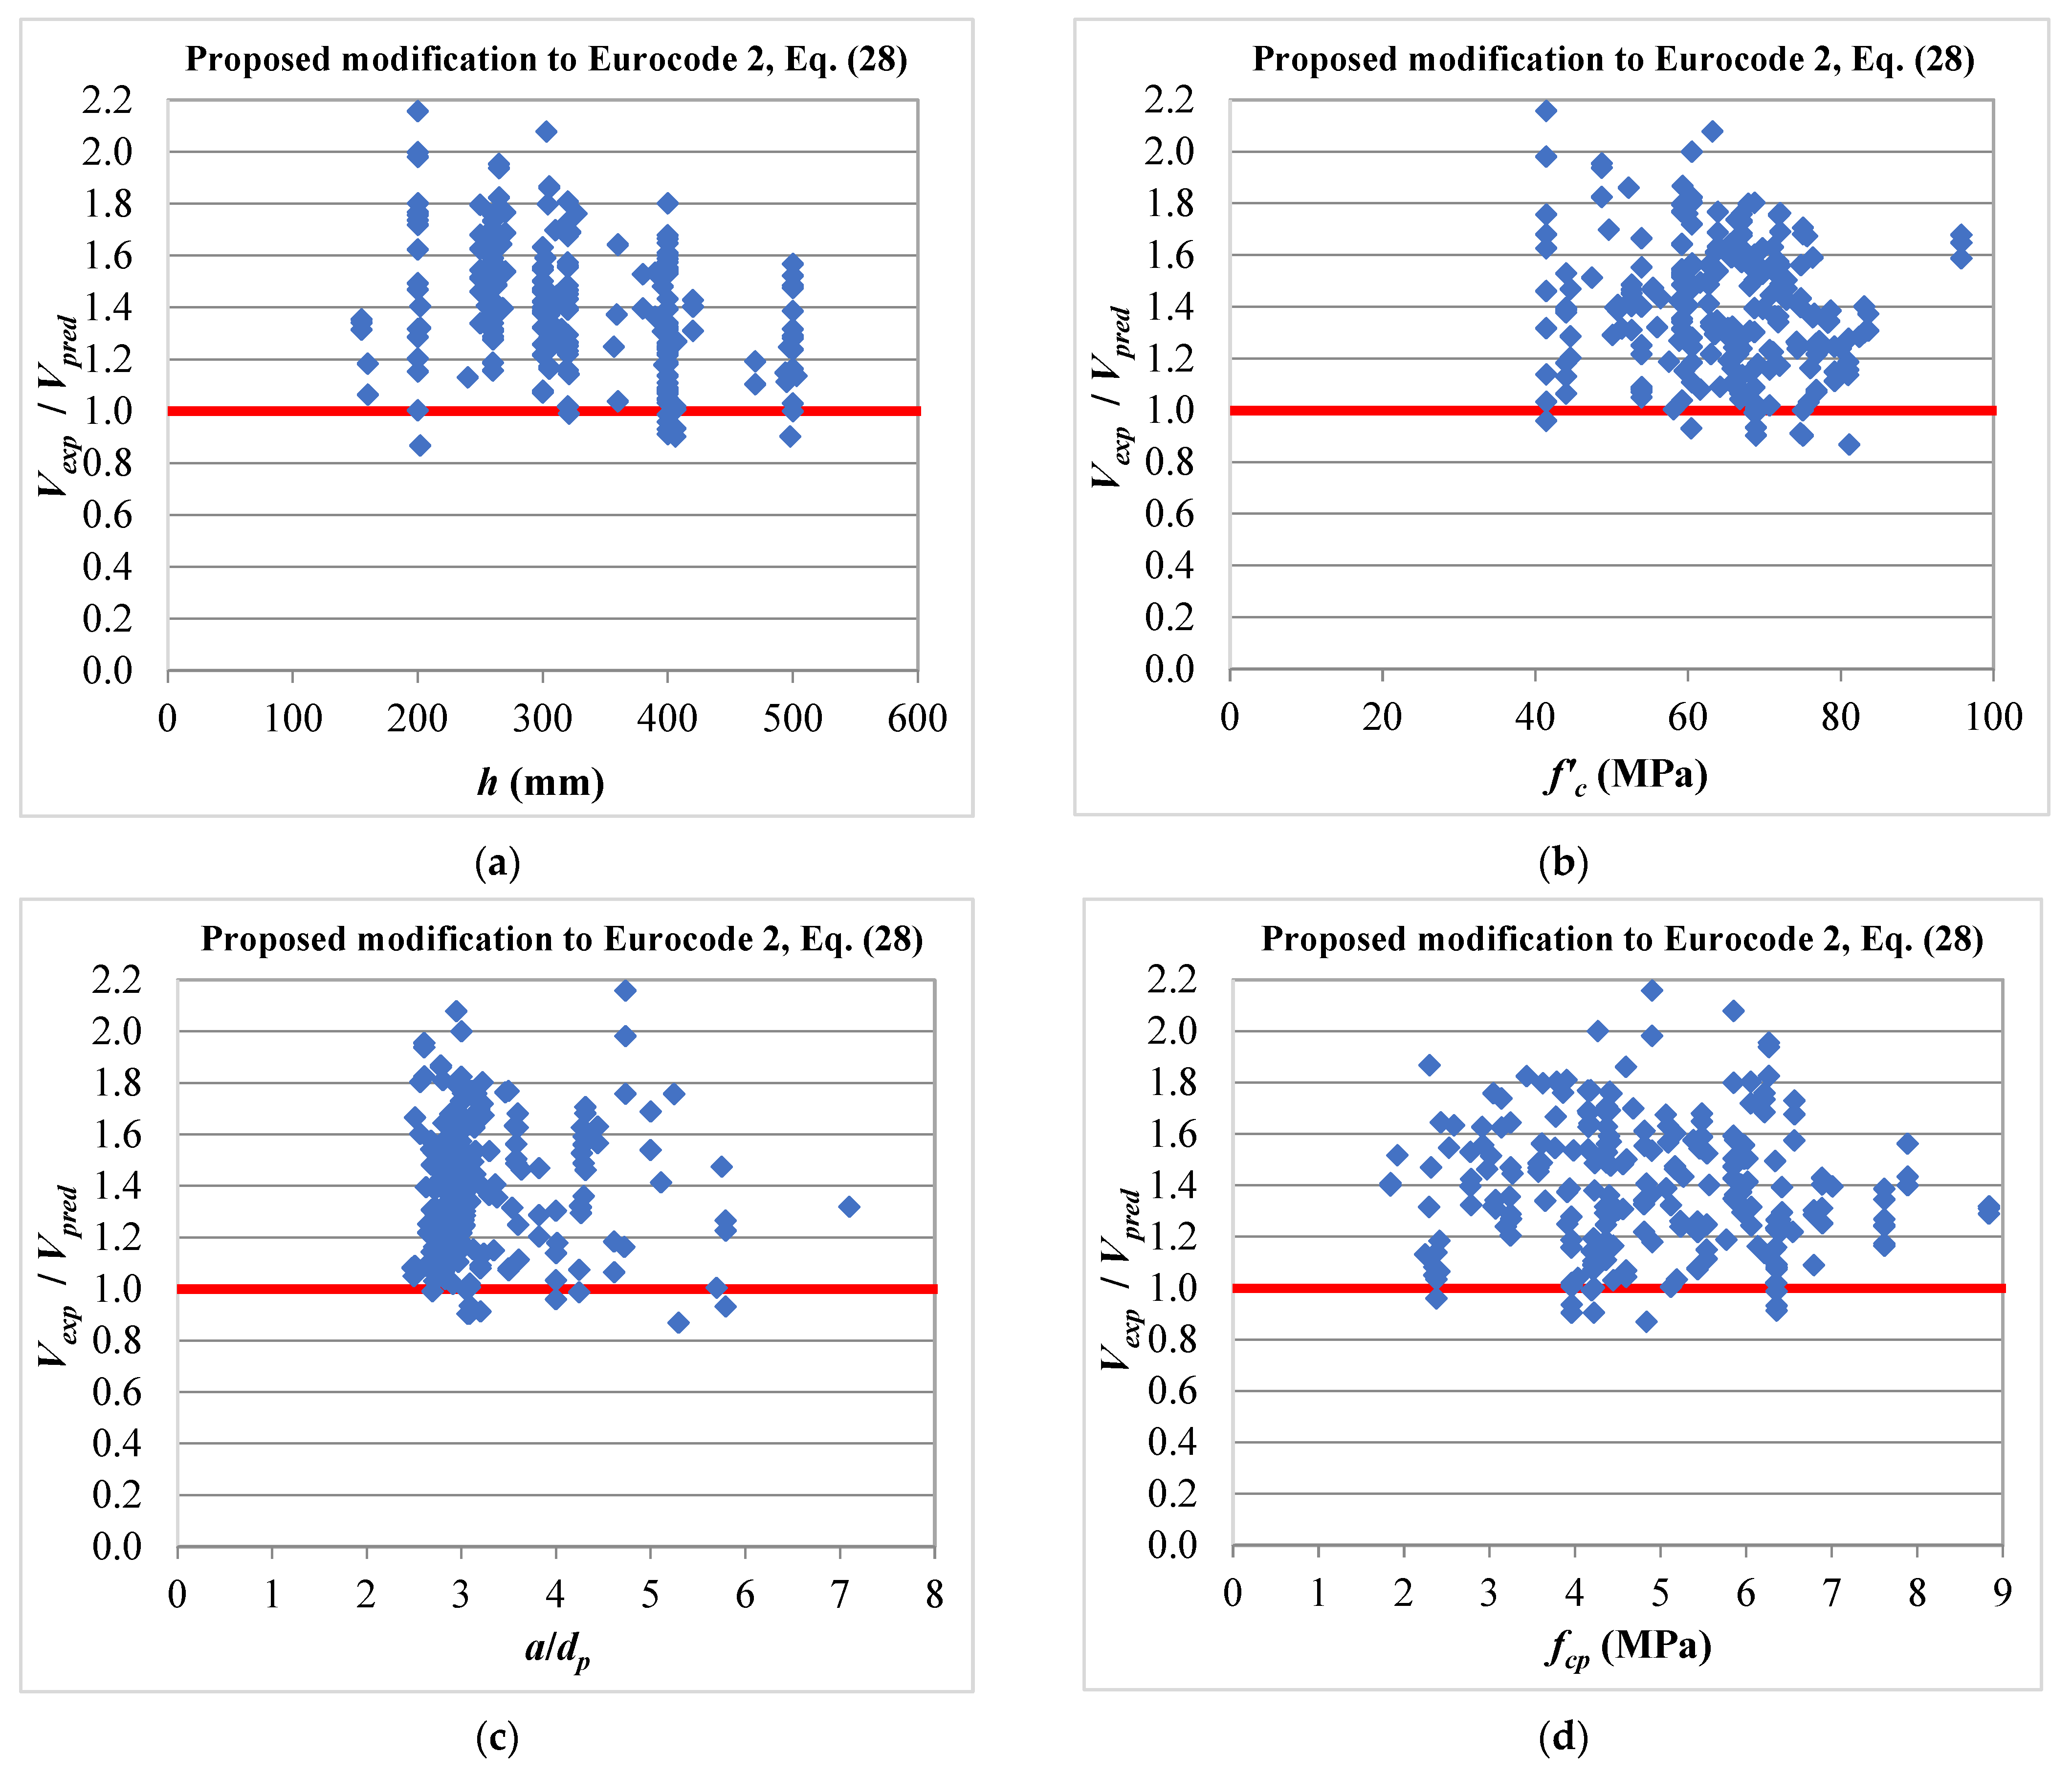
6.2. Proposed Modifications to Eurocode 2
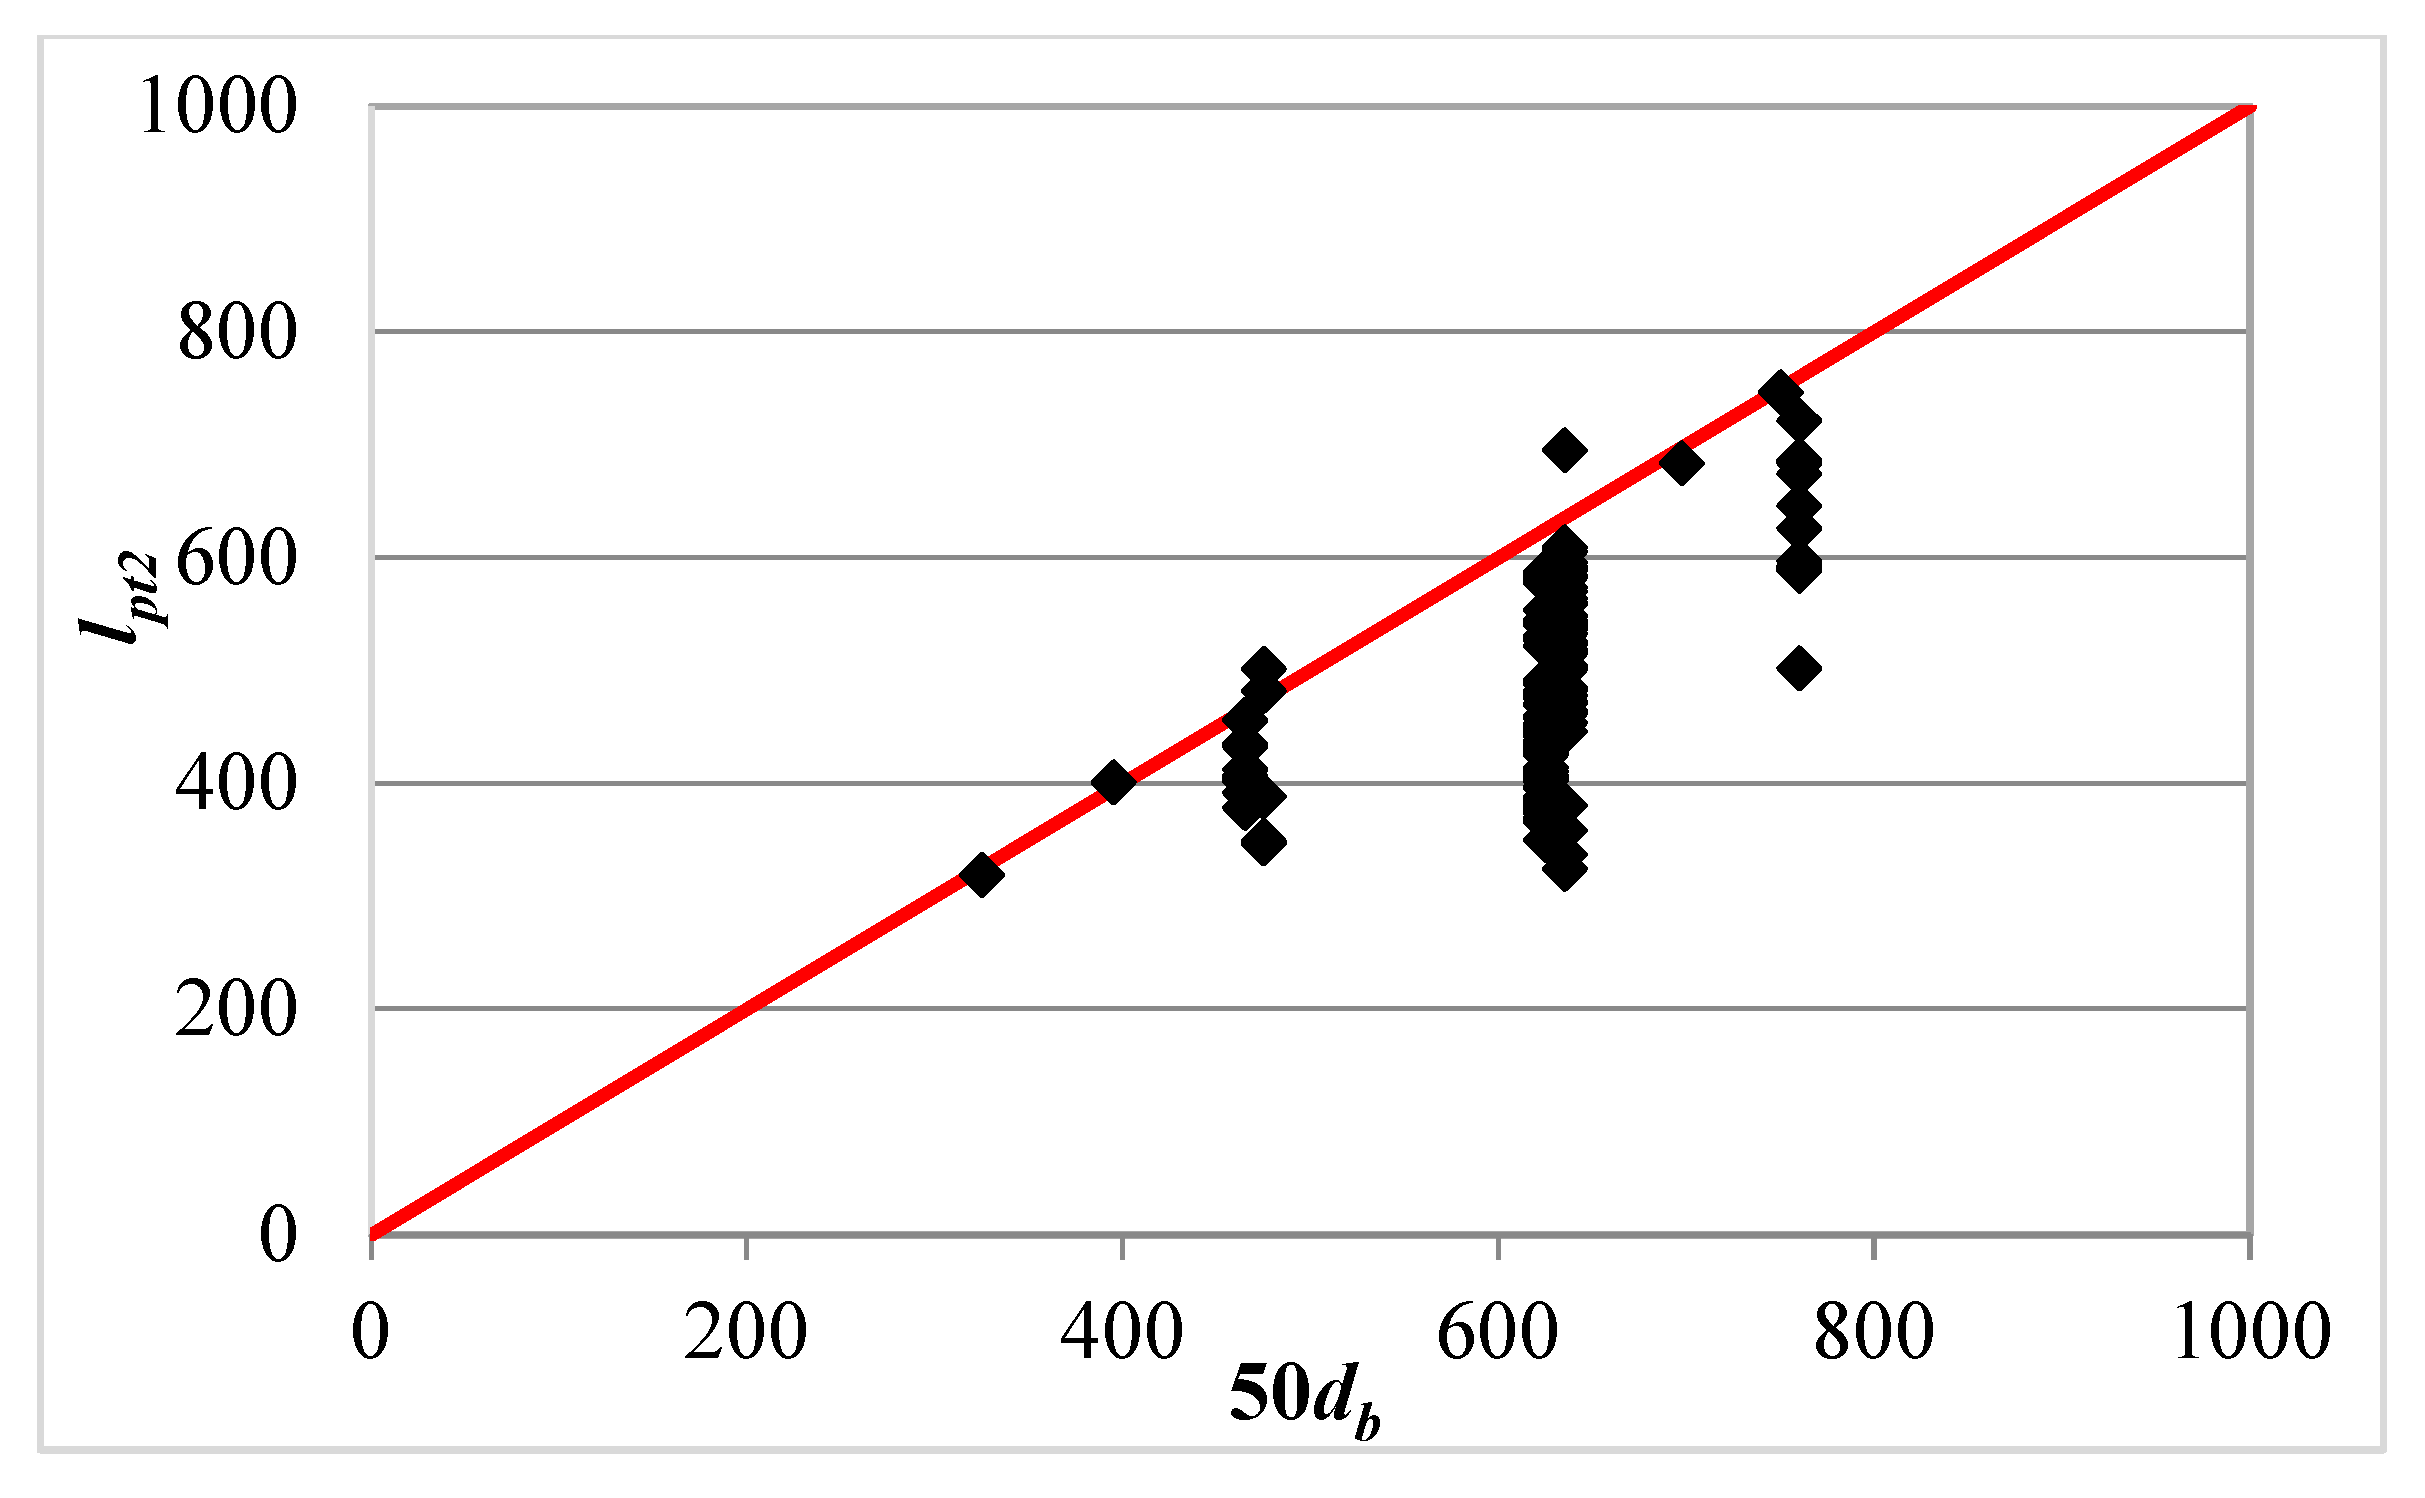
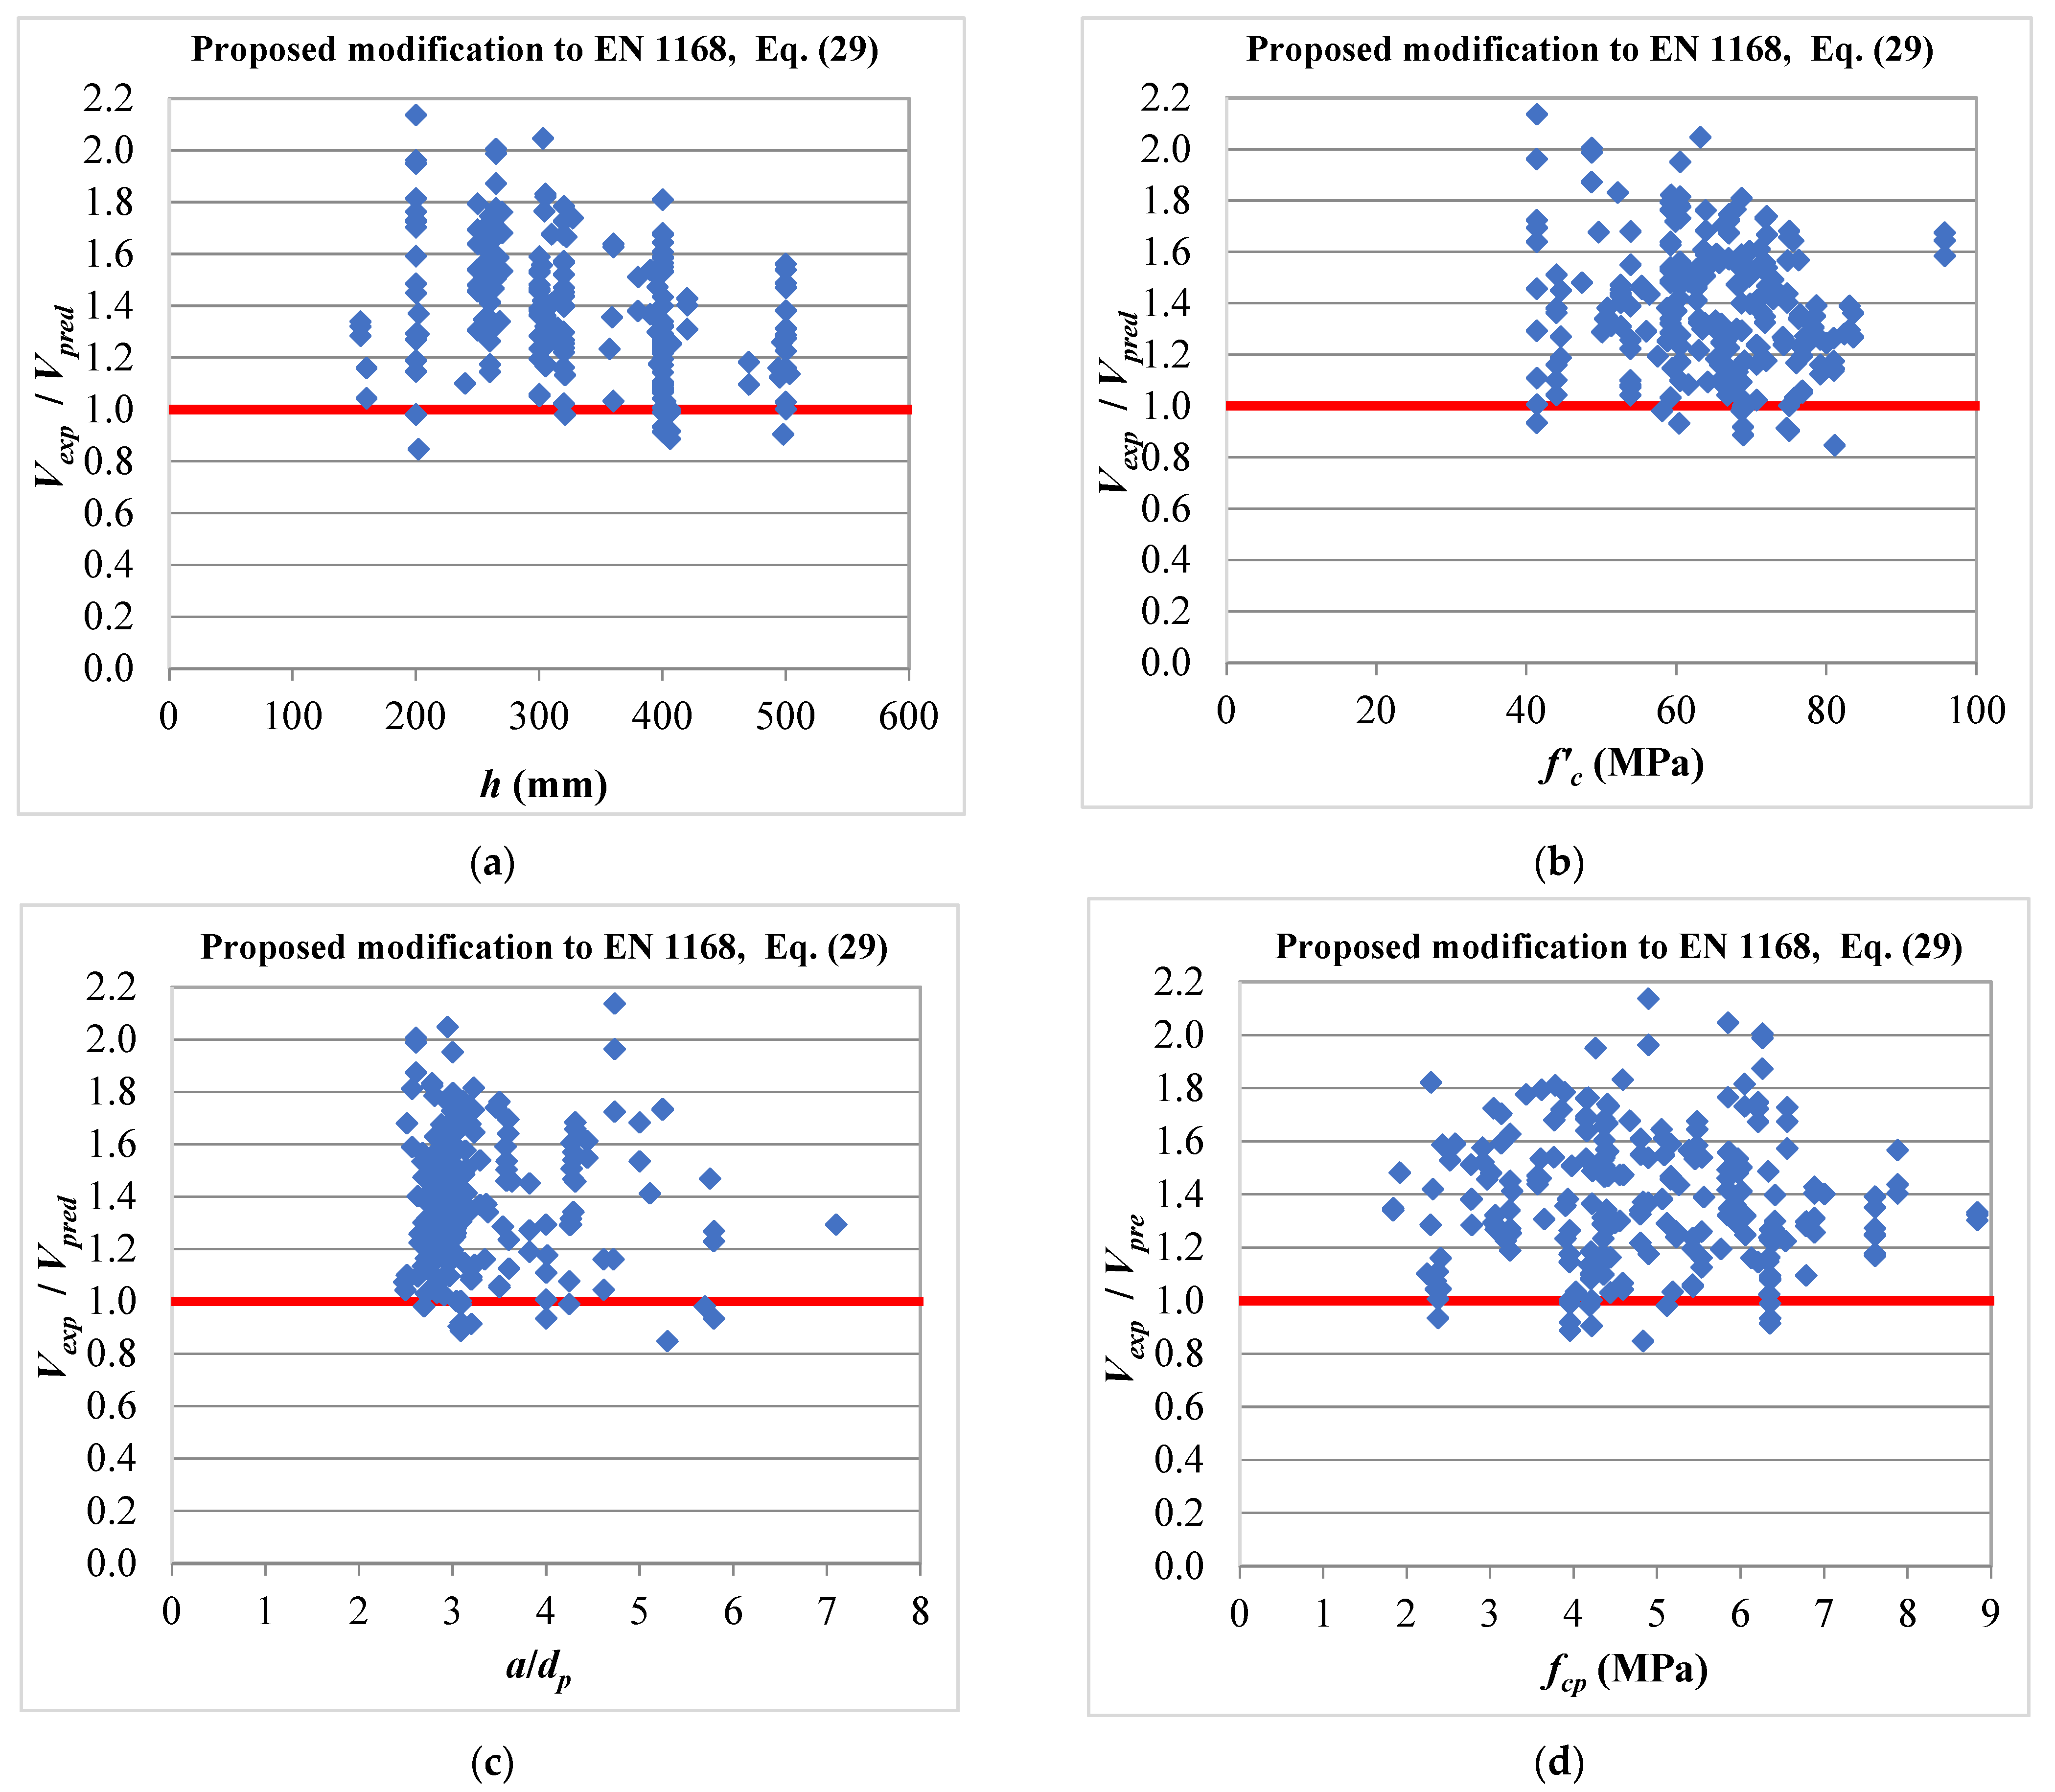
6.3. Proposed Modifications to EN 1168
7. Conclusions
- -
- Both the simplified method of the AASHTO and the ACI 318-19 method produced very conservative predictions for the web shear resistance of prestressed HCS. In contrast, the Eurocode 2 method produced unconservative predictions for 56% of the slabs in the database. On the other hand, the ACI 318-05 method showed unconservative predictions for HCS of deeper sections. Reasonable predictions were obtained by the simplified method of the EN 1168 standard, whereas better predictions were obtained by the CSA-A23.3 method.
- -
- Proposed modifications to the design equations of the ACI 318, Eurocode 2, and EN 1168 were presented. Furthermore, the proposed modified equations were verified against the HCS in the database and more reliable predictions were obtained.
Author Contributions
Funding
Data Availability Statement
Acknowledgments
Conflicts of Interest
References
- ASSAP. The Hollow Core Floor Design and Applications; Association of Manufacturers of Prestressed Hollow Core Floors: Verona, Italy, 2002. [Google Scholar]
- Buettner, D.R.; Becker, R.J. PCI Manual for the Design of Hollow Core Slabs, 2nd ed.; Precast/Prestressed Concrete Institute: Chicago, IL, USA, 1998. [Google Scholar]
- Anderson, A.R. Shear Strength of Hollow Core Members; Technical Bulletin 78-B1; Concrete Technology Association: Tacoma, WA, USA, 1978. [Google Scholar]
- Walraven, J.C.; Mercx, W.P. The bearing capacity of prestressed hollow core slabs. Heron 1983, 28, 1–46. [Google Scholar]
- Becker, R.J.; Buettner, D.R. Shear tests of extruded hollow core slabs. PCI J. 1985, 30, 40–54. [Google Scholar] [CrossRef]
- Pisanty, A. The shear strength of extruded hollow-core slabs. Mater. Struct. 1992, 25, 224–230. [Google Scholar] [CrossRef]
- Yang, L. Design of prestressed hollow core slabs with reference to web shear failure. J. Struct. Eng. 1994, 120, 2675–2696. [Google Scholar] [CrossRef]
- Pajari, M. Resistance of Prestressed Hollow Core Slabs against Web Shear Failure; Research Notes 1292; VTT Building and Transport: Espoo, Finland, 2005. [Google Scholar]
- Hawkins, N.M.; Ghosh, S.K. Shear strength of hollow-core slabs. PCI J. 2006, 51, 110–114. [Google Scholar]
- ACI Committee 318. Building Code Requirements for Structural Concrete (ACI 318-05) and Commentary (ACI 318R-05); American Concrete Institute: Farmington Hills, MI, USA, 2005. [Google Scholar]
- ACI Committee 318. Building Code Requirements for Structural Concrete (ACI 318-08) and Commentary (ACI 318R-08); American Concrete Institute: Farmington Hills, MI, USA, 2008. [Google Scholar]
- Palmer, K.D.; Schultz, A.E. Factors affecting web-shear capacity of deep hollow-core units. PCI J. 2010, 55, 123–146. [Google Scholar] [CrossRef]
- Palmer, K.D.; Schultz, A.E. Experimental investigation of the web-shear strength of deep hollow-core units. PCI J. 2011, 56, 83–104. [Google Scholar] [CrossRef]
- Wijesundara, K.K.; Bolognini, D.; Nascimbene, R. Shear strength of precast prestressed concrete hollow core slabs. In Proceedings of the ICSBE-2010, Yogyakarta, Indonesia, 27–29 May 2010. [Google Scholar]
- Brunesi, E.; Nascimbene, R. Numerical web-shear strength assessment of precast hollow core slab units. Eng. Struct. 2015, 102, 13–30. [Google Scholar] [CrossRef]
- Brunesi, E.; Bolognini, D.; Nascimbene, R. Evaluation of the shear capacity of precast-prestressed hollow core slabs: Numerical and experimental comparisons. Mater. Struct. 2015, 48, 1503–1521. [Google Scholar] [CrossRef]
- Tawadrous, R.; Morcous, G. Shear strength of deep hollow-core slabs. ACI Struct. J. 2018, 115, 699–709. [Google Scholar] [CrossRef]
- El-Sayed, A.K.; Al-Negheimish, A.I.; Alhozaimy, A.M. Web shear resistance of prestressed precast deep hollow-core slabs. ACI Struct. J. 2019, 116, 139–150. [Google Scholar]
- ACI Committee 318. Building Code Requirements for Structural Concrete (ACI 318-19) and Commentary (ACI 318R-19); American Concrete Institute: Farmington Hills, MI, USA, 2019. [Google Scholar]
- EN 1992-1-1; Eurocode 2: Design of Concrete Structures, Part 1: General Rules and Rules for Buildings. European Committee for Standardization: Brussels, Belgium, 2004.
- EN 1168; Precast Concrete Products–Hollow Core Slabs. European Committee for Standardization: Brussels, Belgium, 2011.
- CAN/CSA-A23.3-14; Design of Concrete Structures. Canadian Standards Association: Mississauga, ON, Canada, 2014.
- AASHTO. AASHTO LRFD Bridge Design Specifications, 3rd ed.; AASHTO: Washington, DC, USA, 2004. [Google Scholar]
- Fédération International du Béton (fib). Fib Model Code for Concrete Structures 2010; Bulletin 56, V. 2; Fédération International du Béton: Lausanne, Switzerland, 2010. [Google Scholar]
- Bentz, E.C.; Collins, M.P. Development of the 2004 Canadian Standards Association (CSA) A23.3 shear provisions for reinforced concrete. Can. J. Civ. Eng. 2006, 33, 521–534. [Google Scholar] [CrossRef]
- Bentz, E.C.; Vecchio, F.J.; Collins, M.P. Simplified modified compression field theory for calculating shear strength of reinforced concrete elements. ACI Struct. J. 2006, 103, 614–624. [Google Scholar]
- Kuchma, D.A.; Hawkins, N.M.; Kim, S.H.; Sun, S.; Kim, K.S. Simplified shear provisions of the AASHTO LRFD bridge design specifications. PCI J. 2008, 53, 53–73. [Google Scholar] [CrossRef]
- Sarkis, A.I.; Buker, F.; Sullivan, T.J.; Elwood, K.J.; Brunesi, E.; Hogan, L. Aspects affecting the nonlinear behavior of precast prestressed hollow-core units failing in shear. Struct. Concr. 2022, 23, 3021–3038. [Google Scholar] [CrossRef]
- Asperheim, S.A.; Dymond, B.Z. Factors affecting web-shear capacity of hollow-core slabs with filled cores. PCI J. 2021, 66, 43–65. [Google Scholar] [CrossRef]
- Joo, H.E.; Han, S.J.; Park, M.K.; Kim, K.S. Shear tests of deep hollow core slabs strengthened by core-filling. Appl. Sci. 2020, 10, 1709. [Google Scholar] [CrossRef] [Green Version]
- Lee, Y.J.; Kim, H.G.; Kim, M.J.; Kim, D.H.; Kim, K.H. Shear performance for presressed concrete hollow core slabs. Appl. Sci. 2020, 10, 1636. [Google Scholar] [CrossRef] [Green Version]
- Nguyen, H.T.N.; Tan, K.H.; Kanda, T. Effect of polypropylene and steel fibers on web-shear resistance of deep concrete hollow-core slabs. Eng. Struct. 2020, 210, 110273. [Google Scholar] [CrossRef]
- Meng, X.; Cheng, S.; El Ragaby, A. Shear strengthening of prestressed concrete hollow-core slabs using externally bonded carbon-fiber-reinforced polymer sheets. PCI J. 2019, 64, 77–94. [Google Scholar] [CrossRef]
- Truderung, K.A.; El-Ragaby, A.; Mady, M.; El-Salakawy, E. Shear capacity of dry-cast extruded precast, prestressed concrete hollow-core slabs. PCI J. 2019, 64, 71–83. [Google Scholar] [CrossRef]
- Park, M.K.; Lee, D.H.; Han, S.J.; Kim, K.S. Web-shear capacity of thick precast prestressed hollow-core slab units produced by extrusion method. Int. J. Concr. Struct. Mater. 2019, 13, 7. [Google Scholar] [CrossRef]
- Dudnik, V.S.; Milliman, L.R.; Parra-Montesinos, G.J. Shear behavior of prestressed steel-fiber-reinforced concrete hollow-core slabs. PCI J. 2017, 62, 58–72. [Google Scholar] [CrossRef]
- TNO Building and Constructions Research. TNO Report. Standard Shear Tests on Prestressed Hollow Core Slabs according to EN 1168; TNO: The Hague, The Netherlands, 2005. [Google Scholar]
- Instituto di Ricerche e Coollaudi, M. Masini. Rapporto di Prova no. 5386, July 1995, Rapporto di Prova 1471-2005; Instituto di Ricerche e Coollaudi M. Masini: Milan, Italy, 2005. [Google Scholar]
- Dipartimento di Ingegneria delle Strutture delle Acque e del Terreno, Universi degli Studi di L’Aquila. Prove di Carico Static su Solai Lveolari Spiroll; Report of Generale Prefabbricati, December 1998, June 2003, and December 2003; Universi degli Studi di L’Aquila: L’Aquila, Italy, 2003. [Google Scholar]
- Bertagnoli, G.; Mancini, G. Failure analysis of hollow-core slabs tested in shear. Struct. Concr. 2009, 10, 139–152. [Google Scholar] [CrossRef]


| Reference | Number of Slabs | Slab Thickness, h (mm) | Total Width of Slab, b (mm) | Web Width, bw (mm) | Concrete Compressive Strength, (MPa) | Shear Span to Depth Ratio, a/dp | Compressive Stress fpc Due to Full Effective Prestressing (MPa) |
|---|---|---|---|---|---|---|---|
| Sarkis et al. [28] | 2 | 200 | 1196 | 232 | 60.5 | 3.2 | 6.05 |
| Asperheim and Dymond [29] | 11 | 305 | 1219 | 233–495 | 72–83.6 | 3.03 | 5.94–7.61 |
| Joo et al. [30] | 2 | 400 | 1200 | 276 | 66 | 2.92 | 6.06 |
| Lee et al. [31] | 3 | 265 | 1200 | 237 | 48.7 | 2.61 | 6.26 |
| Nguyen et al. [32] | 2 | 400 | 1200 | 275 | 66.8 | 2.82 | 4.59 |
| Meng et al. [33] | 2 | 305 | 1216 | 228 | 52.2–59.3 | 2.78 | 2.3–4.59 |
| Truderung et al. [34] | 5 | 305 | 1216 | 229–252 | 63.2–83.6 | 2.93 | 3.07–5.85 |
| Park et al. [35] | 8 | 200–500 | 1200 | 242–300 | 60.5 | 2.8–3.0 | 3.43–4.41 |
| El-Sayed et al. [18] | 23 | 200–500 | 900–1200 | 245–363 | 50.1–78.3 | 2.78–3.1 | 2.78–6.41 |
| Tawadrous and Morcous [17] | 5 | 406 | 1200 | 353 | 68.9 | 3.09 | 3.96 |
| Dudnik et al. [36] | 4 | 300 | 1216 | 330 | 76.8 | 3.0–3.5 | 5.43 |
| Palmer and Schultz [13] | 19 | 300–500 | 1200 | 302–439 | 53.9–68.7 | 2.5–4.0 | 2.35–6.89 |
| Hawkins and Ghosh [9] | 11 | 400 | 1200 | 292–404 | 41.4–74.7 | 3.2–5.79 | 2.38–6.35 |
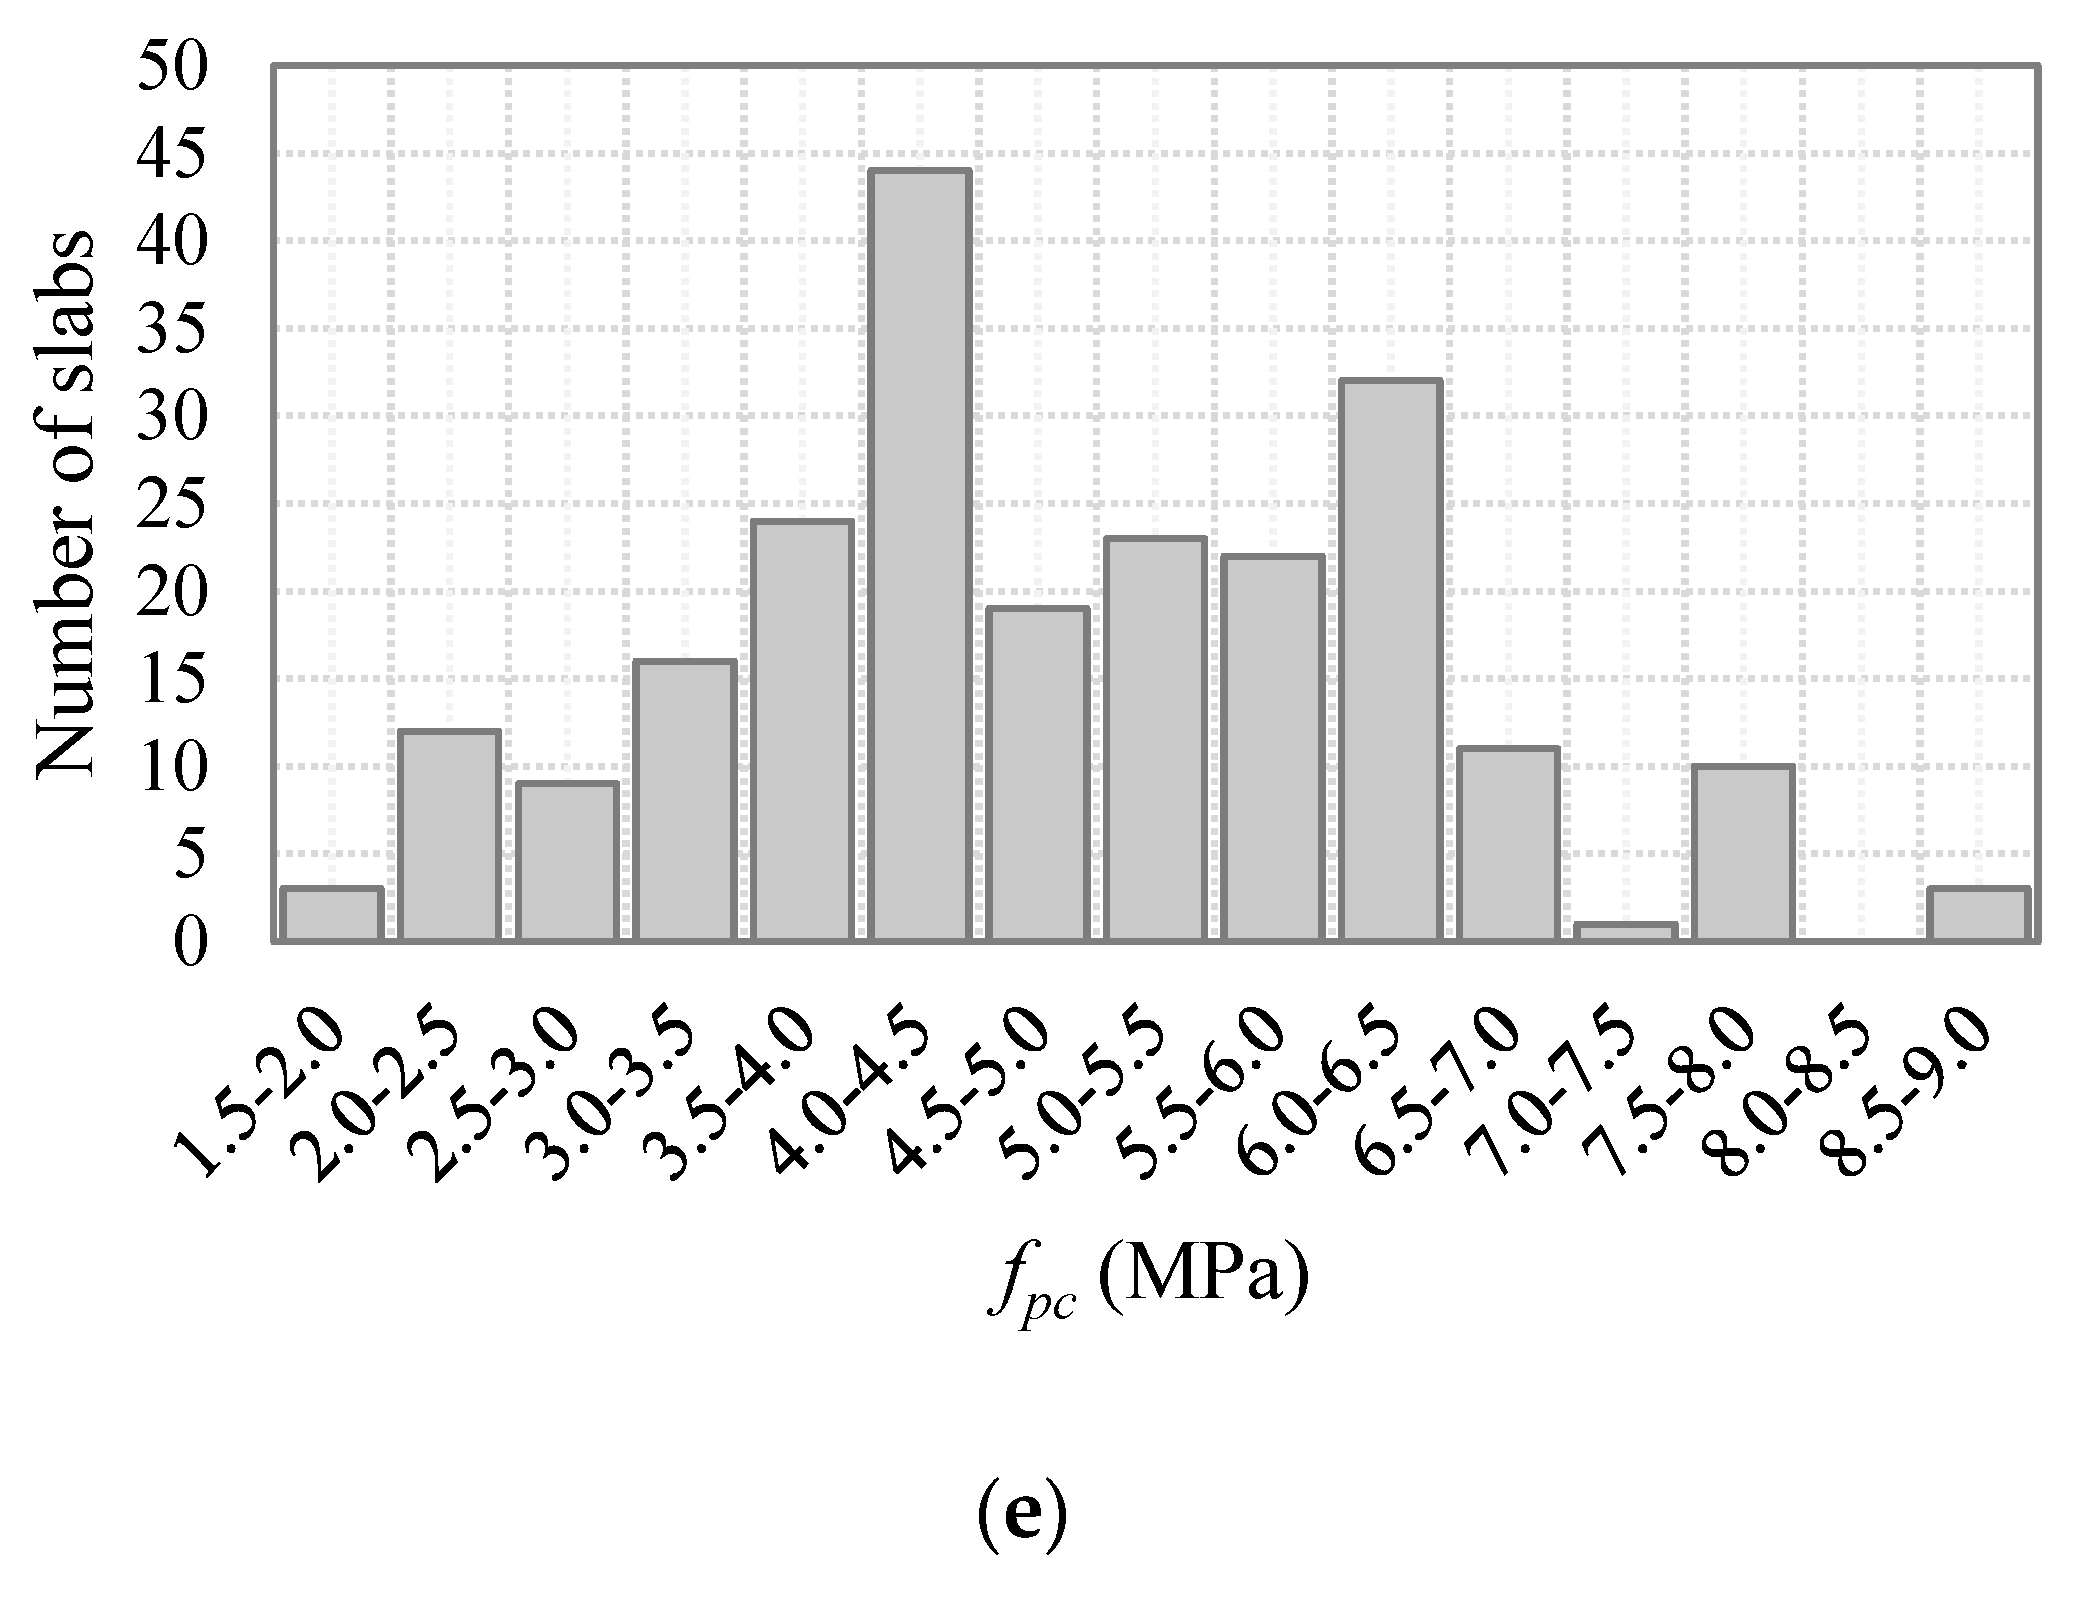
| Pajari [8] | 49 | 200–503 | 1145–1177 | 215–327 | 49.6–81.1 | 2.69–5.24 | 1.84–6.13 |
| TNO [37] | 39 | 260–400 | 1200 | 241–449 | 52.6–95.8 | 2.86–3.16 | 3.57–8.83 |
| Masini [38] | 13 | 160–420 | 1200 | 335–444 | 44–52.6 | 2.75–4.62 | 2.24–6.88 |
| University of L’Aquila [39] | 14 | 155–500 | 1200 | 215–414 | 59.2 | 2.7–3.54 | 1.92–4.36 |
| Becker and Buettner [5] | 7 | 200–250 | 1016 | 330–432 | 41.4 | 3.6–7.1 | 3.04–4.9 |
| Walraven and Mercx [4] | 10 | 260–300 | 1197 | 250–294 | 55.4–63.9 | 3.5–5.11 | 2.58–6.01 |
| Total | 229 | 155–503 | 900–1219 | 215–495 | 41.4–95.8 | 2.5–7.1 | 1.84–8.83 |
| Equation | Experimental-to-Predicted Ratio, Vexp/Vpred | ||||
|---|---|---|---|---|---|
| Average | COV | Minimum | Maximum | Percentage of Unconservative Predictions | |
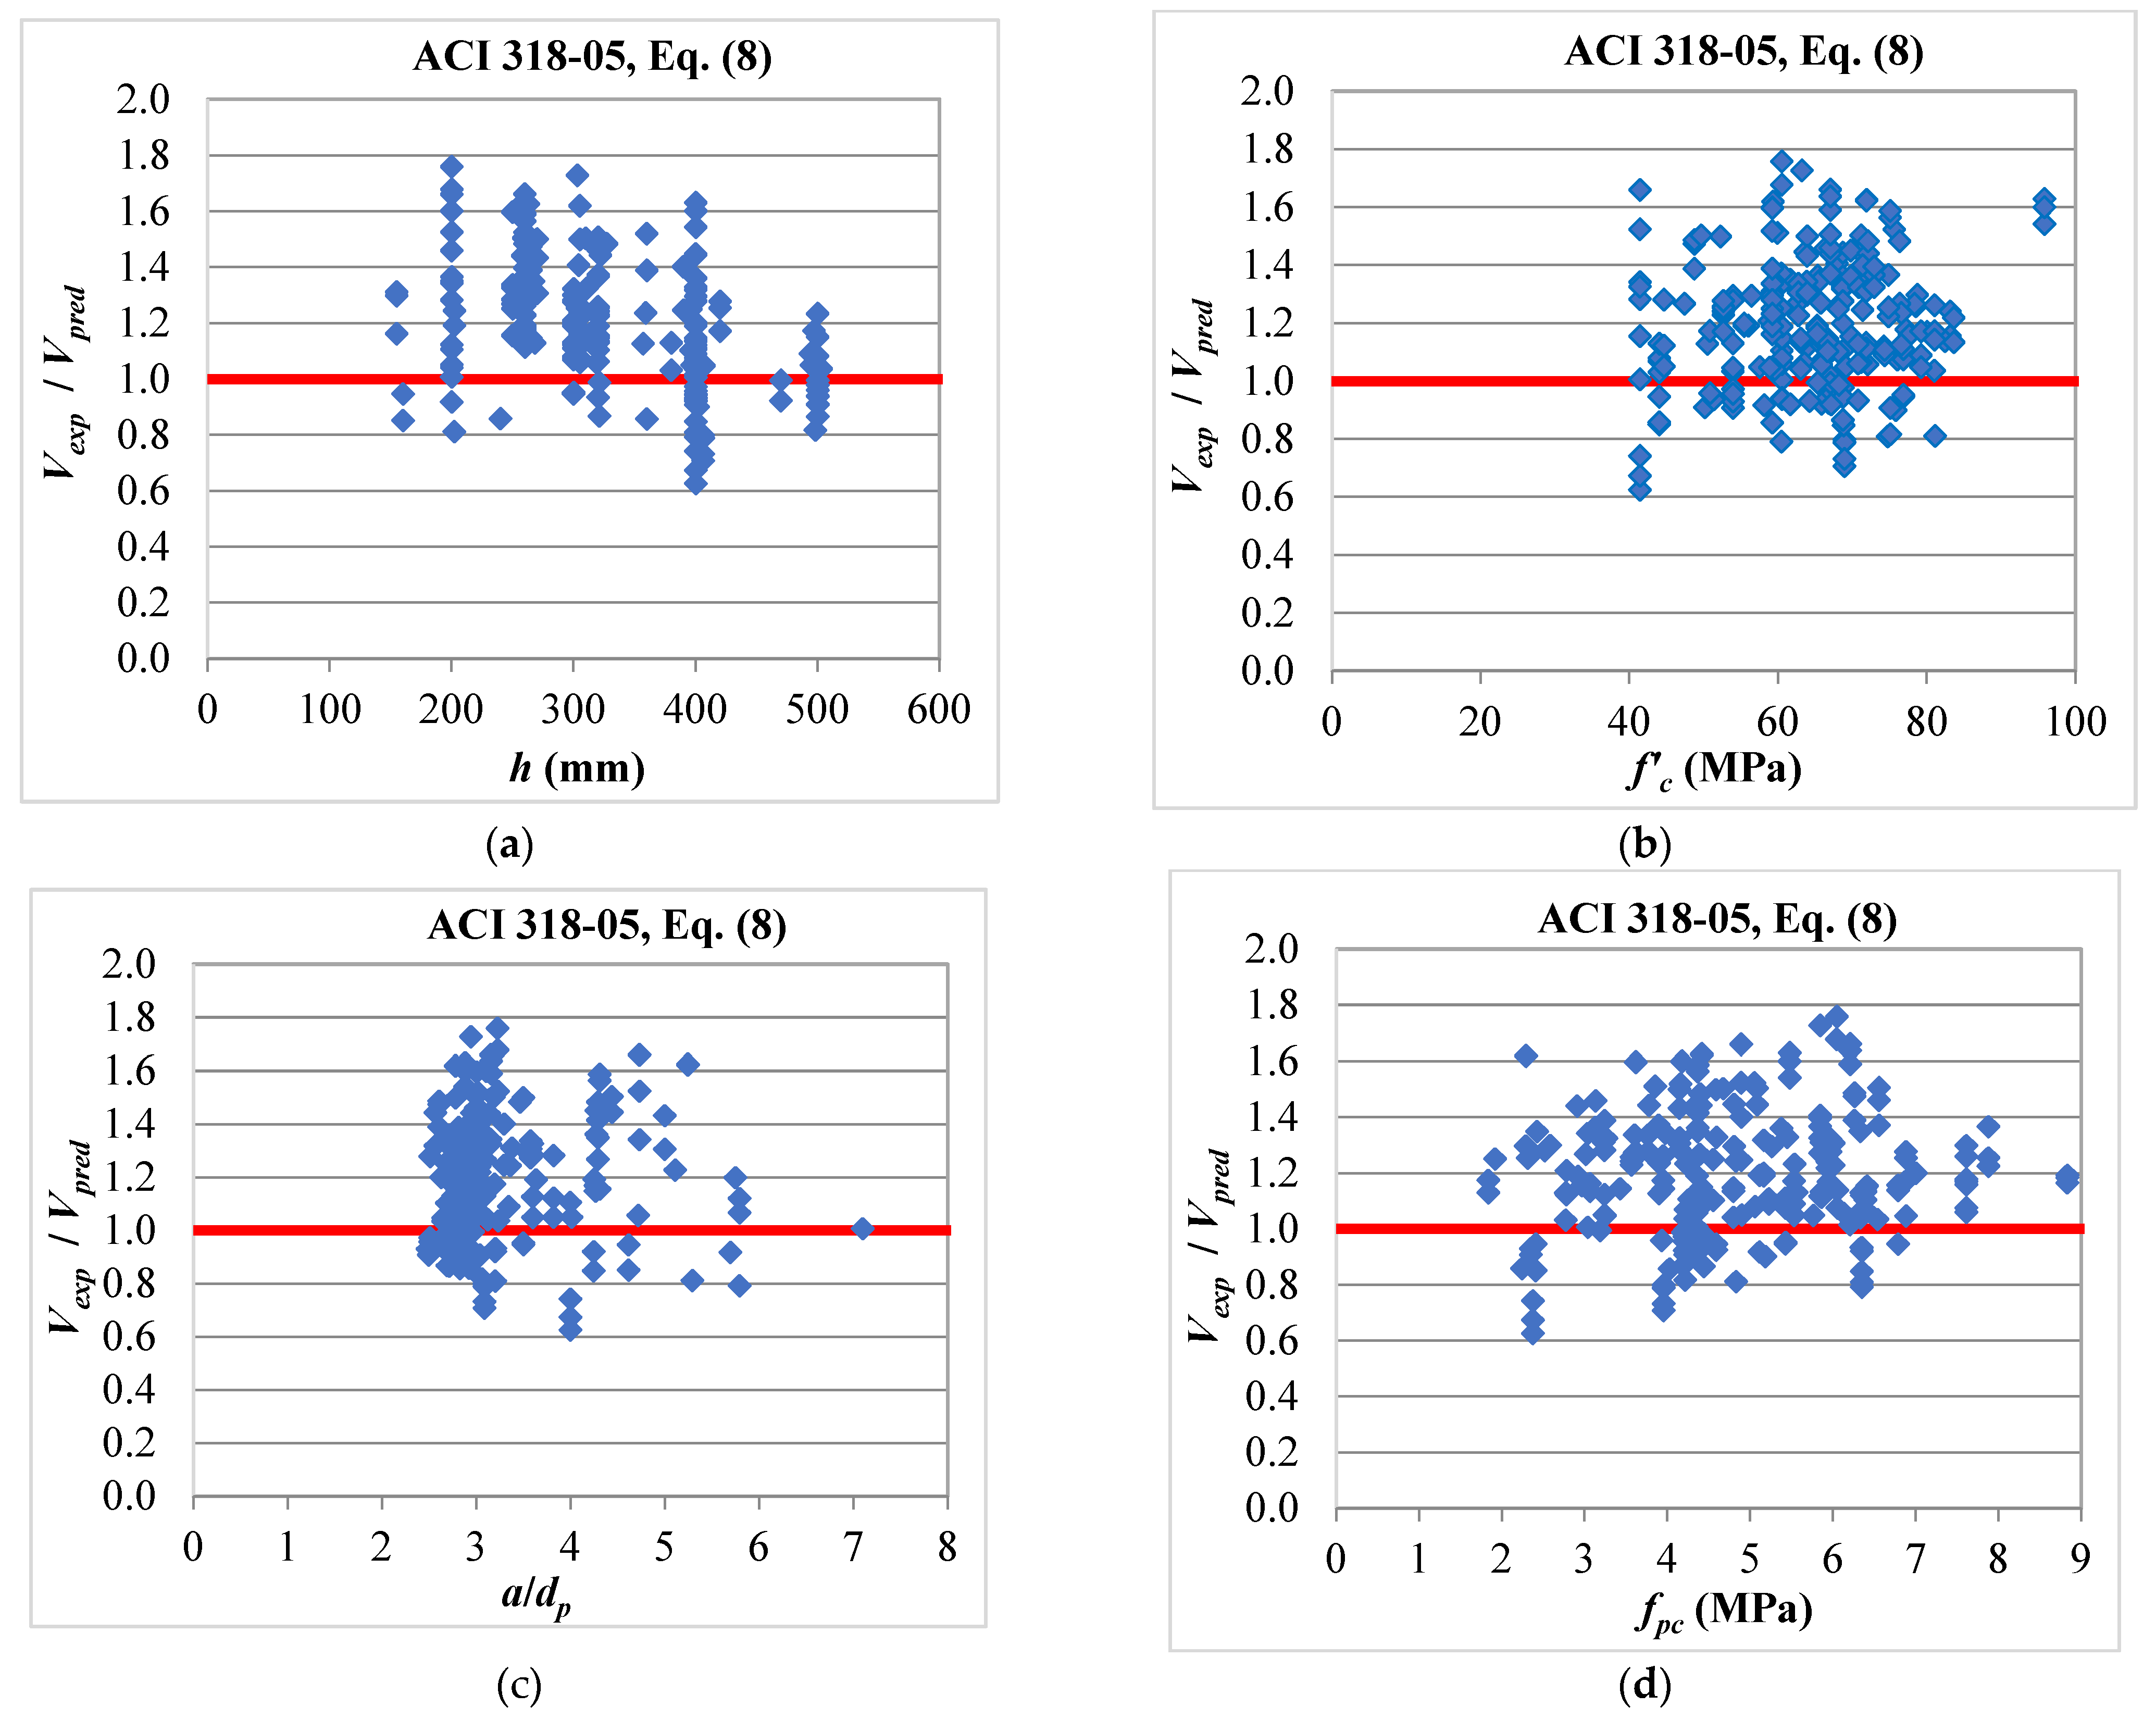
| ACI 318-05 [10], Equation (8) | 1.20 | 18% | 0.63 | 1.76 | 20% |
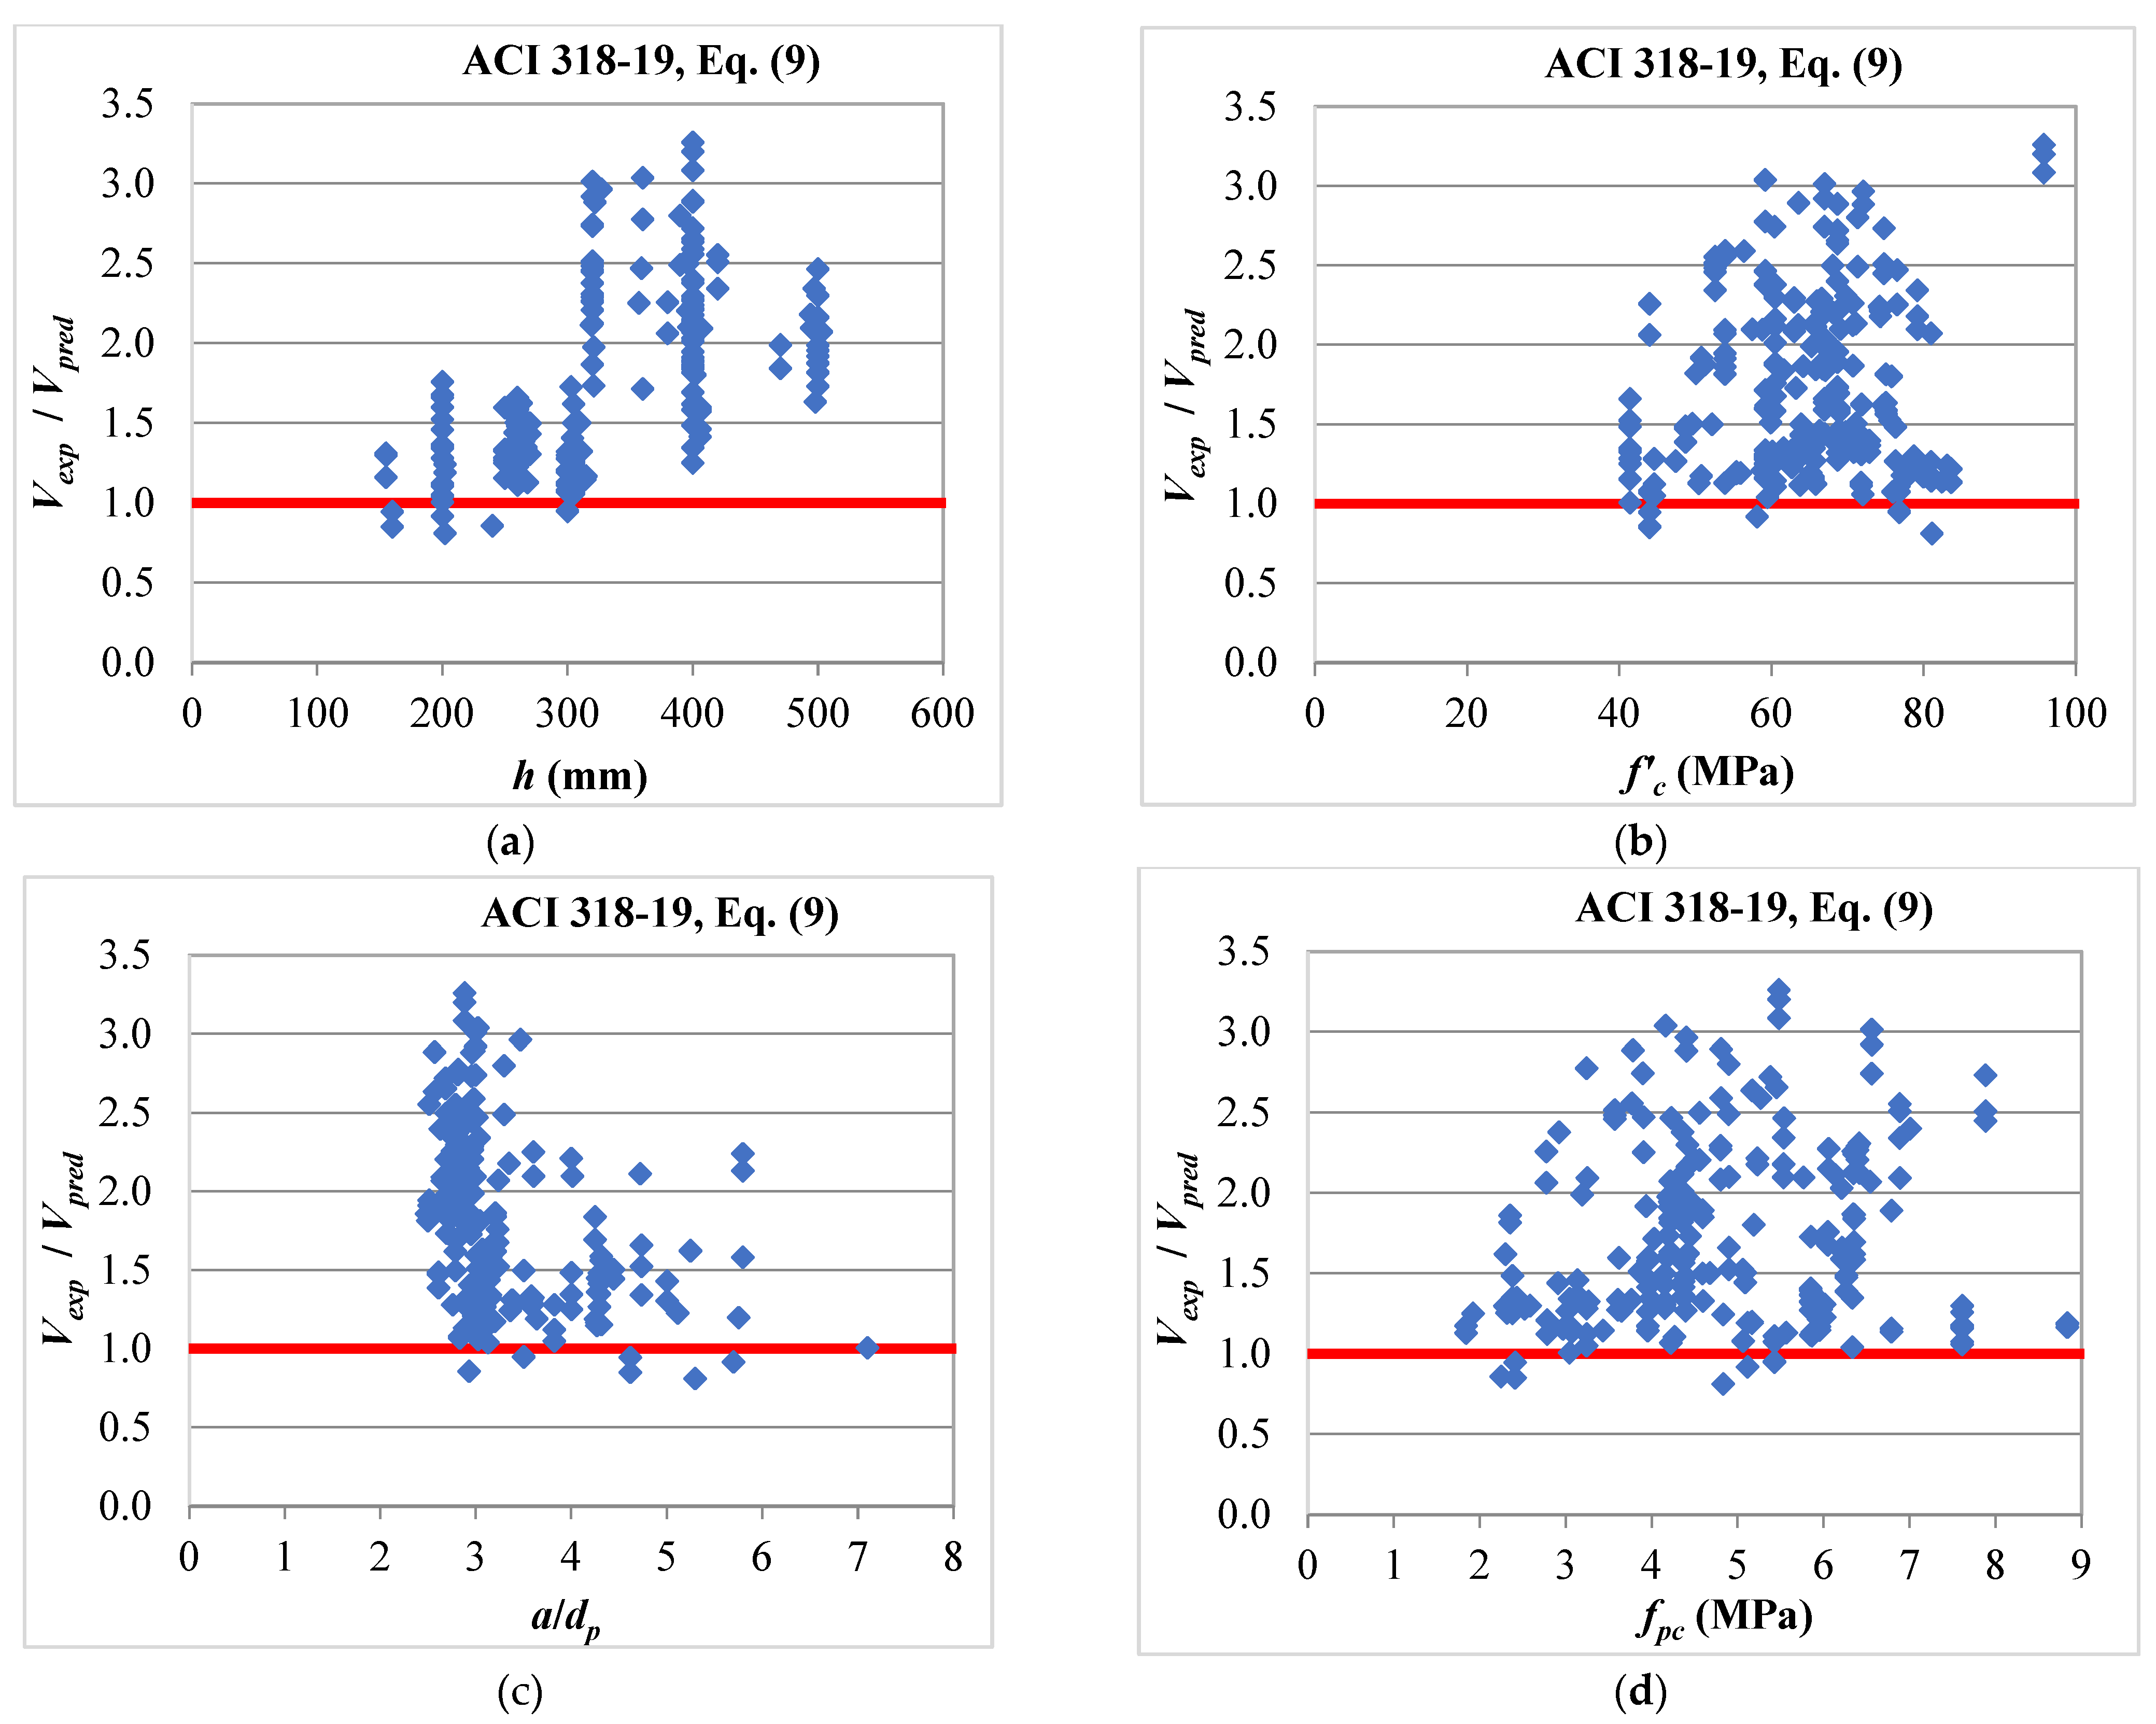
| ACI 318-19 [19], Equation (9) | 1.73 | 33% | 0.81 | 3.26 | 3% |
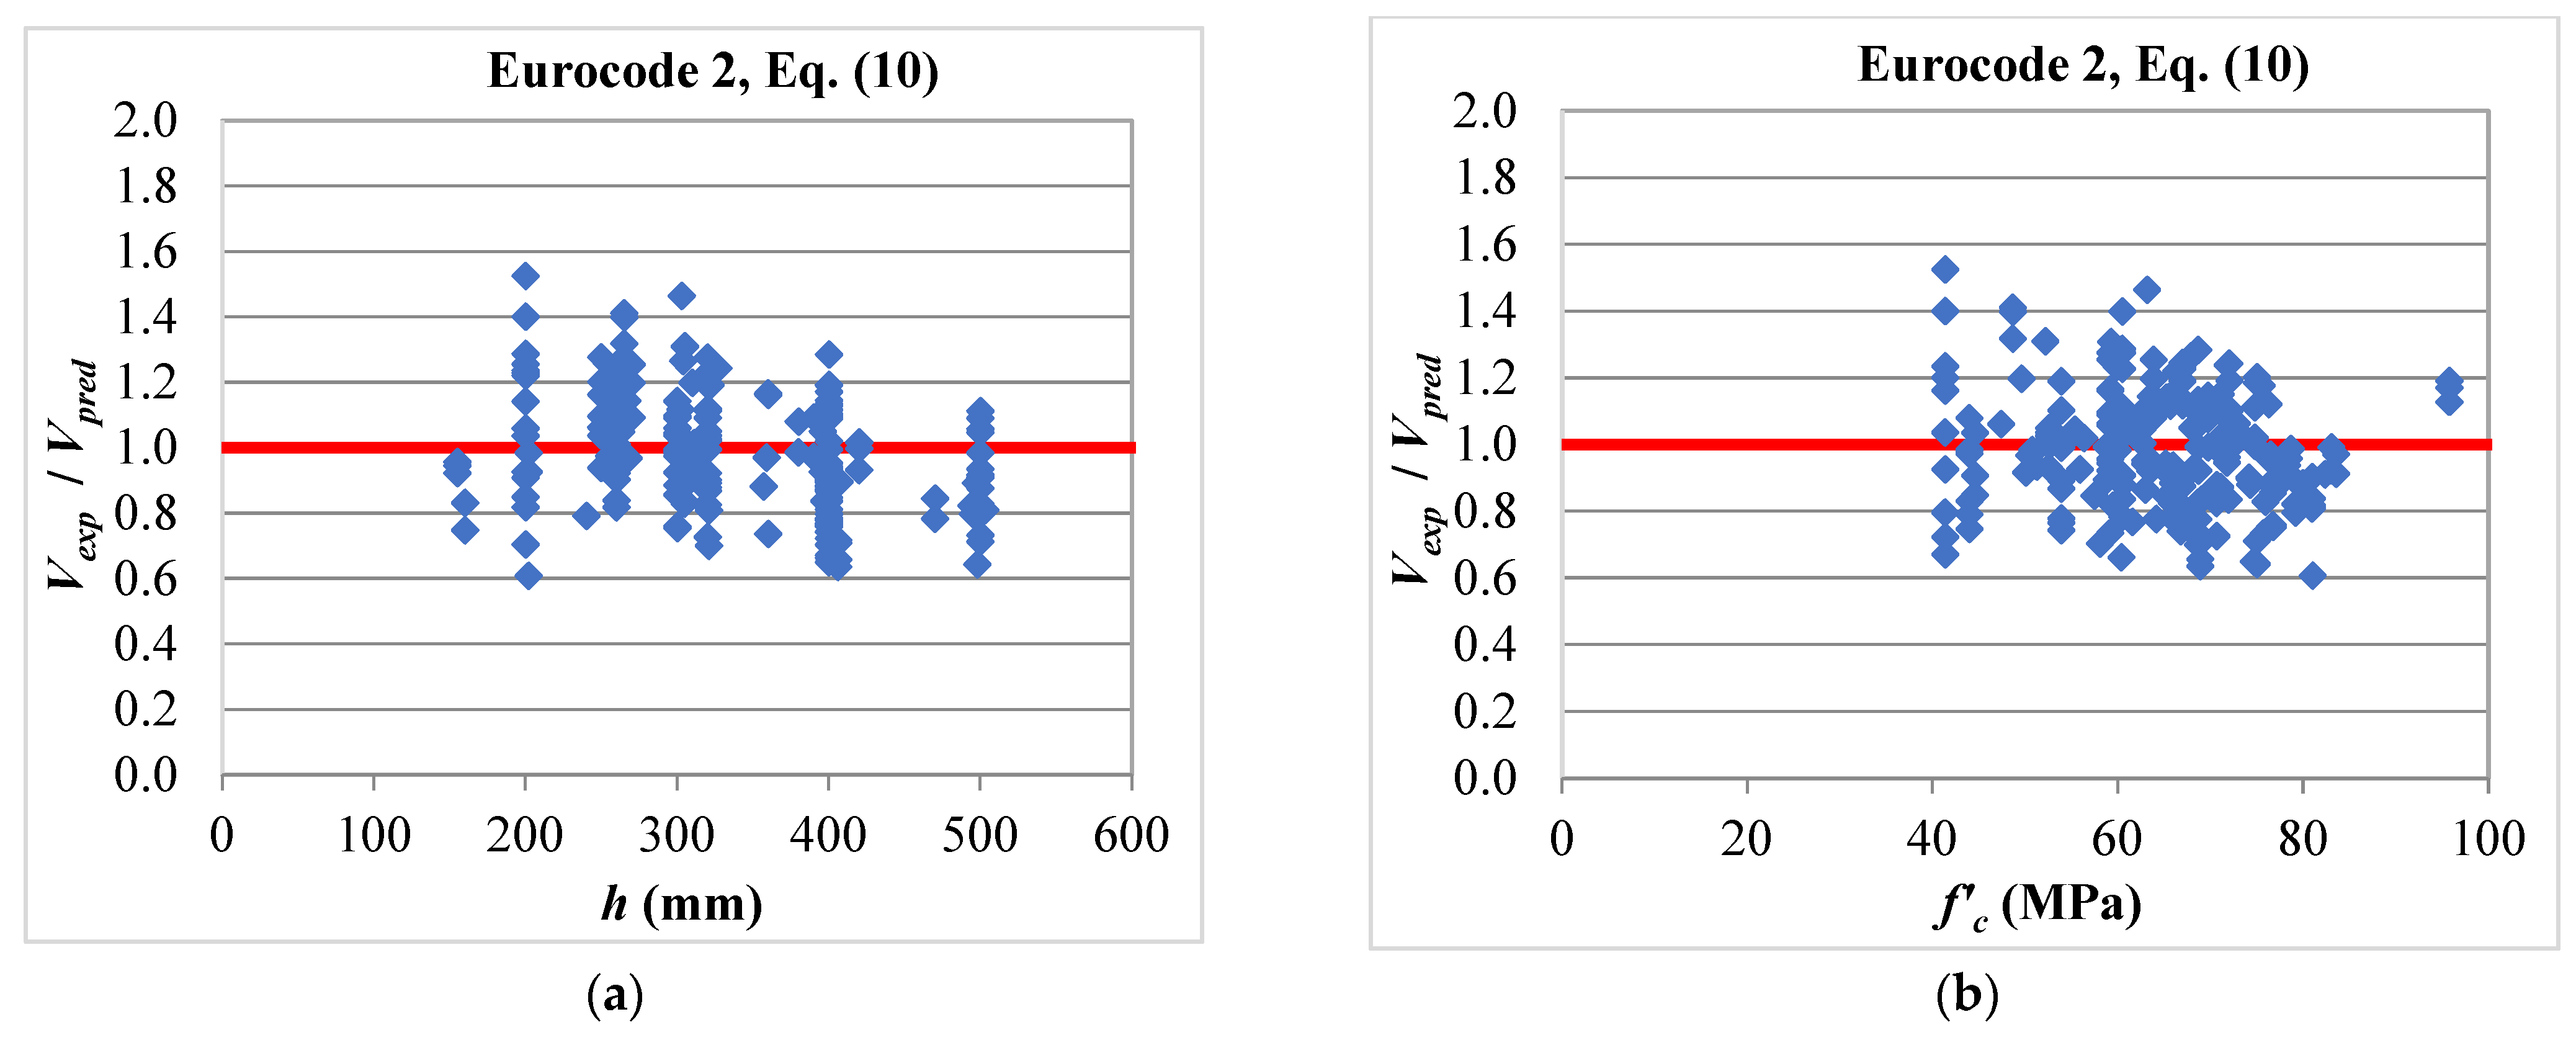
| Eurocode 2 [20], Equation (10) | 0.99 | 18% | 0.61 | 1.52 | 56% |
| EN 1168 [21], Equation (16) | 1.26 | 17% | 0.77 | 1.95 | 14% |
| CSA-A23.3 [22], Equation (20) | 1.27 | 18% | 0.81 | 1.88 | 8% |
| AASHTO [23], Equation (24) | 1.96 | 19% | 1.05 | 2.88 | 0 |
| Design Method | Equation | Experimental-to-Predicted Ratio, Vexp/Vpred | ||||
|---|---|---|---|---|---|---|
| Average | COV | Minimum | Maximum | Percentage of Unconservative Predictions | ||
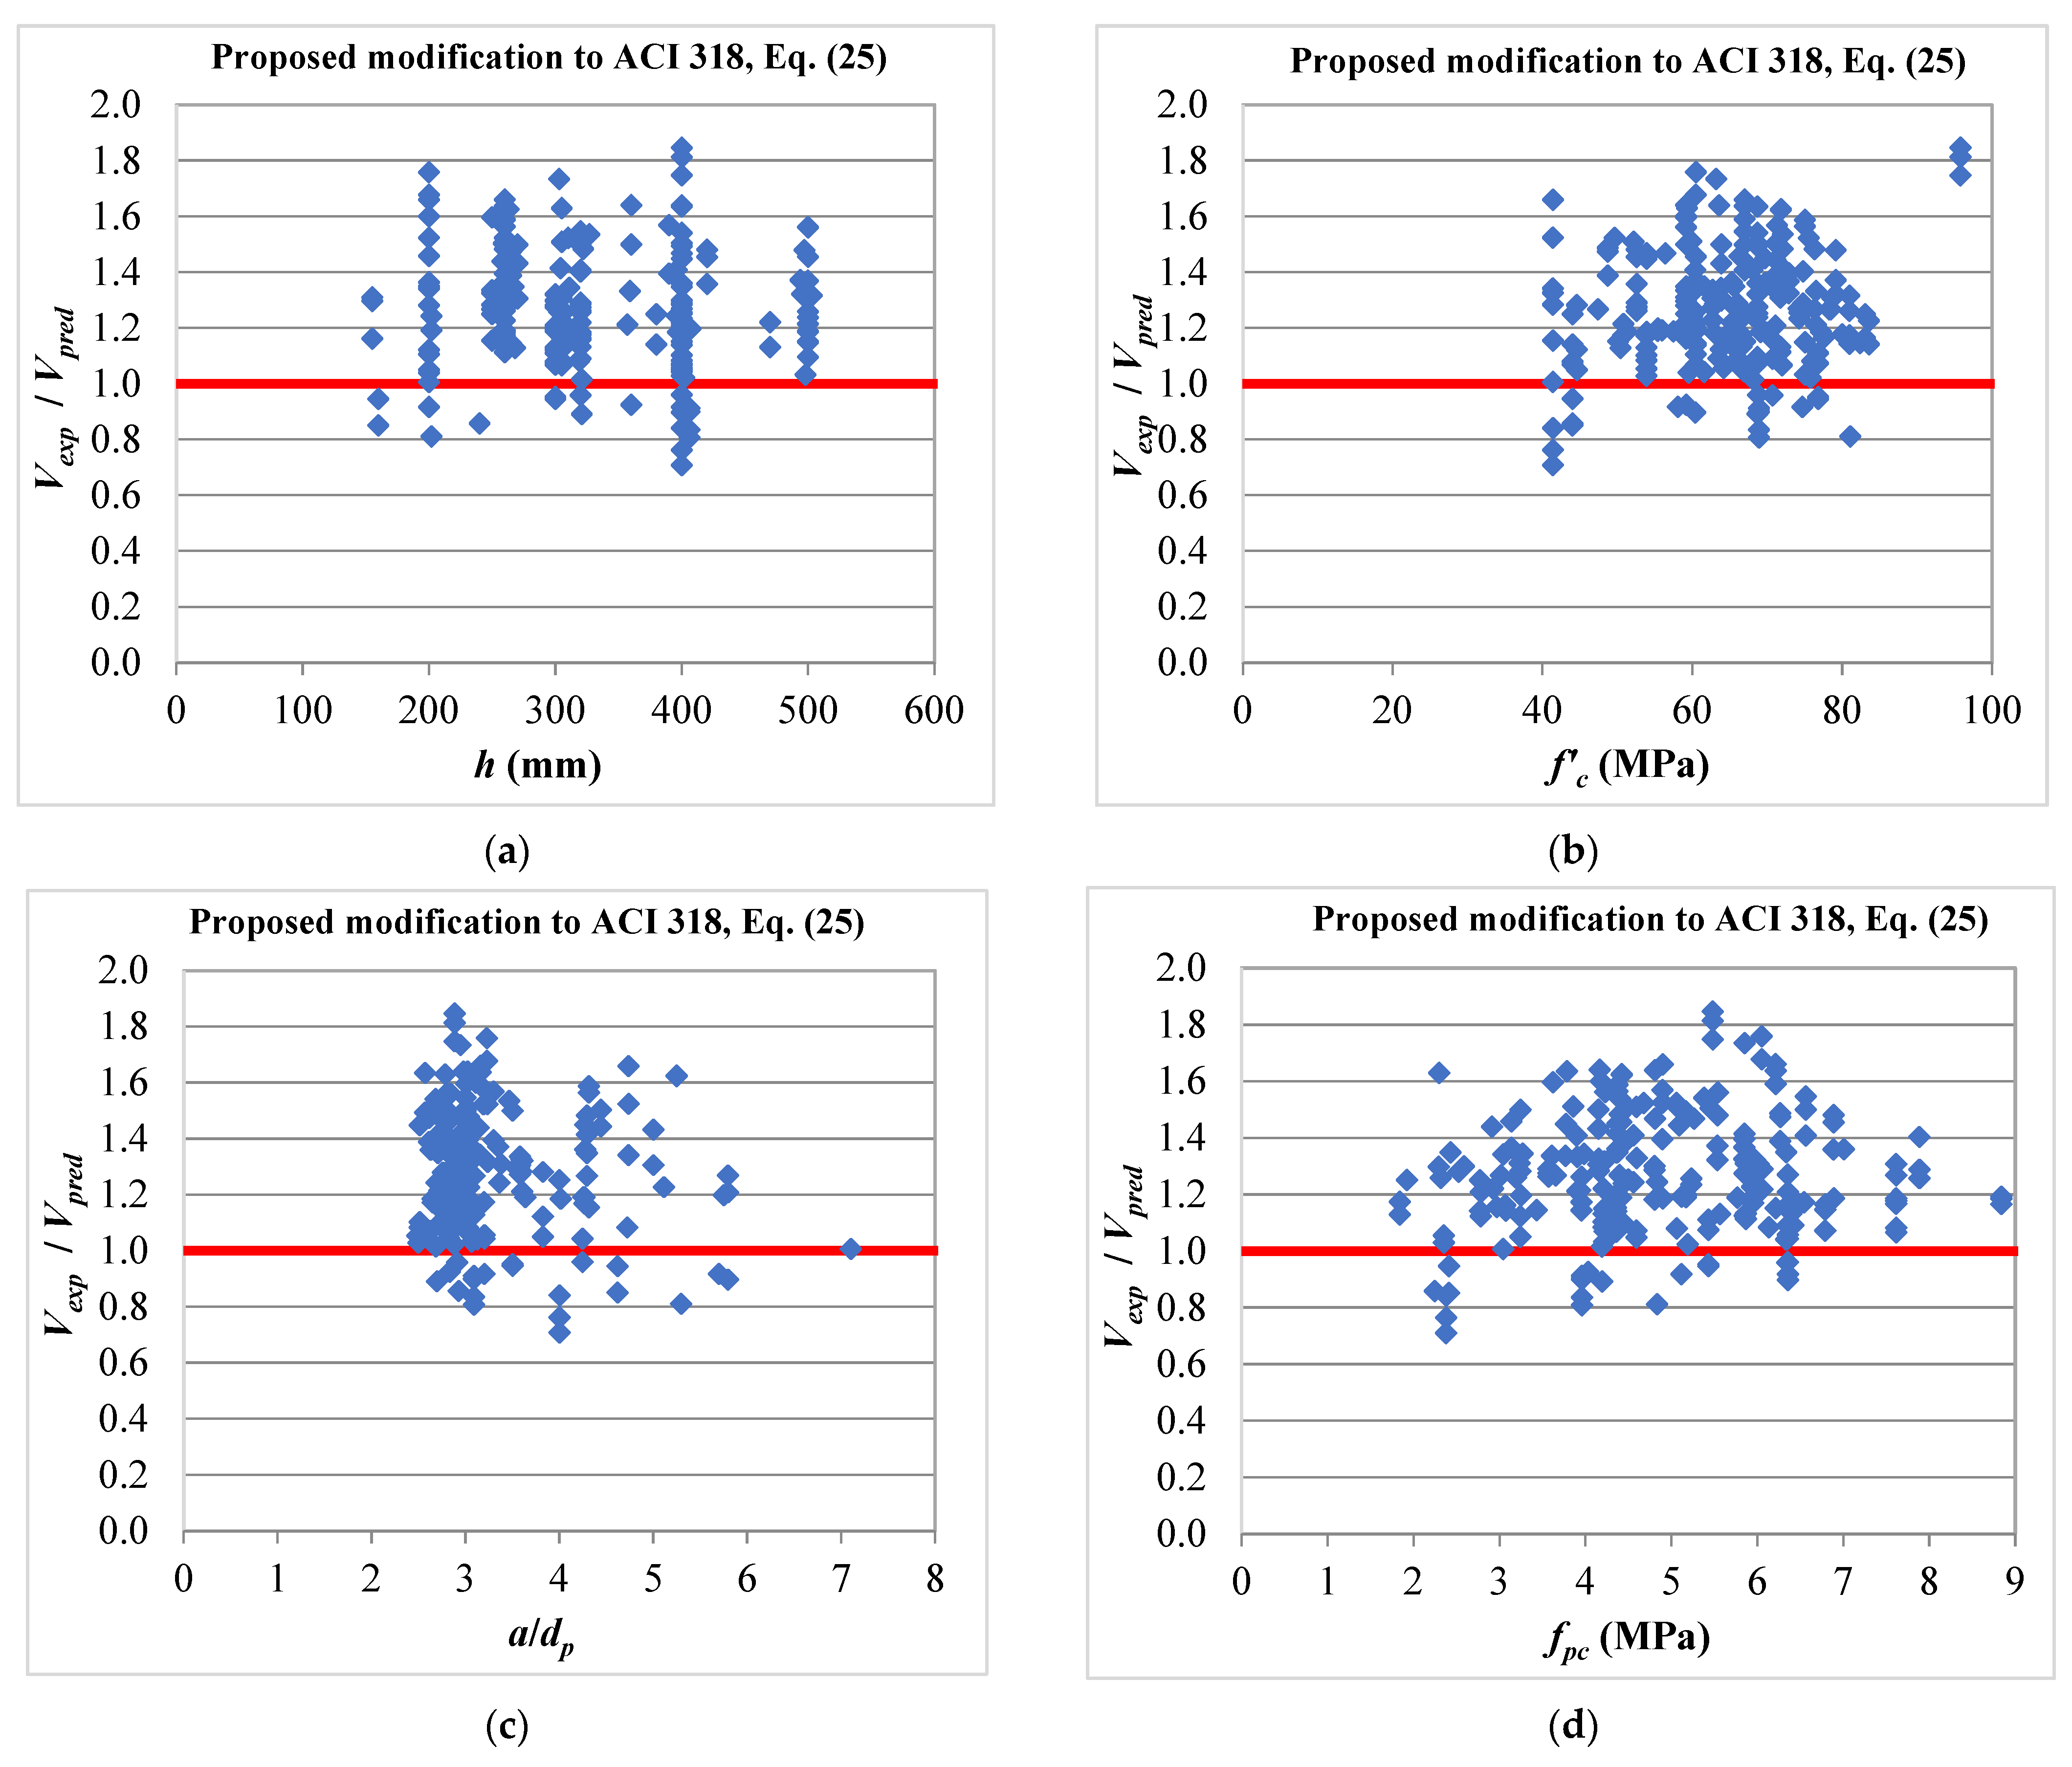
| Proposed modification to ACI 318 | Equation (25) | 1.27 | 17% | 0.71 | 1.85 | 10% |
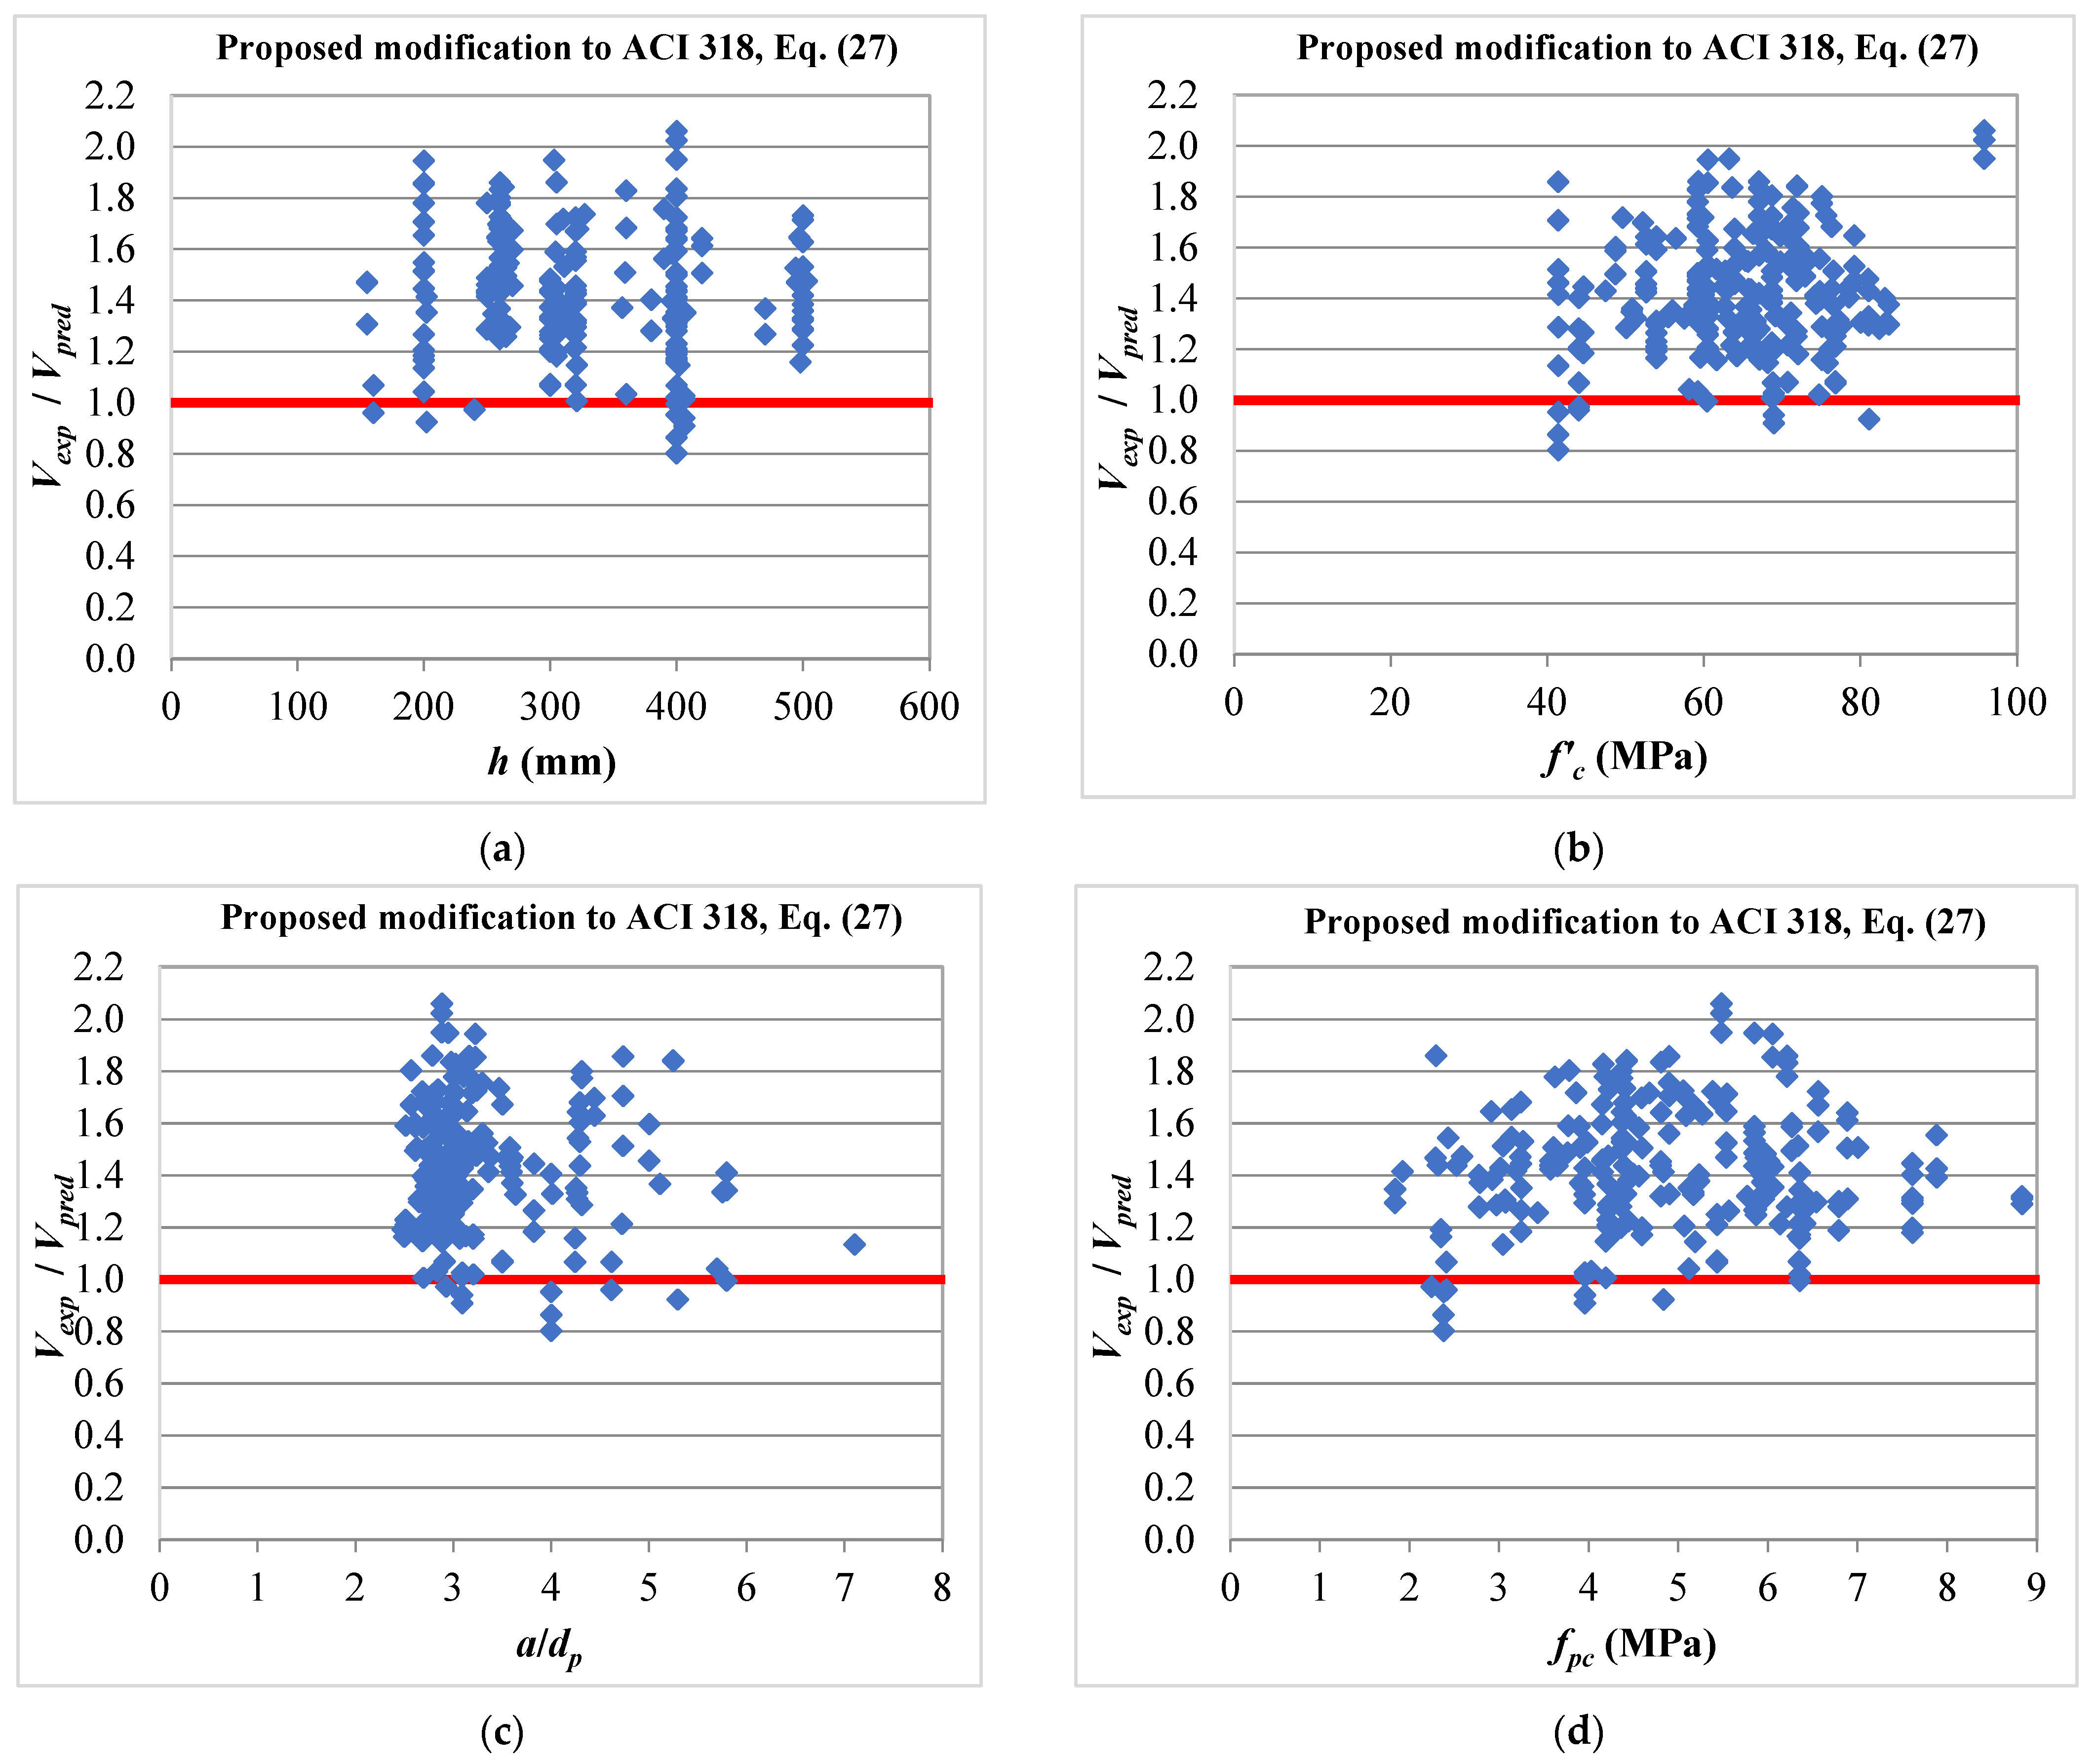
| Equation (27) | 1.42 | 16% | 0.80 | 2.06 | 4% | |
| Proposed modification to Eurocode 2 | Equation (28) | 1.4 | 18% | 0.87 | 2.16 | 4% |
| Proposed modification to EN 1168 | Equation (29) | 1.39 | 17% | 0.85 | 2.14 | 5% |
Disclaimer/Publisher’s Note: The statements, opinions and data contained in all publications are solely those of the individual author(s) and contributor(s) and not of MDPI and/or the editor(s). MDPI and/or the editor(s) disclaim responsibility for any injury to people or property resulting from any ideas, methods, instructions or products referred to in the content. |
© 2022 by the authors. Licensee MDPI, Basel, Switzerland. This article is an open access article distributed under the terms and conditions of the Creative Commons Attribution (CC BY) license (https://creativecommons.org/licenses/by/4.0/).
Share and Cite
El-Sayed, A.K.; Al-Negheimish, A.I.; Alhozaimy, A.M.; Al-Saawani, M.A. Evaluation of Web Shear Design Procedures for Precast Prestressed Hollow Core Slabs. Buildings 2023, 13, 23. https://doi.org/10.3390/buildings13010023
El-Sayed AK, Al-Negheimish AI, Alhozaimy AM, Al-Saawani MA. Evaluation of Web Shear Design Procedures for Precast Prestressed Hollow Core Slabs. Buildings. 2023; 13(1):23. https://doi.org/10.3390/buildings13010023
Chicago/Turabian StyleEl-Sayed, Ahmed K., Abdulaziz I. Al-Negheimish, Abdulrahman M. Alhozaimy, and Mohammed A. Al-Saawani. 2023. "Evaluation of Web Shear Design Procedures for Precast Prestressed Hollow Core Slabs" Buildings 13, no. 1: 23. https://doi.org/10.3390/buildings13010023