
Method for Determining the Fracture Parameters of Fully Graded Dam Concrete

 ,
,
Abstract
:1. Introduction
2. Determination Method of Fracture Parameters
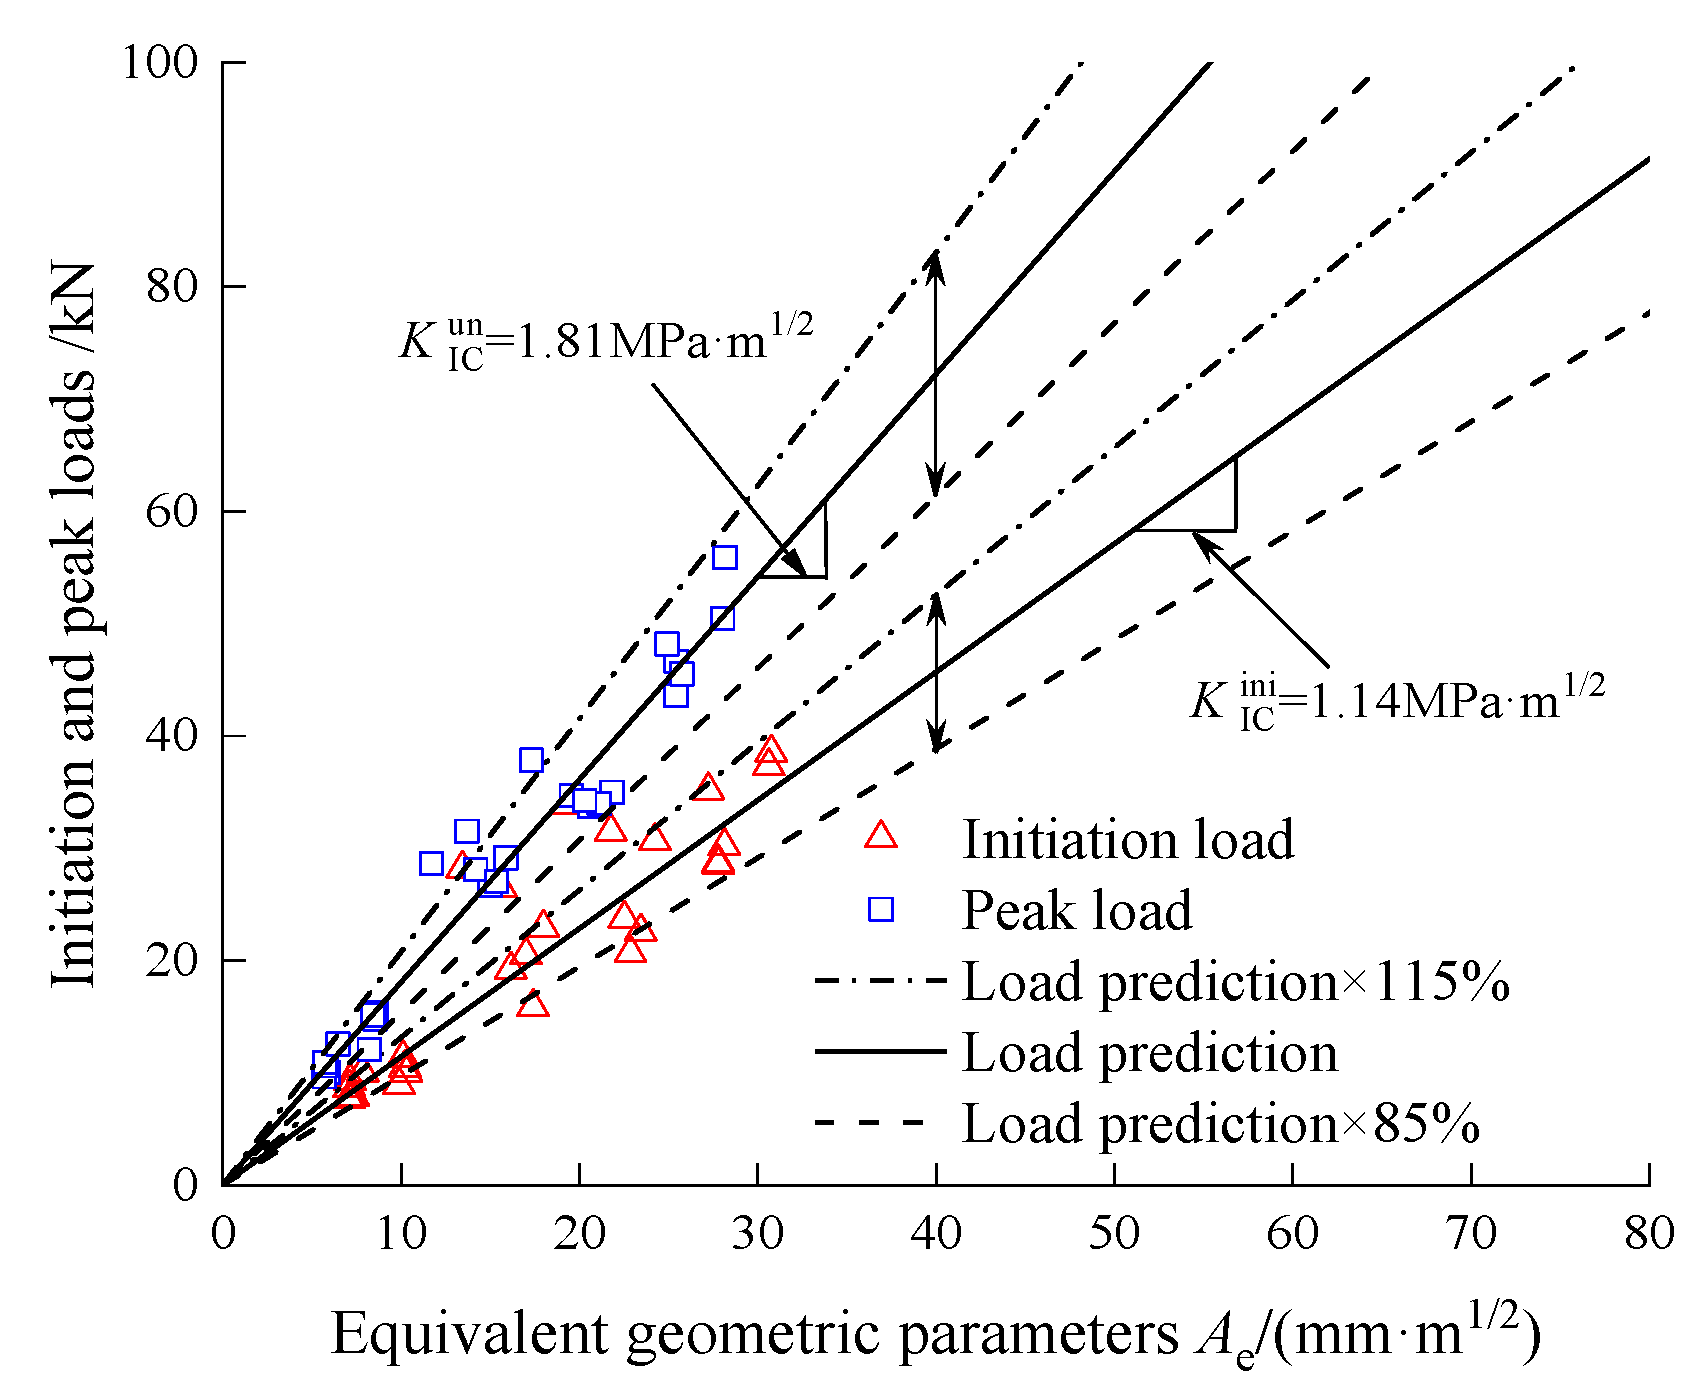
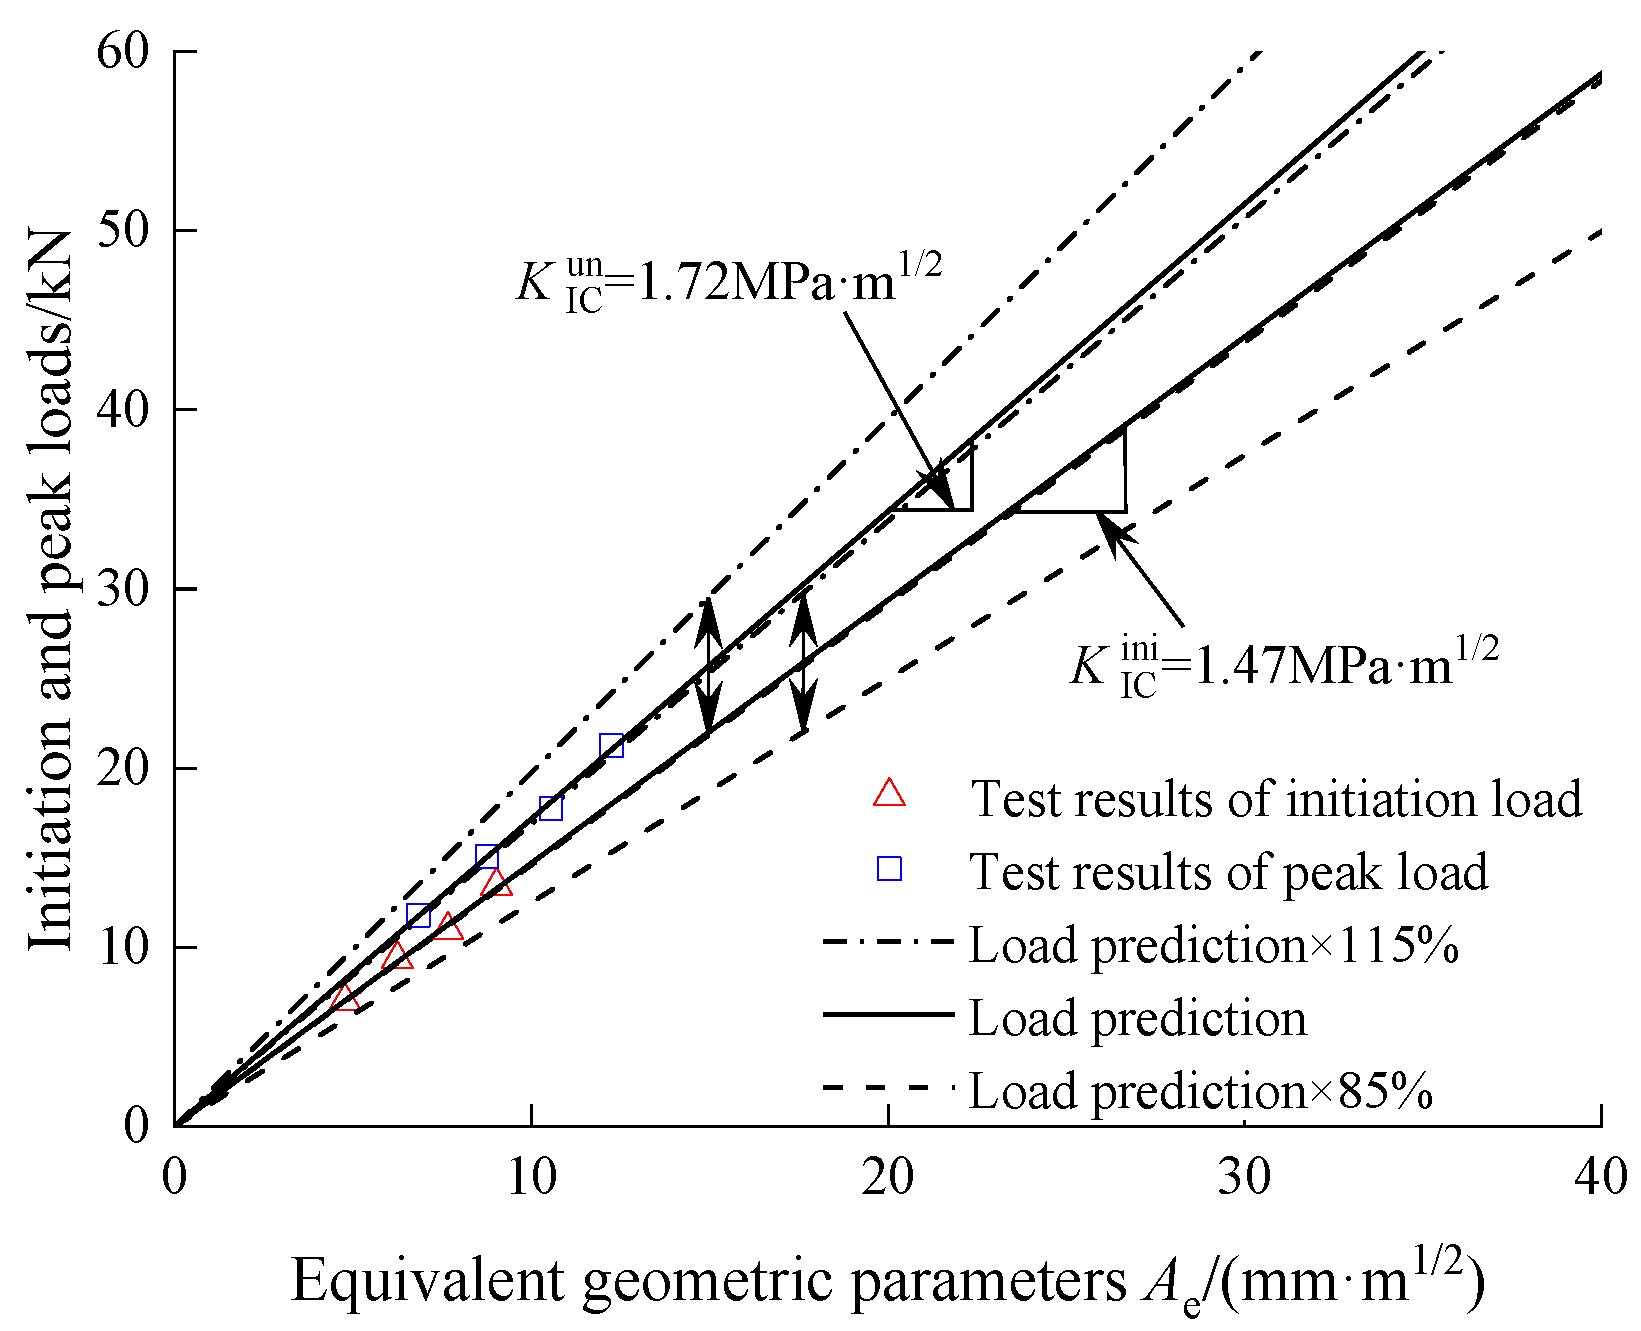
2.1. Determination of Initiation Load and Peak Load
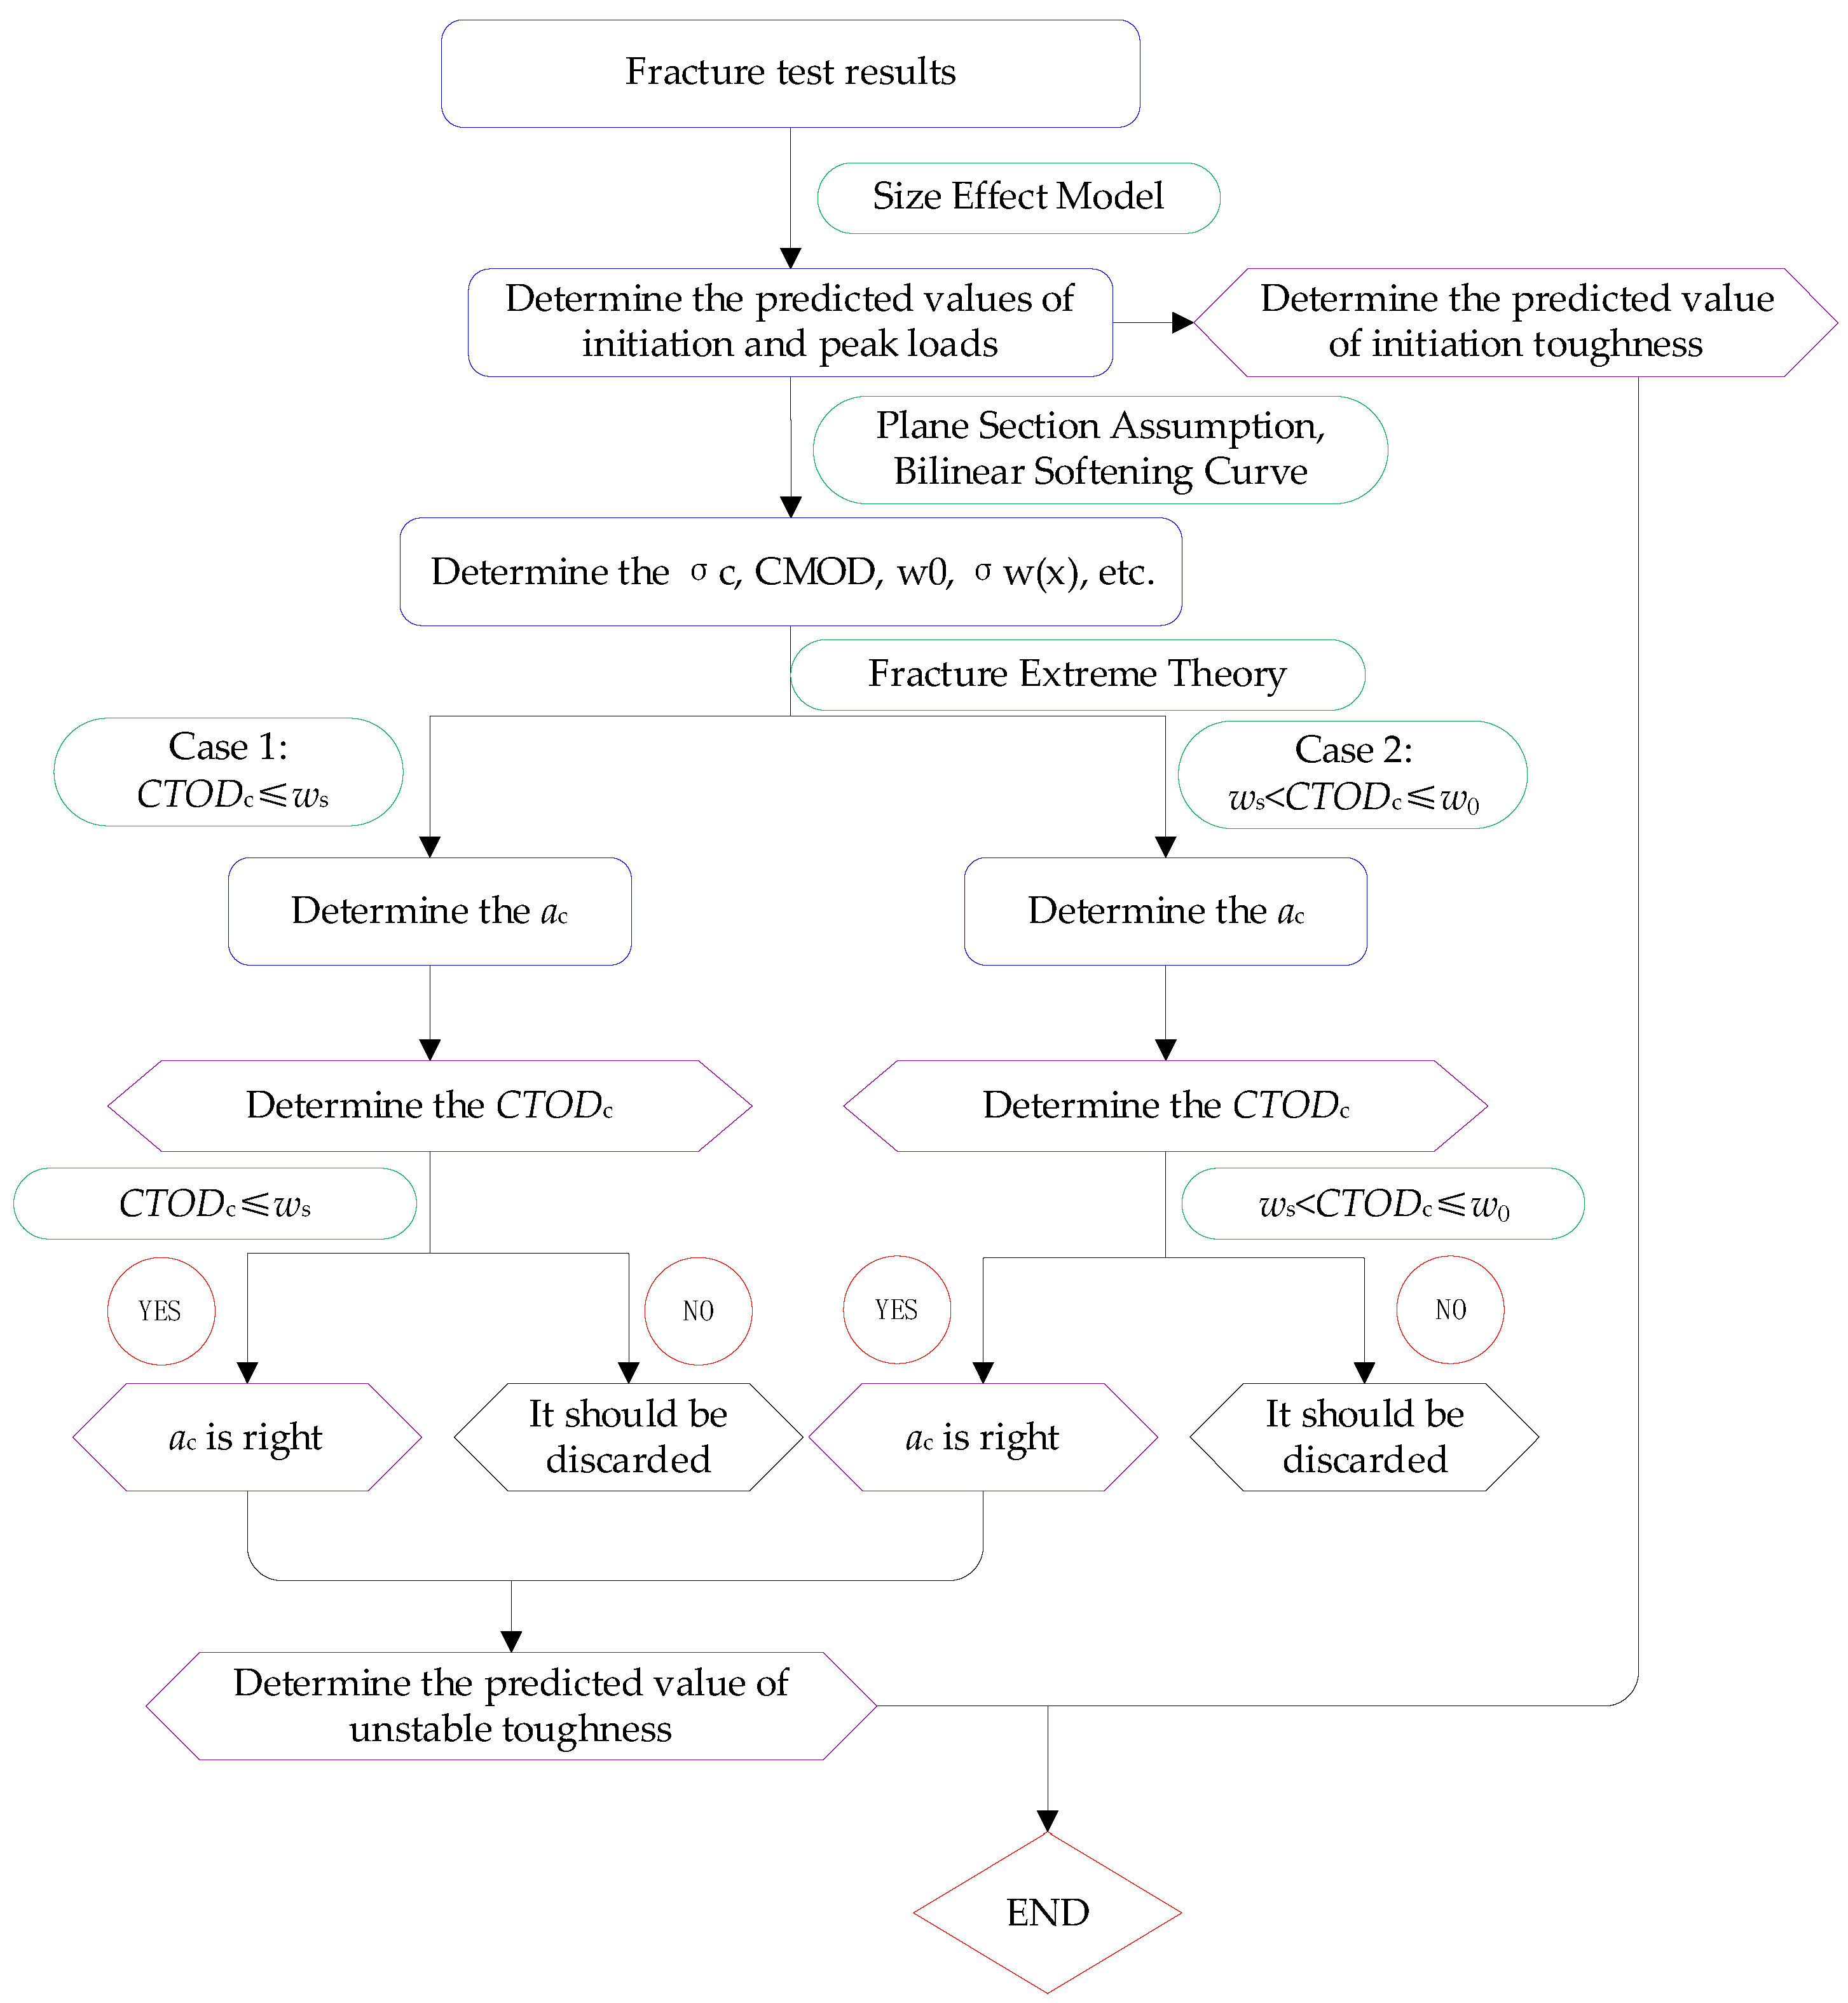
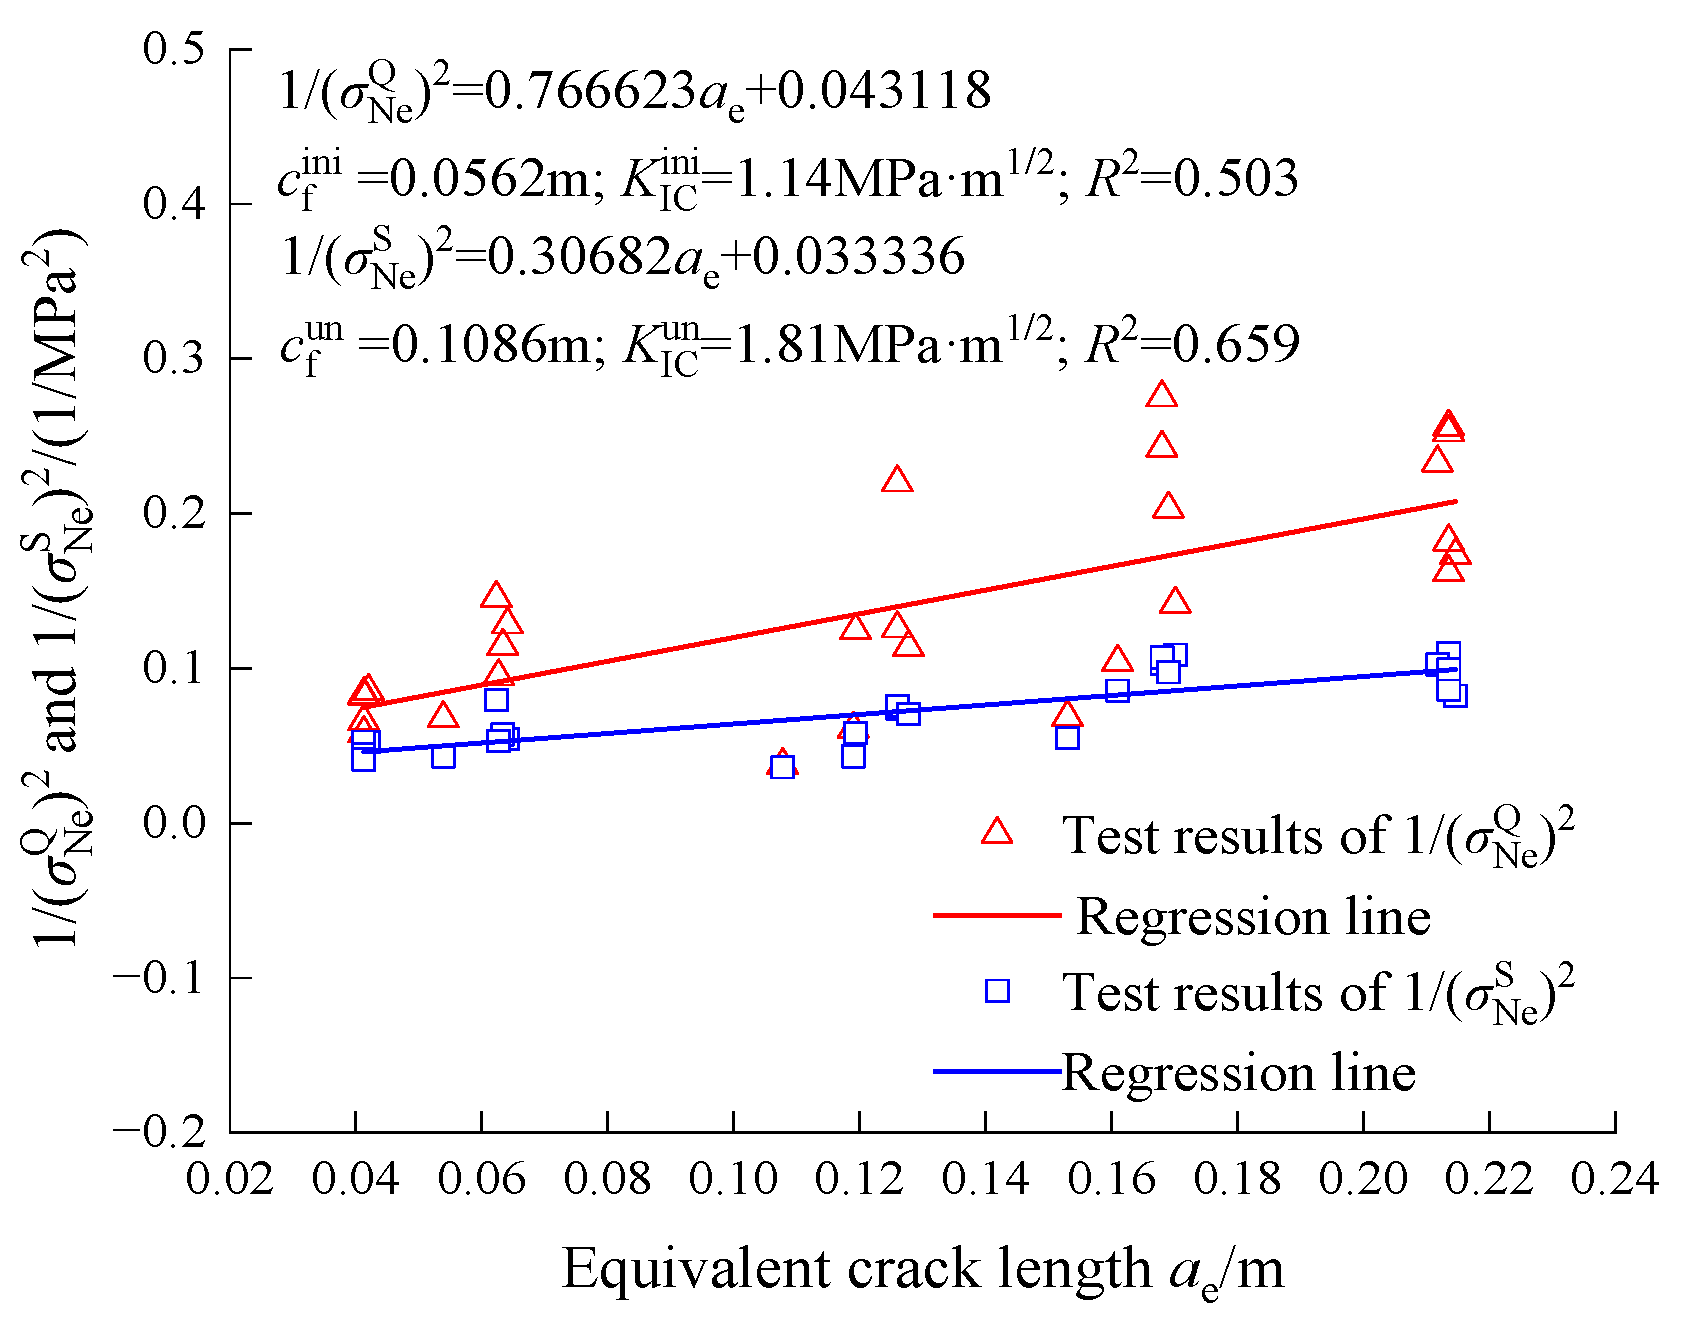
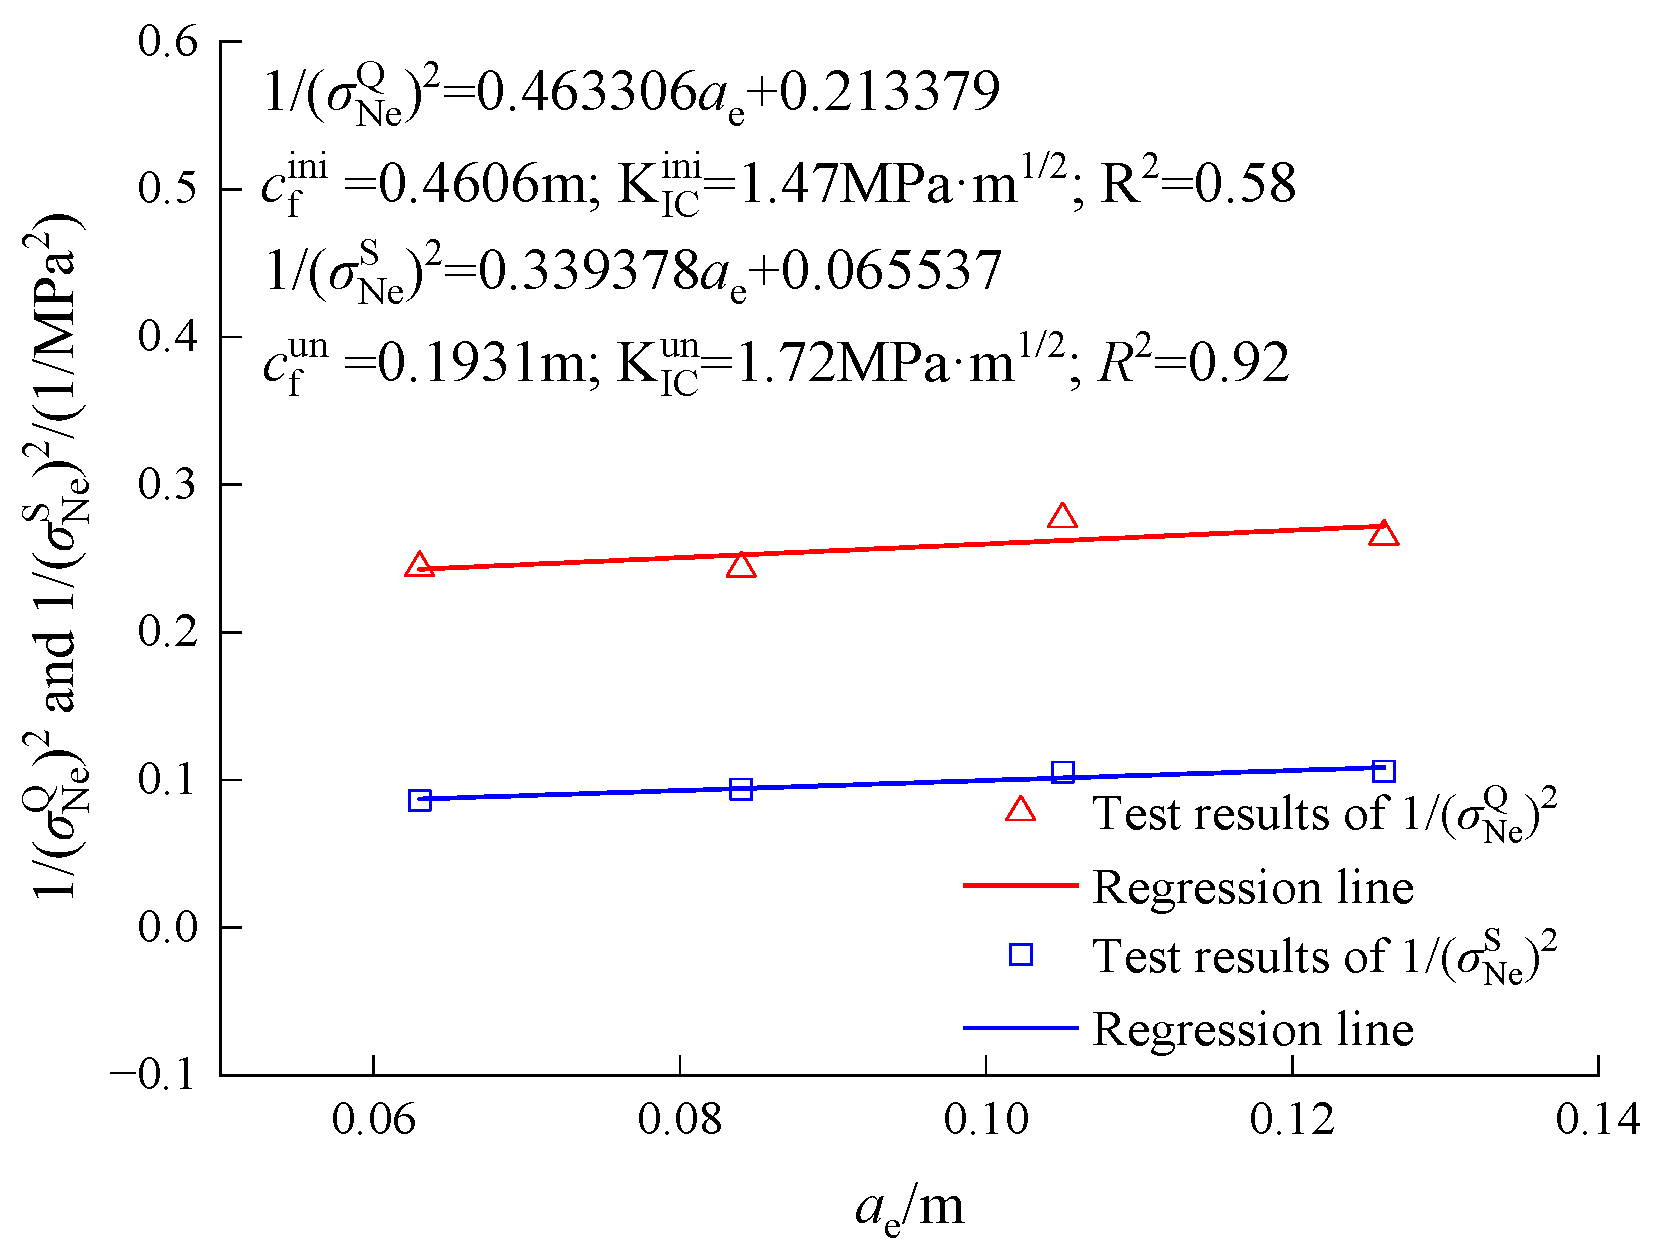
2.2. Determination of Initiation Toughness and Unstable Toughness
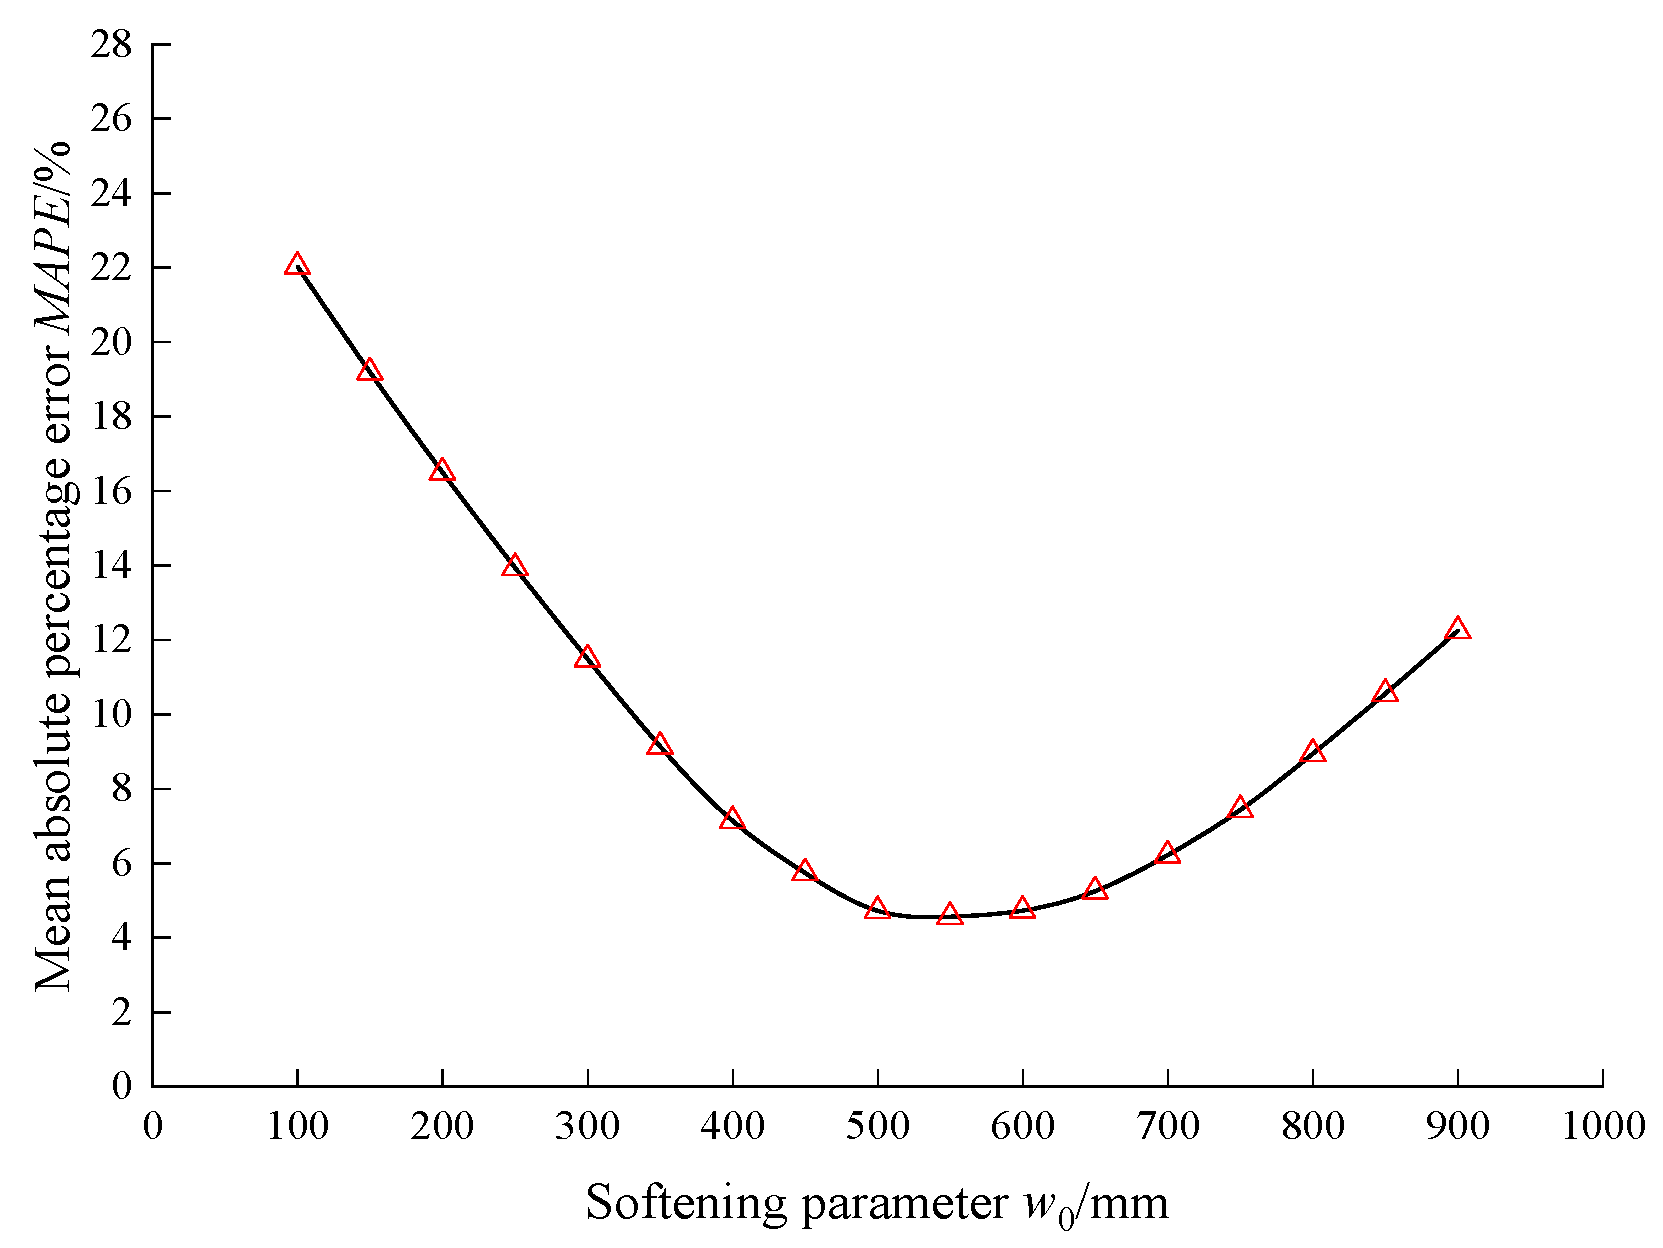
2.3. Evaluation Index of Model Prediction Accuracy
3. Method Validation and Discussion
3.1. Small Aggregate Concrete
3.1.1. Same Crack Length-to-Height Ratio and Different Specimen Sizes
- (1)
- = 0.4, h = 0.2~1 m
- (2)
- α0 = 0.4, h = 0.3~0.6 m
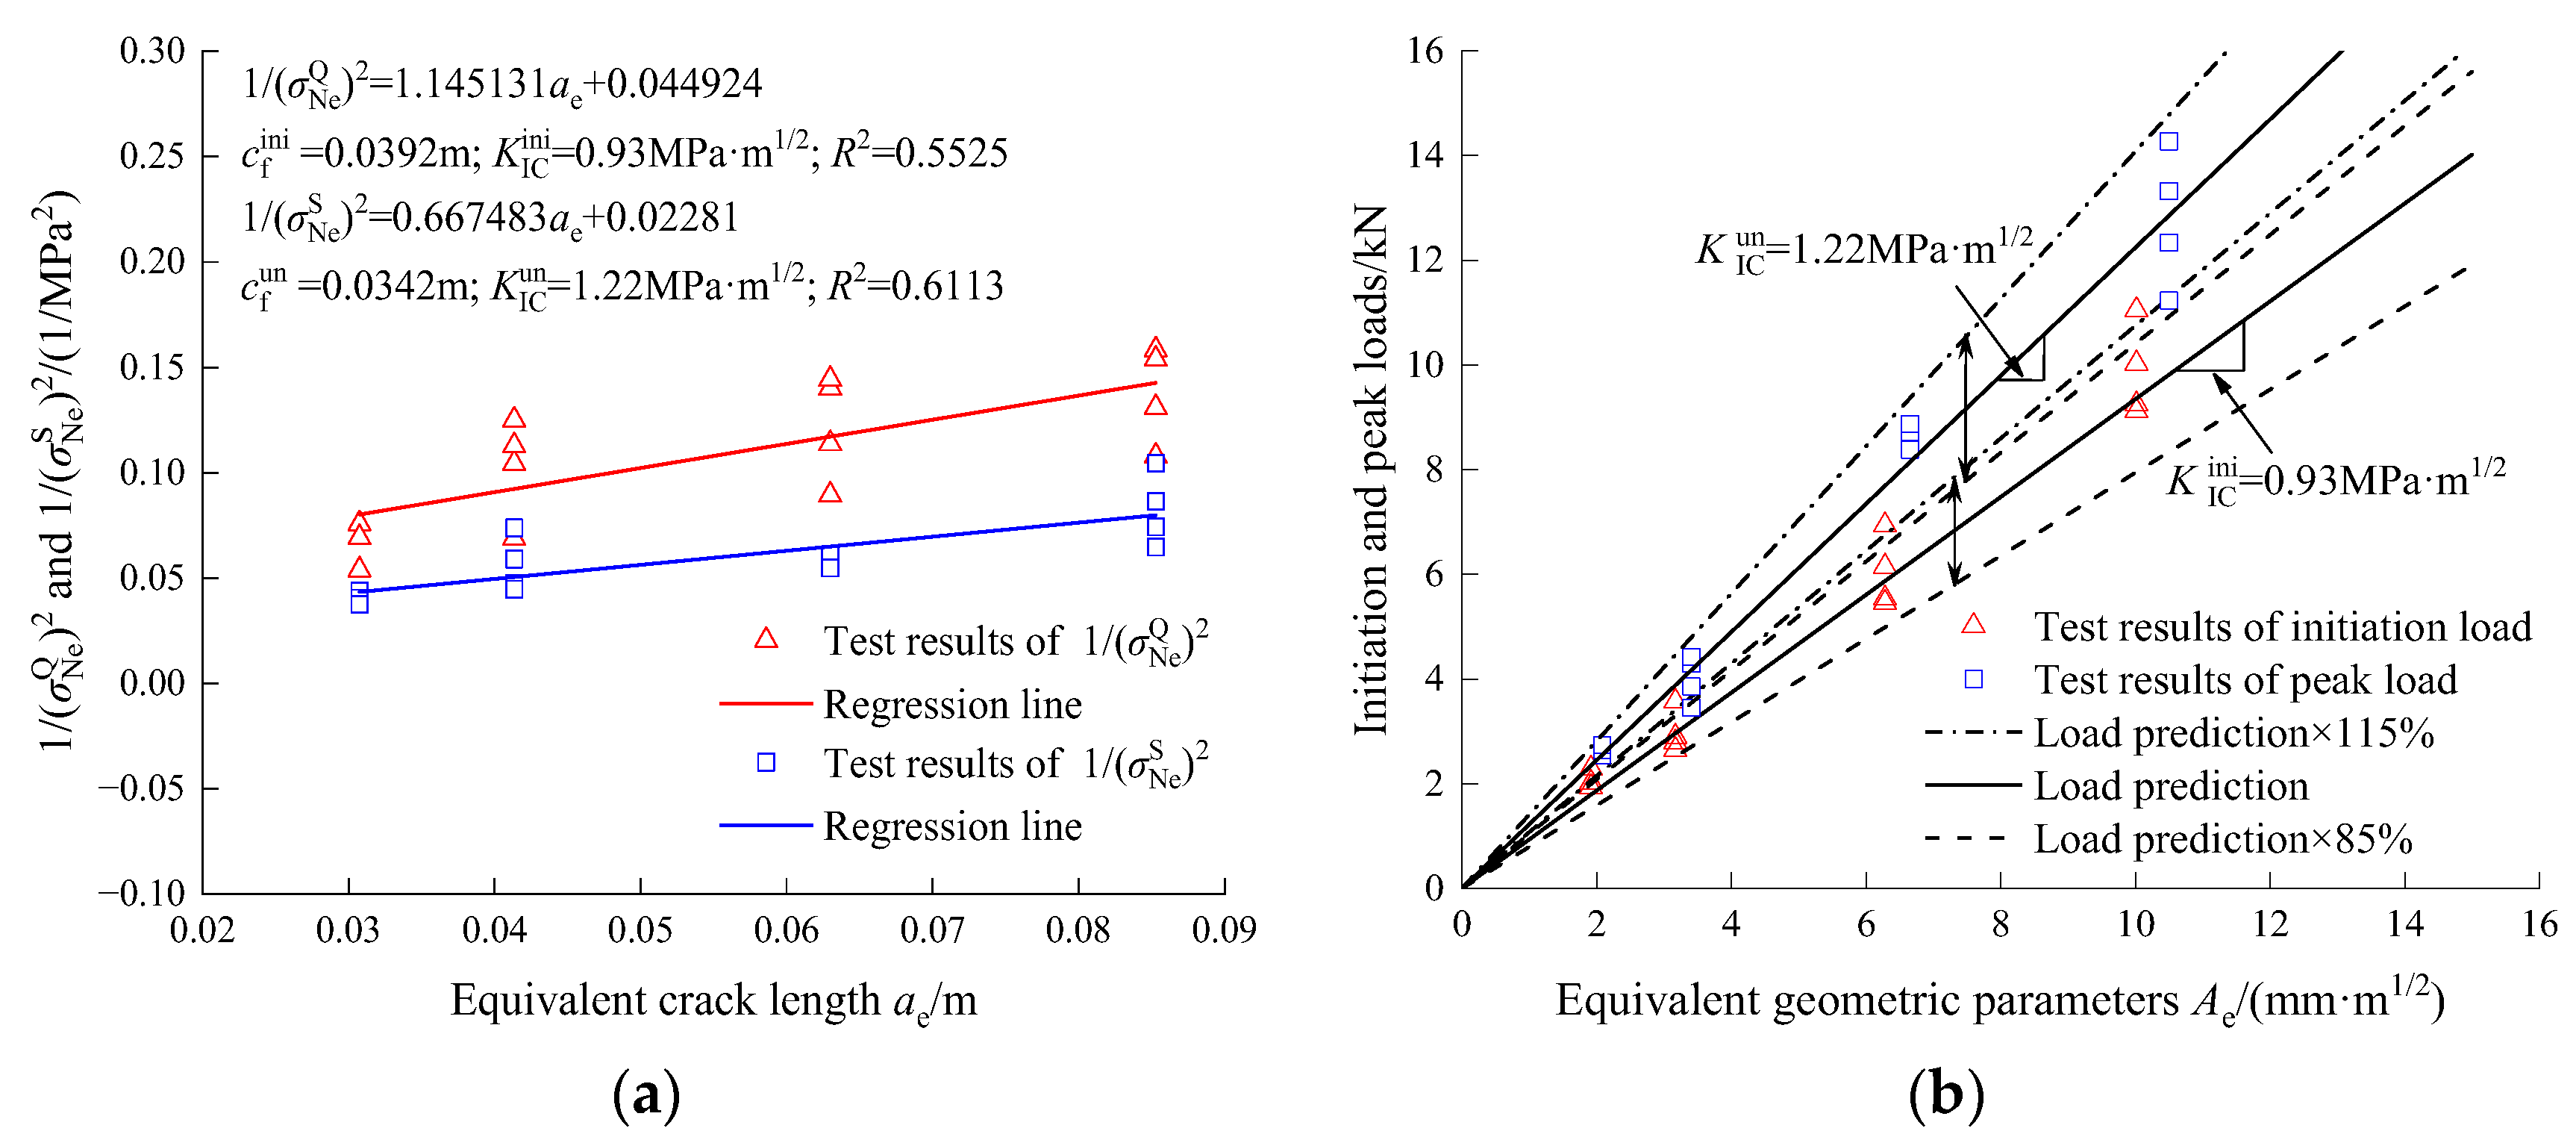
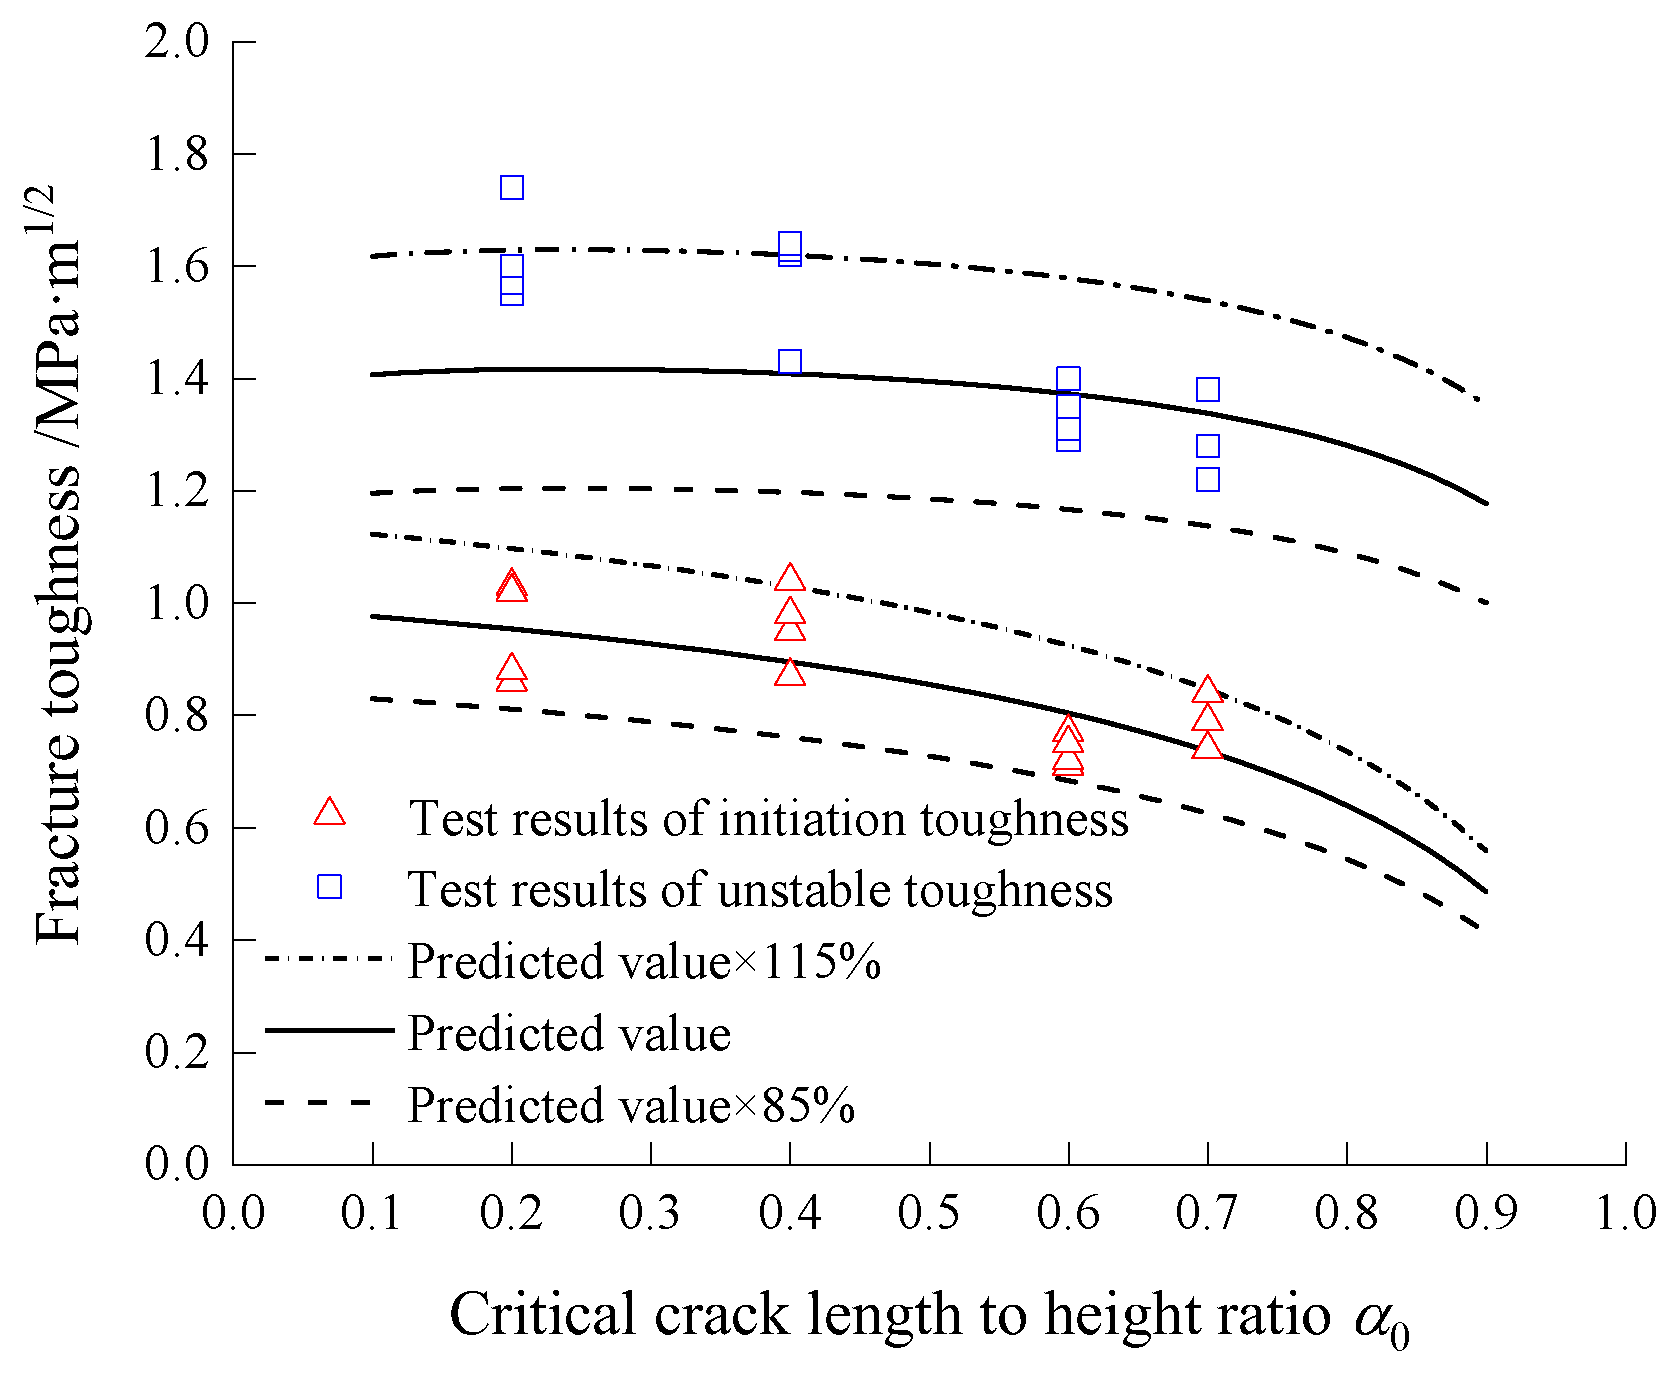
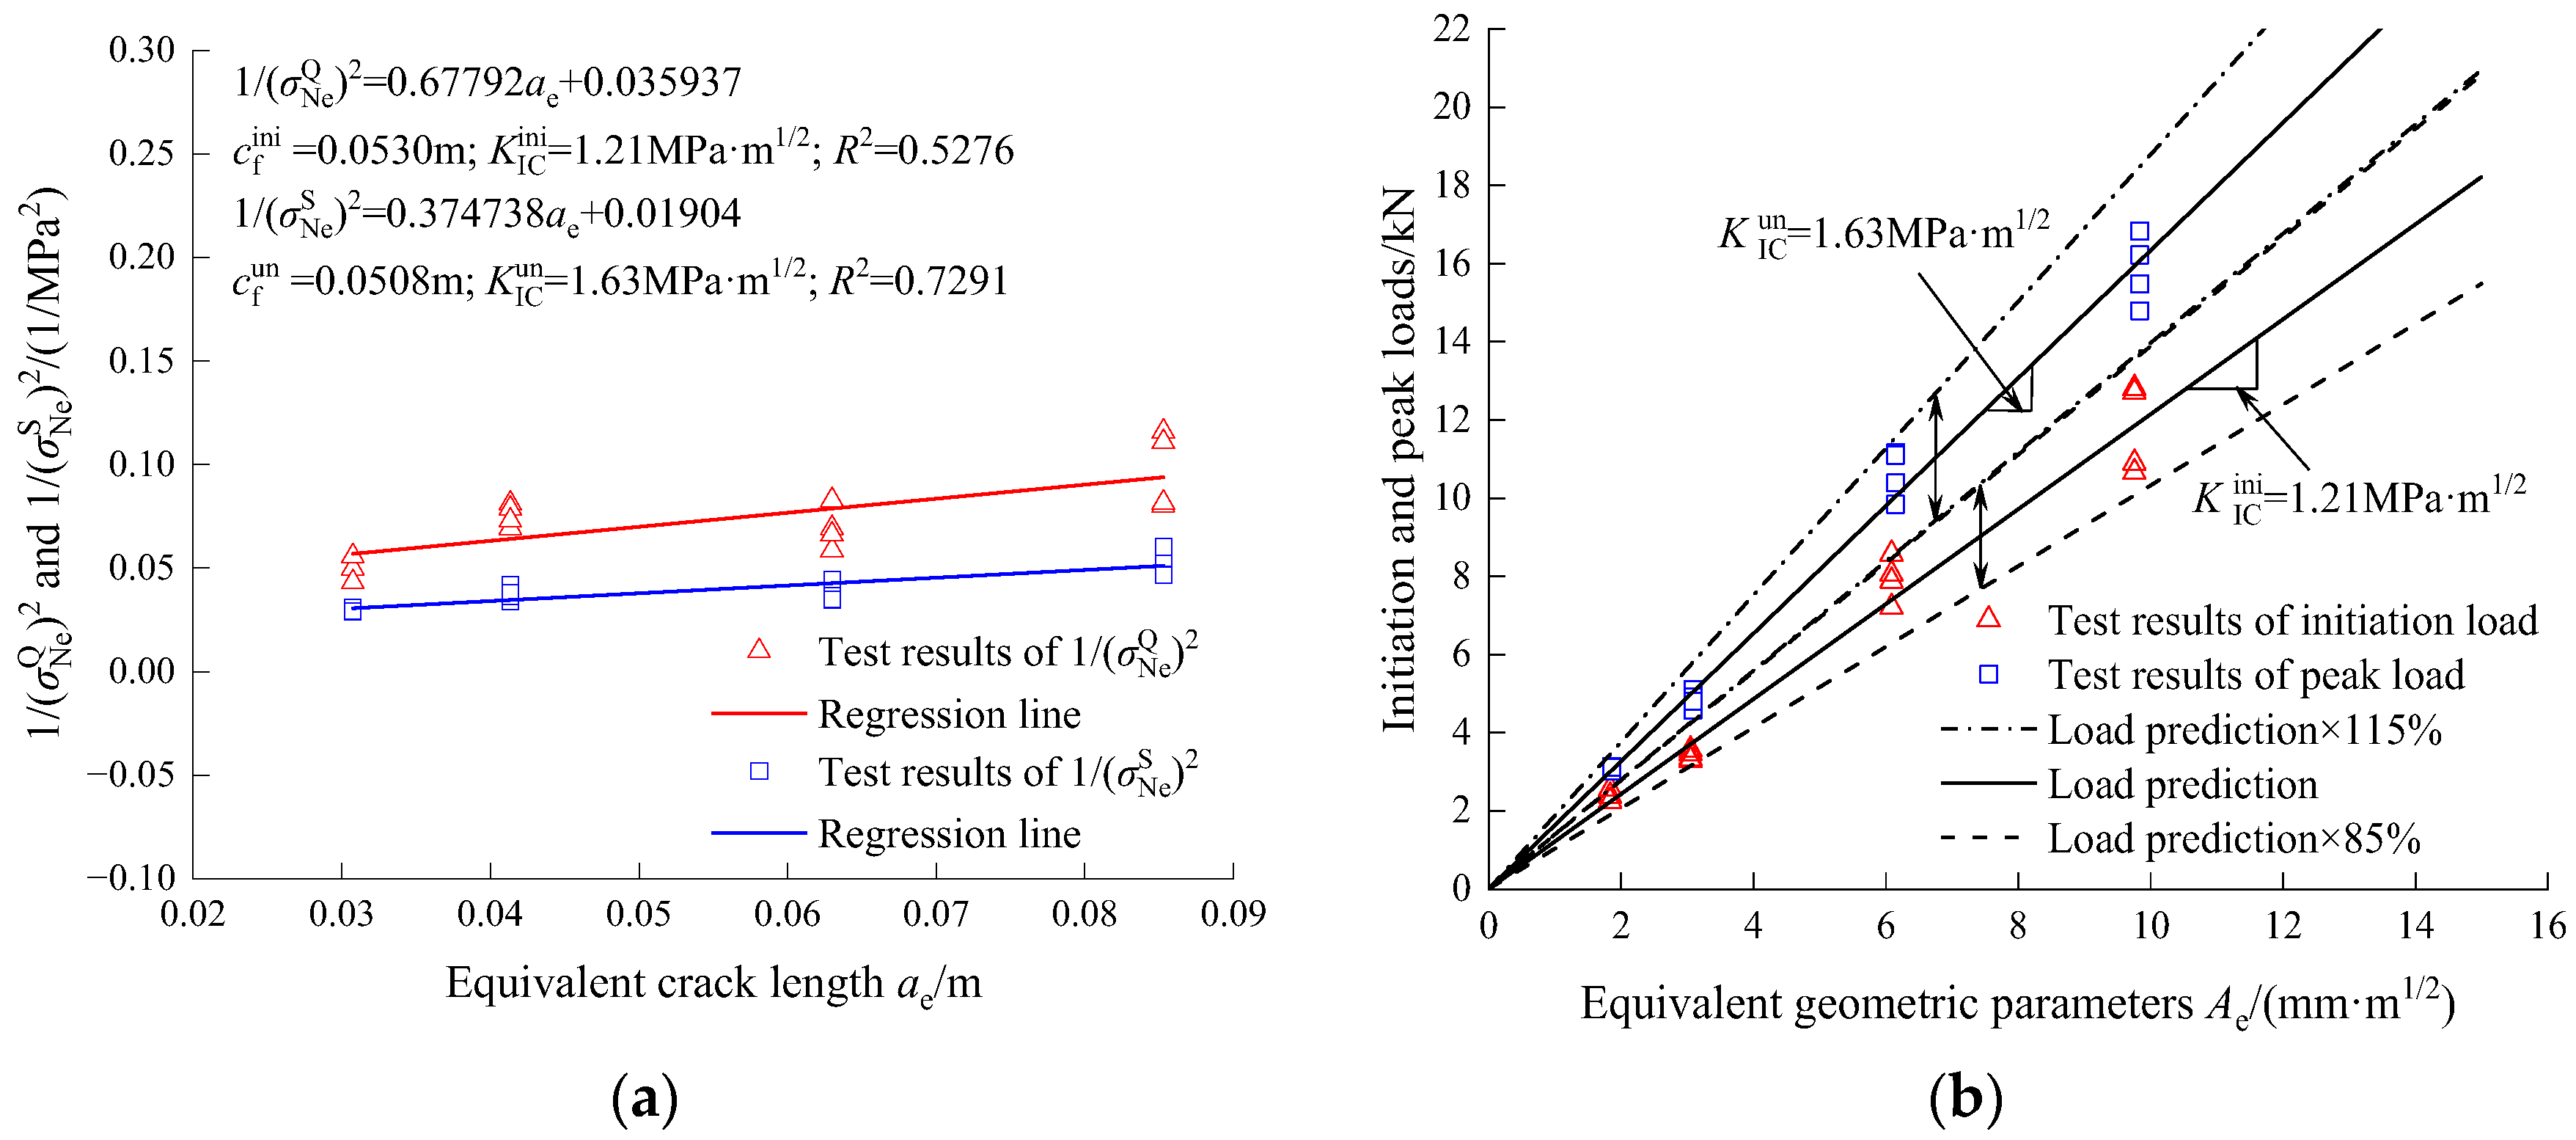
3.1.2. Same Specimen Size but Different Crack Length-to-Height Ratio
- (1)
- dmax = 10 mm
- (2)
- dmax = 20 mm
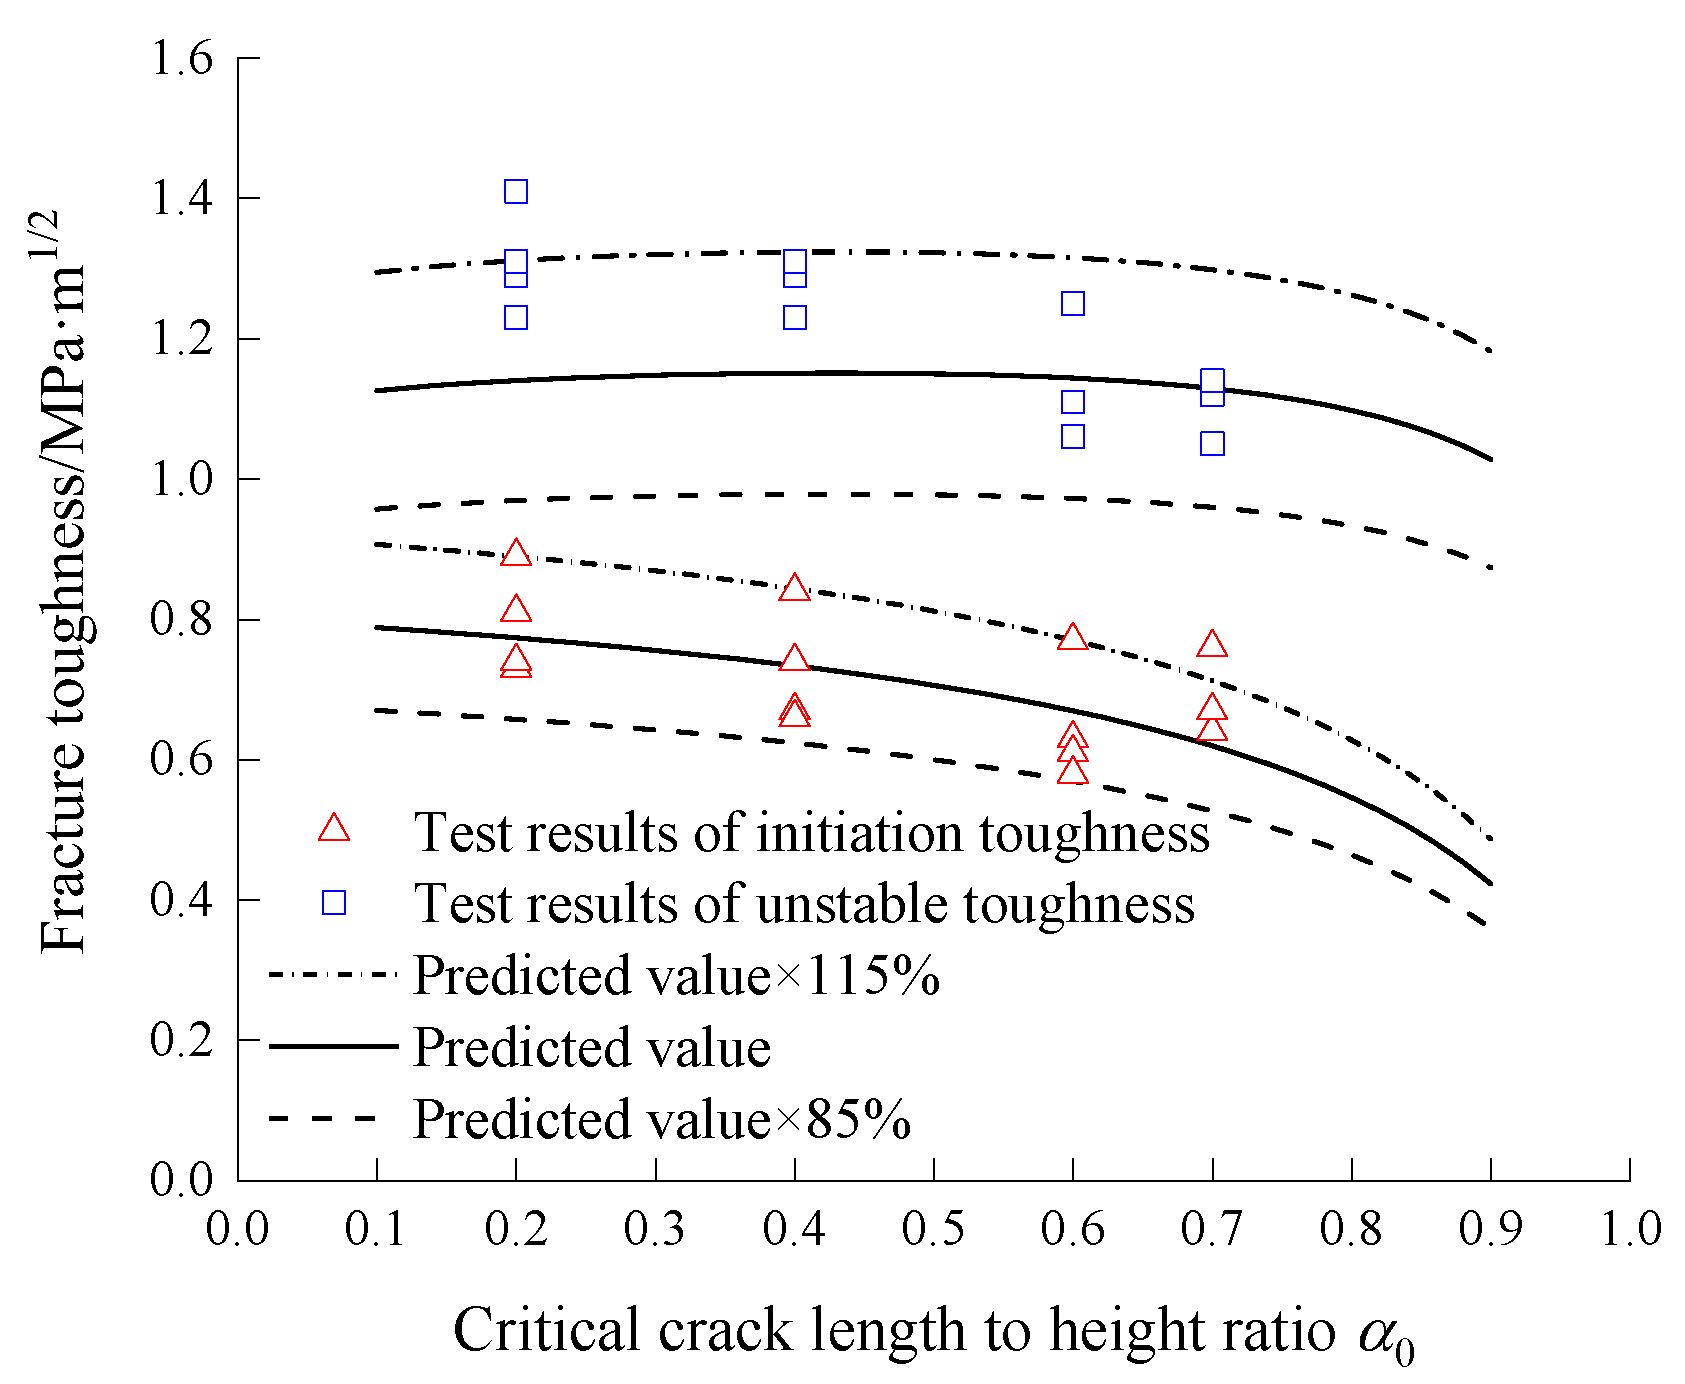
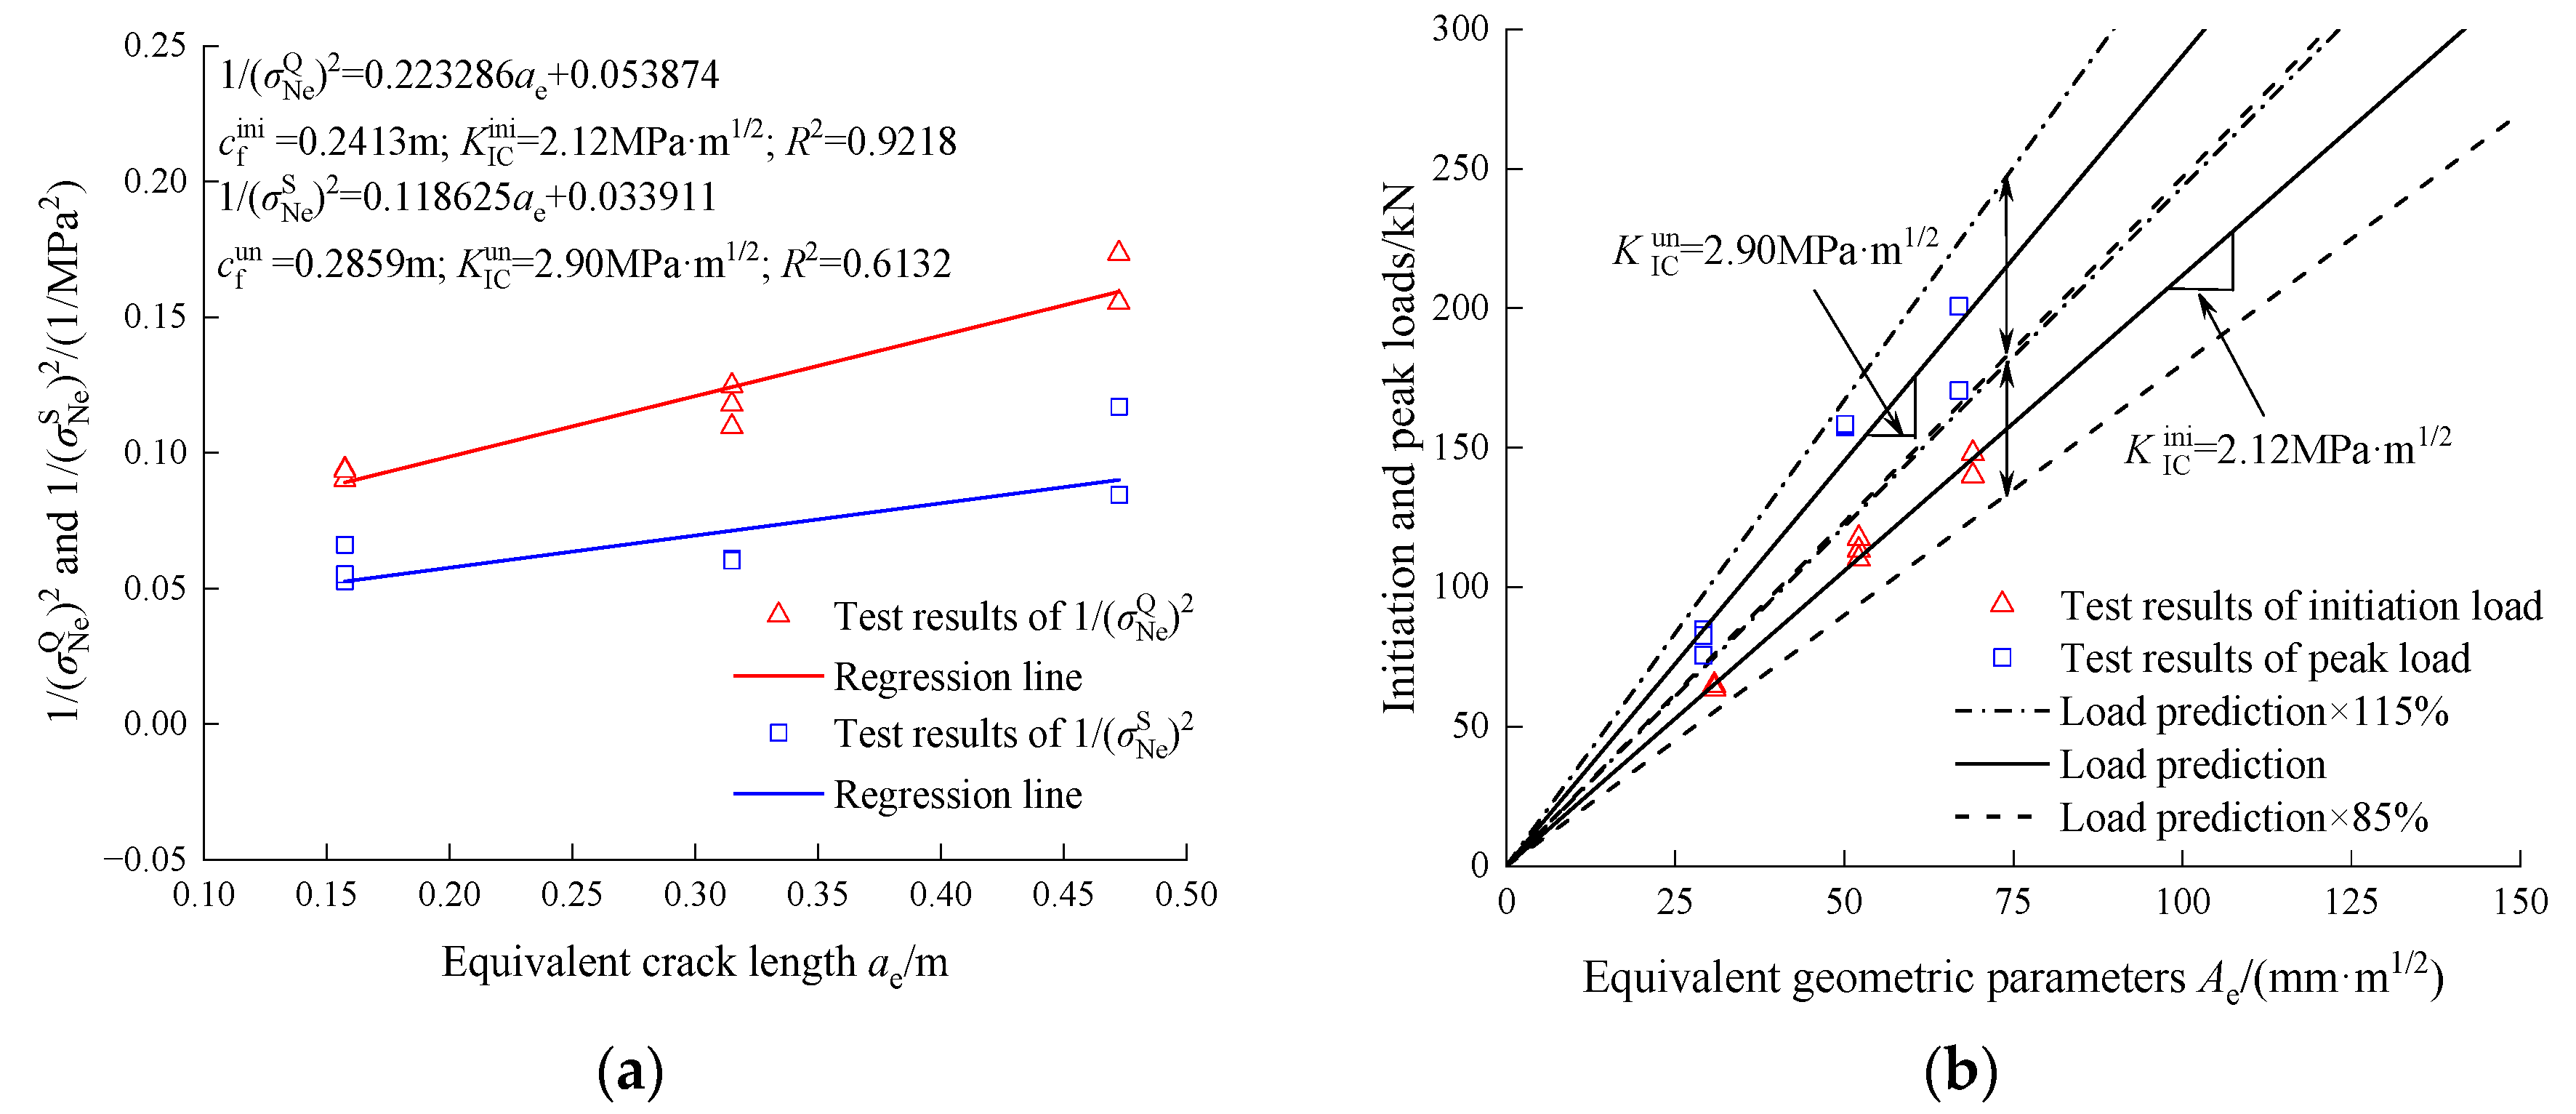
3.2. Fully Graded Concrete
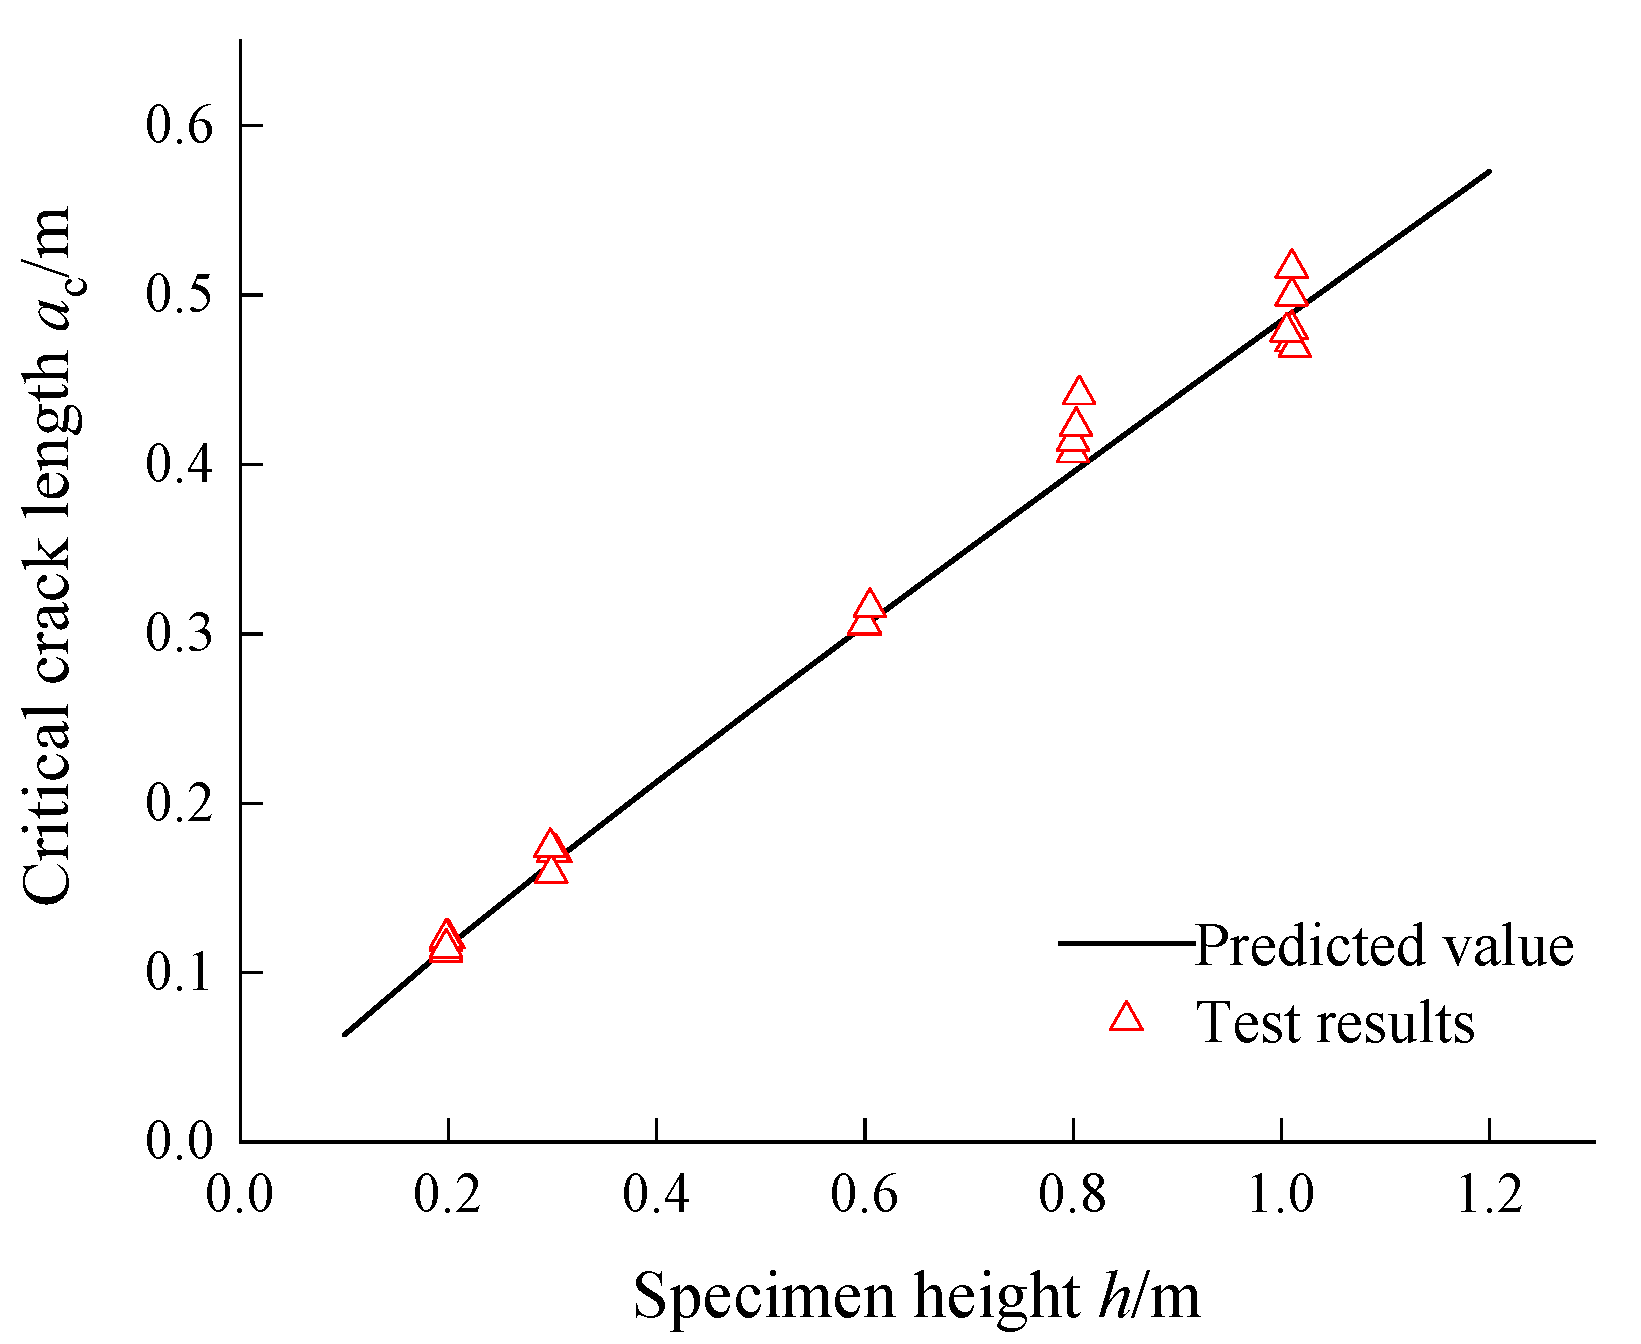
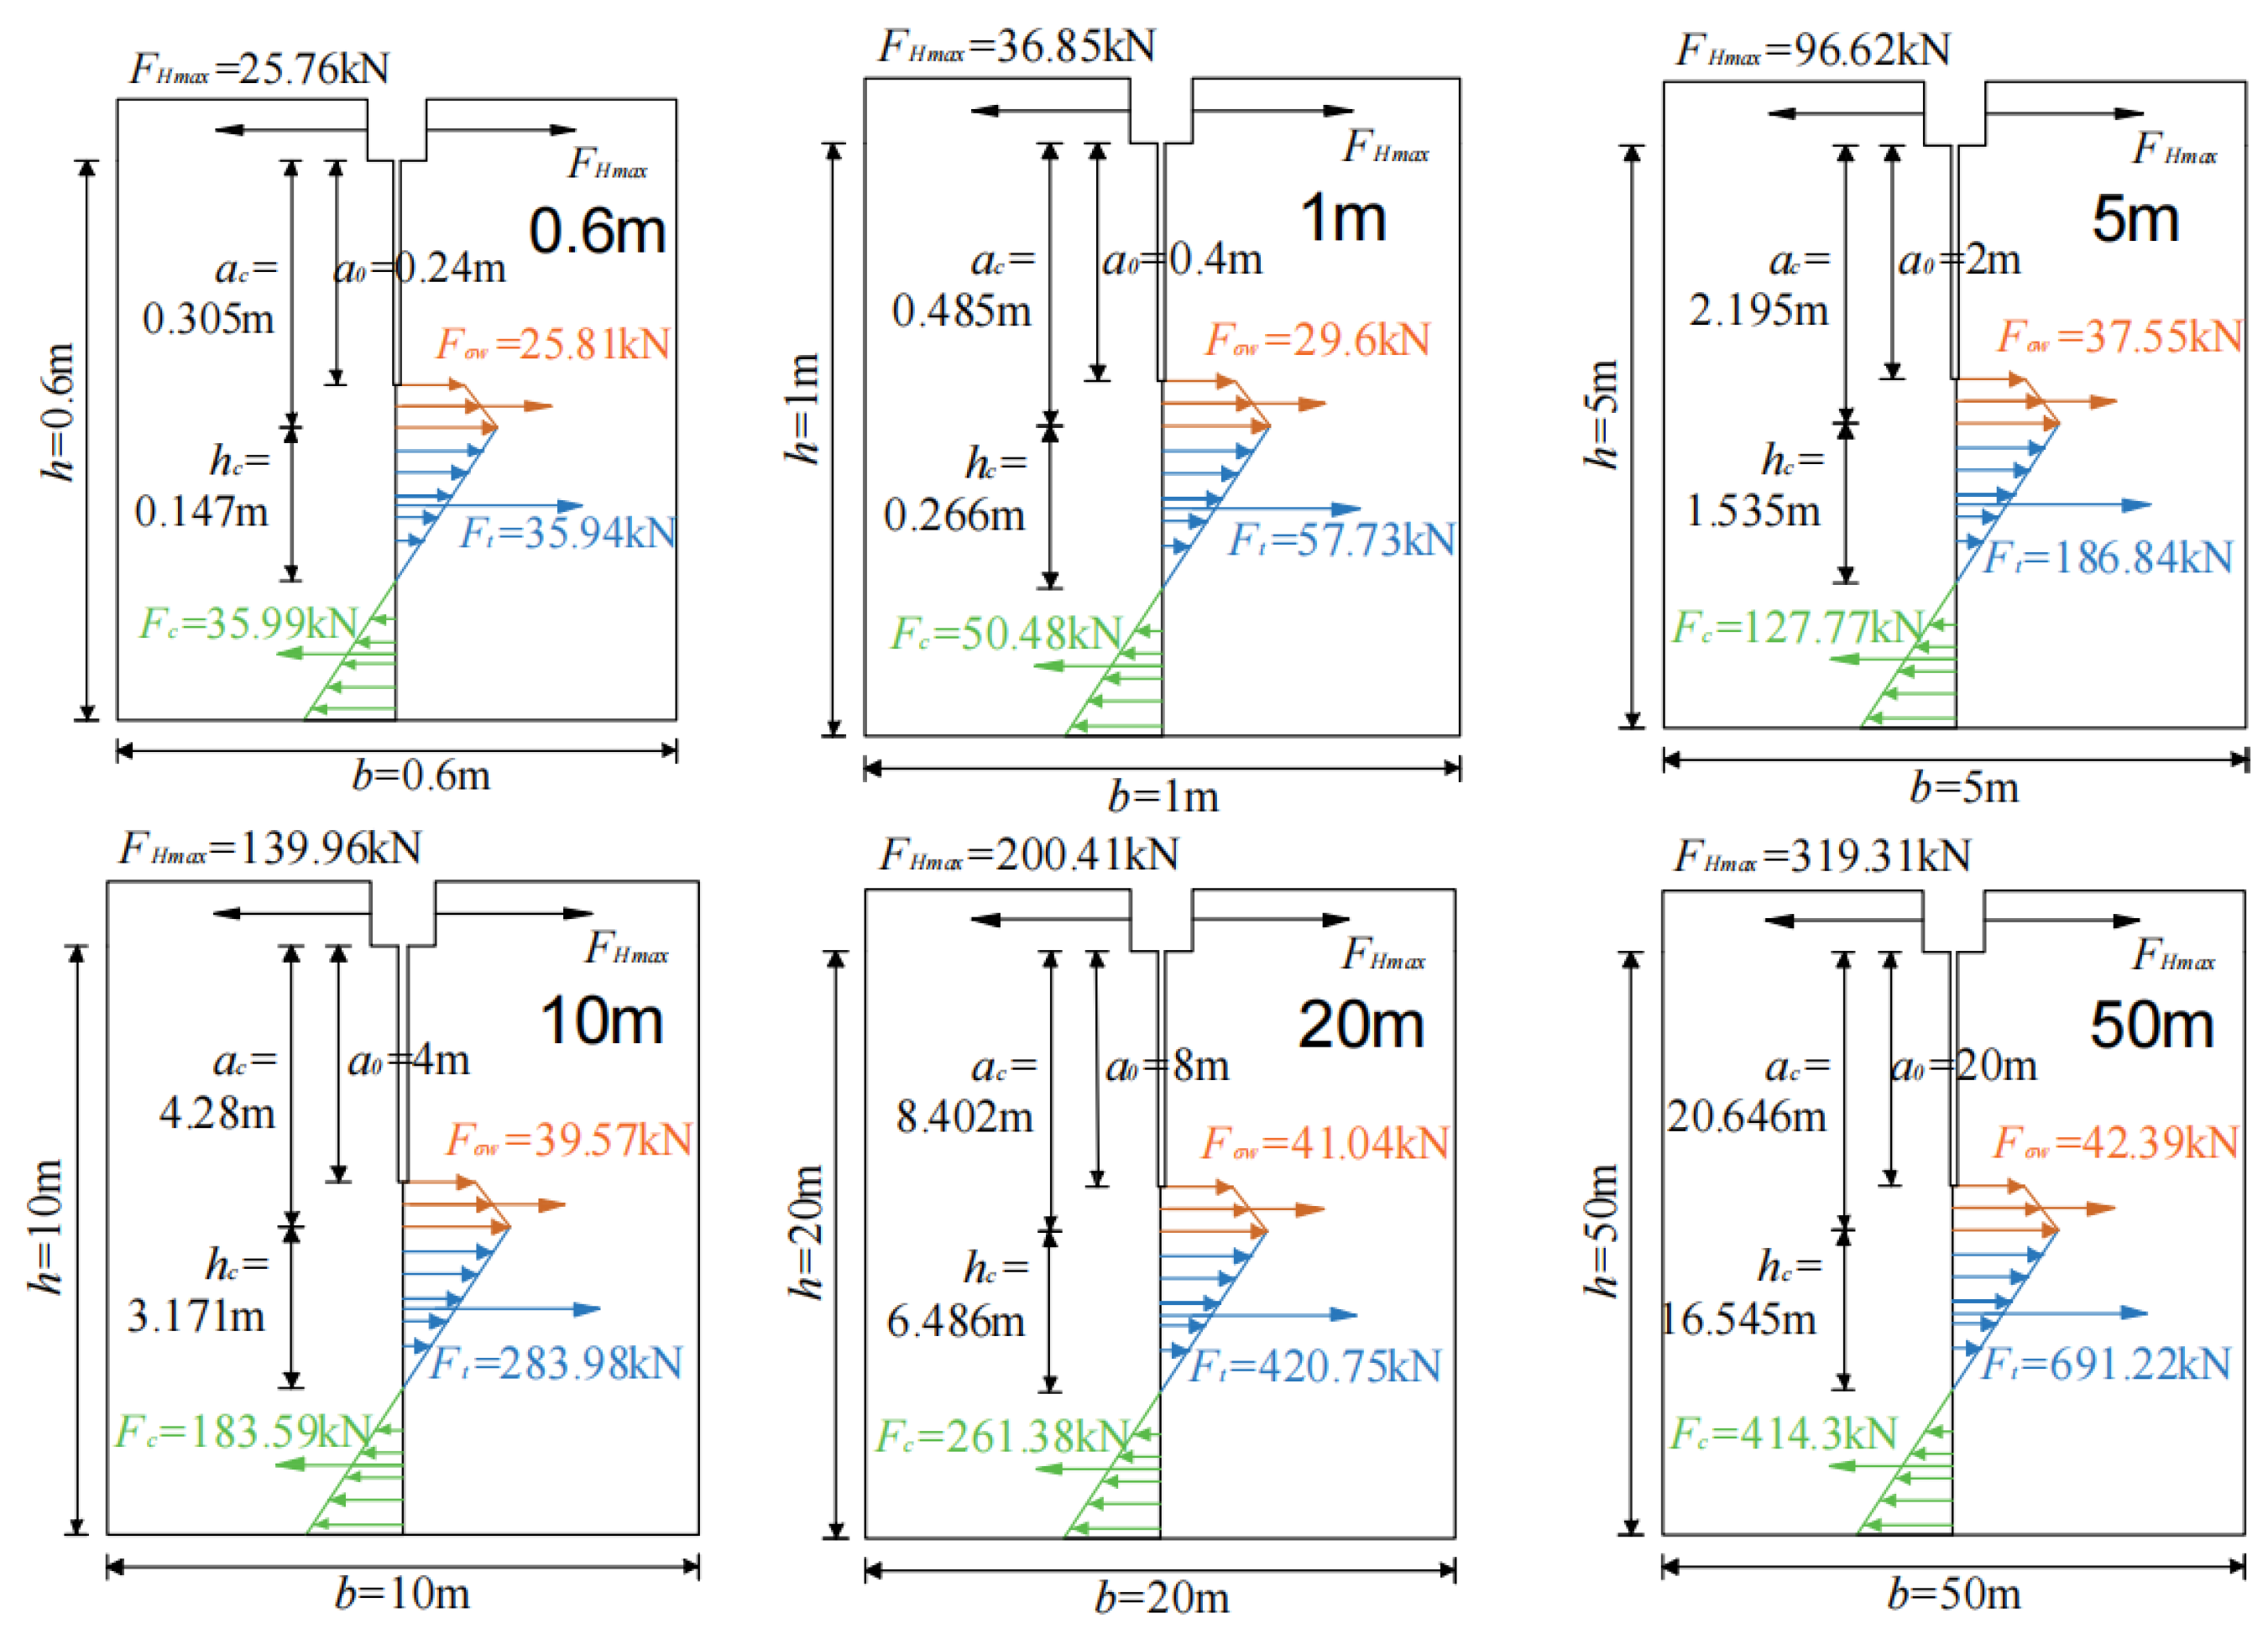
Same Crack Length-to-Height Ratio and Different Specimen Sizes
4. Conclusions
- (1)
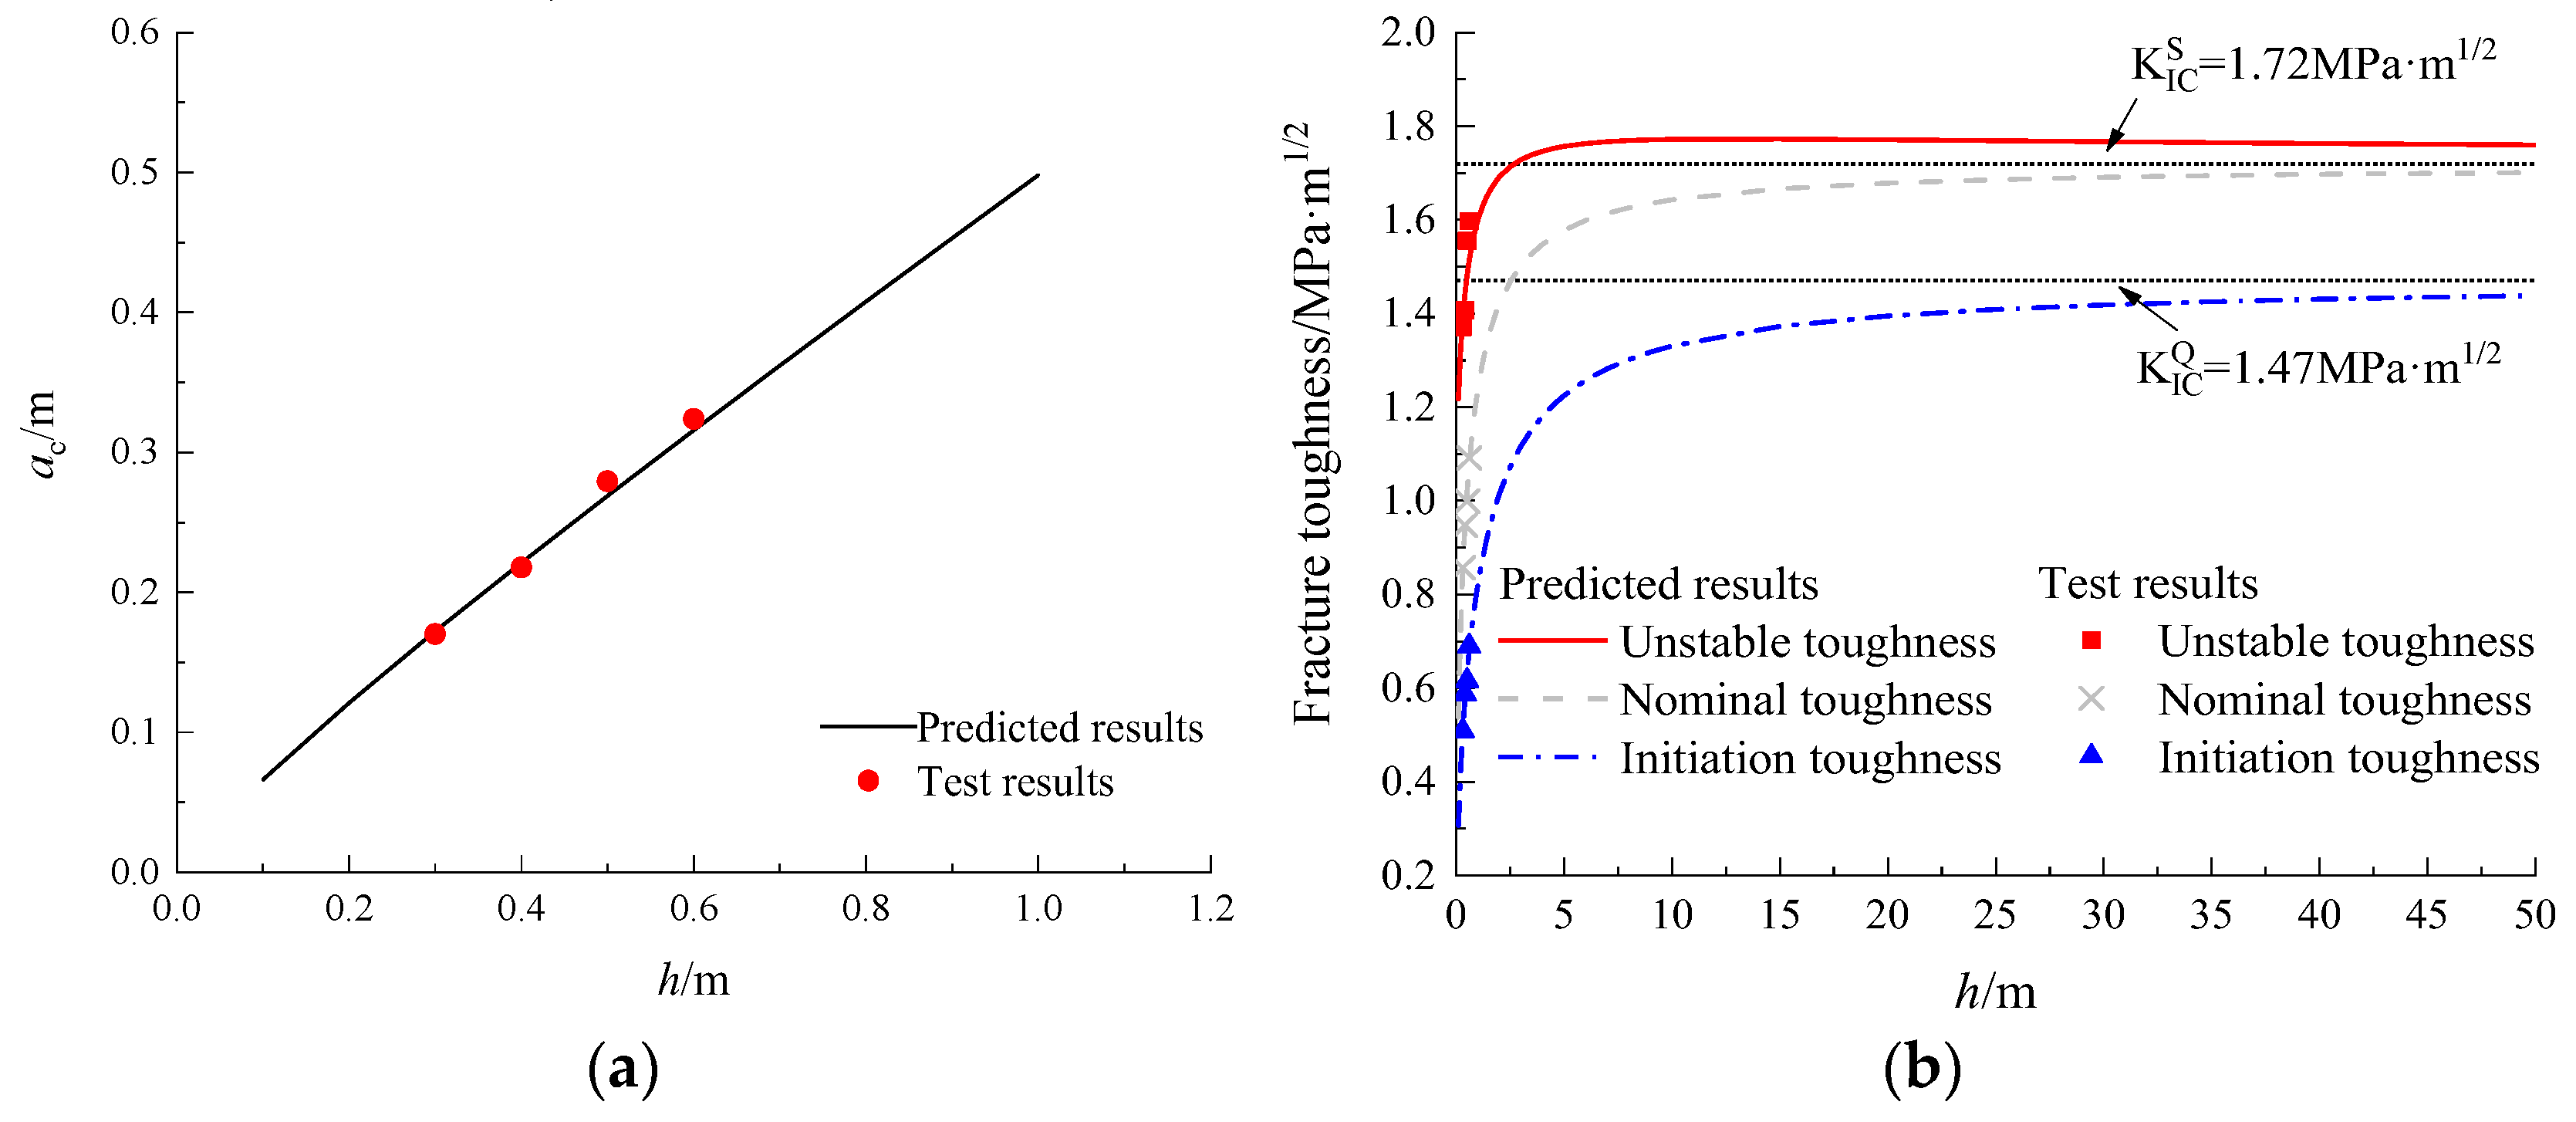
- Based on the wedge-splitting tensile test results of small aggregate concrete and fully graded concrete with limited size or , the size effect model and fracture extreme theory can be used to accurately predict the initiation and peak loads, as well as the initiation and unstable toughness when the size or changes. Furthermore, the prediction accuracy can meet the needs of engineering applications; the mean absolute percentage error is basically below 10%, most of the reliability indices are above 85% and the maximum can reach 100%. It can also be seen from the covariance that the predicted value is positively correlated with the test value.
- (2)
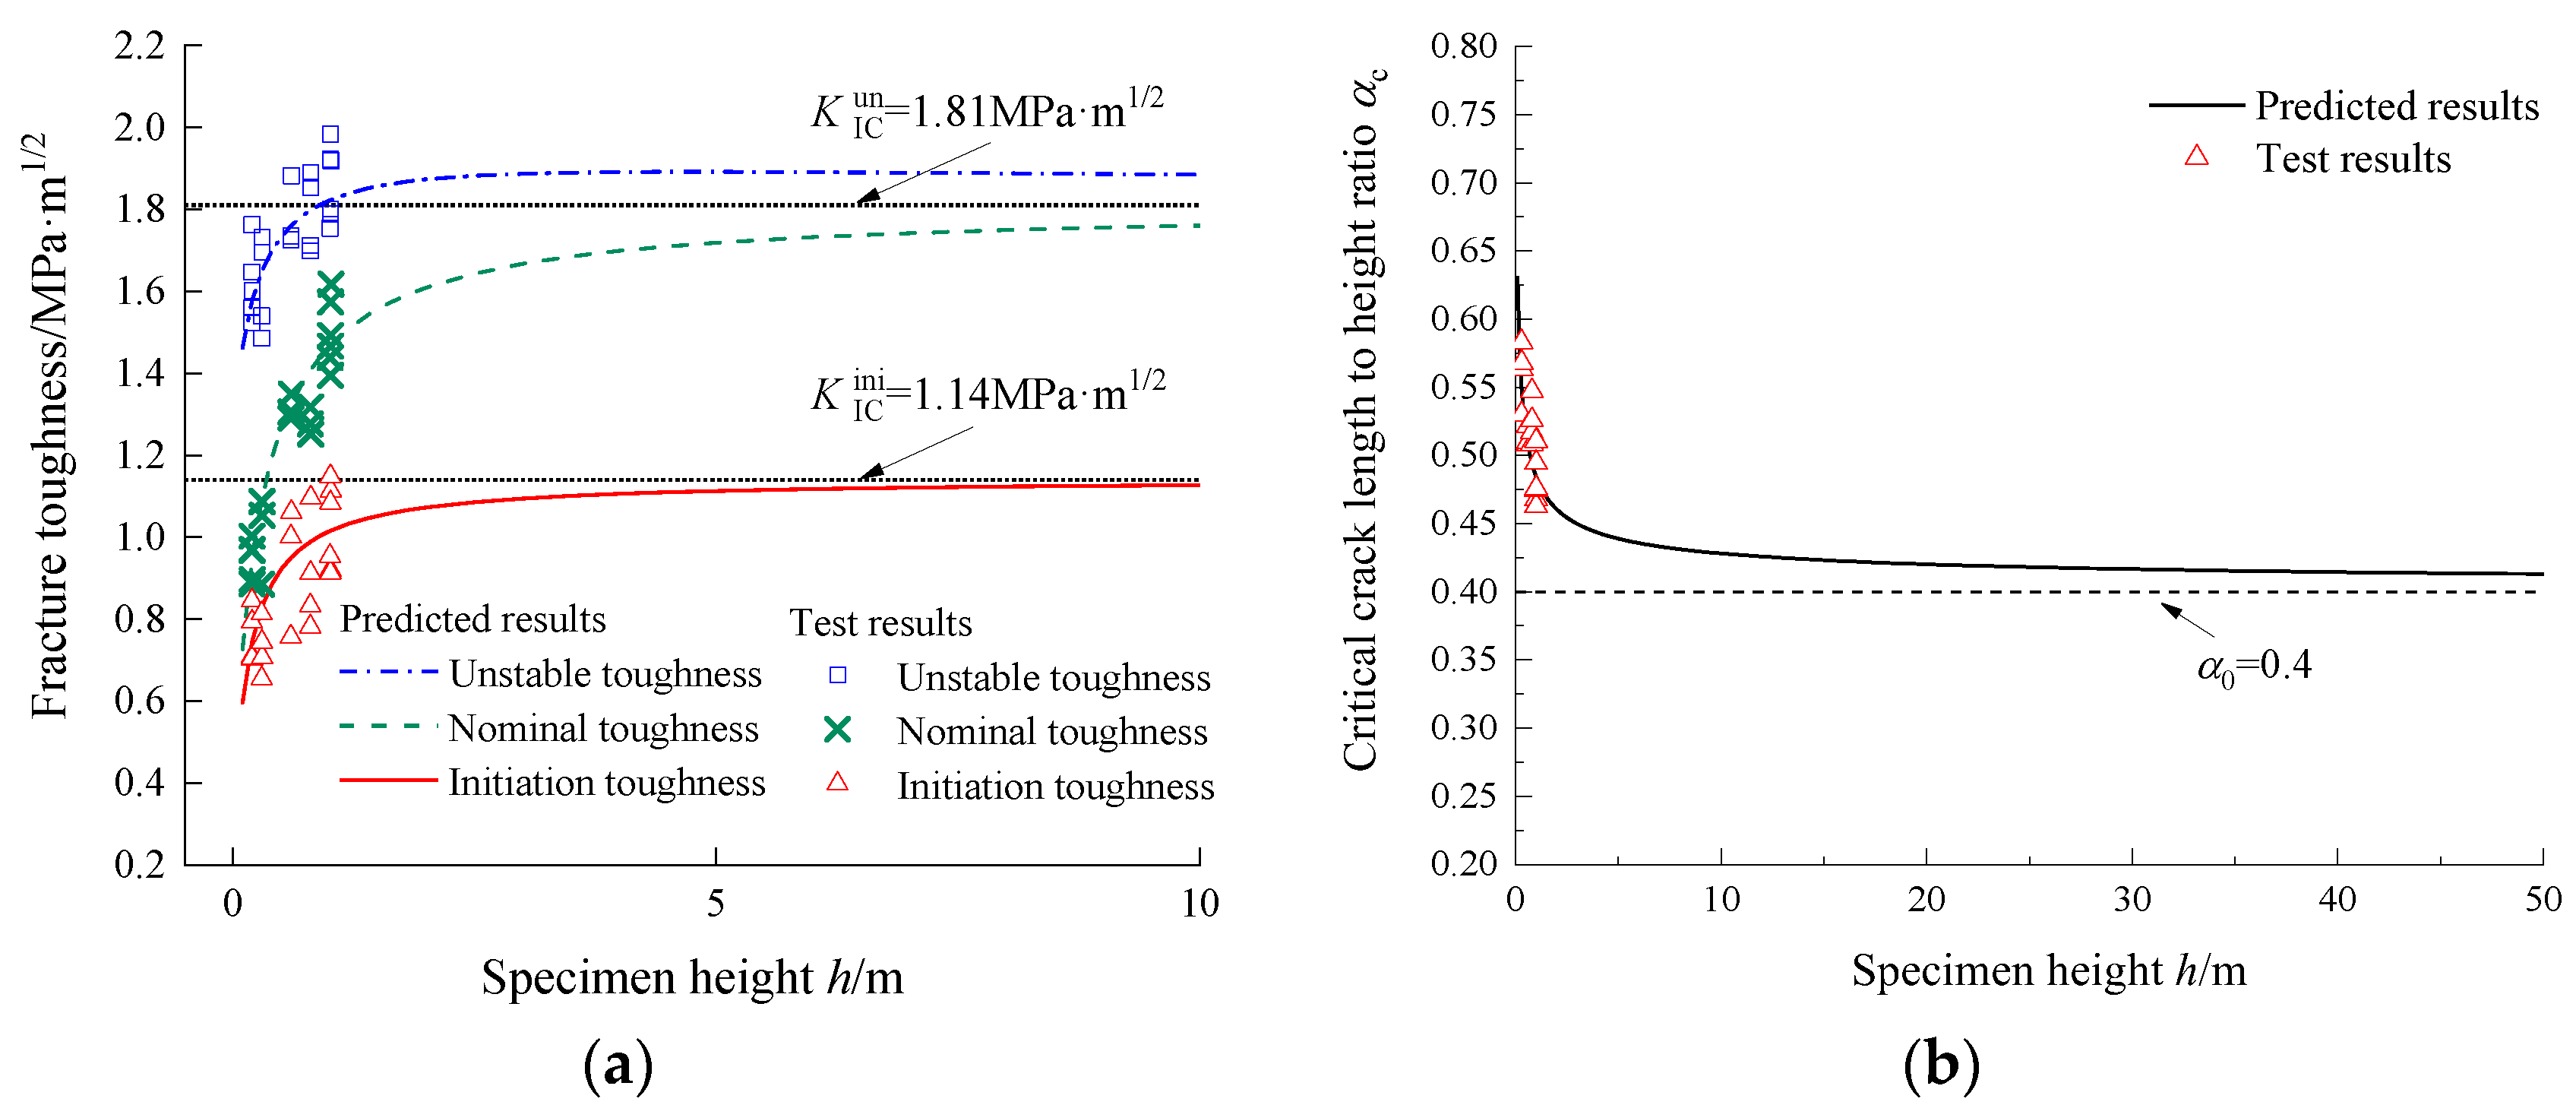
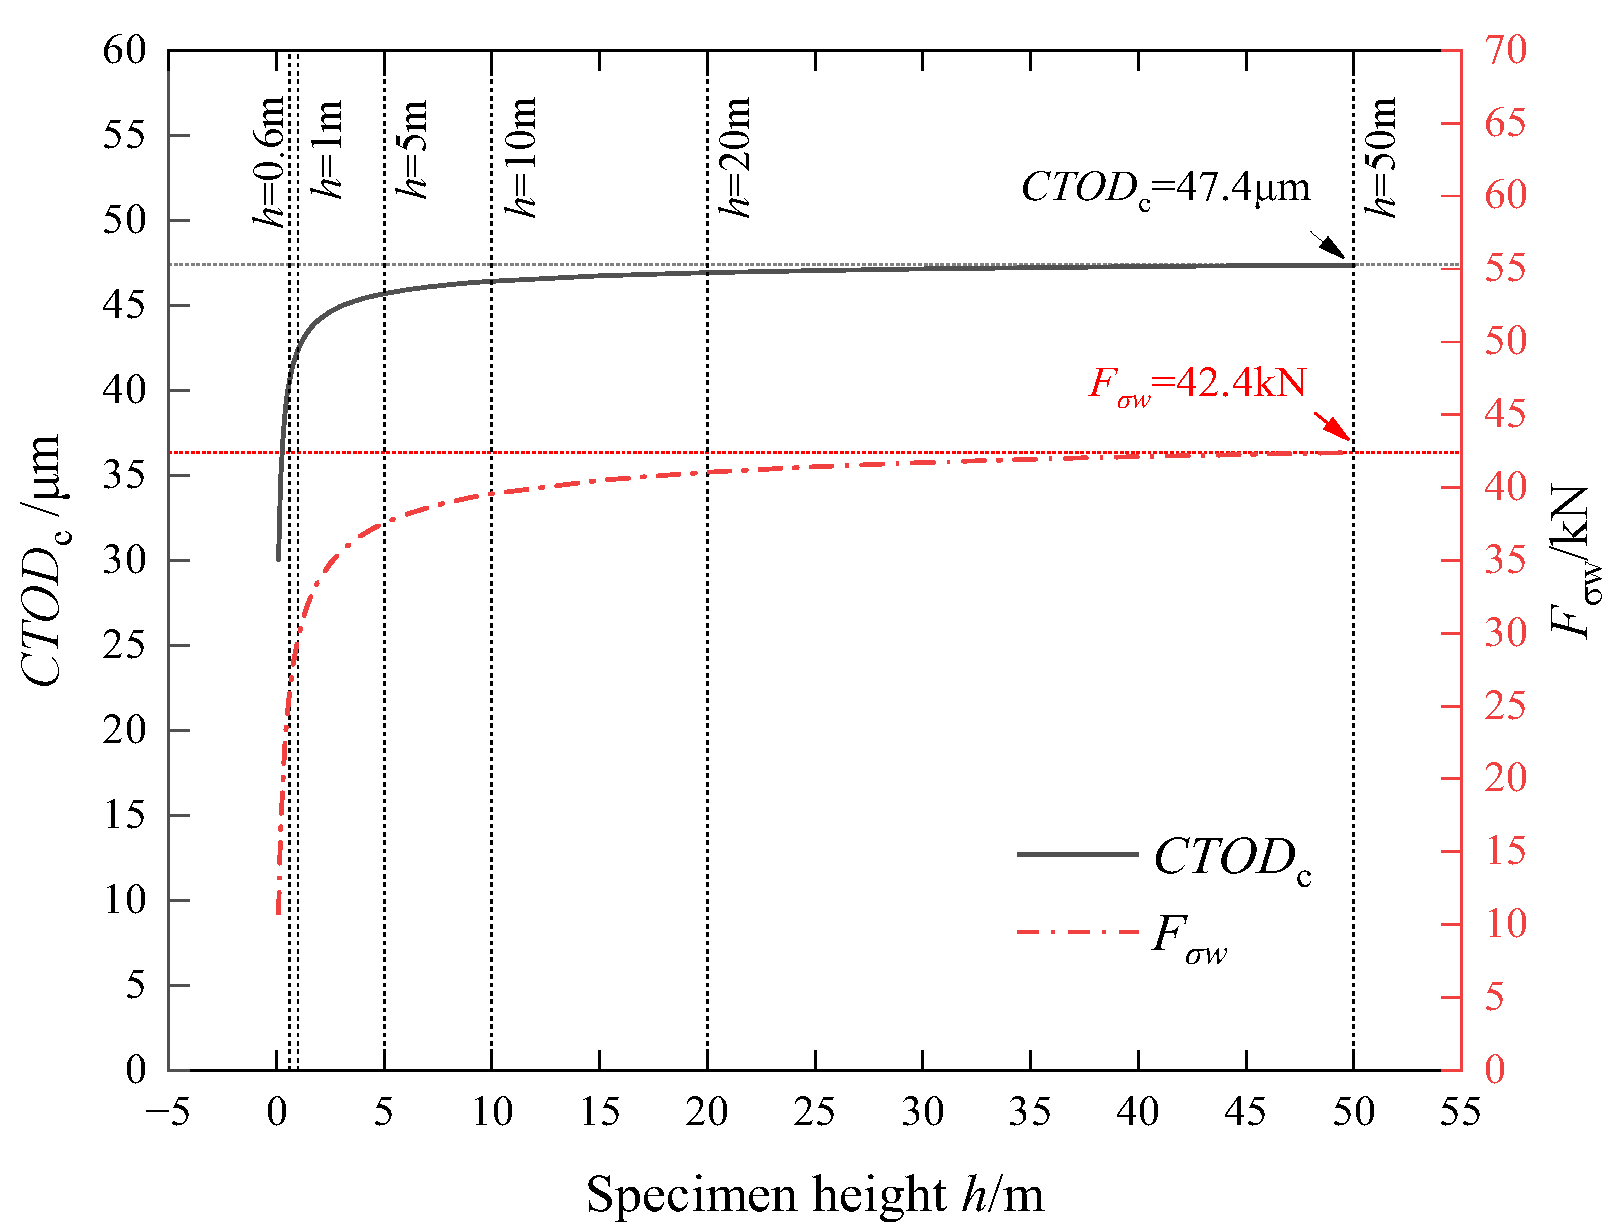
- The , and increased with increased specimen size and gradually stabilized. Furthermore, tends toward as defined in the size effect model. Both and tend toward , and the difference between the two gradually decreases with increased specimen size. The and of the small aggregate concrete in example 1 in this paper are 1.14 MPa·m1/2 and 1.81 MPa·m1/2, respectively, and the and of fully graded concrete are 2.12 MPa·m1/2 and 2.9 MPa·m1/2, respectively.
- (3)
- The research results reported in this paper can provide a theoretical basis for the optimization of the fracture test. In dam engineering, we suggest carrying out fracture tests with limited size and directly; the test results can then be analyzed using the method proposed in this paper. Then, the double-K fracture toughness of fully graded concrete specimens with arbitrary size can be determined. This method can be used for the analysis of the cracking risk and crack stability of dam structures in reality.
Author Contributions
Funding
Data Availability Statement
Conflicts of Interest
Nomenclature
| Initiation toughness | |
| Unstable toughness | |
| FHQ | Initiation load |
| FHmax | Peak load |
| f(α0) | Dimensionless geometric parameter of the specimen |
| Y(α0) | Dimensionless geometric parameter of the specimen |
| ac | Critical crack length |
| αc | Crack length-to-height ratio (αc = ac/h) |
| Nominal initiation strength | |
| Nominal unstable strength | |
| Equivalent nominal initiation strength | |
| Equivalent nominal unstable strength | |
| ae | Equivalent crack length |
| Initiation toughness without size effect | |
| Effective length of the initiation fracture process zone | |
| Unstable toughness without size effect | |
| Effective length of the unstable fracture process zone | |
| Initiation load prediction | |
| Peak load prediction | |
| g′(α0) | Dimensionless geometric parameter of the specimen |
| g(α0) | Dimensionless geometric parameter of the specimen |
| Equivalent geometric parameter related to initiation | |
| Equivalent geometric parameter related to instability | |
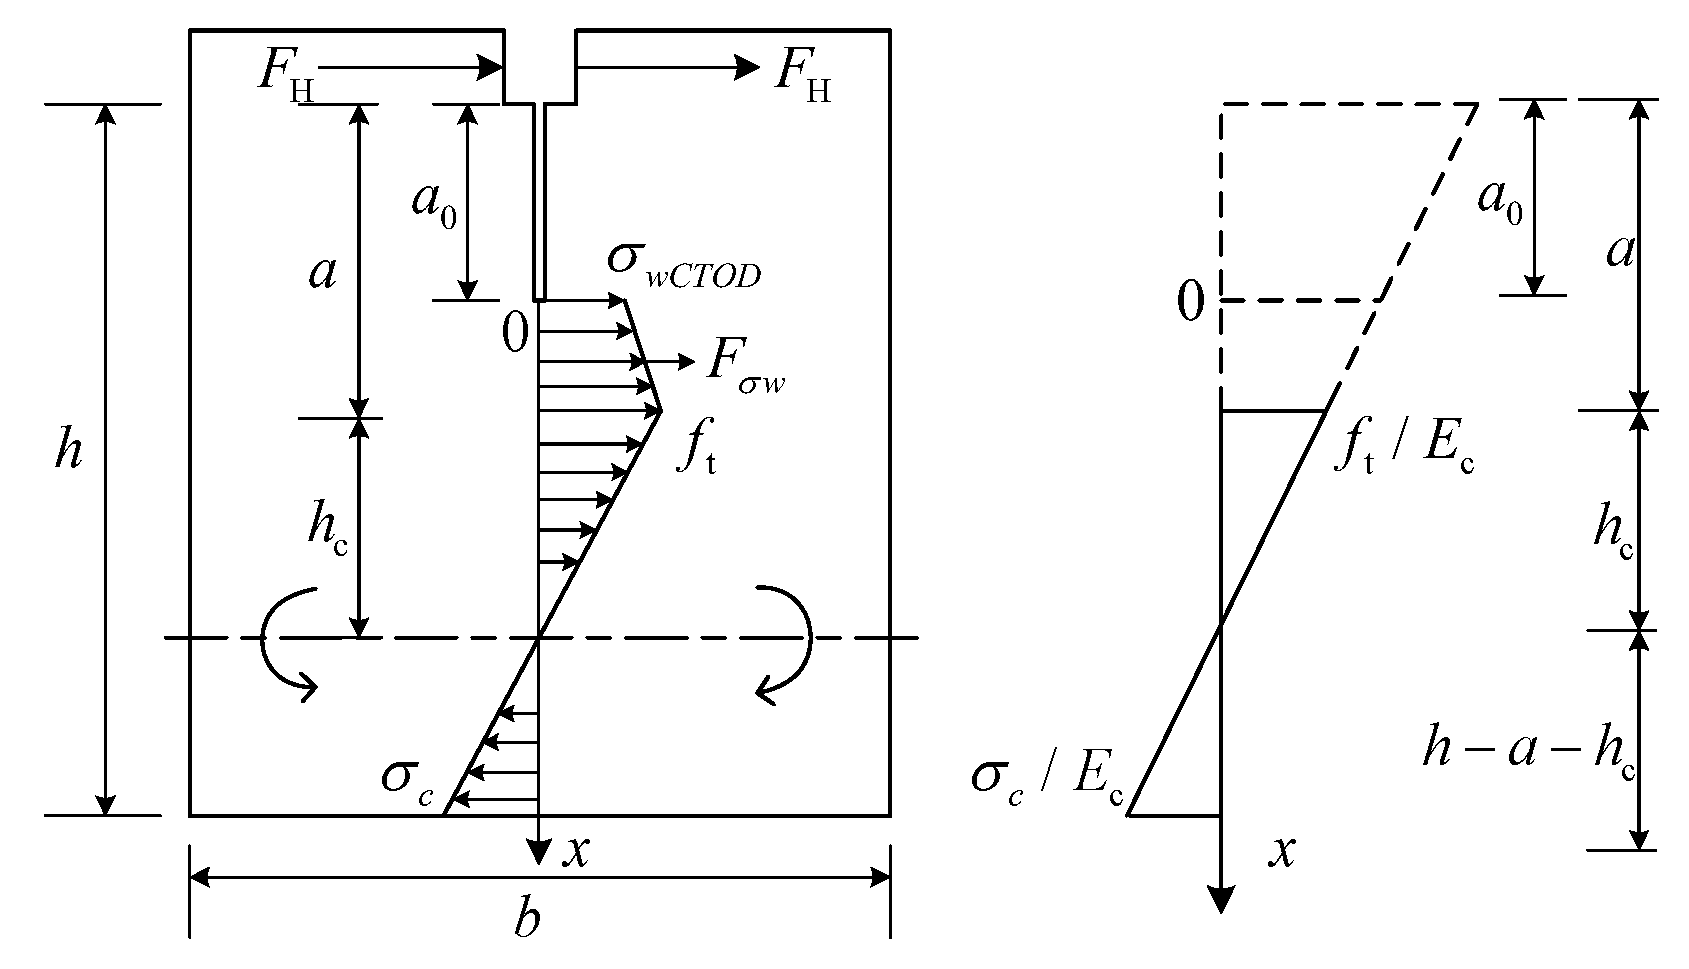
| σc | Compressive stress at the bottom of the specimen |
| t | Thickness of specimen |
| h | Effective height of the specimen |
| a0 | Initial crack length |
| a | Effective crack length |
| hc | Distance from the crack tip to the neutral axis marked by the dotted line |
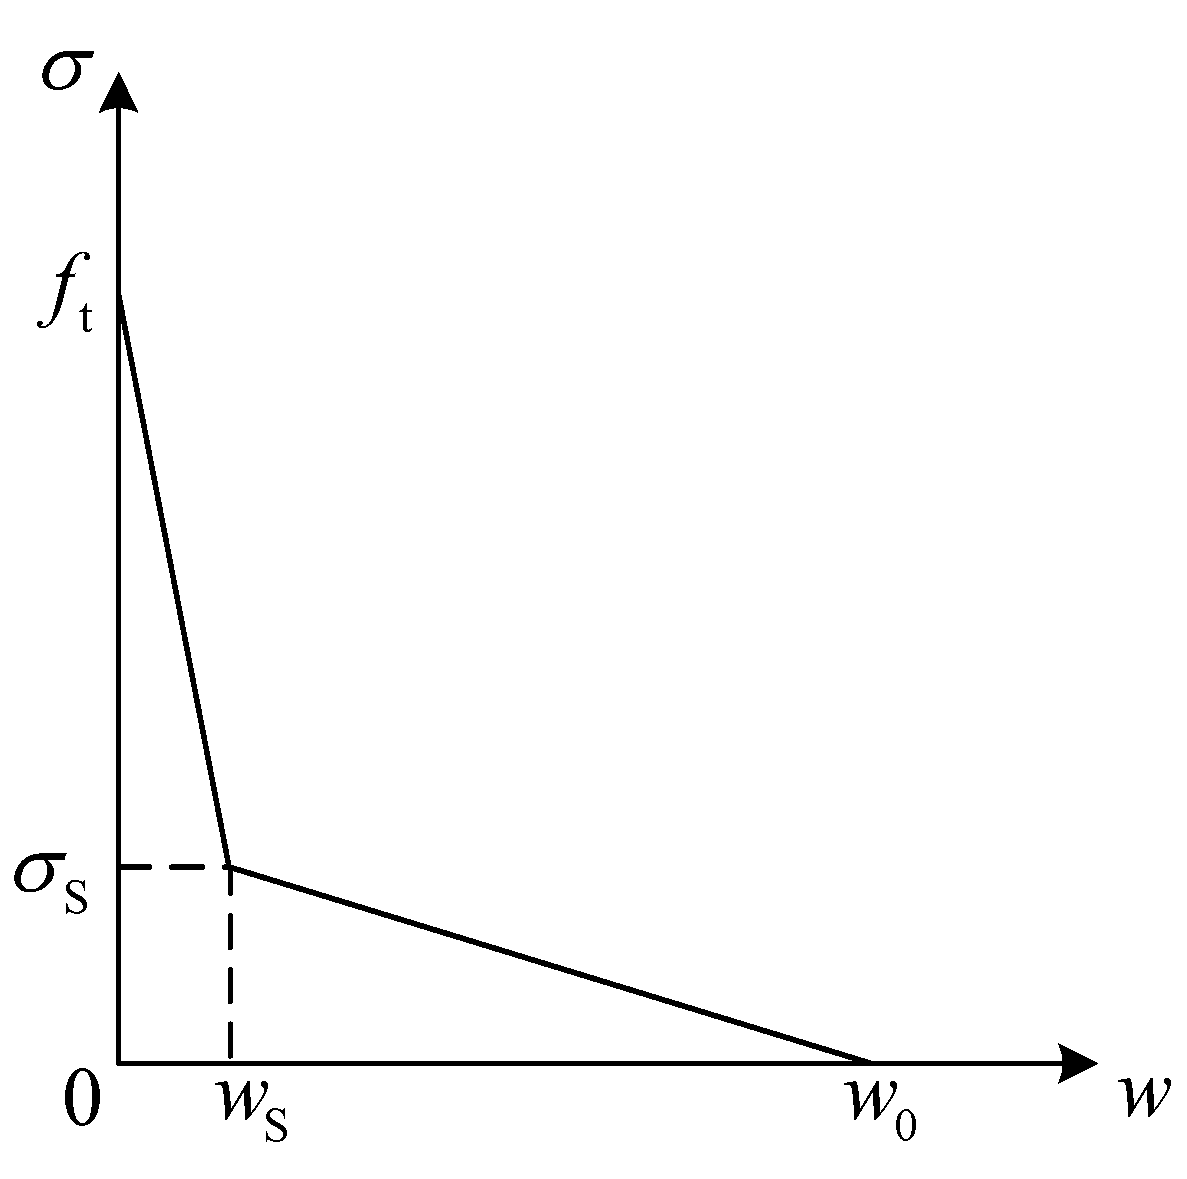
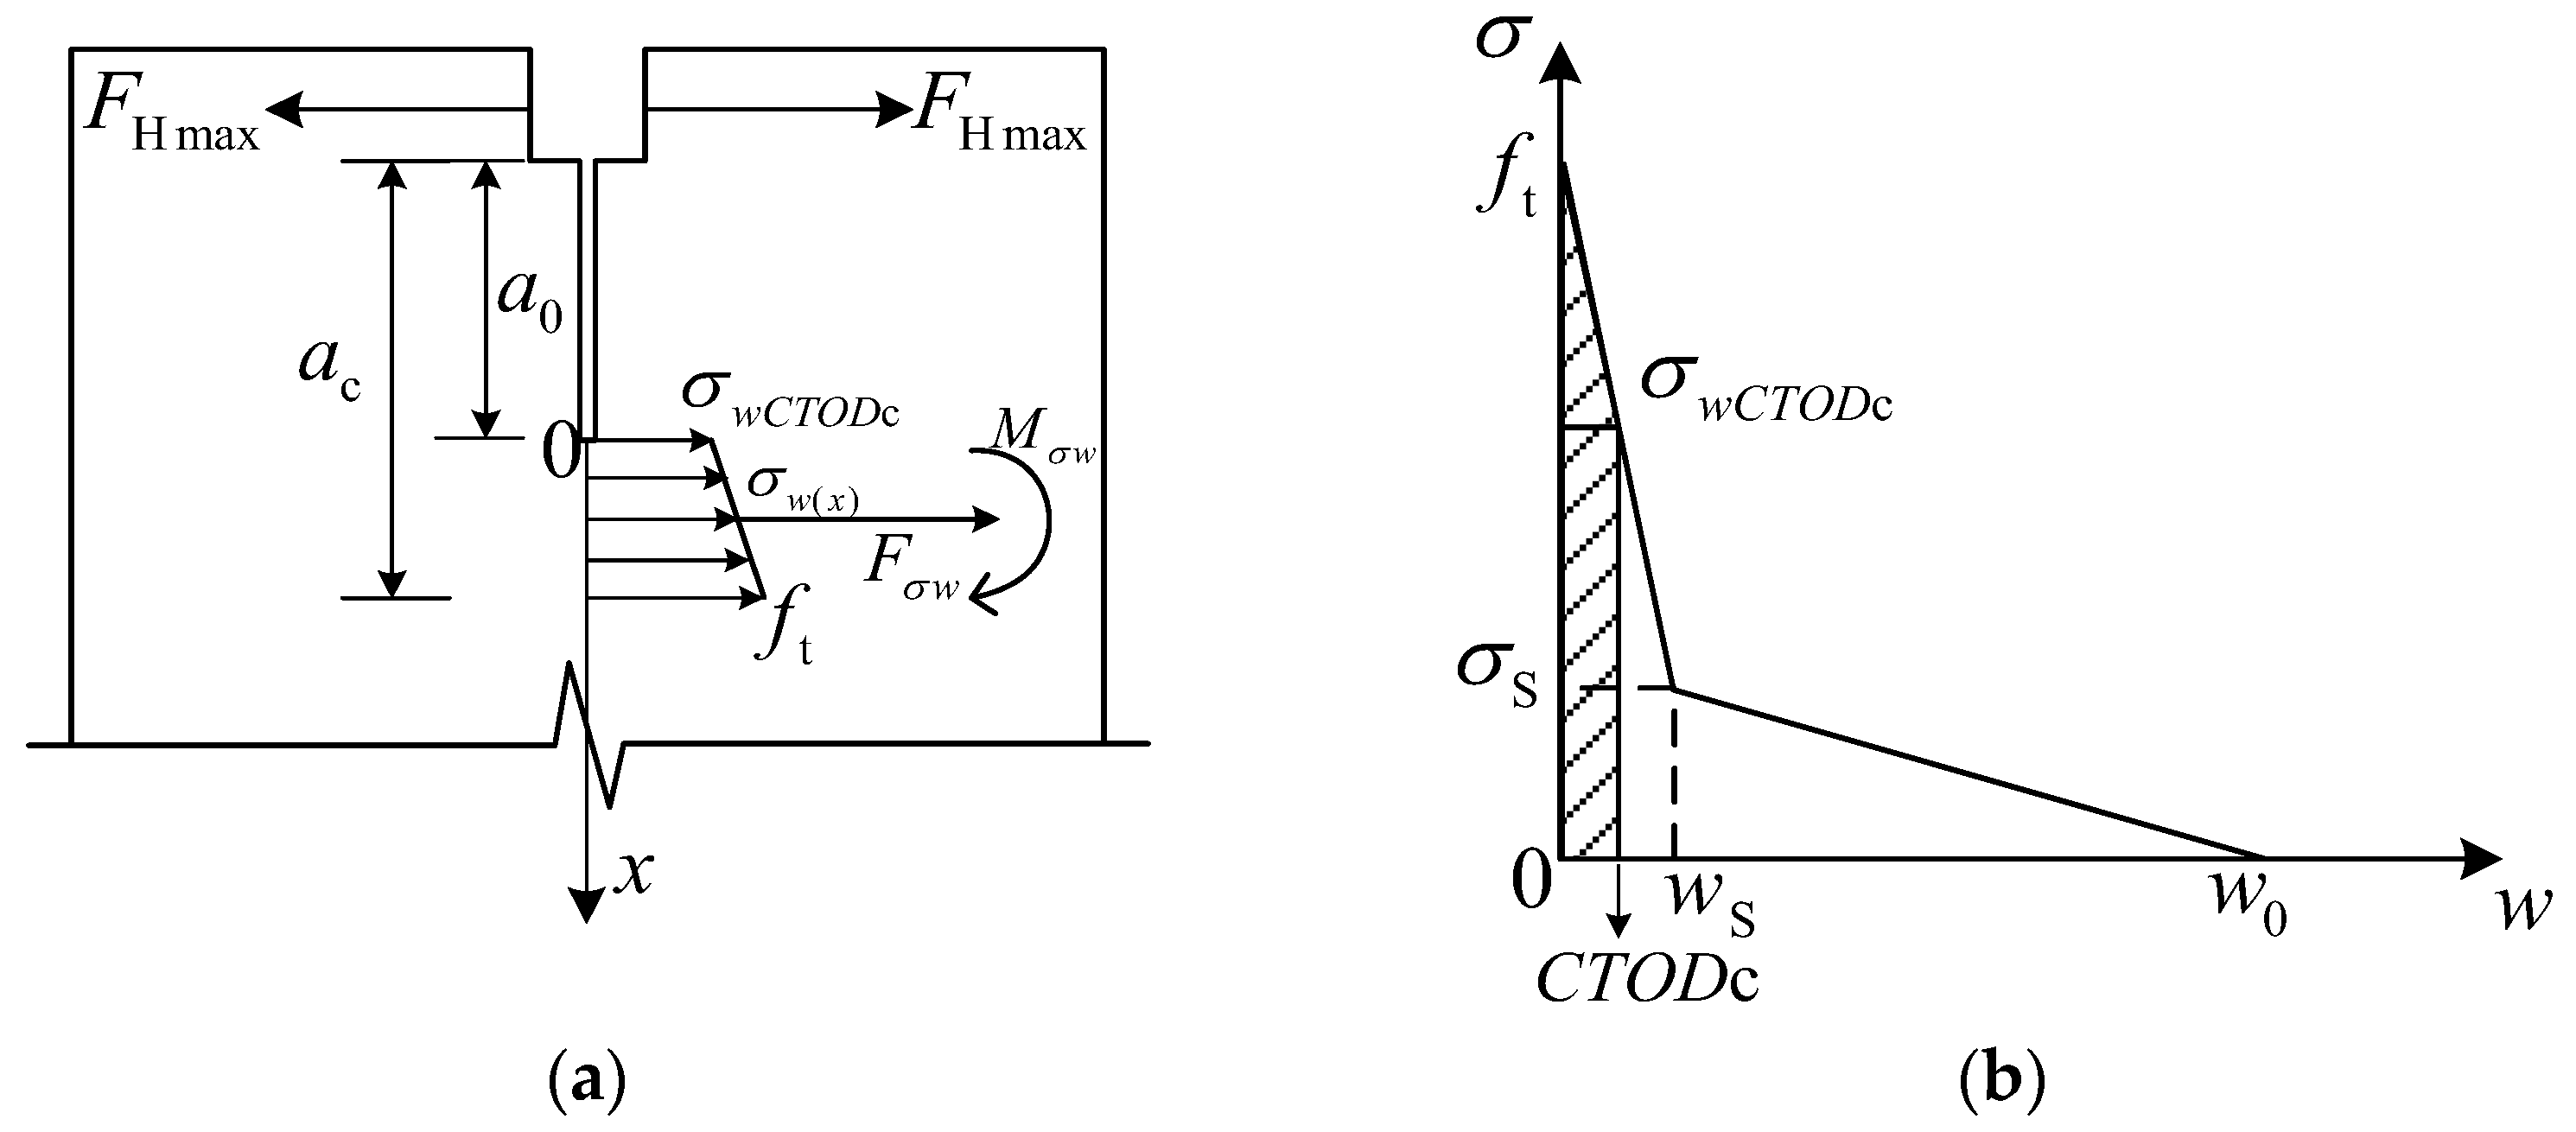
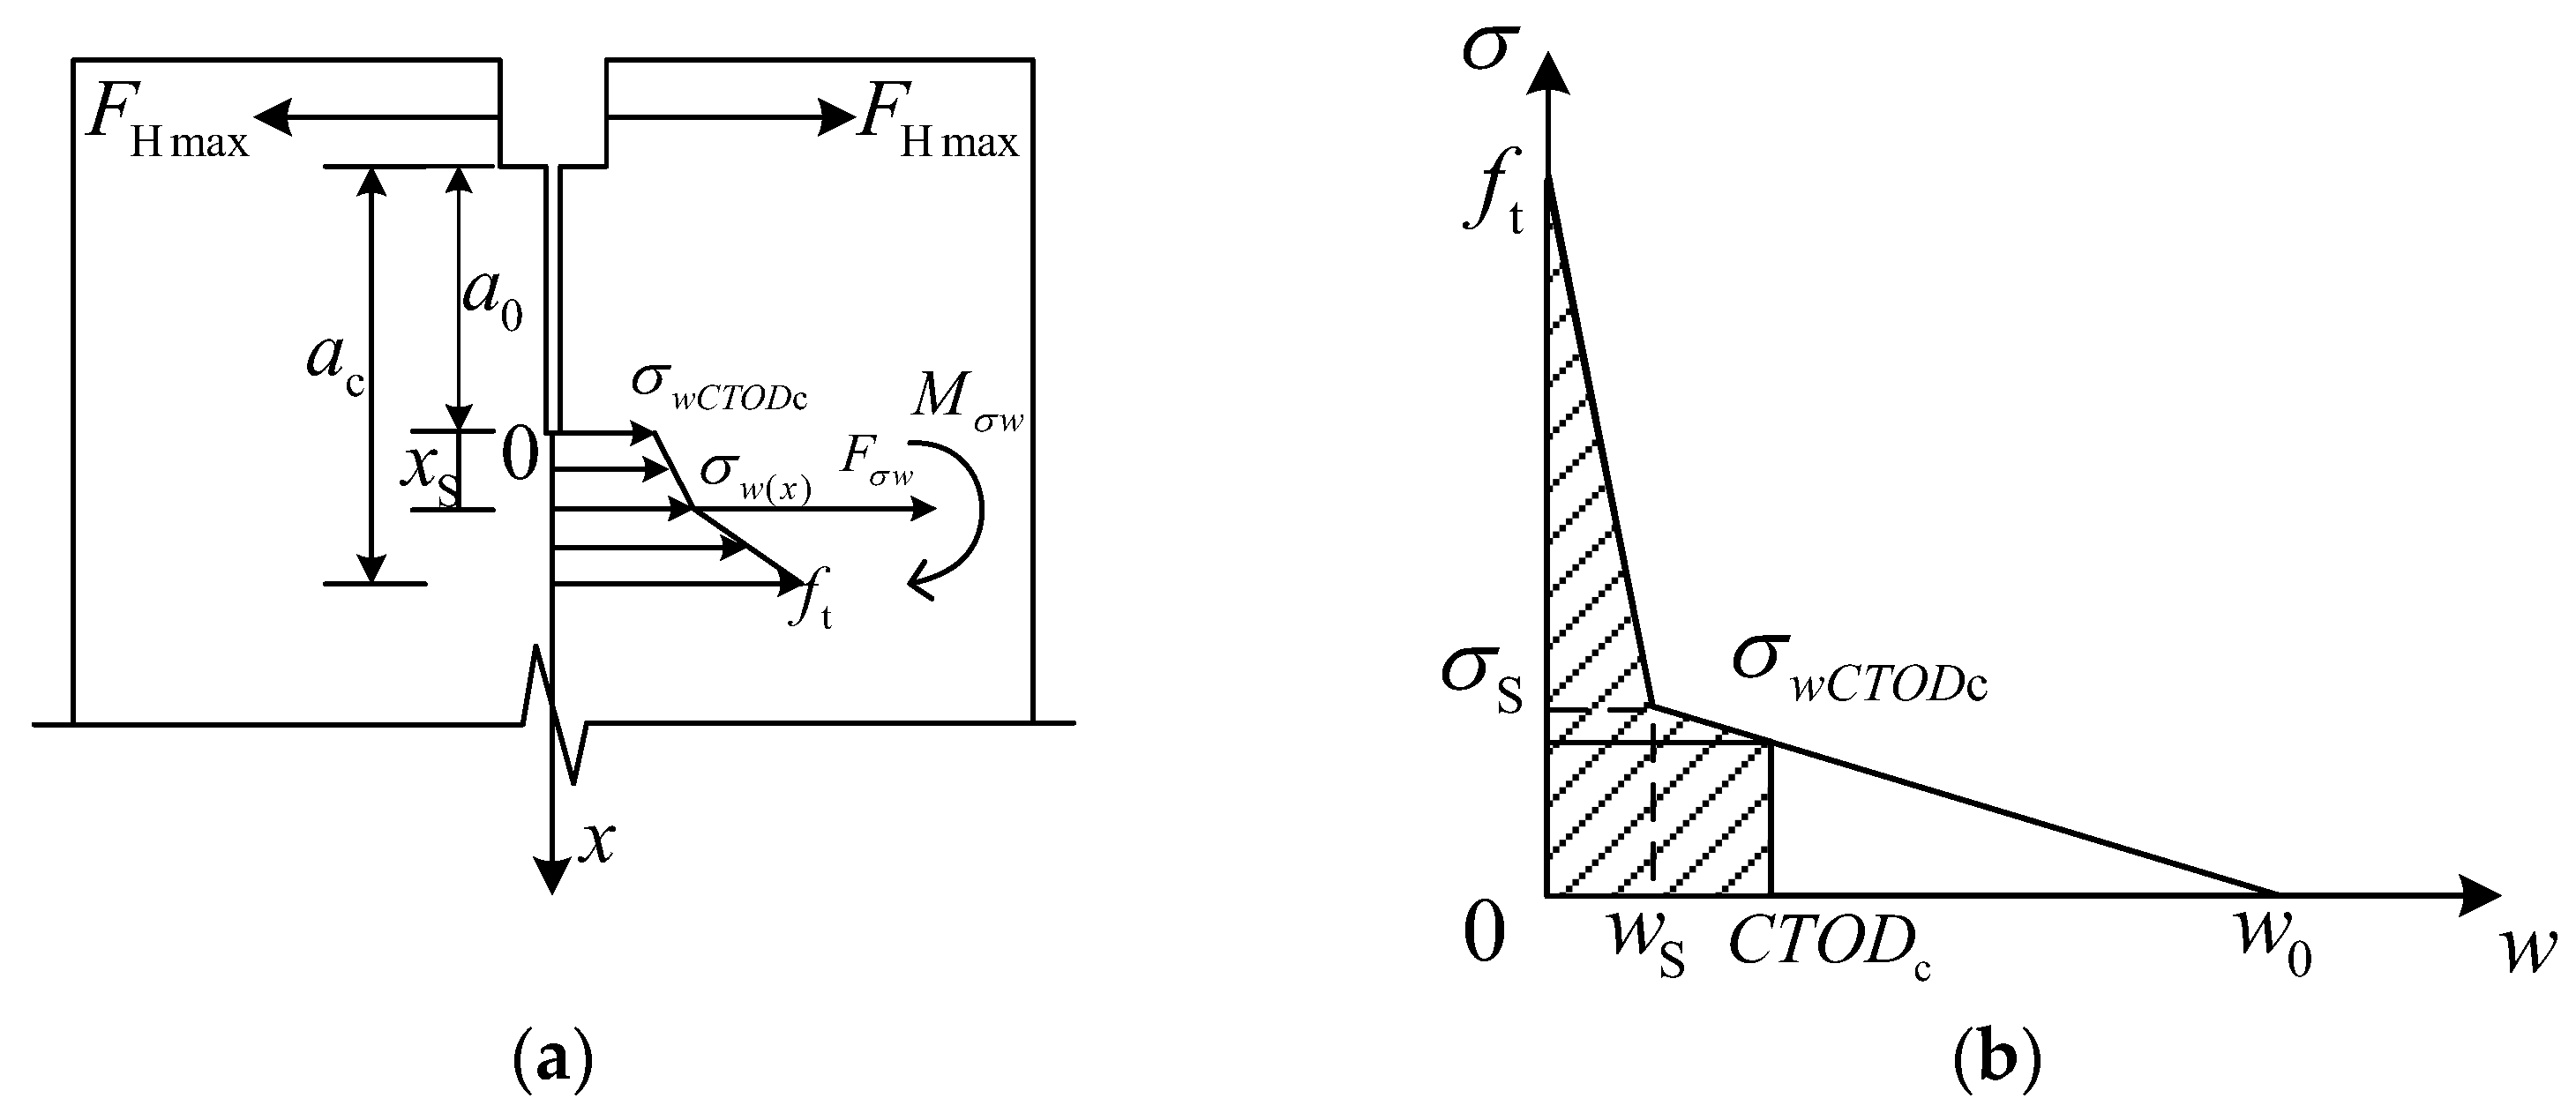
| ft | Equivalent tensile stress at the crack tip |
| σw | Cohesive force in the fracture process zone |
| CTOD | Crack-tip-opening displacement |
| CMOD | Crack-mouth-opening displacement |
| w(x) | Crack-opening displacement at x |
| ws | Crack-opening displacement at the inflection point |
| w0 | Crack-opening displacement at zero cohesion |
| σw(x) | Cohesive force at x |
| σs | Cohesive force at a point |
| RMSE | Root mean square error |
| MAPE | Mean absolute percentage error |
References
- Li, Y.; Zhou, Y.; Wang, R.J.; Li, Y.L.; Wu, X.J.; Si, Z. Experimental investigation on the properties of the interface between RCC layers subjected to early-age frost damage. Cem. Concr. Compos. 2022, 134, 104745. [Google Scholar] [CrossRef]
- Meng, T.; Lian, S.S.; Yu, H.M.; Yang, C.J.; Wang, M.H. Long-term influence of tailings wastewater on mechanical performance and microstructure of dam concrete: A case study in southeastern China. Case Stud. Constr. Mater. 2021, 15, e00720. [Google Scholar] [CrossRef]
- Liu, W.J.; Tan, Y.S.; Li, Q.B.; Yang, N.; Liu, C.F.; Gao, X.F.; Hu, Y.; Niu, X.J.; Zhang, B. Influences of short-term heavy rainfall on interlayer properties and microstructure of concrete dam. Case Stud. Constr. Mater. 2022, 14, e01544. [Google Scholar] [CrossRef]
- Qian, P.; Xu, Q.J. Experimental investigation on properties of interface between concrete layers. Constr. Build. Mater. 2018, 174, 120–129. [Google Scholar] [CrossRef]
- Gao, X.F.; Hu, Y.; Yang, N.; Wu, K.; Li, Q.B. Fracture test and size effect analysis of low-heat cement fully-graded concrete. Eng. Mech. 2022, 39, 183–193. (In Chinese) [Google Scholar] [CrossRef]
- Liu, W.J.; Wang, Y.B.; Li, Q.B.; Gao, X.F.; Tan, Y.S.; Liu, C.F.; Hu, Y.; Niu, X.J. Research on interlayer bonding quality control method of dam concrete based on equivalent age. Materials 2021, 14, 5192. [Google Scholar] [CrossRef]
- Guan, J.F.; Li, Q.B.; Wu, Z.M.; Zhou, S.W. Necessity and Feasible Way of Studying True Fracture Parameters of Super-High Arch Dam Concrete. J. Hydroelectr. Eng. 2014, 33, 152–158. Available online: http://www.slfdxb.cn/CN/Y2014/V33/I5/152 (accessed on 15 July 2022). (In Chinese).
- Kim, J.K.; Yun, L.; Yi, S.T. Fracture characteristics of concrete at early ages. Cem. Concr. Res. 2004, 34, 507–519. [Google Scholar] [CrossRef]
- Xu, S.L.; Zhao, Y.H.; Wu, Z.M.; Gao, H.B. The experimental study on the fracture energy of concrete using wedge splitting specimens. J. Hydroelectr. Eng. 2003, 15–22. (In Chinese) [Google Scholar] [CrossRef]
- Hoover, C.G.; Bažant, Z.P. Comprehensive concrete fracture tests: Size effects of Types 1 & 2, crack length effect and postpeak. Eng. Fract. Mech. 2013, 110, 281–289. [Google Scholar] [CrossRef]
- Beygi, M.H.A.; Kazemi, M.T.; Nikbin, I.M.; Amiri, J.V. The effect of water to cement ratio on fracture parameters and brittleness of self-compacting concrete. Mater. Des. 2013, 50, 267–276. [Google Scholar] [CrossRef]
- Zhang, G.H.; Li, Z.L.; Nie, K.Y.; Liu, M.H. Experimental study on fracture toughness of concrete with different moisture contents. J. Hydroelectr. Eng. 2016, 109–116. (In Chinese) [Google Scholar] [CrossRef]
- Xu, S.L.; Li, Q.H.; Wu, Y.; Dong, L.X.; Lyu, Y.; Reinhardt, H.W.; Christopher, K.Y.L.; Ruiz, G.; Kumar, S.; Hu, S.W. Determination of double-K criterion for crack propagation in quasi-brittle fracture, Part II: Analytical evaluating and practical measuring methods for three-point bending notched beams. Int. J. Fract. 1999, 98, 151–177. [Google Scholar] [CrossRef]
- Xu, S.L.; Reinhardt, H.W. Determination of double-K criterion for crack propagation in quasi-brittle fracture Part I: Experimental investigation of crack propagation. Int. J. Fract. 1999, 98, 111–149. [Google Scholar] [CrossRef]
- Xu, S.L.; Reinhardt, H.W. Determination of double-K criterion for crack propagation in quasi-brittle fracture, Part III: Compact tension specimens and wedge splitting specimens. Int. J. Fract. 1999, 98, 179–193. [Google Scholar] [CrossRef]
- Norm for Fracture Test of Hydraulic Concrete; China Electric Power Press: Beijing, China, 2005. (In Chinese)
- Xu, S.L.; Li, Q.H.; Wu, Y.; Dong, L.X.; Lyu, Y.; Reinhardt, H.W.; Christopher, K.Y.L.; Ruiz, G.; Kumar, S.; Hu, S.W. RILEM Standard: Testing methods for determination of the double-K criterion for crack propagation in concrete using wedge-splitting tests and three-point bending beam tests, recommendation of RILEM TC265-TDK. Mater. Struct. 2021, 54, 1–11. [Google Scholar] [CrossRef]
- Alam, S.Y.; Zhu, R.; Loukili, A. A new way to analyse the size effect in quasi-brittle materials by scaling the heterogeneity size. Eng. Fract. Mech. 2020, 225, 106864. [Google Scholar] [CrossRef]
- Pirooznia, A.; Moradloo, A. Investigation of size effect and smeared crack models in ordinary and dam concrete fracture tests. Eng. Fract. Mech. 2020, 226, 106863. [Google Scholar] [CrossRef]
- Yin, Y.Y.; Hu, S.W. Double-K fracture parameters of concrete in three point bending beams with small span-depth ratios. Eng. Mech. 2020, 37, 138–146. (In Chinese) [Google Scholar] [CrossRef]
- Guan, J.F.; Li, Q.B.; Wu, Z.M.; Zhao, S.B.; Dong, W.; Zhou, S.W. Minimum specimen size for fracture parameters of site-casting dam concrete. Constr. Build. Mater. 2015, 93, 973–982. [Google Scholar] [CrossRef]
- Guan, J.F.; Li, Q.B.; Wu, Z.M.; Dong, W. Determination of minimum size for double K fracture parameters of site-casting fully-graded hydraulic concrete. J. Basic Sci. Eng. 2016, 24, 1219–1231. (In Chinese) [Google Scholar] [CrossRef]
- Guan, J.F. Fracture parameters of site-cast dam and sieved concrete. Mag. Concr. Res. 2016, 68, 43–54. [Google Scholar] [CrossRef]
- Hu, X.Z.; Duan, K. Size effect and quasi-brittle fracture: The role of FPZ. Int. J. Fract. 2008, 154, 3–14. [Google Scholar] [CrossRef]
- Hu, X.Z. An asymptotic approach to size effect on fracture toughness and fracture energy of composites. Eng. Fract. Mech. 2002, 69, 555–564. [Google Scholar] [CrossRef]
- Hu, X.Z.; Wittmann, F. Size effect on toughness induced by crack close to free surface. Eng. Fract. Mech. 2000, 65, 209–221. [Google Scholar] [CrossRef]
- Bažant, Z.P. Size effect in blunt fracture: Concrete, rock, metal. J. Eng. Mech. 1984, 110, 518–535. [Google Scholar] [CrossRef]
- Bažant, Z.P. Scaling theory for quasibrittle structural failure. Proc. Natl. Acad. Sci. USA 2004, 101, 13400–13407. [Google Scholar] [CrossRef] [Green Version]
- Hoover, C.G.; Bažant, Z.P. Comparison of the Hu-Duan boundary effect model with the size-shape effect law for quasi-brittle fracture based on new comprehensive fracture tests. J. Eng. Mech. 2014, 140, 480–486. [Google Scholar] [CrossRef] [Green Version]
- Guan, J.F.; Yuan, P.; Hu, X.Z.; Qing, L.B.; Yao, X.H. Statistical analysis of concrete fracture using normal distribution pertinent to maximum aggregate size. Theor. Appl. Fract. Mech. 2019, 101, 236–253. [Google Scholar] [CrossRef]
- Yao, X.H.; Li, L.L.; Guan, J.F.; Zhang, M.; Liu, Z.P.; Han, R.C.; He, S.H. Initial cracking strength and initial fracture toughness from three-point bending and wedge splitting concrete specimens. Fatigue Fract. Eng. Mater. Struct. 2021, 44, 601–621. [Google Scholar] [CrossRef]
- Guan, J.F.; Liu, Z.P.; Yao, X.H.; Li, L.L.; He, S.H.; Zhang, M. Determination of the cracking strength tensile strength and double-K fracture parameters of concrete. Eng. Mech. 2020, 37, 124–137. (In Chinese) [Google Scholar] [CrossRef]
- Guan, J.F.; Yin, Y.N.; Li, Y.; Yao, X.H.; Li, L.L. A design method for determining fracture toughness and tensile strength pertinent to concrete sieving curve. Eng. Fract. Mech. 2022, 271, 108596. [Google Scholar] [CrossRef]
- Guan, J.F.; Li, C.M.; Wang, J.; Qing, L.B.; Song, Z.K.; Liu, Z.P. Determination of fracture parameter and prediction of structural fracture using various concrete specimen types. Theor. Appl. Fract. Mech. 2019, 100, 114–127. [Google Scholar] [CrossRef]
- Wu, Z.M.; Yang, S.T.; Hu, X.Z.; Zheng, J.J. An analytical model to predict the effective fracture toughness of concrete for three-point bending notched beams. Eng. Fract. Mech. 2006, 73, 2166–2191. [Google Scholar] [CrossRef]
- Wu, Z.M.; Yang, S.T.; Zheng, J.J. Analytical method for predicting effective fracture toughness of concrete and its size effect. J. Hydraul. Eng. 2006, 795–800. (In Chinese) [Google Scholar] [CrossRef]
- Qing, L.B.; Cheng, Y.H.; Guan, J.F. Simplified extreme method for determining initiation toughness of dam concrete. J. Hydroelectr. Eng. 2018, 37, 93–100. (In Chinese) [Google Scholar] [CrossRef]
- Qing, L.B.; Cheng, Y.H.; Fan, X.Q.; Mu, R.; Ding, S.Q. An arc bending notched specimen for determining the mechanical and fracture parameters of concrete based on the FET. Eng. Fract. Mech. 2019, 220, 106639. [Google Scholar] [CrossRef]
- Li, Y.; Qing, L.B.; Cheng, Y.H.; Ma, G.W. Determining the tensile strength of concrete for wedge splitting specimens based on the fracture extreme theory. Theor. Appl. Fract. Mech. 2020, 108, 102654. [Google Scholar] [CrossRef]
- Qing, L.B.; Dong, M.W.; Guan, J.F. Determining initial fracture toughness of concrete for split-tension specimens based on the extreme theory. Eng. Fract. Mech. 2018, 189, 427–438. [Google Scholar] [CrossRef]
- Qing, L.B.; Cheng, Y.H. The fracture extreme theory for determining the effective fracture toughness and tensile strength of concrete. Theor. Appl. Fract. Mech. 2018, 96, 461–467. [Google Scholar] [CrossRef]
- Nie, Y.T.; Qing, L.B. The relationship between double-K parameters of concrete based on fracture extreme theory. J. Theor. Appl. Mech. 2020, 58, 59–71. [Google Scholar] [CrossRef]
- Li, Y.; Qing, L.B.; Cheng, Y.H.; Dong, M.W.; Ma, G.W. A general framework for determining fracture parameters of concrete based on fracture extreme theory. Theor. Appl. Fract. Mech. 2019, 102259. [Google Scholar] [CrossRef]
- Qing, L.B.; Su, Y.M.; Dong, M.W.; Cheng, Y.H.; Li, Y. Size effect on double-K fracture parameters of concrete based on fracture extreme theory. Arch. Appl. Mech. 2020, 427–442. Available online: https://link.springer.com/article/10.1007/s00419-020-01781-5 (accessed on 15 July 2022).
- Qing, L.B.; Li, Q.B. A theoretical method for determining initiation toughness based on experimental peak load. Eng. Fract. Mech. 2013, 295–305. [Google Scholar] [CrossRef]
- Qing, L.B.; Tian, W.L.; Wang, J. Predicting unstable toughness of concrete based on initial toughness criterion. J. Zhejiang Univ. -Sci. A 2014, 15, 138–148. [Google Scholar] [CrossRef] [Green Version]
- Qing, L.B.; Nie, Y.T.; Wang, J.; Hu, Y. A simplified extreme method for determining double-K fracture parameters of concrete using experimental peak load. Fatigue Fract. Eng. Mater. Struct. 2017, 40, 254–266. [Google Scholar] [CrossRef]
- Gao, X.F.; Liu, C.F.; Tan, Y.S.; Yang, N.; Qiao, Y.; Hu, Y.; Li, Q.B.; Koval, G.; Chazallon, C. Determination of Fracture Properties of Concrete Using Size and Boundary Effect Models. Appl. Sci. 2019, 9, 1337. [Google Scholar] [CrossRef] [Green Version]
- Qing, L.B.; Li, Q.B.; Guan, J.F.; Wang, J. Study of concrete fracture process zone based on fictitious crack model. Eng. Mech. 2012, 29, 112–116,132. (In Chinese) [Google Scholar] [CrossRef]
- Wittmann, F.H.; Rokugo, K.; Brühwiler, E.; Mihashi, H.; Simonin, P. Fracture energy and strain softening of concrete as determined by means of compact tension specimens. Mater. Struct. 1988, 21, 21–32. [Google Scholar] [CrossRef]
- Li, Q.B.; Deng, Z.C.; Fu, H. Effect of aggregate type on mechanical behavior of dam concrete. ACI Mater. J. 2004, 101, 483–492. Available online: https://www.concrete.org/publications/internationalconcreteabstractsportal/m/details/id/13487 (accessed on 15 July 2022).
- CEB-FIP Model Code 1990. Programs Usenix Unix Supplementary Documents. UK; Redwood Books: Coconut Creek, FL, USA, 1993.
- Reinhardt, H.W.; Cornelissen, H.; Hordijk, D.A. Tensile tests and failure analysis of concrete. J. Struct. Eng. 1986, 112, 2462–2477. [Google Scholar] [CrossRef]
- Ding, X.T.; Ding, X.; Liu, H.X.; Zheng, Y. Comparison study on softening curve of concrete by direct tension test and three-point bending fracture test. Water Resour. Power 2014, 32, 116–118; 156. (In Chinese) [Google Scholar]
- Zhang, X.F.; Xu, S.L. A comparative study on five approaches to evaluate double-K fracture toughness parameters of concrete and size effect analysis. Eng. Fract. Mech. 2011, 78, 2115–2138. [Google Scholar] [CrossRef]
- Hu, S.W.; Xie, J.F. Experimental research and size effect analysis of fracture parameter of nonstandard wedge splitting tensile specimen. Water Resour. Power 2015, 33, 105–108. (In Chinese) [Google Scholar]
- Du, M.; Wu, L.; Zhang, J.M. Effect of different initial crack-depth ratios and aggregate size on fracture properties of low-heated concrete. Concrete 2020, 14–17. (In Chinese) [Google Scholar] [CrossRef]


| Specimen Number | h/m | b/m | α0 | FHQ/kN | FHmax/kN |
|---|---|---|---|---|---|
| 200-1 | 0.20 | 0.20 | 0.40 | 7.85 | 10.02 |
| 200-2 | 0.20 | 0.20 | 0.40 | 7.81 | 10.69 |
| 200-3 | 0.20 | 0.20 | 0.40 | 7.65 | 9.62 |
| 200-4 | 0.20 | 0.20 | 0.40 | 9.27 | 10.60 |
| 200-6 | 0.20 | 0.20 | 0.40 | 8.65 | 10.93 |
| 300-1 | 0.30 | 0.20 | 0.40 | 9.97 | 15.33 |
| 300-2 | 0.30 | 0.20 | 0.40 | 10.45 | 14.78 |
| 300-3 | 0.30 | 0.20 | 0.48 | 10.00 | 12.56 |
| 300-4 | 0.30 | 0.20 | 0.40 | 11.31 | 15.12 |
| 300-5 | 0.30 | 0.20 | 0.40 | 8.90 | 12.06 |
| 600-1 | 0.60 | 0.21 | 0.40 | 20.47 | 26.68 |
| 600-2 | 0.61 | 0.22 | 0.44 | 19.20 | 28.13 |
| 600-3 | 0.60 | 0.22 | 0.40 | 15.84 | 27.02 |
| 600-4 | 0.60 | 0.22 | 0.40 | 22.90 | 29.12 |
| 600-5 | 0.60 | 0.21 | 0.48 | 28.17 | 28.66 |
| 600-6 | 0.61 | 0.21 | 0.44 | 26.49 | 31.50 |
| 800-1 | 0.81 | 0.24 | 0.43 | 31.47 | 34.69 |
| 800-2 | 0.81 | 0.25 | 0.40 | 30.64 | 34.99 |
| 800-3 | 0.80 | 0.24 | 0.40 | 20.65 | 33.72 |
| 800-4 | 0.80 | 0.24 | 0.40 | 22.56 | 33.96 |
| 800-5 | 0.80 | 0.23 | 0.45 | 33.90 | 37.83 |
| 800-6 | 0.80 | 0.23 | 0.40 | 23.72 | 34.25 |
| 1000-1 | 1.01 | 0.24 | 0.40 | 28.75 | 43.58 |
| 1000-2 | 1.01 | 0.24 | 0.40 | 28.53 | 46.63 |
| 1000-3 | 1.01 | 0.27 | 0.39 | 38.51 | 55.91 |
| 1000-4 | 1.01 | 0.24 | 0.40 | 35.15 | 48.16 |
| 1000-5 | 1.00 | 0.25 | 0.40 | 30.19 | 45.52 |
| 1000-6 | 1.01 | 0.27 | 0.40 | 37.32 | 50.47 |
| Specimen Number | h/m | b/m | t/m | α0 | FHmax/kN | FHQ/kN |
|---|---|---|---|---|---|---|
| WS300 | 0.3 | 0.3 | 0.2 | 0.4 | 11.793 | 7.003 |
| WS400 | 0.4 | 0.4 | 0.2 | 0.4 | 15.067 | 9.342 |
| WS500 | 0.5 | 0.5 | 0.2 | 0.4 | 17.766 | 10.953 |
| WS600 | 0.6 | 0.6 | 0.2 | 0.4 | 21.253 | 13.43 |
| Specimen Number | dmax/mm | h/m | b/m | t/m | α0 | FHQ/kN | FHmax/kN |
|---|---|---|---|---|---|---|---|
| R0.2D10-1 | 10 | 0.3 | 0.3 | 0.12 | 0.2 | 10.03 | 13.32 |
| R0.2D10-2 | 0.3 | 0.3 | 0.12 | 0.2 | 9.12 | 11.23 | |
| R0.2D10-3 | 0.3 | 0.3 | 0.12 | 0.2 | 11.05 | 14.27 | |
| R0.2D10-4 | 0.3 | 0.3 | 0.12 | 0.2 | 9.25 | 12.34 | |
| R0.4D10-1 | 0.3 | 0.3 | 0.12 | 0.4 | 6.94 | 8.72 | |
| R0.4D10-2 | 0.3 | 0.3 | 0.12 | 0.4 | 5.54 | 8.39 | |
| R0.4D10-3 | 0.3 | 0.3 | 0.12 | 0.4 | 5.46 | 8.38 | |
| R0.4D10-4 | 0.3 | 0.3 | 0.12 | 0.4 | 6.15 | 8.87 | |
| R0.6D10-1 | 0.3 | 0.3 | 0.12 | 0.6 | 2.90 | 4.30 | |
| R0.6D10-2 | 0.3 | 0.3 | 0.12 | 0.6 | 2.79 | 3.45 | |
| R0.6D10-3 | 0.3 | 0.3 | 0.12 | 0.6 | 3.57 | 4.43 | |
| R0.6D10-4 | 0.3 | 0.3 | 0.12 | 0.6 | 2.65 | 3.86 | |
| R0.7D10-1 | 0.3 | 0.3 | 0.12 | 0.7 | 1.93 | 2.54 | |
| R0.7D10-3 | 0.3 | 0.3 | 0.12 | 0.7 | 2.29 | 2.64 | |
| R0.7D10-4 | 0.3 | 0.3 | 0.12 | 0.7 | 2.02 | 2.74 | |
| R0.2D20-1 | 20 | 0.3 | 0.3 | 0.12 | 0.2 | 12.81 | 16.22 |
| R0.2D20-2 | 0.3 | 0.3 | 0.12 | 0.2 | 10.66 | 15.48 | |
| R0.2D20-3 | 0.3 | 0.3 | 0.12 | 0.2 | 10.9 | 14.79 | |
| R0.2D20-4 | 0.3 | 0.3 | 0.12 | 0.2 | 12.71 | 16.83 | |
| R0.4D20-1 | 0.3 | 0.3 | 0.12 | 0.4 | 8.57 | 10.39 | |
| R0.4D20-2 | 0.3 | 0.3 | 0.12 | 0.4 | 7.21 | 9.84 | |
| R0.4D20-3 | 0.3 | 0.3 | 0.12 | 0.4 | 7.88 | 11.16 | |
| R0.4D20-4 | 0.3 | 0.3 | 0.12 | 0.4 | 8.06 | 11.10 | |
| R0.6D20-1 | 0.3 | 0.3 | 0.12 | 0.6 | 3.29 | 5.10 | |
| R0.6D20-2 | 0.3 | 0.3 | 0.12 | 0.6 | 3.56 | 4.58 | |
| R0.6D20-3 | 0.3 | 0.3 | 0.12 | 0.6 | 3.34 | 4.91 | |
| R0.6D20-4 | 0.3 | 0.3 | 0.12 | 0.6 | 3.47 | 4.80 | |
| R0.7D20-1 | 0.3 | 0.3 | 0.12 | 0.7 | 2.38 | 3.02 | |
| R0.7D20-3 | 0.3 | 0.3 | 0.12 | 0.7 | 2.56 | 3.13 | |
| R0.7D20-4 | 0.3 | 0.3 | 0.12 | 0.7 | 2.25 | 3.11 |
| Specimen Number | h/m | b/m | t/m | α0 | FHmax/kN | FHQ/kN |
|---|---|---|---|---|---|---|
| FG750-1 | 0.75 | 0.75 | 0.45 | 0.4 | 84.78 | 63.46 |
| FG750-2 | 0.75 | 0.75 | 0.45 | 0.4 | 82.78 | 64.79 |
| FG750-3 | 0.75 | 0.75 | 0.45 | 0.4 | 75.62 | 63.62 |
| FG1500-1 | 1.5 | 1.5 | 0.45 | 0.4 | 157.44 | 117.46 |
| FG1500-2 | 1.5 | 1.5 | 0.45 | 0.4 | 158.22 | 113.25 |
| FG1500-3 | 1.5 | 1.5 | 0.45 | 0.4 | 158.43 | 110.11 |
| FG2250-1 | 2.25 | 2.25 | 0.45 | 0.4 | 200.59 | / |
| FG2250-2 | 2.25 | 2.25 | 0.45 | 0.4 | 200.67 | 140.04 |
| FG2250-3 | 2.25 | 2.25 | 0.45 | 0.4 | 170.58 | 147.93 |
Disclaimer/Publisher’s Note: The statements, opinions and data contained in all publications are solely those of the individual author(s) and contributor(s) and not of MDPI and/or the editor(s). MDPI and/or the editor(s) disclaim responsibility for any injury to people or property resulting from any ideas, methods, instructions or products referred to in the content. |
© 2022 by the authors. Licensee MDPI, Basel, Switzerland. This article is an open access article distributed under the terms and conditions of the Creative Commons Attribution (CC BY) license (https://creativecommons.org/licenses/by/4.0/).
Share and Cite
Gao, X.; Wu, J.; Zhou, M.; Xu, T.; Liu, C.; Tan, Y.; Yang, N.; Qiao, Y. Method for Determining the Fracture Parameters of Fully Graded Dam Concrete. Buildings 2023, 13, 24. https://doi.org/10.3390/buildings13010024
Gao X, Wu J, Zhou M, Xu T, Liu C, Tan Y, Yang N, Qiao Y. Method for Determining the Fracture Parameters of Fully Graded Dam Concrete. Buildings. 2023; 13(1):24. https://doi.org/10.3390/buildings13010024
Chicago/Turabian StyleGao, Xiaofeng, Jiong Wu, Mengxia Zhou, Tao Xu, Chunfeng Liu, Yaosheng Tan, Ning Yang, and Yu Qiao. 2023. "Method for Determining the Fracture Parameters of Fully Graded Dam Concrete" Buildings 13, no. 1: 24. https://doi.org/10.3390/buildings13010024