Article

Civil Engineering Standard Measurement Method Adoption Using a Structural Equation Modelling Approach

by
Siti Asmiza Muzafar
1,
Kherun Nita Ali
2,*,
Mukhtar A. Kassem
2,* and
Muhamad Azry Khoiry
3
1
Civil Engineering Department, Politeknik Sultan Azlan Shah, Behrang 35950, Perak, Malaysia
2
Department of Quantity Surveying, Faculty of Built Environment & Surveying, Universiti Teknologi Malaysia, Skudai 81310, Johor Bahru, Malaysia
3
Department of Civil Engineering, Faculty of Engineering and Built Environment, Universiti Kebangsaan Malaysia, Bangi 43600, Selangor, Malaysia
*
Authors to whom correspondence should be addressed.
Buildings 2023, 13(4), 963; https://doi.org/10.3390/buildings13040963
Submission received: 22 February 2023 / Revised: 28 March 2023 / Accepted: 31 March 2023 / Published: 4 April 2023

Abstract

:
The adoption of a standardized technique of measuring in civil construction projects is influenced both by the drivers and the strategies used, particularly in emerging nations such as Malaysia. So, the authors of this study used structural equation modeling and the PLS-SEM technique to inquire into the connection between the driver and strategy elements of the adoption. Quantity surveyors at quantity surveying consultancy companies using the standard measurement technique were polled using a questionnaire. Using the PLS-SEM technique provided by the SmartPLS 3 software, a hierarchical model was created to determine the components and their impacts on the adoption of the measuring method. The results indicated that all classes considerably influence the adoption of the standard technique of assessment, but the barrier factors had the most impact. The adoption of a standardized technique of measuring was significantly impacted by the driver and strategy elements. The coefficient of determination (R-squared value) of 0.400 indicates that the dependent variable(s) can be explained by the predictor variable(s) in the model. Moreover, Q2 is significantly different from zero, suggesting that endogenous latent components may be predicted by the conceptual model. Because of its high explanatory power, the created model has given a goodness-of-fit (GoF) index of 0.214. This means that the model adequately represents the link between the variables that affect measuring technique adoption and the effects of these factors. The first stage in determining what motivates people to utilize the most up-to-date standardized measurement approach in civil engineering construction projects is to develop a research model of the variables and to explain the connection between the driver and strategy factors on standard adoption.

1. Introduction

The construction sector is recognized as one of Malaysia’s key economic sectors that generate economic growth, along with agriculture, mining, manufacturing and services. Quarterly construction statistics [1] show that Malaysia’s construction sector shrank by 14.2% in the fourth quarter of 2020. The value of the construction work carried out reaches RMB 31.7 billion. The value of construction works in 2020 shrank by 19.4% to RMB 117.9 billion compared to RMB 146.4 billion in 2019. Other subsectors, such as civil engineering and residential and non-residential buildings, declined, while specialty trade activity surged at 29.3%. However, since the fourth quarter of 2015, the civil engineering subsector has maintained its dominance in the value of construction works performed with a 39.6% share for the 21st consecutive quarter. Statistics show that civil works are essential in supporting economic growth, as efficient infrastructure is the backbone of economic development.
Standard measurement technique is a document that provides the foundation for measuring building and civil engineering works, as defined by the Royal Institute of Chartered Surveyors [2]. The goal of the regulation is to guarantee that the list of output quantities adequately defines the scope and nature of the activity carried out [3]. When it comes to preparing quantity lists for civil engineering works, contract prices, and tender papers, ref. [4] and industry participants in Malaysia have agreed on the Malaysian Civil Engineering Standard Method of Measuring (MyCESMM2). Each civil engineering project is within the scope of this document’s definitions, descriptions, measurement procedures, and coverage. Projects that adhere to these standards may save money since everyone is working from the same playbook. Production of the CESMM started in 2003, and by 2011 the standard had been updated to be called MyCESMM. MyCESMM2 is the standardized local practice that resulted from modifications of CESMM3 (UK) and CESMM4 (UK). The goal of MyCESMM2 is to promote the adoption of best practices in the standardization of civil works measurement in accordance with a standard, with the aim of reducing the likelihood of misunderstandings regarding the precise nature of the measurements, descriptions, and methods of work that go into determining the final price of a given product or service. It is a key factor in ensuring that government contracts are awarded fairly and efficiently. By using MyCESMM2, in which the scope of work is specified in clear and standard language, all contractors bidding on the project will have the same information and a common understanding of what has to be done. As a result, skilled contractors may make more objective and transparent decisions, and pricing uncertainty in tenders is minimized or eliminated. As a byproduct, it improves contract management and makes it easier to estimate project costs.
Unfortunately, this standardized technique of measuring has not been widely adopted for usage in the field of civil engineering. As a result, it is familiar with the roles of consultants, contractors, and clients in civil engineering projects. The CITP (2016–2020) at CIDB are working to increase the usage of MyCESMM2 to provide cost effectiveness for civil engineering projects by using best practices in producing quantitative lists. MyCESMM2 will benefit from two supplementary materials: Library of Standard BQ Descriptions for Civil Engineering Standard Method of Measuring and Reference Manual for the Standard Way of Measurement in Civil Engineering. In 2018, the Department of Standards Malaysia published The Malaysian Standard Civil Engineering Standard Method of Measurement (MSCESMM) after consulting with industry participants to increase the usage of MyCESMM2 in civil engineering projects in Malaysia. All contractors bidding on the project will have access to the same information and a common understanding of the scope of work thanks to the standardized document. Tender price uncertainty is reduced or eliminated, and competent contractors may make better-informed decisions because of the standard’s emphasis on transparency and objectivity. It does this indirectly by making contract administration easier and decreasing project cost uncertainty [5,6,7]. There is a wealth of research on the tried-and-true approach of measuring adaptation, but there has not been much done to carefully examine this research. This research aims to bridge the knowledge gap on the use of the civil engineering standard technique of measuring in the building sector. In spite of this widespread awareness among construction project consultants, contractors, and customers, the scope of this standard’s use remains limited. The preparation of bills of quantities using the standard technique of measuring has several advantages, which are driving its widespread use in the construction industry.
In [8], it is said that many researchers find the PLS-SEM method to be very appealing. Without depending on assumptions about the distribution of the underlying data, it aids them in approximating models including several constructs, indicator variables, and structural routes. Specifically, partial least squares structural equation modeling (PLS-SEM) is a causal–predictive approach to SEM that places an emphasis on the prediction of statistical models whose topologies are designed to provide causal explanations.
This study attempts to fill the gap in understanding and identifying the civil engineering standard method of measurement adoption in the construction industry. However, these standards were not used, and the consultants, contractors, and clients were not sufficiently aware of them in construction projects. Many benefits drive the implementation of the standard method of measurement practices in construction, especially in preparing the bills of quantities.
This study seeks to identify factors that encourage construction firms to employ the civil engineering standard technique of measurement. Standardized measurement and practice techniques in civil engineering are motivated by many factors and strategies. Owing to cultural, economic, and legal differences, Malaysia may not use the reasons and tactics of other countries. Hence, Malaysia-focused research is crucial. This research examines SMM adoption drivers and barriers (standard measurement methods). The standard is crucial to developing industry professionalism. The research was carried out to enhance SMM and building sustainability. The suggested model accounts for driver and strategy factors that affect the adoption of a construction project standard measurement method. This review used related articles, conference papers, and books. This extensive literature analysis seeks to uncover all factors that may impact construction project standardized measurement procedures. These range from essential positives to driver- and strategy-related factors that impact building project adoption of the standard measurement procedure. The identified factors were grouped into two-factor groupings, and 18 items are displayed in Figure 1 using this classification approach.

2. Literature Review and Research Model

Currently in Malaysia, various building projects are held to varying degrees of scrutiny. Every major company in an industry usually has a team working on developing their own proprietary standard for measuring performance. Moreover, companies might use expert quantity surveyor organizations that have likely previously arranged their standard measuring procedures. As there is a wide discrepancy between these standards, disagreements over measurements and finances remain unresolved [5]. An accurate bill of quantities was generated using a standardized methodology for taking measurements. Among the current standardized references used in Malaysia’s construction sector are the Standard Method of Measuring for Building Works (SMM2) and the Malaysian Civil Engineering Standard Method of Measurement (MyCESMM2). The standard set by the Royal Institution of Surveyors Malaysia (RISM) for SMM2 and the Malaysian Construction Industry Development Board (CIDB) for MyCESMM2 attempted to facilitate congruity among the construction stakeholders in preparing bills of quantities by addressing the aforementioned issue.
For close to a century, the standard technique of measuring has served as the model for how bills of quantities are put together in the construction sector. Published for the first time in 1922, it was based on the work of prominent London quantity surveyors. The goal was to standardize how quantity surveyors calculate the costs of various construction projects. Quantity surveyors have been providing estimates, bids, and final accounts with numbers using a variety of conventional methods. The widespread use of bills of quantities, however, did help the success of the measurement. According to [9], the conventional method of measuring assists in providing a firm basis upon which to construct the measure, allowing for more precise itemization. This document establishes standards, specifications, norms, or characteristics that may be used consistently to ensure the quality of materials, products, processes, and services. The SMM provides a main basis for measuring construction and infrastructure projects, as described by the Royal Institute of Chartered Surveyors (RICS). The goal is to guarantee that the final bill of quantities generated appropriately reflects the scope and quality of the work to be carried out [10]. By using the SMM, the construction sector may improve its regularity and the quality of its output, making construction project information more accessible to all parties involved [3]. Preparing bills of quantities and their pricing in a way that deviates from industry standards is a major cause of failure in the construction business. Inaccurate or inconsistent measurement practices may be to blame [11].
According to [12], the motivation for the creation of SMM in the building sector is the need for standardized measurements and the use of modern building practices and materials. In addition, verifying the requirements and terms of the contract helps clarify and streamline the measuring standards. In order to appease industry players, particularly contractors, the standard would mandate a nationally standardized structure for bills of quantities in tender papers. They include the Civil Engineering Standard Methods of Measurement (CESMM) [13], the New Rules of Measuring for Building Works, and the Standard Method of Measurement for Building Works (SMM7) [14]. According to its description, the SMM is a document that specifies a regular-use document layout for presenting work. In addition, it includes a set of generally agreed-upon standards for measuring [10]. Moreover, it is suggested by [15,16] that it provide concrete criteria for evaluating widely used works. It also includes helpful recommendations for what a contractor bidding on the project should do to account for each metric. The construction industry’s standard measuring technique may be adapted to reflect regional norms and practices for completing a certain category of building project [14].
Bills of quantities, contract pricing, and bidding papers all benefit from using the same standard technique of measurement for civil engineering projects. The goal is to have a bill of quantities that completely describes the definition, description, norms of measurement, and coverage that are specified by the standard [4]. The goal of the standard is to provide consistency and avoid disagreements caused by varying interpretations of project costs. Better enforcement of the standard technique of measuring implementation has been cited as the most effective way for promoting its use in civil engineering. Given the wide range of building codes, it is prudent to strictly adhere to the measuring standard as described in [17]. Moreover, ref. [9] argued that cutting-edge IT should be the norm, regardless of regional building requirements. At the same time, ref. [18] advocated for more widespread implementation of these measurements in civil engineering projects. Implementing this standard is recommended by [5,19]. Having an appropriate and upgraded standard to keep up with new developments in buildings is also proposed [13,20]. Nonetheless, Yusuf and Mohamad [21] suggested that M&E services should be the focus of the deployment.
The goal of the specification is to ensure the comparability of results and to reduce the likelihood of disagreements about how to assess and define the scope of the work to be performed. There will be less room for error in estimates, valuations, and cost-control formulations, according to previous research, because of the standard of measurement’s consistency, precision, and uniformity. The reference provided by the standard will be consistent and straightforward [17]. The standard will be more transparent and unambiguous with the use of technology, as [9] said. By integrating project data with quantitative measurement, we can cut down on unnecessary elements, plans, and requirements [2]. According to research by [5], if you are consistent, your bill amounts will be too. If the standard or a common understanding of work items is being used, then all of the work items have been appropriately listed and characterized.
In addition, its regularity offers a constant benchmark against which to evaluate future measurements [5,19,22,23,24]. At the same time, it will function as a unified criterion for measuring methodologies, reducing the likelihood of misunderstandings and allowing for more cost transparency. When it comes to measurements, the major companies in Malaysia’s building business all use the same methodology [20]. The purpose of this work is to be of use to those involved in the building industry by encouraging them to think about adopting the standard in measuring for a more realistic approach to taking off and preparing the bills of quantities. In order to minimize misunderstandings and provide a foundation for measuring standards, it is recommended that all parties involved in the construction process use the same standard. This includes clients, contractors, and consultants.
The second most common reason is a fair tender price. Hence, the tender price will match the tender documents and become more competitive. Bills of quantities using measurement rules help compare tenders [7]. Due to the extensive tenders, its accurate bid evaluation will reduce the risk [21]. The standard will improve tender pricing and minimize contractors’ risk exposure [24,25]. When paired with the employer’s estimate, the contractor’s bid price is more likely to be accepted [5]. The contractor’s bid will be uncompetitive if they measure differently. Implementing the standard will solve this [19]. For bidding, the contractor receives information to estimate project costs and create bills of quantities [20,26]. A standard gives contractors additional information to the base of their bid pricing, which benefits the employer. Standardizing measurement procedures reduces disagreements, the third literature-identified motivation. Singapore’s standard would reduce legal disputes [17]. According to [24], the norm will reduce vague-wording claims and conflicts. Bill of quantities ambiguity challenges and arbitration proceedings will decrease [9]. Standardized measurement may prevent disagreements [19]. Moreover, as stated in [5], as both parties will have a better understanding of measurement, there will be fewer unnecessary confrontations, which will boost production and reduce miscalculation-related problems. The contractor will also have fewer work item miscalculations and misunderstandings, enabling them to concentrate on project completion without pointless disagreements.
The research found that improved construction project management and contract administration are the fourth most common benefits of standard measurement. Cost management is accurate and fast using this standardized measurement method. The standard will provide cost predictions via fiscal management and analysis [18]; see [27,28]. It helps budget for unexpected developments. It reduces project expenses [19]. It will include claims, interim payments, modification orders, and final accounts that underpin contractor payments to assist the employer in monitoring his money [5]. Bills of quantities are created using the conventional measurement approach due to monthly interim values and volatility [21]. Standard measurements provide accurate cost predictions and planned project schedules [24]. Standardization may help manage and analyze contract administration and financial transaction expenses. The literature most often uses a boosted standard method to assess research and development: a web-based user guide and standard-compliant technology. Ref. [19] decided that the standard should be adopted from another nation or altered to satisfy regional needs. A mechanical and electrical services supply chain is being utilized to build a uniform measurement procedure [21]. It is limited to building and civil engineering projects with mechanical and electrical services [5].
The literature suggests expanding data on the typical measurement approach’s benefits. The civil engineering standard provides uniform local construction bills of quantities and easy benchmarking for future cost comparisons. Sticking to standard measurement methods might help minimize conflicts [19]. Ref. [20] suggests a more realistic relationship between construction method, cost, and the gold standard of assessment. The standard improves cost estimate, bid price, player cost management, and structural or civil engineering construction [13]. According to the data, rules and regulations requiring the standard method of measuring are the fourth most commonly stated approach for promoting its adoption. Ref. [18] found that project management must be enforced when utilizing the civil engineering standard method of measuring. As there is no monitoring and enforcement organization, ref. [20] describes a broad variety of standards. So, everyone must follow one set of measurement norms. To enhance awareness among Malaysian practitioners, severe steps are needed. Ref. [17] suggests financial and other market-based incentives, low-interest loans, and government subsidies to promote the adoption of a consistent evaluation method. Government-led initiatives are needed to reform and standardize industry. Construction experts have not been effectively informed about promotion teams and local authorities’ competent and proactive standard measurement approach. Workshops, seminars, and conferences spread civil engineering measurement standards [18]. Workshops and seminars by Malaysia’s Construction Industry Development Board (CIDB) have raised civil engineering standards.
According to [29], the PLS-SEM approach is exciting to many researchers. It helps them approximate complex models with many constructs, indicator variables, and structural paths without relying on the data distributional assumptions. More specifically, PLS-SEM is a causal–predictive approach to SEM that emphasizes the prediction of statistical models whose architectures are built to provide causal explanations.

3. Methodology

The evaluation of the relevant literature has improved our comprehension and data collection on the investigation of the variables affecting the adoption of standard measurements in civil engineering. In order to verify the claims made in this study, a survey method was implemented. To better understand the variables (both strategic and underlying) that drive the use of standardized measurements in Malaysian civil engineering construction projects, a questionnaire survey was designed. The questionnaire included four parts, the first being an introductory letter outlining the objectives of the study. In the second part, respondents were asked to fill out the information about themselves, such as their job titles, years of experience, and preferred methods of evaluation. Section 3 and Section 4 aim to isolate the strategic and driving variables that influence the spread of standards.
The questions in this section used a five-point Likert scale (1 = strongly disagree, 2 = disagree, 3 = moderately disagree, 4 = agree, and 5 = strongly agree) to gauge respondents’ levels of agreement with statements about the factors that influence standard adoption and the indicators of standard adoption. A PLS-SEM and the Smart PLS software package were used to analyze the data (partial least square structural equation modelling). One statistical approach, structural equation modeling (SEM), combines a measurement model (confirmatory factor analysis) with a structural model. All of the connections between the structures under consideration for the assessment are specified by these formulae. Since it reveals the structure of the link between latent variables, the SEM system requires verification of the measurement procedure. The internal consistency of a latent variable is the dependability of the scale. Cronbach’s alpha is the most common method used to determine reliability, with a minimum value of 0.60 indicating that the measurement scale for the latent variable is reliable. Based on their registration with the Board of Quantity Surveyors Malaysia (BQSM) and the Malaysian Ministry of Finance, a total of 200 sets of questionnaires were sent out to quantity surveying businesses in Selangor State. Table II displays the outcomes of the 167 submissions that were reviewed and found to be appropriate.
The most widely used structural equation modeling (SEM) approaches are covariance-based methods, which are implemented in widely used statistical packages such as LISREL, EQS, AMOS, SEPATH, and RAMONA [29]. Indeed, the covariance-based approach is identical to SEM in the eyes of many scholars in the social sciences. Yet, PLS is a well-known alternative approach for scientists who want to carry out SEM-based analysis. It might be claimed that the PLS technique is more appropriate depending on the researcher’s goals, the epistemic perspective of data to theory, the features of the data at hand, or the level of theoretical understanding and measurement progress. The goal of covariance-based SEM is to recreate the theoretical covariance matrix rather than to analyze the amount of unexplained variation in the data. Nonetheless, the PLS-SEM approach was used for analysis since its goal is to maximize the explained variance of the endogenous latent constructs (dependent variables), as stated in [30].
Two assumptions, derived from the theoretical model shown in Figure 2, form the basis of this investigation.
Hypothesis 1 (H1).
Driver factors (DF) have a significant effect on civil engineering standard measurement adoption.
Hypothesis 2 (H2).
Strategy factors (SF) have a significant effect on civil engineering standard measurement adoption.
The SEM combines a measuring model (confirmatory factor analysis) and a structural model into a single statistical study. The connections between the various constructs in the analysis were represented by these equations. To properly capture the structural link between latent variables, the SEM procedure requires a good measurement model. The Cronbach alpha coefficient is the most common way to assess the internal consistency of a scale used to measure a latent variable; a higher value of Cronbach’s coefficient indicates greater reliability of the scale used to measure the latent variable, while a lower value indicates less reliability.
All quantity surveying businesses in Selangor, Malaysia were included in the survey’s random sample of 200 participants and their accompanying questionnaires for a three-month time period starting Sep. 2021. Just 167 genuine replies were received; the rest were either badly filled out or never sent back at all, rendering them useless for study (see Table 1). A look at the breakdown of participants’ demographic information reveals that the vast majority have more than five years’ worth of experience in the construction industry and that their job titles are quite similar to that of quantity surveyors.
By a wide margin, as seen in the breakdown of participation, those involved in building projects have been doing so for more than five years. On the other hand, all of the participants share job titles that are directly tied to managing building projects. Quantity surveying professionals, who use the standard measuring technique on a daily basis, were recruited for the research.
The word “SEM” may be used as a synonym for the covariance-based technique. Researchers interested in a SEM-based study also have access to PLS, a widely used alternative method. The PLS method may be preferable depending on the goals of the research, the epistemological perspective of the data to theory, the characteristics of the data, or the current state of theoretical understanding and measuring technology. Table 2 displays the PLS-SEM analysis phase used in the structural equation modeling process.

4. Results and Discussion

A partial least squares estimation method was used to examine the theoretical model shown in Figure 3. PLS model criteria were calculated using [31], while measurement and structural model parameters were estimated using Smart PLS 3.0′s two-step approach.
The following are the stages that are taken into account while evaluating a PLS-SEM route model:
The construct’s validity and trustworthiness are established by an assessment of the outer model (the measurement model) [32]. Examining item loadings, external composite reliability, and discriminant validity [29] are all methods for evaluating this measure.
The amount of variation explained by both exogenous and endogenous latent variables (independent latent variables and dependent variable) is measured using inner model (structural model) assessment [32]. By calculating the route coefficients, “which are standardized betas based on [33]”, the structural model allows us to test our assumptions. Standard errors of the estimations and hypothesis testing were conducted using non-parametric bootstrapping with 5000 replications as described in [34].
1: Examination of the Measuring Instrument (Outer Model)
Composite reliability for assessing external consistency, individual indicator reliability, and average variance extracted (AVE) for assessing convergent validity are the three tests required for assessing reflective measurement models, as stated in [35]. Fornell–Larcker criteria and cross loadings are used to evaluate discriminant validity. Each evaluation metric for reflected measurement models will be detailed below.
Step 1: Initial Convergent Validity
When indicators of a reflective concept are considered to be alternate ways of assessing the same construct, this is known as convergent validity. For this reason, it is preferable for the indicators (measures) of a given construct to converge or at least share a considerable amount of variance. According to [32], item reliability is the degree to which a multiple-item scale’s measurement of latent factors corresponds closely to the true value of those latent variables as they pertain to the mistake. Researchers need to think about the outer loadings of the indicators and the average variance extracted (AVE) to determine convergent validity [36].
First, dependability, or the degree to which something can be relied upon, is assessed by looking at how well it conforms to expectations outside the system. The classic method for estimating reliability using intercorrelations across note indicator variables is Cronbach’s alpha, and it has been used for many years as a gold standard. All indicators are supposed to be equally dependable in Cronbach’s alpha, and all indications subject to extraneous loads are assumed to have the same structure. Priorities, however, are determined by indications from the PLS-SEM. In addition, Cronbach’s alpha tends to understate the dependability of external consistency, accounting for the sensitivity of the number of components in the table.
Trustworthiness all in one. Composite reliability limits might be anything from 0 to 1, with higher values signifying more reliable data. It has the same meaning as Cronbach’s alpha and is often used interchangeably. According to [37], composite reliability ratings between 0.60 and 0.70 are acceptable in exploratory studies, whereas values between 0.70 and 0.90 are acceptable in more mature phases of research. Lastly, a result of less than 0.60 for the composite dependability indicates an issue with internal consistency.
This is called Cronbach’s alpha. A second measure of external consistency dependability, Cronbach’s alpha, uses identical cutoffs but produces lower results than composite reliability (CR). When Cronbach’s alpha is more than 0.7, surveys are typically considered to be credible [38]. When estimating reflective measurement models using PLS-SEM, the lower limit of external consistency reliability is Cronbach’s alpha, while the upper bound is CR.
An average of the extracted variance (AVE). Convergent validity, or the degree to which a concept converges in its indicators by explaining the items’ variation, is the last criterion for evaluating reflective measurement models. Convergent validity was established by calculating the average variance extracted (AVE) from all items sharing a construct’s commonality. According to [36], AVE is calculated as the average of the squared loadings of all indicators related to a build (for the sake of standardizing information). According to [35], the problem was discovered using the same reasoning as with the separate indications. If the average variance explained (AVE) for the concept is more than 0.50, then it adequately explains the average variation shown in its indicators. Conversely, if the AVE is below 0.50, then the variation in item error is larger than the variance in the concept (see Table 3).
Overall, Cronbach’s alpha value was much greater than 0.7, indicating that the test is both trustworthy and internally consistent. According to [32], researchers in the social sciences should not instantly exclude indicators whose outer loading is below 0.60, but should instead keep a close eye on weaker outer loadings, especially when using freshly designed scales. Additionally, researchers need to look at how eliminating certain items affects the composite reliability and the construct’s content validity. Indicators with outer loadings between 0.40 and 0.70 may be removed from the scale if doing so does not enhance the composite reliability or the average-variance-derived AVE over the recommended threshold value. The degree to which the removal of an indication compromises the legitimacy of the material is another factor to consider when considering whether or not to remove the indicator. Sometimes, weaker exterior loading indicators are kept because of their usefulness in establishing internal consistency.
The exogenous construct indicator item has a loading of between 0.4 and 0.7, measuring the endogenous constructions. With its removal, the AVE rises over 0.5, putting it within an acceptable range (see Table 4).
Outside loadings of less than 0.40 on the indicators should result in their permanent removal from the scale [39]. All external components with a loading factor of more than 0.6 and within the permissible range are shown in Figure 4.
Step 2: discriminant validity
According to [35], discriminant validity is the degree to which one theory is true and different from other constructs in terms of relevant empirical factors. Yet, demonstrating discriminant validity requires a construct to be distinct from other constructs in the model and to capture occurrences that those other constructs fail to account for.
Fornell–Larcker analysis.
An alternative, more cautious method is the Fornell–Larcker criteria [35]. The square root of the AVE values is compared to the correlations of the latent variables. Each construct’s strongest correlation with another should be lower than the square root of its AVE. To put it another way, we may express this requirement as follows: the AVE must be higher than the squared correlation with any other indicators. The methodology relies on the hypothesis that within a given concept, correlations between variables are stronger than correlations between variables that are unrelated to the construct under study (see Table 5).

Cross Loading

Discriminant validity has been evaluated in two different ways. Taking a look at the indicators, cross loadings is one way to evaluate their discriminant validity. The outer loading of an indication should be greater on the linked construct than any other loadings. Discriminant validity issues arise when there are cross loadings that are larger than the outer loadings of the indicators. On the basis of [39], these criteria are seen as somewhat lax when it comes to demonstrating discriminant validity. As a result, it is probable evidence that two or more constructs have discriminant validity (see Table 6).
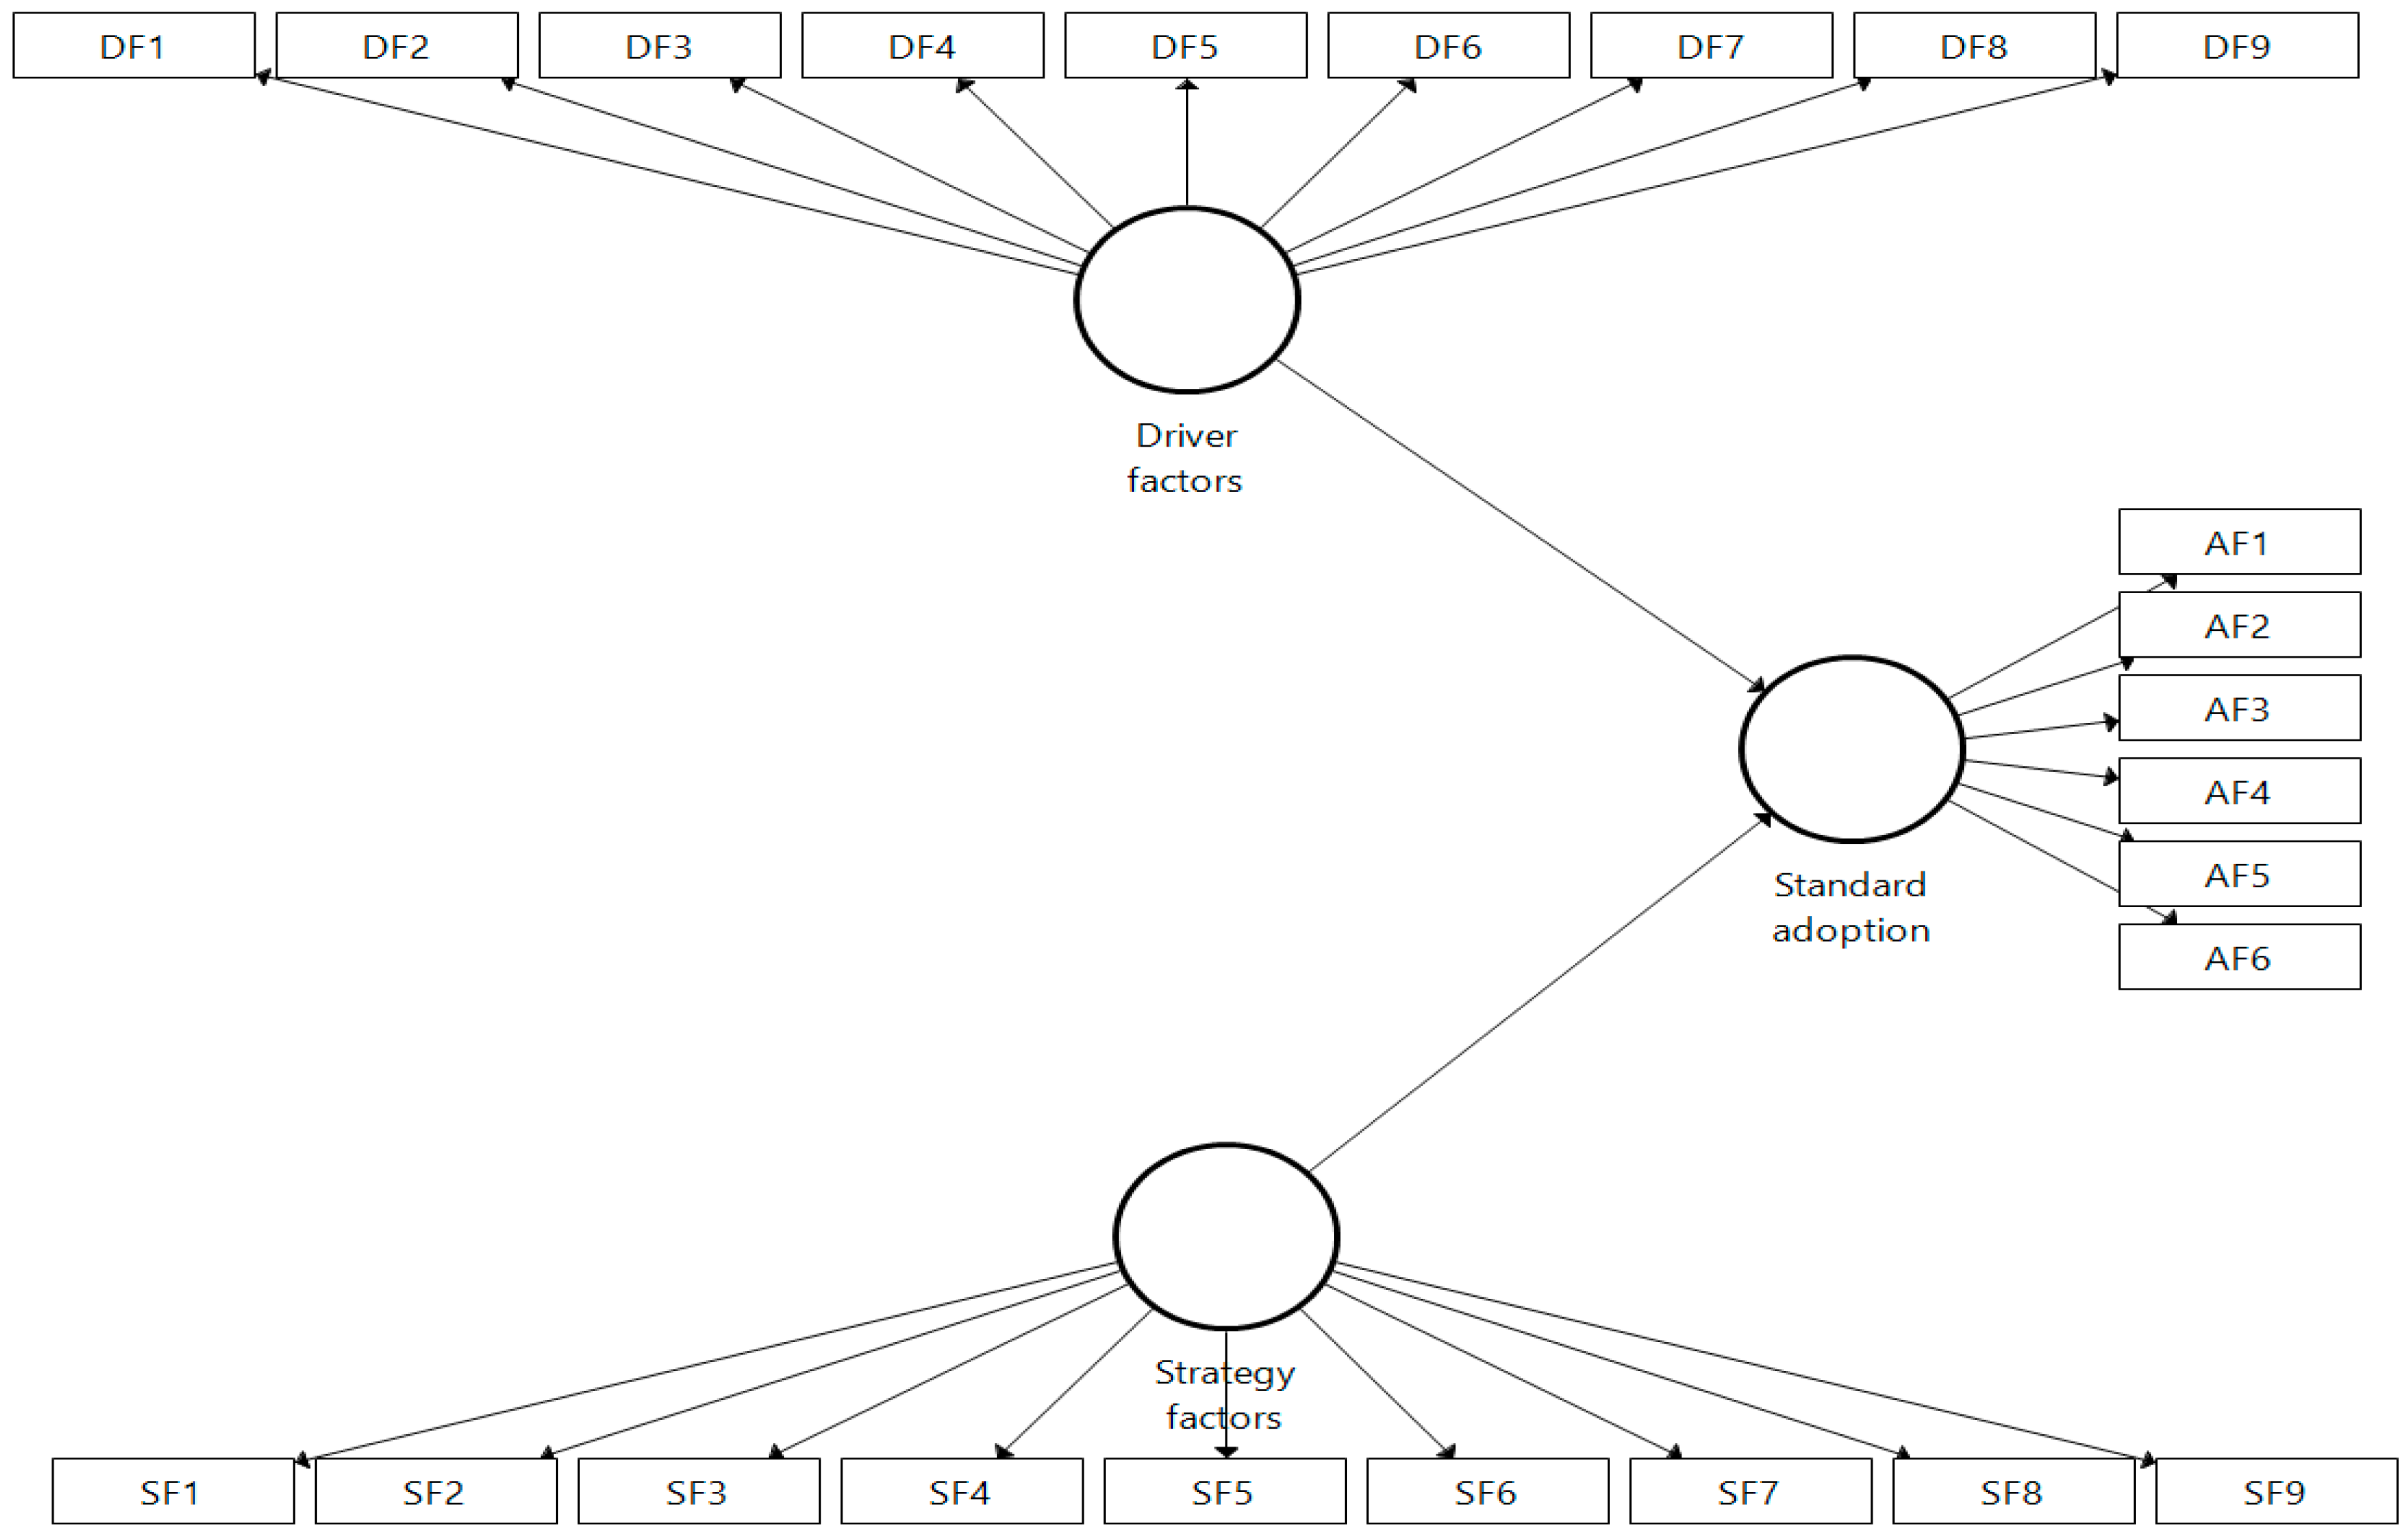
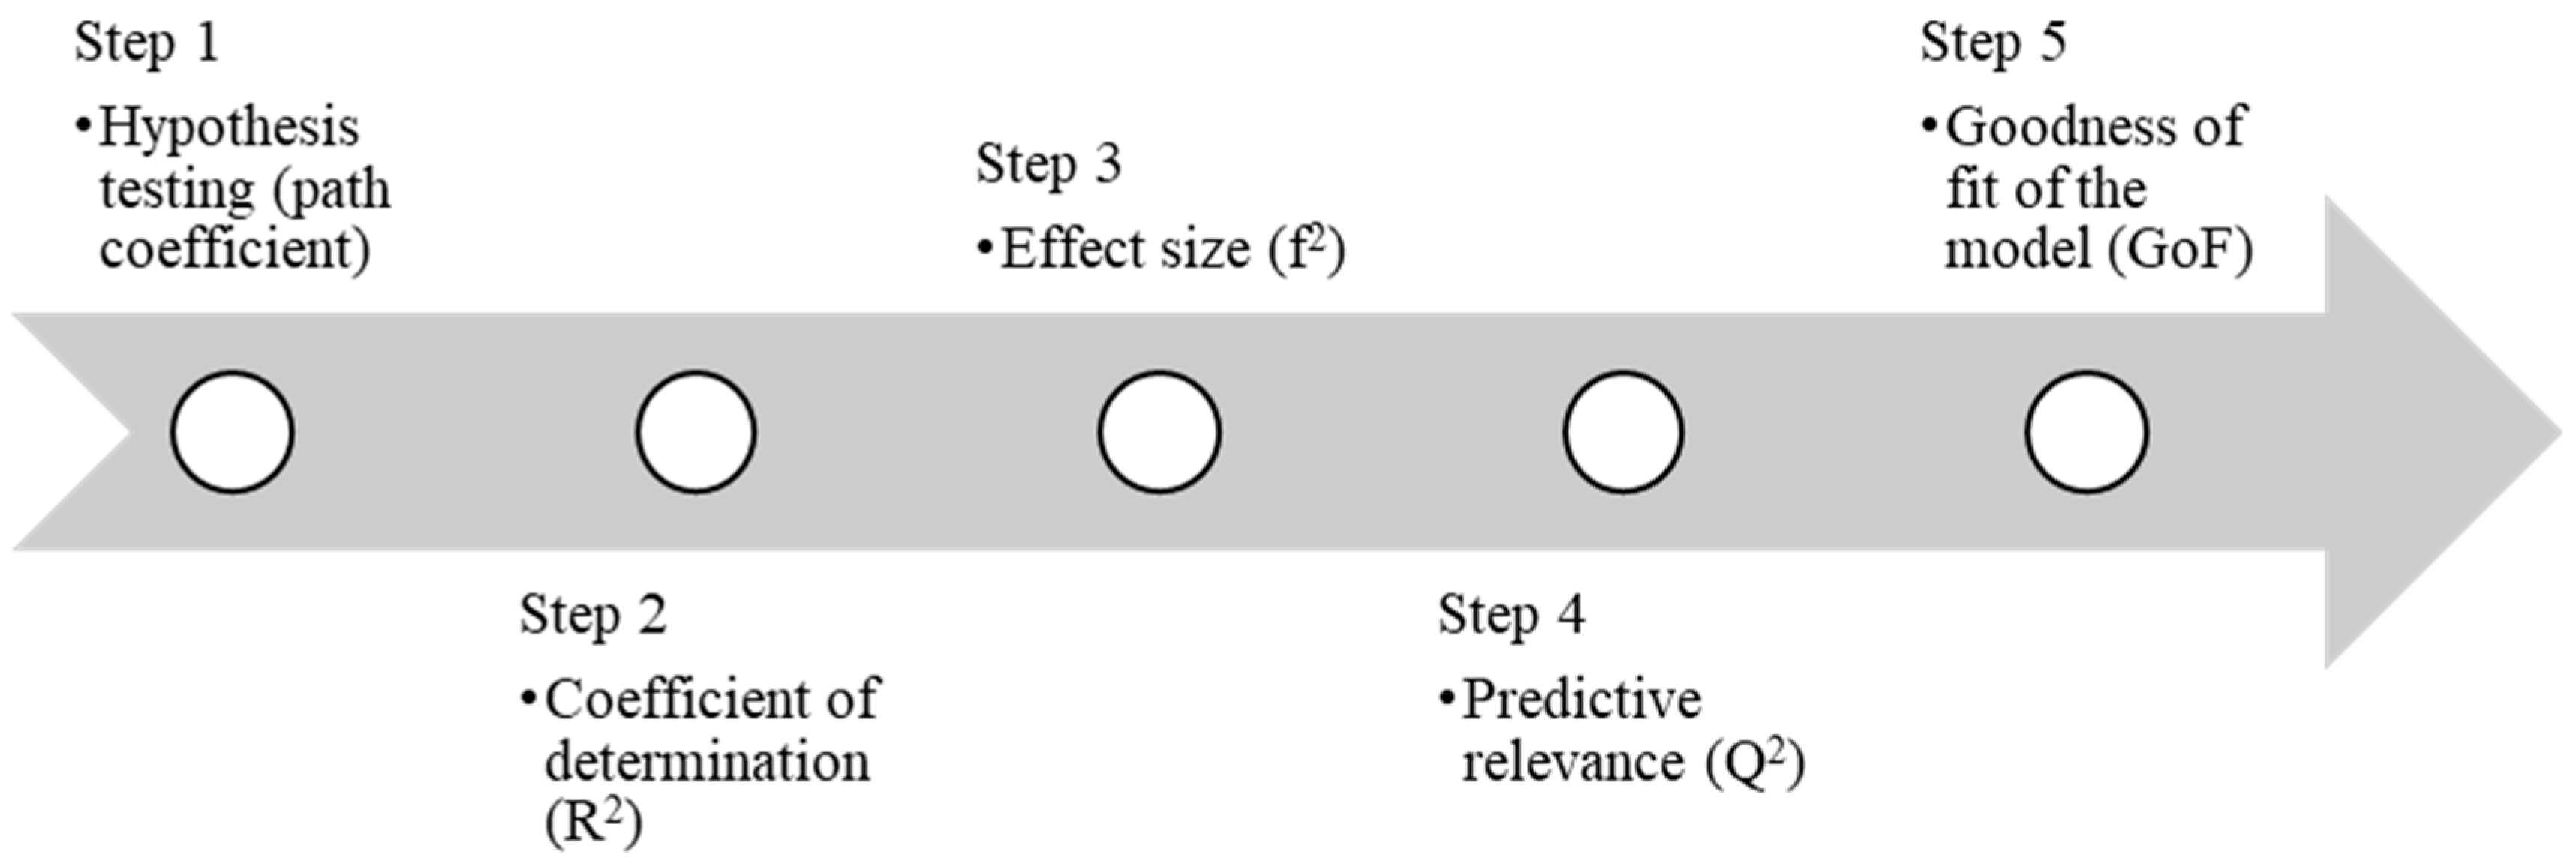
2: Assessment of the structural model (Inner Model)
After checking the construct phases for correctness and efficacy, the results of the structural model are evaluated by analyzing the dependent variables’ internal linkages. The prediction abilities and inter-construct relationships of the model are investigated. The next five phases, shown in Figure 5, assess the structural model at this point.
Step 1: hypotheses testing (path coefficient)
By using the PLS method in Smart PLS, we were able to extract the structural model connections (i.e., the path coefficients) that represent the predicted links among the constructs. There is a predefined range for route coefficients, from 1 to +1, which is known as the limit. Strong positive connections (and the opposite for negative values) are always statistically significant when their estimated path coefficient is near to 1 (i.e., different from zero in the population). The estimated coefficients are most closely centered around 0. Weak associations and shallow values near to zero are often not significant (i.e., not substantially different from zero) [35].
Bootstrapping may be used to acquire a coefficient’s standard error, which is then used to determine statistical significance. The next phase, following the guidelines laid forth in [40], was using the bootstrapping technique to see whether a reflective indicator makes a significant contribution to the relevant construct. The observed t value may be calculated using the bootstrap standard error. With samples greater than 30, it is reasonable to make an approximation to the t distribution. Equally, the quantiles of the normal distribution may be used as cutoff points against which the observed t value can be evaluated. With a certain error probability, a coefficient is considered to be statistically significant when the empirical t value is bigger than the critical value (i.e., significance level). Critical values for two-tailed tests are typically 1.65 (significance level 5–10%), 1.96 (significance level 5–5%), and 2.57 (significance level 5–1%). Researchers in marketing often use a 5% significance level, although this is not always the case; nonetheless, consumer research studies often use a 1% significance level, especially when conducting trials. While performing an exploratory study, however, researchers often choose a 10% significance threshold. The significance level that should be used is ultimately determined by the nature of the research being conducted and its ultimate goal.
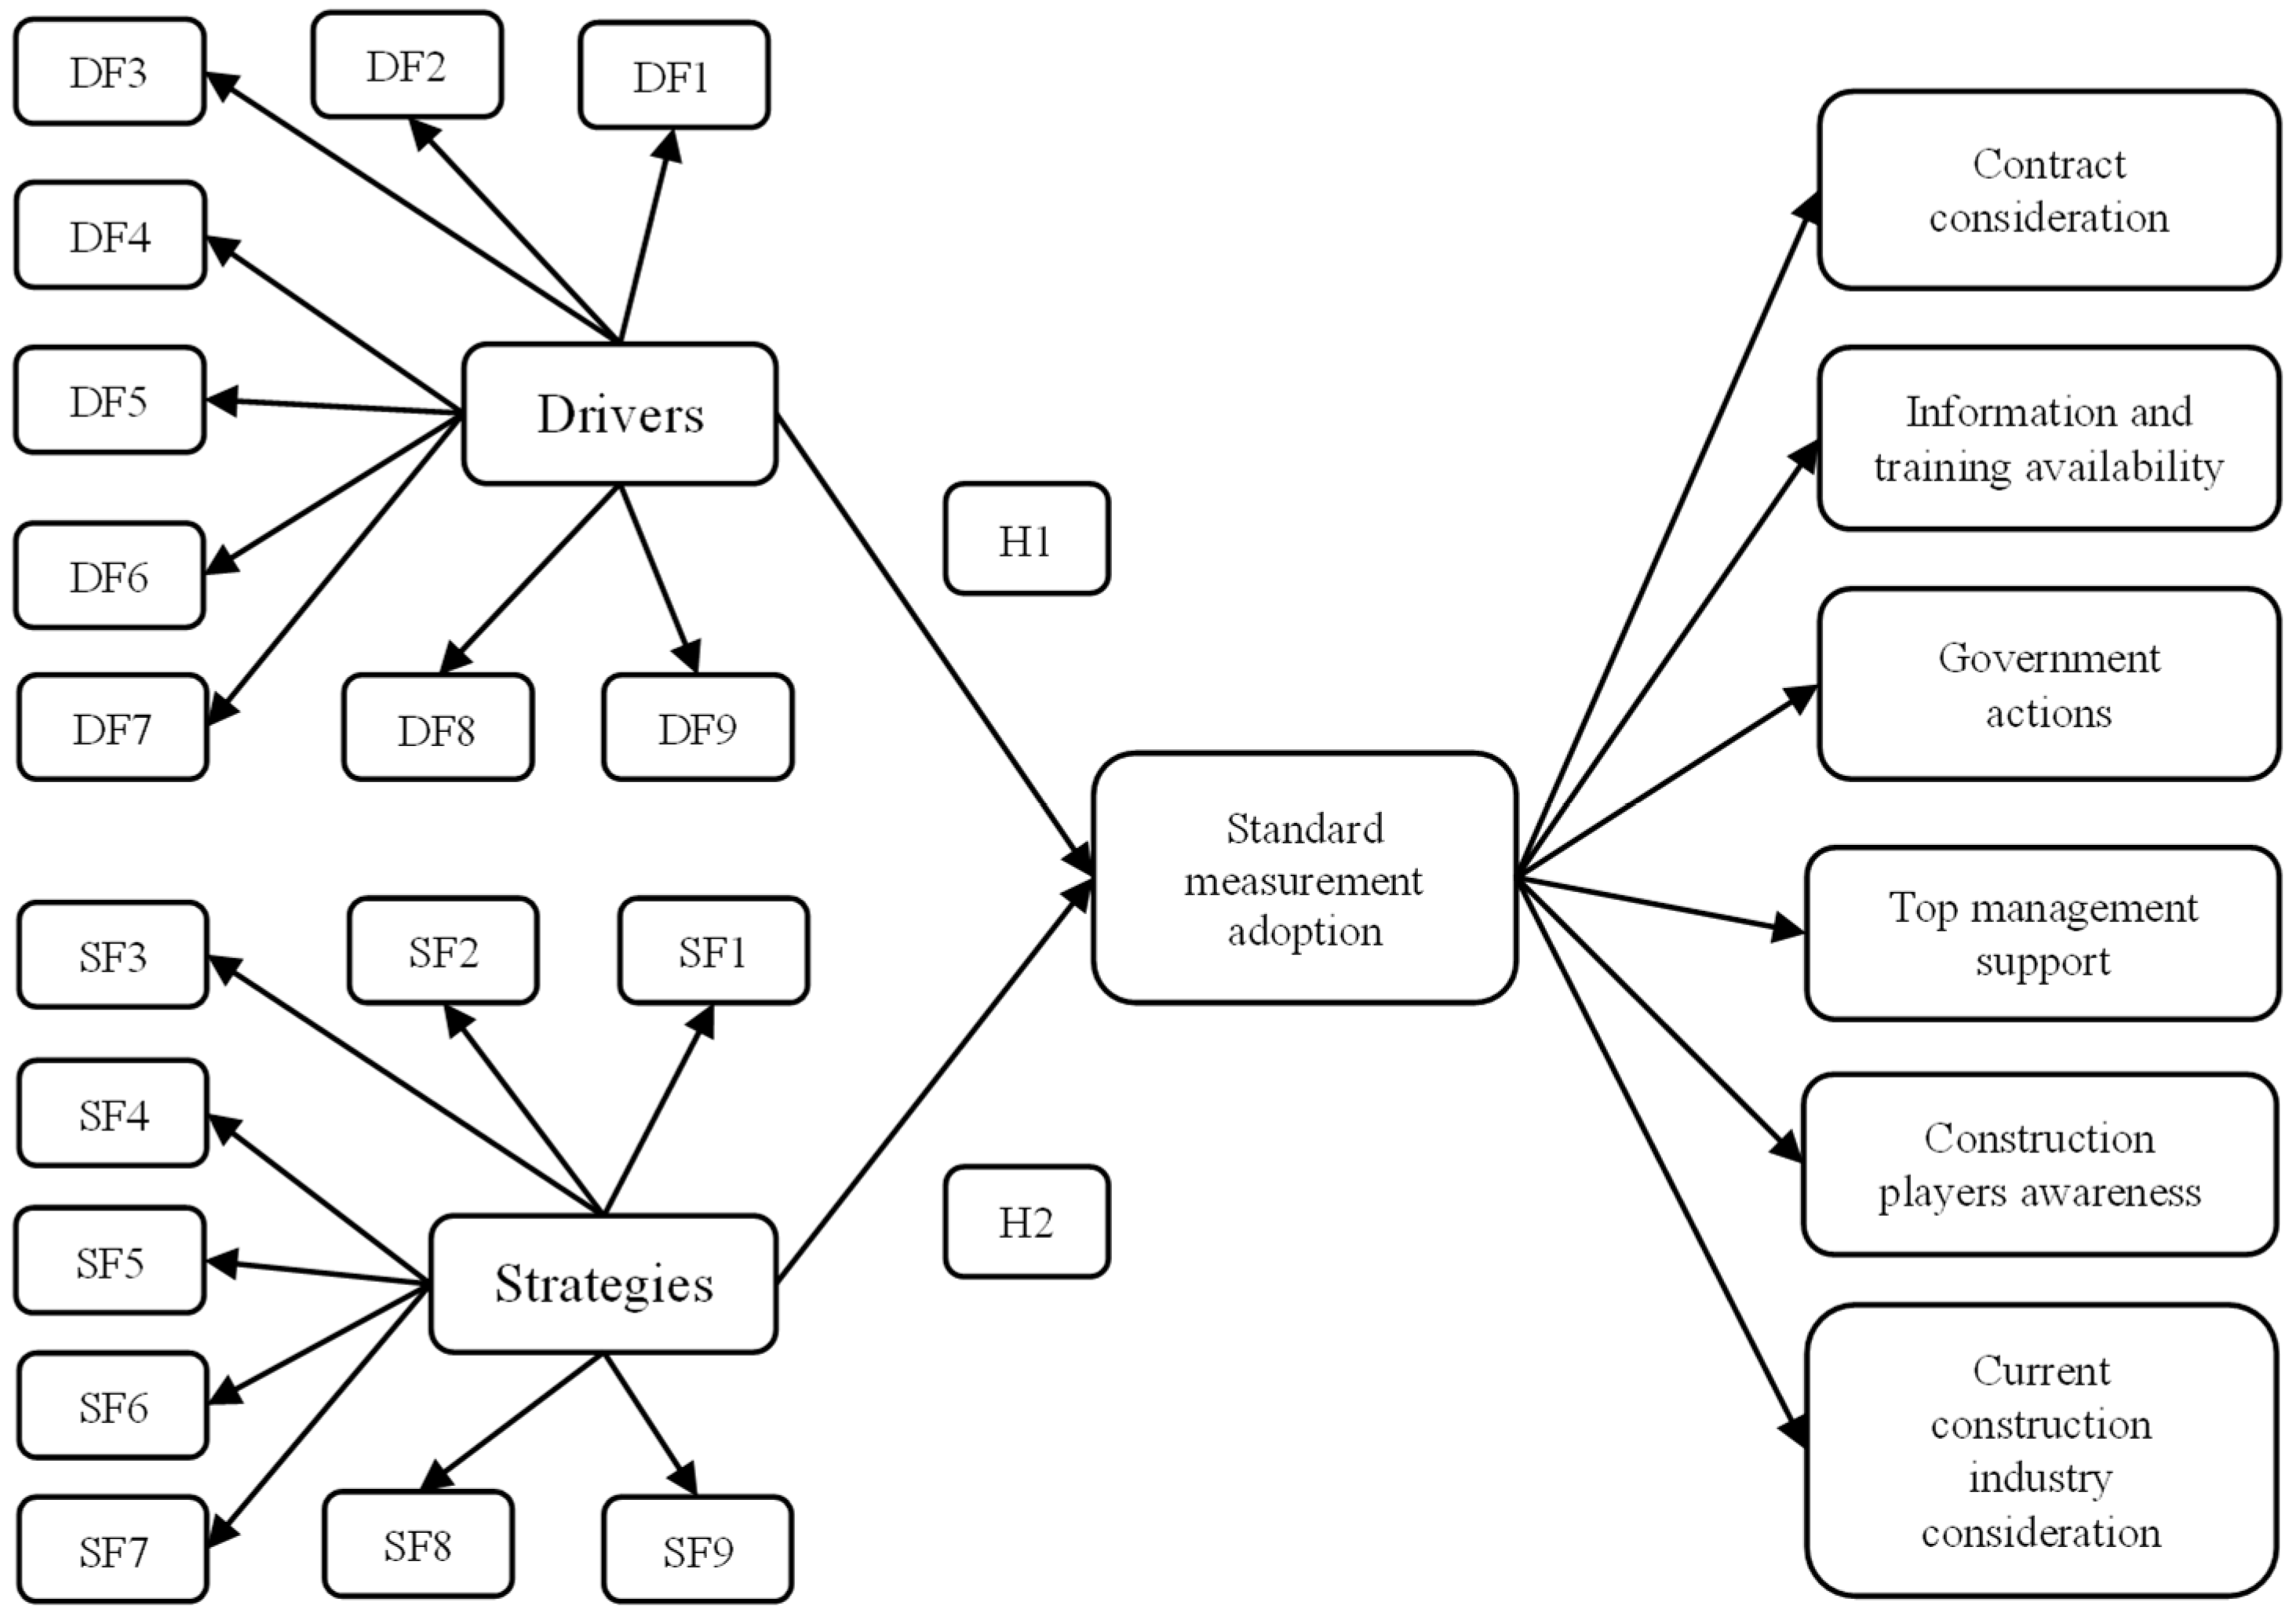
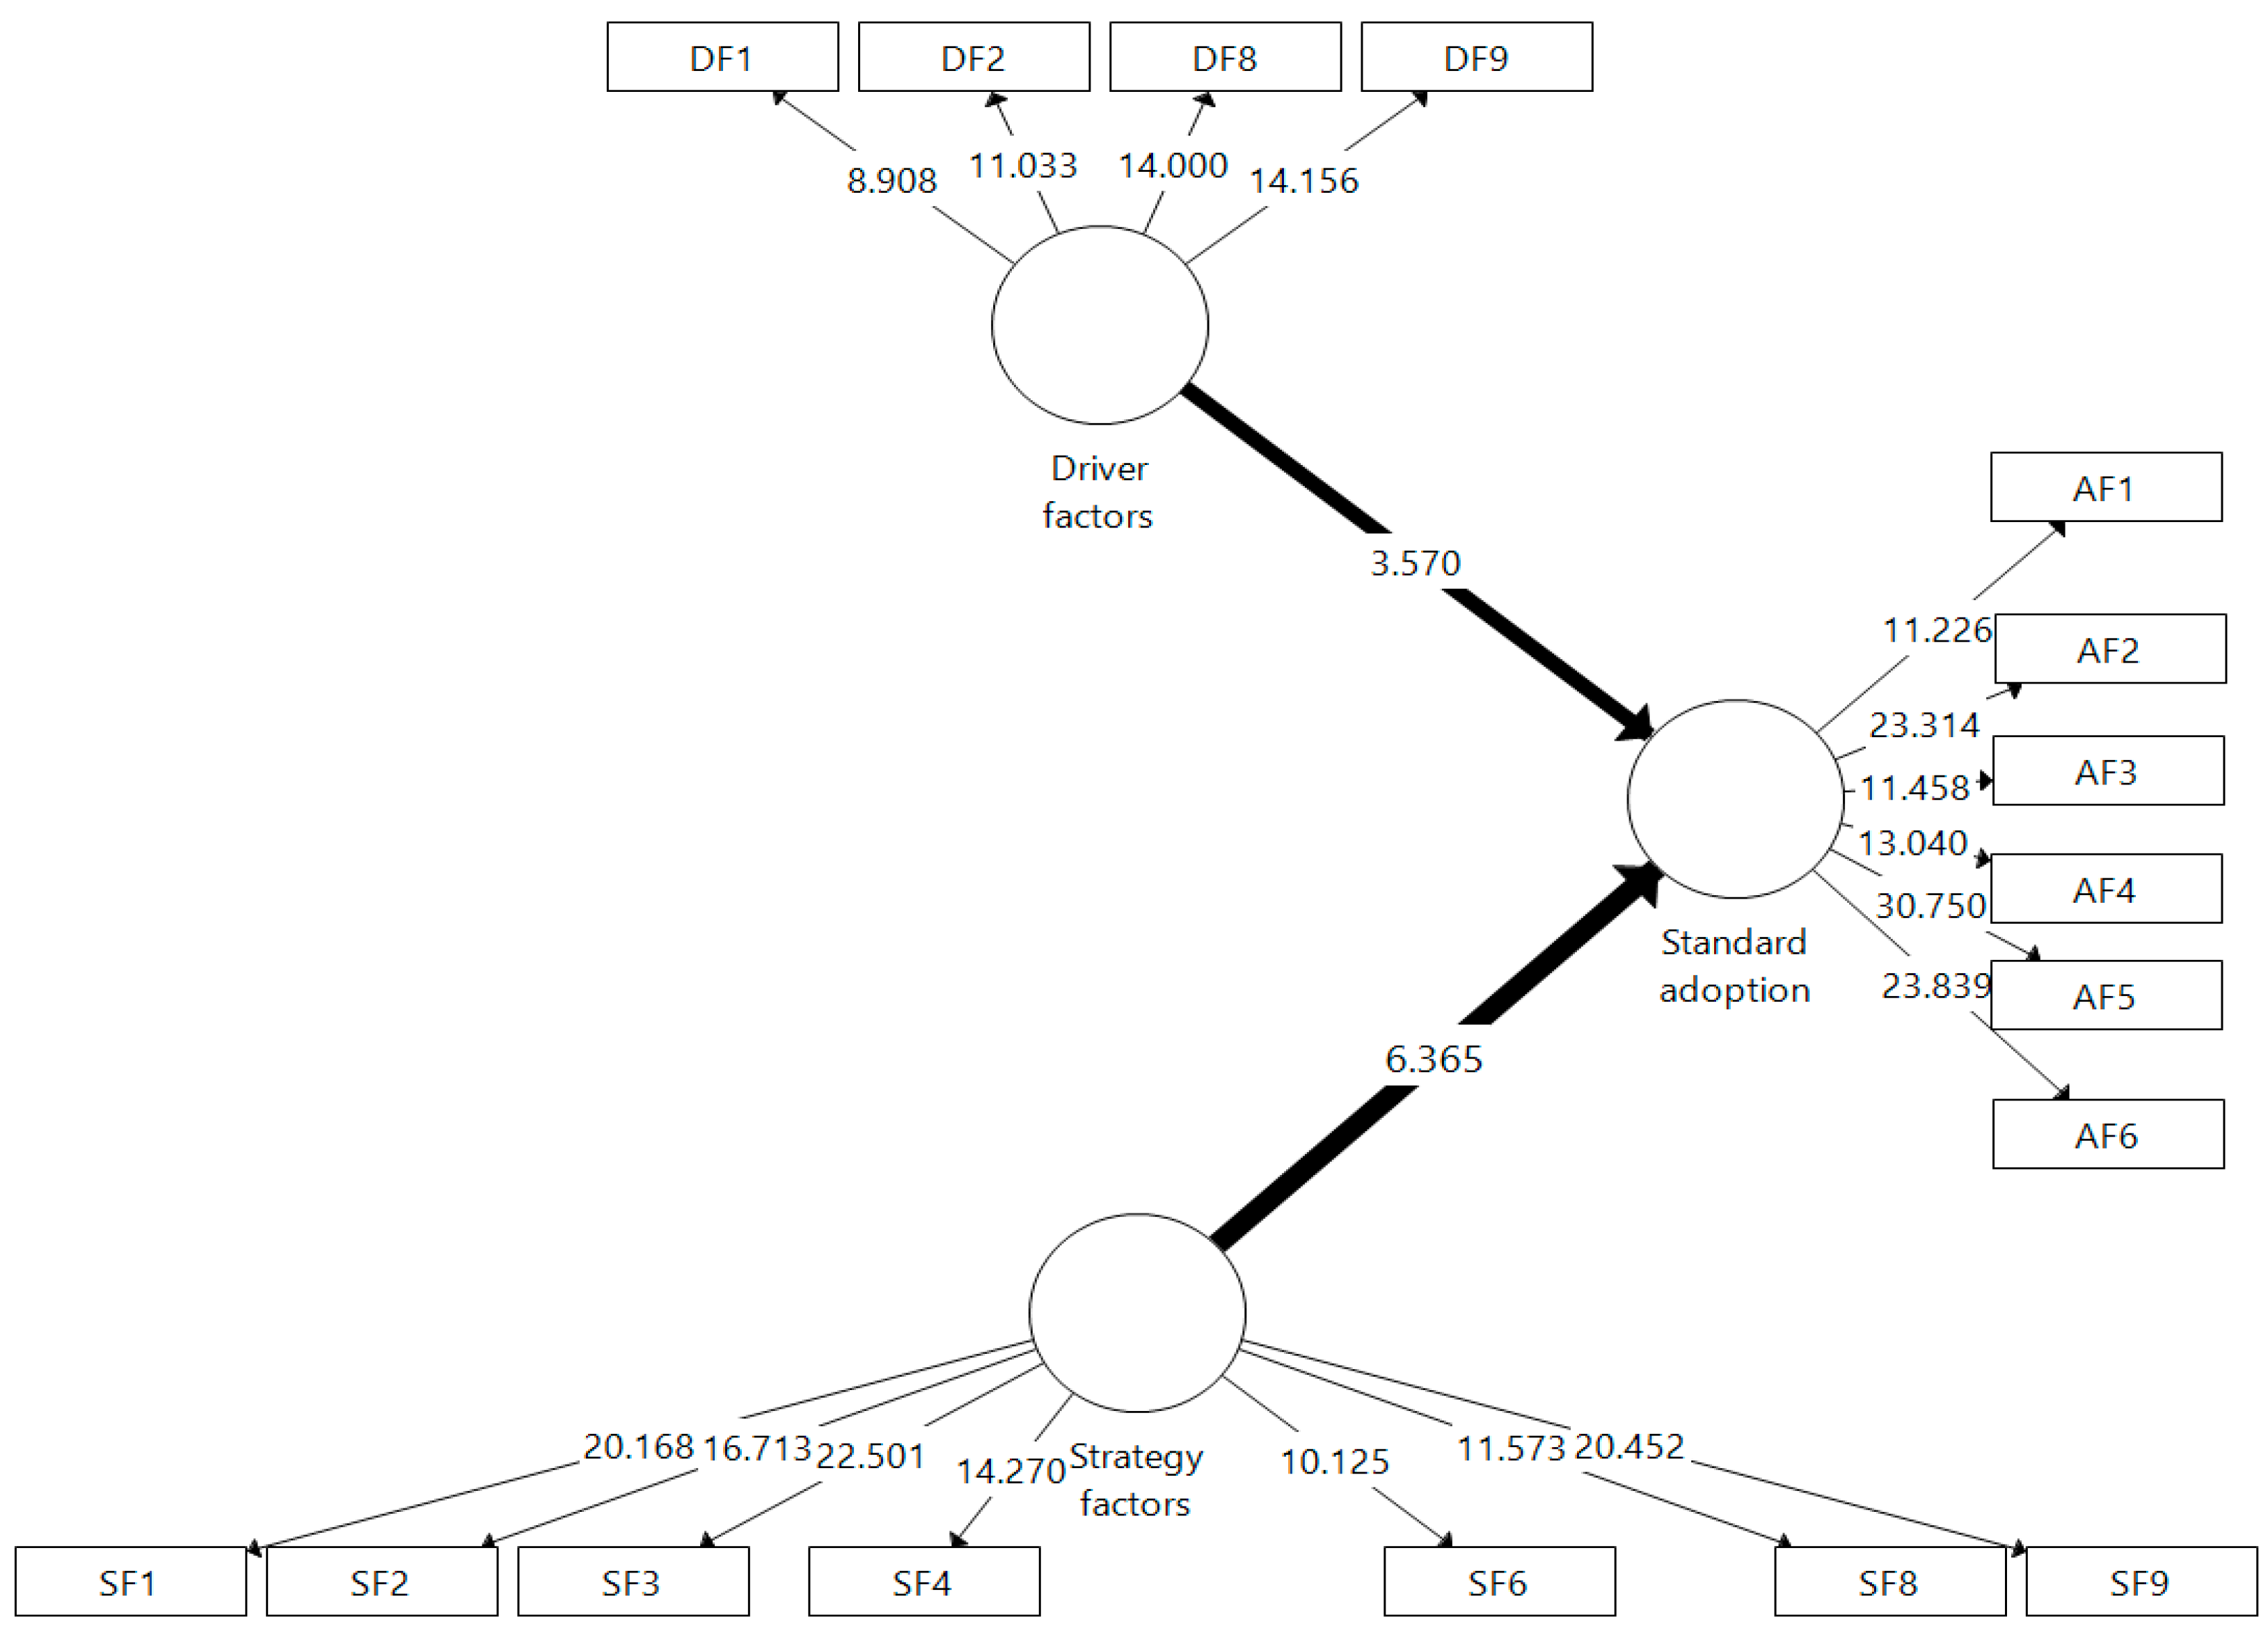
Construction projects in civil engineering in Malaysia are shown in Figure 6 together with the evolution of key aspects including drivers and strategies. It features the most significant pieces of music and proven theories. Hypothesis 1: driver factors—DF—having a considerable impact on standard adoption is supported by SEM analysis (Table 7). The same holds true for Hypothesis 2: strategy factors very heavily affect standard adoption.
Step 2: coefficient of determination (R2 value)
The R2 value (or coefficient of determination) [31,39] is a key metric in PLS-SEM used to evaluate the strength of the structural model (R2 value). To measure how well a model can predict the future, we may use the squared correlation between the observed and anticipated values of a single endogenous component. The coefficient of determination (R2) is a statistical measure of the degree to which a set of independent variables can explain the observed pattern of the dependent variable [41,42]. While [41,43] determined that an R2 of 0.10 is minimally acceptable, this value is context-dependent. Like PLS-SEM, [29] suggests that R2 values of 0.67, 0.33, and 0.19 are substantial, moderate, and weak, respectively, and that R2 values below 0.19 are insufficient (see Table 8).
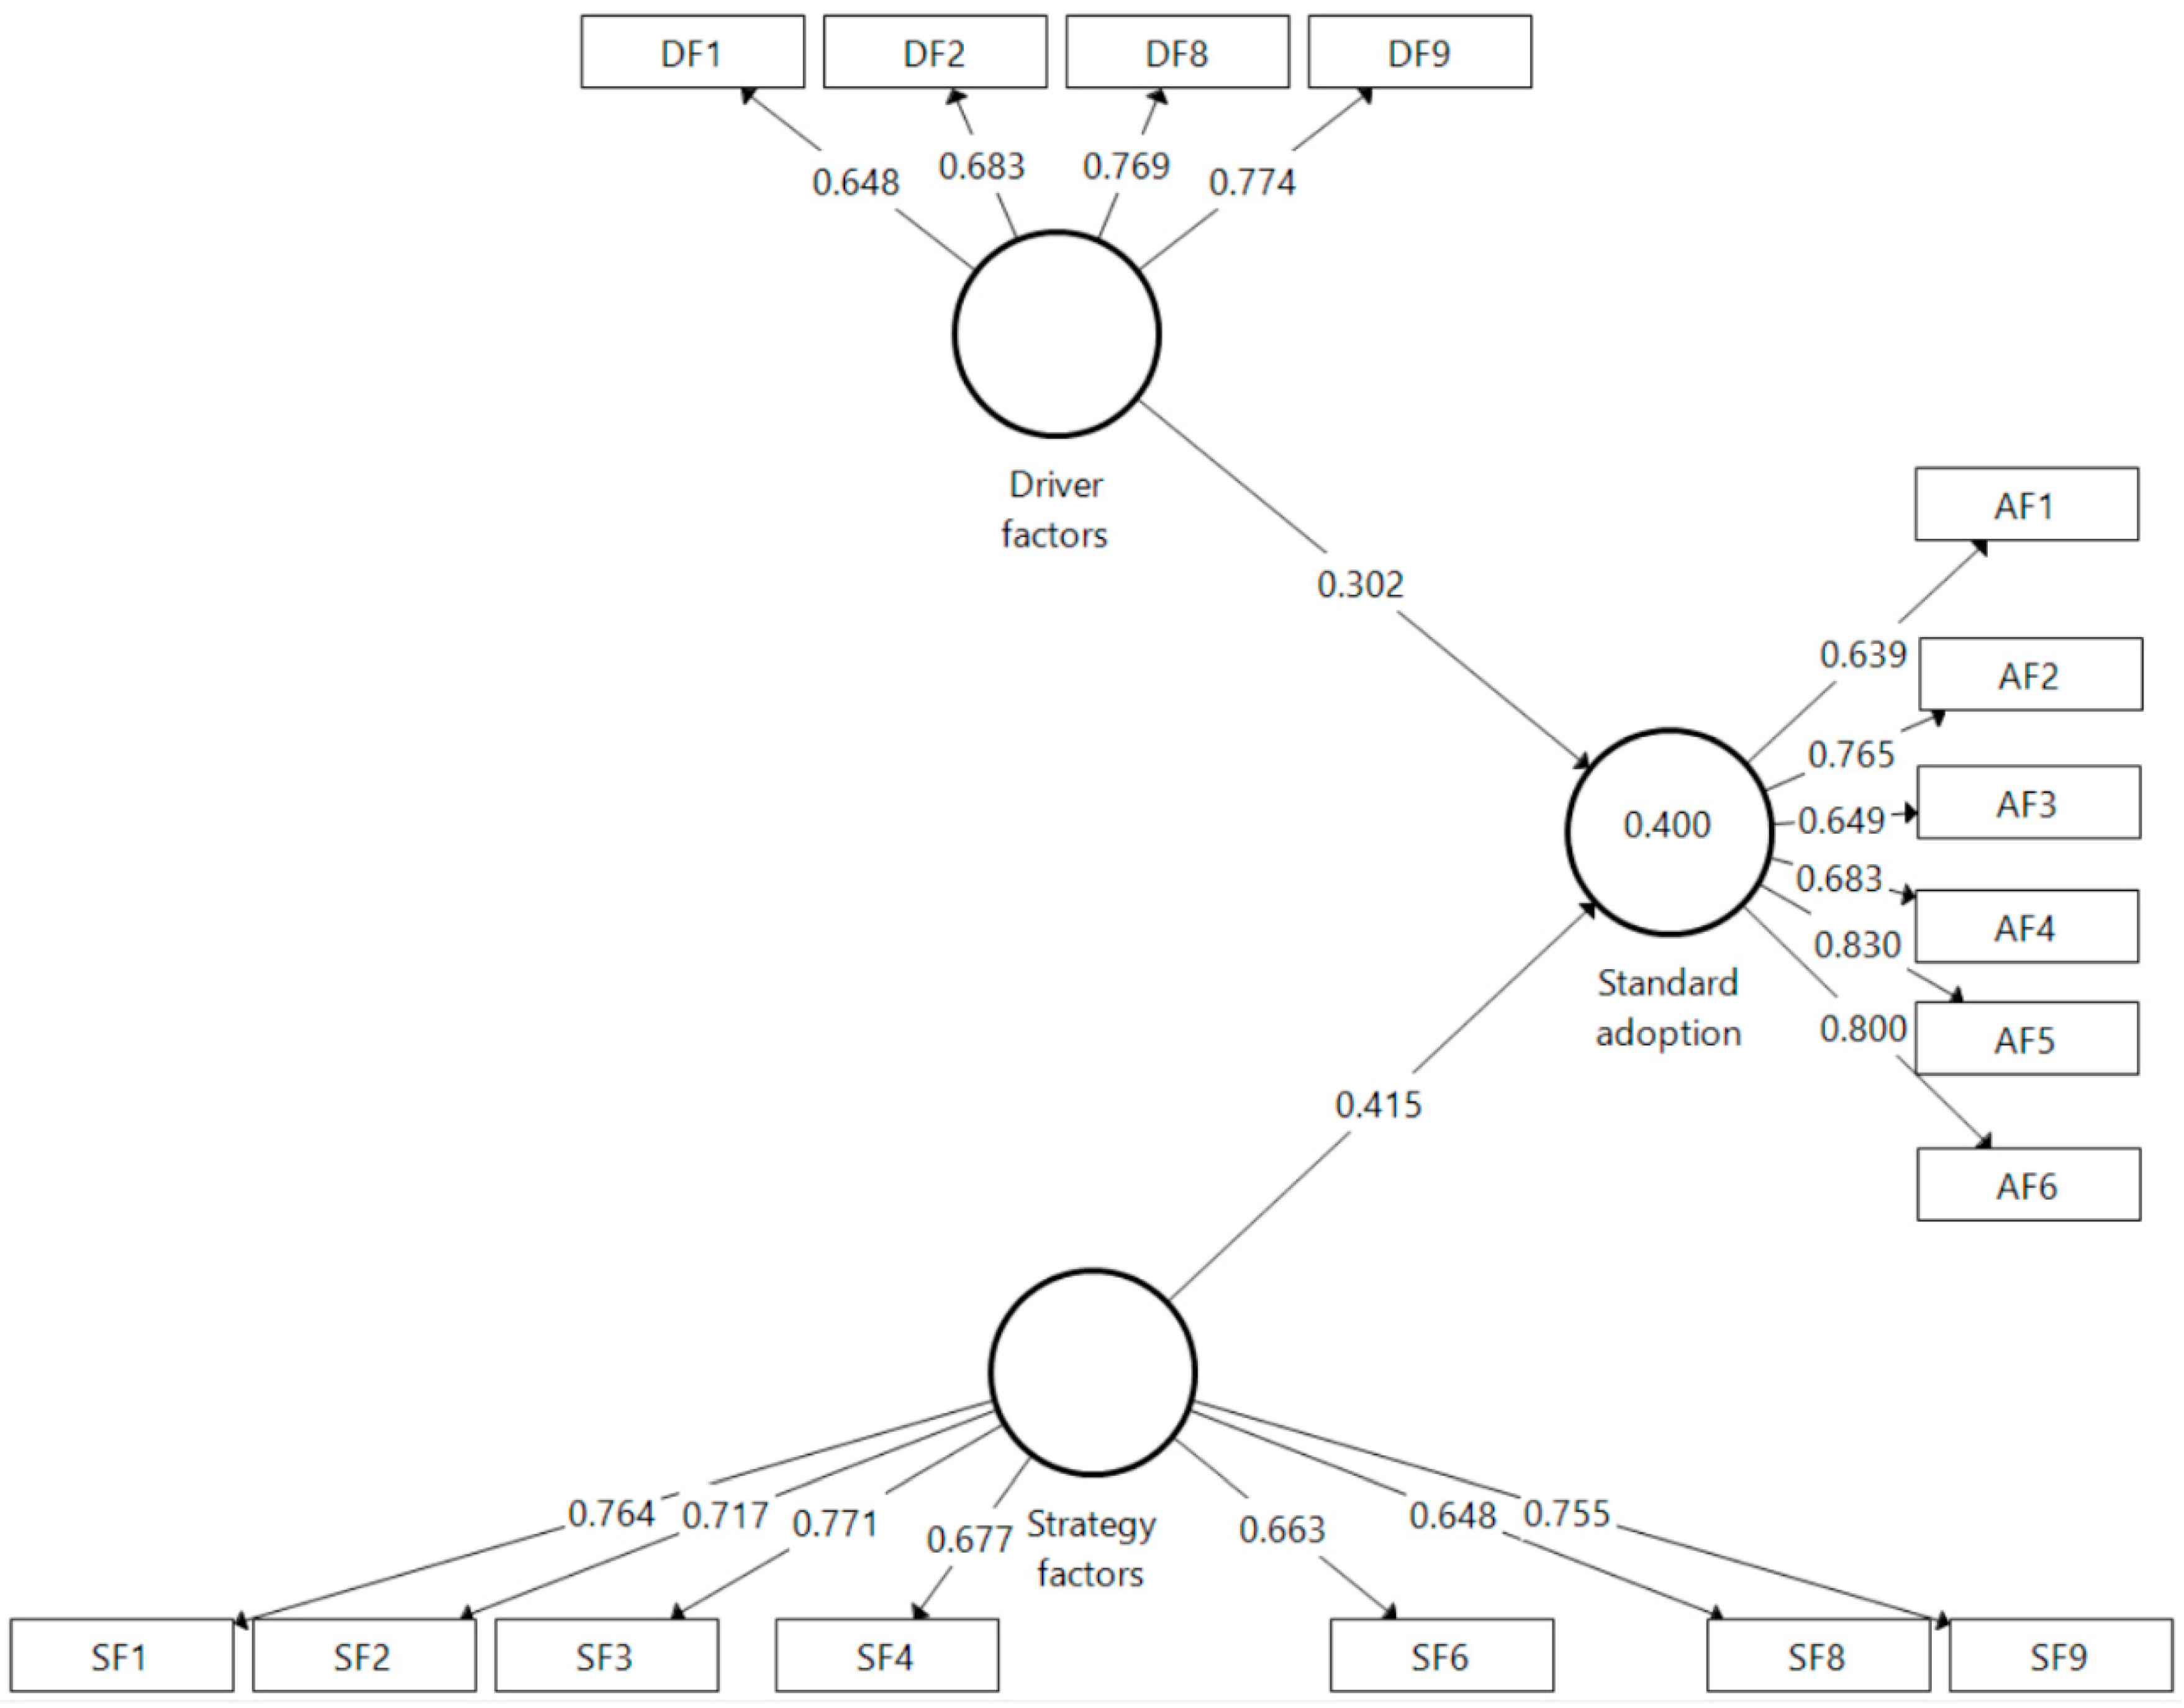
The coefficient of determination (R-squared) is a statistical measure that represents the proportion of variance in the dependent variable that is explained by the independent variables in the model. In this case, the R-squared value of the SEM-PLS model is 0.40, which means that 40% of the variance in the dependent variable is explained by the independent variables in the model. A higher R-squared value indicates a stronger relationship between the independent and dependent variables and a better fit of the model to the data. However, the interpretation of the R-squared value may depend on the context of the study and the specific research question.
Step 3: measuring the effect size (f2)
According to [35], the change in R2 value when a specific exogenous construct is removed from the model may be used to assess whether the removed construct has a significant influence on the endogenous constructs, in addition to evaluating the R2 values of all endogenous constructs. The f2 effect size is a common term for this quantification. One such formula for expressing the extent of the impact is shown below [44,45,46].
According to [25,47], f2 measures how much each external latent construct influences the corresponding endogenous latent construct. The coefficient of determination (R2) changes when an independent construct is removed from the path model, indicating whether the value of the latent exogenous construct had a substantial impact on the value of the latent endogenous construct before its removal. Based on [44], the f2 values were 0.35 (high impact), 0.15 (moderate effect), and 0.02 (low effect) (see Table 9).
Step 4: blindfolding and predictive relevance (Q2)
Data points representing indicators of a chosen endogenous latent variable are omitted from the analysis, and the resulting variables are anticipated, as shown by [35]. The blind approach may then evaluate how well the anticipated values match the actual ones. Predictive accuracy in a route model is high if the predicted value is relatively close to the actual value, while Q2 values larger than 0 show that the model has predictive significance for a certain endogenous construct and are calculated by subtracting the observed value from the predicted value and adding a trivial prediction error (specified as the mean of the remaining data). On the other hand, negative numbers have no predictive value.
According to [47], the blindfold approach is only used for endogenous single-item constructs and endogenous constructs with a reflecting measurement model specification. Blind calculations and cross-validation redundancy are used to determine Q2 statistics as a quality metric for the PLS route model. Predicting the endogenous latent constructs is highly recommended by the Q2 criteria (see Table 10).
Predictive relevance (Q2) is a statistical measure used to evaluate the predictive power of a structural equation modeling (SEM) model. In this case, the SEM-PLS model has a Q2 value of 0.195, which means that the model can predict the endogenous latent components with an accuracy of 19.5%. A higher Q2 value indicates a better predictive power of the model. However, the interpretation of the Q2 value may depend on the context of the study and the specific research question. In general, a Q2 value greater than zero suggests that the model has predictive power, while a negative Q2 value indicates that the model has no predictive power.
Step 5: The goodness of fit of the model—GoF
To ensure that the model adequately describes the data, the goodness of fit (GoF) is used as a comprehensive measure for the model fit. In [48], GoF was described as a global fit metric. It is the geometric mean of the average R2 of the endogenous variables and the average variance extracted (AVE). GoF was developed to take into consideration the research model in its whole [30,49,50], including its measurement and structural components. GoF can be calculated using the following formula:
GoF = ( R 2 * AVE 2 ) = 0.4569
According to [51], a globally valid PLS model must have either a GoF value of zero, a small GoF value, a medium GoF value, or a high GoF value. The following table lists these factors (see Table 11).
The goodness-of-fit (GoF) index is a statistical measure used to evaluate how well a structural equation modeling (SEM) model fits the data. In this case, the SEM-PLS model has a GoF value of 0.4569. A GoF value of 0.4569 suggests that the model has some degree of fit with the data, but the fit may not be optimal. However, the interpretation of the GoF value may depend on the context of the study and the specific research question. In general, a GoF value between 0.1 and 0.25 is considered weak, between 0.25 and 0.5 is moderate, and above 0.5 is strong. It is also important to note that the interpretation of the GoF index should be considered along with other statistical measures, such as the coefficient of determination (R-squared) and the predictive relevance (Q2), to provide a more comprehensive assessment of the model’s quality.
In order to investigate the structural model, it is important to grasp how the PLS-SEM adapts the model to empirical data in order to achieve optimal estimates of the parameters by maximizing the explained variance of the latent endogenous variable [52]. The disadvantage of using goodness-of-fit measurements for the model, the structural model in PLS-SEM, is evaluated using heuristic criteria established by [35]. This is because the model is seen to be well stated if it can accurately predict endogenous components [53]. According to Table 11, the effect of our model’s GoF result of 0.4569 on standard adoptions is minimal, falling between 0.1 and 0.25.
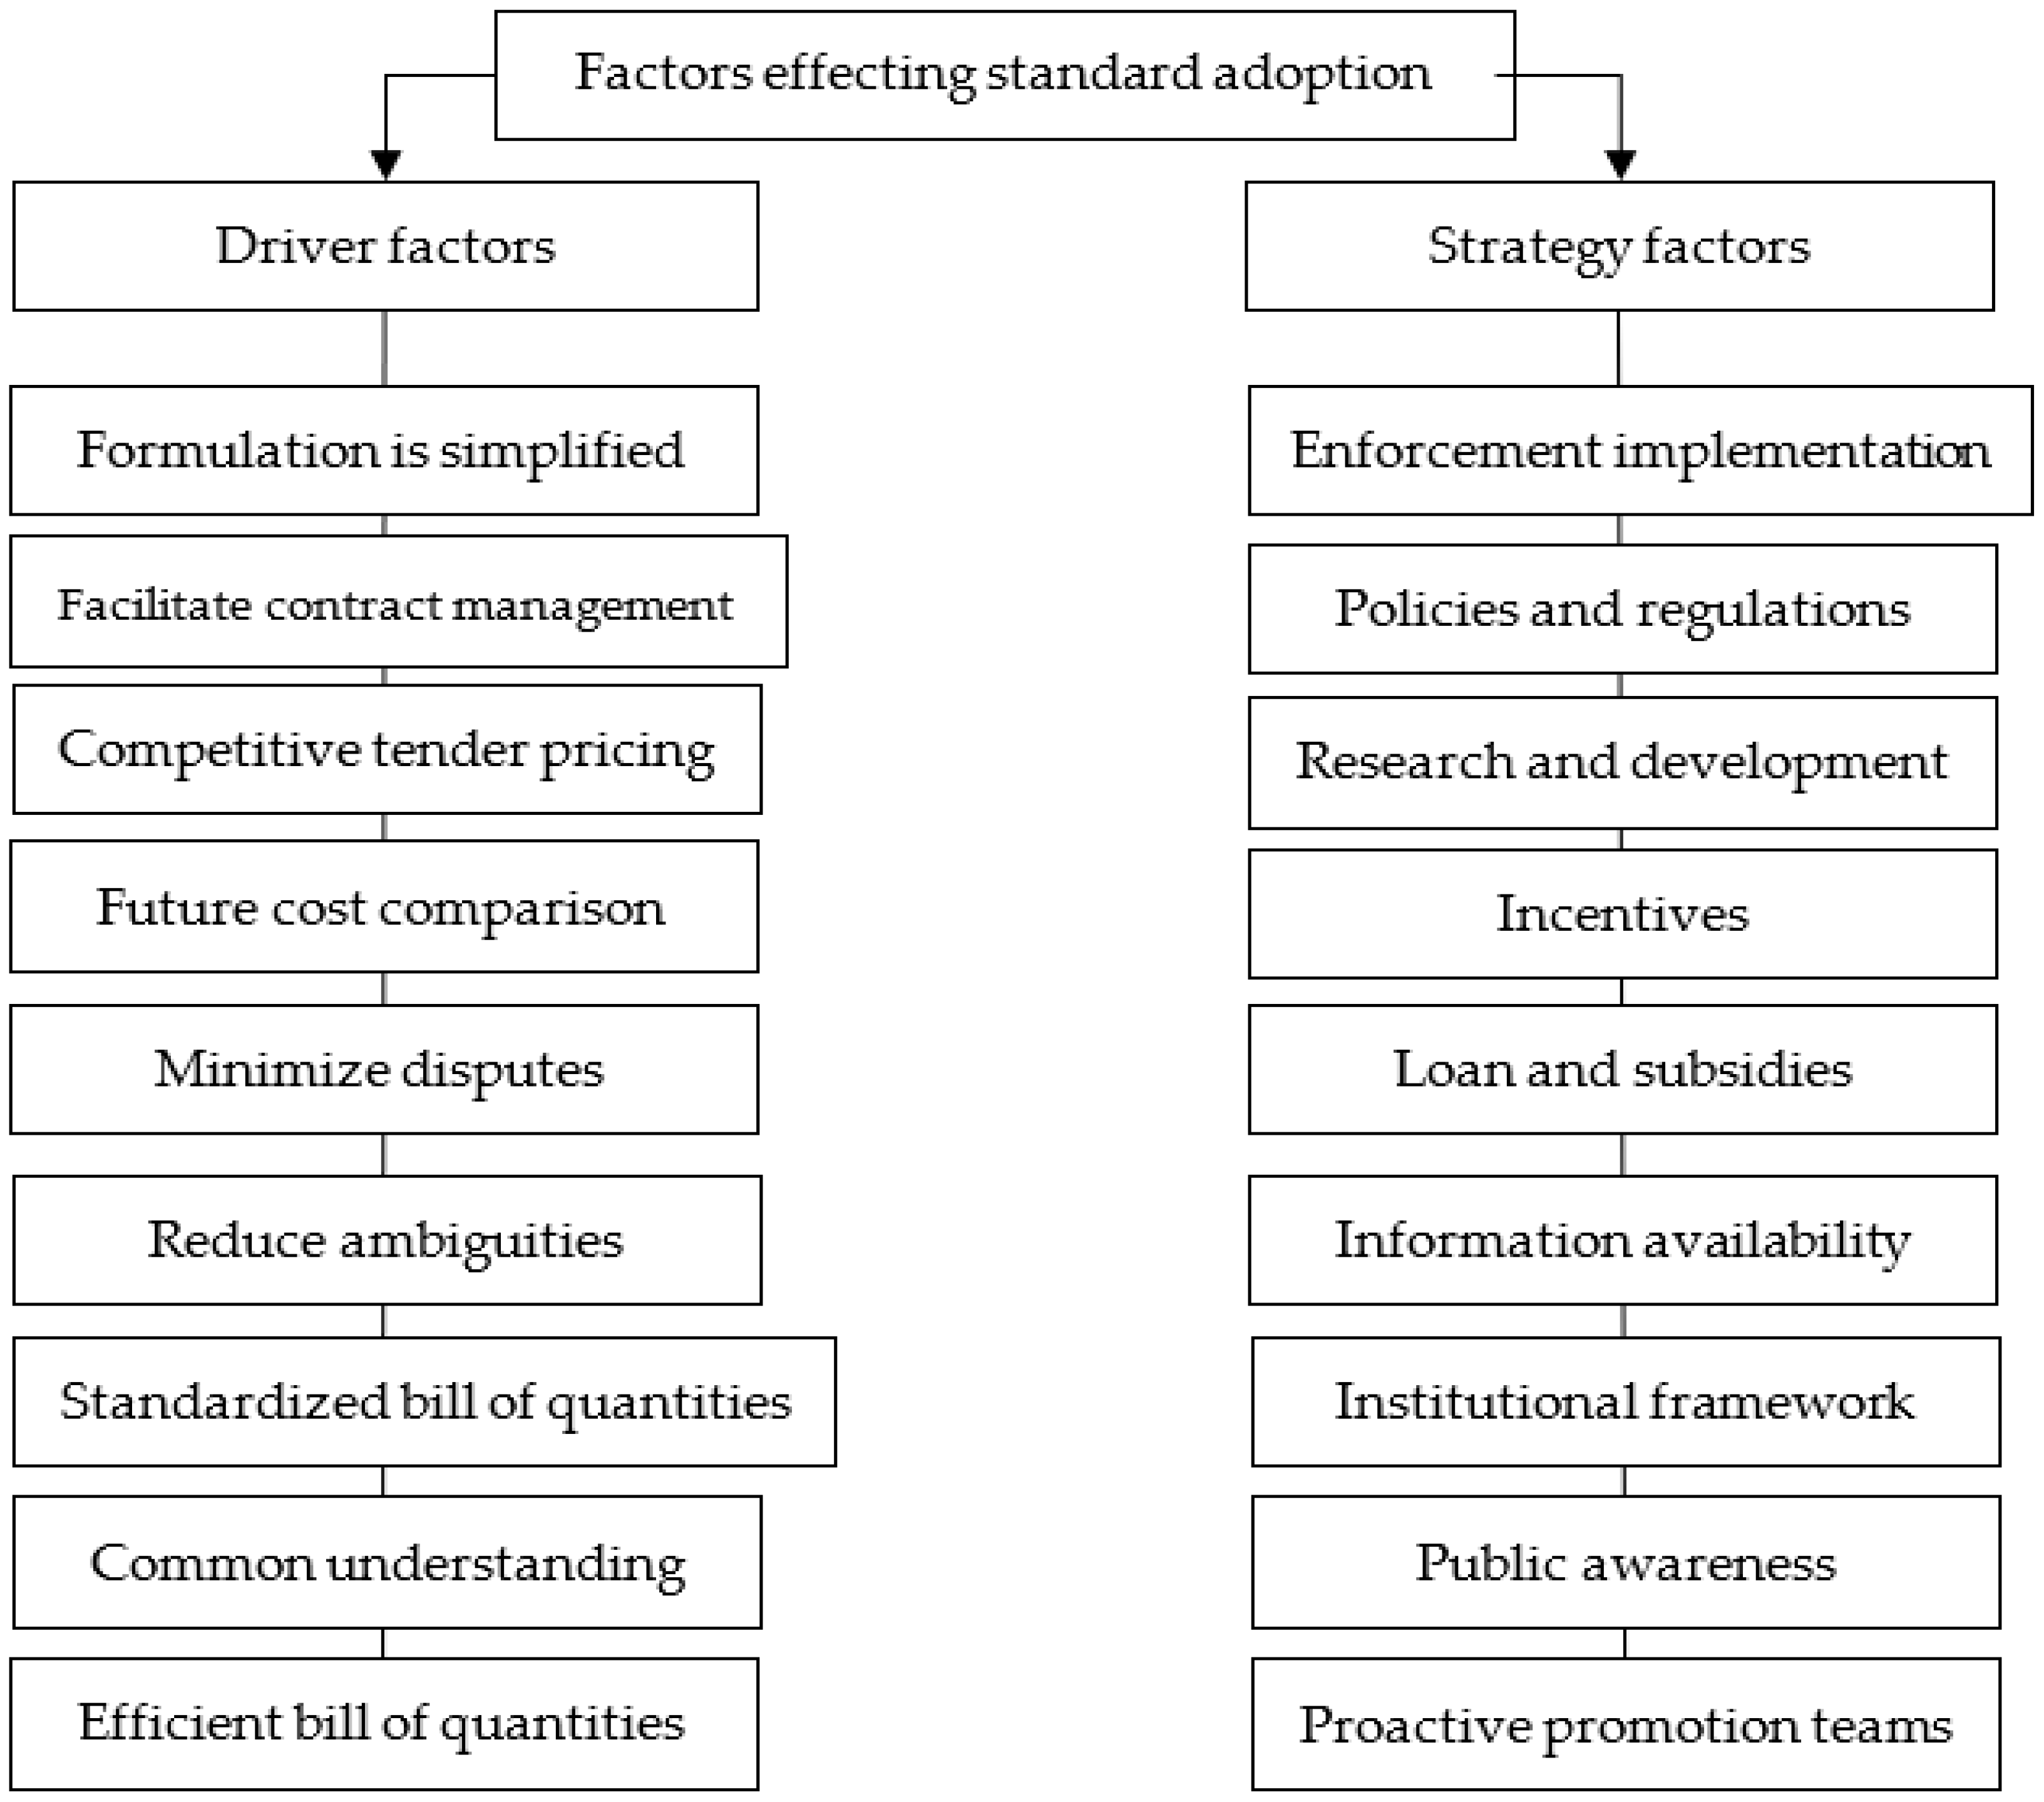
Notwithstanding the lack of resources in this field in poor nations, this research is one of the first to investigate the causes and methods for establishing a civil engineering standard measuring system in building projects in Malaysia. The study’s results also help in the implementation of best practices by identifying the most important drivers and tactics, enabling enterprises and governments interested in this topic to choose the most cost-effective civil engineering projects in the dynamic local construction sector. Analysis of the factor loading reveals that offering an efficient bill of quantities in better arrangement (factor loading = 0.774), and common knowledge in providing consistency, precision, and uniformity for measurement are key driving factors that contribute to standard acceptance (0.769). The third component that helps facilitate contract management is an improvement in construction project control and contract management (0.683). The last motivating aspect is the formulation’s simplification, which results in a competitive and reliable tender price and reduces the likelihood of needless disagreements (0.648).
When considering strategic considerations, however, standard-setting research and development is essential (0.771). Furthermore, it is important to have competent and proactive standard-method-of-measurement promotion teams and local authorities in place to ensure that the adopted standard is used in all cases (0.764) (0.755). Then, with a factor loading of 0.717 comes the implementation of established measuring rules and standards. Financial and additional market-based incentives for the adoption of the standard method of measurement (0.677), improved availability of information on the benefits of the standard method of measurement (0.663), and public awareness through workshops, seminars, and conferences (0.648) are the next three strategy factors. The stakeholders’ team may sort the many drivers and tactics according to the importance and rankings affecting the adoption of the standard, but it is impossible to build a single plan for all the aspects and give them the same attention, time, effort, and money (see Figure 1).
The research aimed to investigate the relationship between the driver and strategy elements in the adoption of standardized measuring techniques in civil construction projects, particularly in emerging nations such as Malaysia. The study used structural equation modeling and the PLS-SEM technique to analyze the data collected through a questionnaire from quantity surveyors at quantity surveying consultancy companies using the standard measurement technique. The results of the study revealed that all classes significantly influence the adoption of the standard technique of assessment, but the barrier factors had the most impact. The adoption of a standardized technique of measuring was significantly impacted by the driver and strategy elements. The coefficient of determination (R-squared value) was found to be 0.4, indicating that 40% of the variance in the dependent variable is explained by the independent variables in the model. Moreover, the predictive relevance (Q2) was found to be 0.195, suggesting that the model can predict the endogenous latent components with an accuracy of 19.5%. Finally, the goodness-of-fit (GoF) index was found to be 0.4569, suggesting that the model fits the data to a moderate degree.
Based on the data, we can identify four drivers and seven strategic elements that influence the pace at which civil engineers adopt a standardized measuring technique. The findings of the structural equation model indicate that all items with factor loadings above the minimum value of 0.6 may explain the connection between driver and strategy factors and the adoption of the standard technique of assessment in construction projects. In contrast, an R-squared value of 0.400 indicates that 40% of the variance in the dependent variable(s) may be accounted for by the presence of one or more predictor factors. In addition, the Q2 is 0.195, which means that the conceptual model may make predictions about endogenous latent constructs. Hence, H1 and H2 are supported by a positive correlation. Our model received a high score on the goodness of fit of the model GoF. On the other hand, the path coefficient of the research hypothesis test, shown by the value of the beta coefficient, characterizes the strength of the relationship between the exogenous and endogenous latent constructs. The two most important determinants of the impact on the adoption of a standard technique of measurement in civil engineering are the driver factors (=0.302) and the strategy factors (=0.415).
The results of the study indicate that the driver and strategy factors have a significant impact on the adoption of standardized measuring techniques in civil construction projects. The finding that barrier factors have the most significant impact highlights the importance of identifying and addressing these barriers to increase the adoption of standardized measuring techniques in the industry. The relatively low R-squared and Q2 values suggest that there may be other factors not included in the model that also influence the adoption of standardized measuring techniques in civil construction projects.
The adoption of a standardized technique for measuring civil construction projects can be influenced by a range of factors, including drivers and strategies. In the context of emerging nations such as Malaysia, these factors may be particularly important due to the unique challenges and opportunities facing these countries. Drivers refer to the factors that motivate or incentivize the adoption of standardized measurement techniques. In the context of civil construction projects, some common drivers include the need for consistency and accuracy in measurement, compliance with industry regulations and standards, and the desire to improve communication and transparency among project stakeholders. Strategies refer to the approaches or methods used to facilitate the adoption of standardized measurement techniques. This may involve the development of training programs, the implementation of new measurement tools and technologies, or the creation of incentives or rewards for using standardized techniques. In emerging nations such as Malaysia, there may be additional drivers and strategies that are particularly relevant. For example, the need to attract foreign investment and compete with other countries in the region may be a driver for the adoption of standardized measurement techniques. Similarly, the use of government policies or regulations to encourage the adoption of standardized techniques may be an important strategy for promoting widespread adoption.
Nonetheless, there are still obstacles to using and implementing conventional measuring procedures when creating a bill of quantities. If the standard document is used, every scope of work will be clearly and frequently stated, ensuring that all contractors that participate in the project tender receive the same, accurate information. Costs associated with bidding uncertainty are reduced or eliminated thanks to this provision, and a more transparent and objective pool of qualified contractors is made possible. As a byproduct, it streamlines contract administration and removes budgetary uncertainty from projects. The standard measurement adaptation technique has been the subject of several investigations, but there has been little effort made to systematically analyze these or other relevant studies. To bridge the communication gap, the article discusses and defines the universally accepted measuring system in the building sector. This standardized way of measuring has not been widely used, however, and this is something that consultants, contractors, and clients in building projects are aware of. Quantifying building efforts is crucial for financial planning. A bill of quantities created from architectural and engineering drawings is the standard starting point for a quantity surveyor’s work in the construction and civil engineering industries [5,7,20]. Disputes may be avoided with methodical bill of quantities preparation. As such, there has to be consistency in how uniformity is measured. The Malaysian Civil Engineering Standard Measurement Method (MyCESMM) was used for engineering projects, whereas the Malaysian Standard Method of Measurement of Building Works (SMM2) was used for construction [7,21,22]. Disparities in measurement accuracy were a driving factor in deciding to conduct this investigation. According to Molloy, consultants employed conventional in-house measuring techniques, including several classifications and descriptions of the same thing (2007). According to [21], RICS found 46 different standardized measuring methodologies throughout the world’s 27 nations. A literacy report notes, however, that some nations utilize a variety of non-conforming assessment techniques. In [7], the authors provided more evidence of this issue by showing that no data from a global survey database (RICS 2003) because the members of RICS Malaysia did not investigate the reliability of the currently used measurement method. Key players in Malaysia’s construction sector referred to a wide range of measurement protocols for building and civil engineering despite a long gap in the research window (2003–2018). Although there have been empirical studies, [7] noted, “there has been no coordinated effort to solve the issue that affects Malaysia’s building sector”.
Adopting standardized measurement methods in civil engineering construction projects can provide several benefits, including
  • Consistency: standardized measurement methods ensure consistency in the measurement and reporting of construction project quantities, which can help to reduce errors and discrepancies in the measurement process.
  • Improved accuracy: standardized measurement methods typically involve using more accurate and precise measurement tools and techniques, which can help to improve the accuracy of the measurements.
  • Efficiency: standardized measurement methods can help to streamline the measurement process, reducing the time and effort required to measure and report quantities. This can lead to increased efficiency and reduced costs.
  • Transparency: standardized measurement methods provide a transparent and objective way of measuring and reporting quantities, reducing the potential for disputes and conflicts between project stakeholders.
  • Improved communication: standardized measurement methods can help to improve communication between project stakeholders, providing a common language for discussing and reporting project quantities.
  • Compliance: standardized measurement methods are often required by industry regulations and standards, ensuring compliance with legal and regulatory requirements.

5. Conclusions

This study is one of the first to examine the factors motivating and influencing the adoption of a standardized measuring approach in Malaysian building projects. The study’s findings help increase the likelihood of adoption by defining the most effective strategies, giving businesses and governments the tools they need to implement the most effective method for delivering efficient civil engineering projects at the lowest possible cost in the highly competitive local construction market.
This research fills a gap in the literature by empirically examining the influence of public project drivers and strategy elements on standard adoption in the context of the civil engineering construction sector. Neither the conventional technique of measurement nor the connection between driver and strategy variables has been addressed in the existing literature. This connection between two crucial fields and adoption studies in infrastructure projects is philosophically fascinating. Moreover, this work provided a model and used a cutting-edge statistical technique, PLS-SEM, that had been lacking in the existing literature. This research uses the cutting-edge PLS-SEM method to address the issue at hand, which expands our existing understanding. Both the conceptual framework and the hypothesis presented here are sound, result-oriented, and valuable additions to the literature.
Governments and other authoritative bodies may use the findings of this research to better integrate and collaborate with stakeholders throughout a project’s life cycle. Authorities may also aid construction firms in developing additional infrastructure projects via the use of civil engineering measuring standards and coordinated efforts to ensure that bills of quantities are prepared consistently across all jobs. The research also details the steps that may be taken by the government to encourage the adoption of the measuring technique and ensure that it is followed. In addition to explaining why and how standards are adopted, this report makes suggestions for how the Malaysian government might help advance standardization in the country’s civil engineering industry.
Suggestions to increase the use of the metric system in building projects:
(1) Promoting the widespread use of the more accepted measuring technique in both governmental and commercial sector endeavors.
(2) Getting the word out there through traditional and online channels about the norm in order to gain support from the general population.
Thirdly, leadership buy-in is crucial in spreading the word about the standard.
As a result of the importance of their work, construction professionals also place a premium on (4) educational and training opportunities.
(5) Provide a public and institutional framework for an effective and enhanced current civil engineering standard method of measuring towards creating bills of quantities in the construction sector, and publicly acknowledge and reward the adopters of this approach.
(6) The standard has to reflect the most up-to-date technologies in order to align the measuring technique for the future benefit of the building industry.
While the standard’s primary purpose is to spread awareness of the strategies among those with a stake in the construction industry, it will also serve as a useful resource for educators, particularly those who are responsible for instructing students in the methods of measuring construction projects. A prospective quantity surveyor’s awareness and understanding of measurement standardization will be critical if he or she is to persuade other parties to adopt the standard and reap its advantages.
Theoretical Implications:
The study’s findings have several theoretical implications for the field of civil engineering and construction management. Firstly, the research has identified the significant role that both driver and strategy elements play in the adoption of standardized measurement techniques. This understanding provides valuable insights into the factors that influence decision making in the construction industry. Furthermore, the use of structural equation modelling and the PLS-SEM technique in this study can serve as a reference for future researchers who wish to investigate the adoption of standardized techniques in other areas of construction management.
Practical Implications:
The study’s findings have practical implications for professionals in the construction industry, particularly in emerging nations such as Malaysia. The identification of the barrier factors to adoption can help practitioners to develop strategies to overcome these obstacles and increase the adoption of standardized measurement techniques. Additionally, the findings can assist organizations in understanding the importance of developing driver and strategy elements to promote the adoption of standardized techniques, ultimately leading to more efficient and effective construction projects.
Limitations:
There are several limitations to this study that should be considered when interpreting the results. Firstly, the study’s sample size was relatively small, comprising only quantity surveyors at quantity surveying consultancy companies in Malaysia. As a result, the findings may not be generalizable to other regions or countries. Additionally, the use of a cross-sectional design limits the study’s ability to establish causality between the variables. Finally, the study relied on self-reported data, which may be subject to response bias.
Based on the findings of the study “Civil Engineering Standard Measurement Method Adoption Using Structural Equation Modelling Approach”, the following recommendations for further research can be suggested:
  • Replication of the study in other emerging nations: The study was conducted in Malaysia, which is an emerging nation. It would be interesting to replicate the study in other emerging nations to investigate if the findings hold true in different contexts.
  • Investigation of other factors influencing adoption: The current study investigated the influence of driver and strategy factors on the adoption of standardized measurement techniques in civil engineering construction projects. Future research can explore other factors that might influence the adoption of the technique, such as organizational culture, management support, and individual characteristics.
  • Use of other data collection methods: The current study used a questionnaire to collect data from quantity surveyors. Future research can employ other data collection methods, such as interviews and focus groups, to obtain more in-depth insights into the factors influencing adoption.
  • Examination of the impact of standard measurement technique adoption: While the current study investigated the factors influencing the adoption of the technique, future research can examine the impact of the adoption on project performance, cost, and quality.
  • Exploration of other statistical techniques: While the study used structural equation modeling (SEM) with partial least squares (PLS) as the analysis technique, future research can explore other statistical techniques such as confirmatory factor analysis (CFA), multiple regression analysis, and exploratory factor analysis (EFA) to investigate the factors influencing the adoption of the technique.

Author Contributions

Conceptualization, S.A.M., K.N.A., M.A.K. (Mukhtar A. Kassem) and M.A.K. (Muhamad Azry Khoiry). Methodology, S.A.M., K.N.A., M.A.K. (Mukhtar A. Kassem) and M.A.K. (Muhamad Azry Khoiry); validation, S.A.M., K.N.A. and M.A.K. (Mukhtar A. Kassem); formal analysis, S.A.M., K.N.A., M.A.K. (Mukhtar A. Kassem) and M.A.K. (Muhamad Azry Khoiry); writing—original draft preparation, S.A.M. and M.A.K. (Mukhtar A. Kassem); writing—review and editing K.N.A.; visualization, S.A.M., K.N.A., M.A.K. (Mukhtar A. Kassem) and M.A.K. (Muhamad Azry Khoiry); supervision, M.A.K. (Mukhtar A. Kassem) and M.A.K. (Muhamad Azry Khoiry); project administration, M.A.K. (Mukhtar A. Kassem) and K.N.A. All authors have read and agreed to the published version of the manuscript.

Funding

This research was funded the Universiti Teknologi Malaysia (UTM) Research Grant Vot No: J130000.7113.05E79 and FRGS/1/2020/SS0/UTM/02/2.

Institutional Review Board Statement

Not applicable.

Informed Consent Statement

Not applicable.

Data Availability Statement

The data sets obtained during and/or analyzed during the current study are available from the corresponding author upon reasonable request.

Acknowledgments

Authors are grateful for financial support from the Universiti Teknologi Malaysia (UTM) for supporting this research and providing research facilities.

Conflicts of Interest

The authors declare no conflict of interest.

References

  1. Department of Statistics Malaysia. Department of Statistics Malaysia, Official Portal. Available online: https://www.dosm.gov.my/v1 (accessed on 12 June 2022).
  2. Jing, Y.; Wakefield, R.; Gunarathna, M.A.C.; Weerasinghe, R.P.N. Prefabricated Building Integrated Photovoltaics: Cost and Deployment. Royal Institution of Chartered Surveyors (RICS) Research Trust. 2019. Available online: https://researchrepository.rmit.edu.au/esploro/outputs/report/Prefabricated-building-integrated-photovoltaics-cost-and-deployment/9921861040801341#details (accessed on 26 June 2022).
  3. Nani, G.; Mills, A.; Adjei-Kumi, T. Misconception about the use of the standard method of measurement in developing countries: A Ghanaian perspective. In Past, Present, and Future: Inaugural Construction Management and Economics Conference; University of Reading: Reading, UK, 2007; pp. 1175–1182. [Google Scholar]
  4. Construction Industry Development Board (CIDB). Malaysian Civil Engineering Standard Method of Measurement (MyCESMM2); CIDB: Kuala Lumpur, Malaysia, 2018.
  5. Hansen, S.; Salim, A.R. Key knowledge generation the importance of standard method of measurement in Indonesian construction industry. Int. J. Technol. Eng. Stud. 2015, 1, 123–128. [Google Scholar]
  6. Mukhtar, A.K. Risk Management Assessment in Oil and Gas Construction Projects Using Structural Equation Modeling (PLS-SEM). Gases 2022, 2, 33–60. Available online: https://www.mdpi.com/2673-5628/2/2/3 (accessed on 18 July 2022).
  7. Nizam Akbar, A.R.; Mohammad, M.F.; Talib, N.A.; Maisham, M. Standardization in construction environment: Adopting standard method of measurements. Asian J. Behav. Stud. (AjBES) 2018, 3, 147–159. [Google Scholar] [CrossRef]
  8. Hair, J.F.; Risher, J.J.; Sarstedt, M.; Ringle, C.M. When to use and how to report the results of PLS-SEM. Eur. Bus. Rev. 2019, 31, 2–24. [Google Scholar] [CrossRef]
  9. Enshassi, A.; Ayash, A.; Mohamed, S. Factors driving contractors to implement energy management strategies in construction projects. J. Financ. Manag. Prop. Constr. 2018, 23, 295–311. [Google Scholar]
  10. Royal Institute of Chartered Surveyors (RICS). RICS New Rules of Measurement: Order of Cost Estimating and Elemental Cost Planning, 1st ed.; Royal Institute of Chartered Surveyors: London, UK, 2012. [Google Scholar]
  11. Charef, R.; Emmitt, S.; Alaka, H.; Fouchal, F. Building information modelling adoption in the European Union: An overview. J. Build. Eng. 2019, 25, 100777. [Google Scholar] [CrossRef]
  12. Nani, G.; Edwards, P.J.; Adjei-Kumi, T.; Badu, E.; Amoah, P. Customization and desirable characteristics of a standard method of measurement for building works in Ghana. Australas. J. Constr. Econ. Build. 2008, 8, 30–40. [Google Scholar]
  13. Nizam Akbar, A.R.; Mohammad, M.F.; Talib, N.A.; Maisham, M. The Implication of the Standard Method of Measurement (SMMs) for Building Works toward Contractors’ Works. In International Civil and Infrastructure Engineering Conference; Springer: Berlin/Heidelberg, Germany, 2014. [Google Scholar]
  14. Cartlidge, D. New Aspects of Quantity Surveying Practice, 3rd ed.; Routledge: London, UK, 2011. [Google Scholar]
  15. Hackett, M.; Statham, G. (Eds.) The Aqua Group Guide to Procurement, Tendering and Contract Administration; John Wiley & Sons: Hoboken, NJ, USA, 2017. [Google Scholar]
  16. Kassem, M.A.; Khoiry, M.A.; Hamzah, N. Evaluation of Risk Factors Affecting Time and Cost of Construction Projects in Yemen. Int. J. Eng. Technol. 2018, 8, 168–178. [Google Scholar]
  17. Darius, P.; Navickas, A.A.; Klumbyte, E.; Seduikyte, L. Comparative Study of Construction Information Classification Systems: CCI versus Uniclass 2015. Buildings 2022, 12, 656. [Google Scholar]
  18. Kasih, R.P.A.; Adi, T.J.W. Construction project productivity assesment model and its implementation in Indonesia construction industry. In MATEC Web of Conferences; EDP Sciences: Les Ulis, France, 2019; Volume 258, p. 02026. [Google Scholar]
  19. Utama, W.P.; Peli, M.; Jumas, D.Y. Standardidasi pengukuran kuantitas pekerjaan konstruksi di Indonesia: Suatu gagasan. In Proceedings of the Prosiding PPIS, Bandung, Indonesia, 29 July 2008. [Google Scholar]
  20. Nizam Akbar, A.R.; Mohammad, M.F.; Norizam, A.; Maisham, M. End users’ perception on the issues pertaining to the current Malaysian standard method of measurements. Malays. Surv. 2014, 49, 15–24. [Google Scholar]
  21. Yusuf, G.A.; Mohamad, S.F. Identification of the potentials and barriers of adopting a standard method of measurement for mechanical and electrical services in Malaysia. OIDA Int. J. Sustain. Dev. 2012, 3, 47–56. [Google Scholar]
  22. Li, X.; Chen, W.; Wang, C.; Kassem, M.A. Study on Evacuation Behavior of Urban Underground Complex in Fire Emergency Based on System Dynamics. Sustainability 2022, 14, 1343. [Google Scholar] [CrossRef]
  23. Ali, K.N.; Alhajlah, H.H.; Kassem, M.A. Collaboration and Risk in Building Information Modelling (BIM): A Systematic Literature Review. Buildings 2022, 12, 571. [Google Scholar] [CrossRef]
  24. A Kassem, M.; Khoiry, M.A.; Hamzah, N. Assessment of the effect of external risk factors on the success of an oil and gas construction project. Eng. Constr. Arch. Manag. 2020, 27, 2767–2793. [Google Scholar] [CrossRef]
  25. Kassem, M.A.; Khoiry, M.A.; Hamzah, N. Theoretical Review on Critical Risk Factors in Oil and Gas Construction Projects in Yemen. Eng. Constr. Archit. Manag. 2020, 28, 934–968. [Google Scholar] [CrossRef]
  26. Muse, A.G.; Sullivan, J.A.; Smith, P. Improving certainty in construction: The need for international standards. In Proceedings of the ICEC XI World Congress, Rio de Janeiro, Brazil, 8–12 October 2016. [Google Scholar]
  27. Adafin, J.; Rotimi, J.; Wilkinson, S. Risk impact assessments in project budget development: Quantity surveyors’ perspectives. Int. J. Constr. Manag. 2020, 20, 13–28. [Google Scholar] [CrossRef]
  28. Davis, P.R.; Love, P.E.D.; Baccarini, D. Bills of quantities nemesis or nirvana? Emerald J. 2009, 27, 99–108. [Google Scholar] [CrossRef]
  29. Chin, W.W. The partial least squares approach tostructural equation modelling. In Modern Methods for Business Research; Marcoulides, G.A., Ed.; Lawrence Erlbaum Associates Publishers: Mahwah, NJ, USA, 1998; pp. 295–336. [Google Scholar]
  30. Henseler, J.; Sarstedt, M. Goodness-of-fit indices for partial least squares path modeling. Comput. Stat. 2013, 28, 565–580. [Google Scholar] [CrossRef] [Green Version]
  31. Henseler, J.; Ringle, C.M.; Sinkovics, R.R. The use of partial least squares path modeling in international marketing. Adv. Int. Mark. 2009, 20, 277–319. [Google Scholar]
  32. Hulland, J.S. Use of Partial Least Squares (PLS) in Strategic Management Research: A Review of Four Recent Studies. Strateg. Manag. J. 1999, 20, 195–204. [Google Scholar] [CrossRef]
  33. Rahman, I.A.; Memon, A.H.; Azis, A.A.A.; Abdullah, N.H. Modeling Causes of Cost Overrun in Large Construction Projects with Partial Least Square-Sem Approach: Contractor’s perspective. Res. J. Appl. Sci. Eng. Technol. 2013, 5, 1963–1972. [Google Scholar] [CrossRef] [Green Version]
  34. Mohammed, H.Z.; Kassemc, M.A.; Alic, K.N.; Khoiryd, M.A. A New Perspective on the Relationship Between the Construction Industry Performance and The Economy Outcome-A Literature Review. J. Kejuruter 2022, 34, 191–200. [Google Scholar] [CrossRef]
  35. Hair, J.F.J.; Hult, G.T.M.; Ringle, C.; Sarstedt, M. A Primer on partial least squares structural equation modeling (PLS-SEM). Long Range Plan. 2014, 46, 184–185. [Google Scholar] [CrossRef]
  36. Sarstedt, M.; Ringle, C.M.; Hair, J.F. Partial Least Squares Structural Equation Modeling. In Handbook of Market Research; Springer: Berlin/Heidelberg, Germany, 2017; Available online: http://link.springer.com/10.1007/978-3-319-05542-8_15-1 (accessed on 3 September 2022).
  37. Bahamid, R.A.; Doh, S.I.; Khoiry, M.A.; Kassem, M.A.; Al-Sharafi, M.A. The Current Risk Management Practices and Knowledge in the Construction Industry. Buildings 2022, 12, 1016. [Google Scholar] [CrossRef]
  38. Sohrabinejad, A.; Rahimi, M. Risk Determination, Prioritization, and Classifying in Construction Project Case Study: Gharb Tehran Commercial-Administrative Complex. J. Constr. Eng. 2015, 2015, 1–10. [Google Scholar] [CrossRef] [Green Version]
  39. Hair, J.F.; Ringle, C.M.; Sarstedt, M. PLS-SEM: Indeed a Silver Bullet. J. Mark. Theory Pract. 2011, 19, 139–152. [Google Scholar] [CrossRef]
  40. Li, X.; Wang, C.; Kassem, M.A.; Liu, Y.; Ali, K.N. Study on Green Building Promotion Incentive Strategy Based on Evolutionary Game between Government and Construction Unit. Sustainability 2022, 14, 10155. [Google Scholar] [CrossRef]
  41. Hair, J.F.; Black, W.C.; Babin, B.J.; Anderson, R.E. Multivariate Data Analysis; Prentice Hall: Hoboken, NJ, USA, 2010. [Google Scholar]
  42. Elliott, A.C.; Woodward, W.A. Statistical Analysis Quick Reference Guidebook: With SPSS Example; Sage Publication: New York, NY, USA, 2007; Available online: http://www.sagepub.com/books/Book229160 (accessed on 5 September 2022).
  43. Hengky, L.; Jabbour, C.J.C.; de Sousa Jabbour, A.B.L. Social media as a form of virtual whistleblowing: Empirical evidence for elements of the diamond model. J. Bus. Ethics 2021, 174, 529–548. [Google Scholar]
  44. Cohen, J. Statistical Power Analysis for the Behavioral Sciences, 2nd ed.; Academic Press: New York, NY, USA, 1988; pp. 1–3. [Google Scholar] [CrossRef]
  45. Cohen, U.; Callaghan, W.; Ringle, C.M. Exploring Causal Path Directionality for a Marketing Model. 2007. Available online: https://repository.ubn.ru.nl/bitstream/handle/2066/46410/46410.pdf. (accessed on 15 September 2022).
  46. Selya, A.S.; Rose, J.S.; Dierker, L.C.; Hedeker, D.; Mermelstein, R.J. A Practical Guide to Calculating Cohen’s f2, a Measure of Local Effect Size, from Proc Mixed. Front. Psychol. 2012, 3, 111. [Google Scholar] [CrossRef] [Green Version]
  47. Hussain, S.; Fangwei, Z.; Siddiqi, A.F.; Ali, Z.; Shabbir, M.S. Structural Equation Model for Evaluating Factors Affecting Quality of Social Infrastructure Projects. Sustainability 2018, 10, 1415. [Google Scholar] [CrossRef] [Green Version]
  48. Roemer, E. A tutorial on the use of PLS path modeling in longitudinal studies. Ind. Manag. Data Syst. 2016, 116, 1901–1921. [Google Scholar] [CrossRef]
  49. Liu, J.; Zhao, X.; Yan, P. Risk Paths in International Construction Projects: Case Study from Chinese Contractors. J. Constr. Eng. Manag. 2016, 142, 1–11. [Google Scholar] [CrossRef]
  50. Esposito Vinzi, V.; Chin, W.W.; Henseler, J.; Wang, H. Handbook of Partial Least Squares: Concepts, Methods and Applications; Springer: Berlin/Heidelberg, Germany, 2010. [Google Scholar]
  51. Wetzels, M.; Odekerken-Schröeder, G.; Van Oppen, C. Using PLS Path Modeling for Assessing Hierarchical Construct Models: Guidelines and Empirical Illustration. MIS Q. 2009, 33, 177. [Google Scholar] [CrossRef]
  52. Li, X.; Wang, C.; Kassem, M.A.; Alhajlah, H.H.; Bimenyimana, S. Evaluation Method for Quality Risks of Safety in Prefabricated Building Construction Using SEM–SDM Approach. Int. J. Environ. Res. Public Health 2022, 19, 5180. [Google Scholar] [CrossRef]
  53. Rigdon, E.E. Rethinking Partial Least Squares Path Modeling: In Praise of Simple Methods. Long Range Plan. 2012, 45, 341–358. [Google Scholar] [CrossRef]
Figure 1. Driver and strategy factors in previous studies.
Buildings 13 00963 g001
Figure 2. The hypotheses of the research. Note: DF—driver factor; SF—strategy factor.
Buildings 13 00963 g002
Figure 3. Driver and strategy factors’ influence on standard adoption relationship model using the PLS-SEM methodology. Note: DF—driver factor; SF—strategy factor; AF—adoption factor.
Buildings 13 00963 g003
Figure 4. Convergent validity of measurement model (R2 and factor loading).
Buildings 13 00963 g004
Figure 5. Structural model assessment procedure.
Buildings 13 00963 g005
Figure 6. Path analysis of the research hypotheses.
Buildings 13 00963 g006
Table 1. Demographic characteristics of respondents.
ProfileFrequency%
Gender
    Male8249.1
    Female 8550.9
Age
    Less 25 years3319.8
    25–30 years5935.3
    31–40 years6136.5
    41–50 years63.6
    >50 years84.8
Position
    Director63.6
    Senior quantity surveyor3219.2
    Quantity surveyor8852.7
    Assistant quantity surveyor3219.2
    Others95.4
Experience
    <5 years7243.1
    5–10 years5130.5
    11–20 years3319.8
    21–30 years74.2
    >30 years42.4
Table 2. Data analysis steps using the PLS-SEM method.
PLS-SEMAssessment of measurement model
(Outer model)
Convergent validity
Individual item reliability
Composite reliability
The average variance extracted (AVE)
Discriminate validity
Cross loading
Variable correlation (root square of AVE)
Assessment of structural model
(Inner model)
The hypothesis testing (path coefficient)
The coefficient of determination—R2
Effect size—f2
Predictive relevance—Q2
The goodness of fit of the model—GoF
Table 3. Result of measurement model—convergent validity.
Exogeneous ConstructsItemsLoadingsAlphaCRAVE
Driver factors—DFDF10.6130.7820.8150.341
DF20.613
DF30.379
DF40.475
DF50.398
DF60.564
DF70.514
DF80.775
DF90.782
Strategy factors—SFSF10.7510.8660.8910.477
SF20.716
SF30.759
SF40.701
SF50.576
SF60.672
SF70.633
SF80.635
SF90.751
Endogenous constructs
Standard adoption—AF
AF10.6500.8250.8720.534
AF20.764
AF30.652
AF40.682
AF50.823
AF60.794
Table 4. Results of measurement model—convergent validity iteration 2.
Exogeneous ConstructsItemsLoadingsAlphaCRAVE
Driver factors—DFDF10.6480.6920.8110.519
DF20.683
DF80.769
DF90.774
Strategy factors—SFSF10.7640.8420.8800.512
SF20.717
SF30.771
SF40.677
SF60.663
SF80.648
SF90.755
Endogenous constructs
Standard adoption—AF
AF10.6390.8250.8720.535
AF20.765
AF30.649
AF40.683
AF50.830
AF60.800
Table 5. Discriminant validity—Fornell–Larcker—driver and strategy factors.
Driver FactorsStrategy Factors
Driver factors0.720
Strategy factors0.5440.715
Table 6. Discriminant validity—cross loading for driver and strategy factors.
Driver FactorsStrategy Factors
DF10.6480.364
DF20.6830.254
DF80.7690.469
DF90.7740.477
SF10.4700.764
SF20.2230.717
SF30.5430.771
SF40.3980.677
SF60.3380.663
SF80.2580.648
SF90.4010.755
Table 7. Path coefficient of the research hypotheses.
No.HypothesesOriginal Sample (O)Sample Mean (M)Standard Deviation (STDEV)T Statistics
(|O/STDEV|)
p ValuesDecision
1Driver factors → Standard Adoption0.3020.3080.0853.5440.000Supported
2Strategy factors → Standard Adoption0.4150.4220.0656.4080.000Supported
Note: p < 0.01.
Table 8. R-square of the endogenous latent variables.
Construct RelationR2Result
Influence of driver and strategy factors on standard adoption0.400 *Moderate
* Note: In particular, [29] recommended that R2 values over 0.67 are strong, R2 values between 0.19 and 0.33 are moderate, R2 values below 0.19 are undesirable.
Table 9. Assessment of effect size (f2).
No.ConstructsEffective Size f2Result
1Driver factors0.107 *Small
2Strategy factors0.202 *Medium
Note(s): * interpreting effect size (f2) [44]; f2 above 0.35 is considered a large effect size; f2 ranging from 0.15 to 0.35 is a medium effect size; f2 between 0.02 and 0.15 is considered a small effect size.
Table 10. Results of predictive relevance (Q2) values.
Endogenous Latent VariablesSSOSSEQ2 (=1 − SSE/SSO)
Influence of driver and strategy factors on standard adoption1002.000806.1910.195
Table 11. Value of goodness of fit of the model (GoF).
GoF less than 0.1No fit
GoF between 0.1 and 0.25Small
GoF between 0.25 and 0.36Medium
GoF greater than 0.36Large
Disclaimer/Publisher’s Note: The statements, opinions and data contained in all publications are solely those of the individual author(s) and contributor(s) and not of MDPI and/or the editor(s). MDPI and/or the editor(s) disclaim responsibility for any injury to people or property resulting from any ideas, methods, instructions or products referred to in the content.

