
A BIA-Based Quantitative Framework for Built Physical Asset Criticality Analysis under Sustainability and Resilience


Abstract
:1. Introduction
- How to consider business continuity aspects when determining asset criticality?
- How can asset criticality analysis reflect tradeoffs between resilience and sustainability metrics?
2. Literature Review
2.1. Physical Asset Criticality Analysis
2.2. Business Impact Aanalysis
2.3. Sustainability and Resilience Assessment
2.4. Literature Gap and Our Contributions
- Proposing a new BIA-based physical asset criticality analysis framework that considers sustainability and resilience factors for asset-intensive companies will provide top managers with valuable information for deciding on their physical assets’ contingency and continuity plans.
- The relationship between business continuity management and asset management is addressed.
- Proposing a probabilistic graphical model by combining fuzzy DEMATEL and the Bayesian network approaches to assess physical asset criticality.
- Introducing an aggregate asset criticality index by applying the best-worst method and considering environmental, social, economic, and resilience factors will help managers prioritize assets.
- Providing a case study in a gas plant to show the applicability of the proposed framework.
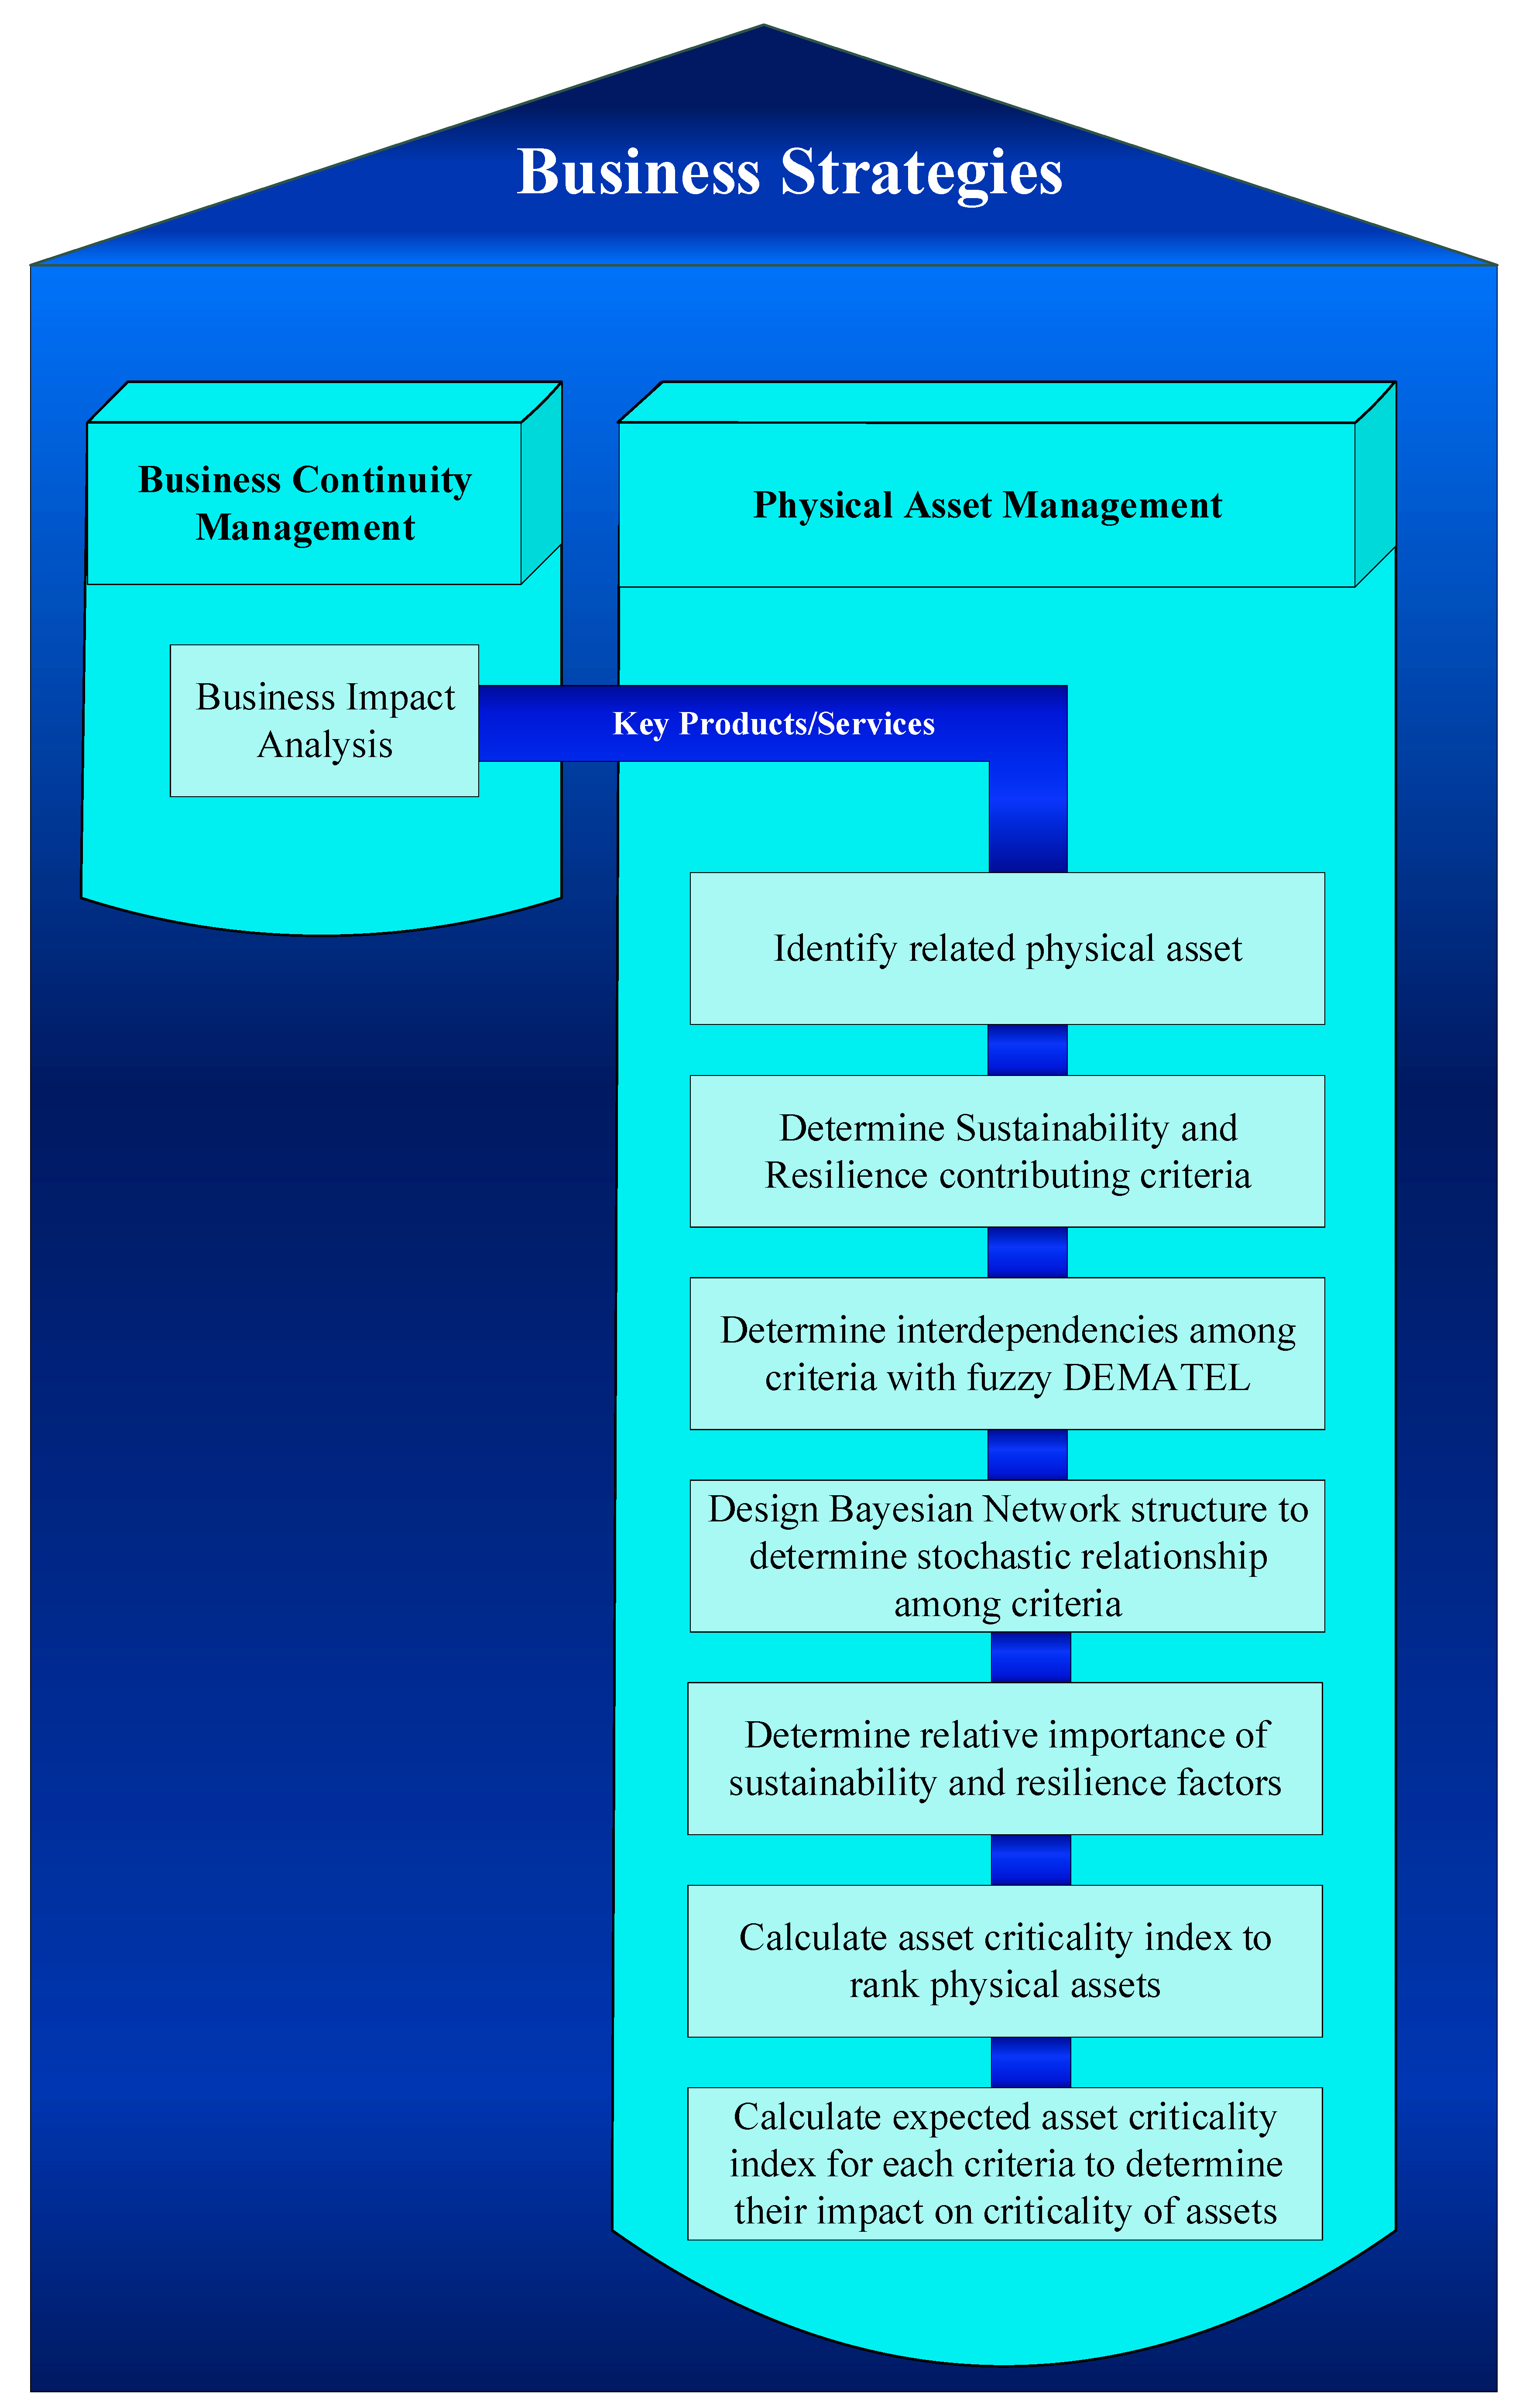
3. Proposed BIA-Based Mixed Sustainability-Resilience Framework for Physical Asset Criticality Analysis
3.1. Determination of Key Products
3.2. Identification of Critical Physical Assets
3.2.1. Sustainability and Resilience Factors
- ▪
- Sustainability:
- ▪
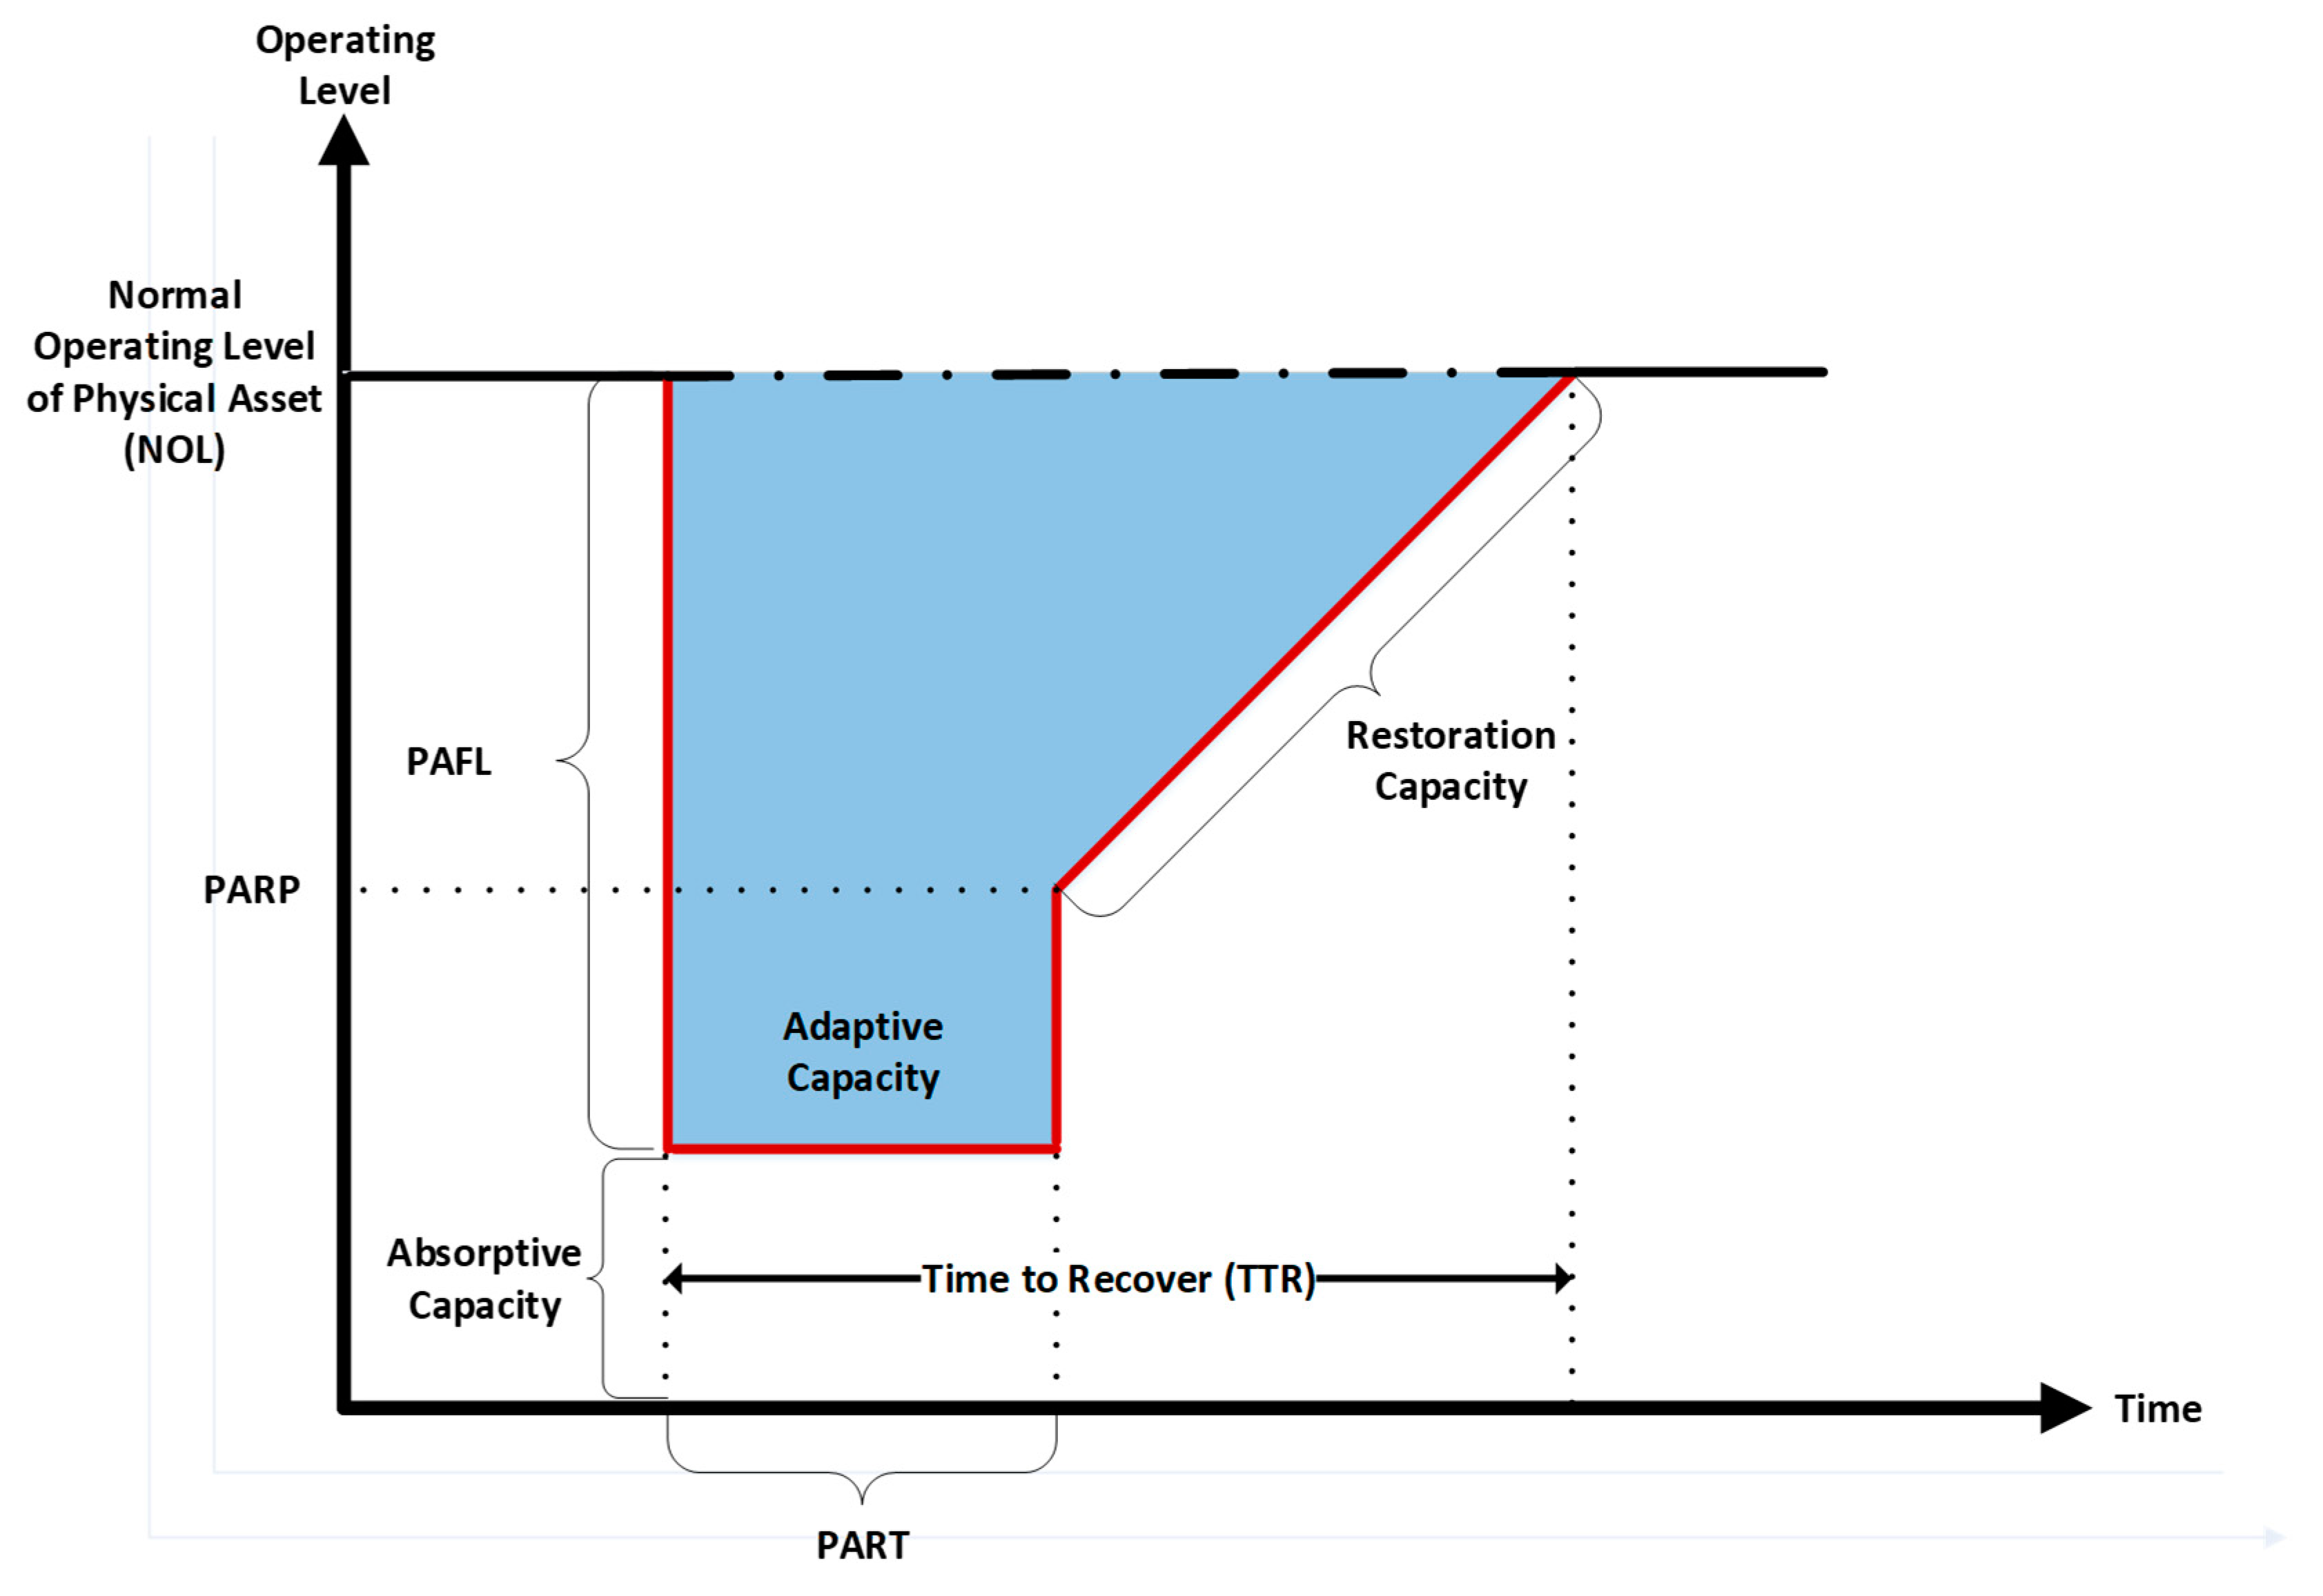
- Resilience:
3.2.2. Identifying Interdependencies, among Sustainability and Resilience Factors
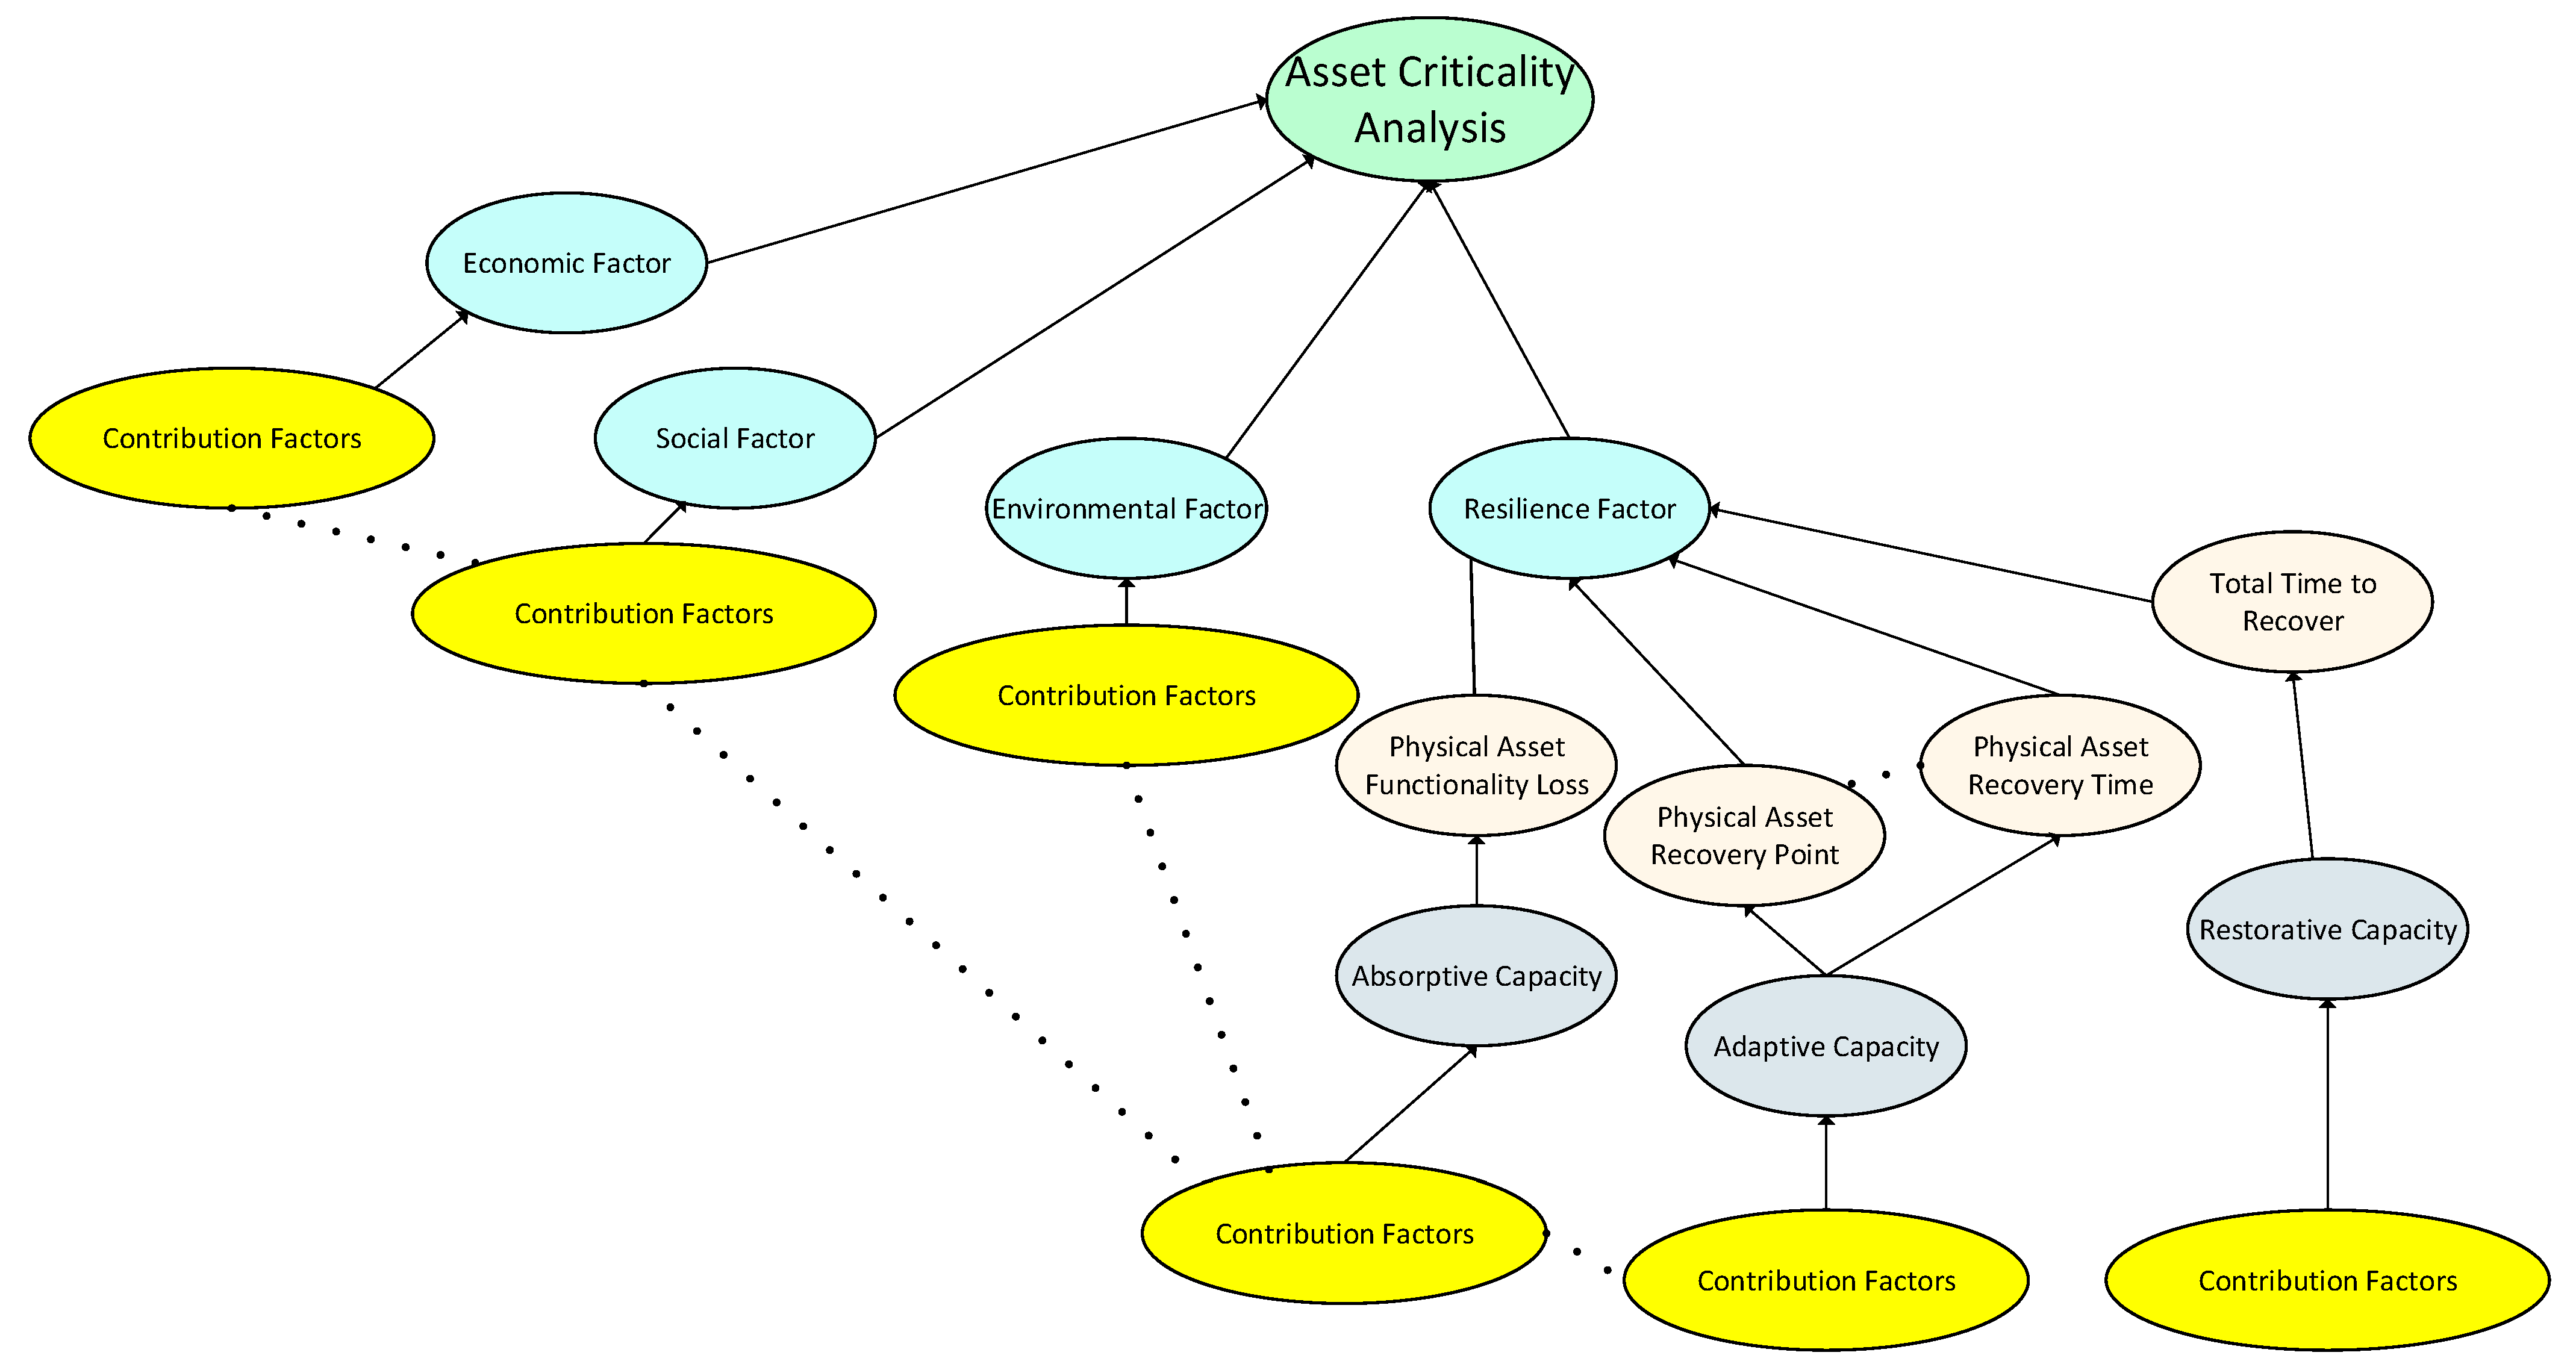
3.2.3. Bayesian Network Structure for Physical Asset Criticality Analysis
- The initial threshold for determining the causal relations may be defined imprecisely by experts. Therefore, the threshold can be modified to identify strong relationships between sustainability and resilience factors.
- In conducting the FDEMATEL survey, experts may indicate the correlation among the factors rather than causal relationships. Therefore, experts should review the graph to identify such correlations and eliminate them.
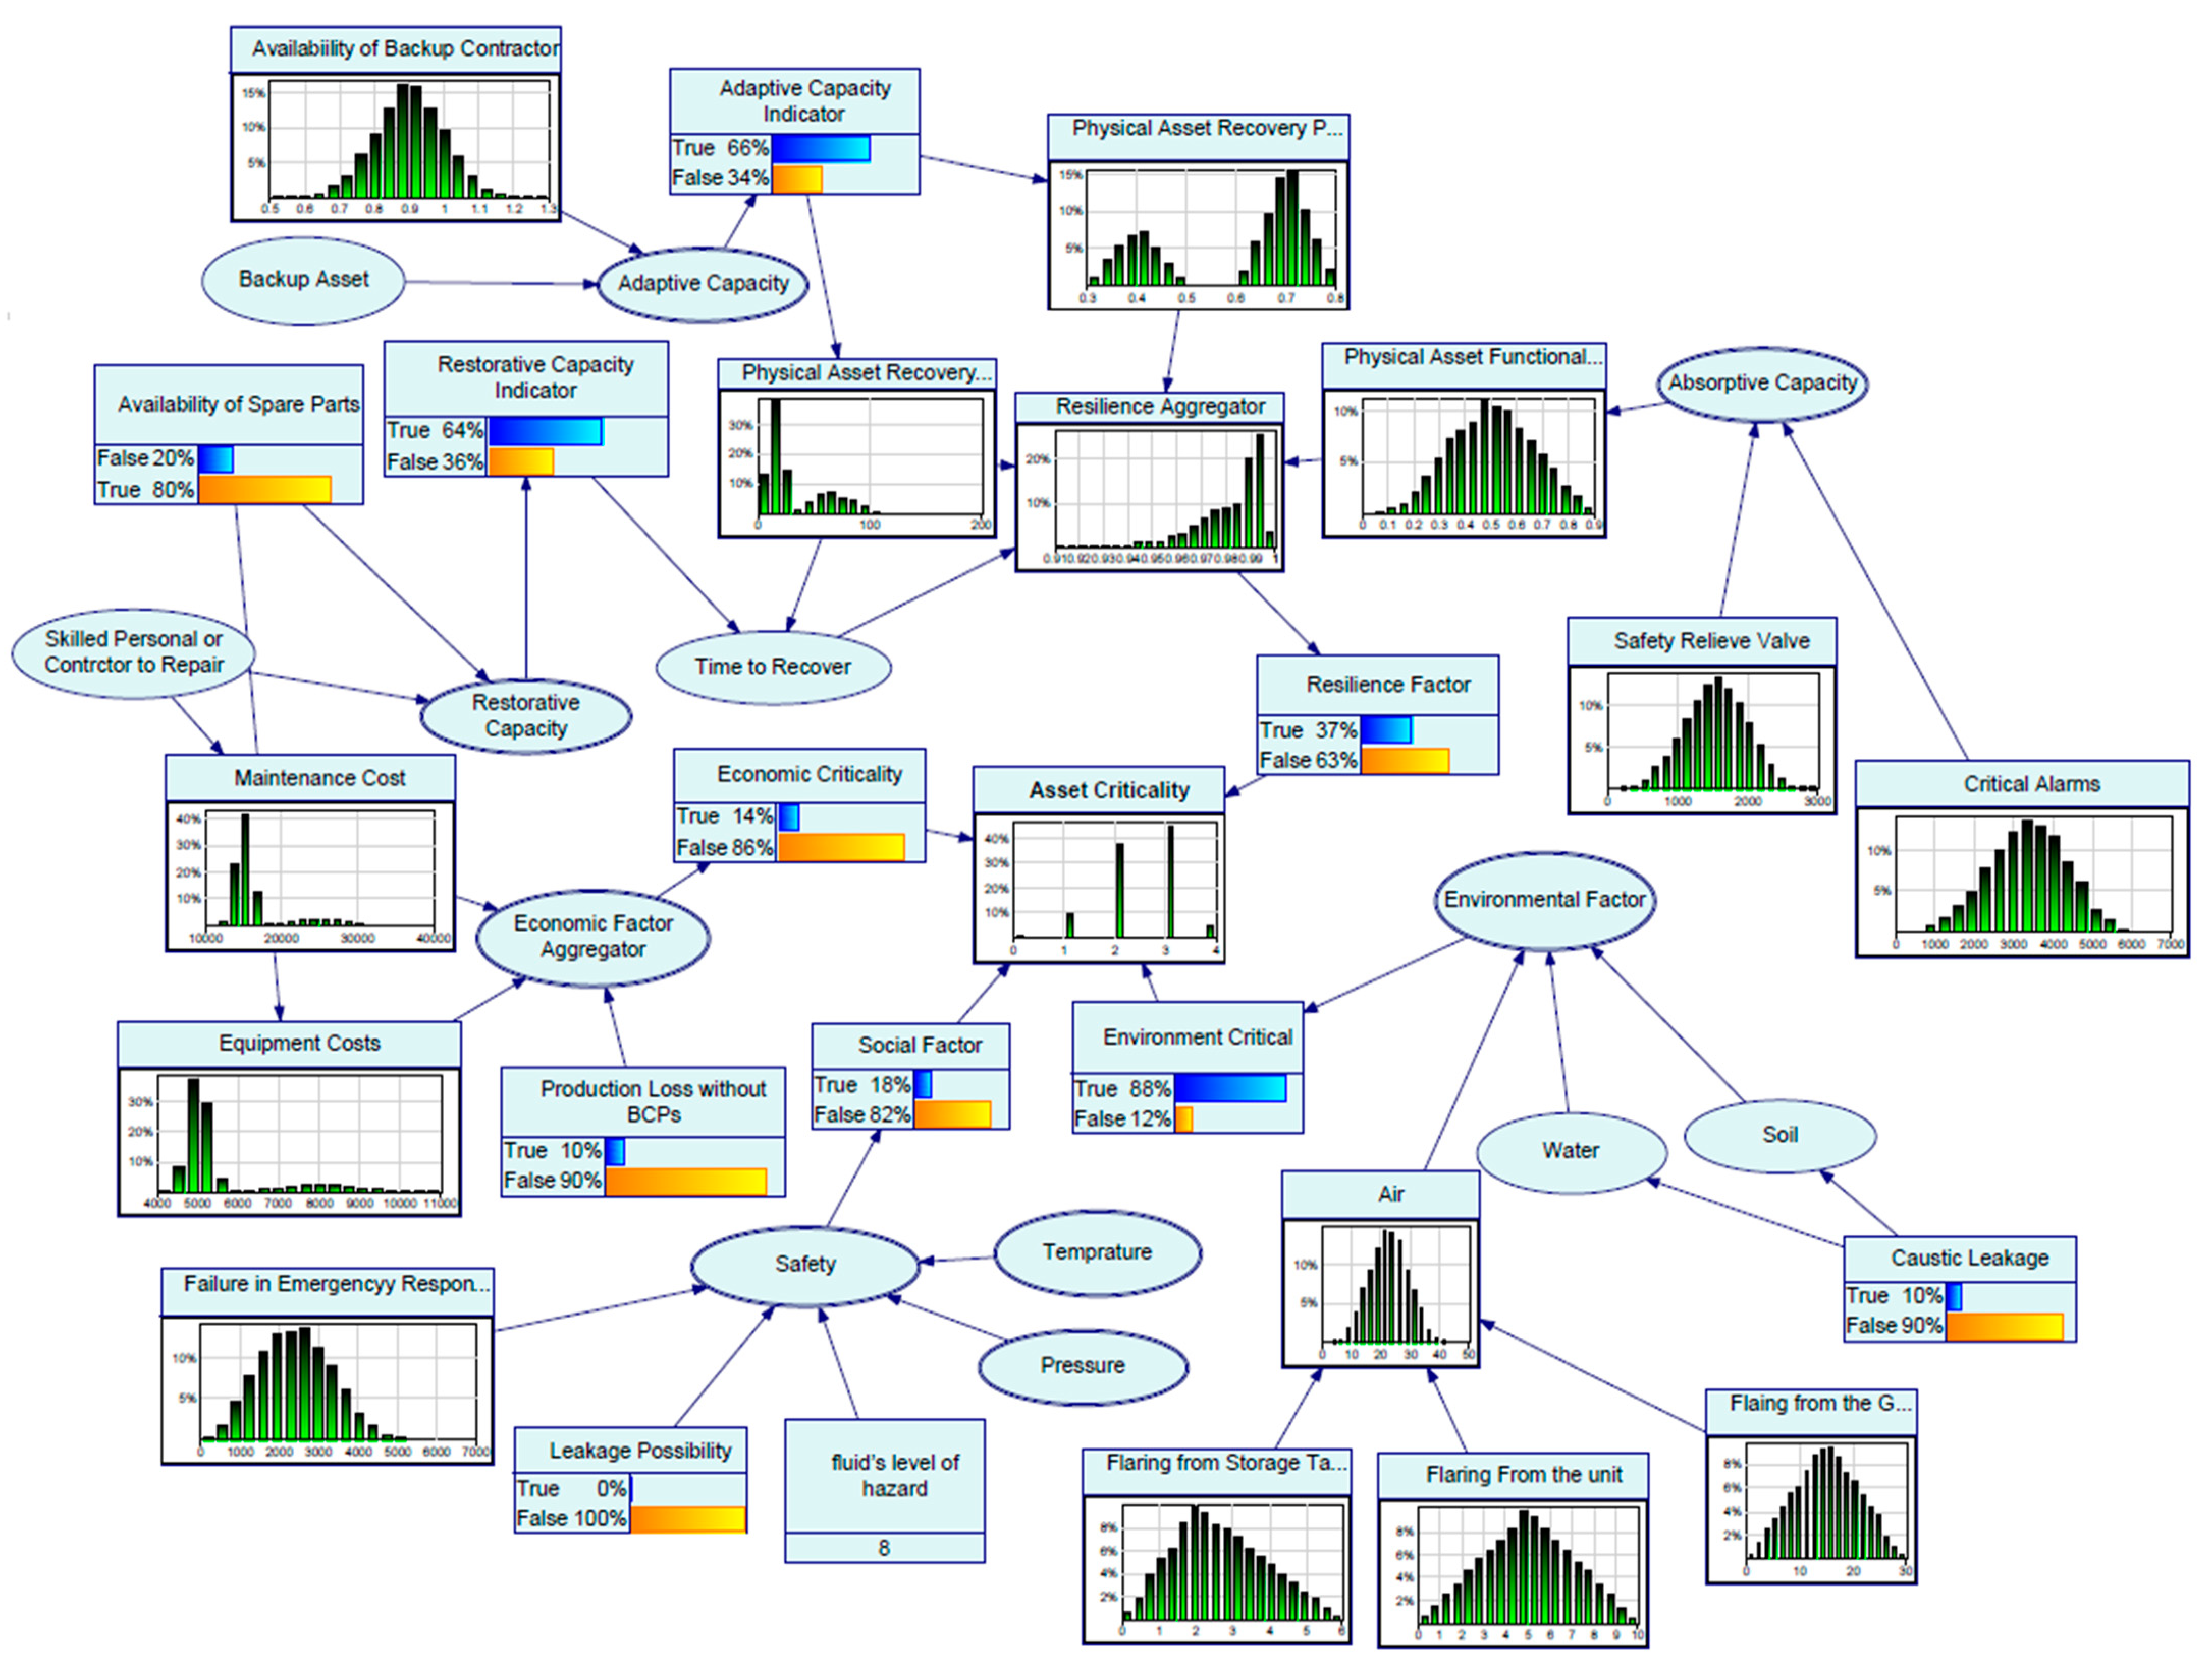
- The proposed general BN structure for physical asset criticality analysis is illustrated in Figure 3. The target variable is physical asset criticality analysis, which is conditioned on economic, social, environmental, and resilience factors. According to Equations (1) and (2), the resilience factor is calculated based on physical asset functionality loss, physical asset recovery point, physical asset recovery time, and total time to recover, which are conditioned on absorptive, adaptive, and restorative capacities. In addition, interdependencies may exist among sub-factors of different main factors, which are shown by the dotted line. The BN model may have different variable types:
- Equation type or continuous variables: these variables capture uncertainty via a probability distribution. These variables may be functions of other related variables.
- State Variables: uncertainty is captured based on a discrete probability distribution.
- Deterministic or fixed variables: these variables have either constant values or values that are determined based on the states of other related variables (parent variables).
3.2.4. Asset Criticality Index
3.3. Analysis of the Results
4. Case Study
4.1. Key Product Determination in GP
4.2. Critical Physical Assets in GP
4.2.1. Sustainability and Resilience Factors for GP’s Physical Assets
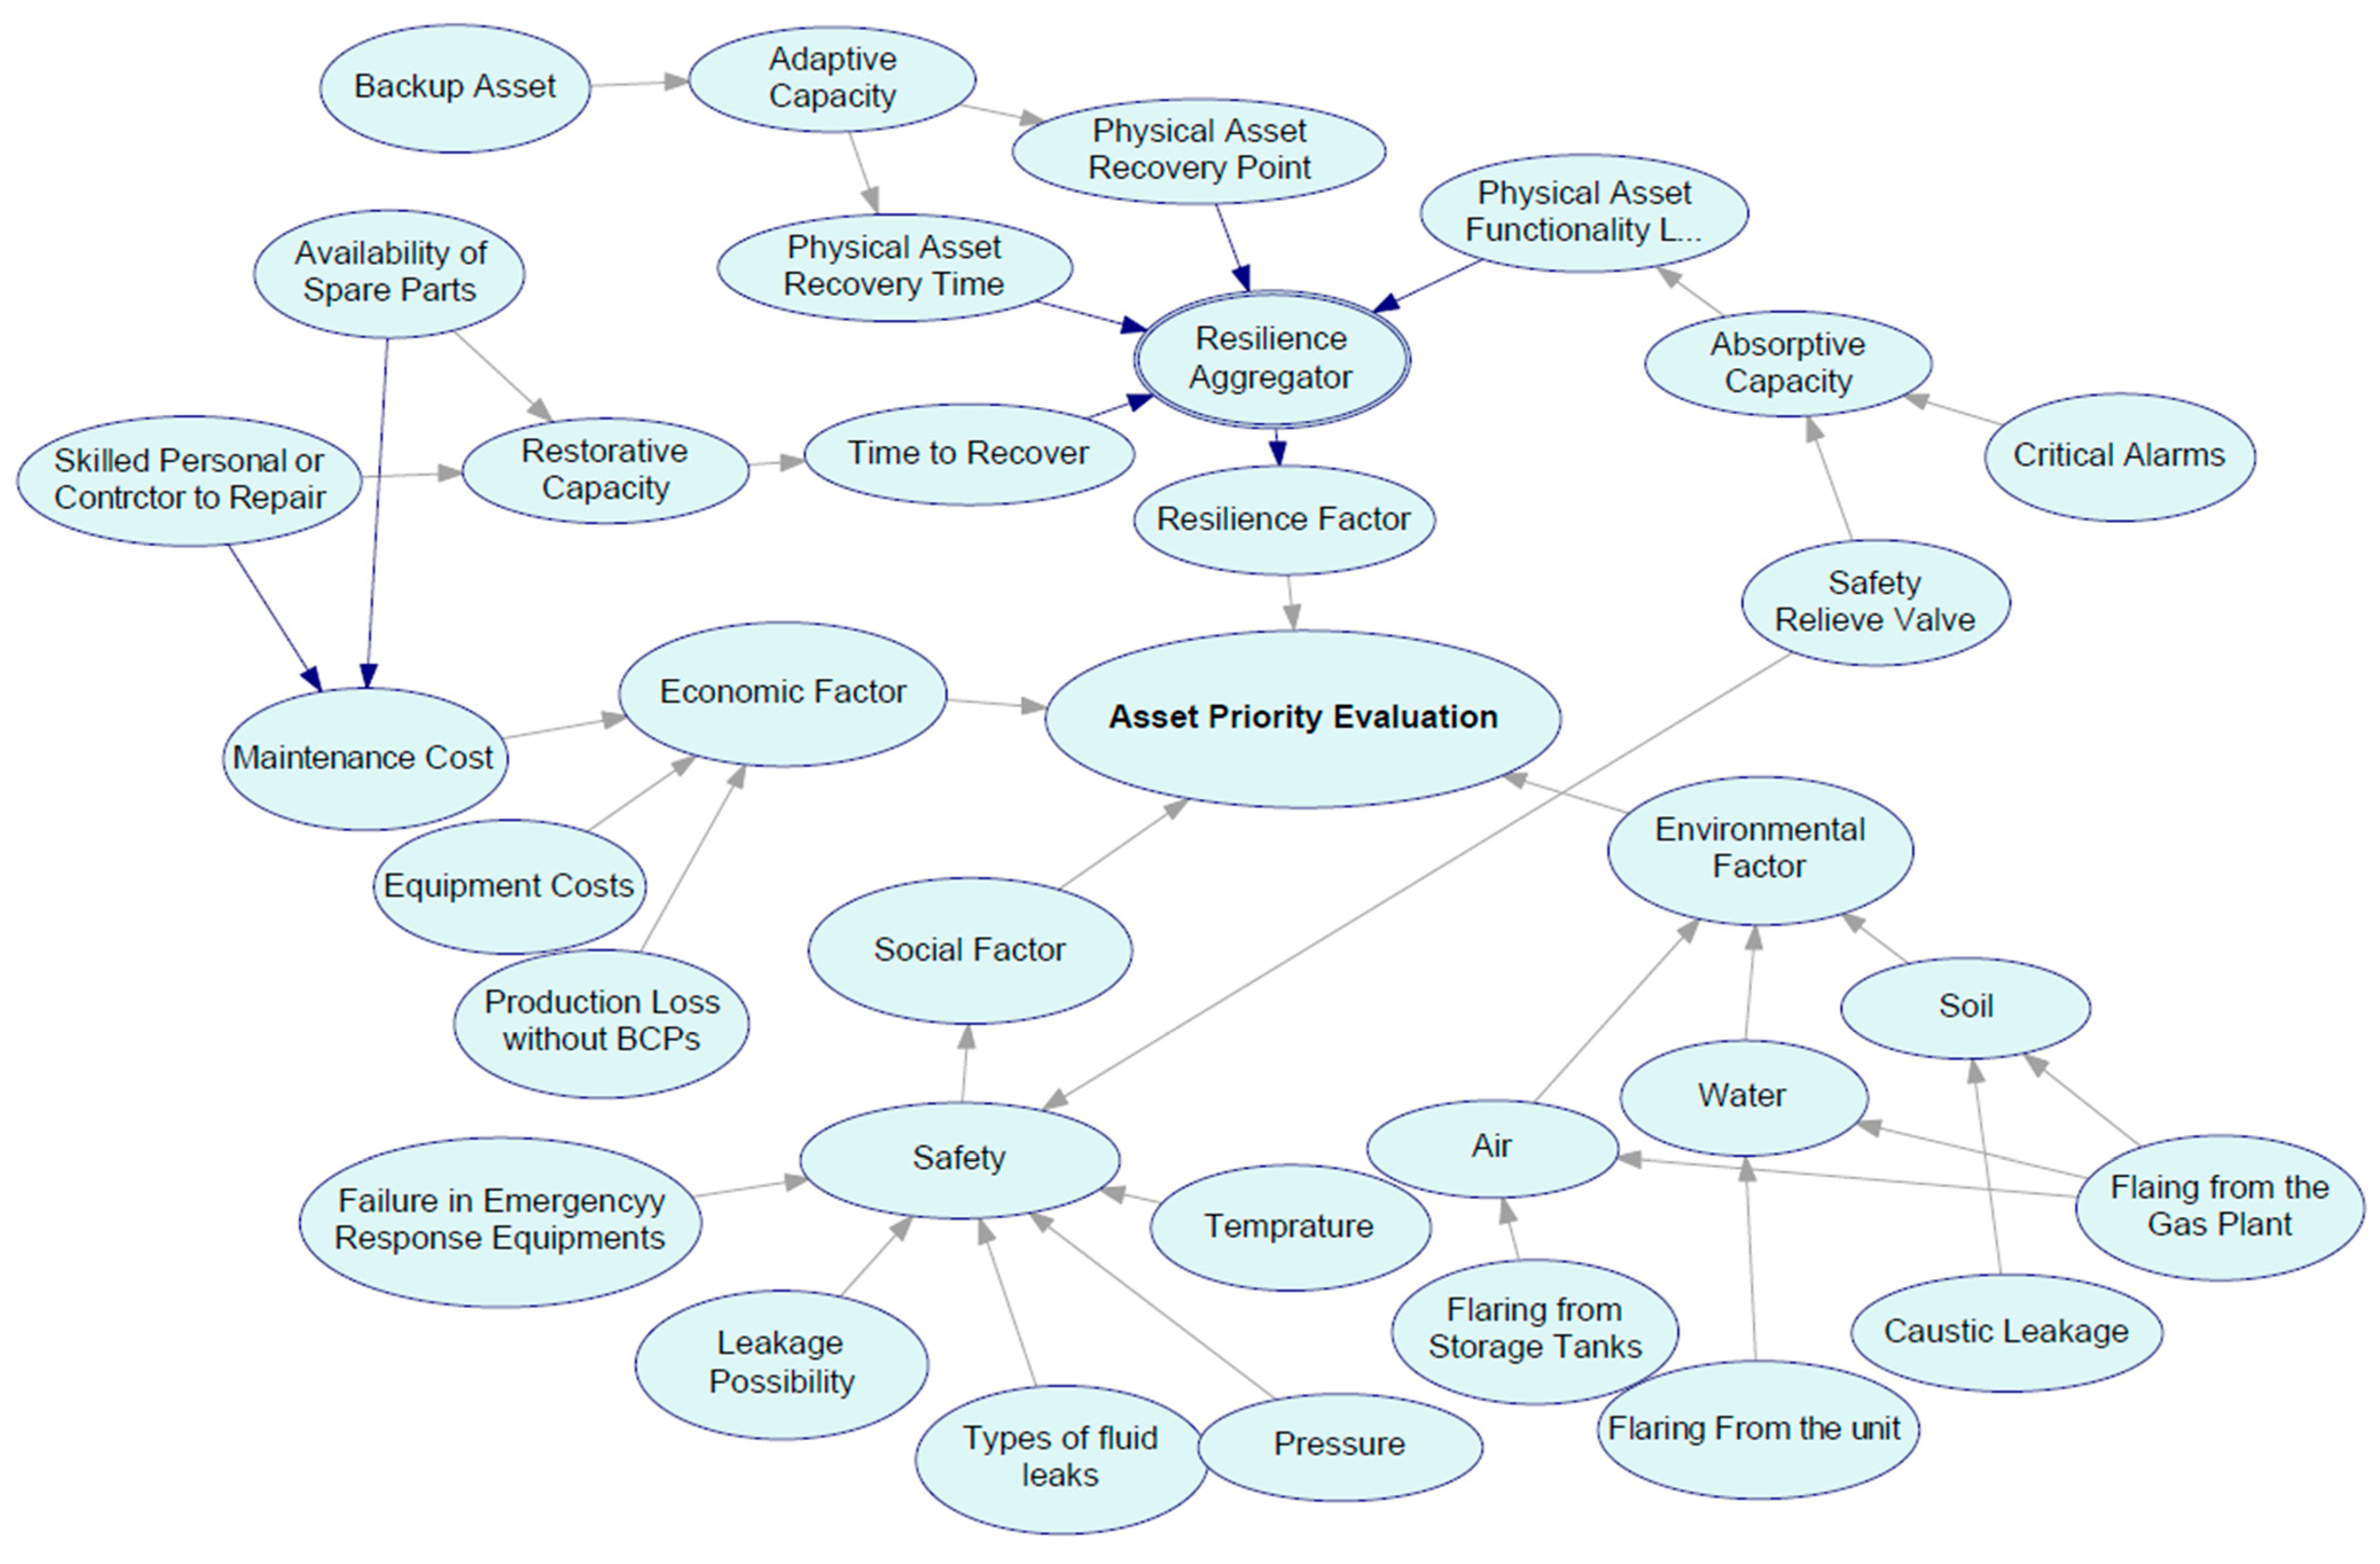
4.2.2. Bayesian Network Structure for Physical Asset Criticality Analysis
4.2.3. Modeling Sustainability and Resilience Criteria in Physical Asset Criticality Analysis Bayesian Network
- ▪
- Modeling sustainability factors:
- ▪
- Modeling resilience factors:
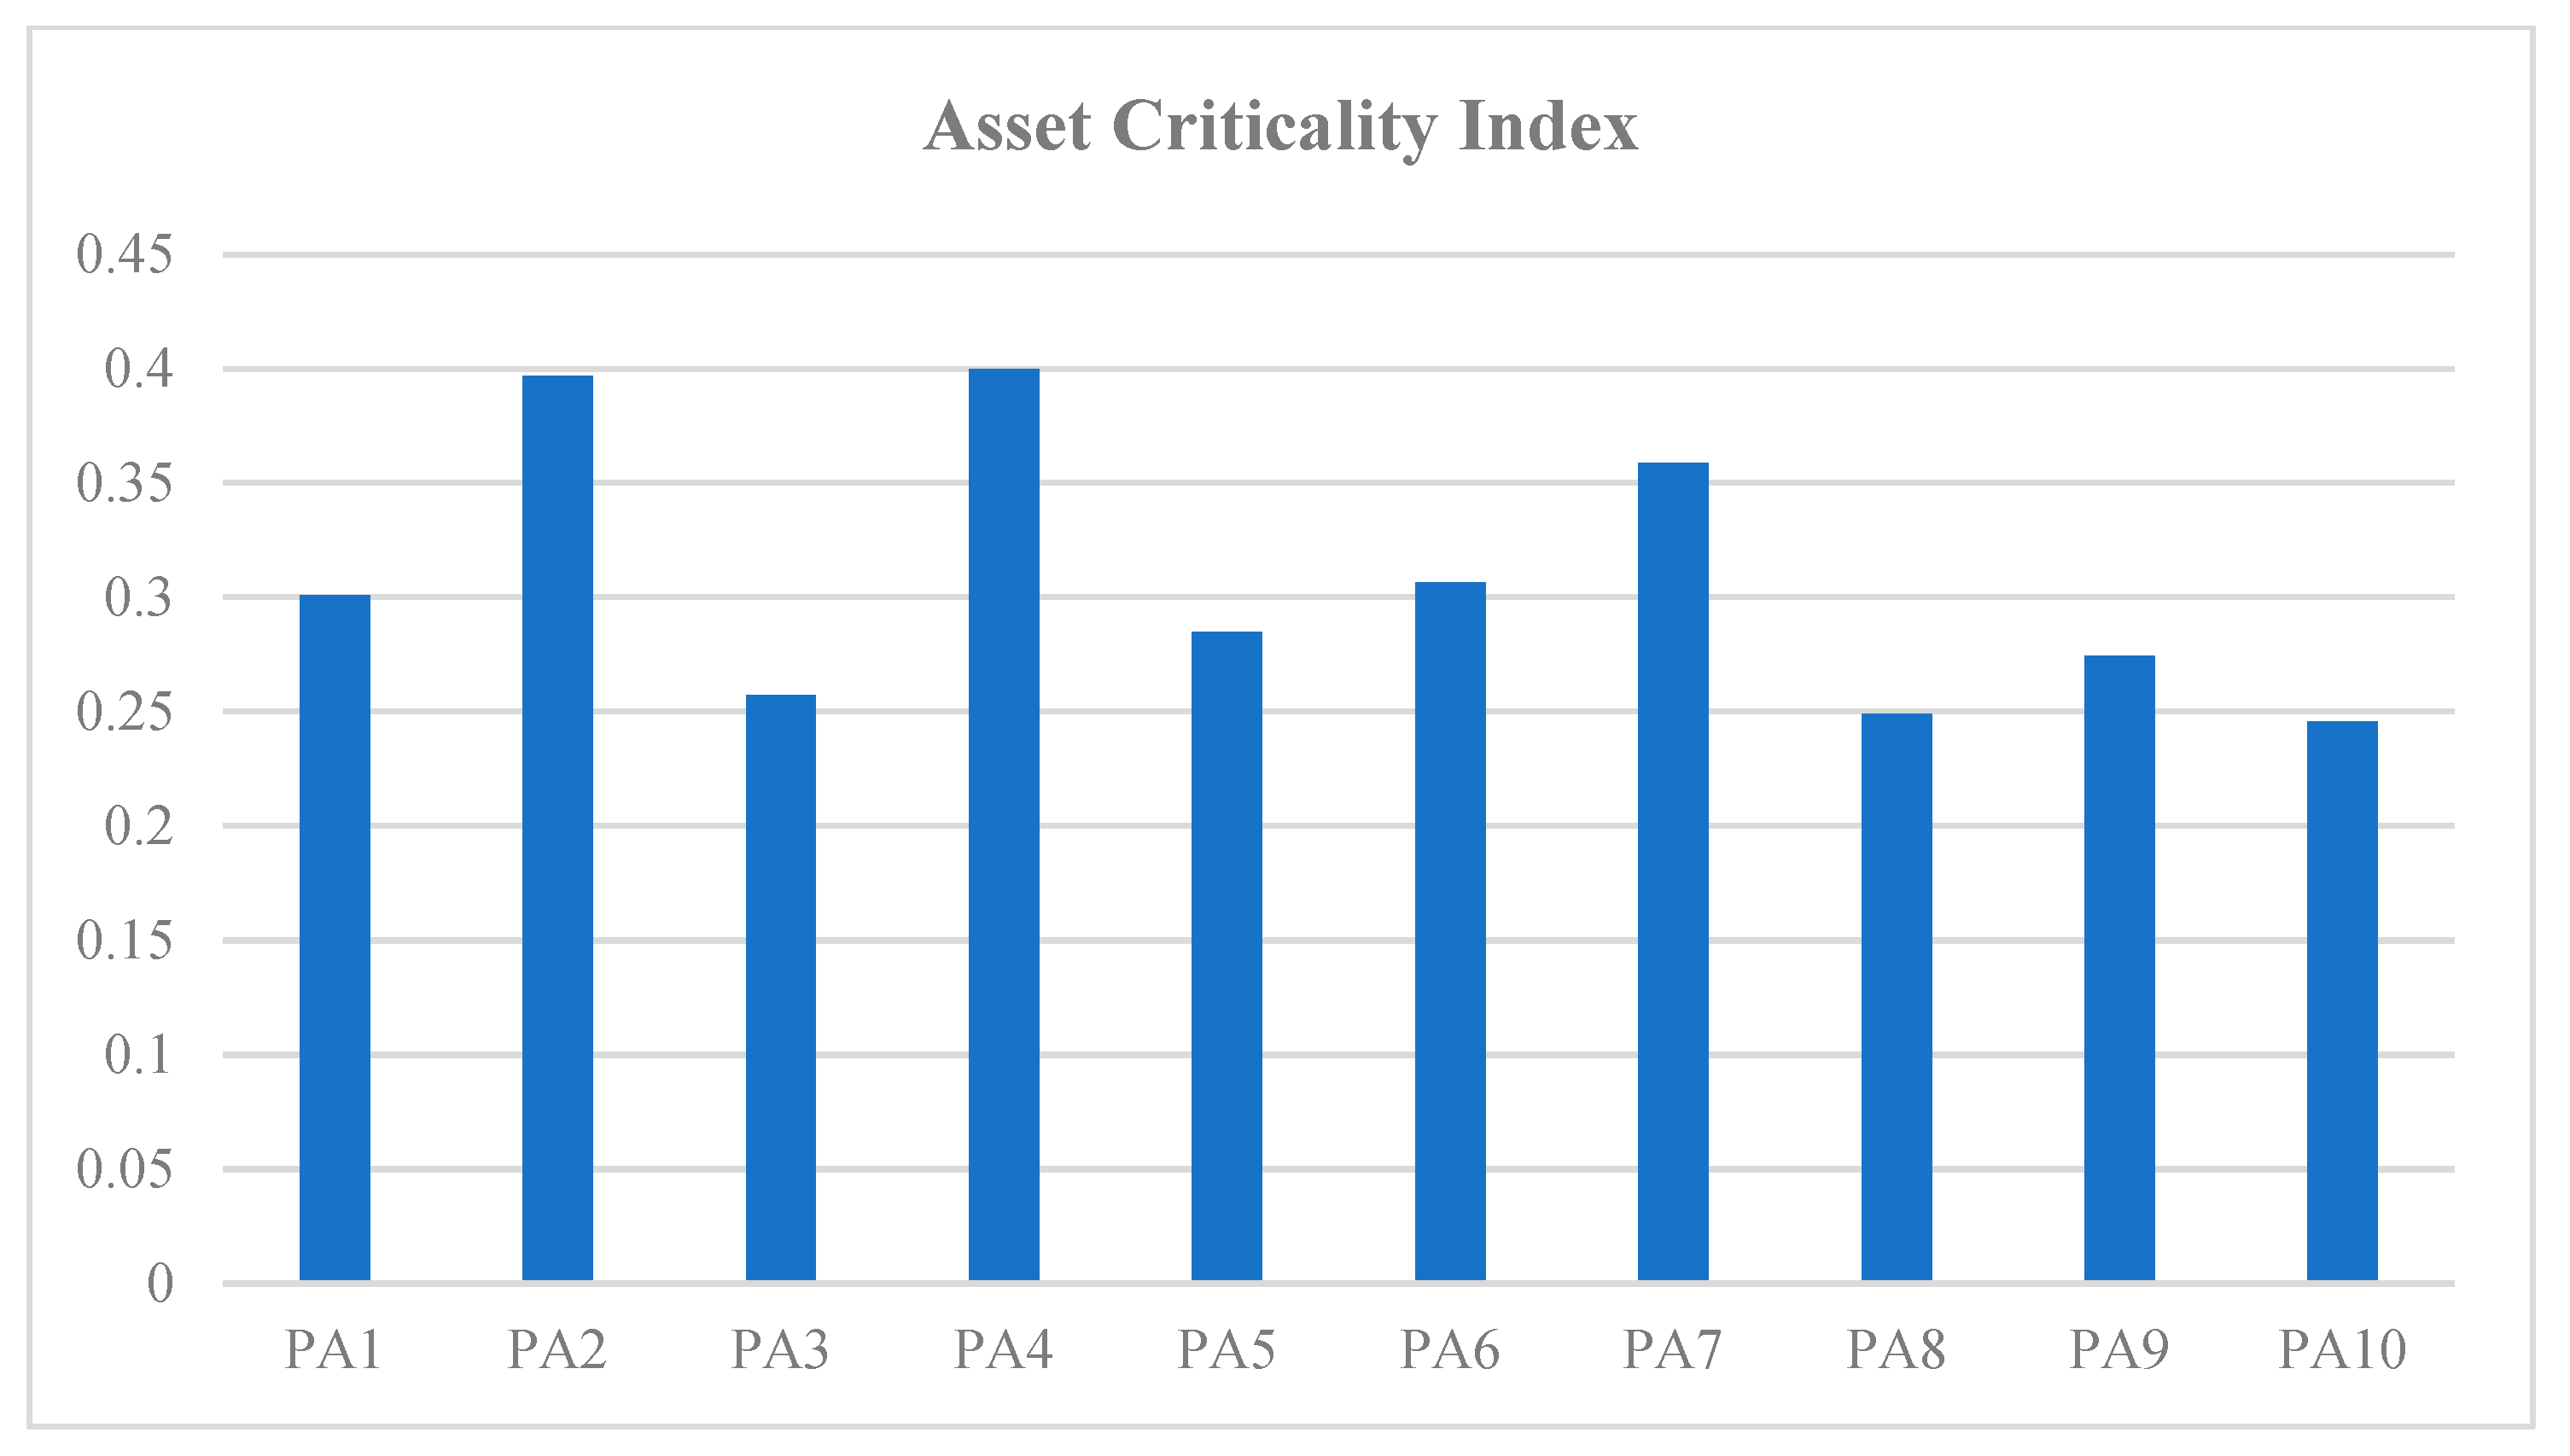
4.2.4. Calculating the Asset Criticality Index
4.3. Model Validity and Analysis of the Results
- Are the model’s node and arc structures consistent with expert predictions?
- Does the model’s structure resemble that of other networks in the resilience domain?
- Are the parameters of each node consistent with what experts would expect?
5. Contributions
5.1. Contributions to Practice and Managerial Insights
- Continuity of key products/services provided in every situation, including disastrous ones, helps organizations foster their reputation. There is a strong relationship between the continuity of physical assets and the continuity of products in asset-intensive organizations. Therefore, the relationship between the continuity of key products’ provision and the continuity of physical assets should be addressed in criticality analysis. Accordingly, our framework proposes a business impact analysis approach through which required physical assets for the continuity of product/service provision are identified.
- Sustainability and resilience are crucial factors for organizations’ sustained success. For this reason, our framework for criticality analysis not only considers these two main factors and their corresponding criteria, but it also captures the interdependencies that exist between them. Accordingly, the framework provides sufficient tools for asset managers to be consistent with organizations’ strategies while prioritizing physical assets.
- Organizations usually struggle with limited resources for their asset management plans. Therefore, the normalized expected asset criticality index is proposed in this paper to prioritize the contributing criteria of criticality analysis. This index will guide managers in taking appropriate directions while developing asset management plans. The priority of variables guides the company in prioritizing their asset management plans.
5.2. Contributions to Knowledge and Theoretical Insights
- To our knowledge, this is the first study that applies business impact analysis to determine key physical assets as a prerequisite to criticality analysis. Therefore, our proposed framework acts as a bridge between physical asset management and business continuity management.
- In the literature, a majority of studies on criticality analysis conduct failure mode and affect analysis (FMEA) or similar risk management tools in which interdependencies among contributing factors to criticality are not incorporated. It should be noted that the presented BIA-based criticality analysis framework proposes a combined fuzzy DEMATEL-Bayesian network model to capture interdependencies among sustainability and resilience contributing factors to the asset criticality analysis.
- Unlike other relevant studies to the physical asset criticality analysis, we consider the sustainability and resilience factors as the contributing factors in the criticality analysis. Moreover, a fuzzy BWM is applied to determine the relative importance of each factor in the asset criticality index, which makes the physical asset ranking procedure more realistic.
6. Conclusions
Supplementary Materials
Author Contributions
Funding
Institutional Review Board Statement
Informed Consent Statement
Data Availability Statement
Conflicts of Interest
Acronyms
| BCM | Business Continuity Management |
| BCP | Business Continuity Plan |
| BIA | Business Impact Analysis |
| BN | Bayesian Network |
| BWM | Best-Worst Method |
| MADM | Multi-Attribute Decision Making |
| MCDA | Multi-Criteria Decision Analysis |
| NOL | Normal Operating Level |
| NPT | Node Probability Table |
| PAFL | Physical Asset Functionality Loss |
| PARP | physical Asset Recovery Point |
| PART | Physical Asset Recovery Time |
| TTR | Total Time to Recover |
References
- AlKazimi, M.A.; Grantham, K. Investigating new risk reduction and mitigation in the oil and gas industry. J. Loss Prev. Process Ind. 2015, 34, 196–208. [Google Scholar] [CrossRef]
- Al-Kasasbeh, M.; Mujalli, R.O.; Abudayyeh, O.; Liu, H.; Altalhoni, A. Bayesian Network Models for Evaluating the Impact of Safety Measures Compliance on Reducing Accidents in the Construction Industry. Buildings 2022, 12, 1980. [Google Scholar] [CrossRef]
- Ratnayake, R.C. Ratnayake Sustainable performance of industrial assets: The role of PAS 55-1&2 and human factors. Int. J. Sustain. Eng. 2013, 6, 198–211. [Google Scholar] [CrossRef]
- Faertes, D. Reliability of supply chains and business continuity management. Procedia Comput. Sci. 2015, 55, 1400–1409. [Google Scholar] [CrossRef] [Green Version]
- Gulati, R. Maintenance and Reliability Best Practices; Industrial Press: New York, NY, USA, 2012. [Google Scholar]
- ISO ISO 55000:2014; Asset Management—Overview, Principles and Terminology. International Organization for Standardization: London, UK, 2014.
- ISO 22301; Security and Resilience—Business Continuity Management Systems—Requirements. International Organization for Standardization: London, UK, 2019.
- Torabi, S.A.; Soufi, H.R.; Sahebjamnia, N. A new framework for business impact analysis in business continuity management (with a case study). Saf. Sci. 2014, 68, 309–323. [Google Scholar] [CrossRef]
- Xiahou, X.; Chen, J.; Zhao, B.; Yan, Z.; Cui, P.; Li, Q.; Yu, Z. Research on Safety Resilience Evaluation Model of Data Center Physical Infrastructure: An ANP-Based Approach. Buildings 2022, 12, 1911. [Google Scholar] [CrossRef]
- Davies, R.; Dieter, J.; McGrail, T. The IEEE and asset management: A discussion paper. In Proceedings of the IEEE Power and Energy Society General Meeting, Detroit, MI, USA, 24–28 July 2011; pp. 1–5. [Google Scholar]
- Tracey, S.; O’Sullivan, T.L.; Lane, D.E.; Guy, E.; Courtemanche, J. Promoting resilience using an asset-based approach to business continuity planning. SAGE Open 2017, 7, 2158244017706712. [Google Scholar] [CrossRef] [Green Version]
- Yazdani, M.; Mojtahedi, M.; Loosemore, M. Enhancing evacuation response to extreme weather disasters using public transportation systems: A novel simheuristic approach. J. Comput. Des. Eng. 2020, 7, 195–210. [Google Scholar] [CrossRef]
- Roostaie, S.; Nawari, N. The DEMATEL approach for integrating resilience indicators into building sustainability assessment frameworks. Build. Environ. 2021, 207, 108113. [Google Scholar] [CrossRef]
- Aghabegloo, M.; Rezaie, K.; Torabi, S.A. Physical Asset Risk Management: A Case Study from an Asset-Intensive Organization. In The International Symposium for Production Research; Lecture Notes in Mechanical Engineering; Springer: Cham, Switzerland, 2020; pp. 667–678. [Google Scholar]
- Collier, Z.A.; Wang, D.; Vogel, J.T.; Tatham, E.K.; Linkov, I. Sustainable roofing technology under multiple constraints: A decision-analytical approach. Environ. Syst. Decis. 2013, 33, 261–271. [Google Scholar] [CrossRef]
- Pillay, A.; Wang, J. Modified failure mode and effects analysis using approximate reasoning. Reliab. Eng. Syst. Saf. 2003, 79, 69–85. [Google Scholar] [CrossRef]
- Márquez, A.C.; De Leõn, P.M.; Rosique, A.S.; Fernández, J.F.G. Criticality Analysis for Maintenance Purposes: A Study for Complex In-service Engineering Assets. Qual. Reliab. Eng. Int. 2016, 32, 519–533. [Google Scholar] [CrossRef]
- Muganyi, P.; Mbohwa, C.; Madanhire, I. Warranting physical assets reliability through criticality optimization. In Proceedings of the International Conference on Industrial Engineering and Operations Management, Girona, Spain, 12–13 July 2018; pp. 3383–3393. [Google Scholar]
- Parajes, S.; Adolfo, J.; Márquez, C.; Sola, A. Rosique Criticality analysis for preventive maintenance optimization purposes in gas network infrastructures. Proc. Inst. Mech. Eng. Part O J. Risk Reliab. 2018, 232, 464–472. [Google Scholar]
- Antomarioni, S.; Ciarapica, F.E.; Bevilacqua, M. Association rules and social network analysis for supporting failure mode effects and criticality analysis: Framework development and insights from an onshore platform. Saf. Sci. 2022, 150, 105711. [Google Scholar] [CrossRef]
- Shahri, M.M.; Jahromi, A.E.; Houshmand, M. An integrated fuzzy inference system and AHP approach for criticality analysis of assets: A case study of a gas refinery. J. Intell. Fuzzy Syst. 2021, 41, 199–217. [Google Scholar] [CrossRef]
- Kure, H.I.; Islam, S.; Ghazanfar, M.; Raza, A.; Pasha, M. Asset criticality and risk prediction for an effective cybersecurity risk management of cyber-physical system. Neural Comput. Appl. 2022, 34, 493–514. [Google Scholar] [CrossRef]
- Syachrani, S.; Jeong, H.D.; Chung, C.S. Advanced criticality assessment method for sewer pipeline assets. Water Sci. Technol. 2013, 67, 1302–1309. [Google Scholar] [CrossRef]
- Beyza, J.; Garcia-Paricio, E.; Yusta, J.M. Ranking critical assets in interdependent energy transmission networks. Electr. Power Syst. Res. 2019, 172, 242–252. [Google Scholar] [CrossRef]
- Santos, T.; Silva, F.J.G.; Ramos, S.F.; Campilho, R.D.S.G.; Ferreira, L.P. Asset Priority Setting for Maintenance Management in the Food Industry. In Proceedings of the 29th International Conference on Flexible Automation and Intelligent Manufacturing (FAIM2019), Limerick, Ireland, 24–28 June 2019; Volume 38, pp. 1623–1633. [Google Scholar] [CrossRef]
- Solomon, J.D.; Oldach, J. Forced rank methodologies to more efficiently perform criticality analysis. In Proceedings of the 2016 Annual Reliability and Maintainability Symposium (RAMS), Tucson, AZ, USA, 25–28 January 2016; pp. 2–7. [Google Scholar] [CrossRef]
- Cha, S.-C.; Juo, P.-W.; Liu, L.-T.; Chen, W.-N. RiskPatrol: A risk management system considering the integration risk management with business continuity processes. In Proceedings of the IEEE International Conference on Intelligence and Security Informatics, Taipei, Taiwan, 17–20 June 2008; pp. 110–115. [Google Scholar] [CrossRef]
- Snedaker, S.; Rima, C. Business Impact Analysis. In Business Continuity and Disaster Recovery Planning for IT Professionals, 2nd ed.; Syngress: Oxford, UK, 2015; pp. 225–274. [Google Scholar]
- Sikdar, P. Alternate approaches to business impact analysis. Inf. Secur. J. Glob. Perspect. 2011, 20, 128–134. [Google Scholar] [CrossRef]
- Heng, G.M. Conducting Your Impact Analysis for Business Continuity Planning; GMH Continuity Architects: Singapore, 2002. [Google Scholar]
- Azfar, K.R.W.; Khan, N.; Gabriel, H.F. Performance measurement: A conceptual framework for supply chain practices. Procedia-Soc. Behav. Sci. 2014, 150, 803–812. [Google Scholar] [CrossRef] [Green Version]
- Marchese, D.; Reynolds, E.; Bates, M.E.; Morgan, H.; Clark, S.S.; Linkov, I. Resilience and sustainability: Similarities and differences in environmental management applications. Sci. Total Environ. 2018, 613, 1275–1283. [Google Scholar] [CrossRef] [PubMed]
- Kaklauskas, A.; Zavadskas, E.K.; Binkyte-Veliene, A.; Kuzminske, A.; Cerkauskas, J.; Cerkauskiene, A.; Valaitiene, R. Multiple criteria evaluation of the EU country sustainable construction industry lifecycles. Appl. Sci. 2020, 10, 3733. [Google Scholar] [CrossRef]
- Tupenaite, L.; Kaklauskas, A.; Lill, I.; Geipele, I.; Naimaviciene, J.; Kanapeckiene, L.; Kauskale, L. Sustainability assessment of the new residential projects in the Baltic States: A multiple criteria approach. Sustainability 2018, 10, 1387. [Google Scholar] [CrossRef] [Green Version]
- Kamranfar, S.; Azimi, Y.; Gheibi, M.; Fathollahi-Fard, A.M.; Hajiaghaei-Keshteli, M. Analyzing green construction development barriers by a hybrid decision-making method based on DEMATEL and the ANP. Buildings 2022, 12, 1641. [Google Scholar] [CrossRef]
- Gheibi, M.; Eftekhari, M.; Akrami, M.; Emrani, N.; Hajiaghaei-Keshteli, M.; Fathollahi-Fard, A.; Yazdani, M. A sustainable decision support system for drinking water systems: Resiliency improvement against cyanide contamination. Infrastructures 2022, 7, 88. [Google Scholar] [CrossRef]
- Bocchini, P.; Frangopol, D.M.; Ummenhofer, T.; Zinke, T. Resilience and sustainability of civil infrastructure: Toward a unified approach. J. Infrastruct. Syst. 2014, 20, 04014004. [Google Scholar] [CrossRef]
- Rostam, M.G.; Abbasi, A. A framework for identifying the appropriate quantitative indicators to objectively optimize the building energy consumption considering sustainability and resilience aspects. J. Build. Eng. 2021, 44, 102974. [Google Scholar] [CrossRef]
- Meacham, B.J. Sustainability and resiliency objectives in performance building regulations. Build. Res. Inf. 2016, 44, 474–489. [Google Scholar] [CrossRef]
- Soleiman, I.H.; Chhetri, P.; Fathollahi-Fard, A.M.; Al-e-Hashem, S.M.J.M.; Shahparvari, S. Sustainable closed-loop supply chain with energy efficiency: Lagrangian relaxation, reformulations and heuristics. Ann. Oper. Res. 2022, 318, 531–556. [Google Scholar] [CrossRef]
- Fahimnia, B.; Jabbarzadeh, A. Marrying supply chain sustainability and resilience: A match made in heaven. Transp. Res. Part E Logist. Transp. Rev. 2016, 91, 306–324. [Google Scholar] [CrossRef]
- Rajesh, R. Optimal trade-offs in decision-making for sustainability and resilience in manufacturing supply chains. J. Clean. Prod. 2021, 313, 127596. [Google Scholar] [CrossRef]
- Abbaspour, S.; Aghsami, A.; Jolai, F.; Yazdani, M. An integrated queueing-inventory-routing problem in a green dual-channel supply chain considering pricing and delivery period: A case study of construction material supplier. J. Comput. Des. Eng. 2022, 9, 1917–1951. [Google Scholar] [CrossRef]
- Moosavi, J.; Fathollahi-Fard, A.M.; Dulebenets, M.A. Supply chain disruption during the COVID-19 pandemic: Recognizing potential disruption management strategies. Int. J. Disaster Risk Reduct. 2022, 75, 102983. [Google Scholar] [CrossRef]
- Tang, J.; Heinimann, H.; Han, K.; Luo, H.; Zhong, B. Evaluating Resilience in Urban Transportation Systems for Sustainability: A Systems-Based Bayesian Network Model. Transp. Res. Part C Emerg. Technol. 2020, 121, 102840. [Google Scholar] [CrossRef]
- Hossain, N.U.I.; Nur, F.; Hosseini, S.; Jaradat, R.; Marufuzzaman, M.; Puryear, S.M. A Bayesian network based approach for modeling and assessing resilience: A case study of a full service deep water port. Reliab. Eng. Syst. Saf. 2019, 189, 378–396. [Google Scholar] [CrossRef]
- Hosseini, S.; Barker, K. Modeling infrastructure resilience using Bayesian networks: A case study of inland waterway ports. Comput. Ind. Eng. 2016, 93, 252–266. [Google Scholar] [CrossRef]
- Kammouh, O.; Gardoni, P.; Cimellaro, G.P. Probabilistic framework to evaluate the resilience of engineering systems using Bayesian and dynamic Bayesian networks. Reliab. Eng. Syst. Saf. 2020, 198, 106813. [Google Scholar] [CrossRef]
- Sarwar, A.; Khan, F.; James, L.; Abimbola, M. Integrated offshore power operation resilience assessment using Object Oriented Bayesian network. Ocean Eng. 2018, 167, 257–266. [Google Scholar] [CrossRef]
- Molina-Serrano, B.; González-Cancelas, N.; Soler-Flores, F. Analysis of the port sustainability parameters through Bayesian networks. Environ. Sustain. Indic. 2020, 6, 100030. [Google Scholar] [CrossRef]
- Sierra, L.A.; Yepes, V.; García-Segura, T.; Pellicer, E. Bayesian network method for decision-making about the social sustainability of infrastructure projects. J. Clean. Prod. 2018, 176, 521–534. [Google Scholar] [CrossRef]
- Keshtkar, A.R.; Salajegheh, A.; Sadoddin, A.; Allan, M.G. Application of Bayesian networks for sustainability assessment in catchment modeling and management (Case study: The Hablehrood river catchment). Ecol. Modell. 2013, 268, 48–54. [Google Scholar] [CrossRef] [Green Version]
- El Amrani, S.; Hossain, N.U.I.; Karam, S.; Jaradat, R.; Nur, F.; Hamilton, M.A.; Ma, J. Modelling and assessing sustainability of a supply chain network leveraging multi Echelon Bayesian Network. J. Clean. Prod. 2021, 302, 126855. [Google Scholar] [CrossRef]
- Khan, F.I.; Haddara, M.M. Risk-based maintenance (RBM): A quantitative approach for maintenance/inspection scheduling and planning. J. Loss Prev. Process. Ind. 2003, 16, 561–573. [Google Scholar] [CrossRef]
- Jaderi, F.; Ibrahim, Z.Z.; Zahiri, M.R. Criticality analysis of petrochemical assets using risk based maintenance and the fuzzy inference system. Process. Saf. Environ. Prot. 2019, 121, 312–325. [Google Scholar] [CrossRef]
- Mi, X.; Tang, M.; Liao, H.; Shen, W.; Lev, B. The state-of-the-art survey on integrations and applications of the best worst method in decision making: Why, what, what for and what’s next ? Omega 2019, 87, 205–225. [Google Scholar] [CrossRef]
- Rezaei, J. Best-worst multi-criteria decision-making method. Omega 2015, 53, 49–57. [Google Scholar] [CrossRef]
- Karimi, H.; Sadeghi-dastaki, M.; Javan, M. A fully fuzzy best—Worst multi attribute decision making method with triangular fuzzy number: A case study of maintenance assessment in the hospitals. Appl. Soft Comput. J. 2020, 86, 105882. [Google Scholar] [CrossRef]
- Guo, S.; Zhao, H. Fuzzy best-worst multi-criteria decision-making method and its applications. Knowl.-Based Syst. 2017, 121, 23–31. [Google Scholar] [CrossRef]
- Gupta, H.; Barua, M.K. A novel hybrid multi-criteria method for supplier selection among SMEs on the basis of innovation ability. Int. J. Logist. Res. Appl. 2018, 21, 201–223. [Google Scholar] [CrossRef]
- World Commission on Environment and Development. Our Common Future; Oxford University Press: Oxford, UK, 1987. [Google Scholar]
- Brandenburg, M.; Govindan, K.; Sarkis, J.; Seuring, S. Quantitative models for sustainable supply chain management: Developments and directions. Eur. J. Oper. Res. 2014, 233, 299–312. [Google Scholar] [CrossRef]
- Ding, G.K. Developing a multicriteria approach for the measurement of sustainable performance. Build. Res. Inf. 2005, 33, 3–16. [Google Scholar] [CrossRef]
- Winroth, M.; Almström, P.; Andersson, C. Sustainable indicators at factory level-a framework for practical assessment. In Proceedings of the IIE Annual Conference, Orlando, FL, USA, 19–23 May 2012; p. 1. [Google Scholar]
- API. 581-Recommended Practice for Risk-Based Inspection Methodology; API: Camellia, Australia, 2016. [Google Scholar]
- API. RP 581 Risk-Based Inspection Methodology, 3rd ed.; API: Camellia, Australia, 2016. [Google Scholar]
- Liu, B.; Xue, B.; Chen, X. Development of a metric system measuring infrastructure sustainability: Empirical studies of Hong Kong. J. Clean. Prod. 2021, 278, 123904. [Google Scholar] [CrossRef]
- Fernández-Sánchez, G.; Rodríguez-López, F. A methodology to identify sustainability indicators in construction project management—Application to infrastructure projects in Spain. Ecol. Indic. 2010, 10, 1193–1201. [Google Scholar] [CrossRef]
- Akhtar, S.; Reza, B.; Hewage, K.; Shahriar, A.; Zargar, A.; Sadiq, R. Life cycle sustainability assessment (LCSA) for selection of sewer pipe materials. Clean Technol. Environ. Policy 2015, 17, 973–992. [Google Scholar] [CrossRef]
- Islam, R.; Nazifa, T.H.; Mohamed, S.F. Evaluation of facilities management sustainable parameters for improving operational efficiency. Int. J. Constr. Manag. 2021, 21, 538–554. [Google Scholar] [CrossRef]
- Alnoaimi, A.; Rahman, A. Sustainability assessment of sewerage infrastructure projects: A conceptual framework. Int. J. Environ. Sci. Dev. 2019, 10, 23–29. [Google Scholar] [CrossRef]
- Haimes, Y.Y. On the definition of resilience in systems. Risk Anal. Int. J. 2009, 29, 498–501. [Google Scholar] [CrossRef]
- Hosseini, S.; Barker, K.; Ramirez-Marquez, J.E. A review of definitions and measures of system resilience. Reliab. Eng. Syst. Saf. 2016, 145, 47–61. [Google Scholar] [CrossRef]
- Zobel, C.W.; Khansa, L. Characterizing multi-event disaster resilience. Comput. Oper. Res. 2014, 42, 83–94. [Google Scholar] [CrossRef]
- Panteli, M.; Mancarella, P.; Trakas, D.N.; Kyriakides, E.; Hatziargyriou, N.D. Metrics and quantification of operational and infrastructure resilience in power systems. IEEE Trans. Power Syst. 2017, 32, 4732–4742. [Google Scholar] [CrossRef] [Green Version]
- Jovanović, A.; Klimek, P.; Renn, O.; Schneider, R.; Øien, K.; Brown, J.; DiGennaro, M.; Liu, Y.; Pfau, V.; Jelić, M.; et al. Assessing resilience of healthcare infrastructure exposed to COVID-19: Emerging risks, resilience indicators, interdependencies and international standards. Environ. Syst. Decis. 2020, 40, 252–286. [Google Scholar] [CrossRef] [PubMed]
- Argyroudis, S.A. Resilience metrics for transport networks: A review and practical examples for bridges. In Proceedings of the Institution of Civil Engineers-Bridge Engineering; Thomas Telford Ltd.: London, UK, 2022; pp. 1–14. [Google Scholar]
- Ayyub, B.M. Systems resilience for multihazard environments: Definition, metrics, and valuation for decision making. Risk Anal. 2014, 34, 340–355. [Google Scholar] [CrossRef]
- Labaka, L.; Hernantes, J.; Sarriegi, J.M. A holistic framework for building critical infrastructure resilience. Technol. Forecast. Soc. Chang. 2016, 103, 21–33. [Google Scholar] [CrossRef]
- Moghadas, M.; Asadzadeh, A.; Vafeidis, A.; Fekete, A.; Kötter, T. A multi-criteria approach for assessing urban flood resilience in Tehran, Iran. Int. J. Disaster Risk Reduct. 2019, 35, 101069. [Google Scholar] [CrossRef]
- Zavadskas, E.K.; Kaklauskas, A.; Sarka, V. The new method of multicriteria complex proportional assessment of projects. Technol. Econ. Dev. Econ. 1994, 3, 131–139. [Google Scholar]
- Kaklauskas, A. Degree of project utility and investment value assessments. Int. J. Comput. Commun. Control. 2016, 11, 666–683. [Google Scholar] [CrossRef]
- Liou, J.J.H. Developing an integrated model for the selection of strategic alliance partners in the airline industry. Knowl.-Based Syst. 2012, 28, 59–67. [Google Scholar] [CrossRef]
- Yazdani, M.; Khalili, S.M.; Babagolzadeh, M.; Jolai, F. A single-machine scheduling problem with multiple unavailability constraints: A mathematical model and an enhanced variable neighborhood search approach. J. Comput. Des. Eng. 2017, 4, 46–59. [Google Scholar] [CrossRef] [Green Version]
- Kaya, R.; Yet, B. Building Bayesian networks based on DEMATEL for multiple criteria decision problems: A supplier selection case study. Expert Syst. Appl. 2019, 134, 234–248. [Google Scholar] [CrossRef]
- Choua, Y.-C.; Sun, C.-C.; Yen, H.-Y. Evaluating the criteria for human resource for science and technology (HRST) based on an integrated fuzzy AHP and fuzzy DEMATEL approach. Appl. Soft Comput. 2012, 12, 64–71. [Google Scholar] [CrossRef]
- Yazdani, M.; Jolai, F. Lion optimization algorithm (LOA): A nature-inspired metaheuristic algorithm. J. Comput. Des. Eng. 2016, 3, 24–36. [Google Scholar] [CrossRef] [Green Version]
- Tzeng, G.-H.; Chiang, C.-H.; Li, C.W. Evaluating intertwined effects in e-learning programs: A novel hybrid MCDM model based on factor analysis and DEMATEL. Expert Syst. Appl. 2007, 32, 1028–1044. [Google Scholar] [CrossRef]
- Fenton, N.; Neil, M. Risk Assessment and Decision Analysis with Bayesian Networks; CRC Press: Boca Raton, FL, USA, 2018. [Google Scholar]
- Varkey, D.A.; Pitcher, T.J.; McALLISTER, M.K.; Sumaila, R. Bayesian decision-network modeling of multiple stakeholders for reef ecosystem restoration in the Coral Triangle. Conserv. Biol. 2013, 27, 459–469. [Google Scholar] [CrossRef]
- Hosseini, S.; Barker, K. A Bayesian network model for resilience-based supplier selection. Int. J. Prod. Econ. 2016, 180, 68–87. [Google Scholar] [CrossRef]
- Schultz, M.T.; Smith, E.R. Assessing the resilience of coastal systems: A probabilistic approach. J. Coast. Res. 2016, 32, 1032–1050. [Google Scholar] [CrossRef]
- Li, P.; Chen, G.; Dai, L.; Zhang, L. A fuzzy Bayesian network approach to improve the quantification of organizational influences in HRA frameworks. Saf. Sci. 2012, 50, 1569–1583. [Google Scholar] [CrossRef]
- Laskey, K.B. Sensitivity analysis for probability assessments in Bayesian networks. IEEE Trans. Syst. Man. Cybern. 1995, 25, 901–909. [Google Scholar] [CrossRef] [Green Version]
- Koski, T.; Noble, J.M. Bayesian Networks: An Introduction; John Wiley & Sons: New York, NY, USA, 2011. [Google Scholar]
- BayesFusion GeNIe Modeler. 2019. Available online: https://support.bayesfusion.com/docs/GeNIe.pdf (accessed on 23 December 2022).
- NFPA NFPA 704; Standard System for the Identification of the Hazards of Materials for Emergency Response. National Fire Protection Association: Quincy, MA, USA, 2022.
- Pitchforth, J.; Mengersen, K. A proposed validation framework for expert elicited Bayesian Networks. Expert Syst. Appl. 2013, 40, 162–167. [Google Scholar] [CrossRef]


| Evaluation Criteria | |||||
|---|---|---|---|---|---|
| Reference Articles | Quantitative Approach | Sustainability Metrics Are Considered | Resilience Metrics Are Considered | Business Continuity Orientation | Main Ranking Method |
| [18] | ◐ | ◐ | ○ | ○ | MADM |
| [19] | ◐ | ⏺ | ◐ | ○ | AHP |
| [20] | ⏺ | ○ | ○ | ○ | FMECA |
| [21] | ◐ | ◐ | ○ | ○ | Fuzzy inference system |
| [22] | ◐ | ◐ | ○ | ○ | Fuzzy inference system |
| [23] | ◐ | ○ | ◐ | ○ | - |
| [24] | ⏺ | ○ | ◐ | ○ | graph theory |
| [25] | ◐ | ◐ | ◐ | ○ | - |
| [26] | ○ | ◐ | ○ | ◐ | Function-based scoring |
| [13] | ○ | ⏺ | ⏺ | ○ | - |
| [39] | ○ | ⏺ | ⏺ | ○ | - |
| Our Paper | ⏺ | ⏺ | ⏺ | ⏺ | Mixed DEMATEL-Bayesian Network |
| Sustainability Dimension | Indicator | References |
|---|---|---|
| Environmental | Resource Depletion | [63] |
| Sustainability-sourced Material | [13] | |
| Energy Consumption/Energy Efficiency | [13,38,63,64] | |
| Global warming | [63] | |
| Air pollution | [13,64,65,66,67,68] | |
| Water pollution | [64,66] | |
| Soil Pollution | [66,68] | |
| Waste Management | [13,67] | |
| Economic | Lifecycle Impact Reduction/adaptive reuse | [13,67] |
| Physical asset replacement cost | [69] | |
| Value of Asset | [70] | |
| Maintenance Cost | [66] | |
| Social | Public Safety | [64,70,71] |
| Safety of operational and construction staff | [68] | |
| Security | [71] |
| Sustainability Dimension | Criteria | |
|---|---|---|
| Environmental | Air Pollution/ Water Pollution/ Soil Pollution | Flaring from Storage Tanks |
| Flaring From the unit | ||
| Caustic Leakage | ||
| Flaring from the Gas Plant | ||
| Economic | Maintenance Cost | |
| Equipment Costs | ||
| Production Loss without BCPs | ||
| Social Safety | Pressure | |
| Failure in Emergency Response Equipment | ||
| Leakage Possibility | ||
| Types of fluid leaks | ||
| Temperature | ||
| Resilience Dimension | criteria | |
| Absorptive Capacity | Safety Relieve Valve | |
| Critical Alarms | ||
| Adaptive Capacity | Backup Asset | |
| Restorative Capacity | Availability of Spare Parts | |
| Skilled Personal or Contractor to Repair | ||
| Variable Name | NPT | Meaning |
|---|---|---|
| Maintenance cost | If (availability of skilled personnel or contractor to repair =“True”, TruncNormal (15,000, 1000, 10,000), TruncNormal (25,000, 4000, 13,000)) | If there are skilled personnel or contractor available in the country, the maintenance cost would be TNORM (15,000, 1000, 10,000); otherwise its TNORM (25,000, 4000, 13,000) |
| Equipment cost | If (availability of spare parts =“True”, TruncNormal (5000, 250, 2000), TruncNormal (8000, 1000, 3000)) | If there are spare parts available in the country, the equipment cost would be TNORM (5000, 250, 2000); otherwise its TNORM (8000, 1000, 3000) |
| Production loss | False: 0.9 | The probability of production loss due to the failure in the physical asset is 0.1 |
| True: 0.1 | ||
| Economic Criticality | If(Or(And(Maintenance cost >16,000, Equipment cost >7500), Production loss = “True”), True, False) | The Physical asset is economically critical if maintenance cost is higher than 16,000 and equipment cost is higher than 7500, or production loss would occur in case of failure |
| Criteria | Category | Corresponding Number |
|---|---|---|
| Pressure | 1–25 barg | 1 |
| 25–45 barg | 3 | |
| 45–70 barg | 5 | |
| >70 barg | 8 | |
| Temperature | 1–39 °C | 1 |
| 40–69 °C | 3 | |
| 70–100 °C | 5 | |
| >100 °C or <0 °C | 8 |
| Variable Name | NPT | Meaning |
|---|---|---|
| failure in emergency response equipment | Weibull (2700, 2.8) | failure in emergency response equipment is Weibull with a shape factor of 2.8 and characteristic life of 2700 h |
| leakage possibility | False: 0.9995 | The probability of leakage in the physical asset is 0.0005. The amount is the average of leakage possibility in different leakage scenarios defined in quantitative risk assessments conducted in GP |
| True: 0.0005 | ||
| social criticality | Safety = If(Or(fluid’s level of hazard + Pressure + Temperature > 20, And(leakage possibility = “True”, fluid’s level of hazard > 8), failure in emergency response equipment <1500), 1, 0) | The Physical asset is social-critical if the summation of the fluid’s level of hazard, Pressure, and Temperature corresponding number is more than 20; or if leakage possibility states true, and the fluid’s level of hazard is more than 8, or if failure in emergency response equipment occurs before 1500 h. |
| Variable Name | NPT | Meaning |
|---|---|---|
| flaring from storage tanks | Triangular distribution (0, 2, 6) | Flaring from storage tanks follows a triangular distribution with a minimum, mode, and maximum amount of 0, 2, and 6 million cubic meters in a week |
| flaring from unit | Triangular distribution (0, 5, 10) | Flaring from unit follows a triangular distribution with a minimum, mode, and maximum amount of 0, 5, and 10 million cubic meters in a week |
| flaring from the whole plant | Triangular distribution (0, 15, 30) | Flaring from the whole plant follows a triangular distribution with a minimum, mode, and maximum amount of 0, 15, and 30 million cubic meters in a week |
| Air pollution | flaring from storage tanks+ flaring from unit + flaring from the whole plant | Air pollution equals the sum of flaring from storage tanks, a unit, and a whole plant |
| Caustic Leakage | False: 0.9997 | The probability of caustic leakage in the physical asset is 0.0003. The amount is the average of leakage possibility in different caustic leakage scenarios defined in quantitative risk assessments conducted in GP |
| True: 0.0003 | ||
| Environment criticality | If (Or (Air pollution >15, Water Pollution = “True”, Soil pollution = “True”), True, False) | The Physical asset is environment critical if the amount of flaring (air pollution factor) is more than 15, or water or soil pollution occurs |
| Variable Name | NPT | Meaning |
|---|---|---|
| Failure in the Critical Alarm system | Weibull (3900, 3.8) | failure in a critical alarm system is Weibull with a shape factor of 3.8 and characteristic life of 3900 h |
| Failure in the safety relief valve system | Weibull (1700, 3.9) | failure in the safety relief valve system is Weibull with a shape factor of 3.9 and characteristic life of 1700 h |
| Absorptive capacity | If (And (Safety_Relieve_Valve > 1800, Critical_Alarms > 2500), True, False) | The absorptive capacity of the physical asset will be in acceptable condition if failure in the safety relief valve system does not occur sooner than 1800 h and failure in the critical alarm system does not occur sooner than 2500 h |
| Availability of Backup Contractor | Normal (0.9, 0.1) | The backup contractor is available 90% of the time with a standard deviation of 10% |
| Availability of Backup Asset | Normal (0.85, 0.05) | The backup contractor is available 85% of the time with a standard deviation of 5% |
| Adaptive capacity | If (Or (Availability of Backup Asset > 0.85, Availability of Backup Contractor > 0.95), True, False) | The adaptive capacity of the physical asset will be in acceptable condition if the Availability of the Backup Asset is more than 85% of the time or the Availability of the Backup Contractor is more than 95% of the time |
| Availability of spare parts | False: 0.2 | 80% of the time, spare parts are available, while 20% of the time spare parts are not available in the plant |
| True: 0.8 | ||
| availability of skilled personnel or contractor to repair | False: 0.1 | 90% of the time, skilled personnel or contractors are available, while 10% of the time there are no skilled personnel or contractors for maintenance or recovery activities |
| True: 0.9 | ||
| Restorative capacity | If (And (Skilled Personnel or Contractor to Repair =“True”, Availability of spare parts =“True”), True, False) | Conditional logic is applied to determine whether the restorative capacity is in acceptable condition. |
| Variable Name | NPT | Meaning |
|---|---|---|
| Physical asset functionality loss | If (Absorptive_Capacity = True, Triangular (0.05, 0.5, 0.8), Triangular (0.2, 0.5, 0.9)) | Physical asset functionality loss following disruptive events is triangular distribution (0.05, 0.3, 0.8) if absorptive capacity is in acceptable condition. Otherwise, the parameters are (0.2, 0.5, 0.9) |
| Physical asset recovery point | If (Adaptive_Capacity_Indicator = “True”, Triangular (0.6, 0.7, 0.8), Triangular (0.3, 0.4, 0.5)) | The physical asset recovery point follows triangular distribution (0.6, 0.7, 0.8) if adaptive capacity is in acceptable condition, otherwise, the parameters are (0.3, 0.4, 0.5) |
| Physical asset recovery time | If (Adaptive_Capacity_Indicator = “True”, Triangular (1, 15, 30), Triangular (30, 60, 110)) | Physical asset recovery time follows triangular distribution (1, 15, 30) if adaptive capacity is in acceptable condition. Otherwise, the parameters are (30, 60, 110) |
| Total Time to Recovery | If(Restorative_Capacity_Indicator = “True”,Triangular (5, 30, 110) + PART, Triangular (30, 75, 360) + PART) | Total time to recovery follows the sum of triangular distribution of (5, 30, 110) and physical asset recovery time if the restorative capacity indicator is in n acceptable condition. Otherwise, the parameters for the triangular distribution are (30, 75, 360) |
| Factor | Economic Critical | Social Critical | Environment Critical | Resilience Critical | |
|---|---|---|---|---|---|
| The Most Important Factor | Economic Critical | Equally Important | Fairly Important | Very Important | Weakly important |
| Factors | The Least Important Factor |
|---|---|
| Environment Critical | |
| Environment critical | Equally Important |
| Social critical | Fairly Important |
| Resilience critical | Very Important |
| Economic Critical | Absolutely important |
| Fuzzy Weights of Factors | Crisp Weighs |
|---|---|
| 0.367 | |
| 0.207 | |
| 0.104 | |
| 0.322 |
| Variable | Priority | ||
|---|---|---|---|
| Maintenance Cost | 0.52684 | 0.098053412 | 4 |
| Equipment Costs | 0.64937 | 0.120858219 | 1 |
| Production Loss without BCPs | 0.61607 | 0.114660552 | 2 |
| Failure in Emergency Response Equipment | 0.46904 | 0.0872959 | 5 |
| Leakage Possibility | 0.29985 | 0.055806916 | 12 |
| Air Pollution | 0.54405 | 0.10125647 | 3 |
| Caustic Leakage | 0.30649 | 0.057042727 | 9 |
| Safety Relieve Valve | 0.30252 | 0.056303846 | 11 |
| Critical Alarms | 0.30252 | 0.056303846 | 10 |
| Availability of Backup Contractor | 0.33369 | 0.062105085 | 8 |
| Backup Asset | 0.22317 | 0.041535532 | 13 |
| Availability of Spare Parts | 0.41276 | 0.076821286 | 6 |
| Skilled Personal or Contractor to Repair | 0.38662 | 0.071956211 | 7 |
Disclaimer/Publisher’s Note: The statements, opinions and data contained in all publications are solely those of the individual author(s) and contributor(s) and not of MDPI and/or the editor(s). MDPI and/or the editor(s) disclaim responsibility for any injury to people or property resulting from any ideas, methods, instructions or products referred to in the content. |
© 2023 by the authors. Licensee MDPI, Basel, Switzerland. This article is an open access article distributed under the terms and conditions of the Creative Commons Attribution (CC BY) license (https://creativecommons.org/licenses/by/4.0/).
Share and Cite
Aghabegloo, M.; Rezaie, K.; Torabi, S.A.; Khalili, S.M. A BIA-Based Quantitative Framework for Built Physical Asset Criticality Analysis under Sustainability and Resilience. Buildings 2023, 13, 264. https://doi.org/10.3390/buildings13010264
Aghabegloo M, Rezaie K, Torabi SA, Khalili SM. A BIA-Based Quantitative Framework for Built Physical Asset Criticality Analysis under Sustainability and Resilience. Buildings. 2023; 13(1):264. https://doi.org/10.3390/buildings13010264
Chicago/Turabian StyleAghabegloo, Mohsen, Kamran Rezaie, S. Ali Torabi, and Seyed Mohammad Khalili. 2023. "A BIA-Based Quantitative Framework for Built Physical Asset Criticality Analysis under Sustainability and Resilience" Buildings 13, no. 1: 264. https://doi.org/10.3390/buildings13010264