Article

Effects of the Ground Reinforcement on the Dynamic Behaviors of Compacted Loess Embankment with Ballasted Track

School of Civil Engineering, Chang’an University, Xi’an 710061, China
*
Author to whom correspondence should be addressed.
Buildings 2023, 13(4), 860; https://doi.org/10.3390/buildings13040860
Submission received: 15 January 2023 / Revised: 18 February 2023 / Accepted: 6 March 2023 / Published: 24 March 2023

Abstract

:
An embankment is needed to satisfy the requirements for the longitudinal slope of railway lines, and ground reinforcement is also generally required in loess regions. The present study attempted to understand the effects of different ground reinforcement measures on the dynamic characteristics of a track–embankment–ground system. To this end, the critical speeds and the distributions of dynamic stress and environmental vibration were analyzed using a 2.5D finite element method. Three typical ground reinforcements, including dynamic compaction ground (DCG), soil–cement compacted pile composite ground (SCG) and CFG pile composite ground (CFGG), were used. The results indicate that the train speed (critical speed I) at which the maximum vertical displacement of the track occurs is universally higher than that (critical speed II) at which the wave propagation phenomenon occurs. The lower boundary limit of the peak region in the dispersion relationship can be selected as the reference value of critical speed II. Moreover, the values of critical speed I obtained using the DCG, SCG and CFGG models were around 92, 105 and 127 m/s, respectively. For critical speed II, the values were 75, 80 and 115 m/s. Once the train speed exceeded critical speed II, the vibration was confined to the embankment in the CFGG model, as evidenced by the isolation of the wave propagation from the embankment to the ground as well as the increasing dynamic stress in the embankment. After reinforcement, the dynamic stress, dynamic influence depth (DID), critical speed and resonant frequency increased. Additionally, the DID stayed around the 3–6 m range at all speeds.

1. Introduction

An embankment is needed in railway line construction to satisfy the requirements for the longitudinal slope. The dynamic responses of the ground have been discussed in some previous studies in the case of a low embankment height. In some theoretical analyses, the embankment is commonly considered as a beam resting on a semi-infinite foundation. However, the geometry of the system is no longer compatible with the adaptability of theoretical methods when the height of the embankment is non-negligible [1,2,3]. In fact, the influence of dynamic loading might be mainly concentrated on the embankment, owing to the limited influence depth of the moving train load [4]. Discussions about the dynamic responses of embankments are of significance for the evaluation of the dynamic stability and long-term operation status of the subgrade.
In the construction of embankments, ground reinforcement is generally adopted to ensure the high strength and limited deformation of the foundation [5,6,7,8]. There are three vital issues for the operation of railway lines, i.e., the effects of the embankment on the dynamic characteristics and environmental vibration of the system, the effects of the ground reinforcement measures on the dynamic response of the system and the distribution laws of the dynamic stress on the embankment. Regarding the first issue, Connolly et al. [9] investigated the effect of the embankment stiffness on the ground-borne vibration. Costa et al. [10] established a simplified approach for calculating the critical speed of track–embankment–ground systems. Olivier et al. [2] investigated the ground vibration on embanked high-speed rail lines via a finite element model and pointed out that vibration attenuation with distance is dependent on the soil surface geometry. In order to present an efficient mitigation measure for railway embankment vibrations, Lyratzakis et al. [3] processed a number of numerical simulations in which a 3D finite element model of a ballasted track–embankment–ground system was built. Regarding the reinforcement effects of piles, Gao and Li [11] investigated the influences of CFG pile composite subgrade on ground vibration attenuation and the vibration frequency spectrum. Connolly et al. [12] reported that the critical speed increases and the displacement of the rail decreases as the stiffness of the pile increases. Li et al. [13] discussed the influences of piles on the vibration responses of soils, and the train–track dynamic interactions. The results showed that pile-reinforced ground has a higher critical speed than that of natural ground. The dynamic characteristics of embankments with different ground reinforcement measures, however, are rarely addressed, although they have been considered in some previous studies.
Loess is one of the most extensively distributed geological formations, covering approximately 10% of the land surface on the earth’s mantle [14]. China has the most widespread dispersion of loess in the world, with a range of over 631,000 km2, accounting for 6.6% of the total area of the country. In loess regions, ground treatment measures are required in the construction of embankments, according to the actual stratigraphic condition. Dynamic compaction, soil–cement compaction piles and cement–fly-ash–gravel (CFG) piles are frequently used to reinforce the ground when the depth of the collapsible loess is small. In detail, the dynamic compaction method is employed to increase the density, leading to a lower compressibility and higher strength of the soil foundation through the energy generated from dropping a rammer. Soil–cement compaction piles, considered as flexible piles, present a relatively high homogeneity and density, leading to a higher bearing capacity of the composite ground compared with that when employing soil–cement mixing piles [15]. CFG piles, which can be classified into the group of semi-rigid piles by mixing gravels, fly ash and cement, have the advantages of a higher strength and stiffness with a lower cost, with the ability to improve the bearing capacity of the CFG pile composite ground by transmitting the construction load to deeper soil levels [11,16]. When the thickness of the collapsible loess is relatively large, it is appropriate to employ a long–short composite piled foundation, in which the short pile is used to eliminate the collapsibility, and the long pile is capable of controlling the compressive deformation of the soil. However, some questions remain: How do the dynamic displacement, environmental vibration and dynamic stress evolve as the train speed increases, or under different methods of ground reinforcement? How do the ground reinforcement measures affect the critical speed and the dynamic influence depth of the system? Moreover, what roles do the embankment and reinforced ground play in the dynamic response of the system? All of these issues are essential in fully understanding the operating conditions of railway lines in loess areas. However, as yet, little is known about these critical issues.
Aiming to achieve the abovementioned objectives, three typical reinforced ground types, i.e., dynamic compaction ground (DCG), soil–cement compacted pile composite ground (SCG) and CFG pile composite ground (CFGG), were selected to illustrate the variations in the dynamic displacement of the track, the environmental vibration of the embankment–ground system and the distribution of the dynamic stress in the embankment. An efficient 2.5D finite element method was used to calculate the dynamic response law of the system. The present study is expected to provide a preliminary reference for the related research in the future.

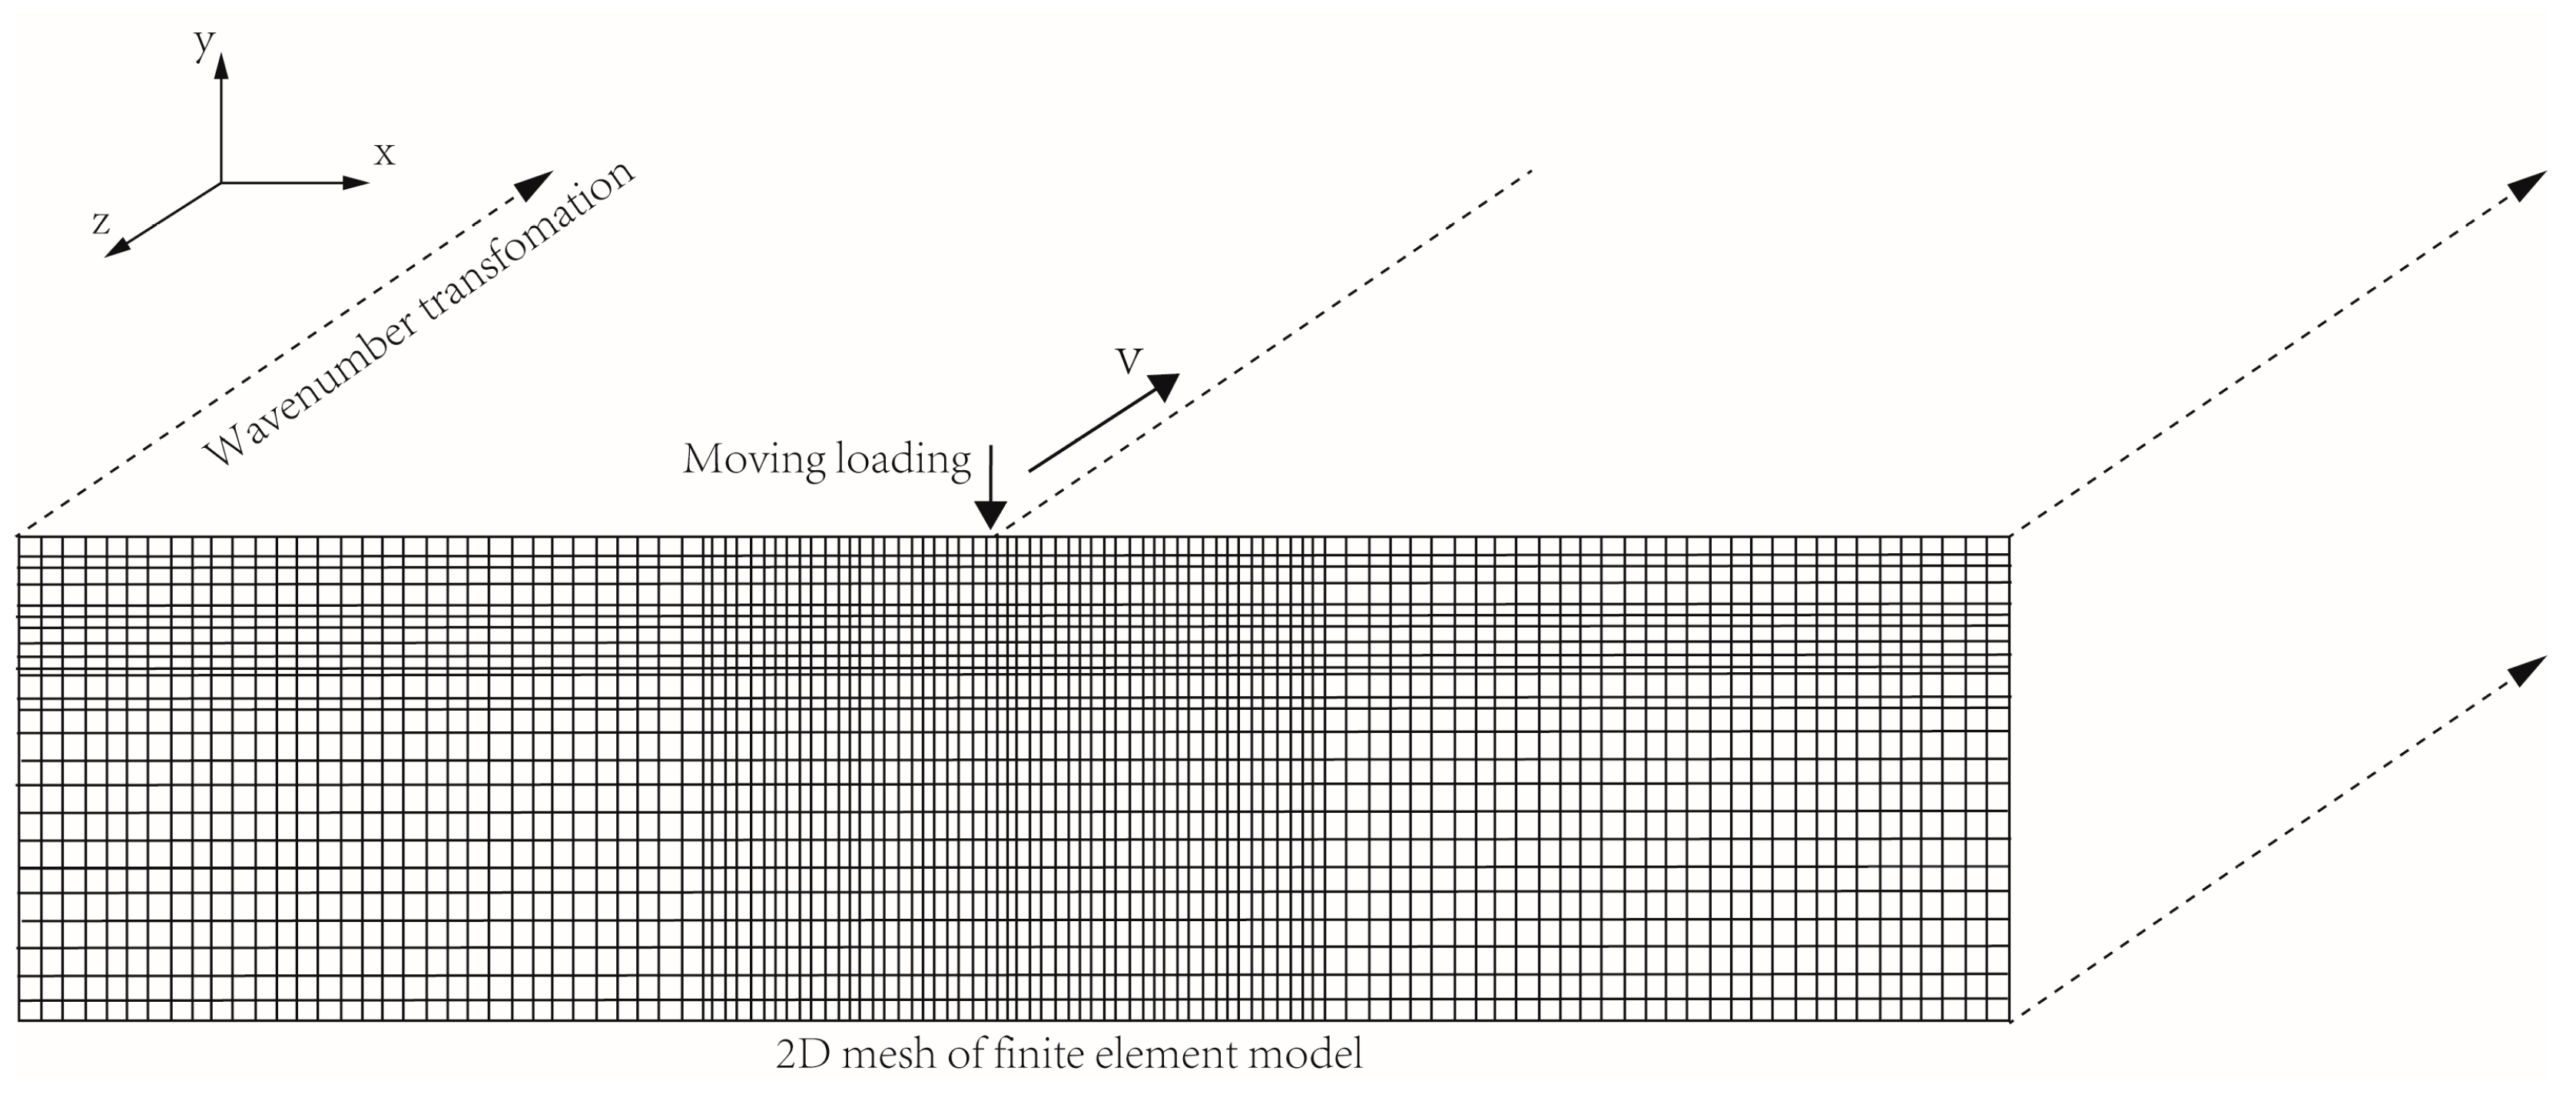
2. Brief Introduction of the 2.5D Approach and Verification

2.1. Brief Introduction of Basic Theory

Dynamic responses of subgrade systems have been previously studied as plane strain problems, for the consideration of computational efficiency. However, some published studies have revealed that dynamic characteristics of subgrade systems subjected to moving train loads will violate the corresponding assumptions in the plane strain condition, although the cross-section of the subgrade is considered invariant along the direction of the moving load. The 2.5D finite element method was introduced by Yang et al. [17] for understanding the dynamic responses in subgrade systems, and it has been increasingly used with the advantages of high efficiency, high accuracy and the ability to consider complex sections [10,17,18,19,20,21], compared with a higher demand for meshing by employing a 3D finite element model. The accuracy of simulated results obtained using the 2.5D approach depends on several factors, including the number and corresponding size of meshes, resolution in the time–frequency domain and wave adsorption boundary. On the other hand, the computational efficiency of 2.5D models highly depends on the number of samplings and the range of the frequency–wavenumber domain [22].
In the 2.5D approach, soil properties are considered as invariant, and the cross-section of the track–embankment–ground system is also considered as invariant and infinite in the direction of the moving train, i.e., the z direction herein. Since the wavenumber transformation is adopted along the z direction as mentioned, the 3D dynamic responses of the subgrade system can be calculated based on a 2D finite element model, which consequently reduces the degree of freedom of the model. Because only the section information in the x–y plane is considered in the finite element preprocessing, the computational workload is greatly reduced. The dynamic responses on each node of the mesh element in the time–space domain (x,y,z,t) can be calculated from the frequency–wavenumber domain (x,y,ξz,ω) using a dual Fourier transform. Any details on corresponding basic theories and equations can be found in the previous literature as mentioned above [17,18,19,20,21]. The present 2.5D finite element procedure was written using the commercial software MATLAB R2019b. A schematic illustration of the 2.5D approach for dynamic responses in an embankment–ground system can be seen in Figure 1.

2.2. Verification of the 2.5D Procedure

The accuracy of the present approach was validated by comparing the simulated results obtained with the proposed 2.5D approach with the field monitoring data obtained by BANVERKET (Swedish Rail Administration). Additionally, the simulated results were compared with those from Takemiya [18] and Gao et al. [21] under train speeds of 70 and 200 km/h, respectively. In the 2.5D modeling procedure, the effects of different soil layers with distinct physical properties and the ground reinforcement measure of piles were considered [20]. Then, we considered the track system as a Euler beam with a bending rigidity of 200 MN·m2 and mass per unit length m = 10,800 kg/m [24]. Some other properties of the train and soil are listed in Table 1 and Table 2. A comparison of the vertical displacements obtained using the 2.5D approach and those from Takemiya [18], Gao et al. [21] and the monitoring data is shown in Figure 2.

3. Model Information

3.1. Section and Material Parameters

A typical cross-section of an embankment–ground system is presented in Figure 3, according to the latest design of railway embankments applied in the loess region in China. The width of the embankment surface was 8.8 m, and its height was set to 6 m considering the potentially limited effect depth of the moving train load [4]. In detail, the thickness of the surface and bottom layers of the subgrade bed was set to 0.7 and 2.3 m, respectively. The slope ratio of the embankment was 1:1.5, as shown in Figure 3. In this case, the height of the embankment was non-ignorable. A typical loess site was selected as the model foundation. Three types of ground soil improvement methods were adopted in the present study, i.e., dynamic compaction ground (DCG) with a depth of 3 m, soil–cement compacted pile composite ground (SCG) and CFG pile composite ground (CFGG), as shown in the finite element models in Figure 3. Figure 3 also depicts the outline and meshing of the model cross-sections. The model width was set to around 150 m. It was noted that the size of the grid should be smaller, leading to the generation of a greater number of grids along the center line below the embankment, compared with the region far away from the center line. It is obvious that the dynamic stress attenuates gradually in the surrounding region; therefore, we decided to focus on the distribution of the dynamic stress in the region below the embankment.
The parameters of the different soil layers and structure parts are listed in Table 3. The parameters of the soil layers were obtained by conducting physical–mechanical tests in the laboratory. The properties of the embankment and piles were collected from corresponding railway engineering reports in the loess region. As a frequency-domain method, the nonlinearity of the soil cannot be considered accurately in the 2.5D computing process. In a previous study, the equivalent linear method was used to consider the variation in the soil stiffness with the octahedral strain through multiple iterations [10]. This is an excellent compromise, but significantly demanding from the computational point of view. A better situation for the present model is a linear relationship between the dynamic stress and strain points of the compacted loess, which has been reported previously in an initial dynamic strain interval under traffic loading [25]. This means the nonlinear characteristic of the soil becomes no longer essential in studying the dynamic behavior of the compacted loess embankment.
With regard to the pile-reinforced ground, a 0.5 m diameter and 15 m length of the pile were selected at a spacing of 1.5 m. The foundation reinforcement area was 2.5 m beyond the foot of the embankment slope. A 0.8 m thick cement-improved soil cushion was placed between the reinforced ground and the embankment. In accordance with some relevant references [23,24], the pile–soil contact was simulated by applying the binding constraint and the equivalent dynamic modulus method for obtaining the equivalent modulus (see Equation (1)). Specifically, equivalent piling, which was distributed in the longitudinal direction with a fixed cross-section, was adopted in the present study based on Zhang et al. [26]. It was considered reasonable to simulate the dynamic responses in the reinforced ground by using such a method, because the dynamic stress decays to a very low value when transmitting from the embankment to the ground. The connection surface between adjacent soil layers in the finite element model was modeled by sharing the same nodes. Considering the response detail of the embankment instead of that in the pile-reinforced ground was an objective of this study, so the above simplification was acceptable. Moreover, it is apparent that the dynamic pile–soil interaction might be very slight beneath an embankment whose height is non-ignorable. For the SCG, the dynamic modulus of the soil in the pile is increased appropriately as a result of the compaction effect.
E s p = π D 4 l E p + ( 1 π D 4 l ) E s
where l refers to the pile center spacing, D is the diameter of the pile, E is the dynamic modulus, and subscripts sp, p and s refer to the equivalent pile wall, pile and soil among the pile, respectively.
There are two generic choices of the track structure type, i.e., ballasted and slab track. In recent years, the slab track type has been increasingly adopted on high-speed railways, resulting in a higher service performance and a longer life. However, the ballasted track type is still widely used on both normal and high-speed railways owing to its low price and easy maintenance. To date, ballasted tracks have contributed to more than 95% of railway systems [25,27]. In many countries, ballasted tracks are the main choice for high-speed railways, such as in France, Spain and Italy. In China, the first high-speed ballasted track railway line in the loess region is in operation (Yinchuan–Xi’an). Therefore, a ballasted track was selected in the present study in order to consider a large speed range, i.e., from 60 to 140 m/s.
Similar to Gao [20] and Bian [28], the ballasted track system was modeled as a Euler beam with a width of 4 m, and the parameters were as follows: bending rigidity EI = 13.254 MN·m2 and mass per unit length m = 540 kg/m. It should be noted that using a Euler beam model can lead to a reasonable analysis of dynamic responses in the subgrade system with good accuracy. The granular mixture of railway ballast and sleepers was modeled as a continuous distributed mass attached to the track, in order to be coincident with the assumption of invariance in the z direction for the 2.5D method. In fact, the sleepers vertically transmit shock excitation to the embankment and thus have a discrete supporting effect on the track. On the other hand, the deformation of ballast can be modeled using a more appropriate constitutive model; however, the 2.5D method becomes more complicated for the calculation of the dynamic responses of track–embankment–ground systems. A viscoelastic, dynamically artificial boundary was adopted to simulate the absorbing effect of the outer domain on the wave induced by the moving load. The parameters of the viscoelastic element were calculated by referring to the stress field in the viscoelastic medium [20,22].

3.2. Vehicle Information

The relative position of the axle loading was defined according to the CRH3 (China Railways High-speed) train, as shown in Figure 4. The train has 8 carriages, in which 4 motor carriages (M) and 4 trailing carriages (T) are orderly arranged (M + T + M + T + T + M + T + M). The length of the train is about 200 m, and the max axle weight is about 17 t. A mathematical model of the train using the 2.5D approach can be found in [24].

4. Results and Discussion

There are three vital types of responses when studying the dynamic behavior of the subgrade when subjected to moving train loads, i.e., the vertical displacement of the track, the dynamic stress of the subgrade soil and the environmental vibration on the surface. They are relevant to the operating safety and comfort of passage, the long-term settlement and dynamic stability of the subgrade and the suitability of living environments along the line. In order to fully analyze the effects of the train speed, five different speeds were considered, i.e., 60, 80, 100, 120 and 140 m/s. It is worth noting that 100, 120 and 140 m/s are very high speeds for operation.

4.1. Vertical Displacement of Track

The vertical displacement curves of the track considering different train speeds are shown in Figure 5. Here, we ignored the difference in the vertical displacement induced by the train head and subsequent carriage, and the maximum vertical displacement of the track induced by the moving load was adopted to ensure a more conservative result. As shown, the vertical displacement form of the track changes as the train speed increases. It is well known that there are two classical response patterns of the subgrade with increasing train speed, i.e., with or without wave propagation over the ground. The change in the displacement pattern is more evident when observing the contour plot of the surface in the x–z section, as shown in Figure 6. For the DCG and SCG models, the Mach cone is easy to distinguish.
The displacement caused by adjacent bogies (two and three bogies in Figure 5a) has no interactions when the speed is at a low level, in which the system’s displacement pattern is quite similar to a quasi-static deformation. With the increase in the train speed, the interaction between adjacent bogies gradually emerges, which is the external expression of wave propagation and the Mach cone. This interference in the deformation induced by adjacent bogies that are closely spaced gives rise to an increase in the vertical displacement amplitude for the DCG and SCG models. This conclusion was drawn through a comparison of the displacement generated by the second bogie, whose amplitude is similar to that in the condition with no wave propagation. The above phenomenon means that the spatial position of the axle load, which depends on the train type, has a significant influence on the amplitude of the vertical displacement of the track at a relatively high speed [12]. Moreover, the Mach cone of the SCG model becomes blunter compared with that of the DCG model, especially for the v = 100 m/s condition. This change indicates that the reinforcement measure significantly improves the integrity of the embankment.
Additionally, it is important to highlight that the response pattern of the CFGG model at a high speed (i.e., v ≥ 120 m/s) is unique. The interaction between adjacent bogies also exists but no longer leads to an increase in the vertical displacement amplitude. It is evident that the displacement amplitude generated by the second bogie is larger than that generated by the third bogie. The contour plot of the surface of the CFGG model at a high speed is different from those of the other models. As can be seen in Figure 7, the Mach cone appears, but the wings are confined to the embankment area. This phenomenon is of significance in revealing that the CFG pile reinforcement measure can isolate the wave propagation from the embankment to the ground. The main reason might lie in the fact that the local reinforcement decreases the response of the ground through the continuity and coordination of displacement.
Owing to the increase in train speeds in recent decades, discussions about the critical speed of the subgrade have become increasingly necessary. The critical speed has always been seen as the speed yielding the maximum amplification of dynamic responses, or the lowest load speed that gives rise to wave propagation in track–ground systems [10,29]. In order to determine the critical speed of our track–embankment–ground system, variations in the vertical displacement amplitude of the track versus train speed are depicted in Figure 8. The critical speeds of the DCG, SCG and CFGG models were around 92 m/s, 105 m/s and 127 m/s, respectively. A common conclusion can be drawn that the ground reinforcement reduces the vertical displacement of the track and increases the critical speed of the system. It is evident that the DCG model had two critical speeds, which is consistent with the performance of the ground with the presence of a stiffer upper layer. This is acceptable because the modulus of the embankment filler is larger than that of the ground layer.
Establishing a simplified determination method of the critical speed is a significant effort in engineering practice. To this end, Costa [10] tested a theoretical method for obtaining the critical speed of a track–embankment–ground system. However, it is difficult to consider a layered soil for the reinforced ground following the method proposed by Costa [10]. Thus, the P–SV ground dispersion relationship cannot be calculated using theoretical methods. An alternative approach is to plot the P–SV Green function (vertical displacement response to unit vertical harmonic load) of the model [30]. The 2.5D approach is an efficient method to delineate the dispersion relationship of a system without a track, as shown in Figure 9. The intersection of the embankment–ground dispersion curve and the track system dispersion curve can be used to determine the critical speed of a track–embankment–ground system [10,22]. As shown in Figure 9, the critical speeds obtained by the dispersion curves were about 96, 104 and 144 m/s for the DCG, SCG and CFGG models, respectively. The prediction performed well for the DCG and SCG models. However, a remarkable difference cannot be overlooked in the CFGG model. The reason might lie in the significant movement of the peak area of the contour plot, which basically changes the dispersion relationship and makes the dispersion curve hard to delineate. That is, the critical speed of the DCG and SCG models can be obtained rapidly through the dispersion relationship; however, this remains challenging for the CFGG model. It is worthwhile mentioning that the vehicle type and the spatial distribution of the axle load also change the values of the critical speed obtained in the manner shown in Figure 8 [12]. The interaction of the axle loads will not be discussed because the effect is always subtle and difficult to quantify.
The effects of reinforcement measures on the dynamic responses of the system could also be discussed from the point of spectrum features. The peak area is distributed in a narrow frequency range, which can be regarded as the resonance frequency of the system. It is evident that the resonance frequency was remarkably increased after the ground was reinforced with the CFG pile.
In addition, it should be pointed out that the appearance of the peak area leads to a change in the displacement curve in the time domain. As can be seen in Figure 5, the displacement forms under the condition of no wave propagation on the surface are similar. The contour plots of the surface around the lower limit speed are depicted in Figure 10. Combining the results shown in Figure 6 and Figure 7, a conclusion could be drawn that the lower boundary limit of the peak region could be taken as another critical speed at which the Mach effect occurs.
Compared with the critical speed (critical speed I) determined using the vertical amplitude of the track, the lower boundary speed (critical speed II) is also of great significance. Moreover, critical speed II is more universal, since the value of critical speed I depends upon the spatial distribution of the axle load to some extent. In engineering practice, critical speed II is suggested for estimating the response pattern of the subgrade.

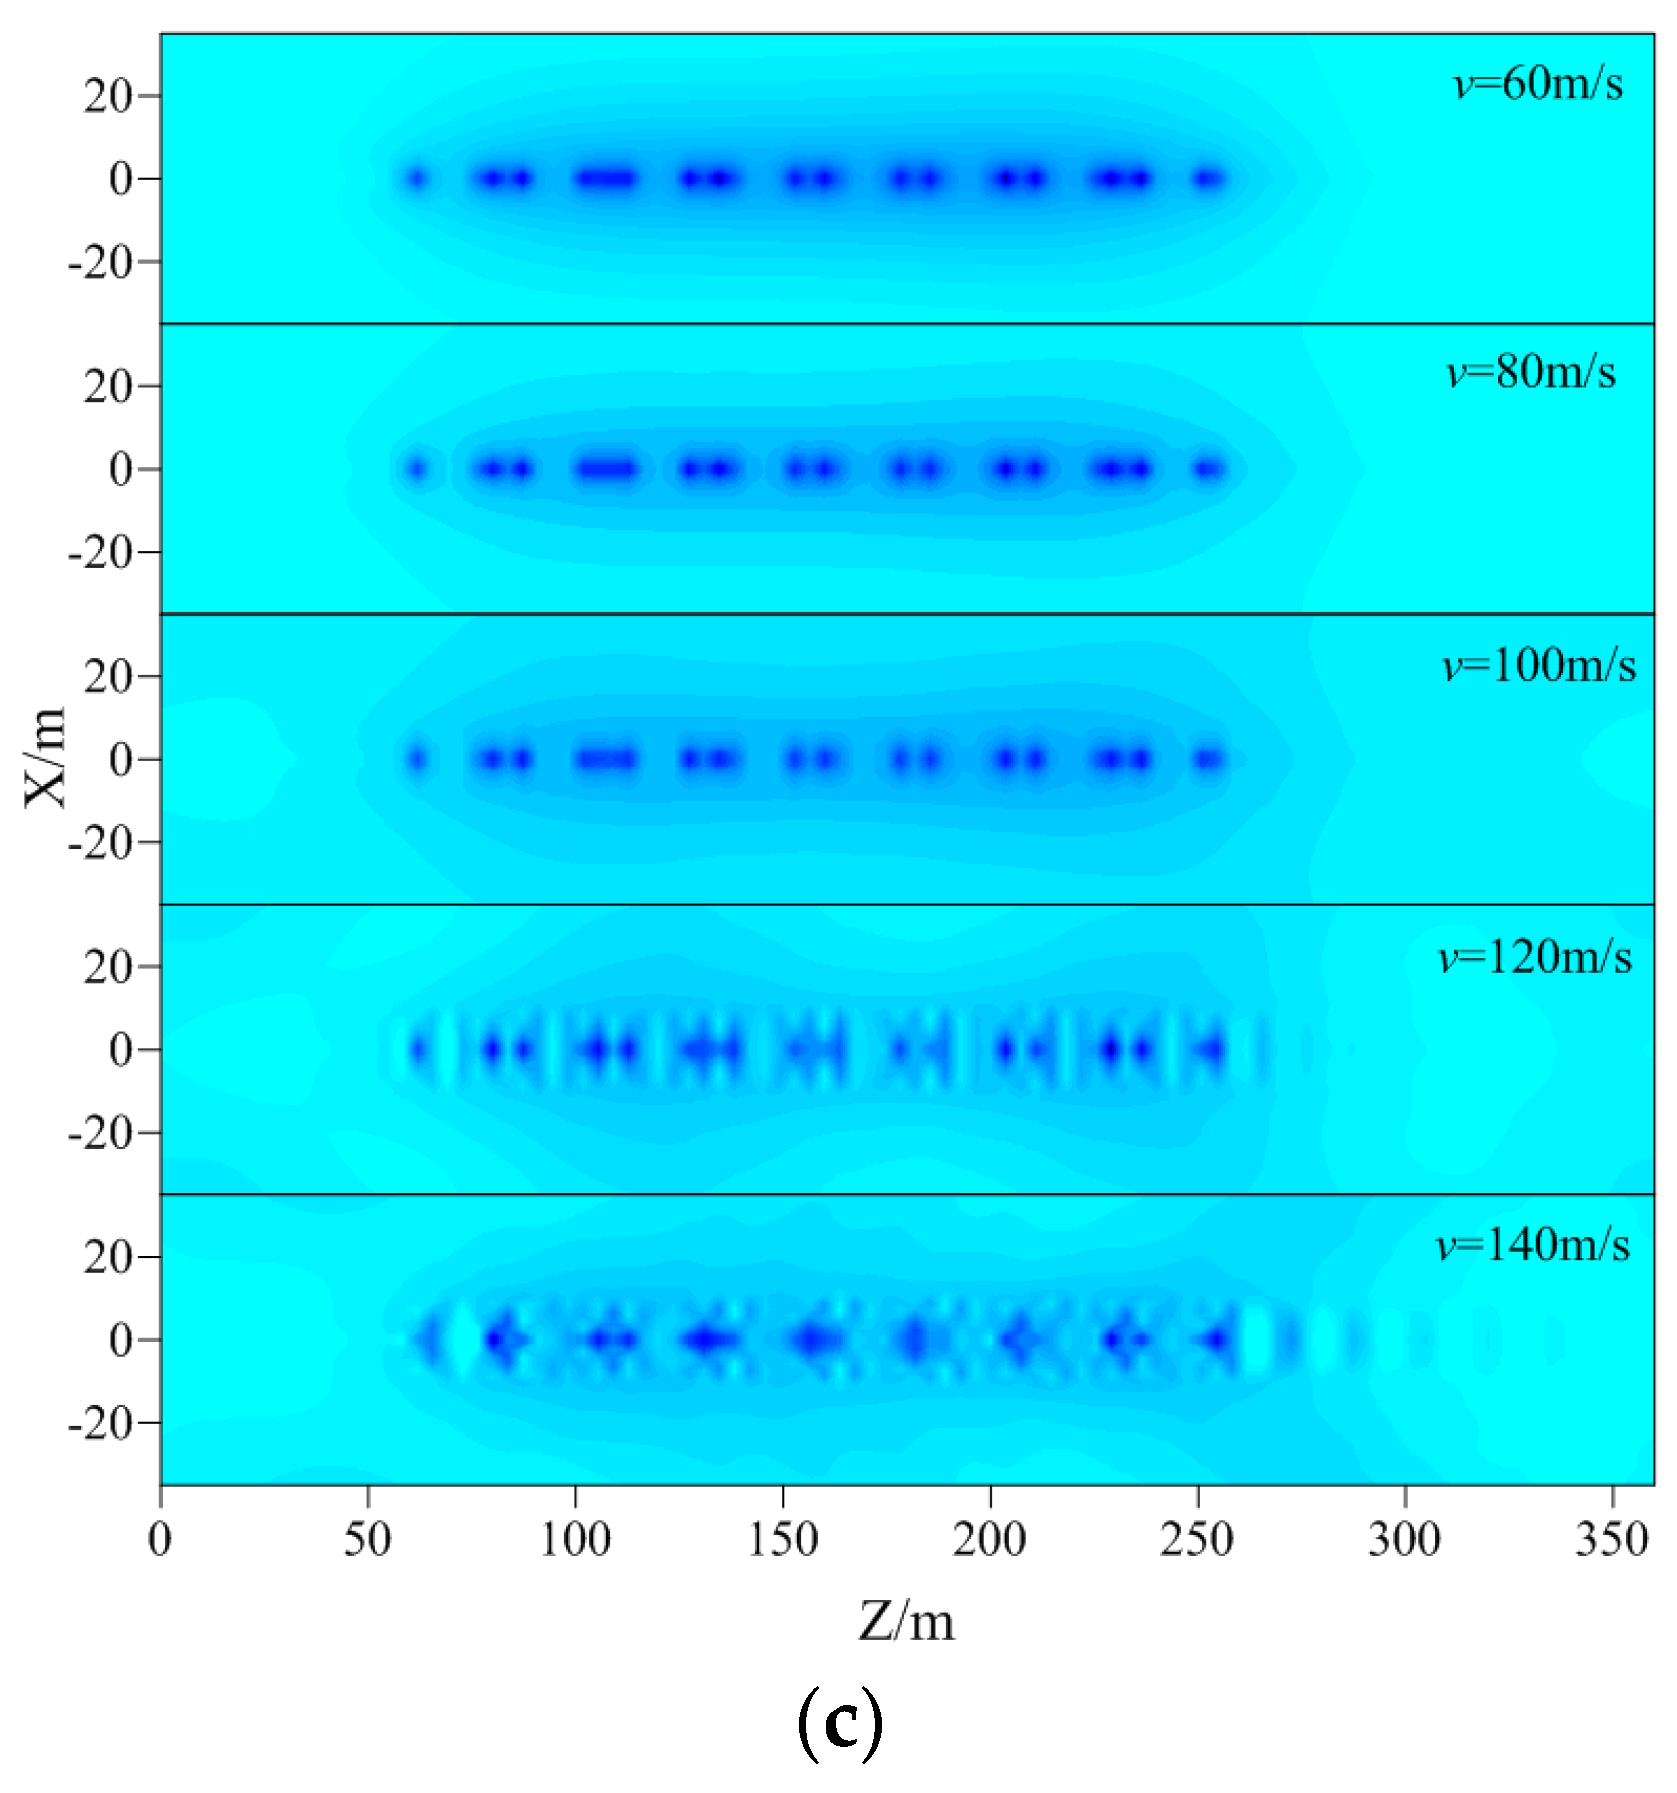
4.2. Environmental Vibration

In the present section, the influences of the ground reinforcement measures on the environmental vibration on the surface are studied comparably. Several parameters are frequently used to describe the environmental vibration, such as the acceleration, vertical velocity and root mean square of the vertical velocity [2,13]. The vibration level (VAL, unit: dB), defined using the maximum acceleration value, was adopted to introduce variation into the environmental vibration generated by the moving train load, written as follows:
V A L = 20 log 10 ( A A 0 )
where A is the maximum acceleration value (m/s2), and the quantity A0 is the normalization value of A0 = 10−5 m/s2 [18].
The distribution and attenuation of the VAL are shown in Figure 11, Figure 12 and Figure 13. Taking the DCG model as an example (Figure 11), the increase in the train speed led to an increase in the VAL. The VAL decayed rapidly at first and gradually became stable with the distance from the center of the railway. Moreover, the increase in the train speed also led to an increase in the attenuation rate of the VAL.
Before illustrating the distribution of the VAL of the alternate models, the variations in the VAL of the track versus the train speed under different ground reinforcement measures are shown in Figure 12. The VAL linearly increased with increasing train speed by around 115–135 dB. Additionally, the ground reinforcement measure was found to have a negligible influence on the VAL. That is, the differences in the VAL distribution were only reflected in the attenuations, along with the distance from the center of the railway, as shown in Figure 13.
The differences in the VAL distribution between the DCG and SCG models were very slight, and the attenuation in the VAL value of the SCG model was a little faster than that of the DCG model. An obvious tendency could also be observed in the CFGG model, i.e., it had a faster rate of reduction in the value of the VAL. The ground vibration intensity of the CFGG model was significantly lower than that of the alternate models.

4.3. Dynamic Stress

The distribution and influence depth of vertical stress are significant in evaluating the long-term settlement and dynamic stability of the subgrade. To this end, vertical stress variations along the center line of the different models are shown in Figure 14. As mentioned above, the dynamic response was basically changed by the CFG pile reinforcement measure. The response of the SCG model, however, was similar to that of the DCG model. For the DCG and SCG models, the vertical stress amplitude decayed very quickly along the depth, and the attenuation tendencies under different train speeds were similar, as shown in Figure 14a,b. That is, an increase in the train speed did not change the attenuation law of the dynamic stress with depth. However, an evident difference can be clearly observed in Figure 14c. Regarding the CFGG model, the attenuation tendencies in the embankment were similar to those of the other two models, with the train speed being lower than critical speed II. Once the train speed exceeded critical speed II, such as at 120 m/s, the amplitude declined slowly and a rebound tendency became more and more evident at a depth of around 3–5 m as the train speed increased. Additionally, the dynamic stress of the soil among the piles suddenly decreased in the embankment–ground interface, owing to the pile–soil stress proportion of the composite ground. It should be noted that the train speed of 140 m/s resulted in a fluctuation in the simulated results.
The vertical dynamic stress amplitudes at 4 m depth versus the train speed based on different models are depicted in Figure 15. It is quantitatively shown that the dynamic stress increased with the increase in the train speed. Furthermore, the ground treatment measure was found to increase the dynamic stress in the embankment. The higher the stiffness of the composite ground, the larger the dynamic stress. Regarding the CFGG model, a better prediction of the dynamic stress is expected when there is no wave propagation on the surface owing to the constant difference from the other models. However, an inflection point evidently occurred at a train speed of around 110 m/s. The dynamic stress difference between the SCG and CFGG models became more and more significant once the train speed exceeded critical speed II. Under the condition of a train speed higher than critical speed II, it is valid that the CFG pile reinforcement confined the vibration to the embankment, isolating the wave propagation from the embankment to the ground as well as increasing the dynamic stress in the embankment.
The dynamic influence depth (DID) is always considered as an important factor to describe the region subjected to train loading. With regard to the determination of the DID, the first approach is to take the depth at which the dynamic stress attenuation rate is reduced to 10%; the other approach refers to the determination of the thickness of the compression layer, i.e., the depth at which the ratio of the additional stress to the self-weight (ζ) is between 0.1 and 0.2 [31]. As we all know, the dynamic behavior of the soil is strongly affected by the confining pressure. Moreover, the cyclic stress ratio is always adopted to classify the dynamic behavior of soil subjected to long-term traffic loading. The latter approach, therefore, should be more reasonable in determining the DID. In the present study, ζ = 0.1 was adopted to determine the DID.
It is worth mentioning that the initial earth pressure on the top of the subgrade is not zero because of the dead load applied by the bed. In the present study, the initial vertical earth pressure was 14 kPa, according to the “Code for Design of Railway Earth Structure” [32]. The relationships between the dynamic stress amplitude and depth with the 0.1 self-weight line are depicted in Figure 14, and the variation in the DID versus the train speed is shown in Figure 16. It is clear that the DID increased with the increase in the train speed, and the ground reinforcement led to an increase in the DID. The DID stayed around the 3–6 m range at all speeds. For the CFGG model, the inflection point became no longer obvious owing to the sudden decrease in the dynamic stress in the embankment–ground interface.

5. Conclusions

The present study addresses the effects of different ground reinforcement measures on the responses of a ballasted track–embankment–ground system. Three typical reinforced ground layers were adopted, i.e., dynamic compaction ground (DCG), soil–cement compacted pile composite ground (SCG) and CFG pile composite ground (CFGG). The critical speed, dynamic influence depth (DID) and environmental vibration attenuation were discussed in terms of the displacements of the track, the variations in environmental vibration and the dynamic stress distributions. Some conclusions can be drawn, as follows:
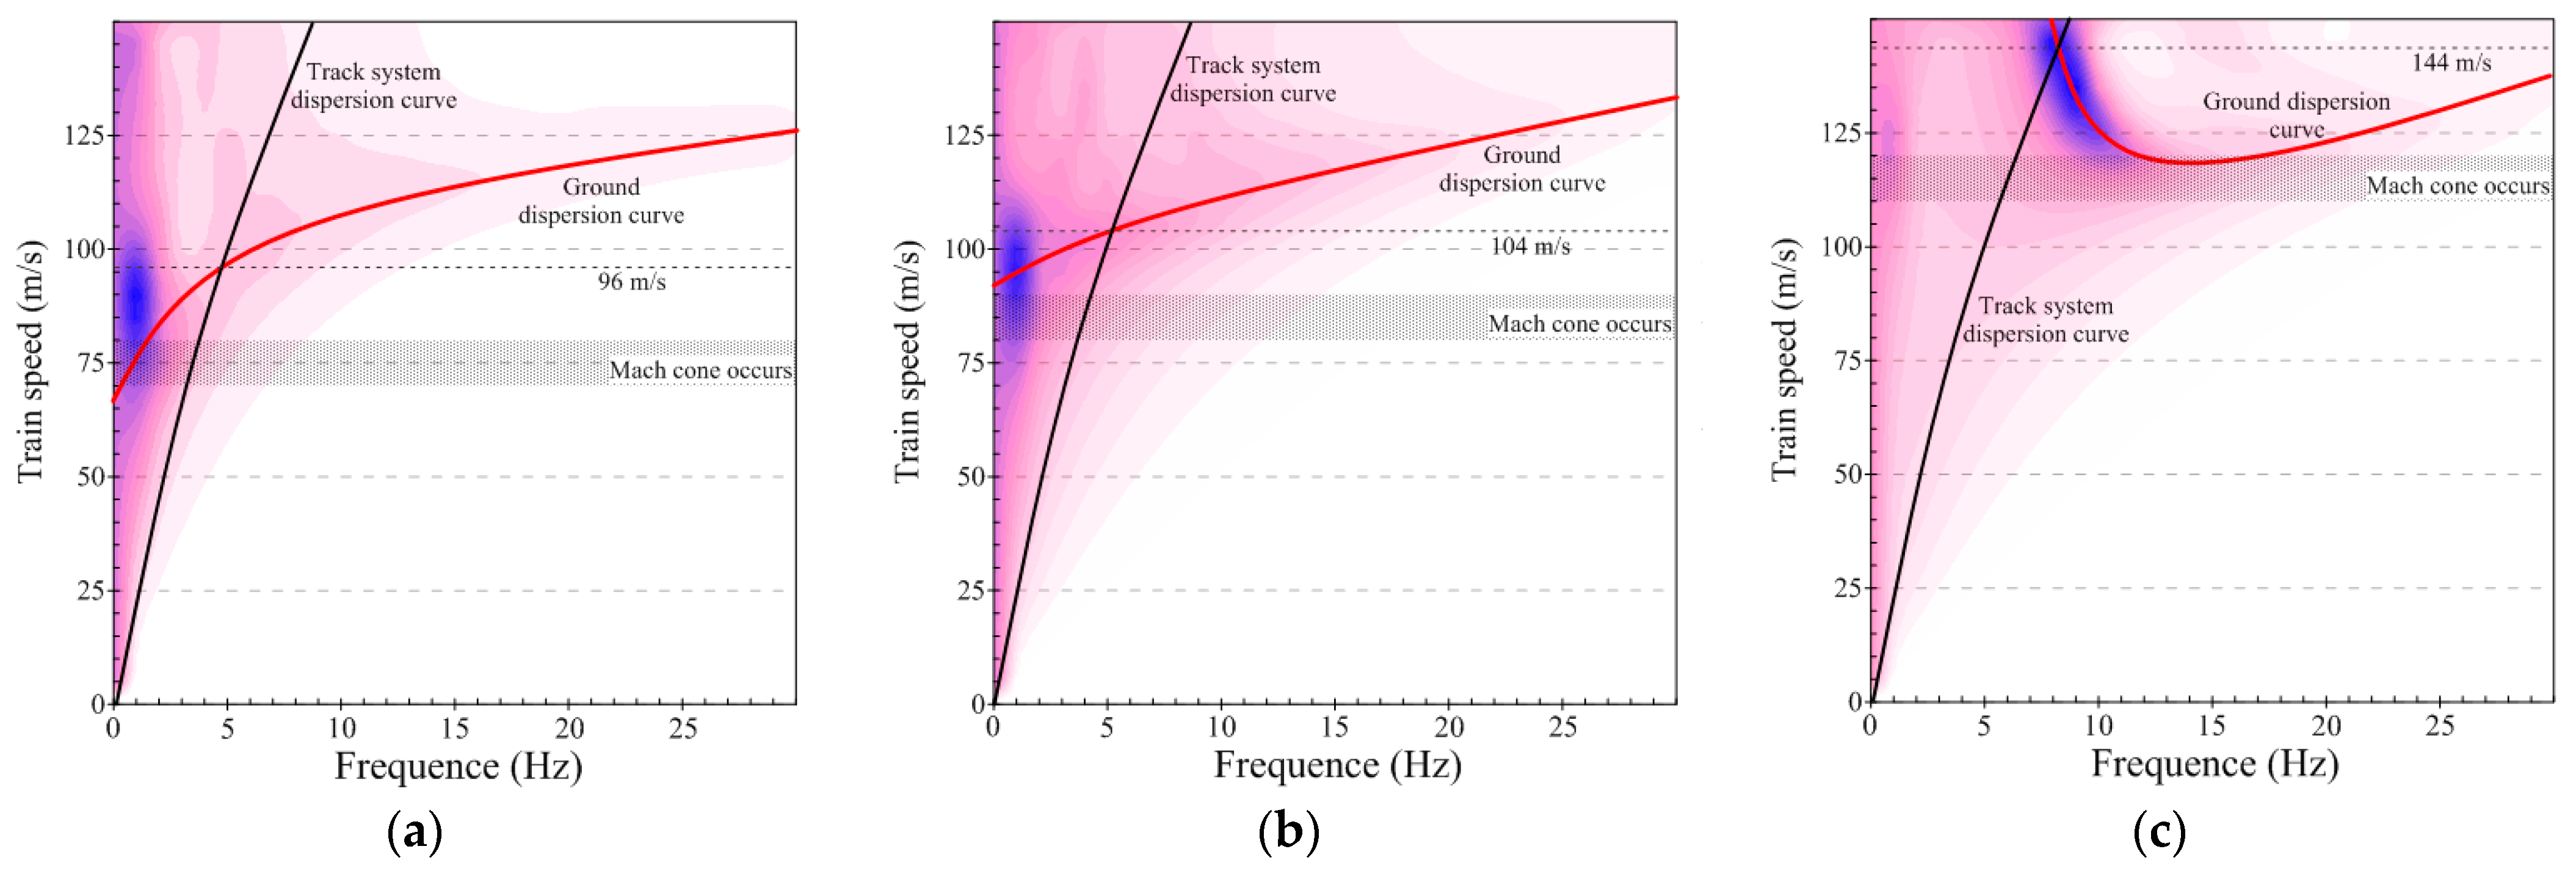
  • The train speed (critical speed I) at which the maximum vertical displacement of the track occurs is higher than that (critical speed II) at which the wave propagation phenomenon occurs. The response pattern is basically changed after the wave propagation phenomenon occurs. Consequently, it is suggested to take critical speed II into account in engineering practice.
  • The contour plots of the dispersion relationship of the embankment–ground could be used to determine critical speed I of the DCG and SCG models. This remained challenging for the CFGG model, resulting in an abnormal distribution of the peak area. The lower boundary limit of the peak region could be selected as the reference value of critical speed II. The obtained values of critical speed I for the DCG, SCG and CFGG models were around 92, 105 and 127 m/s, respectively. For critical speed II, the values for the same models were 75, 80 and 115 m/s, respectively.
  • After reinforcement, the dynamic stress, DID, critical speed and resonant frequency increased. Meanwhile, the displacement of the track decreased. When the train speed exceeded critical speed II, the CFG pile reinforcement measure significantly changed the dynamic characteristics of the system. The vibration was confined to the embankment, isolating the wave propagation from the embankment to the ground as well as increasing the dynamic stress in the embankment.
  • The DID stayed around the 3–6 m range at all speeds and increased with the increase in the train speed. The ground reinforcement also led to an increase in the DID.
It should be noted that, although a verification of the 2.5D finite element model was performed in this paper, the simulated dynamic responses of the track–subgrade system under the effects of different ground reinforcement measures need to be compared with experimental monitoring data from engineering practice, in order to verify the accuracy of the proposed 2.5D finite element model and the reliability of the calculated results. On the other hand, it is better to explicitly present an exact improvement and the efficiency of the proposed 2.5D finite element model in terms of the vertical displacement, environmental vibration and dynamic stress in the embankment–ground system through a comparison with other conventional methods, e.g., 2D and 3D finite element methods, in future research.

Author Contributions

Conceptualization, X.W. (Xinsheng Wei) and R.W.; methodology, X.W. (Xinsheng Wei); software, R.W.; validation, X.W. (Xinsheng Wei), R.W. and X.W (Xin Wen); formal analysis, X.W. (Xinsheng Wei); resources, R.W. and Z.H.; data curation, R.W. and Z.H.; writing—original draft preparation, X.W. (Xinsheng Wei) and R.W.; writing—review and editing, X.W. (Xinsheng Wei) and R.W.; visualization, X.W. (Xin Wen); supervision, R.W. and Z.H.; funding acquisition, Z.H. All authors have read and agreed to the published version of the manuscript.

Funding

This research was funded by the National Natural Science Foundation of China (grant number 42077248).

Data Availability Statement

The data presented in this study are available on request from the corresponding author. The data are not publicly available, as the data also form part of an ongoing study.

Conflicts of Interest

The authors declare no conflict of interest.

References

  1. Fu, Q.; Zheng, C. Three-Dimensional Dynamic Analyses of Track-Embankment-Ground System Subjected to High Speed Train Loads. Sci. World J. 2014, 2014, 924592. [Google Scholar] [CrossRef] [PubMed]
  2. Olivier, B.; David, P.C.; Pedro, A.C.; Georges, K. The Effect of Embankment on High Speed Rail Ground Vibrations. Int. J. Rail Transp. 2016, 4, 229–246. [Google Scholar] [CrossRef]
  3. Lyratzakis, A.; Tsompanakis, Y.; Psarropoulos, P.N. Efficient Mitigation of High-Speed Trains Induced Vibrations of Railway Embankments Using Expanded Polystyrene Blocks. Transp. Geotech. 2020, 22, 100312. [Google Scholar] [CrossRef]
  4. Yang, J.; Cui, Z. Influences of Train Speed on Permanent Deformation of Saturated Soft Soil under Partial Drainage Conditions. Soil Dyn. Earthq. Eng. 2020, 133, 106120. [Google Scholar] [CrossRef]
  5. Wang, C.; Zhou, S.; Wang, B.; Guo, P.; Su, H. Settlement behavior and controlling effectiveness of two types of rigid pile structure embankments in high-speed railways. Geomech. Eng. 2016, 11, 847–865. [Google Scholar] [CrossRef]
  6. Filz, G.M.; Sloan, J.A.; McGuire, M.P.; Smith, M.; Collin, J. Settlement and Vertical Load Transfer in Column-Supported Embankments. J. Geotech. Geoenviron. Eng. 2019, 145, 04019083. [Google Scholar] [CrossRef]
  7. Zhang, Z.; Rao, F.; Ye, G. Design method for calculating settlement of stiffened deep mixed column-supported embankment over soft clay. Acta Geotech. 2020, 15, 795–814. [Google Scholar] [CrossRef]
  8. Rui, R.; Han, J.; Zhang, L.; Zhai, Y.; Cheng, Z.; Chen, C. Simplified Method for Estimating Vertical Stress-Settlement Responses of Piled Embankments on Soft Soils. Comput. Geotech. 2020, 119, 103365. [Google Scholar] [CrossRef]
  9. Connolly, D.; Giannopoulos, A.; Forde, M.C. Numerical Modelling of Ground Borne Vibrations from High Speed Rail Lines on Embankments. Soil Dyn. Earthq. Eng. 2013, 46, 13–19. [Google Scholar] [CrossRef]
  10. Costa, P.A.; Colaço, A.; Calçada, R.; Cardoso, A.S. Critical speed of railway tracks. Detailed and simplified approaches. Transp. Geotech. 2015, 2, 30–46. [Google Scholar] [CrossRef]
  11. Gao, G.; Li, S. Dynamic response of CFG pile composite subgrade induced by moving train loadings. J. Vib. Shock. 2015, 34, 135–143. (In Chinese) [Google Scholar]
  12. Connolly, D.P.; Dong, K.; Costa, P.A.; Soares, P.; Woodward, P.K. High Speed Railway Ground Dynamics: A Multi-Model Analysis. Int. J. Rail Transp. 2020, 8, 324–346. [Google Scholar] [CrossRef]
  13. Li, T.; Su, Q.; Kaewunruen, S. Influences of Piles on the Ground Vibration Considering the Train-Track-Soil Dynamic Interactions. Comput. Geotech. 2020, 120, 103455. [Google Scholar] [CrossRef]
  14. Pécsi, M. Loess is not just the accumulation of dust. Quat. Int. 1990, 7, 1–21. [Google Scholar] [CrossRef]
  15. Sun, H.; Zhang, S. A field experimental study of composite foundation with rammed soil-cement pile in collapsible loess area. Adv. Mater. Res. 2014, 1030, 969–973. [Google Scholar] [CrossRef]
  16. Zou, X.; Zhao, Z.; Xu, D. Consolidation analysis of composite foundation with partially penetrated cement fly-ash gravel (CFG) piles under changing permeable boundary conditions. J. Cent. South Univ. 2015, 22, 4019–4026. [Google Scholar] [CrossRef]
  17. Yang, Y.; Hung, H. A 2.5D finite/infinite element approach for modelling visco-elastic bodies subjected to moving loads. Int. J. Numer. Methods Eng. 2001, 51, 1317–1336. [Google Scholar] [CrossRef]
  18. Takemiya, H. Simulation of Track–Ground Vibrations Due to a High-Speed Train: The Case of X-2000 at Ledsgard. J. Sound Vib. 2003, 261, 503–526. [Google Scholar] [CrossRef]
  19. Bian, X.; Chao, C.; Jin, W.; Chen, Y. A 2.5d Finite Element Approach for Predicting Ground Vibrations Generated by Vertical Track Irregularities. J. Zhejiang Univ.-SCIENCE A 2011, 12, 885–894. [Google Scholar] [CrossRef]
  20. Gao, G.; Chen, Q.; He, J.; Liu, F. Investigation of Ground Vibration Due to Trains Moving on Saturated Multi-Layered Ground by 2.5D Finite Element Method. Soil Dyn. Earthq. Eng. 2012, 40, 87–98. [Google Scholar] [CrossRef]
  21. Gao, G.; Yao, S.; Yang, J.; Chen, J. Investigating Ground Vibration Induced by Moving Train Loads on Unsaturated Ground Using 2.5D Fem. Soil Dyn. Earthq. Eng. 2019, 124, 72–85. [Google Scholar] [CrossRef]
  22. Wang, R.; Hu, Z.; Zhang, Y.; Zhang, X.; Chai, S. Stress field in viscoelastic medium with propagation of plane and cylindrical waves and the discussion of its application. Rock Soil Mech. 2018, 39, 4665–4672. (In Chinese) [Google Scholar]
  23. Wang, R.; Hu, Z.; Ma, J.; Ren, X.; Li, F.; Zhang, F. Dynamic Response and Long-Term Settlement of a Compacted Loess Embankment under Moving Train Loading. Ksce J. Civ. Eng. 2021, 25, 4075–4087. [Google Scholar] [CrossRef]
  24. Jing, G.; Ding, D.; Liu, X. High-Speed Railway Ballast Flight Mechanism Analysis and Risk Management—A Literature Review. Constr. Build. Mater. 2019, 223, 629–642. [Google Scholar] [CrossRef]
  25. Wang, R.; Wang, L.; Hu, Z.; Zhao, Z.; Li, X.; Wang, Q. Study on the dynamic characteristics of compacted loess subjected to static deviatoric stress generated by traffic loading. J. China Railw. Soc. 2019, 41, 110–117. (In Chinese) [Google Scholar]
  26. Zhang, J.; Gao, G.; Bi, J. Analysis of vibration mitigation for CFG pile-supported subgrade of high-speed railway. Soil Dyn. Earthq. Eng. 2023, 164, 107612. [Google Scholar] [CrossRef]
  27. Eason, G. The stresses produced in a semi-infinite solid by a moving surface force. Int. J. Eng. Sci. 1965, 2, 581–609. [Google Scholar] [CrossRef]
  28. Bian, X.; Hu, J.; Thompson, D.; Powrie, W. Pore Pressure Generation in a Poro-Elastic Soil under Moving Train Loads. Soil Dyn. Earthq. Eng. 2019, 125, 105711. [Google Scholar] [CrossRef]
  29. Costa, P.A.; Soares, P.; Colaco, A.; Lopes, P.; Connolly, D. Railway Critical Speed Assessment: A Simple Experimental-Analytical Approach. Soil Dyn. Earthq. Eng. 2020, 134, 106156. [Google Scholar] [CrossRef]
  30. Ntotsios, E.; Thompson, D.J.; Hussein, M.F.M. A Comparison of Ground Vibration Due to Ballasted and Slab Tracks. Transp. Geotech. 2019, 21, 100256. [Google Scholar] [CrossRef]
  31. TB 10001-2016; Code for Design of Railway Earth Structure. State Railway Administration: Beijing, China, 2016.
  32. Q/CR 9127-2015; Interim Code for Limit State Design of Railway Earth Structure. China Railway: Beijing, China, 2015.
Figure 1. Schematic illustration of the application of the 2.5D finite element method in dynamic responses of an embankment–ground system (Adapted with permission from ref. [23]. Copyright 2021 Springer Nature.).
Buildings 13 00860 g001
Figure 2. Verification of the proposed 2.5D finite element model (Adapted with permission from ref. [23]. Copyright 2021 Springer Nature.).
Buildings 13 00860 g002
Figure 3. Outline and meshing of model cross-sections: (a) DCG model; (b) SCG and CFGG models (Adapted with permission from ref. [23]. Copyright 2021 Springer Nature.).
Buildings 13 00860 g003
Figure 4. Relative axle position of the CRH3 train (units: m) (Adapted with permission from ref. [23]. Copyright 2021 Springer Nature.).
Buildings 13 00860 g004
Figure 5. Vertical displacement curves of the track based on different train speeds: (a) DCG model; (b) SCG model; (c) CFGG model.
Buildings 13 00860 g005
Figure 6. Contour plots of the surface based on different train speeds: (a) DCG model; (b) SCG model; (c) CFGG model.
Buildings 13 00860 g006aBuildings 13 00860 g006b
Figure 7. Local contour plot of the surface based on different train speeds of the CFGG model.
Buildings 13 00860 g007
Figure 8. Variations in the vertical displacement amplitude of the track versus train speed.
Buildings 13 00860 g008
Figure 9. Contour plot of the dispersion relationship of the track system and the ground in the frequency–speed domain: (a) DCG model; (b) SCG model; (c) CFGG model.
Buildings 13 00860 g009
Figure 10. Contour plot of the surface around the lower boundary limit speed: (a) DCG model; (b) SCG model; (c) CFGG model.
Buildings 13 00860 g010
Figure 11. (a) Distribution and (b) attenuation of the VAL on the surface under different train speeds of the DCG model.
Buildings 13 00860 g011
Figure 12. Variations in the VAL of the track versus train speed with different ground reinforcement measures.
Buildings 13 00860 g012
Figure 13. The attenuation of the VAL on the surface based on different train speeds: (a) SCG model; (b) CFGG model.
Buildings 13 00860 g013
Figure 14. Relationship between the dynamic stress amplitude and 0.1 self-weight line along with the depth: (a) DCG model; (b) SCG model; (c) CFGG model.
Buildings 13 00860 g014
Figure 15. Vertical dynamic stress amplitude at 4 m depth versus train speed with different ground reinforcement measures.
Buildings 13 00860 g015
Figure 16. Influence depth versus train speed with different ground reinforcement measures.
Buildings 13 00860 g016
Table 1. Parameters of the soil layer (Takemiya [18] and Gao et al. [21]).
Soil Layer or
Structure
Thickness
(m)
Density
(kg·m−3)
Shear Wave Velocity (m/s)Poisson’s
Ratio
Crust1.01500720.39
Organic clay3.01260410.35
Clay layer 14.51475650.41
Clay layer 215.01475870.33
Table 2. Train axle load distribution of X2000 (Takemiya [18] and Gao et al. [21]).
Carriage No.Pn1 (kN)Pn2 (kN)an (m)bn (m)ln (m)
1160.5117.52.911.60.0
2122.5122.52.914.824.2
3122.5122.52.914.824.4
4122.5122.52.914.824.4
5180.0181.52.96.624.4
Table 3. Parameters of the soil layer.
Soil Layer or StructureApplicable
Model
Thickness
(m)
Length
(m)
Density
(kg·m−3)
Modulus
(MPa)
Damping
Ratio
Poisson’s
Ratio
Surface layer of subgrade bedALL0.7-190086.50.040.25
Bottom layer of subgrade bedALL2.3-190096.00.040.25
Embankment below subgrade bedALL--180050.00.040.25
Treated soilDCG3.0-180050.00.040.3
CushionSCG 0.8-200020000.3
CFGG
Soil–cement compacted pileSCG-15200010000.23
Soil among pileSCG15-200050.00.040.25
CFG pileCFGG-15250025,50000.17
Soil layer 1ALL7.0-198026.30.050.32
Soil layer 2ALL6.0-188017.90.050.33
Soil layer 3ALL24.0-199041.10.050.32
Disclaimer/Publisher’s Note: The statements, opinions and data contained in all publications are solely those of the individual author(s) and contributor(s) and not of MDPI and/or the editor(s). MDPI and/or the editor(s) disclaim responsibility for any injury to people or property resulting from any ideas, methods, instructions or products referred to in the content.

