1. Introduction
Cities and their inhabitants consume more than 75% of global energy production and contribute 80% of glasshouse gas emissions [
1]. According to the United Nations Department of Economic and Social Affairs (UN DESA), the global population has increased from 751 million in 1950 to 4.2 billion in 2018, with a projected increase to 7 billion by 2050 [
2]. With rising population and energy consumption, it is critical to accelerate the energy transition and urban sustainable development.
There are numerous options to improving urban sustainability, including active approaches, such as introducing renewable energy alternatives, and passive approaches, such as demand shift, demand reduction, etc. Among these options, distributed renewable energy (DRE) such as solar photovoltaic (PV) is garnering increasing interest in both research and the market. DRE can (1) reduce carbon emissions, (2) increase energy fairness, supply security, and independence, and (3) minimise dependency on large-scale energy infrastructure investment [
3].
However, there are many challenges faced by DRE in urban areas such as limited physical space for installation, compliance with building safety requirements, reduced access to natural resources due to urban density (i.e., reduced solar exposure caused by shading and instable air flow in high-density built areas), the low conversion rate of the DRE system, unstable output of the DRE, impacts to the public electricity grid, etc. Therefore, a formidable energy management system is essential amid the growth of DRE in the urban environment.
As a novel energy management concept, virtual power plants (VPPs) are gaining increasing research interest. A VPP is a network of distributed generators (DG) and energy storage systems (ESS), in which these integrated elements are able to participate in the energy market as a single entity and own the function similar to a conventional power plant (CPP) by, for example, participating in the electricity wholesale market, providing electricity network services such as ancillary frequency control and load control, or serve as a backup generator in the circumstance of outage.
In contrast to a CPP, a VPP operates differently in several aspects:
- (1)
A VPP relies heavily on communication and control systems to adjust its dispatch strategies [
4,
5];
- (2)
The primary sources of electricity generation in a VPP are distributed energy resources (DERs) located at various locations [
6,
7,
8];
- (3)
The participants in a VPP are often referred to as prosumers, as they not only consume electricity but also produce and contribute to the grid [
9,
10];
- (4)
VPPs’ functionality in the public grid largely relies on energy storage systems which transform the intermittent power flow of the DERs into stabilised and scheduled outputs [
11,
12,
13].
With the rapid growth of distributed renewable energy systems in the urban environment, it is important to assess the challenges and opportunities of adopting VPPs for effective regulation and management of the DGs. There are several review papers in this field examining the different factors of VPP studies. In 2012, a review paper [
14] provided a general overview of VPPs, including their logical framework, control strategies, and optimization. The authors of this paper investigated numerous studies and European VPPs and identified the need for better prediction tools and optimization methods for real-world VPP projects.
A more recent review paper, [
15], provided a detailed review of uncertainties involved in the VPP studies. This review identified and discussed three categories of uncertainty: renewable energy generation, market prices, and electricity demand. The authors pointed out that future studies should pay more attention to the structural uncertainties caused by the connection status of DERs. Another review paper [
16] summarised the architecture and optimization techniques of VPPs and provided a summary of the best optimization techniques based on operational strategies. Additionally, ref. [
17] assessed the risk management strategies adopted in VPP studies and concluded that current VPP studies still have a limited scope regarding risks, which are mostly related to renewable generation and market dynamics.
These review papers highlighted the need for improved prediction tools that are capable of capturing the increasing uncertainties in a broader operating environment of VPPs, optimization methods that are robust under greater complexities of the VPPs’ operating strategies, and risk management approaches that provide thorough consideration in a comprehensive spectrum of VPPs’ operation goals. Additionally, they suggest the importance of considering uncertainties and the flexibility of VPPs in energy markets. However, most of the previous papers investigated technical benefits and risks from the standpoint of the VPP system itself.
As pointed out in [
17], future VPP studies should consider factors beyond technologies or algorithms. VPPs are sophisticated systems that interact with DERs, electricity infrastructure, urban environment, communities, and the end-users. Therefore, the impacts of VPPs require further investigation from the community level with the consideration of the VPPs’ costs and benefits, carbon emission reduction capability, and the impacts to the local supply network. VPPs may have the potential to support the constantly growing penetration of DRE systems in cities and reshape the energy landscape of communities by providing cleaner and cheaper energy. However, changes in urban environments can also have significant impacts on VPPs in many ways. Population density, urban planning, and community socioeconomic status play important roles in urban infrastructure [
18,
19] and may also affect the development and operation of VPPs. Consequently, suitable problem-solving approaches and effective research framework are required to cope with the uncertainties and complexities of deploying VPPs in diverse communities.
Therefore, this study aims to evaluate the challenges and opportunities of community-focused renewable energy transition through the establishment of VPPs with community-based renewable generators and storage systems. A case study was performed for community-based VPPs with a sample size of 235 communities. A detailed modelling and information capturing was carried out using geospatial analyses and K-Means Clustering, to capture and describe the renewable energy resources and supply and demand profiles. Reinforcement learning was selected as the optimisation and control solution to tackle the uncertainties and complexities of the case study communities’ diverse demand and supply conditions. This paper is structured as follows: The rest of
Section 1 presents a literature review on the present studies of VPPs in terms of VPP operation strategies, modelling, and problem-solving techniques.
Section 2 covers the research design and the process of implementing the VPP framework in the case study. The detailed research methods and processes are presented in
Section 3, followed by the findings and discussion in
Section 4. Finally,
Section 5 discusses the conclusion of this study along with research limitations and recommendations for future work.
1.1. Literature Review
1.1.1. VPPs’ Risks and Benefits for Prosumers and Communities
VPP development and operation is a multi-party process involving service providers, consumers, prosumers, legislators, and local communities. However, the majority of the previously stated profit-enhancing or risk-reduction measures are primarily applicable to VPP systems or VPP operators [
20]. Although it is critical to ensure that VPPs perform optimally when participating in the electricity market, the success of VPPs is largely dependent on the participation and interaction of all stakeholders, as an electricity supply system that may involve substantial investment and significant impacts on urban development [
21].
The previous studies in this domain mostly focus on investigating the economic potential of VPPs by optimising their operation strategies in the energy market. For example, [
22,
23] provided the optimisation of a VPP’s profitability of participating in the energy market through frequency control ancillary services and energy trading. The authors of [
24,
25,
26] investigated the optimisation of the VPP system’s operation cost and penalty due to system instability, while [
27,
28] evaluated the VPP’s cost and benefits through reducing greenhouse gas emission.
Although the previous research has developed a comprehensive understanding of the benefits of VPPs as an entity, there is a lack of consideration for the benefits and risks for end-users and communities where the VPPs are based. The participation of prosumers and the communities is one of the essential criteria in the implementation of VPPs [
29], for its reliance on the cooperation and aggregation of distributed prosumers. However, in most previous research, the end-users in the VPP framework are considered as flexible loads [
13,
30] or simply as the source of revenue for the VPP entities.
Distributed renewable energy systems face challenges in achieving commercial viability due to their low capacity and unstable output, as summarised in [
31]. Without a well-performing control and optimisation strategy, these distributed resources can also have negative impacts on the public grid, which may require extra costs for balancing supply and demand [
32,
33,
34]. Furthermore, DRE systems heavily rely on energy storage systems [
3], which can significantly increase costs [
32]. These economic uncertainties can pose potential economic risks to the communities and end-users greatly, and hinder the renewable transition.
VPPs can play a crucial role in reducing the economic risks of renewable energy through effective management of DRE systems [
17]. By integrating DRE systems into the public grid, VPPs can also contribute to reducing overall electricity prices in the market, making renewable energy more affordable for all. In particular, communities with limited purchasing power may benefit from access to cheaper and cleaner energy by participating in VPP networks. Hence, it is essential to gain a deeper understanding of the potential role that VPPs can play in powering communities with distributed renewable resources.
1.1.2. Modelling and Problem-Solving Techniques in VPP Studies
As an energy system interacting with various demand patterns, generation patterns and energy market conditions, the modelling of VPP involves numerous uncertainties such as weather forecasting, demand forecasting, market price forecasting, etc. [
15]. The two commonly adopted modelling methods are deterministic modelling, which create sophisticated calculation models for renewable energy systems, the VPP control system, user demand, and energy market [
24,
35], and stochastic modelling, which represents the VPP components with probability models [
22,
36,
37]. In addition, some studies also use actual data records of generators’ output or user demand instead of modelling them [
30].
In terms of problem-solving methods such as optimisation and control strategies, the commonly used approaches can be categorised as heuristic approaches and mathematical approaches. Mathematical approaches, such as linear or nonlinear programming, usually adopt regression methods to seek the global or local optimality within the VPP’s operation constraints [
38,
39]. Although these mathematical optimisation approaches are well-developed methodologies, their application to VPP is under critique due to their vulnerability when dealing with uncertainties and their insensitivity to the global optimality [
13,
15].
Heuristic approaches, such as particle swam optimization, agent-based optimisation, machine-learning-based heuristic control, and optimisation, have more flexibility when dealing with uncertainties and can identify the global optimal more easily [
40]. However, as pointed out in [
13], these methods may be ineffective for achieving local optimal. This is due to the fact that, given a small population size, the optimisation algorithm typically treats significant contingency events, such as demand spikes and market price spikes, as outliers, despite the fact that these contingencies may be essential for enhancing the energy conservation and economic performance of the VPP.
In addition, with increasing renewable energy options, technique innovation, and a complex operation environment, it was found in [
13] that the modelling process for the VPP system is increasing in complexity. Hence, a more robust and effective problem-solving and modelling approach should be introduced to provide optimised decision-making for VPP implementation. As a branch of machine learning, reinforcement learning (RL) is a potent tool for assisting decision making in dynamic situations. RL approaches can provide robust optimisation for different scenarios [
41,
42] in the application of energy network control and optimisation.
1.1.3. Summary of Literature Review
To sum up the findings of the literature review, it is found that although previous studies in the domain of VPP made significant contributions in investigating the optimisation of VPP operations with various mathematical or heuristic approaches, most of these studies have a limited focus on the VPP’s benefits and profitability for the VPP system itself or the operator of the VPP. The risks and benefits for end-users and local communities are rarely discussed. Additionally, current problem-solving techniques for VPP research have met their limitations in dealing with the growing uncertainties and complexities of implementing VPP in urban environments. To address these research gaps and limitations through this research, we conducted a case study in an Australian city with a novel RL-based VPP framework. The case study evaluated VPP’s performance in carbon emission reduction, profitability, and benefits for end-users.
1.2. Research Contributions
VPPs operate in complex and uncertain environments, where temporal and spatial dynamics such as supply/demand conditions, demographic profiles, renewable energy resources, urban growth, population growth, and corresponding demand growth can significantly impact their performance. The implementation of VPPs also faces broader challenges and uncertainties, such as long-term economic viability and socioeconomic values, which require in-depth analyses of VPP operations in urban environments. Therefore, a comprehensive understanding of the operational complexities and potential impacts of VPPs is crucial to ensure their effectiveness and sustainability in the long run. Hence, this study aims to further explore the challenges and opportunities of using VPPs in an Australian city’s context. The main research objectives of this study are:
- (1)
To implement a conceptual VPP framework in an Australian city;
- (2)
To model the VPP’s performance for urban communities across an Australian city;
- (3)
To optimise VPP performance for urban communities across an Australian city;
- (4)
To evaluate the technoeconomic impacts of VPP and provide discussion and suggestions for future development and policy making
The significance of this study can be summarised into the following two aspects: (1) This study focuses on the research gaps on community-oriented VPP operation and addresses technoeconomic opportunities and challenges for communities and end-users. (2) This study proposes a research framework in the context of community environment and utilises a multi-disciplinary approach to address the uncertainties and complexities.
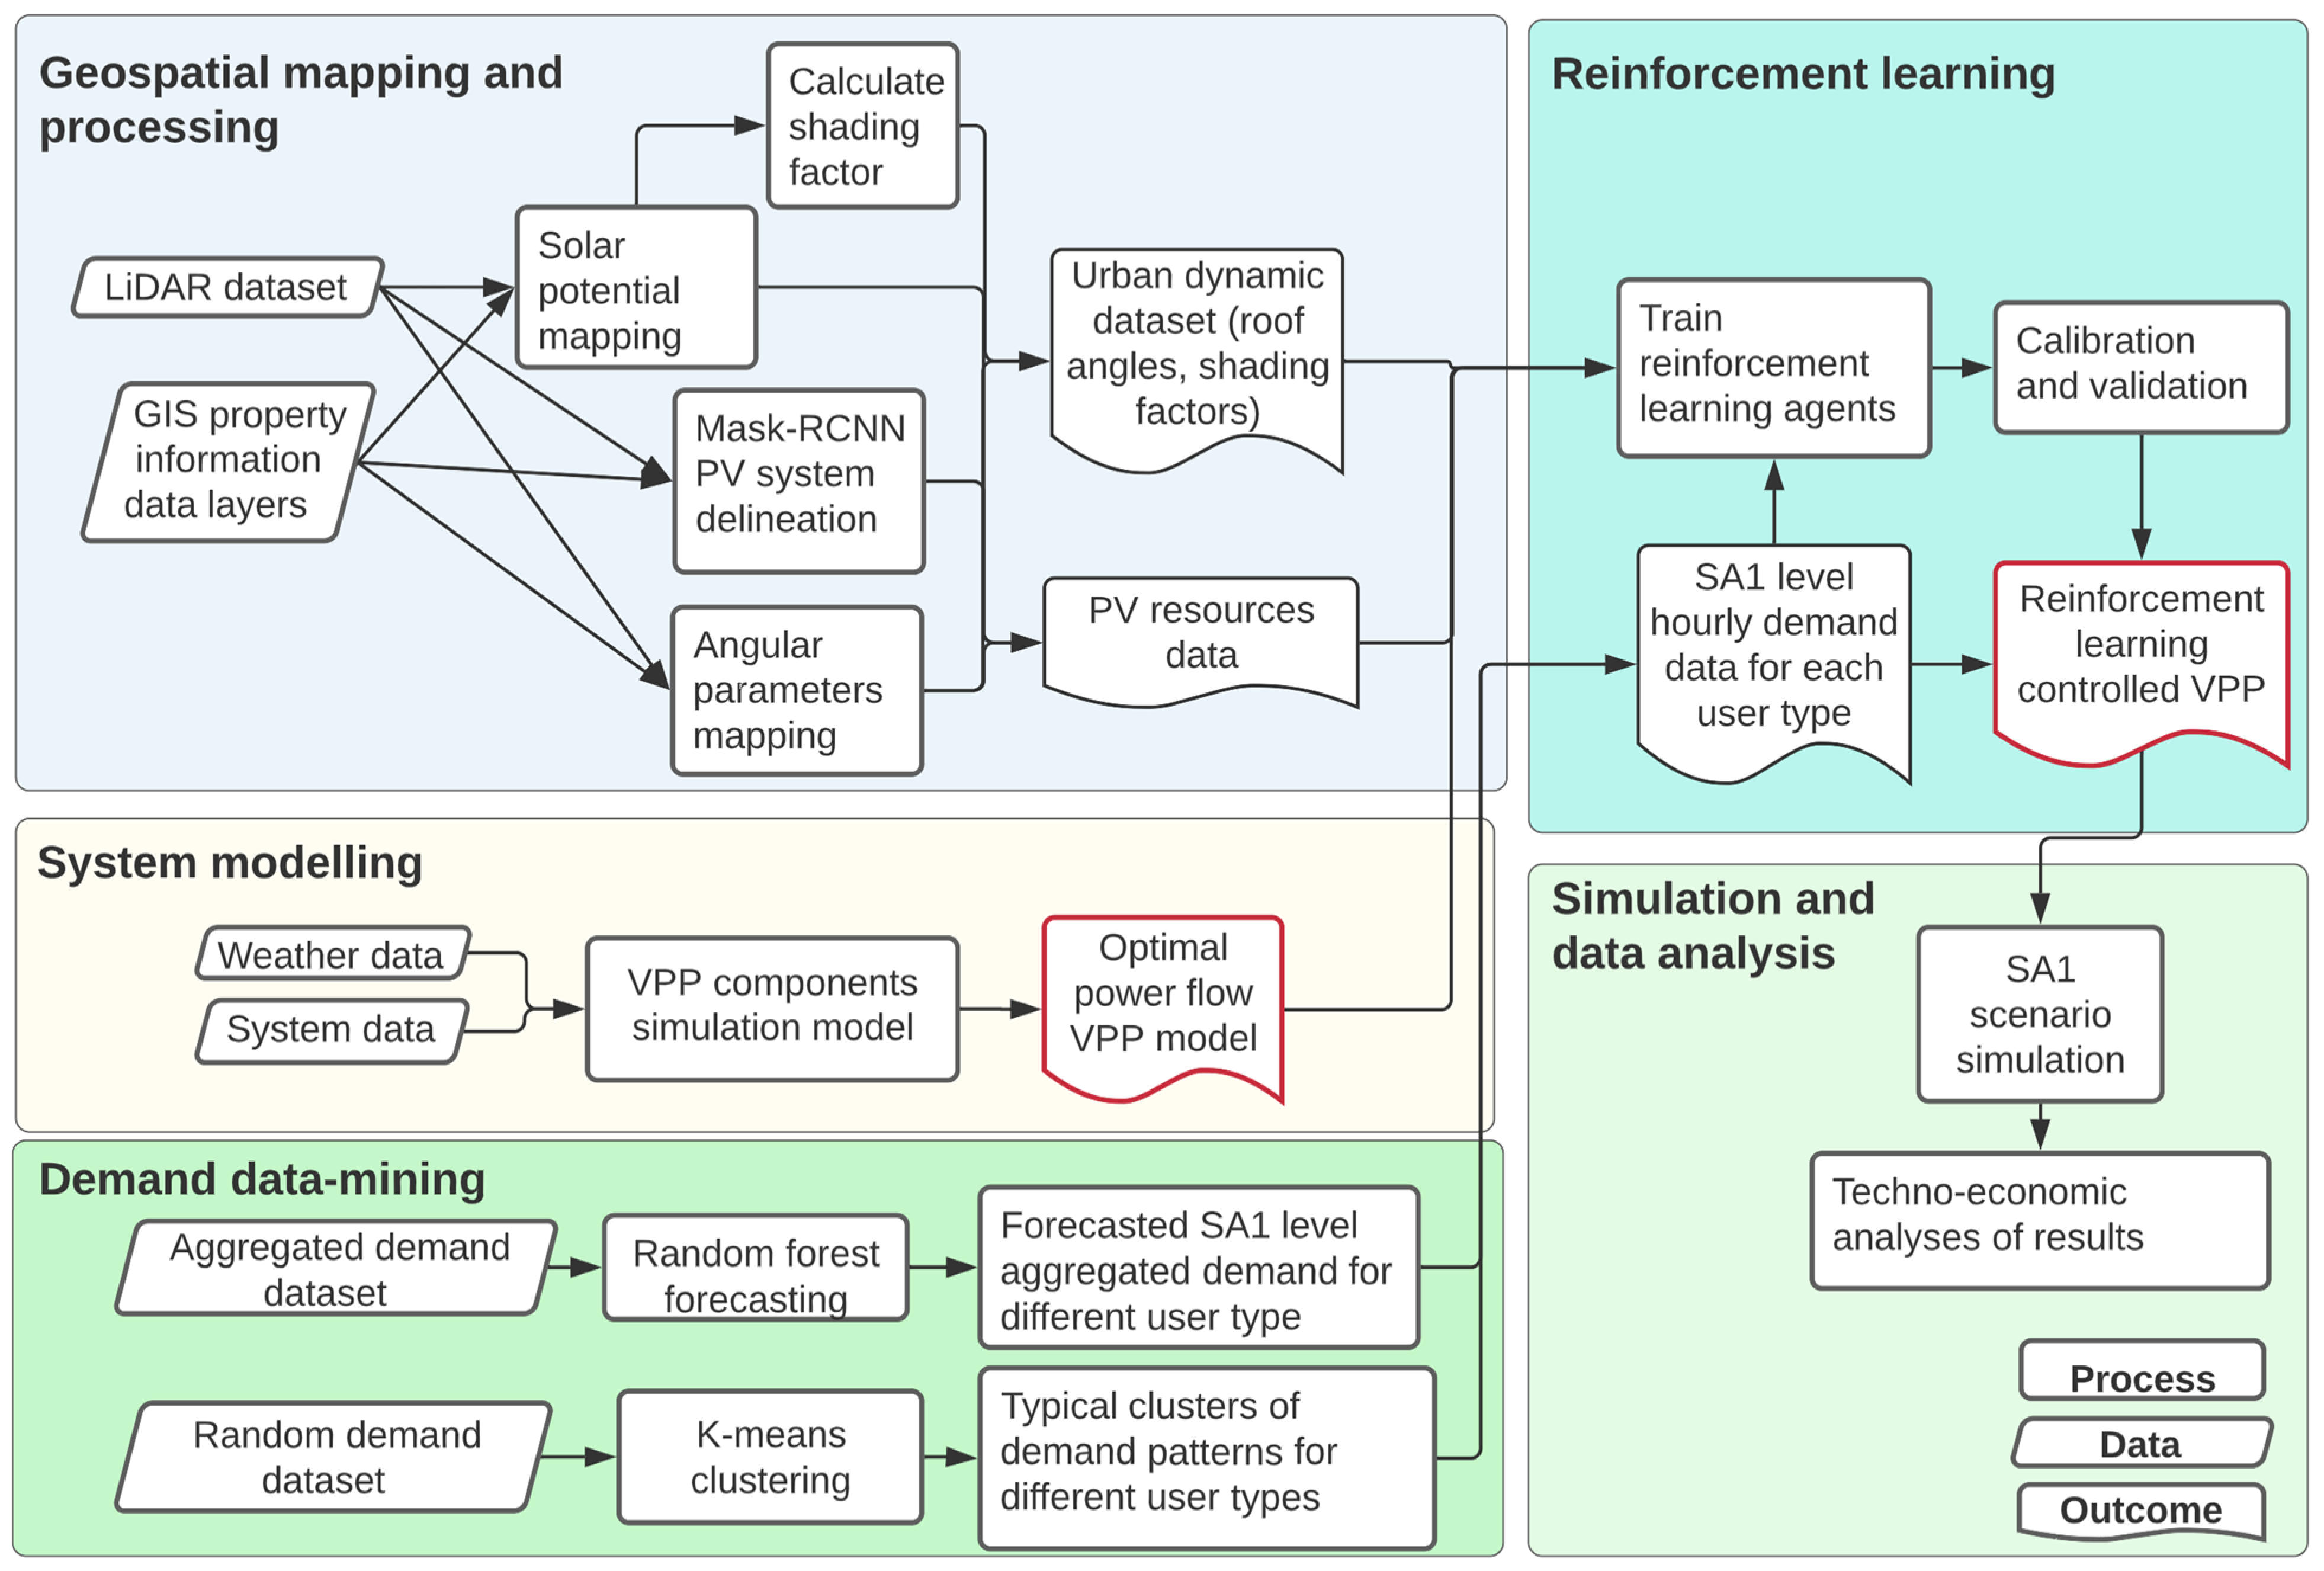
3. Data Processing, Modelling, Optimisation, and Simulation for Community-Based VPPs
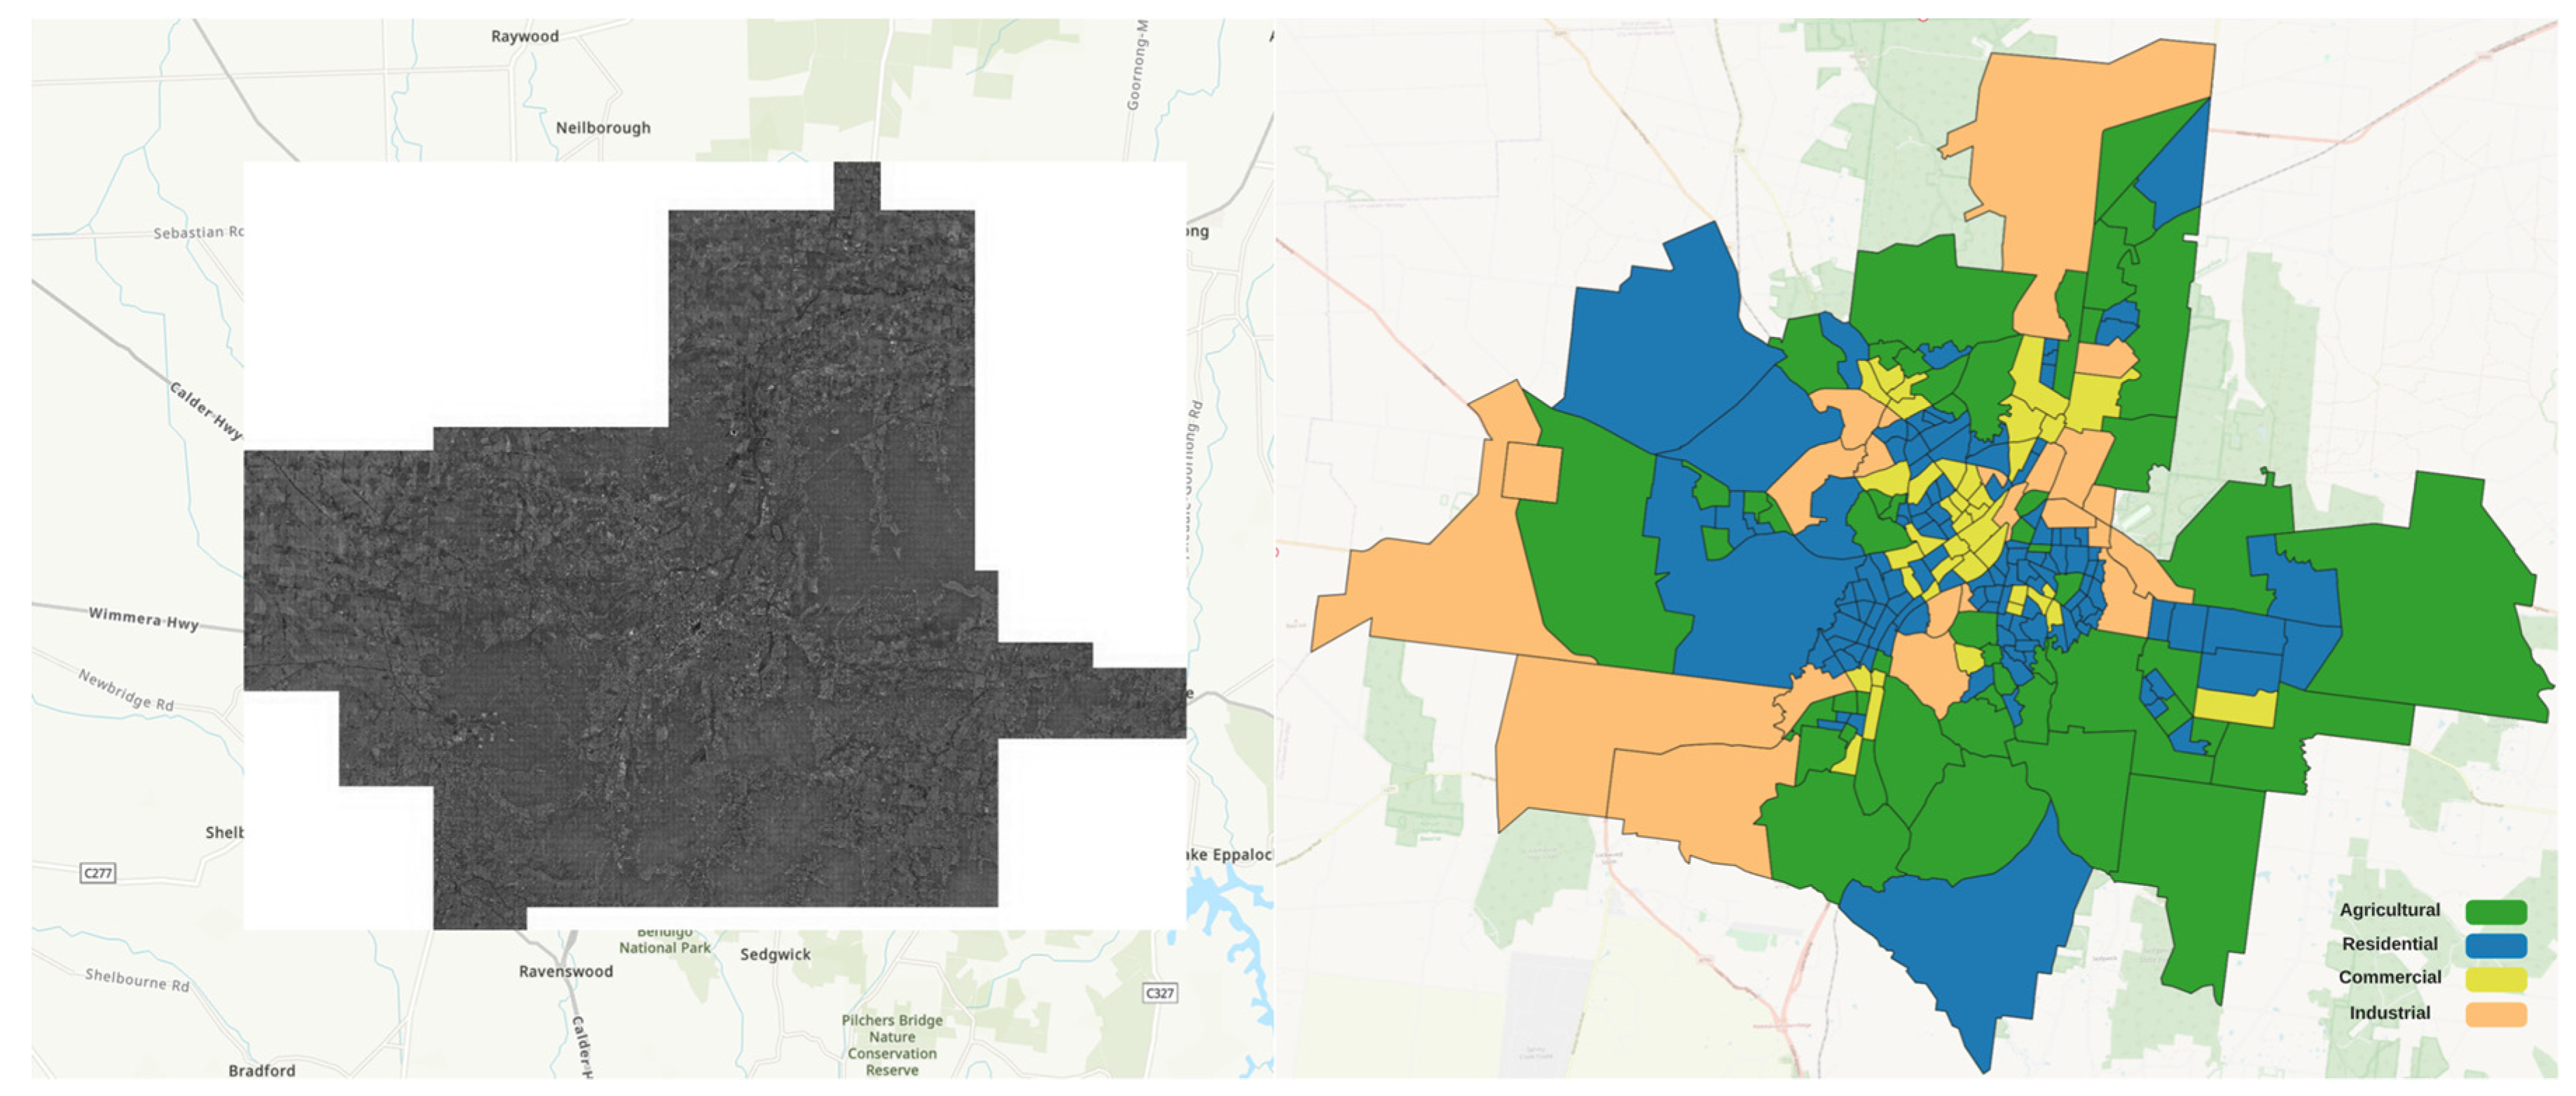
3.1. Geospatial Mapping and Processing
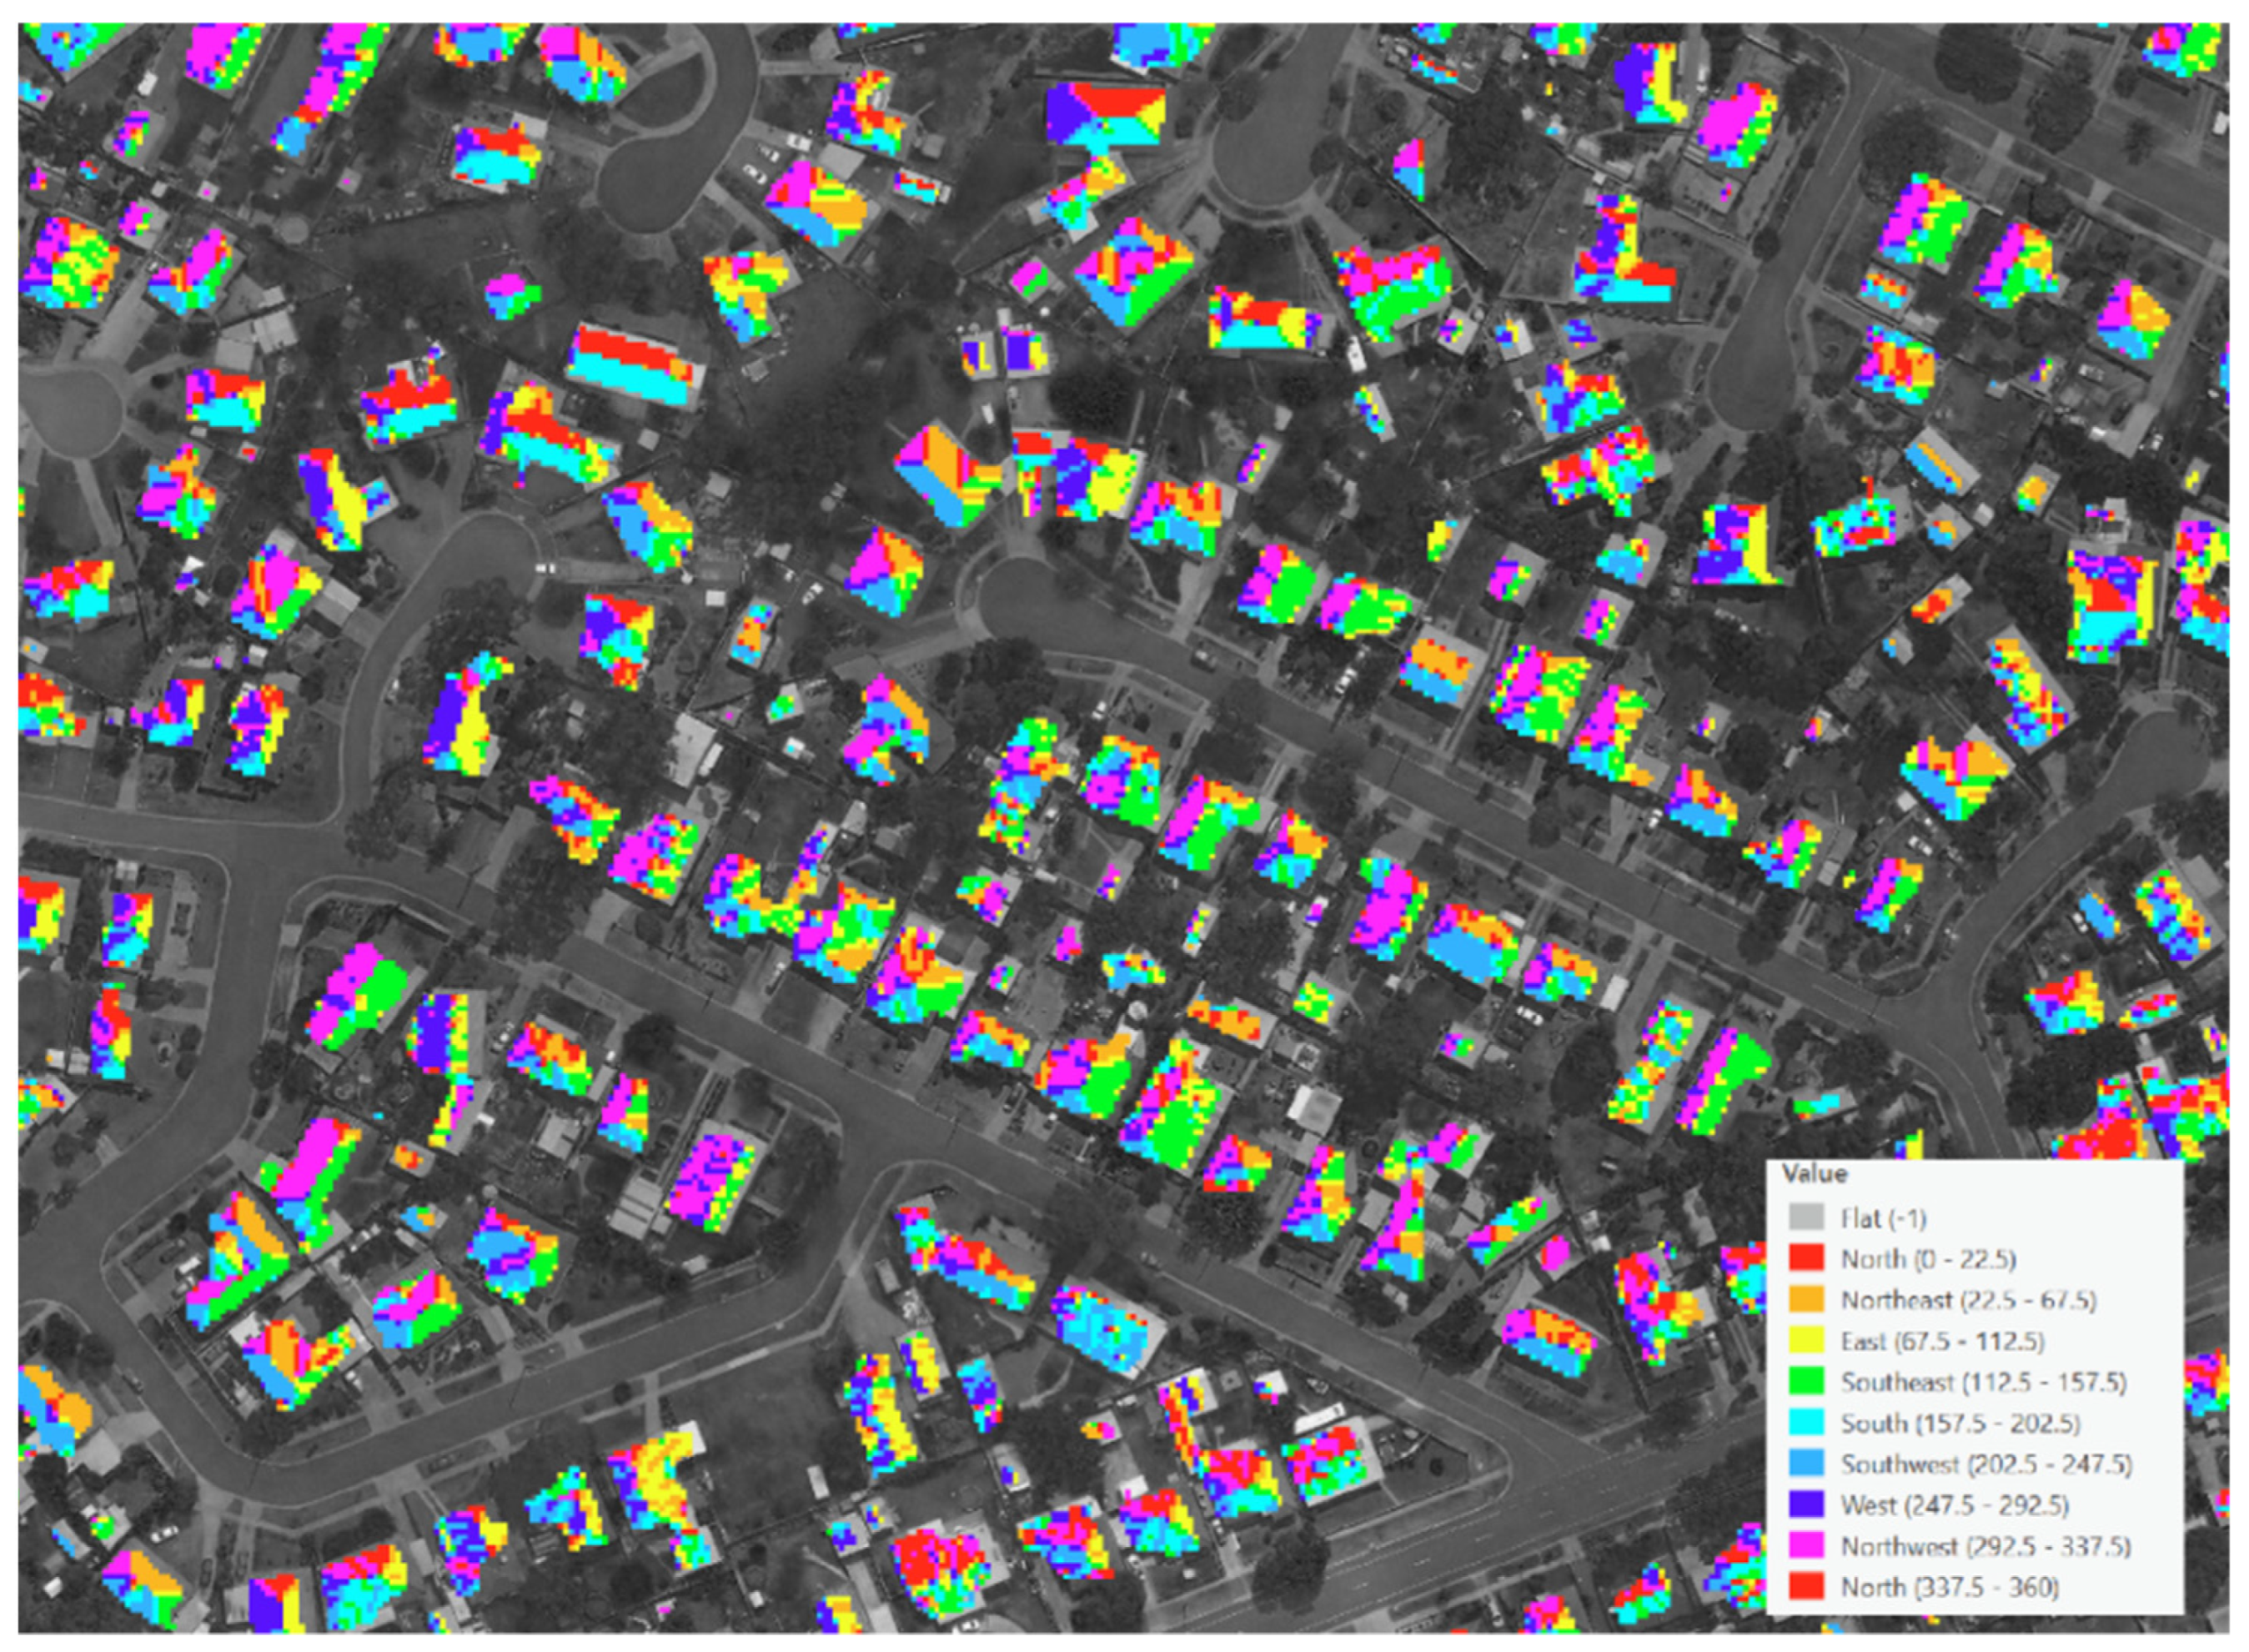
GIS is a powerful tool which facilitates a better understanding of urban environment dynamics and local resource distribution. In this part of the study, GIS data on the City of Greater Bendigo were collected, and GIS platforms (QGIS and ArcGIS) and processing tools were adopted to analyse the geographic data and map the urban environment and PV resources. In this study, the GIS data were collected from the Department of Environment, Land, Water and Planning (DELWP) of the Victoria State Government. The dataset includes the LiDAR data of digital surface model (DSM), high resolution aerial image, building height model (BHM), and property footprint. The DSM data were used to create the case study city’s roof angular profile including azimuth (
Figure 3) and tilt angle (
Figure 4).
BHM was used as an input raster to determine the azimuth angles of building rooftops. The aspect function in the QGIS toolkit was used to generate the azimuth angle raster layers. A rooftop’s azimuth angle (aspect) is its angle of departure from north (0°). It has a range of 0 to 360 degrees, with 0 representing north and 180 degrees indicating south. The aspect function in QGIS returns the azimuth distribution of the input BHM (
Figure 3). The azimuth raster was coloured to illustrate different angular values. Each rooftop’s azimuth angle was then exported as an attribute table, which was subsequently utilised to simulate rooftop PV.
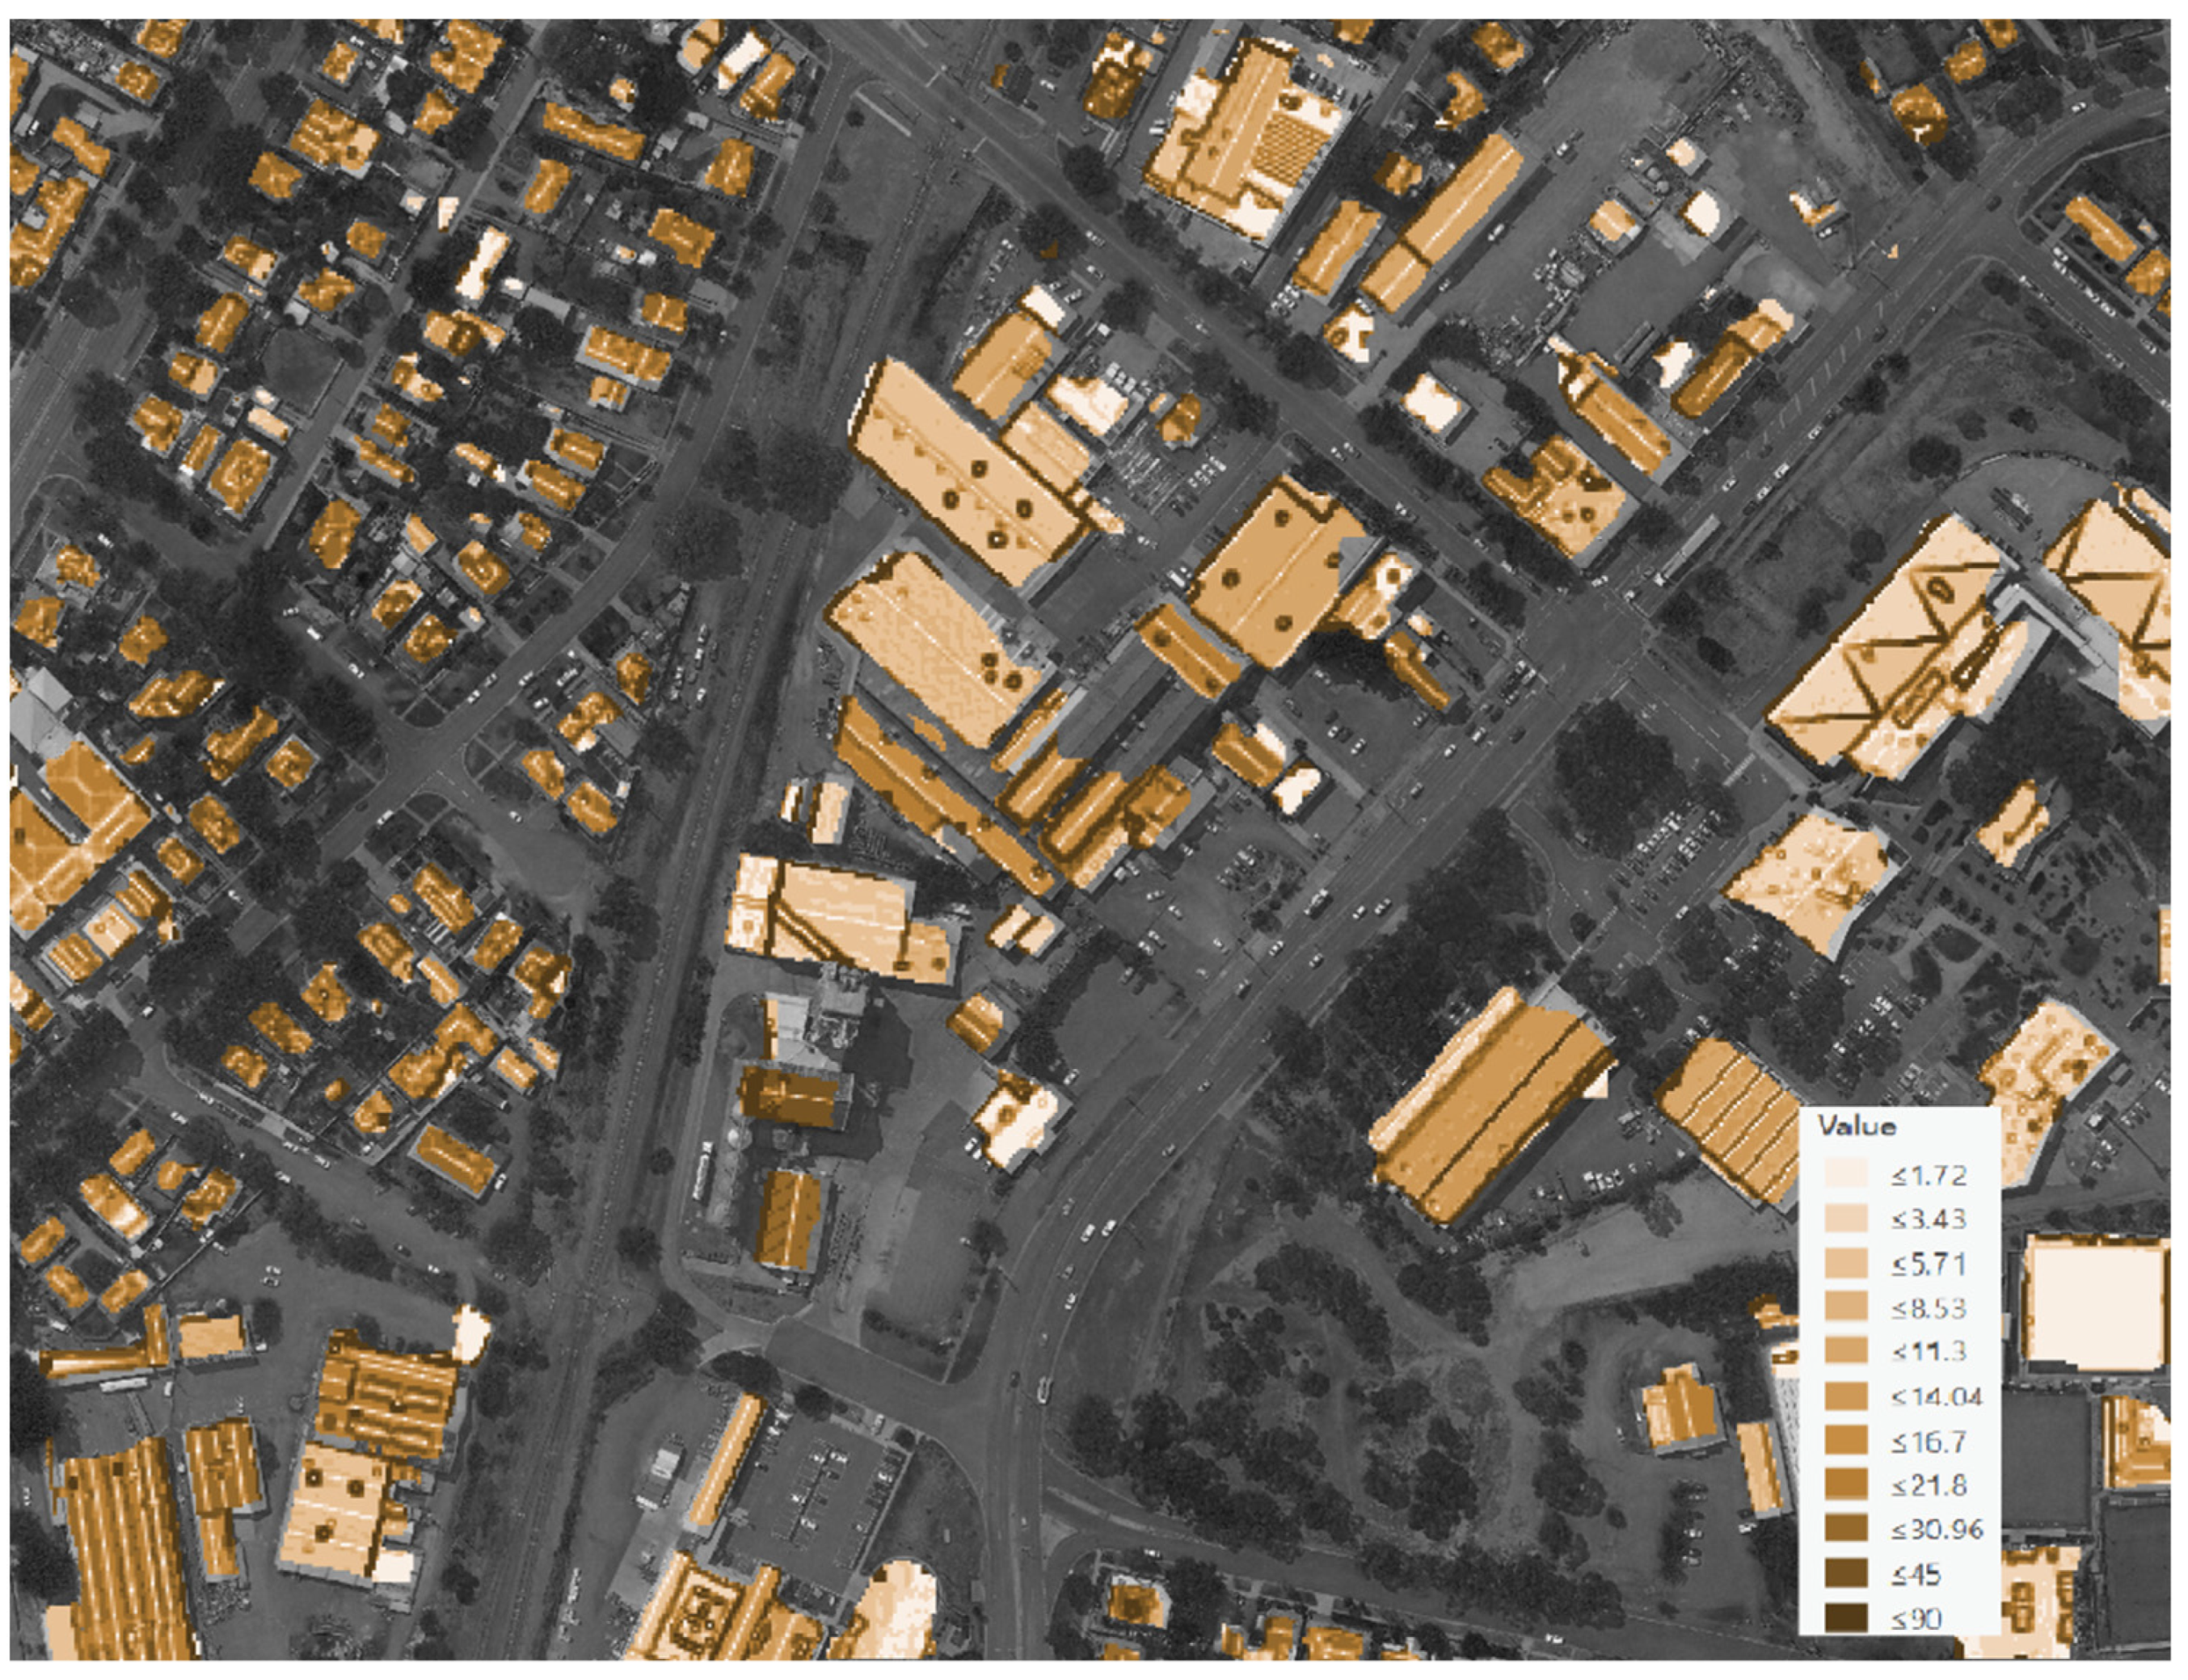
The tilt angle, like the azimuth angle, is an important angular parameter for simulating PV output. The Slope function in QGIS takes the BHM as input and generates the rooftop tilt angle layer. The tilt angle layer, like the azimuth angle layer, was coloured to show the angle values (
Figure 4).
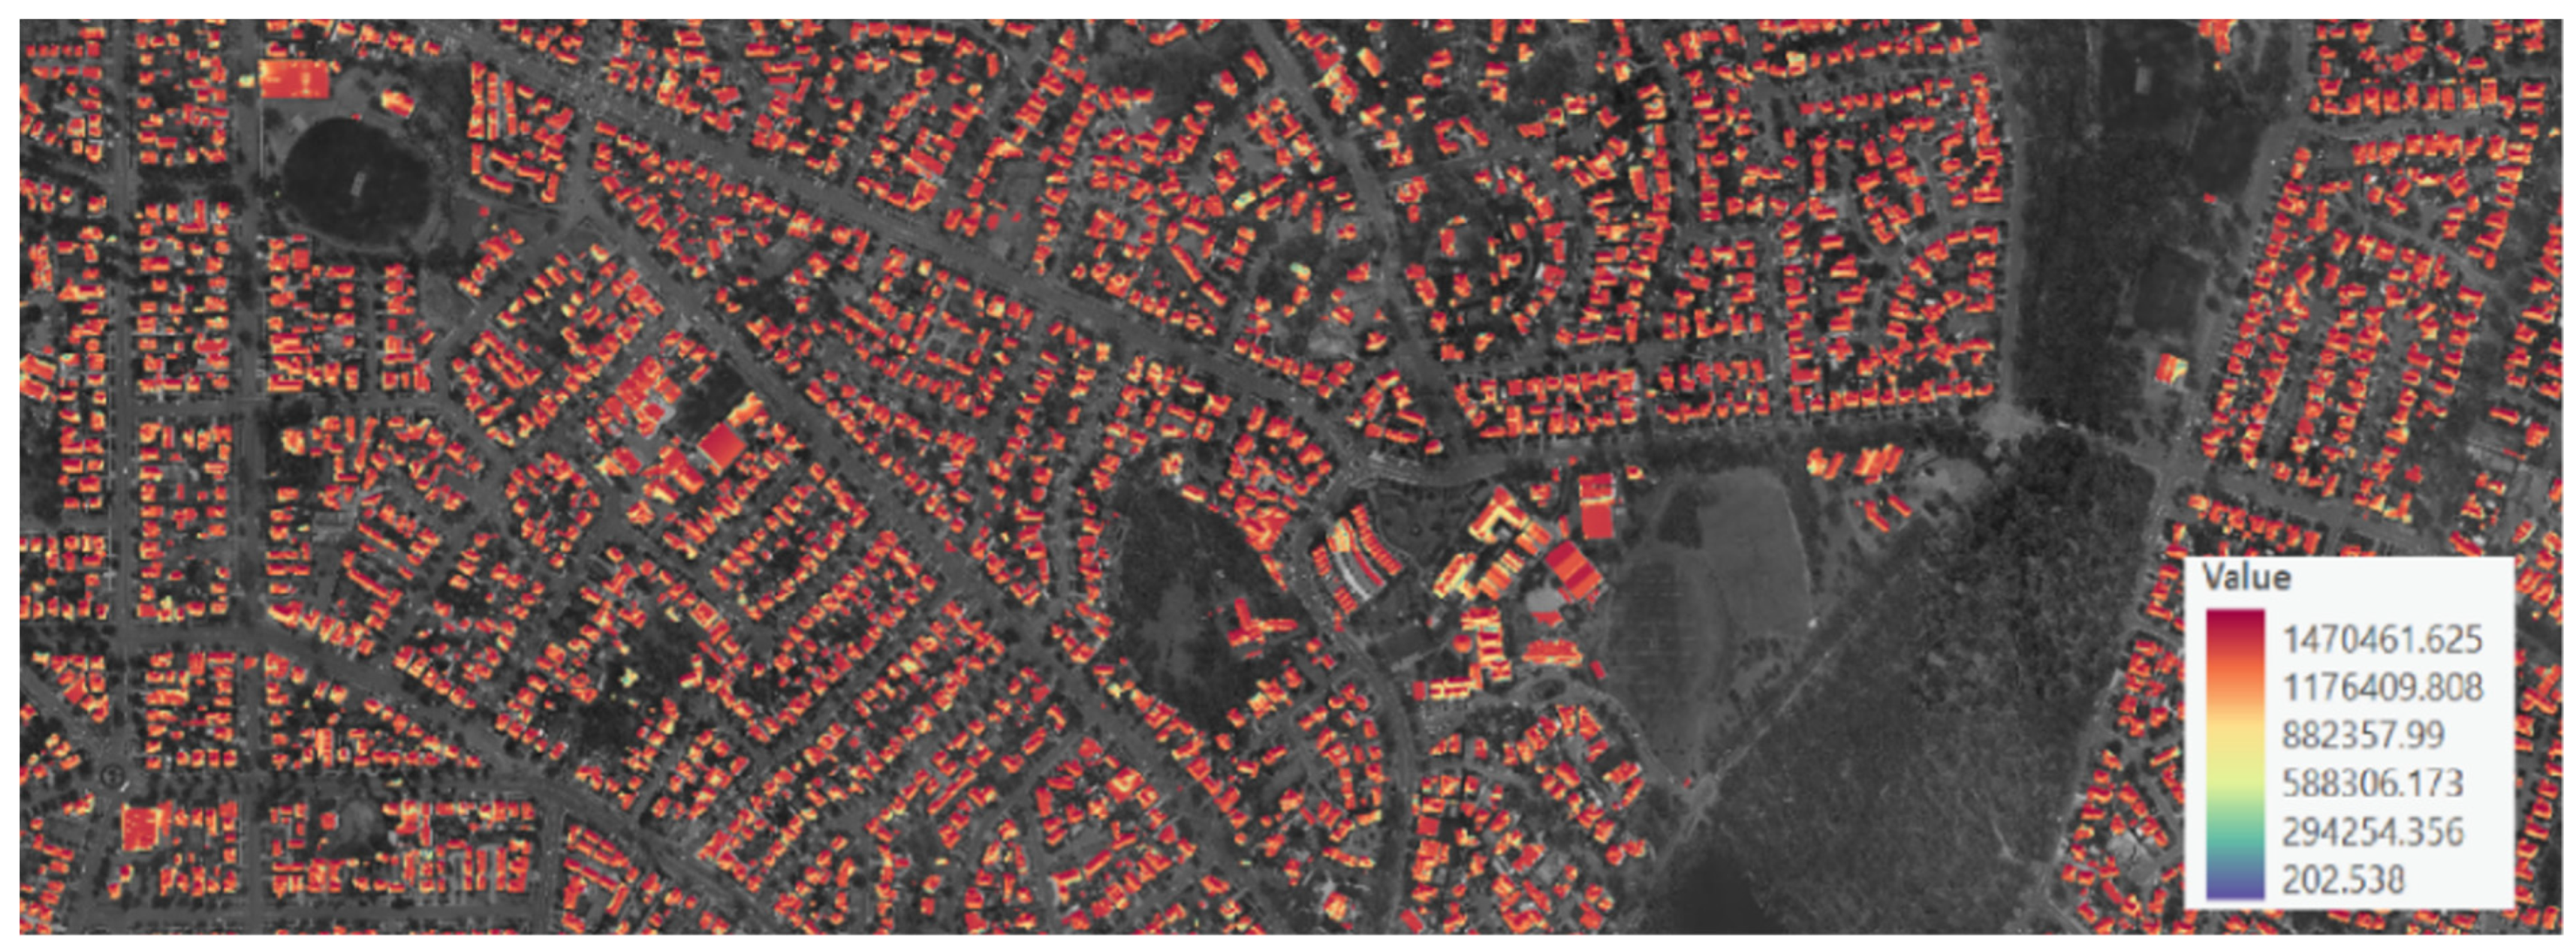
Furthermore, GIS-based approaches were used to identify both existing and potential solar PV resources in the case study city. With the high-resolution aerial image data and the Mask R-CNN [
47] image recognition algorithm, the existing PV systems installed on Bendigo rooftops were delineated. Based on the angular parameter and shading impact factor, the solar PV potential mapping of the rooftop PV in the case study area was created (
Figure 5). The GIS processing outcome of PV delineation, azimuth angle, tilt angle, and potential mapping was used in the following sections for PV modelling and simulation.
3.2. System Modelling
The system modelling in this study comprises the modelling of the PV system, battery energy storage system (BESS), the control mechanism of the VPP, and the energy market. The modelling was carried out using MATLAB and Simulink. To simulate the operation of the PV system, the following factors were taken into consideration: (1) Plane of array (POA) irradiance; (2) Solar position; (3) Losses caused by heat transfer; (4) Losses caused by the inverter, mismatch, wiring, shading, dust, etc. On the one hand, POA irradiance, solar position, and heat loss are closely related to the GIS-defined urban environment profile, which was sophisticatedly modelled to enable the analysis of different input scenarios. The model adopted the PVlib toolbox developed by Sandia National Lab [
48]. The modelling of a storage system mainly requires inputs of system specifications such as charge/discharge rate, maximum capacity, and efficiency. The reference value for BESS is based on the specifications of the TESLA Powerwall [
49].
3.3. Demand Data Mining
Energy consumption data were provided by the case study city’s local distribution network service provider: PowerCor. The dataset included an aggregated customer-type-based dataset for postal areas and 3000 de-identified samples with categories of different property purposes: residential, commercial, industrial, agricultural (coded as R, C, I, and A, respectively). A data-mining approach integrating Random Forest (RF) and K-means Clustering was used to extract the features of the sample demand data and reconstruct the demand dataset for the four user types in each SA1 cluster.
The data mining process comprised the following steps: (1) Train the RF model with sample postal-area-level input features and validate the results at the postal area level, (2) Establish the RF forecasting model on expanded postal-area-level input features and validate the results at the postal area level, (3) Train the RF model on postal-area-level input features to forecast the SA1-level consumption profile, (4) K-means clustering of the de-identified sample to extract the consumption profile for each type of user, and (5) Reconstruct SA1-level demand patterns based on clustered profiles and the forecasted SA1-level consumption profile.
Additional input variables of the user type composition, population density, and dwelling density for each SA1 and postal area were acquired from ABS to create a prediction model with RF that could estimate a SA1-level aggregated consumption profile from postal area demand data. The following input features were labelled on the aggregated postal area demand data: (1) Season, (2) User type, (3) User type count, and (4) User type ratio.
The
K-means approach was adopted for the clustering of the random sample data to identify the typical demand patterns among different user types in the City of Greater Bendigo.
K-means is one of the most fundamental but efficient unsupervised learning algorithms for data mining [
50]. The goal of
K-means clustering is to seek the optimal clustering policy that has the minimal total squared errors across all defined clusters, which can be described using the following equations:
where,
is the Euclidean distance of each cluster,
is the cluster mean, and
are the members of the defined cluster. The objective of the
K-means approach is to minimise the aggregated
E across all
K clusters:
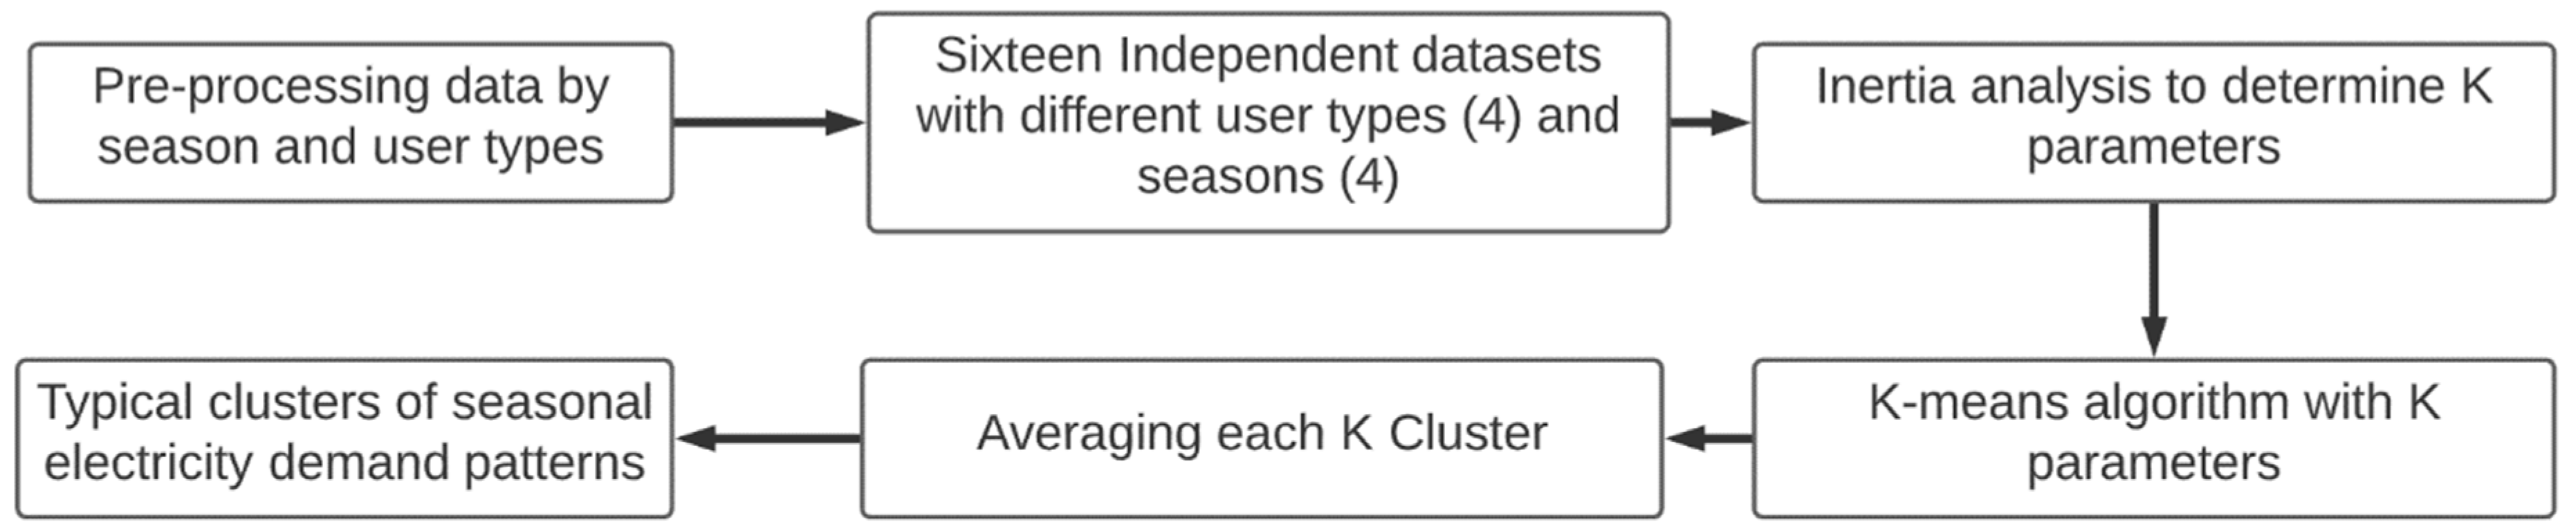
The process of using
K-means clustering to establish typical demand patterns is shown in
Figure 6. The dataset was divided into four sections by user type during the pre-processing stage. Following that, each sub-dataset was divided into four seasons, which generated sixteen independent datasets. The
K parameter should be established after the sixteen independent datasets are ready for clustering. Because the goal of
K-means clustering is to minimise total squared errors across all clusters, inertia analysis was performed to calculate the within-cluster sum of squared errors (WCSS). In the inertia analysis, the WCSSs in each
K were displayed in a line chart to show the reduction in inertia. A suitable
K divides the dataset into
K clusters, resulting in a considerable reduction in inertia when compared to the inertia in
K 1 clusters. Following the selection of
K, each independent dataset was grouped into
K clusters using the
K-means algorithm. Each cluster indicates a group of people who have the same customer type and use similar amounts of electricity during a given season.
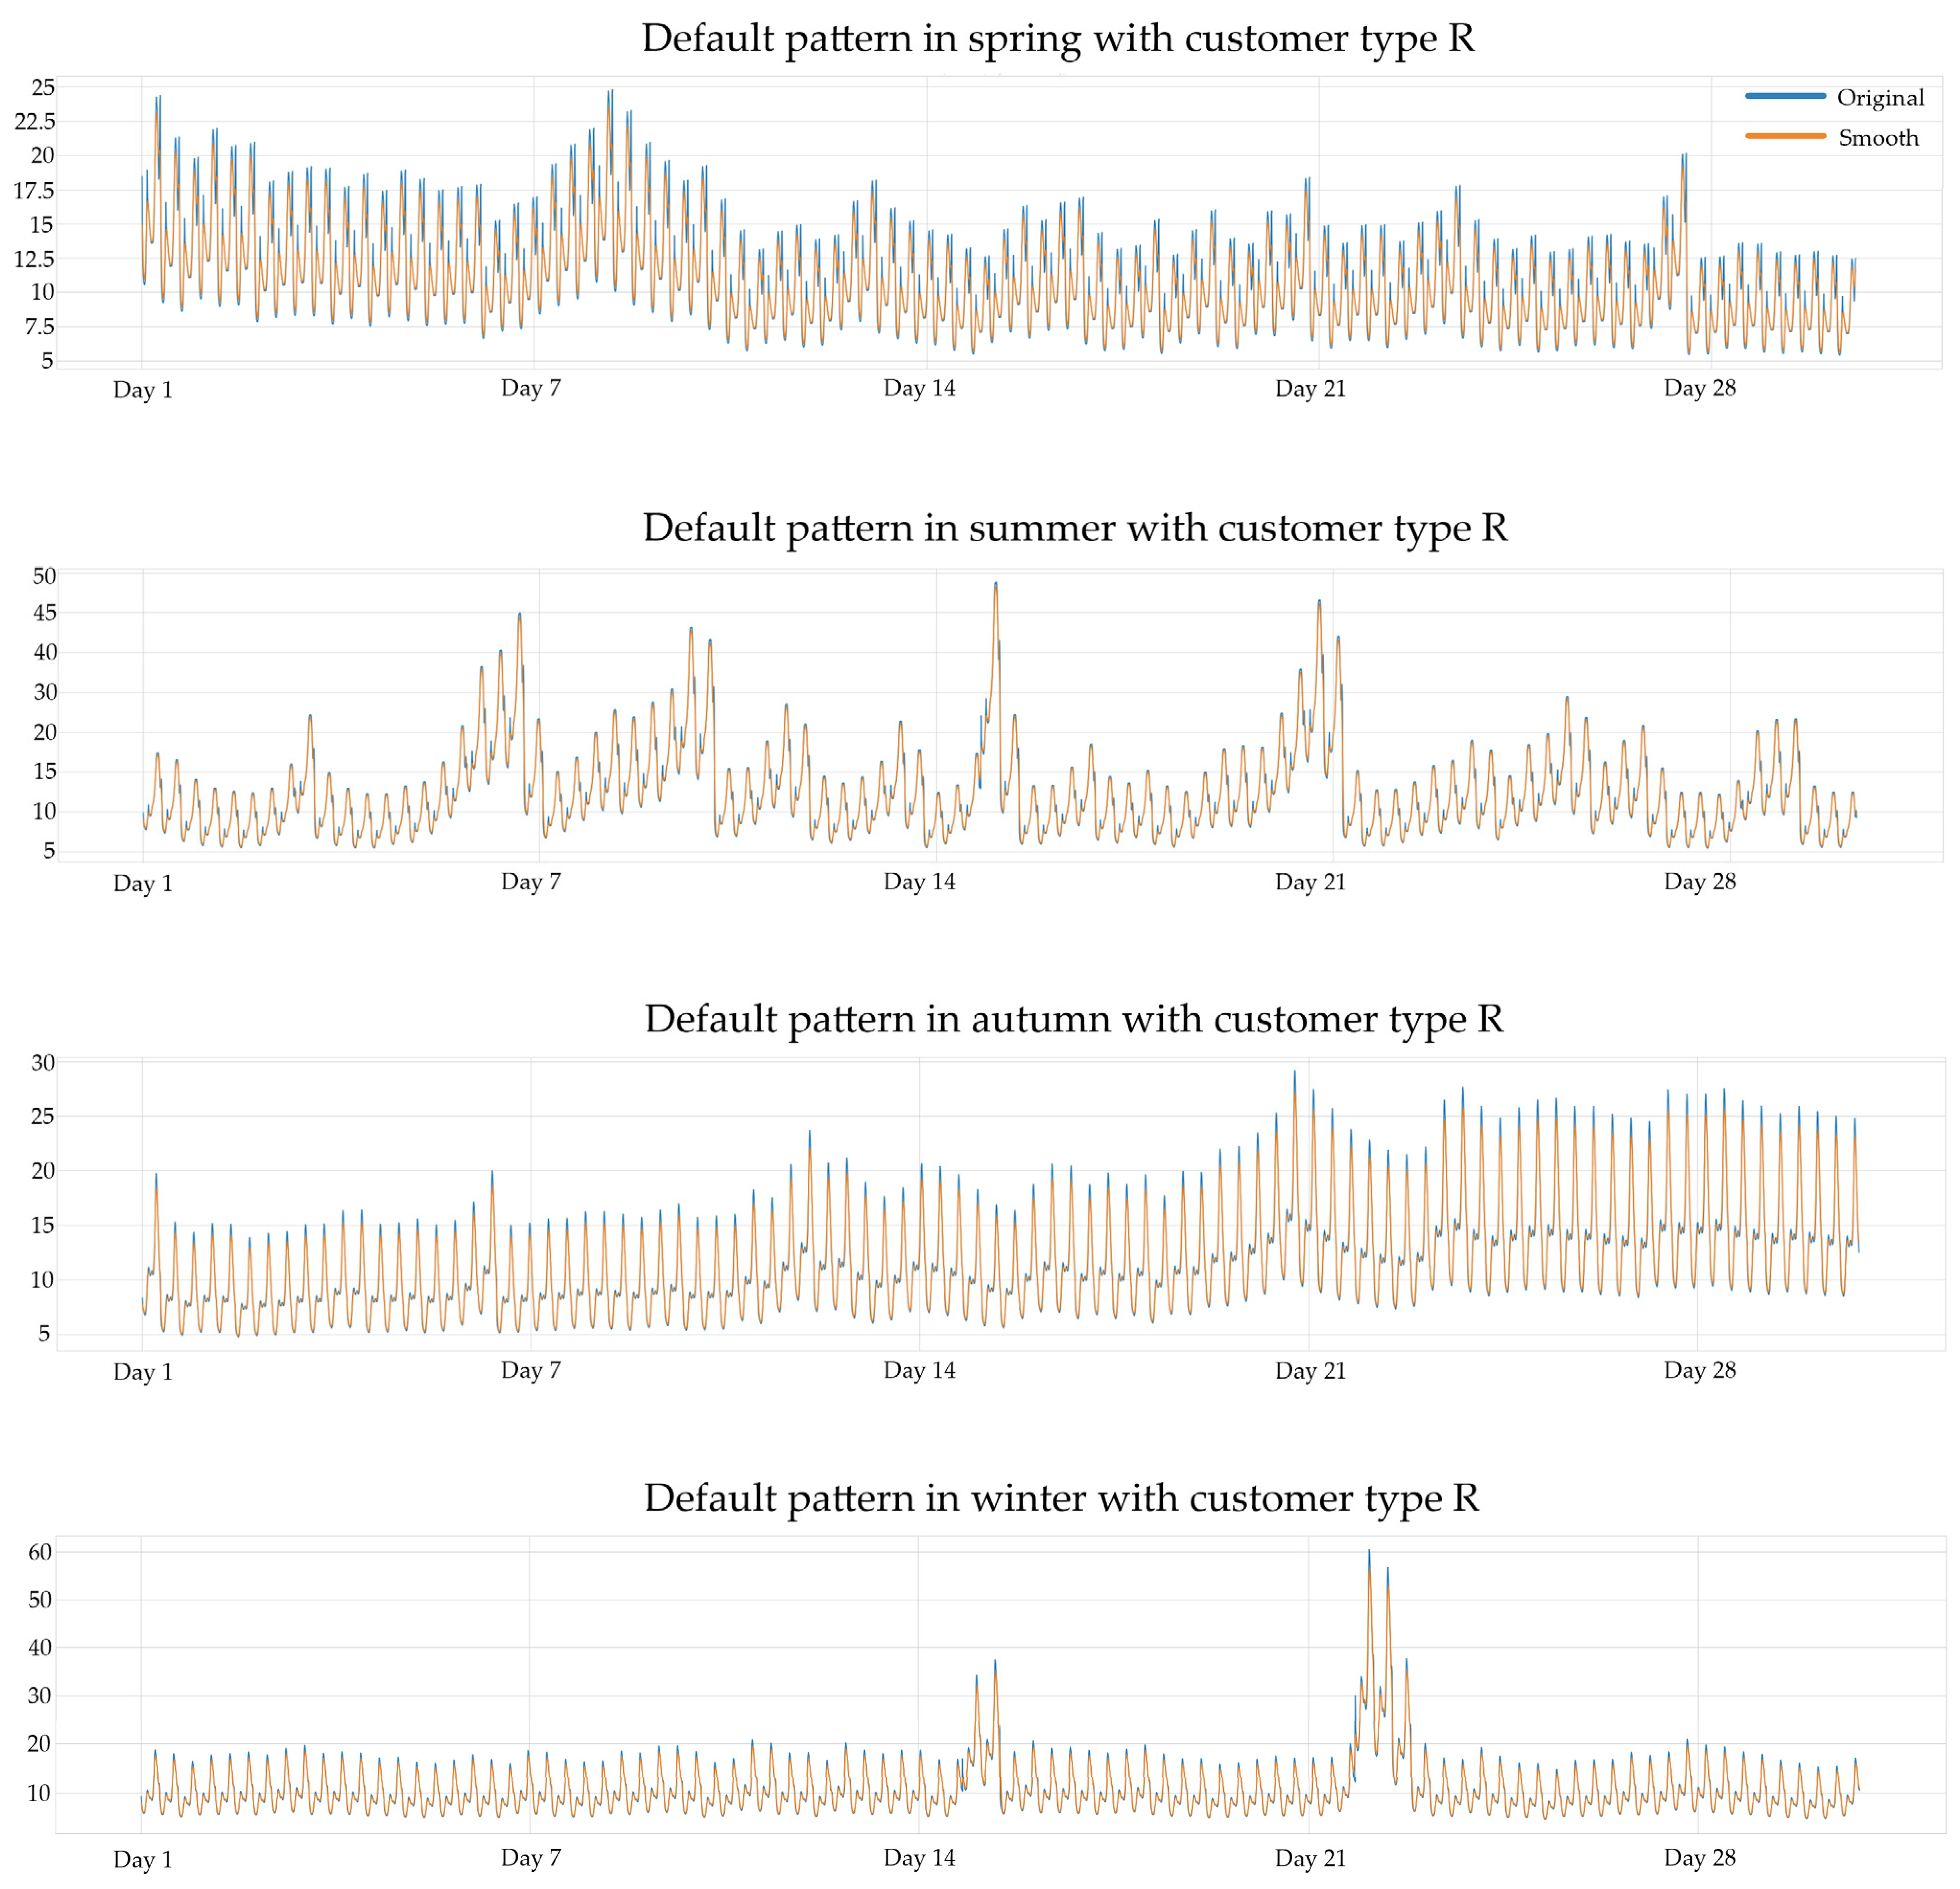
Shown in
Figure 7 is a sample of the reconstructed demand pattern. Each row of
Figure 7 shows one month’s electricity demand profile (kWh) for all residential users in one sample SA1. The outcome is the hourly interval demand data for each type of user in each SA1 of the City of Greater Bendigo. The reconstructed hourly demand pattern was then amplified to fit the aggregated SA1 electricity consumption in each SA1 for each user type. The models used in the demand data mining process were cross-validated multiple times at the postal area level to ensure its efficacy as far as possible. However, it remains a limitation that the true fidelity of this approach cannot be verified on a more detailed level (i.e., SA1 level), due to the lack of ground truth data at the SA1 level and the de-identification of the sample user data.
3.4. Reinforcement Learning VPP Operation Model
To operate the VPP under uncertainties and complexities in the urban environment and provide optimised control decisions, this study applied an RL-based approach to model the VPP control system. The concept of RL is very similar to human behaviour patterns when we observe and learn about the world. We learn something by obtaining sufficient positive feedback and learn that something is incorrect or dangerous by receiving negative feedback. Similar to human learning, the foundation of RL is the Markov Decision Process (MDP), which defines the procedure by which RL agents interact with the environment. MDP provides a control model for decision making in a discrete and stochastic process. The MDP creates an environment for the decision maker, in our case, an artificial intelligent entity (agent). In the MDP environment, the agent generates actions to change the states of the environment randomly. The changes result in the reward the agent can obtain and the probabilities of future state transitions. The agent’s objective is to select actions to maximise the long-term measure of total reward.
In this study, the RL-controlled VPP system is capable of adjusting electricity trading and scheduling strategies based on the observation and forecast of the users’ demand, the national energy market (NEM) electricity price for wholesale and ancillary services, and the renewable energy systems’ output. In total, four RL agents were trained under the four demand patterns, namely A, C, I, and R. The RL agent applies the deep deterministic policy gradient (DDPG) algorithm to construct its deep neural network through training iterations. The VPP system structure was modelled in Simulink with a MDP environment embedded. The RL system’s objective function is to maximise the economic benefits and minimise the losses in the operation of a VPP by providing demand shifting and participating in the electricity market. The objective function can be formulated as the following equation:
where
CF is the total cashflow of all timesteps,
is the AEMO-recommended retail price used to estimate the cash flow for trading with the public grid, and
is the AEMO ancillary services market price used for estimating ancillary services incomes.
With the objective function defined, the reward function for the RL system can then be formulated with the following three components: (1) the objective reward (
), (2) the step reward (
), and (3) the finishing reward (
). The reward function for the RL system can be described as:
is modified from the objective function (Equation (4)) to represent the actual cash flow of the VPP system.
3.5. Multi-Scenario Simulation and Analysis
The multiple scenario analysis of this study simulated and investigated the impacts of different VPP operation strategies under the different scenario cases. When generating scenario cases, this research considered the spatial and temporal dynamics of the urban environment in terms of the demand/supply changes, market changes, etc. The following aspects were considered in the scenario settings:
Scenario group A: Scenarios of potential PV coverage
Based on the PV system delineation results, the PV coverage scenario was established, considering solar potential, rooftop orientation, the slope of the roof, and the rooftops’ financial viability for deploying PV systems. The scenarios were as follows: (1) Base case with currently detected solar panels, (2) Medium coverage ratio scenario (25% of total available rooftop), (3) High coverage ratio scenario (50% of total available rooftop).
Scenario group B: Scenarios of electricity storage facilities
The PV/battery ratio is an essential factor to be considered when designing a distributed PV system. Many studies have investigated the coverage ratio impact of PV systems and battery systems on self-sufficiency capability and economic performance [
51,
52,
53,
54]. However, most of these studies applied scenario analyses that investigate different ratios’ performance. The recommended ratio ranges from 50% to 200%, as can be found in these studies. Based on a recommended system ratio from an Australian State Government document, the baseline ratio in this research was set for 70% of the PV system capacity [
55]. For scenario group B, three cases were introduced: (1) base case scenario without battery capacity, which affects the base case VPP operation scenario only, (2) battery capacity of 70% PV capacity, (3) battery capacity of 140% PV capacity, and (4) battery capacity with 210% PV capacity.
Scenario group C: Scenarios for electricity demand growth
This study considered a demand growth of 5 years to reflect the future demand conditions. The current demand is based on the demand data as introduced in
Section 3.3. The 5 years’ demand growth is forecasted using the estimated demand growth rate recommended by Australian Department of Industry, Science, Energy and Resources (DISER) [
56]. In the DISER’s 2020 report, the recent growth rate for 2019–2020 is used to estimate the five years’ growth in the near future.
4. Findings and Discussions
This section discusses the feasibility of a distributed renewable energy management system—VPP from the following aspects: (1) Carbon emission reduction, (2) Project economic performance, (3) User electricity price reduction and (4) Consumption efficiency measured by load factor.
4.1. Carbon Emission Reduction Performance of VPPs
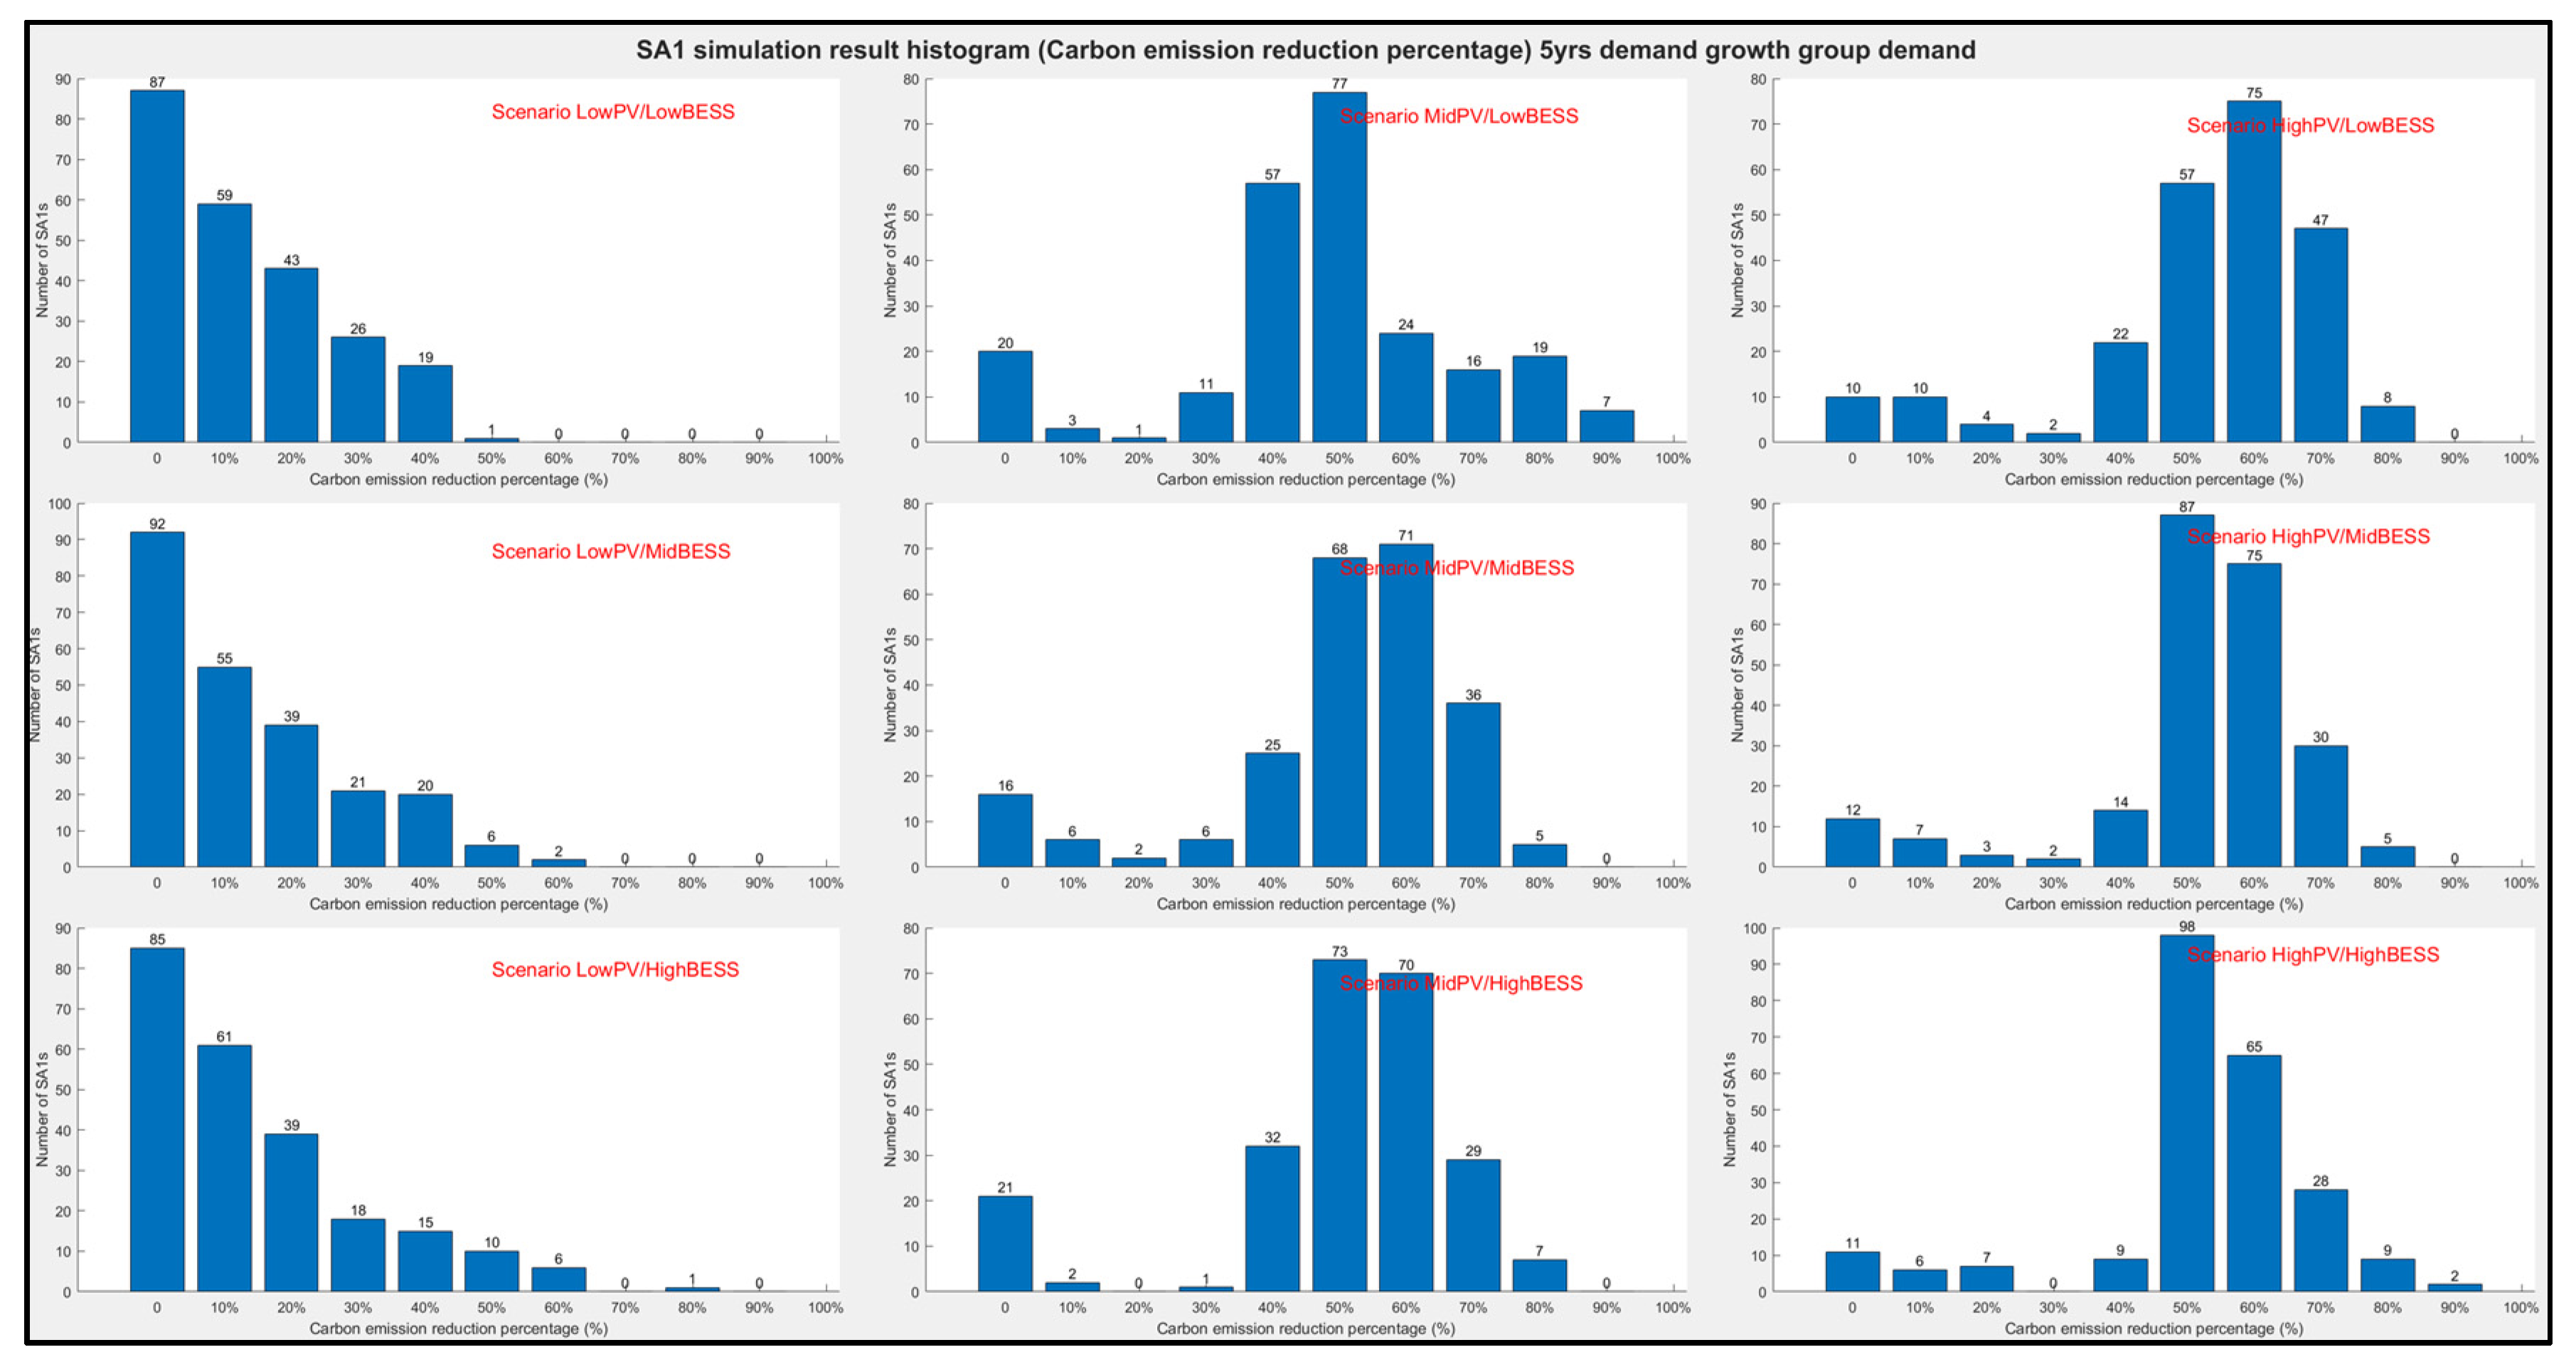
Figure 8 presents the histogram of the simulation results of carbon emission reduction (CO
2-e) with VPP implemented in each SA1. The emission reduction was calculated using Equation (5), where
is the emission of CO
2 with VPP implemented,
is the total CO
2 emission, and
is the emission reduction rate:
The carbon emission reduction factor was calculated based on the carbon dioxide (CO
2) emission factor provided in [
57] for electricity purchased from the grid. According to the report, in Victoria, Australia, the emission factor for CO
2 is 0.98 kg/kWh. As can be seen in
Figure 8, with low PV coverage levels, the vast majority of SA1s have carbon emission reduction rates lower than 10%, and the frequency of the 0–10% group increases while the demand growth scenario changes from current to future years. Increased PV coverage scenarios have a significant effect in increasing the rate of reduction of CO
2 emissions. It can also be noticed that within the same PV coverage scenario, increasing BESS capacity enlarges the group size of SA1s with higher carbon emission reduction rates.
Figure 8 presents the histogram plots of SA1 communities’ carbon emission reduction rate under different VPP operation scenarios. The X-axis represents the 10% interval of carbon emission reduction rates being measured. The Y-axis represents the count of observations that fall within each interval.
Based on
Figure 8, VPPs have the potential to reduce communities’ reliance on fossil fuel-based electricity. However, this capability depends on the capacity of available PV and BESS in the VPP systems. Furthermore, the figure shows that even with medium or high levels of PV coverage, around 20–30 communities in the second and third columns have low carbon emission reduction rates of less than 20%. This is likely due to extreme consumption levels in some industry or agriculture-focused communities that cannot be effectively offset by renewable generation. Therefore, while VPPs perform well in most communities with higher renewable energy and storage penetration, they may not be a one-size-fits-all solution for all communities with various demand patterns. Future investments and policy making should consider each community’s suitability when evaluating VPP as a carbon emission reduction approach.
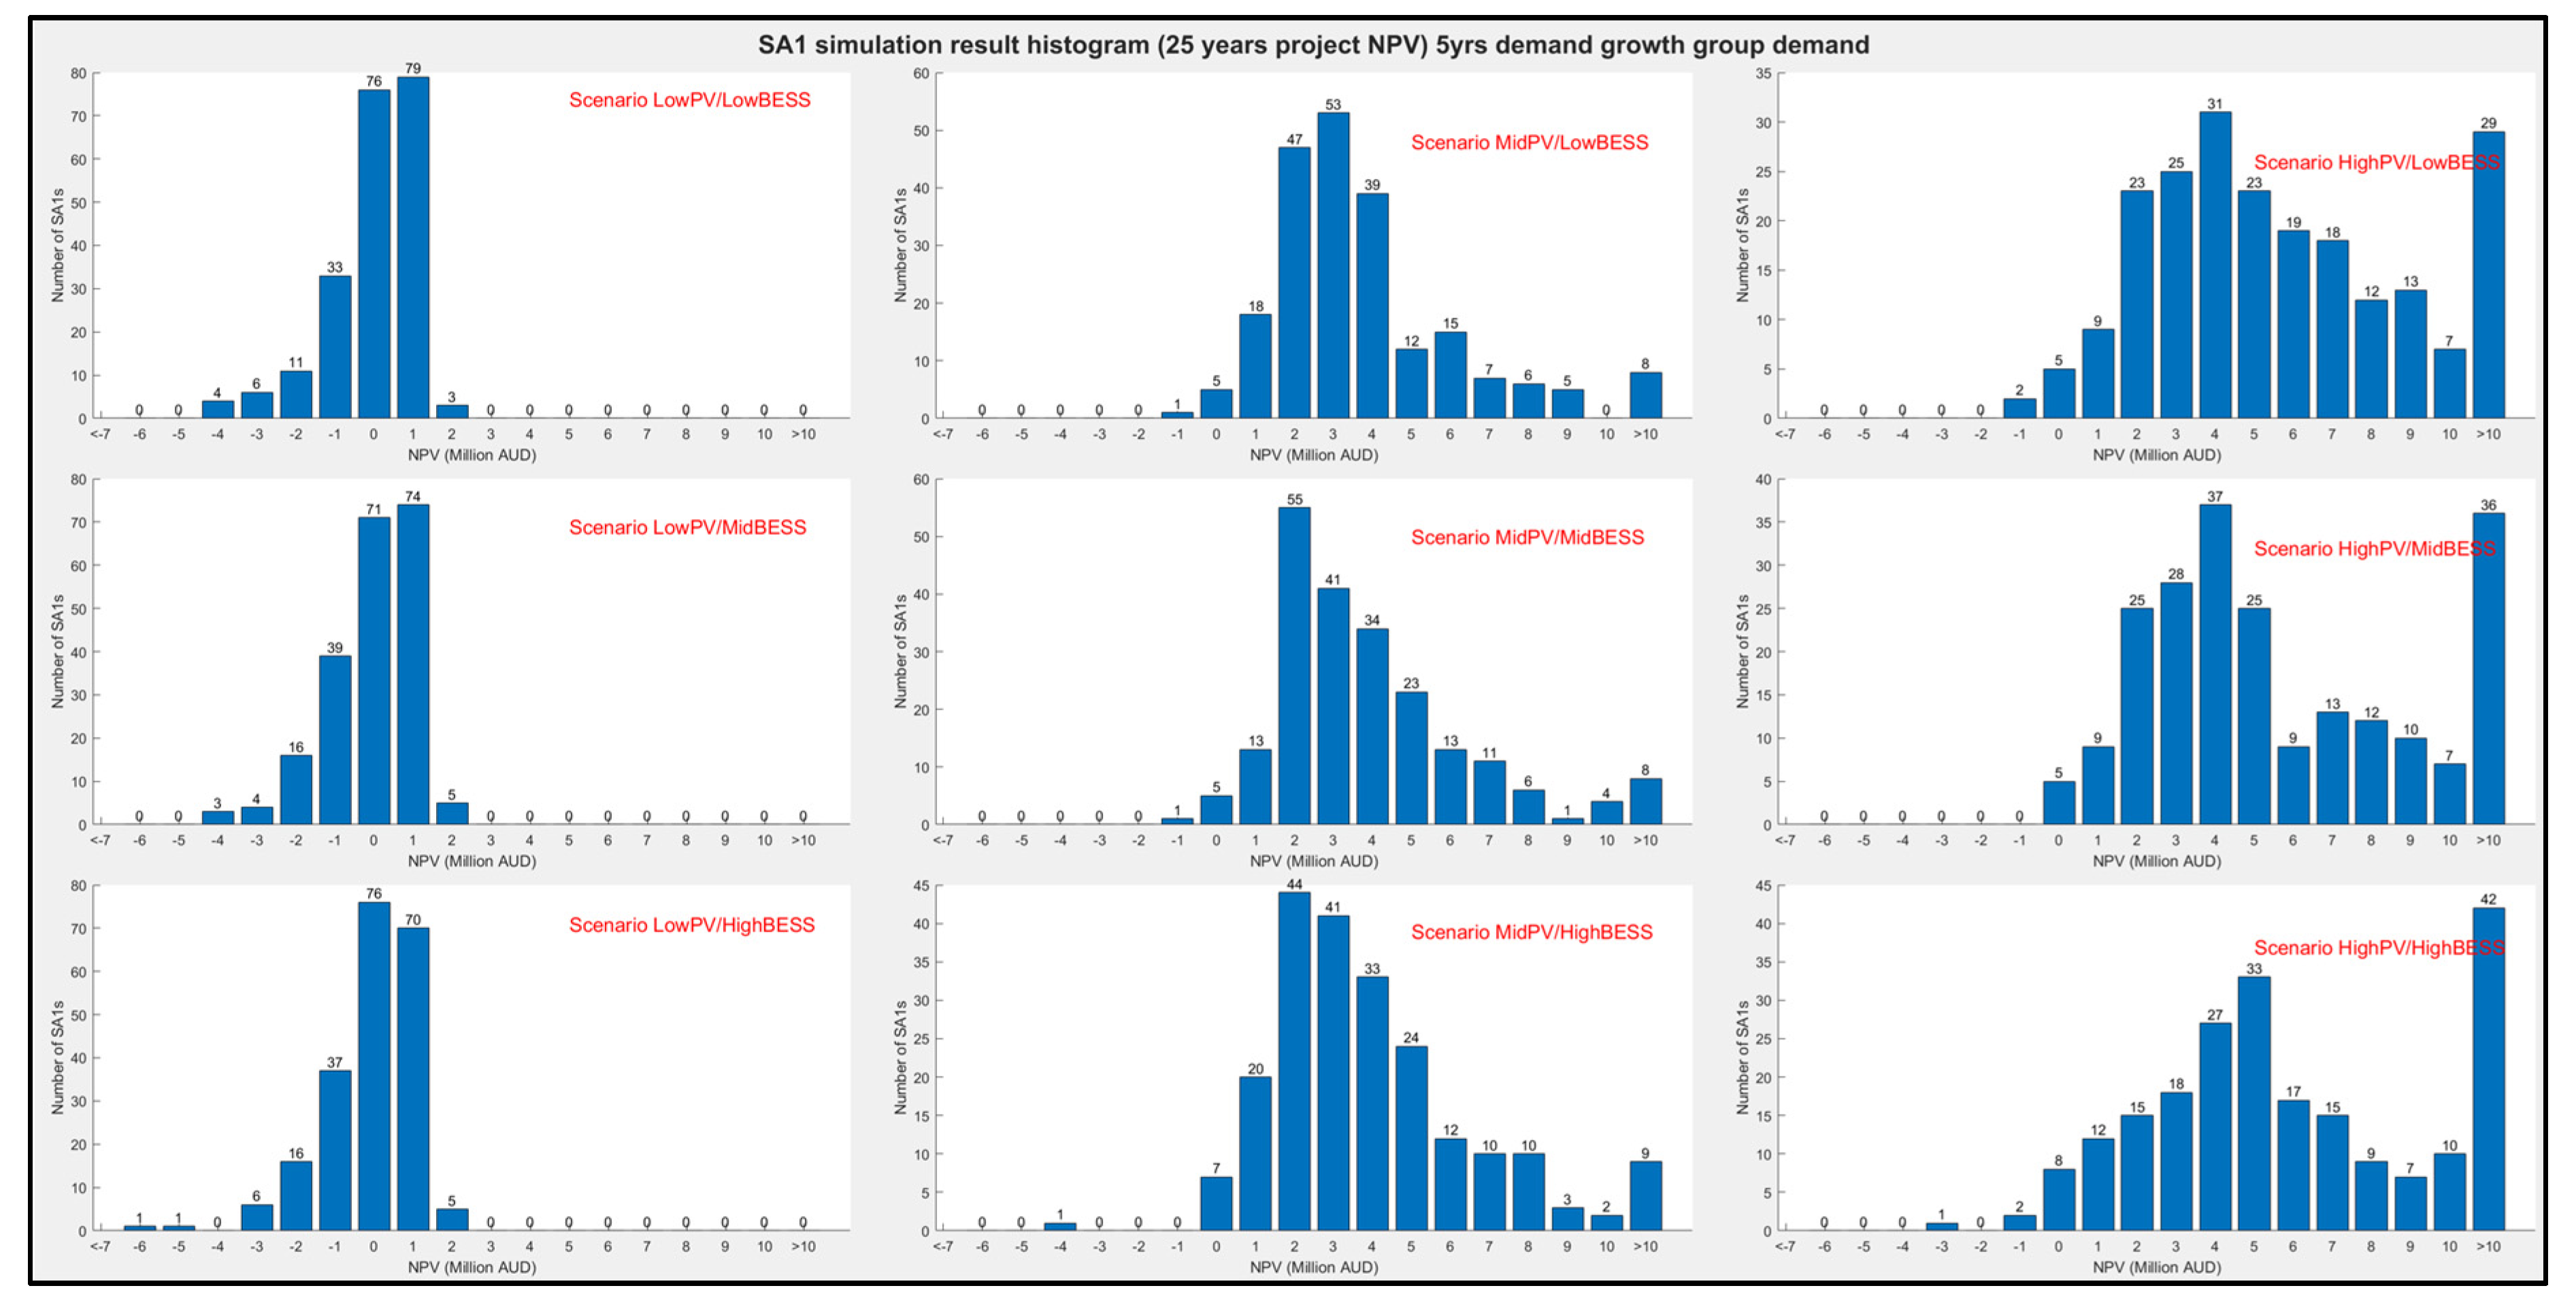
4.2. Economic Performance of VPPs Measured by 25 Years Net Present Value (NPV)
As presented in
Section 4.1, the VPPs tend to have a better performance among the communities when exposed to more renewable resources and BESS capacity. Nevertheless, the increasing size of distributed PV and BESS will involve a greater amount of capital investment. Hence, it is essential to examine VPPs’ costs and benefits among the multiple scenarios.
To measure the financial viability of investing in VPPs, this study calculated the VPP project’s life cycle net present value (NPV) for each SA1. The NPV calculation considers a 25-year lifetime for PV and BESS systems. In the life cycle, the cost of the project includes: (1) The cost of PV systems, (2) the cost of BESS systems, (3) the cost of construction, (4) the cost of maintenance and replacement, and (5) the cost of electricity purchased from the grid. The income of the project includes: (1) Income from selling electricity wholesale, and (2) income from participating in FCAS services.
The NPV calculation is this research applied the following equation:
where,
is the present value of annual cashflow at year
,
is the cost item,
is the income item,
is the saving in expenditure on electricity by offsetting users’ demand, and
is the discount rate.
Figure 9 shows the histogram of the VPPs’ economic performance in each community measured by 25 years NPV. The X-axis has a range from AUD −7 to 10 million with an interval of AUD 1 million. The Y-axis shows the count of observations within each interval.
It was found that the financial performance of VPP largely relies on the capacity of renewable generators and storage systems. When the capacity remains at the current level, the forecasted net present value (NPV) for investing in community-level VPP will be low. The simulation results on the 25 years project NPV indicate that with current PV coverage, most of the SA1s have low NPV or negative NPV values and the lowest NPV is around AUD −5 to −4 million. In the current scenario, around 34–35% of the SA1s have positive NPV values. This indicates that the investment in VPP with current installed PV capacity will have a relatively low expected financial payback.
When the PV coverage increases to medium or high level, the NPV among SA1s shows an increasing pattern, with over 88% of the SA1s populated above AUD 1 million in the 5-year scenario. The percentage grows up to above 90% of the SA1s with a higher NPV than AUD 1 million in the 10-year scenario. Increasing PV capacity will have a positive impact on the VPP’s NPV among the SA1s. However, the increase in BESS capacity can have a double-sided effect on the project NPV. For example, if an SA1 community already has a higher estimated profit (above AUD 10 million 25-year NPV), extra BESS capacity will be more likely to further increase the profit level. On the contrary, if an SA1 community has an estimated profit of less than AUD 1 million, the extra BESS capacity that incurs more initial cost and maintenance cost will have a higher chance of reducing the exiting profit.
In summary, the economic payback and project value of the future VPP deployment largely rely on the capacity of PV and BESS system. Higher PV and BESS system capacity gives VPP greater capability in demand offset and energy trading. It can also be found that the high BESS capacity can sometimes reduce project economic feasibility, which may be due to the high capital cost and maintenance cost of the BESS system.
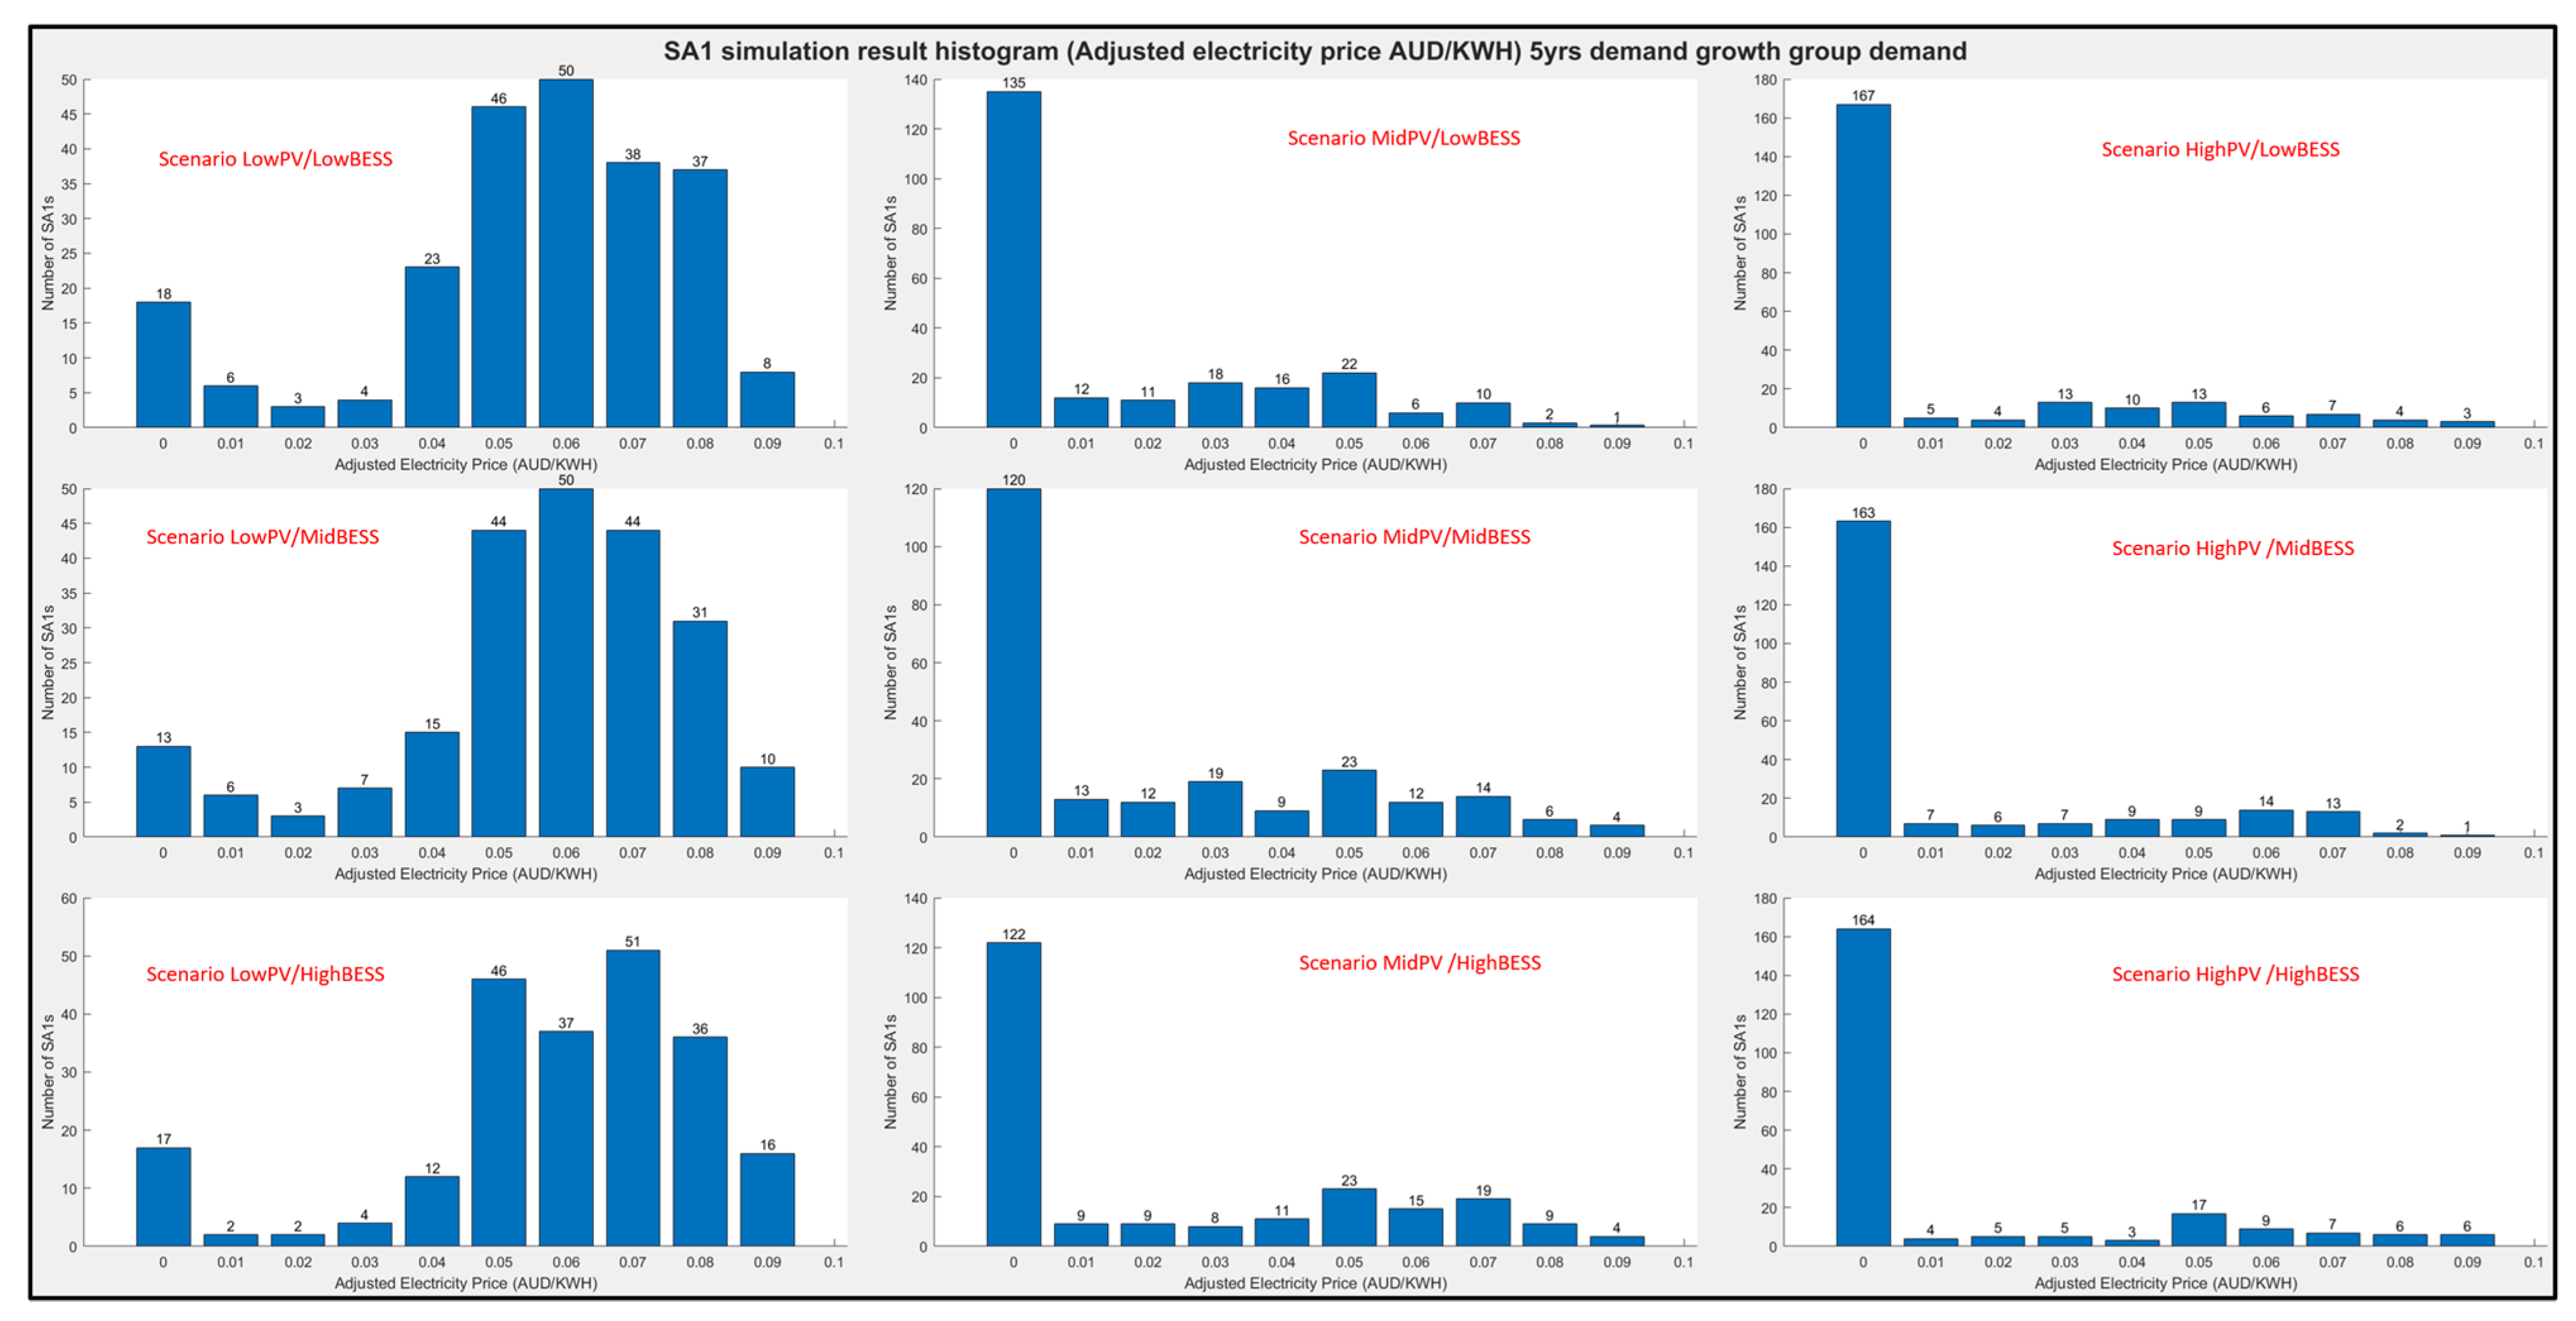
4.3. Economic Benefits of VPP for Communities and End-Users
Based on the calculation of the NPV, this research also provides an estimation of the electricity retail price which can fully offset the cost of the VPP. The adjusted electricity was calculated using the ratio of the users’ net demand after the demand offset action of VPP and the 25-year NPV in each SA1, as shown in the following equations:
where
is the total demand in each SA1 and
is the user demand offset by VPP.
Figure 10 is the histogram plots of the simulation results for the adjusted electricity price with VPP operating under each scenario. The X-axis has a range from 0 to 0.1 AUD/kWh with an interval of 0.01 AUD/kWh. The Y-axis shows the count of observations (i.e., the number of SA1 communities) falling into certain intervals.
The resulting histogram plots are shown in
Figure 10. It can be found that VPP’s economic performance has a strong impact on reducing the electricity cost for the local communities, even with the current PV installation capacity. Most of the SA1s with current PV capacity and low BESS capacity have reduced electricity price ranging from 0.05 to 0.08 AUD/kWh, while over 50% of the SA1s have an electricity price of less than AUD 0.01. This illustrates a significant reduction compared to the Default Offer electricity price (ranging from 0.1297 to 0.3091 AUD/kWh, excluding the service charge) provided by the Essential Services Commission (ESC) of Victoria [
58]. This demonstrates that the VPP has significant capacity in reducing the users’ electricity expenditure with different demand profiles.
The results from the adjusted electricity price indicate that VPPs offer significant benefits to end-users, even at the current level of renewable energy and BESS coverage. Comparing the first column of
Figure 9 and
Figure 10, it can be seen that despite the NPVs of investment being suboptimal at low-PV and BESS coverage levels, end-users would still benefit from much lower electricity prices by using VPPs. Therefore, it is recommended that government bodies and potential investors take into account the positive impact on end-users when considering VPP deployment. The successful implementation of VPPs largely depends on the increase in distributed renewable energy and storage capacity. Since a large portion of the procurement for such distributed generators comes from prosumers or households, it is crucial to demonstrate the direct benefits of participating in VPPs to end-users, prosumers, and the wider community.
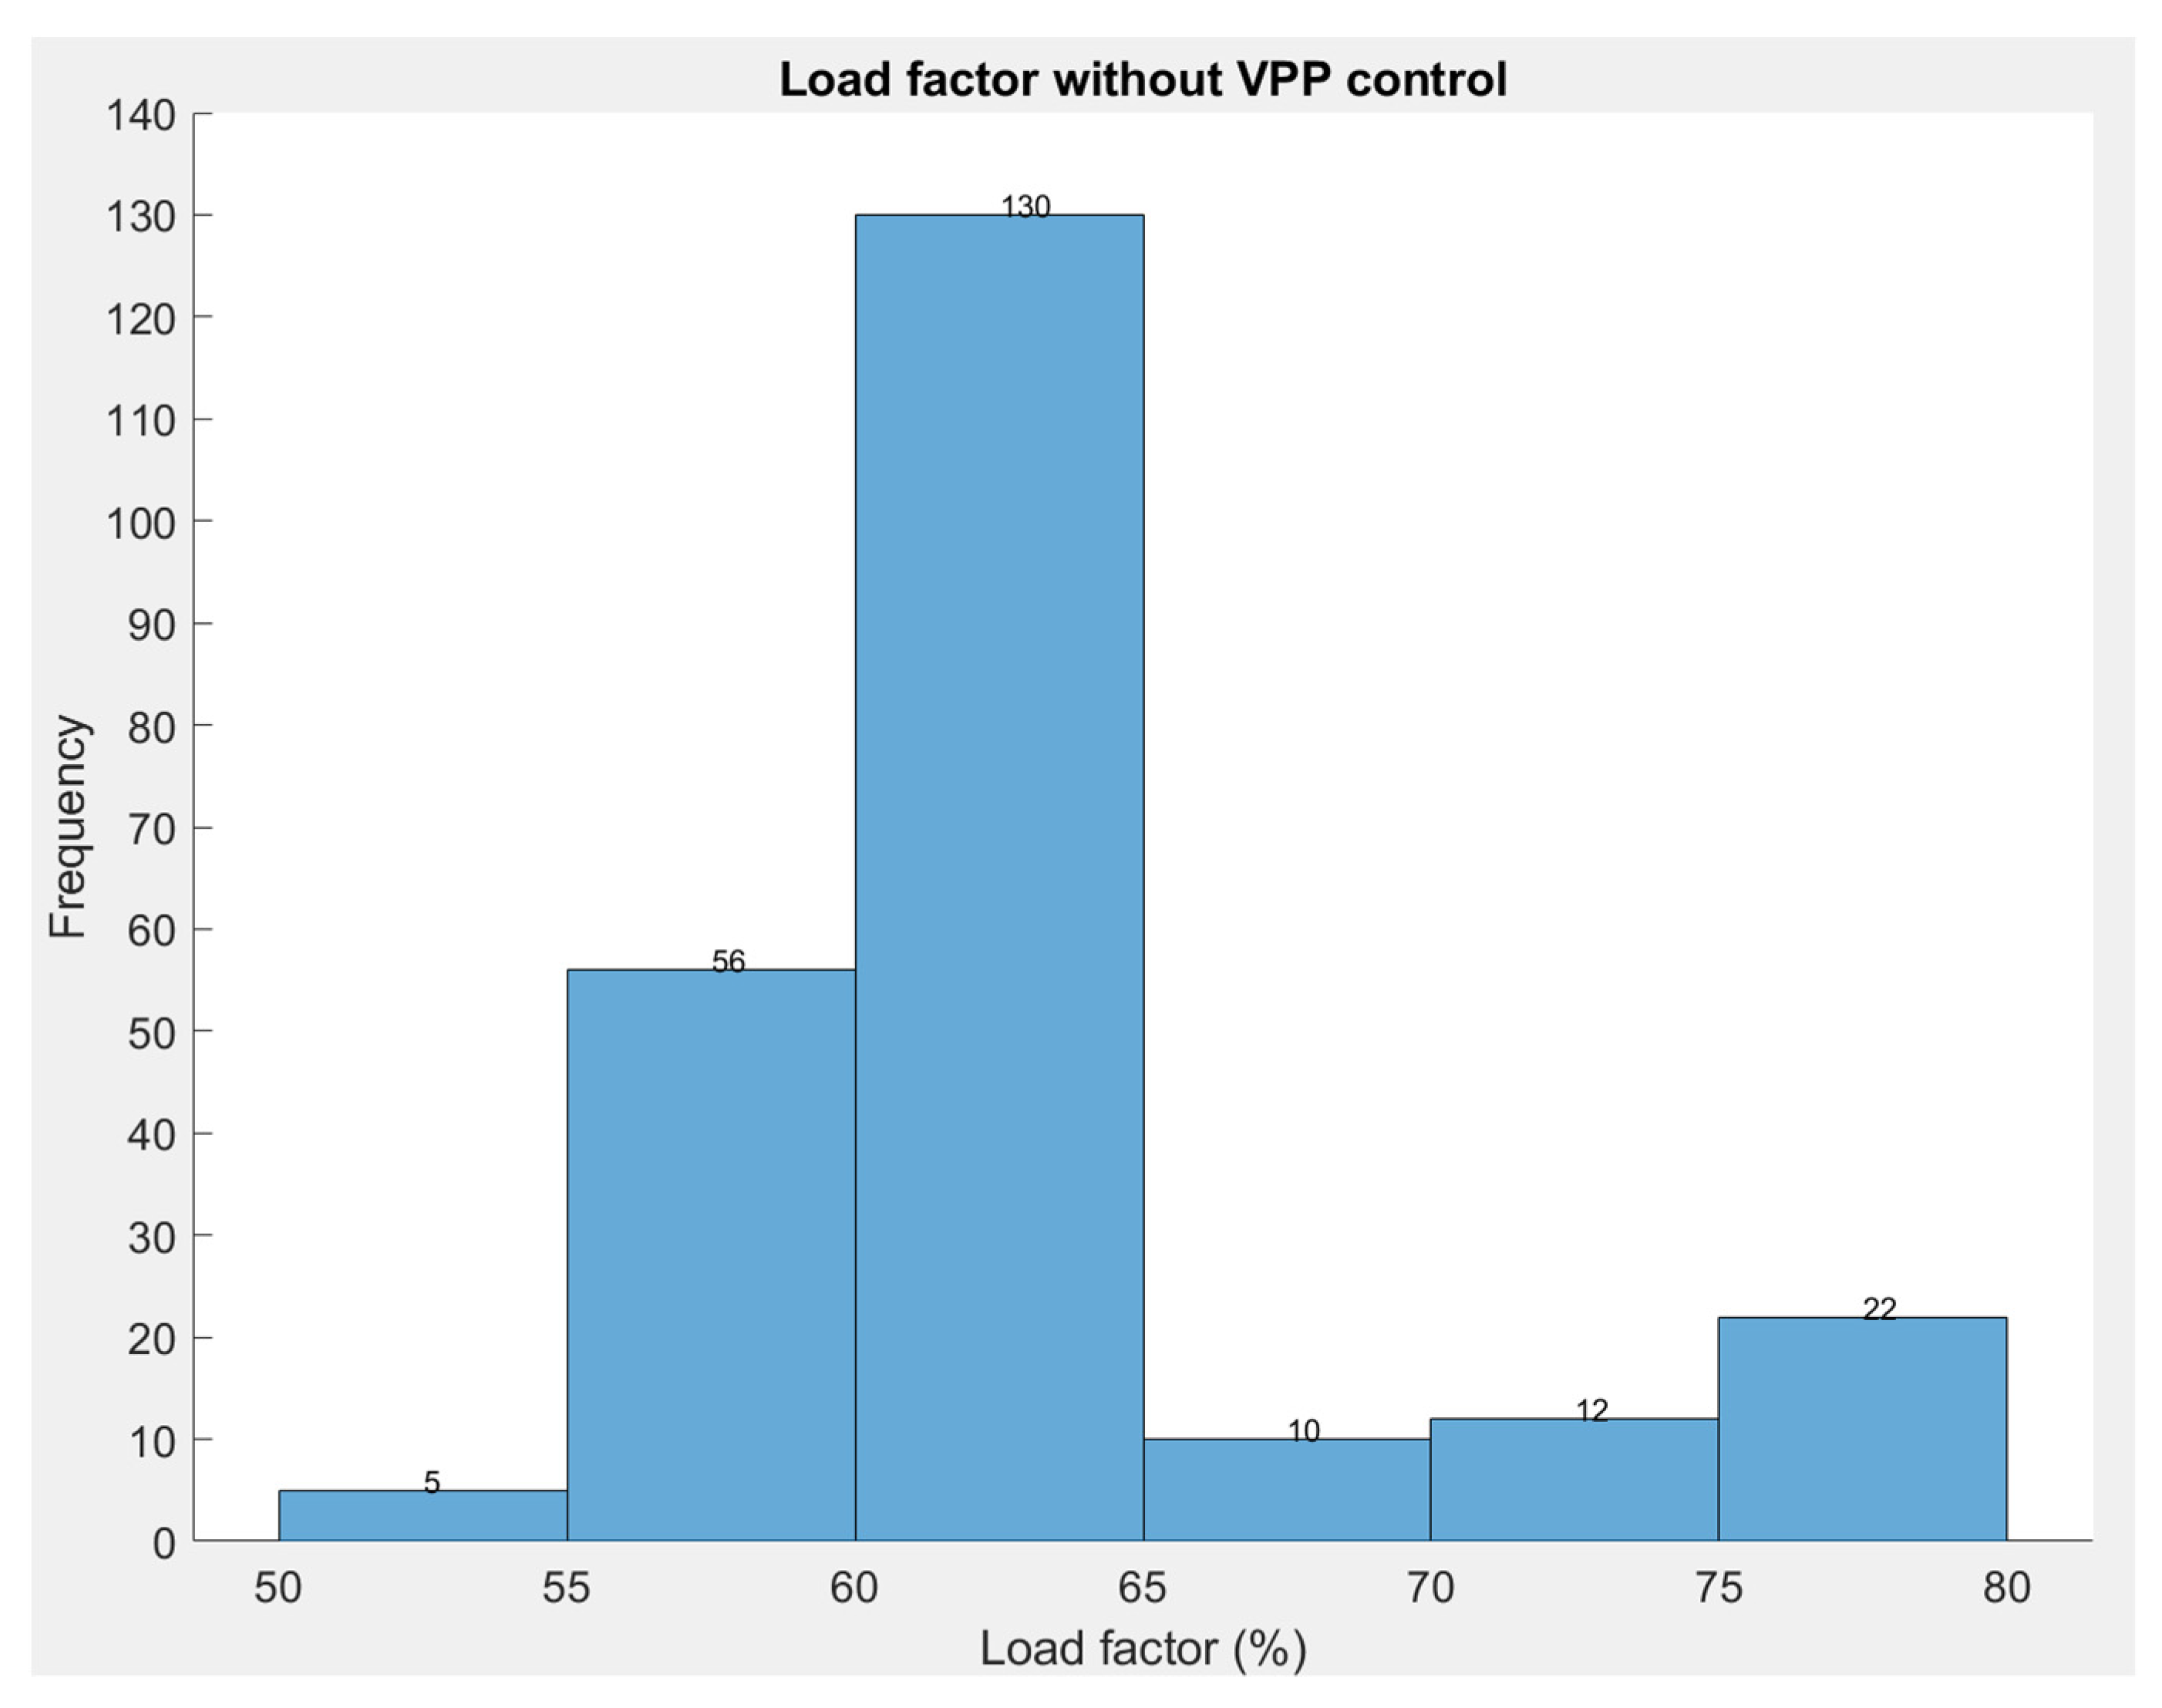
4.4. Consumption Efficiency Measured by Load Factor
The load factor is an essential indicator for assessing the effects of load on the power grid. As a distributed generator network, VPP has a significant impact on grid stability. The load factor is defined as the ratio of the average load over time to the peak load over time. The electricity infrastructure is built to sustain peak loads rather than normal loads. When the load factor in a user cluster is higher, it signifies that the average load of the users is close to the peak load, indicating that the energy infrastructure in this cluster is more efficient. In contrast, if the load factor is low, it suggests that the consumers’ electricity consumption is substantially lower than the peak demand that the electricity network is designed to meet most of the time. As a result, a higher load factor indicates that the electricity network is more efficient, whereas a lower load factor indicates that the network is less efficient, and the network requires more ancillary service capacity to mitigate imbalanced frequency or voltage when demand is much lower than the designed capacity.
This section provides an assessment of the VPP model’s impact on the grid’s consumption efficiency using load factor as an indicator. The load factor in this study was calculated using the following equation:
where
is the load factor as a percentage and
is the hourly user demand in a year.
In this study, a comparison was made between the original load factor and the load factor under VPP control. The original load factor was calculated using the current demand data in each SA1, and a histogram plot was created (
Figure 11) to show the distribution of the load factors among the SA1s. The X-axis in
Figure 11 represents the range of load factor from 50 to 80% with an interval of 10%, while the Y-axis shows the count of observations that belong to each interval. The figure shows that, of the 235 SA1s, over 50% have load factors of around 60–65% and approximately 30 SA1s have load factors ranging from 65% to 80%. Over one quarter of the SA1s have load factors below 60%.
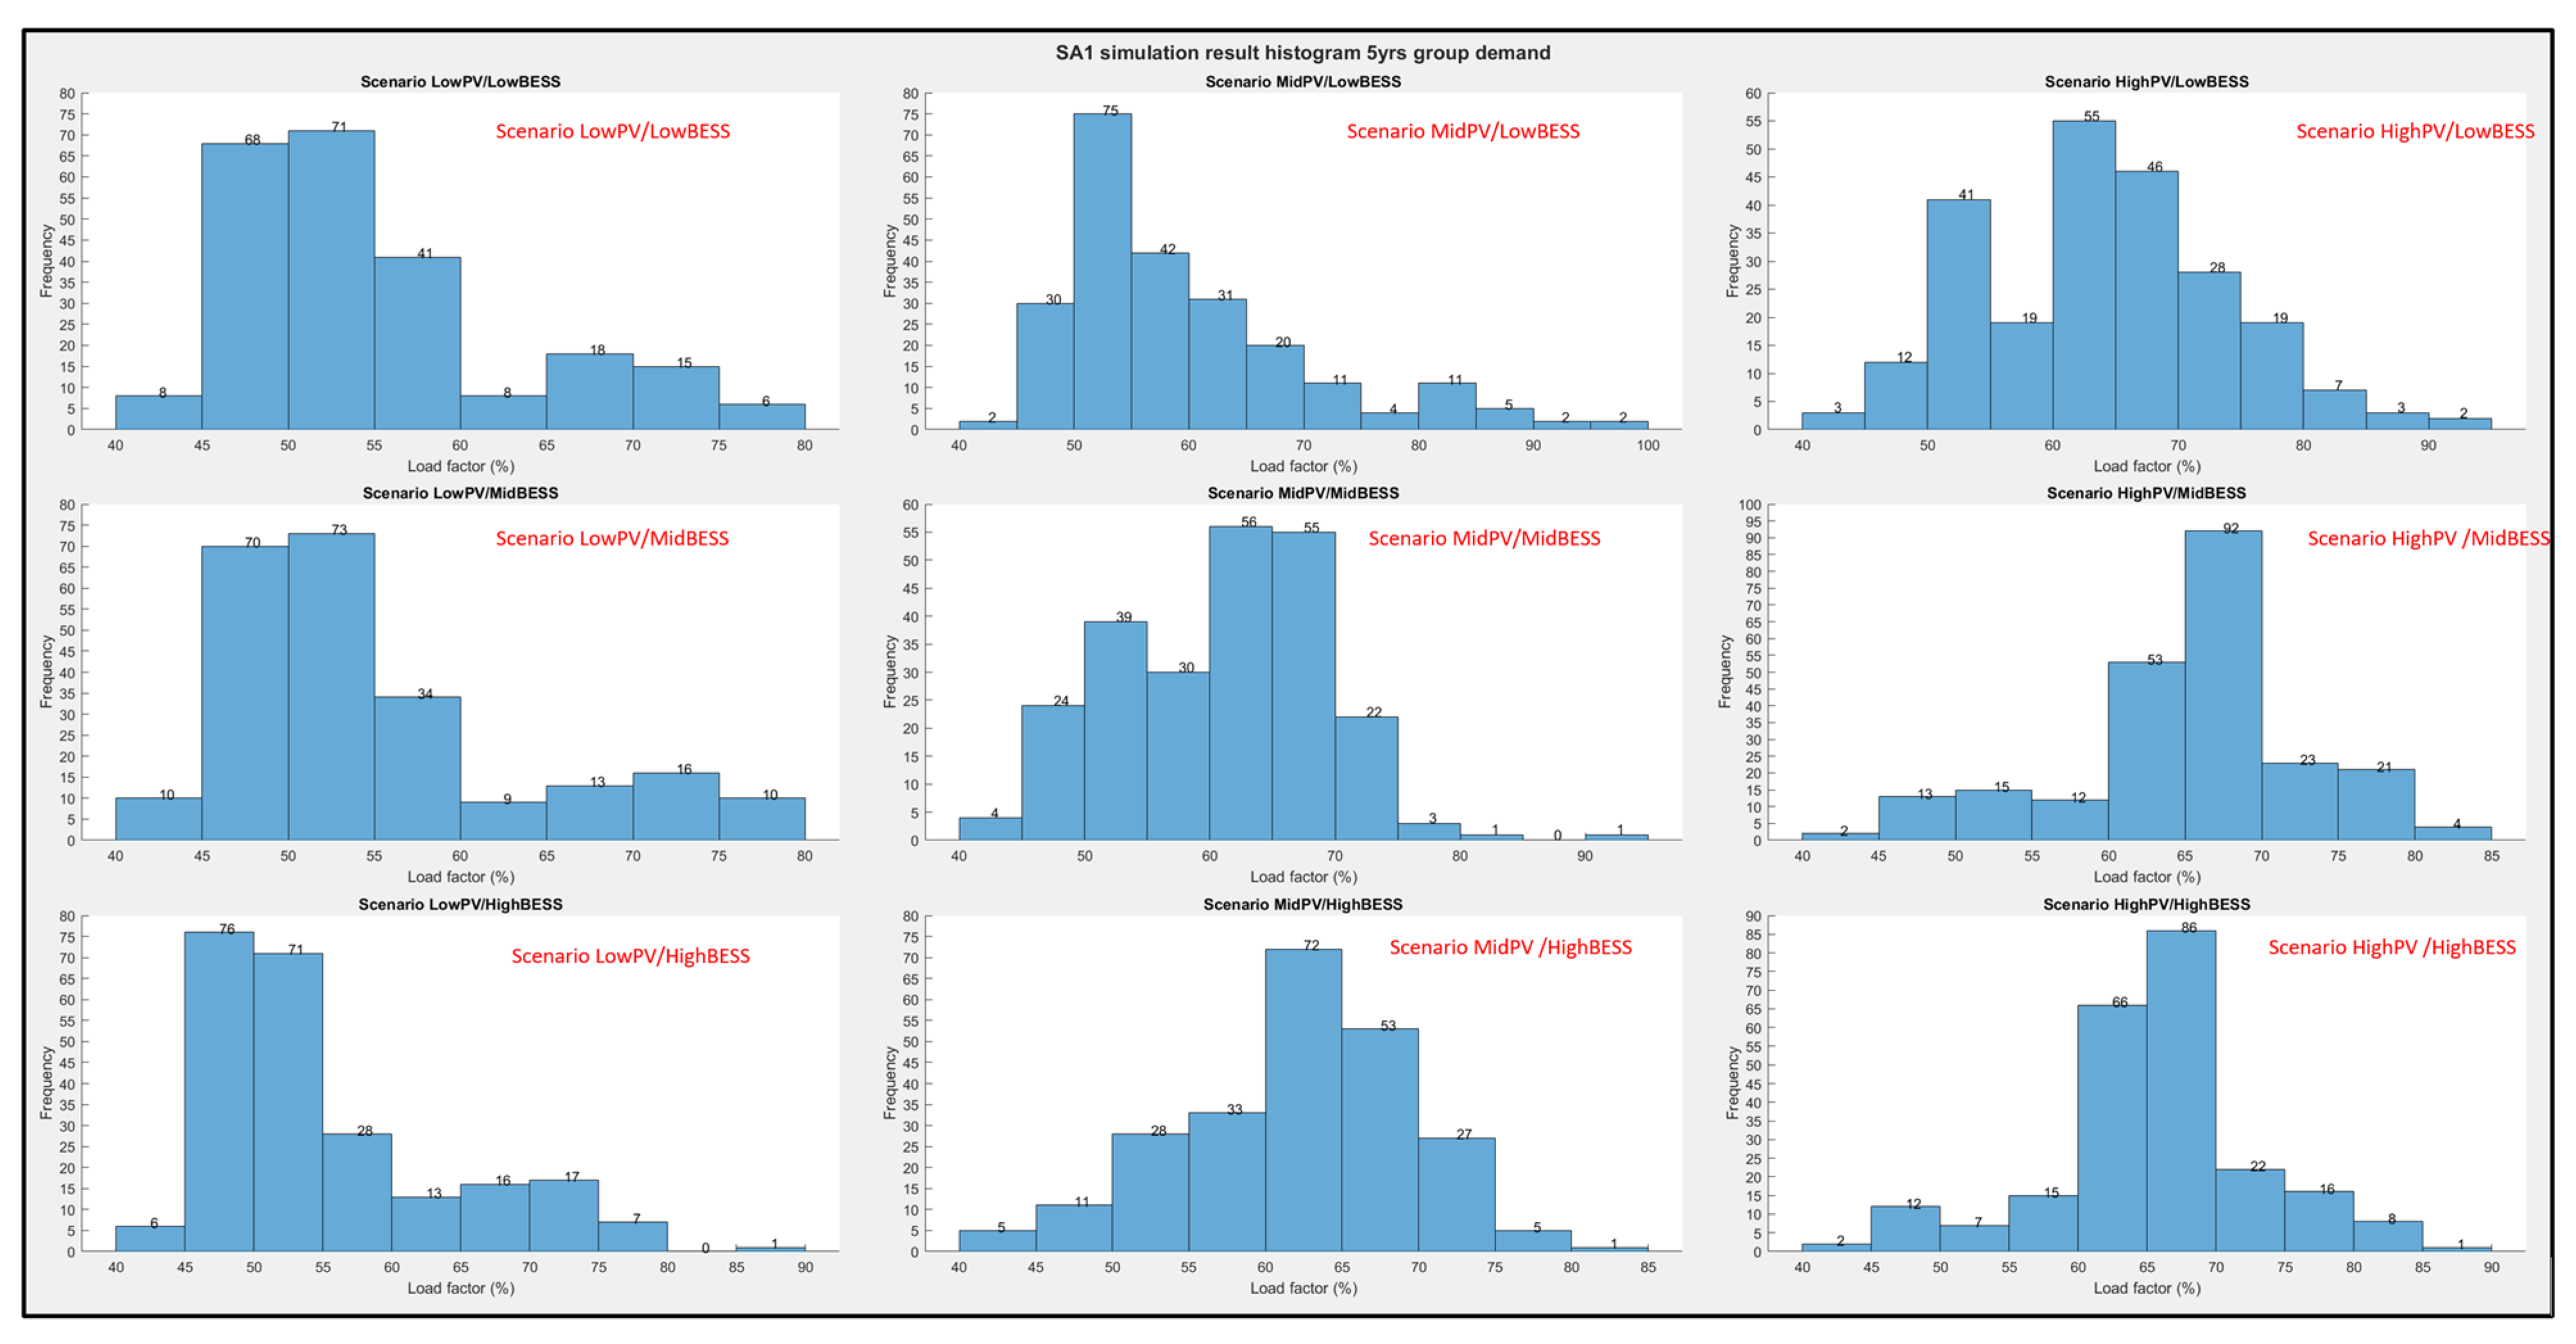
The load factor results for VPP-controlled scenarios are shown in the histogram (
Figure 12). Compared with the original load factor histograms in
Figure 11, the histograms of low-PV scenarios in
Figure 12 show a significant decrease in the distribution pattern, with over 50% of the SA1s having lower load factors than 55%. This indicates that, when applying the VPP system at current PV coverage level, the VPP will have a negative impact on the efficiency and stability of Bendigo’s electricity network. The reason is that PV has a higher output during the daytime while the users do not make their peak demand. However, the PV output is not high enough to last in the system until the peak demand. The consequence is that the PV output only reduces the average demand while the peak demand cannot be mitigated. As a result, the load factor becomes higher than in the situation without PV.
The load factor situation is improved as the PV coverage level increases. As
Figure 12 shows, in scenarios with high PV coverage and medium–high BESS scenarios, less than 25% of the SA1s have load factors lower than 60%. Furthermore, the BESS capacity shows its benefits in the medium–high PV coverage scenarios, where the scenarios with higher BESS capacity have more SA1s located in the load factor range of 65–75% compared to the scenarios with low BESS capacity.
In summary, the results of load factors presented in
Section 4.4 demonstrate that there is a significant impact on the public electricity network in terms of consumption efficiency when PV and BESS coverage are low. The current renewable and storage capacity in the sample communities are not sufficient to effectively offset the peak load among users, resulting in a reduced load factor. This could cause unexpected frequency and voltage turbulence during peak hours, which should be a concern for local network distributors. Increasing the PV and BESS capacity can significantly improve the load factor of most sample communities. However, approximately 10–20 communities experience a drop in load factors even with medium–high PV and BESS coverage. This suggests that VPP may not be a suitable option for these communities from the perspective of grid stability. It is important to consider the balance between the deployment of VPPs and the stability of the public electricity network when planning future investments and policies.
5. Conclusions and Further Research
This paper reports the results of a case study of an implementation of community- focused VPP system in an Australian city. The aim of this study is to investigate the VPP’s benefits and risks for end-users and local communities. In this study, a novel VPP model with an RL-based control mechanism is introduced which is capable of operating under various demand and supply profiles within each SA1 community. Geospatial mapping and data mining approaches were utilised to capture the local renewable resources and reconstruct the demand patterns for community-based user clusters. Based on the simulation results, the data analysis provides an overview of the VPP’s performance in terms of carbon emission reduction, project economic performance, electricity cost benefits for end-users and communities, and the impacts on the grid consumption efficiency.
From the investment perspective, it was found that at current PV coverage level, the implementation of VPP is not a feasible option due to the risks of low economic value, and relatively poor performance in carbon emission reduction. Nevertheless, analysis of the PV and BESS growth scenarios proves that the VPP has great potential to support the future growth of the city’s renewable energy system and unlock the distributed system’s values among the communities.
Ideally, with an increase in PV rooftop coverage to 25%, over 50% of the SA1 communities will have a significant reduction in carbon emissions. When the PV coverage further increases to 50% of rooftop are, over 70% of the SA1 communities will reduce the carbon emissions by half. The increasing BESS capacity has the effect of maintaining carbon emission reduction against demand growth. Compared with the scenario groups with low BESS capacity, those with mid to high systems capacity will maintain a higher carbon emission reduction rate even as the electricity consumption continues to grow.
For end-users, VPPs have great capacity in reducing the user’s expenditure on electricity in all the scenarios when the adjusted electricity price lower than the Default Offer as provided by the Victoria Essential Service Commission.
The analysis of load factor indicated that with current levels of renewable energy penetration, VPPs tend to have a negative impact on the local electricity network that will lower the consumption efficiency. It is a result of the insufficient PV and BESS capacity, which reduces the average load but fails to significantly reduce the peak load. The alternative scenarios suggested that, with increasing PV and BESS capacity, VPP is capable of improving the load factors compared to the default situation.
Due to the limitations in the data collection, this research does not consider the detailed VPP operation from an electrical engineering perspective. The interaction among VPPs operating in different communities are not considered as this requires single line diagrams of the supply, distribution, and transmission network. The operating voltage and frequency of the VPPs are not considered in this study, as they require further data input and modelling of the grid-connected inverters and the feeder network. It is recommended that future research may further expand the scope of research to include detailed simulation of VPPs to include more aspects of electricity network impact factors such as voltage control and frequency regulation. It is recommended that future studies may considerably expand VPP modelling and functionalities, for example, by integrating a game-theory-based bidding system in the market end of the VPP system model.
To sum up, this research validates the VPP benefits for end-users and the communities in terms of reducing carbon emissions and reducing electricity costs. However, the financial viability and the grid impacts of VPP projects largely depend on the availability and capacity of the renewable energy generators and storage systems.


