1. Introduction
Lake Van Basin is a high seismic risk region in the Eastern Anatolia Region. In the basin, Bitlis City has been the cradle of many different civilizations and is located on a strategic transition corridor. Especially in recent years, the devastating earthquakes in this basin and the loss of life and large-scale economic damage resulting from these earthquakes have brought up the importance of studies, research, and measures to be taken regarding earthquakes.
An important part of modern predisaster management is that an assessment of the behavior of the existing structures under the influence of earthquakes is carried out before a possible earthquake. The main purpose of determining the earthquake safety of buildings is to make the right decisions about the existing building stock by making the necessary assessments and structural analysis before a possible earthquake [
1,
2,
3,
4,
5,
6,
7,
8]. It is not easy to make detailed structural analyses due to the large stock of existing buildings. It is also a problematic process regarding time, cost, and technical staff for detailed structural analysis. Therefore, using fast and accurate evaluation methods on the existing building stock is a practical solution [
9,
10,
11,
12]. These methods, developed using post-earthquake statistical data, are very practical in applicability [
13,
14]. These methods are generally based on the observational analysis of the building from the outside and partly from the inside [
15]. There are many methods for rapid assessments of the existing structures. The Turkish Rapid Assessment Method (PDRB-2019) [
16] was used in this study, updated in 2019. Within this study’s scope, the sample buildings’ regional risk priorities were determined using this method. This method was first published and implemented in 2013 by the Ministry of Environment, Urbanization, and Climate Change. In light of earthquakes in Türkiye and scientific developments, both the earthquake hazard map and the seismic design code were updated in 2018. The Turkish Rapid Assessment Method was also updated in 2019 in accordance with the important changes made in the map and code [
16,
17,
18,
19]. In this regulation, simplified methods that can be used to determine the regional earthquake risk distribution of different types of buildings, such as reinforced concrete and masonry, are specified with detail. In this study, the proposed method for masonry structures was used.
The history of masonry buildings dates back to the settled life of people. A large part of the existing building stock consists of masonry structures that were built without any engineering services. Therefore, these types of structures are most affected by earthquakes [
20]. Structural damages in masonry buildings reveal that the earthquake resistance of such structures is lower than other structures [
21,
22,
23,
24,
25,
26,
27]. The masonry structures built with local materials and construction techniques are shaped by the effects of climate and topography. Architectural characteristics in masonry buildings also directly affect risk priorities [
28,
29]. In this respect, studies on such structures can be an important support tool for decision makers.
There are studies on seismic risk priorities related to urban-level scoring. Formisano et al. [
30] made a seismic evaluation of two ancient masonry church sets in two different regions in Italy with three different simplified methods. Fabbrocino et al. [
31] used a simplified method for regional-scale seismic assessments, and they obtained a global score for churches located on two different islands in Italy. Khemis et al. [
32] determined the risk ratings for 226 unreinforced masonry buildings in Annaba, Algeria. The seismic fragility assessment of masonry buildings in two different settlements in Bosnia and Herzegovina was carried out using a macro seismic model by Ademović et al. [
33]. Pirchio et al. [
34] developed 13 different indices for risk grading with their fieldwork for 72 medieval masonry churches in Italy. Formisano and Marzo [
35] compared the results by performing structural analysis and the simplified LV1 and advanced LV3 analysis levels given by the Italian Cultural Heritage Guidelines for a masonry building. Lourenc̣o et al. [
36] have presented a simplified method for the seismic assessment of large-span masonry structures, which provides lower bound formulas for different simplified geometric indices, applied to a database of 44 monuments in Italy, Portugal, and Spain. Özbay and Karapınar [
37] tried to determine risk priorities for 213 masonry structures located in Istanbul Galata. This and similar studies can be considered case studies to determine risk priorities.
In this study, the authors carried out the architectural characteristics of the traditional Bitlis houses, which were built in masonry style, as a result of field investigations. As a result of this observation-based study, information was given about the damages that occurred in these structures, and solutions were presented. All pictures and figures used in the article were prepared by the authors from the site and in a computer environment. Within the scope of the study, 20 different traditional Bitlis houses were examined. In another part of this study, seismic parameters were determined using an updated Türkiye Earthquake Hazards Map Interactive Web Application for each building by considering the geographic coordinates measured on site. The necessary data for the Turkish Rapid Assessment Method was obtained with the help of this application. In addition, it was carried out using the Turkish Rapid Assessment Method, which was updated in 2019, to determine the regional earthquake risks of twenty different masonry structures in Bitlis. As a result of the measurements made in situ, the structural result scores were calculated for each masonry structure, and risk priority was determined among the selected structures. This study is one of the first investigations using the Turkish Rapid Assessment Method in masonry structures. The obtained results were evaluated and suggestions were made. The study is one of the most comprehensive studies of masonry structures in Bitlis, which is one of the settlements with the high earthquake risk. The study provides detailed information regarding Bitlis masonry stock in terms of different disciplines. The last earthquakes in Kahramanmaraş, which occurred in Türkiye on 6 February 2023, have made it necessary to determine the earthquake risks of the existing building stock. This study will be a definitive study for settlements when determining the risk priorities of masonry structures. The Turkish Rapid Assessment Method has been explained in detail in the study and can be used for different settlement units.
2. Architectural Characteristics of Traditional Bitlis Houses
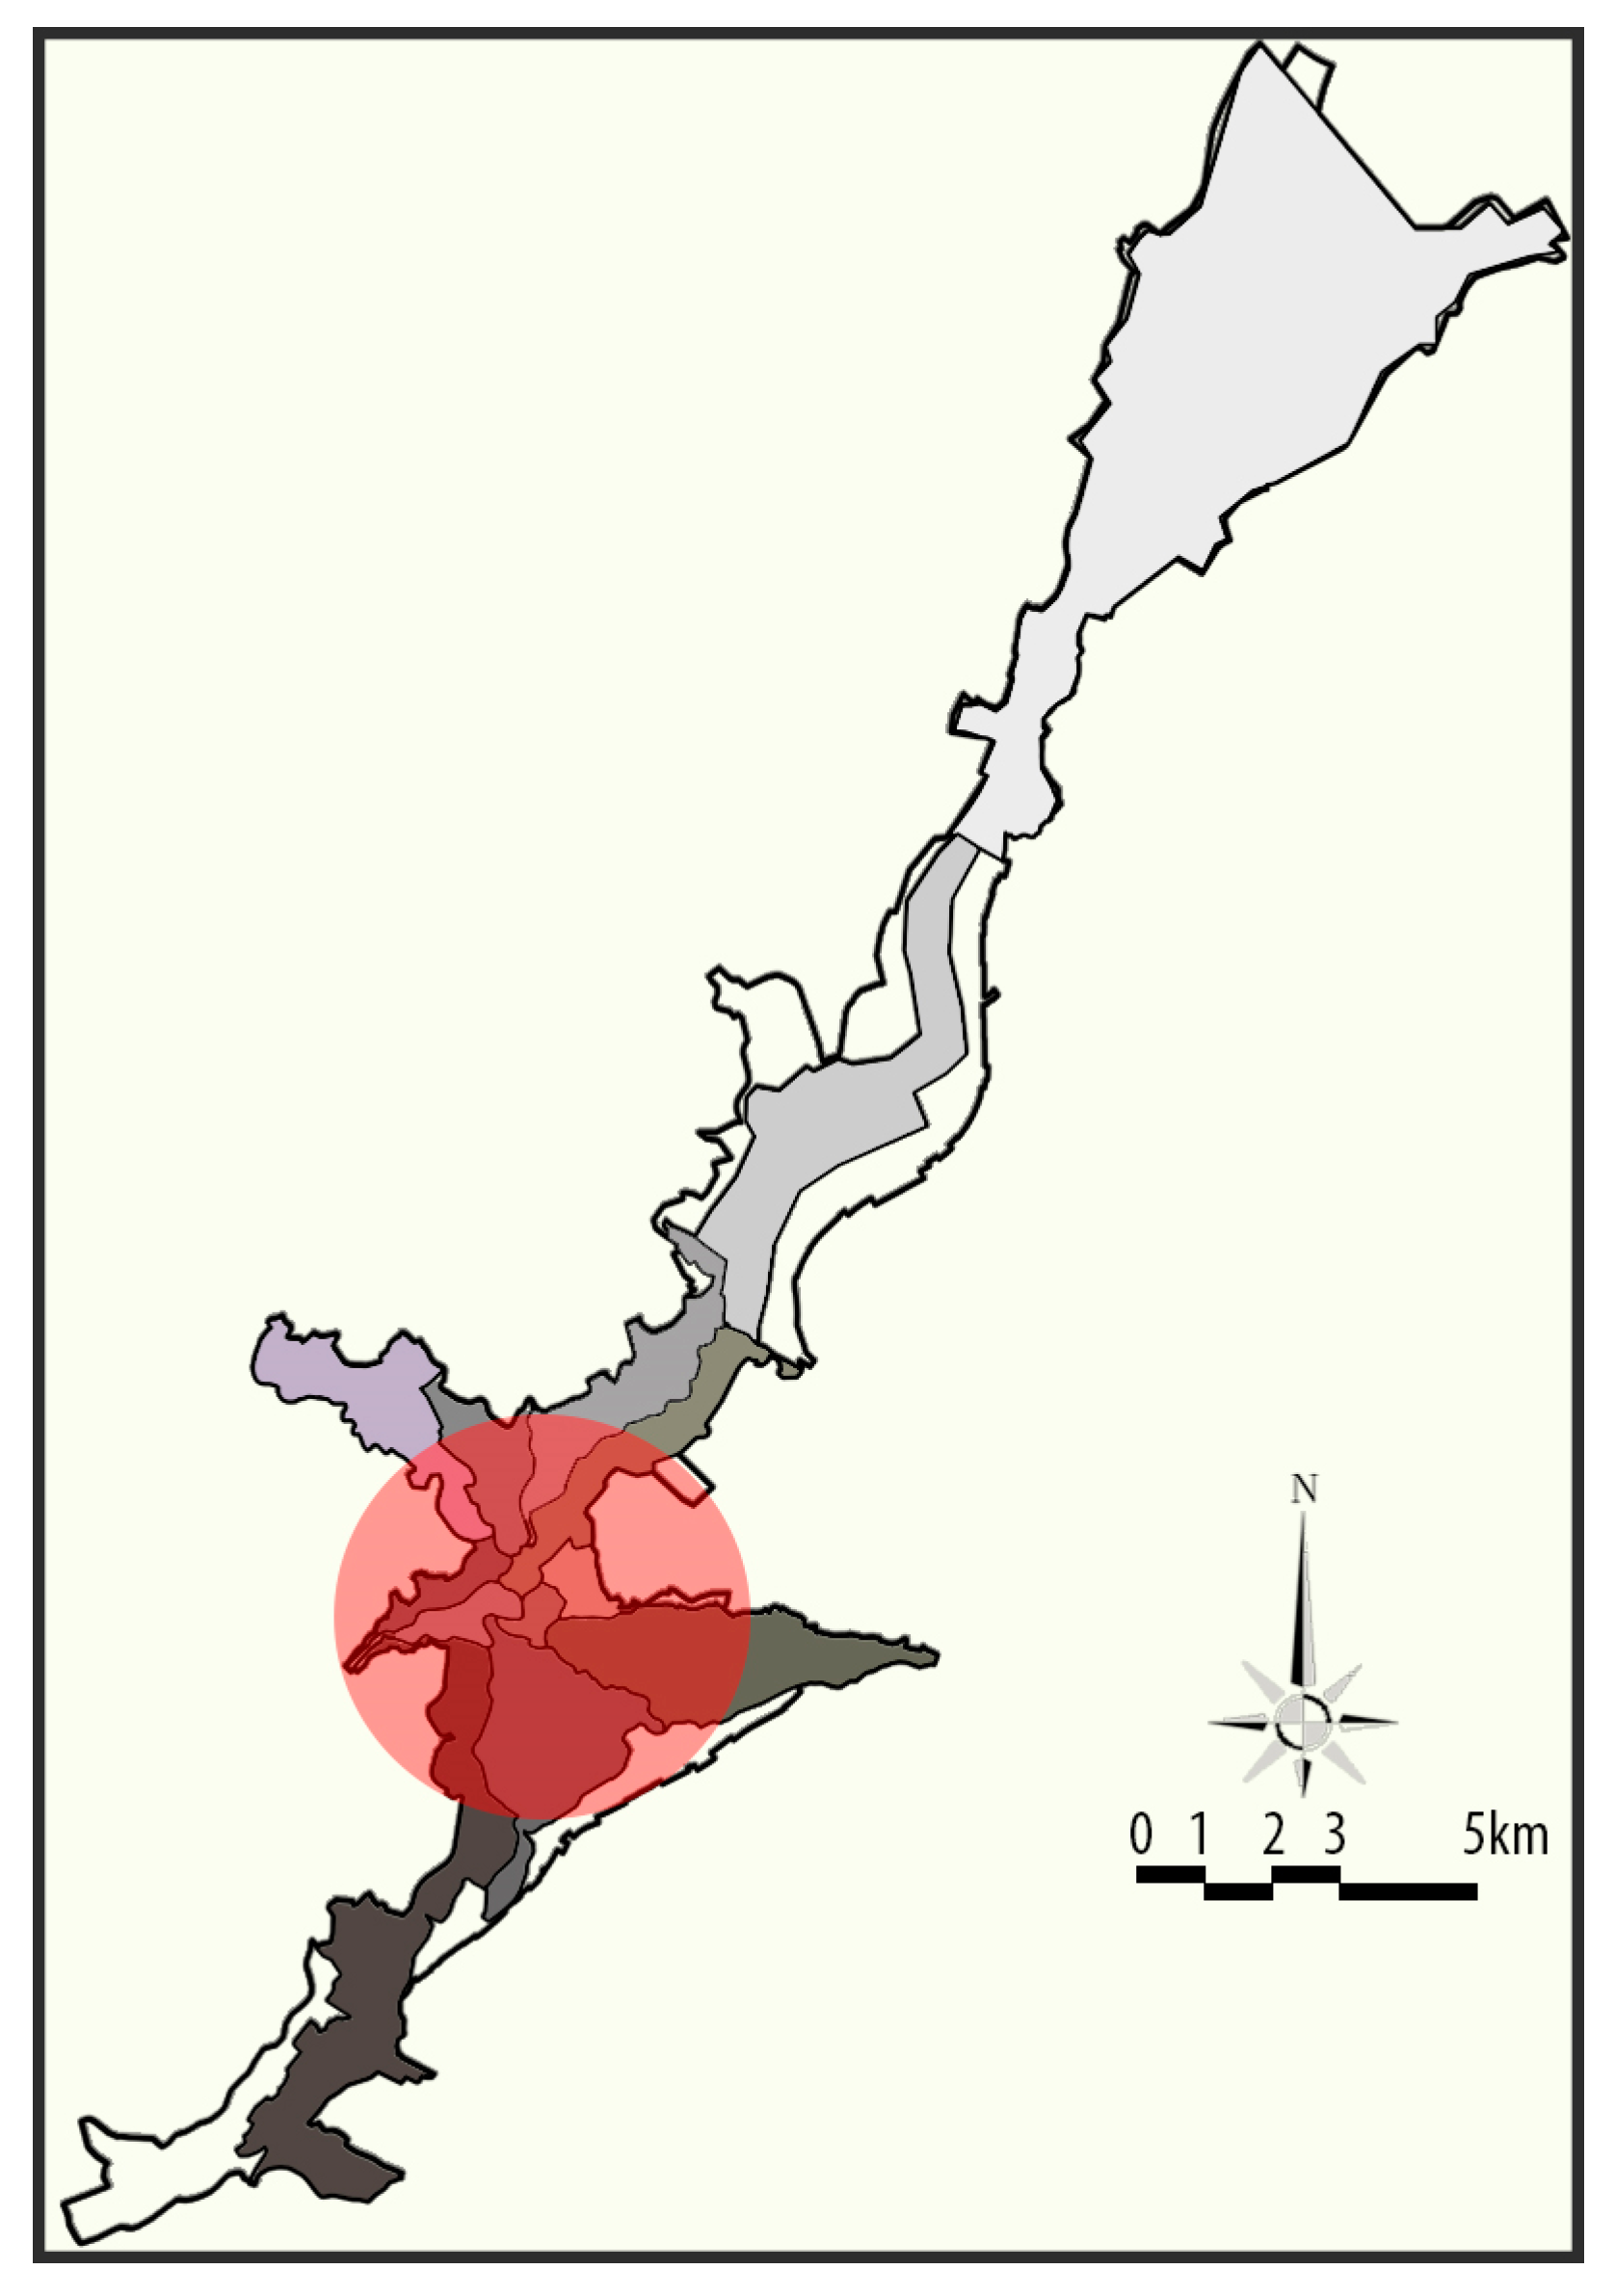
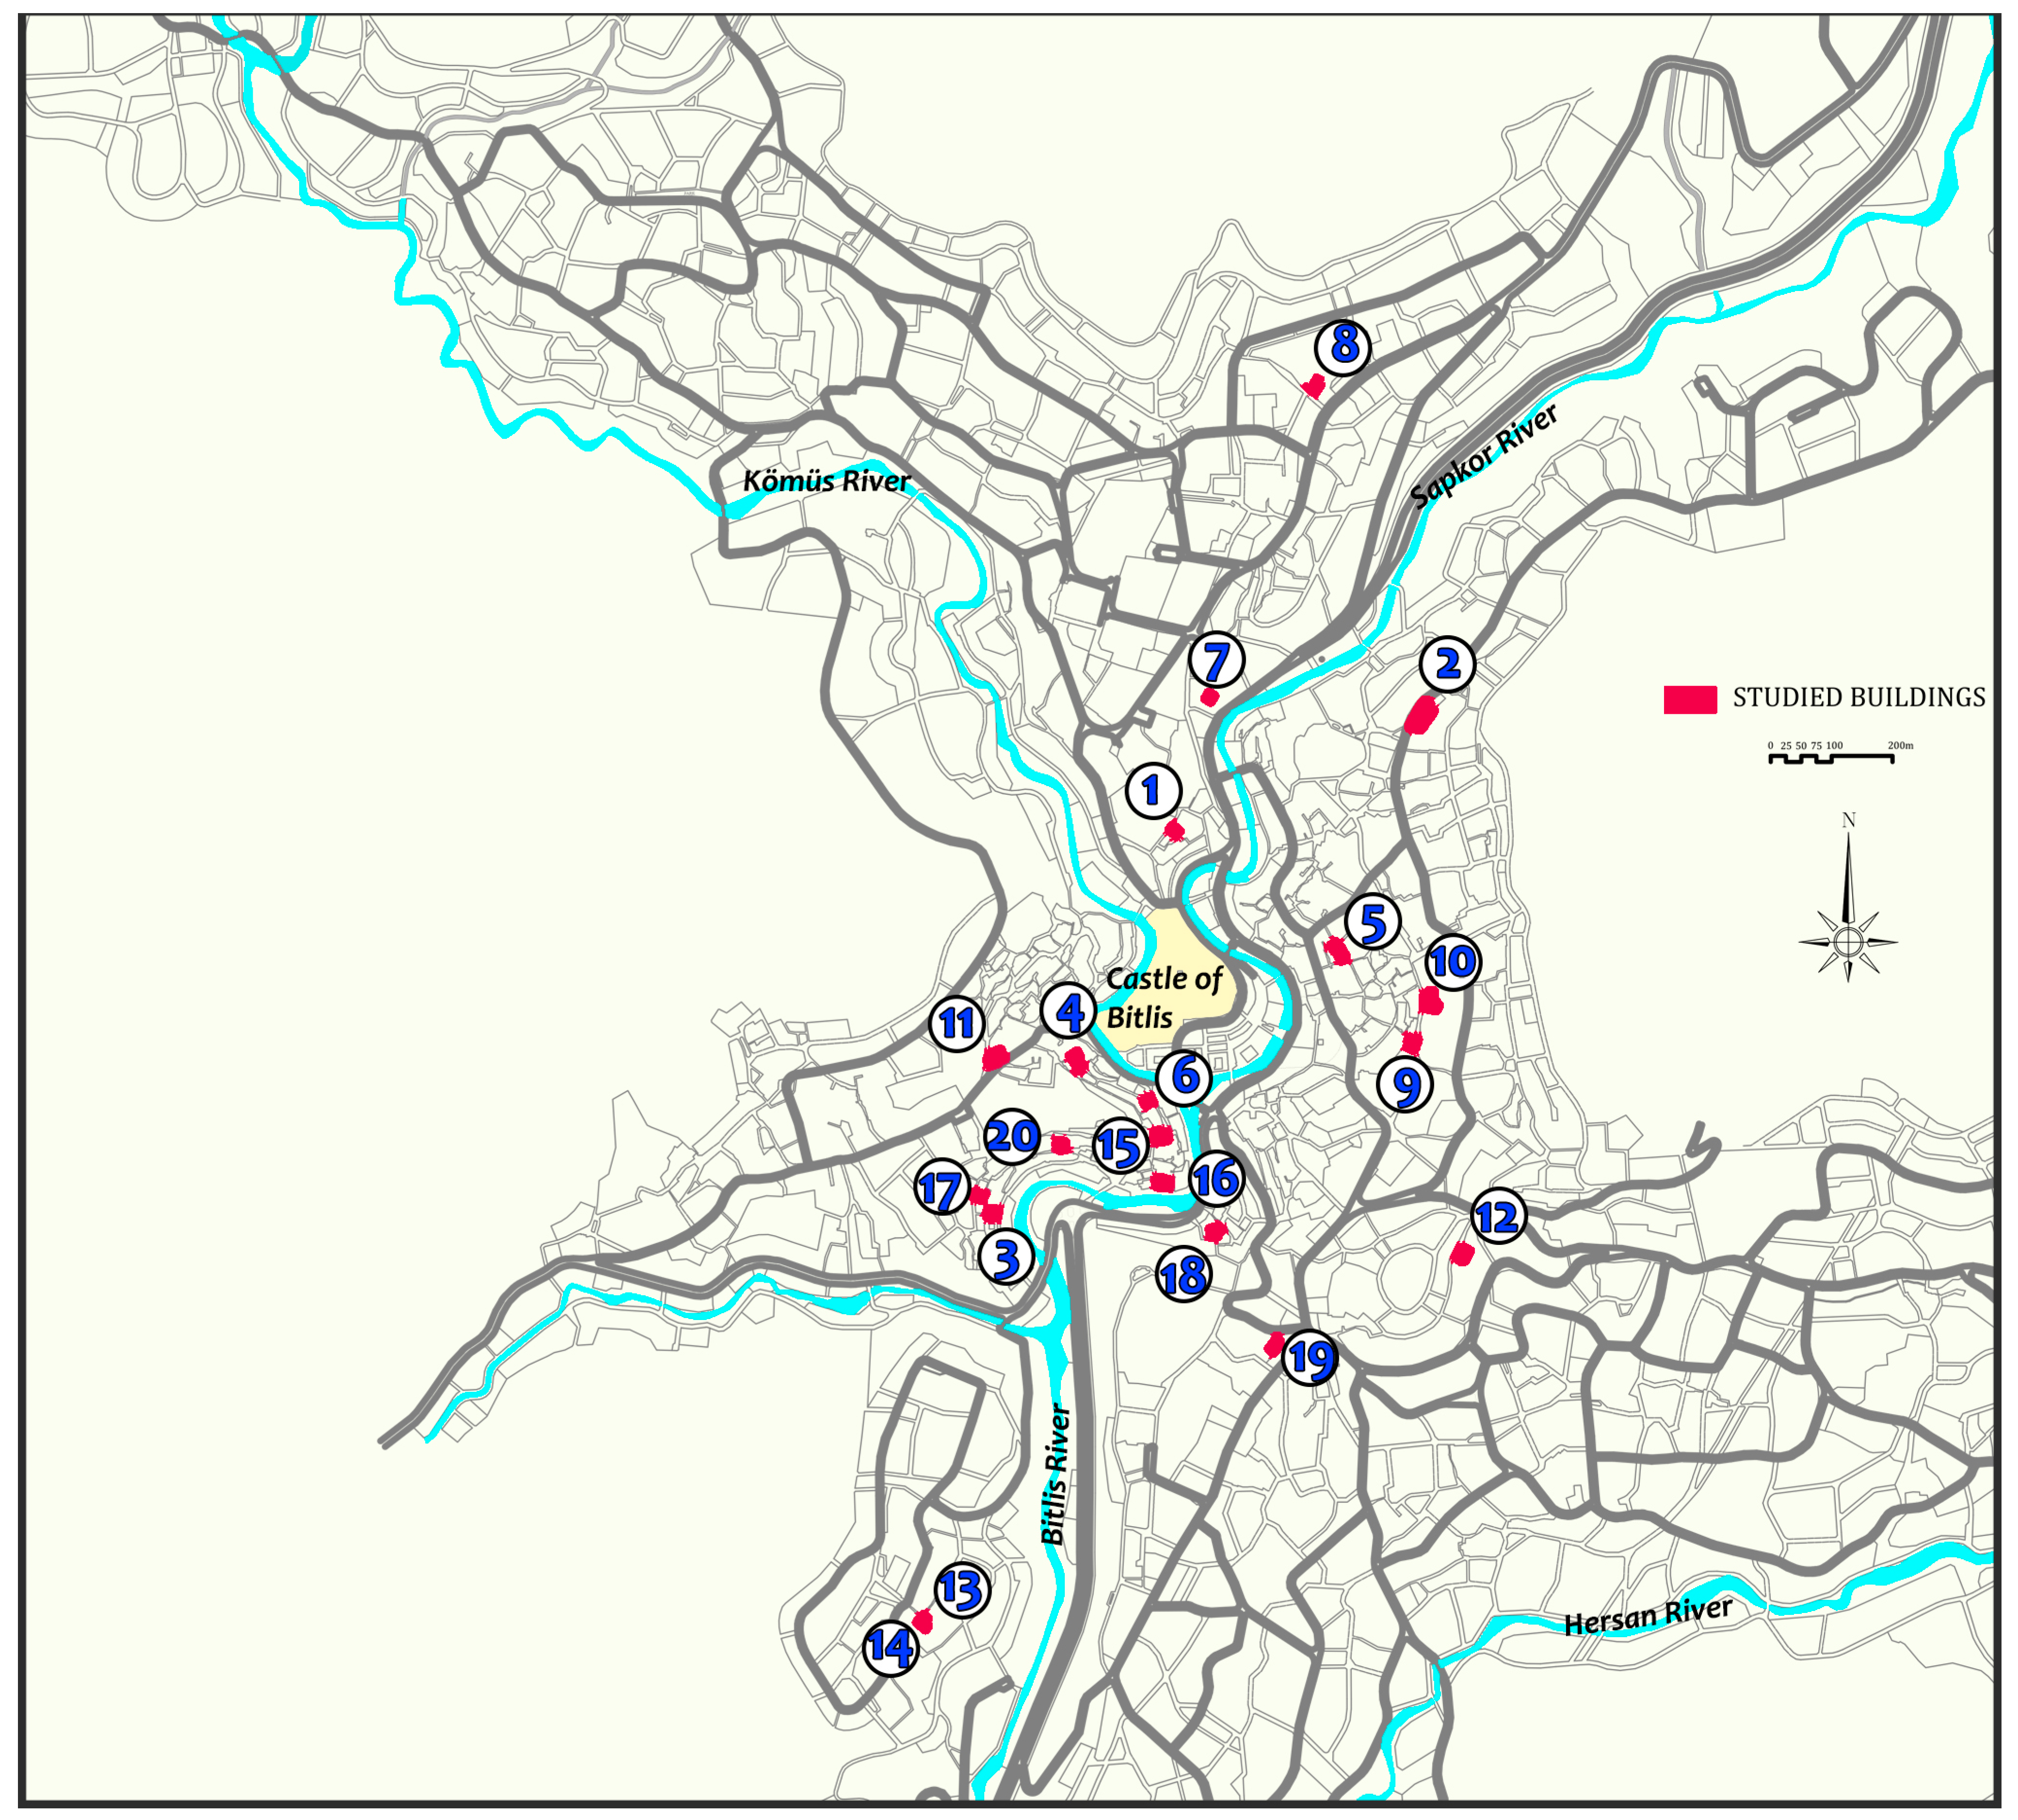
The masonry structures in Bitlis are seen in the first settlement areas of the city (
Figure 1). The settlement in this section is located in the valleys formed by the streams.
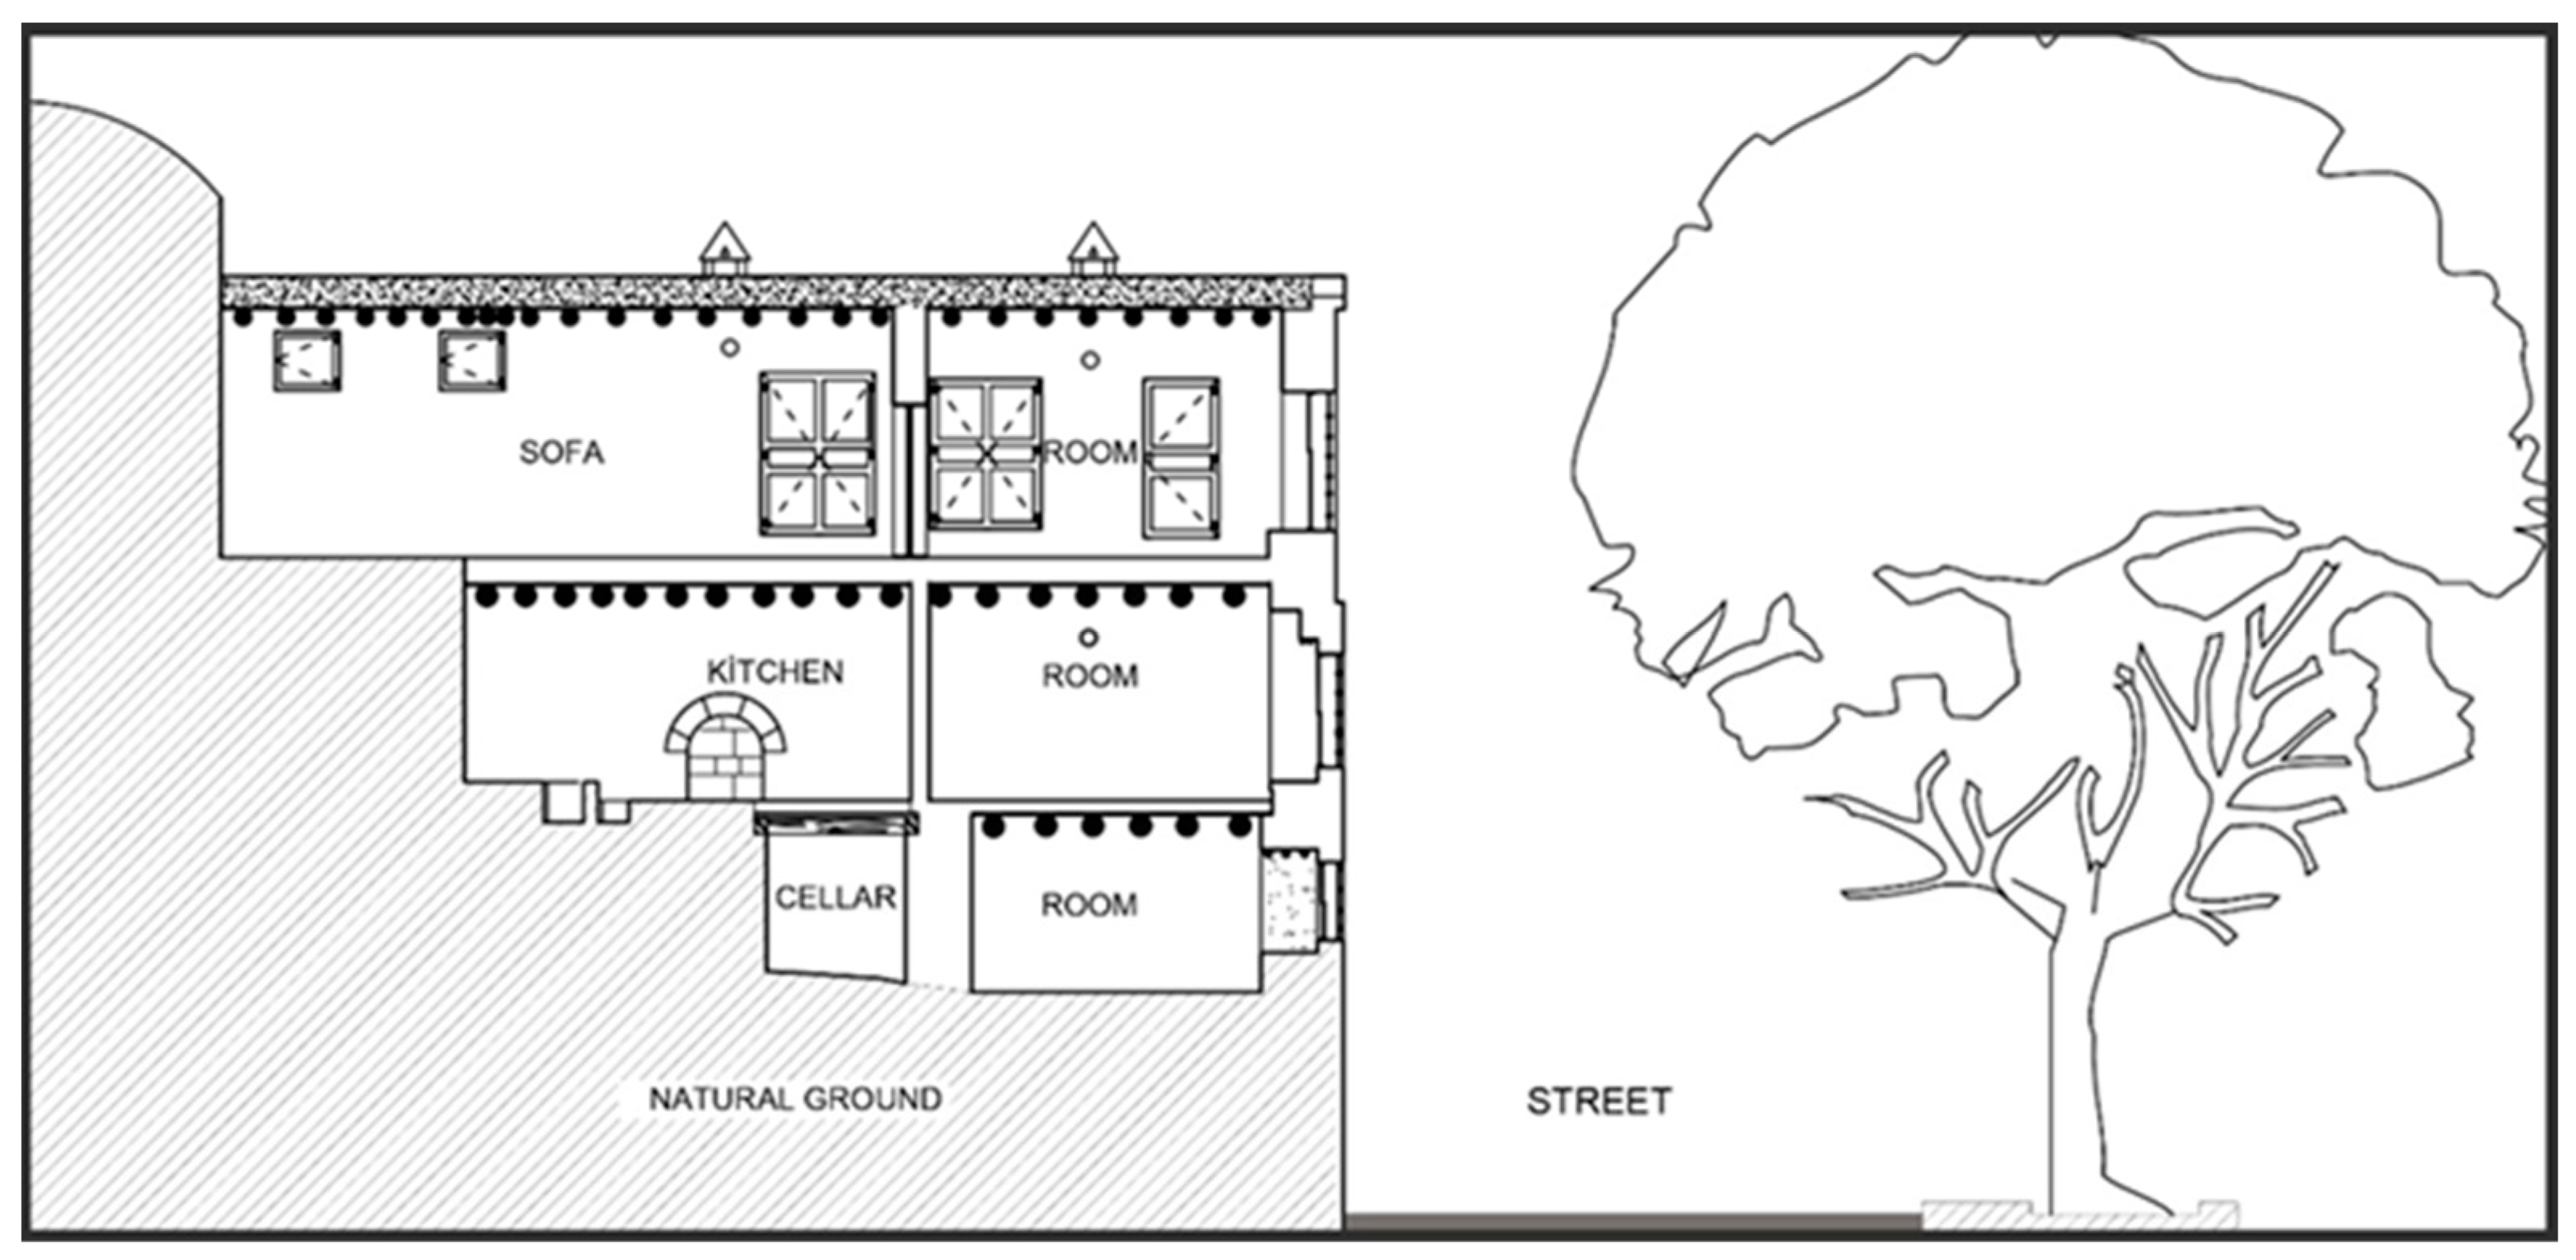
The traditional masonry Bitlis houses have three floors at most. Due to the sloping topography, the floors in the buildings are built by gradual spreading from the ground floor to the top (
Figure 2). In general, each floor can be accessed from the outside. However, there are also examples of vertical circulation from the bottom floor to the top. Due to the harsh climatic conditions, the building openings are small and few. The ornaments and decorations on the buildings consist of inscriptions.
The places where the structures shaped by the natural ground intersect with the rocky ground can be left without a wall. The lower floors are arranged as a barn or side sofa + room. In houses whose ground floor is used as a barn, the bottom of each room is mostly used as an independent unit. If there is more than one floor above, each floor is used as a separate independent unit. The upper floors are built with a middle sofa. The blind facades on the natural ground side are used as service spaces. It is connected to the outside with a small opening in the form of a culvert. Otherwise, lighting is made in the form of a chimney. The kitchen space is constructed together with the sofa; it creates a special area with its hearth and niches. The rooms are placed in sections with open walls so that they are not covered with the land. There are benches in front of the windows in the rooms with window openings that expand from the outside to the inside. Due to the crowded family structure in some houses, there are wet areas in the rooms. There are niches on the walls where beds and diary items are placed.
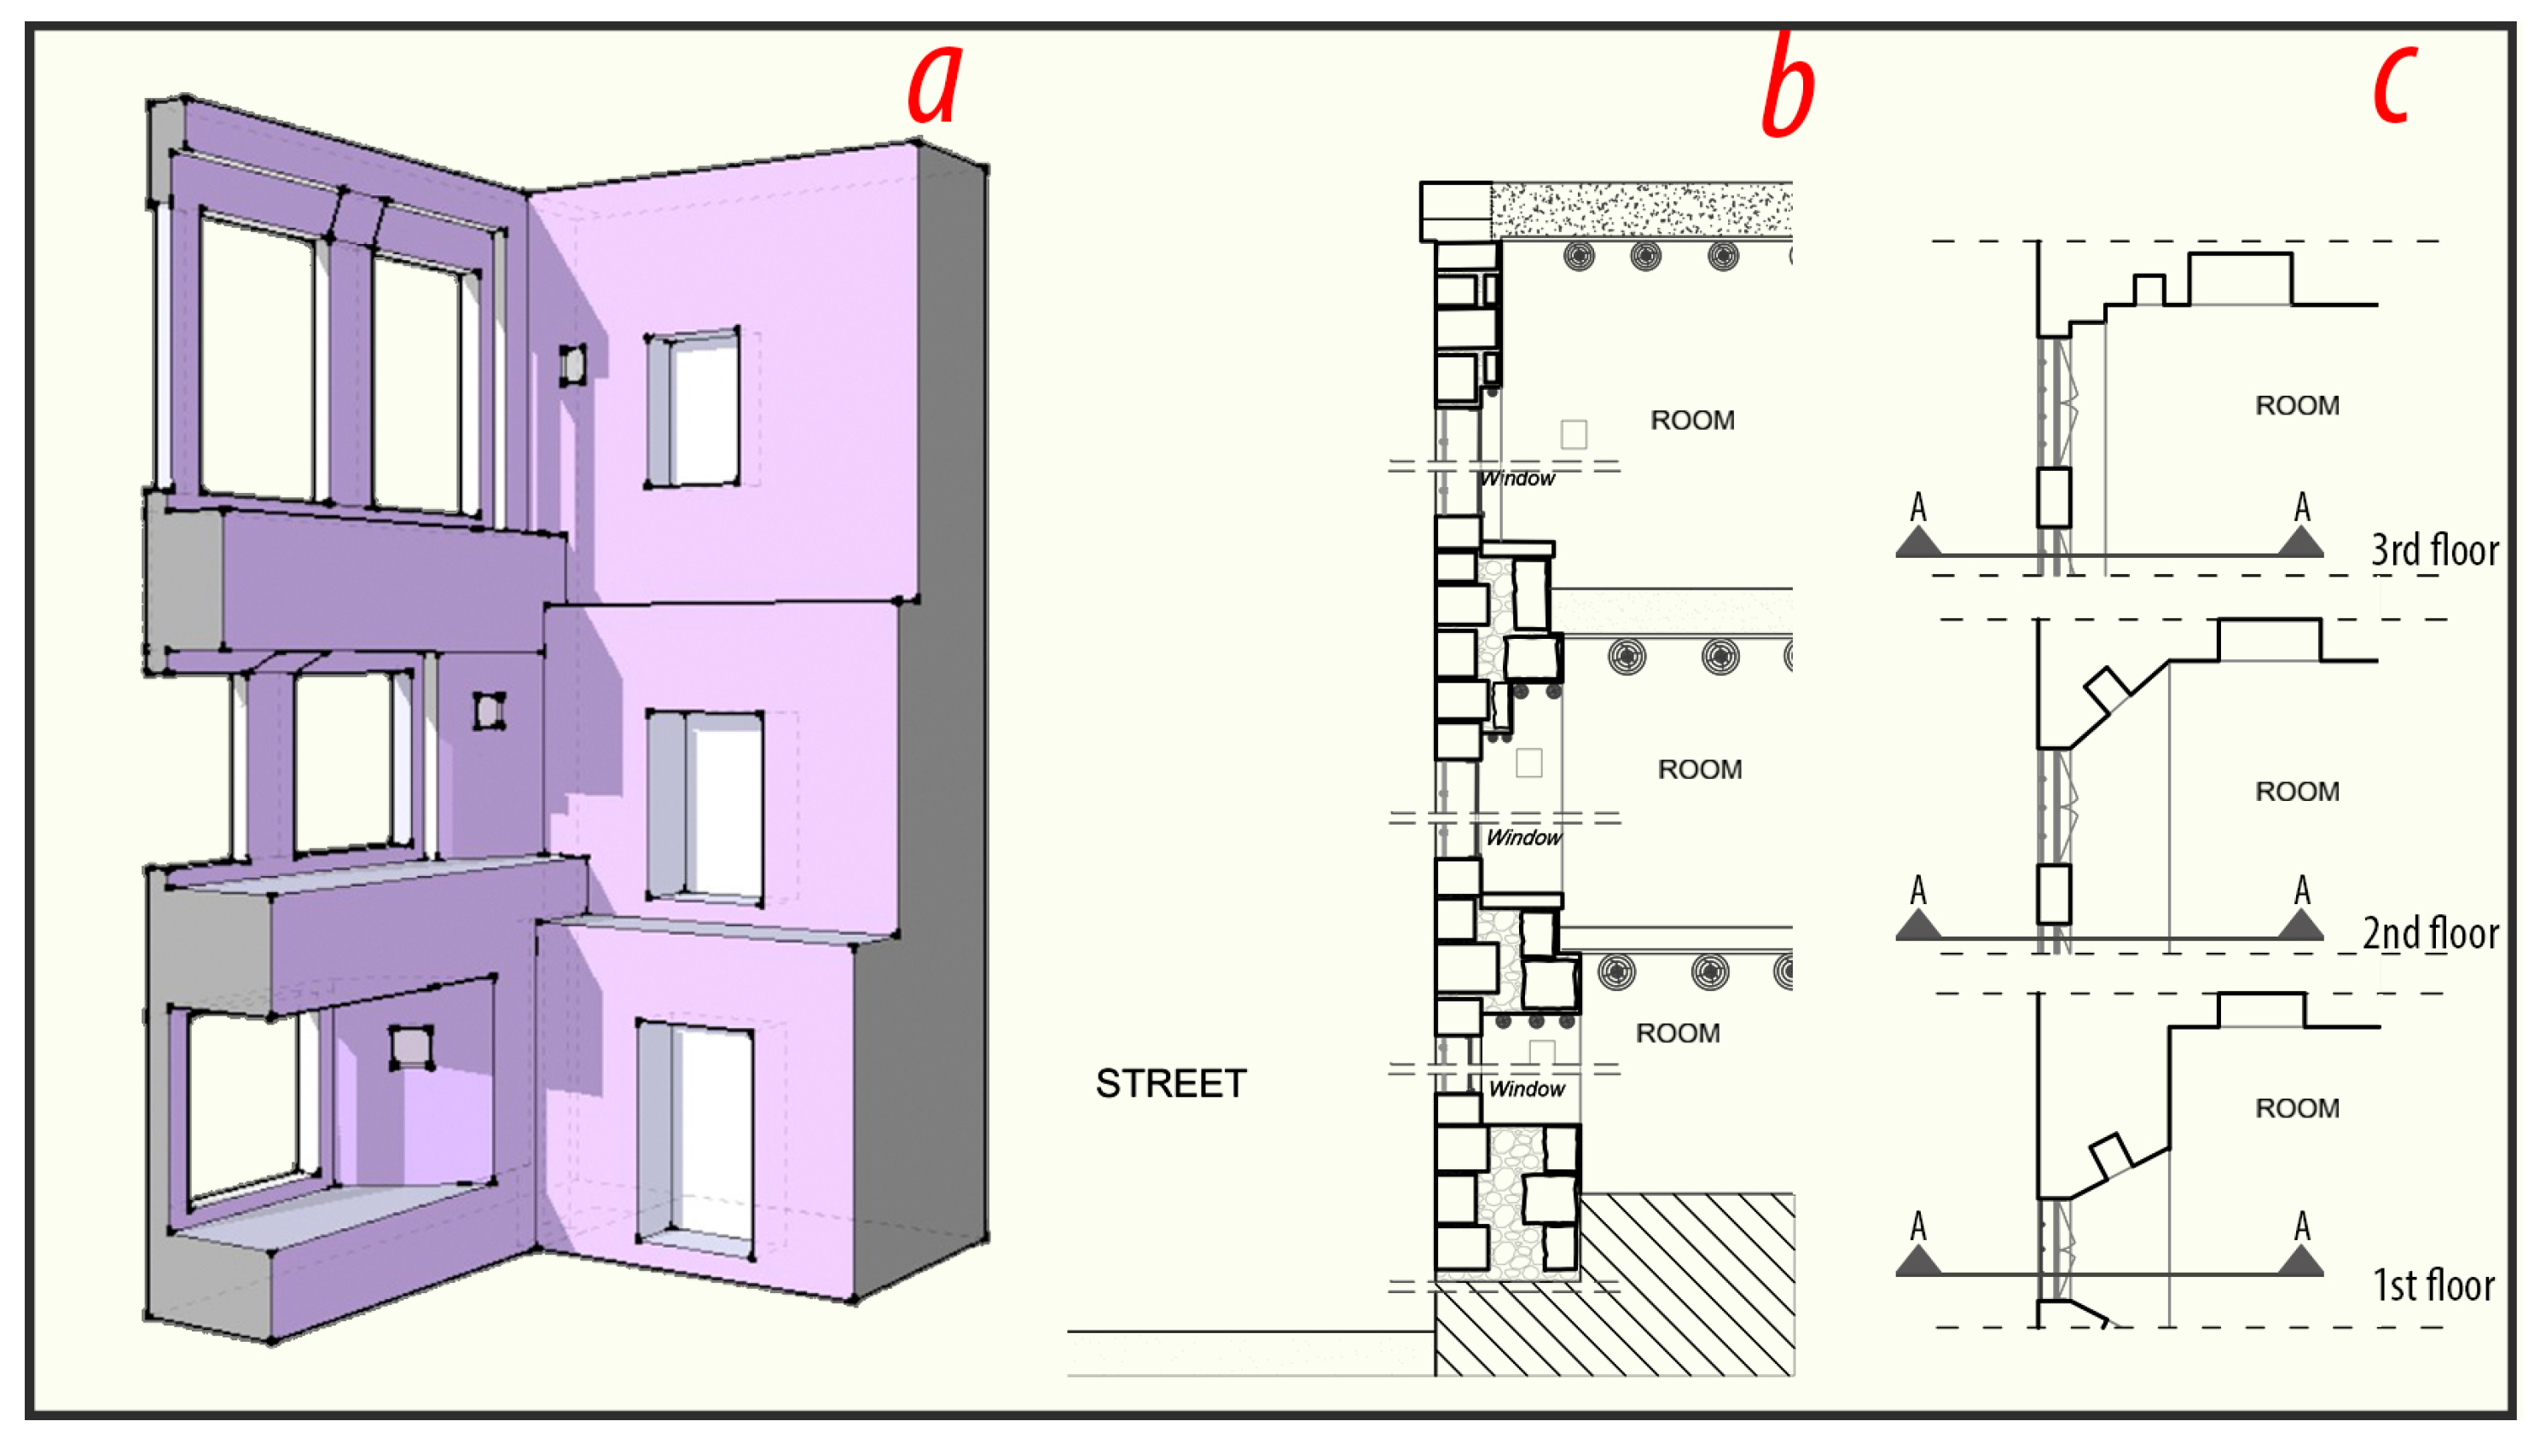
The outer walls of the masonry Bitlis houses are in the form of multi-leaf stone masonry walls (
Figure 3). There is cut stone on the outside, rough-cut stone on the inside, and rubble stone mixed with mortar in the middle. It is built in such a way that the wall thicknesses become thinner from the lower floor to the upper floor (100 cm to 75 cm). Although the separating walls in the interior of the space are mostly built with a similar method, the wooden Bağdadi construction (lath technique) is also seen [
38,
39].
Although the mezzanine floors are vaulted in relatively qualified buildings, they are mostly built with wooden beams. Thin twigs, reeds, and wood veneer boards are added to the wooden beams. In some houses, it is also possible to make a stone coating on them. The top cover, which is built with a flat earth roof, is also built with wooden beams. On the top of the upper floor slab, which has a similar structure, soil fill called “Püsürük” and local soil called “Seg” filled with salt–straw–limestone are used.
3. Observational Structural Analysis in Traditional Bitlis Houses
Bitlis Stone, with its local name, was used in traditional Bitlis houses. Bitlis stone is considered to be a pyroclastic rock formed by the volcanic lavas from the explosion of the Nemrut crater in the past, spreading and cooling in the region [
40]. These ignimbrites are very sensitive to chemical and physical degradation. It is partially soft under the ground and hardens when in contact with air. The desired shapes can be readily given to the soft Bitlis stone by hand or machine. In addition, due to its porous structure, the Bitlis stone shows a certain degree of insulation if water absorption is prevented [
41].
Bitlis City, in addition to being the province with the most snowfall in Türkiye, is located in a geography where temperature differences are high [
42,
43]. Snowfall generally starts in the first week of November and continues until the middle of the spring season. In the last week of April, the precipitation leaves its place to the melting process of the accumulated snow. The fact that the precipitation period is so long during the year increases the risk period in Bitlis [
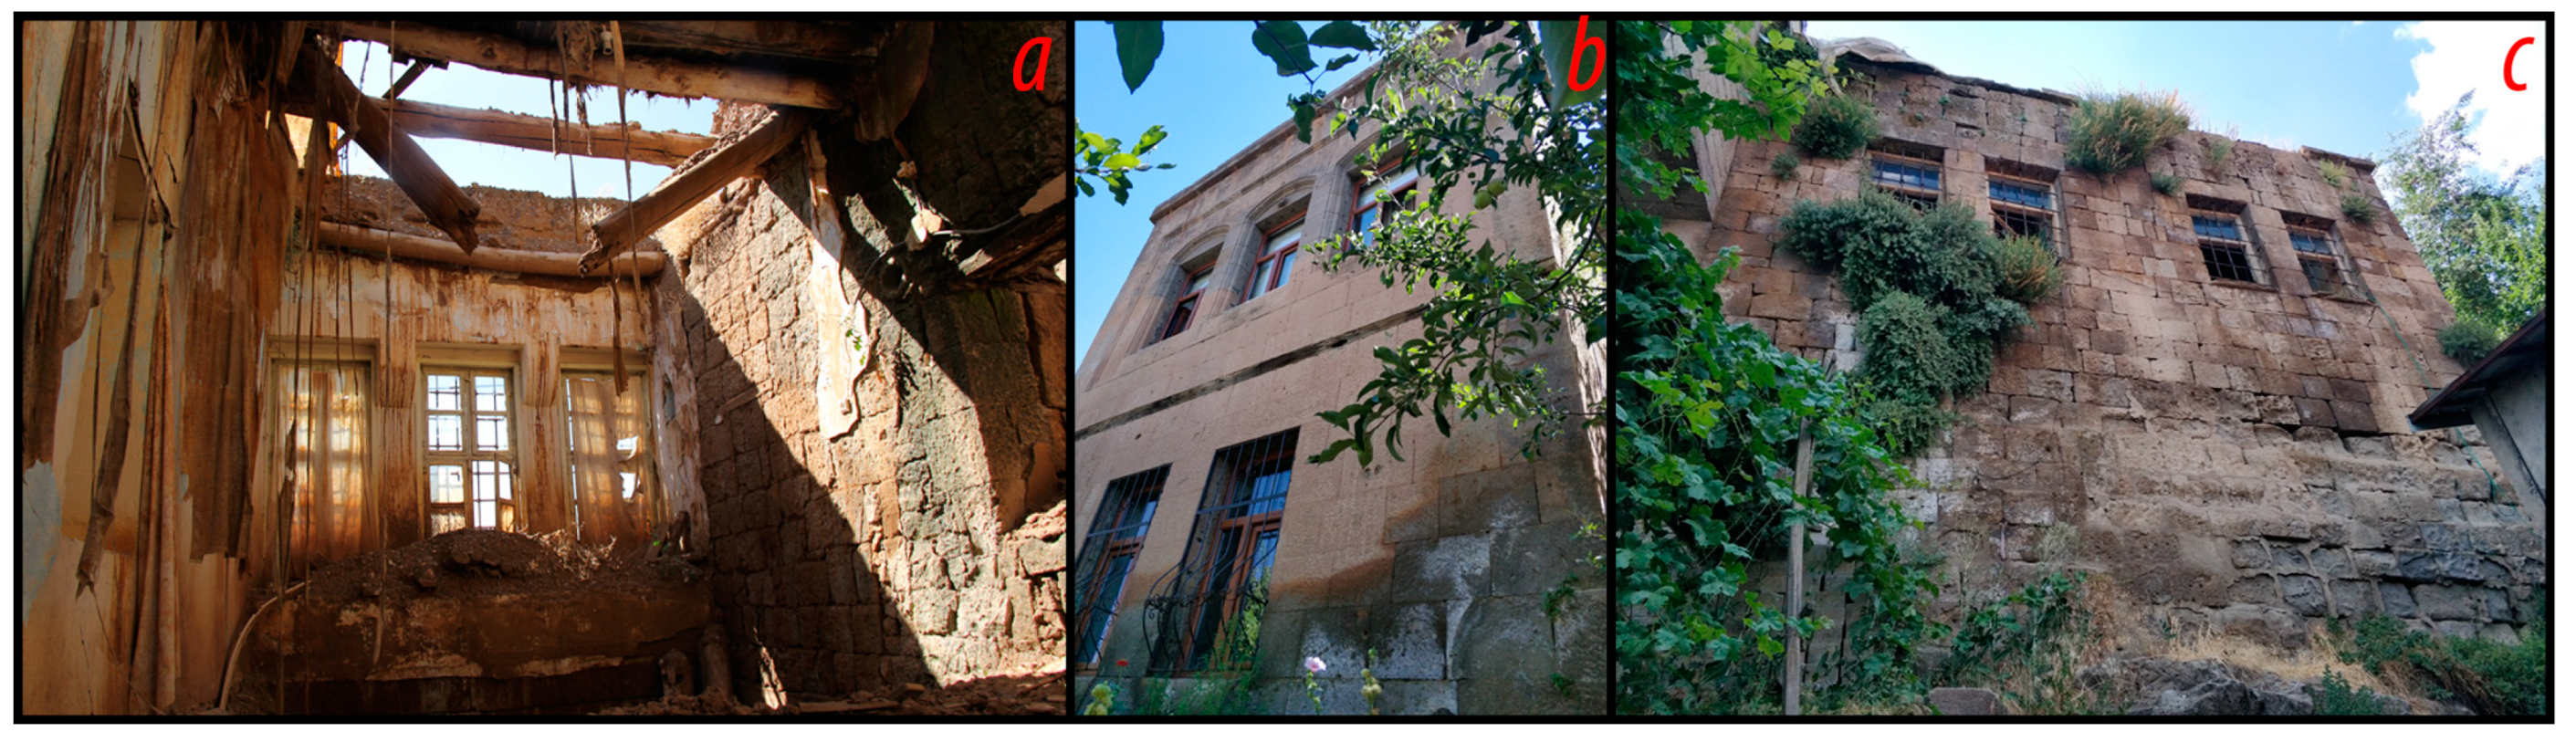
44]. Due to these reasons, various types of damage occur in Bitlis houses. In addition, various damages have occurred due to other environmental factors such as rupture and wear, depending on time. In these structures, which do not receive any engineering services, additional damages are observed due to precipitation, since no water isolation is applied to the ground. Water alone or together with other environmental factors negatively affects the mechanical properties of the building blocks and accelerates the degradation. It is known that due to temperature differences and frost events, some of the structures cause disintegration and rupture. Moisture-induced deterioration is observed in the sections of the stone texture that come into contact with water. The freeze–thaw cycle, which is effective in cold periods, is one of the most significant factors in the deterioration of structural materials, especially in Bitlis City, where the winter season is long. Depending on the seasons dominated by the dry climate, lichen formations attract attention. Lichen formations can have negative effects on the appearance and characteristics of the natural structure over time. There are calcifications in some of the structures examined due to excessive precipitation. It is observed that there are wear and mass losses in the wall joints. In addition, one of the common features of Bitlis stone is color change and discoloration with the impacts of natural conditions over time. Discoloration was observed in nearly all the examined structures. Since the soil properties are good in the examined structures, it has been observed that there is almost no ground consolidation over time.
In general, soil roofs are preferred in Bitlis masonry houses, which cause significant damage due to excessive snowfall. In some cases, depending on the degree of damage, structures become unusable over time. Damage to the structures due to roof leaks or collapses and the premature end of their useful life cause the homeowners to leave the buildings. Due to the official process for the repairs, it is not repaired and the house is in ruins over time. It is not possible to regain the houses that started to disappear over time because they are not used and maintained. Some images of the damage observed in the examined structures are shown in
Figure 4.
4. Determination of Seismic Parameters for Selected Structures
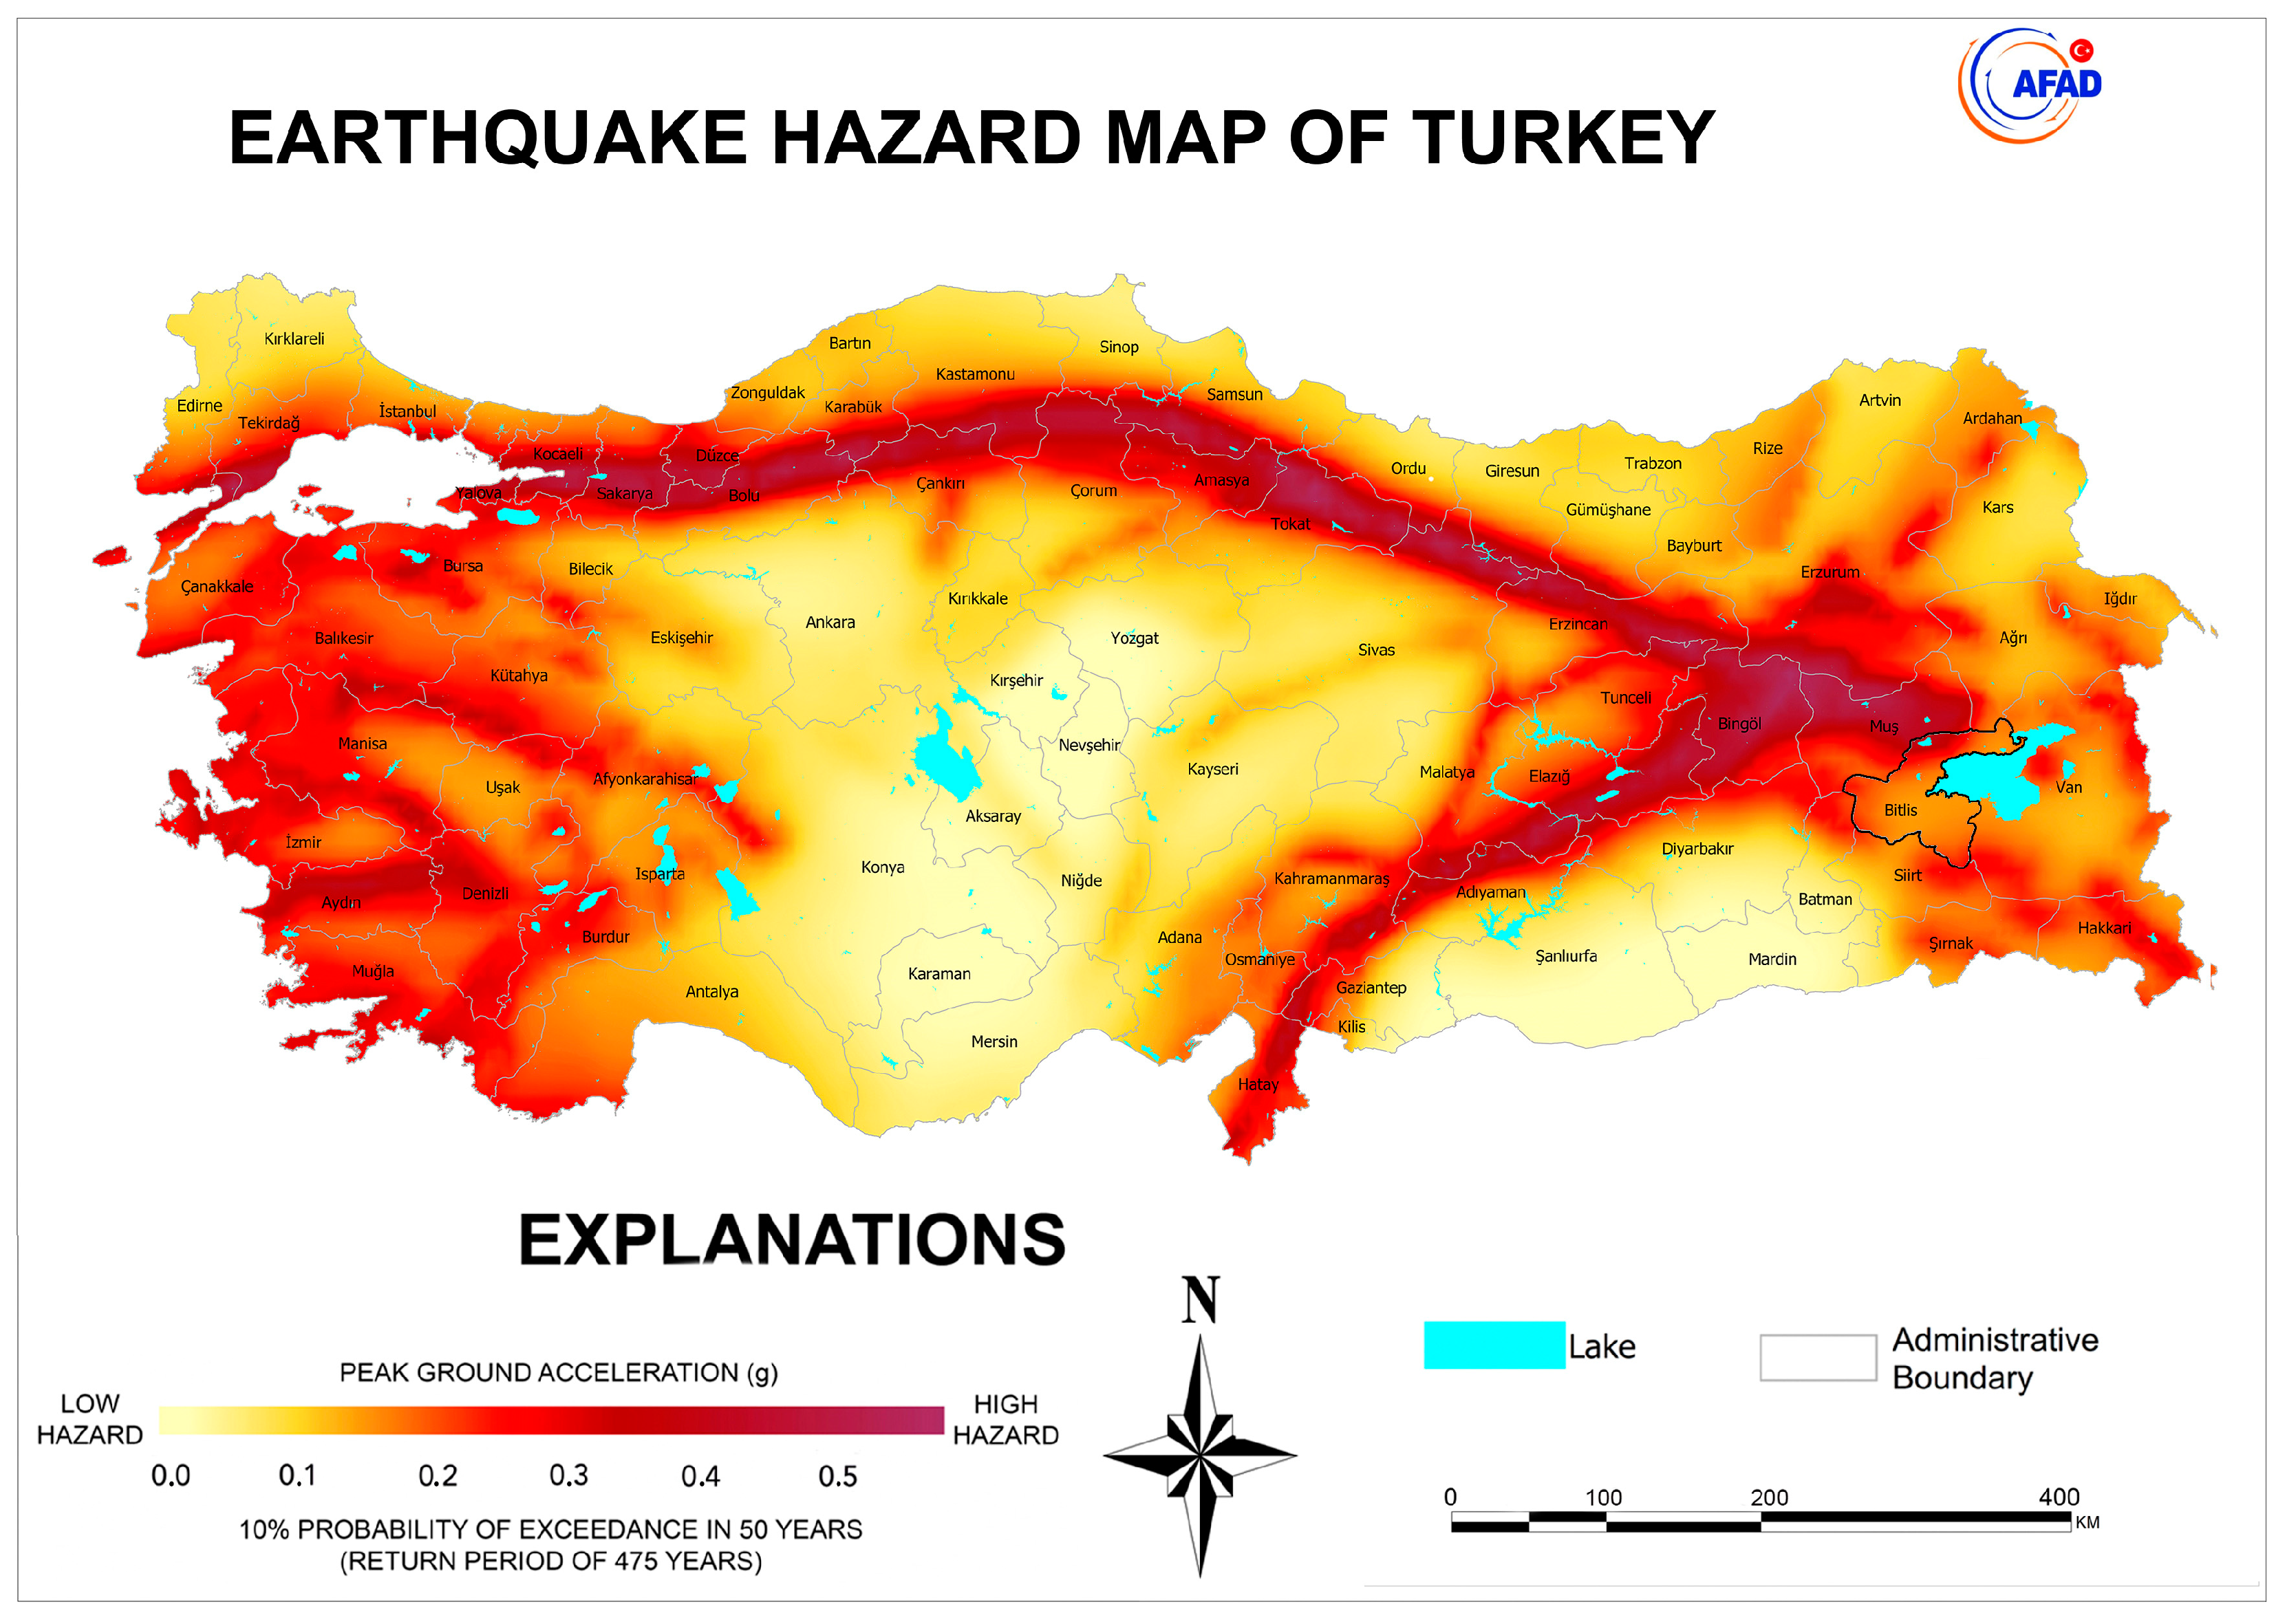
Lake Van basin is one of the regions where current seismic activity is intense in Türkiye. The earthquakes and losses that occurred in this basin again revealed the seismicity risk of the basin. Earthquake hazard maps renewed in 1945, 1947, 1963, 1972, and 1996 in Türkiye, where the basin is located, were last updated in 2018 and entered into force in 2019 [
45]. With the current earthquake map, the earthquake hazard has now started to be calculated specifically for the geographical location. The current map is shown in
Figure 5.
A number of parameters are needed for the calculations of buildings under earthquake loads, and these values can be obtained with the help of the Türkiye Earthquake Hazard Maps Interactive Web Application, which was created together with the TBEC-2018 that came into force in 2019 [
18]. The peak ground acceleration (PGA), peak ground velocity (PGV), map spectral acceleration coefficients (S
S and S
1), local ground effect coefficients (F
S and F
1), design acceleration spectral coefficients (S
DS and S
D1), and horizontal and vertical design spectrums can be obtained with the help of this application, for any geographical location, taking into account different earthquake ground motion levels and different local soil classes. This application cannot be used if the soil properties are very bad, that is, if the local soil class is ZF. In this study, seismic parameters were obtained by considering the geographical location of each masonry structure using the mentioned application. In the TBEC-2018, the earthquake ground motion level is expressed in four different ways, unlike the previous regulations. The earthquake ground motion levels used in the study are given in
Table 1. The earthquake parameter values were calculated separately for four different earthquake ground motion levels.
A comparison of the PGA and the PGV values for different earthquake ground motion levels for each of the locations of twenty masonry buildings using the Türkiye Earthquake Hazard Maps Interactive Web Application is shown in
Table 2.
A comparison of the short-period map spectral acceleration coefficient (S
S) for various earthquake ground motion levels and map spectral acceleration coefficient (S
1) for a 1.0 s period using the same application is shown in
Table 3.
The same local soil conditions and the fact that the buildings are very close to each other in all examined structures caused the earthquake parameters calculated in
Table 2 and
Table 3 to be quite close to each other. For the probability of exceedance of 10% in 50 years, the PGA value is calculated as 0.27 g. It should be noted that there will be significant differences between these values for different local soil conditions in different regions. The local soil classes for the masonry buildings examined were obtained from the soil surveys made by the relevant public institutions and organizations; the ZB local soil class properties are shown in
Table 4.
Considering the ZB local soil class, the earthquake parameters obtained with the help of the earthquake application are shown in
Table 5.
5. Turkish Rapid Assessment Method for Masonry Buildings
The loads in the masonry buildings are carried to the load-bearing walls and are constructed to be transferred to the ground through the walls. The wall thicknesses are considerably higher than the wall thicknesses in reinforced concrete structures. The inner and outer walls of the structure are created as a result of stacking local materials on top of each other and assembling them with a binding material. Masonry materials such as brick, adobe, stone, etc., are utilized in the vertical structural members (columns and walls) of masonry systems, and the dominant stress type of the system is pressure. The tensile strength of the materials used in masonry structures is low and the compressive strength is high. Therefore, these members, which can withstand high compressive forces, are not resistant to the effects of shear and bending forces [
46,
47,
48,
49,
50,
51,
52,
53,
54]. In this context, determining the risk priorities of masonry structures becomes more important.
Simplified methods that can be used in the rapid evaluation technique, which is used to define risk priorities, are specified with their details. The parameters to be considered with this technique and how the structural result scores should be calculated are specified discretely for various types of buildings. Within the scope of this study, risk priorities were determined among twenty building samples using the rapid assessment technique determined for masonry buildings in the Turkish Rapid Assessment Method. This method can be used for existing masonry structures between one to five floors. The parameters required to use the method are given below. In this method, firstly, the design spectral acceleration coefficient (
SDS) is determined using the Türkiye Earthquake Hazard Map depending on the earthquake ground motion level. Standard earthquake ground motion level (DD-2) is taken into account, where the probability of exceedance is 10% in 50 years and the corresponding recurrence period is 475 years. The geographical location of each building on the map and
SDS values for DD-2 are obtained. The
SDS values, earthquake hazard zones, and base score values according to the number of floors are shown in
Table 6.
With this method, a base score is obtained and each negativity parameter is reduced from this base score. Within the scope of this study, the negativity parameters taken into consideration for masonry structures in the Turkish Rapid Assessment Method are explained in detail below:
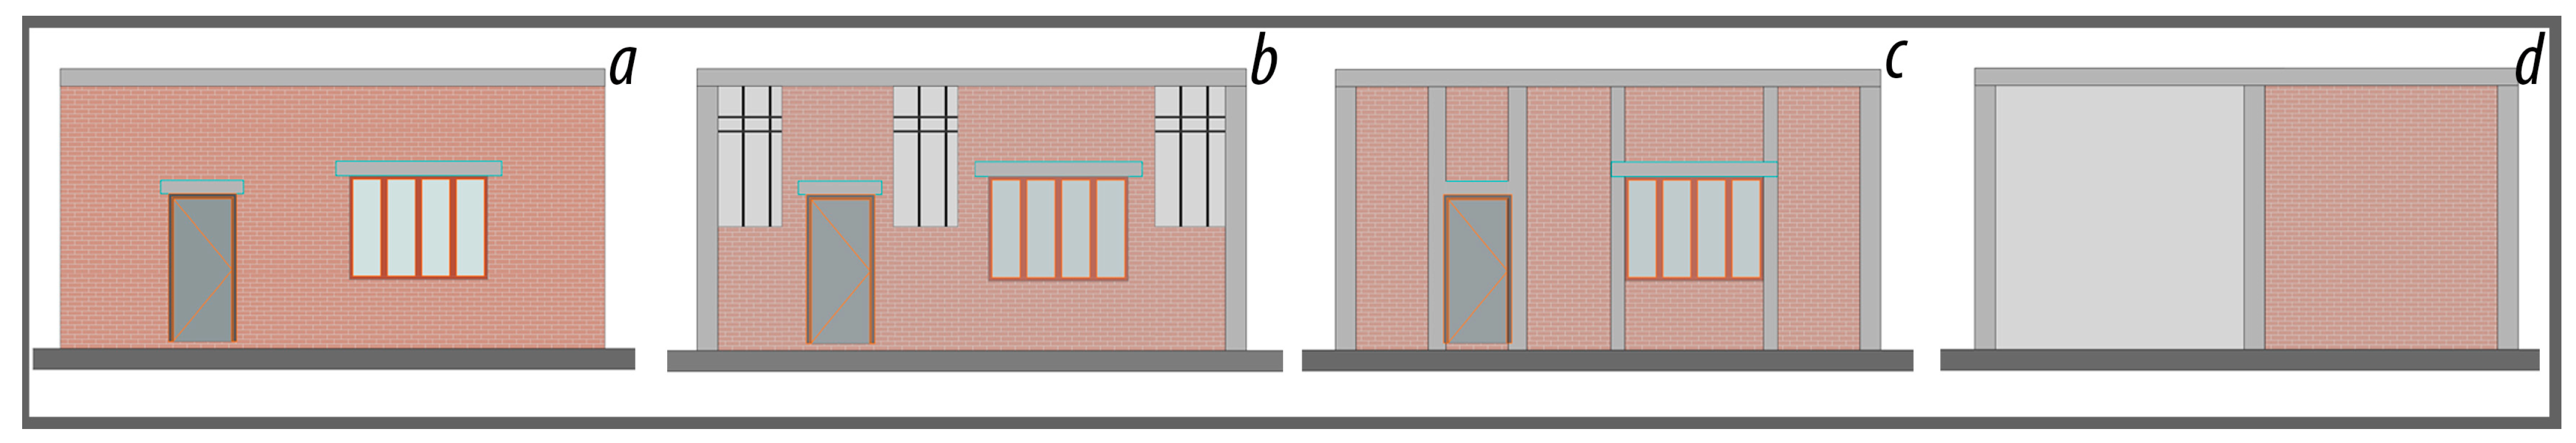
Masonry building type: By determining the structural system of the building, one building type such as unreinforced masonry, reinforced masonry, contained masonry, and mixed (masonry wall and reinforced concrete frame) system is selected as the building system (
Figure 6). All examined masonry structures were considered unreinforced masonry structures.
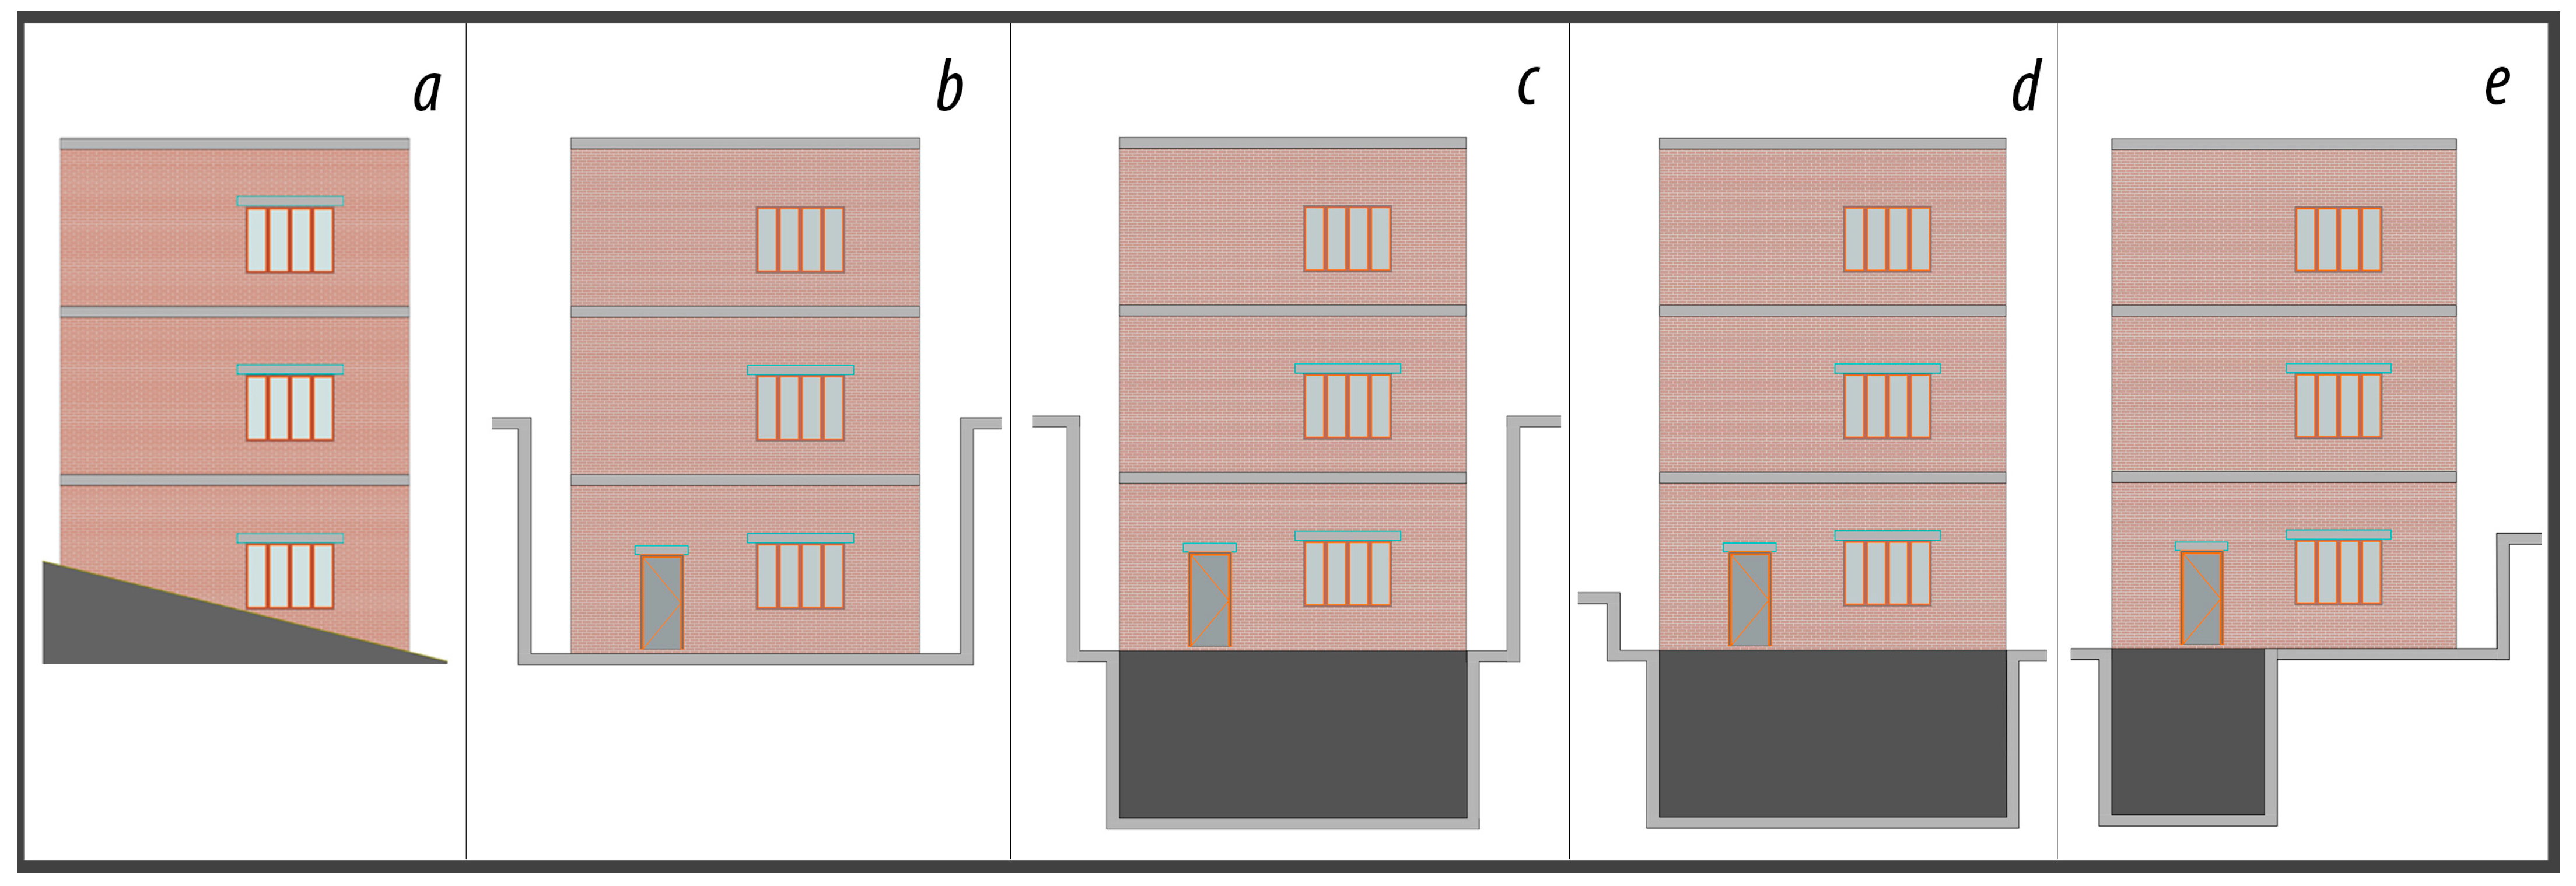
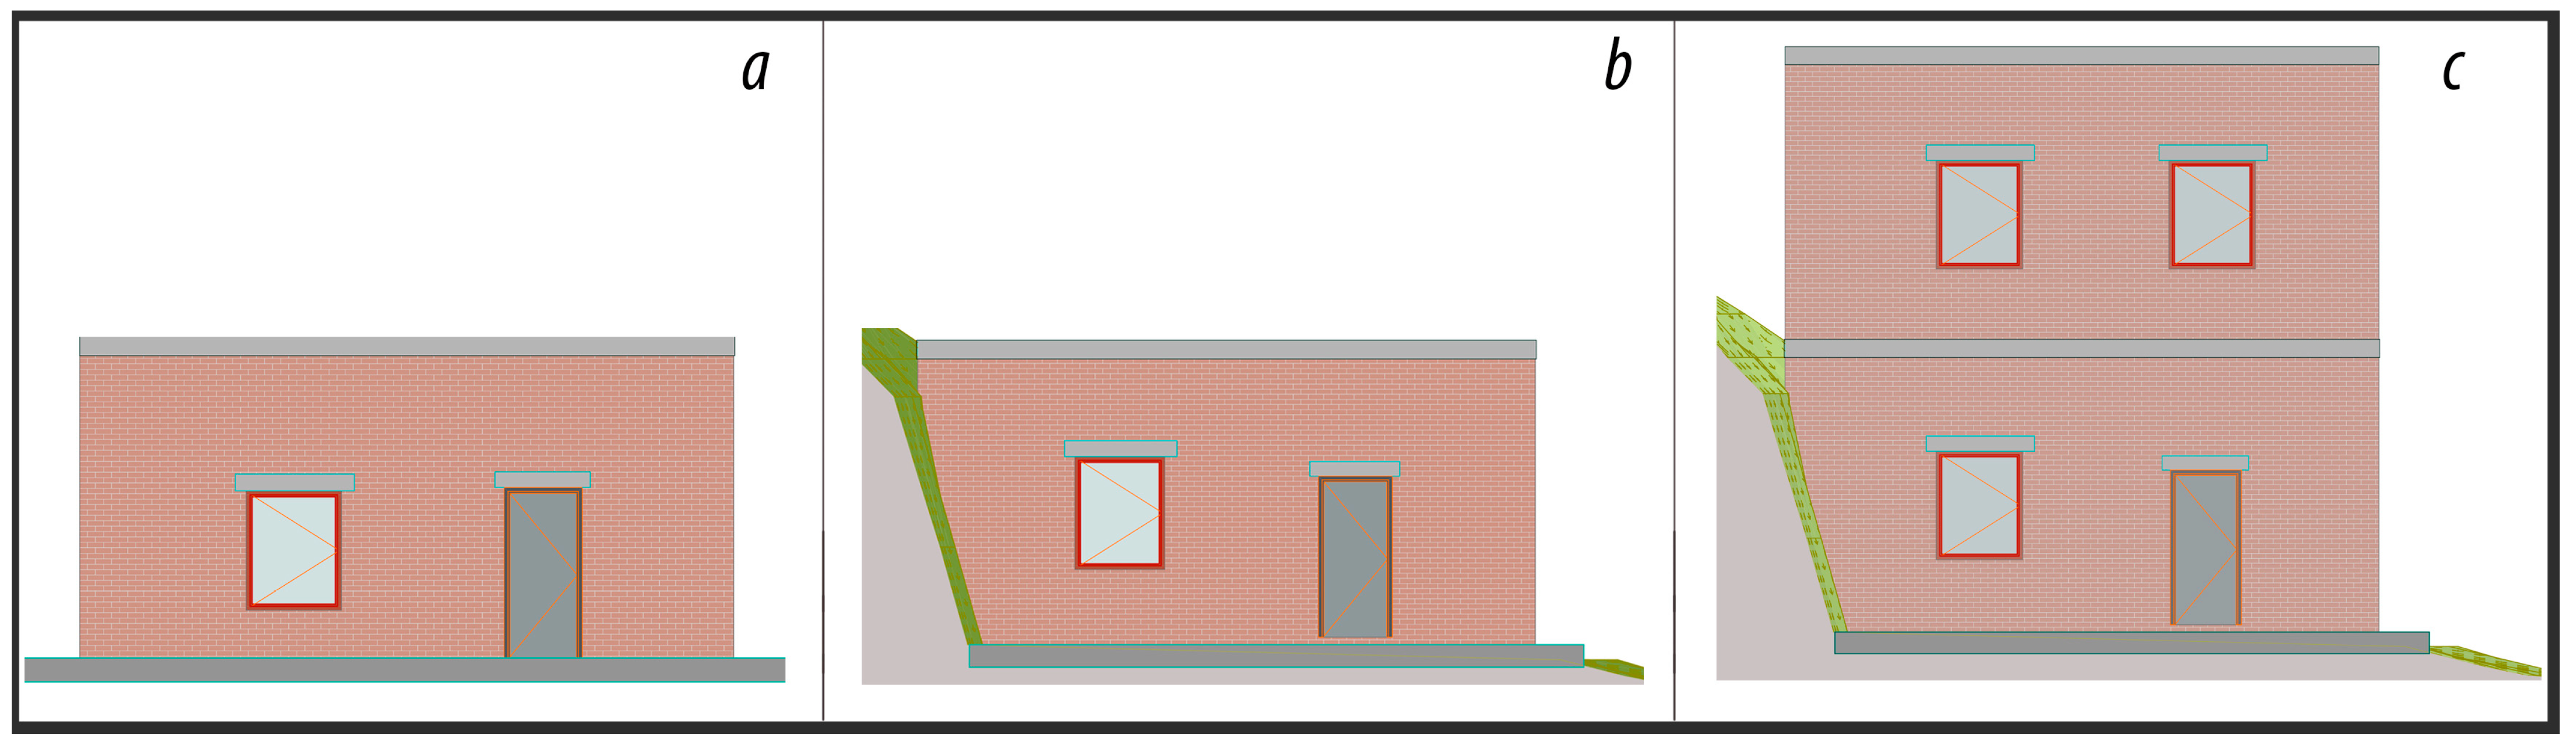
Number of free stories: The facade with the highest number of floors starting from the ground is taken into account as the number of free floors. The determination of the number of free stories belonging to different situations is given in
Figure 7.
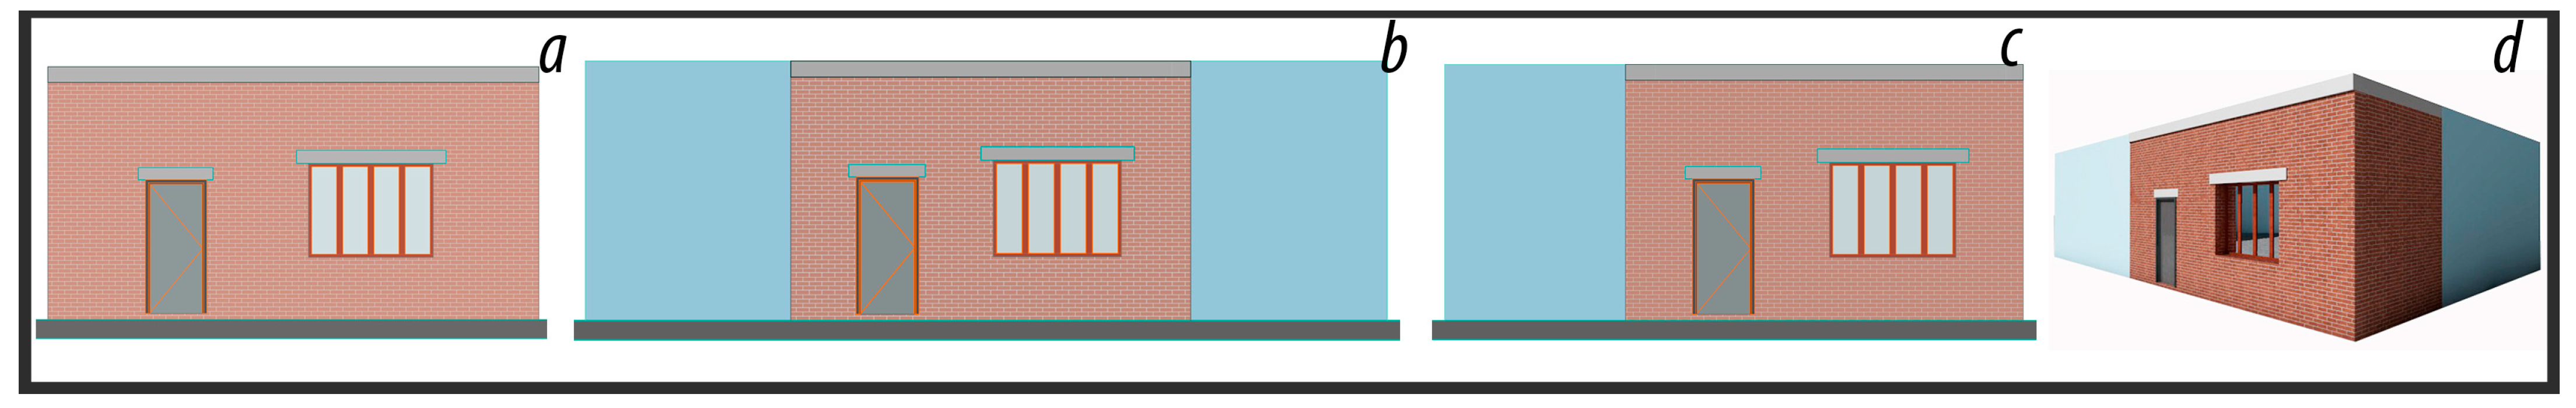
Building regulation/pounding: The location of adjacent structures can affect earthquake performance due to pounding. The structures located on the edge are most adversely affected by this condition, and if the floor levels of the adjacent structure are different, this negativity increases even more. The building order and floor level with adjacent buildings will be evaluated together. Five different situations are considered for this parameter (separate, adjacent middle–same, adjacent middle–different, adjacent edge–same, adjacent edge–different). The determination of the building order is shown in
Figure 8.
If the investigated building is adjacent, floor levels should also be taken into account in these buildings (
Figure 9).
Current situation and visual quality: Material type, quality, and masonry construction work will be checked separately and classified as good, moderate, and bad. In addition, it will be determined whether there is damage to the existing structure.
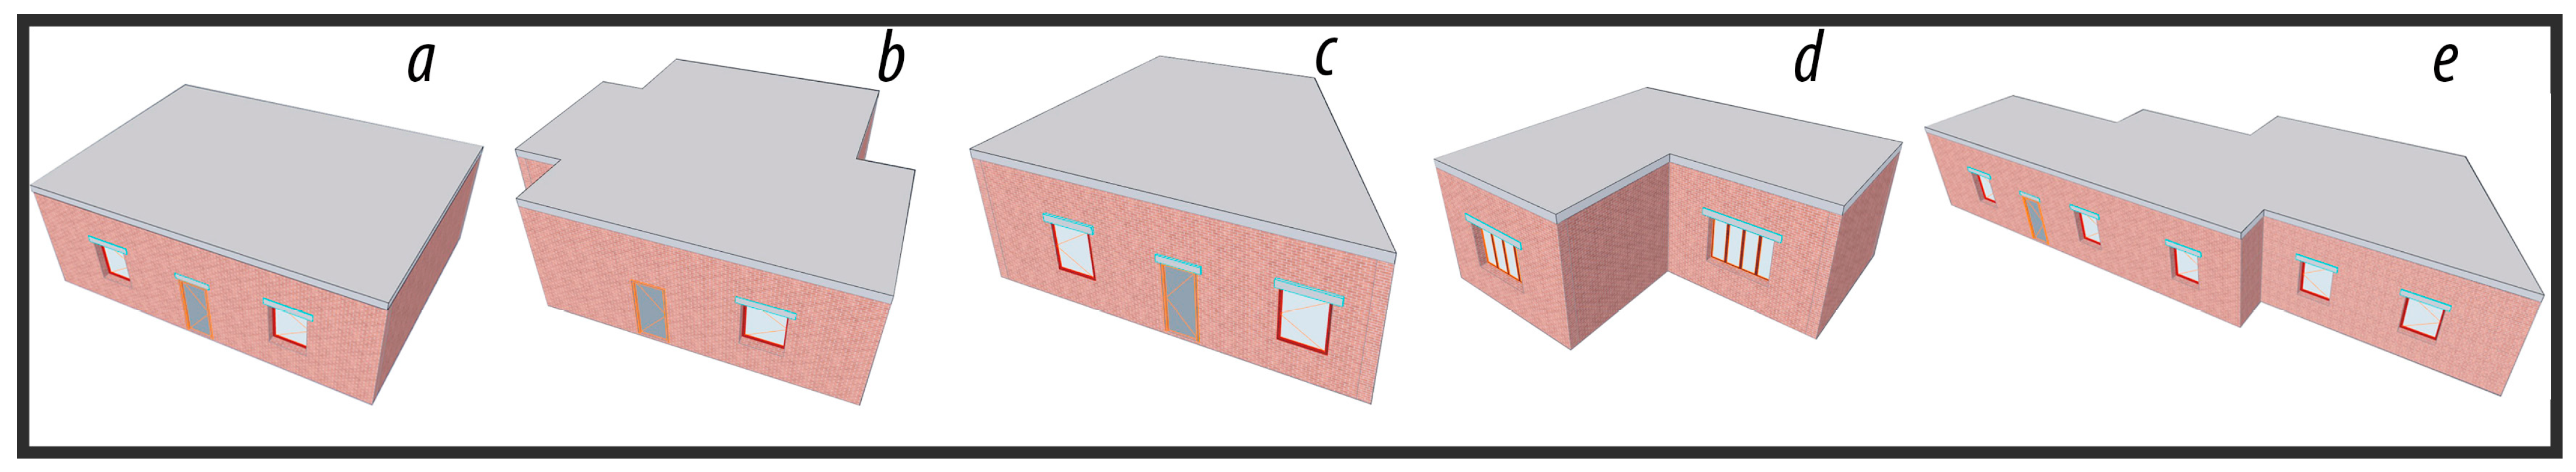
Irregularity in plan: Irregularity in the plan is determined in three different ways: regular, irregular, and extremely irregular according to the plan geometry. The different situations related to this are shown in
Figure 10.
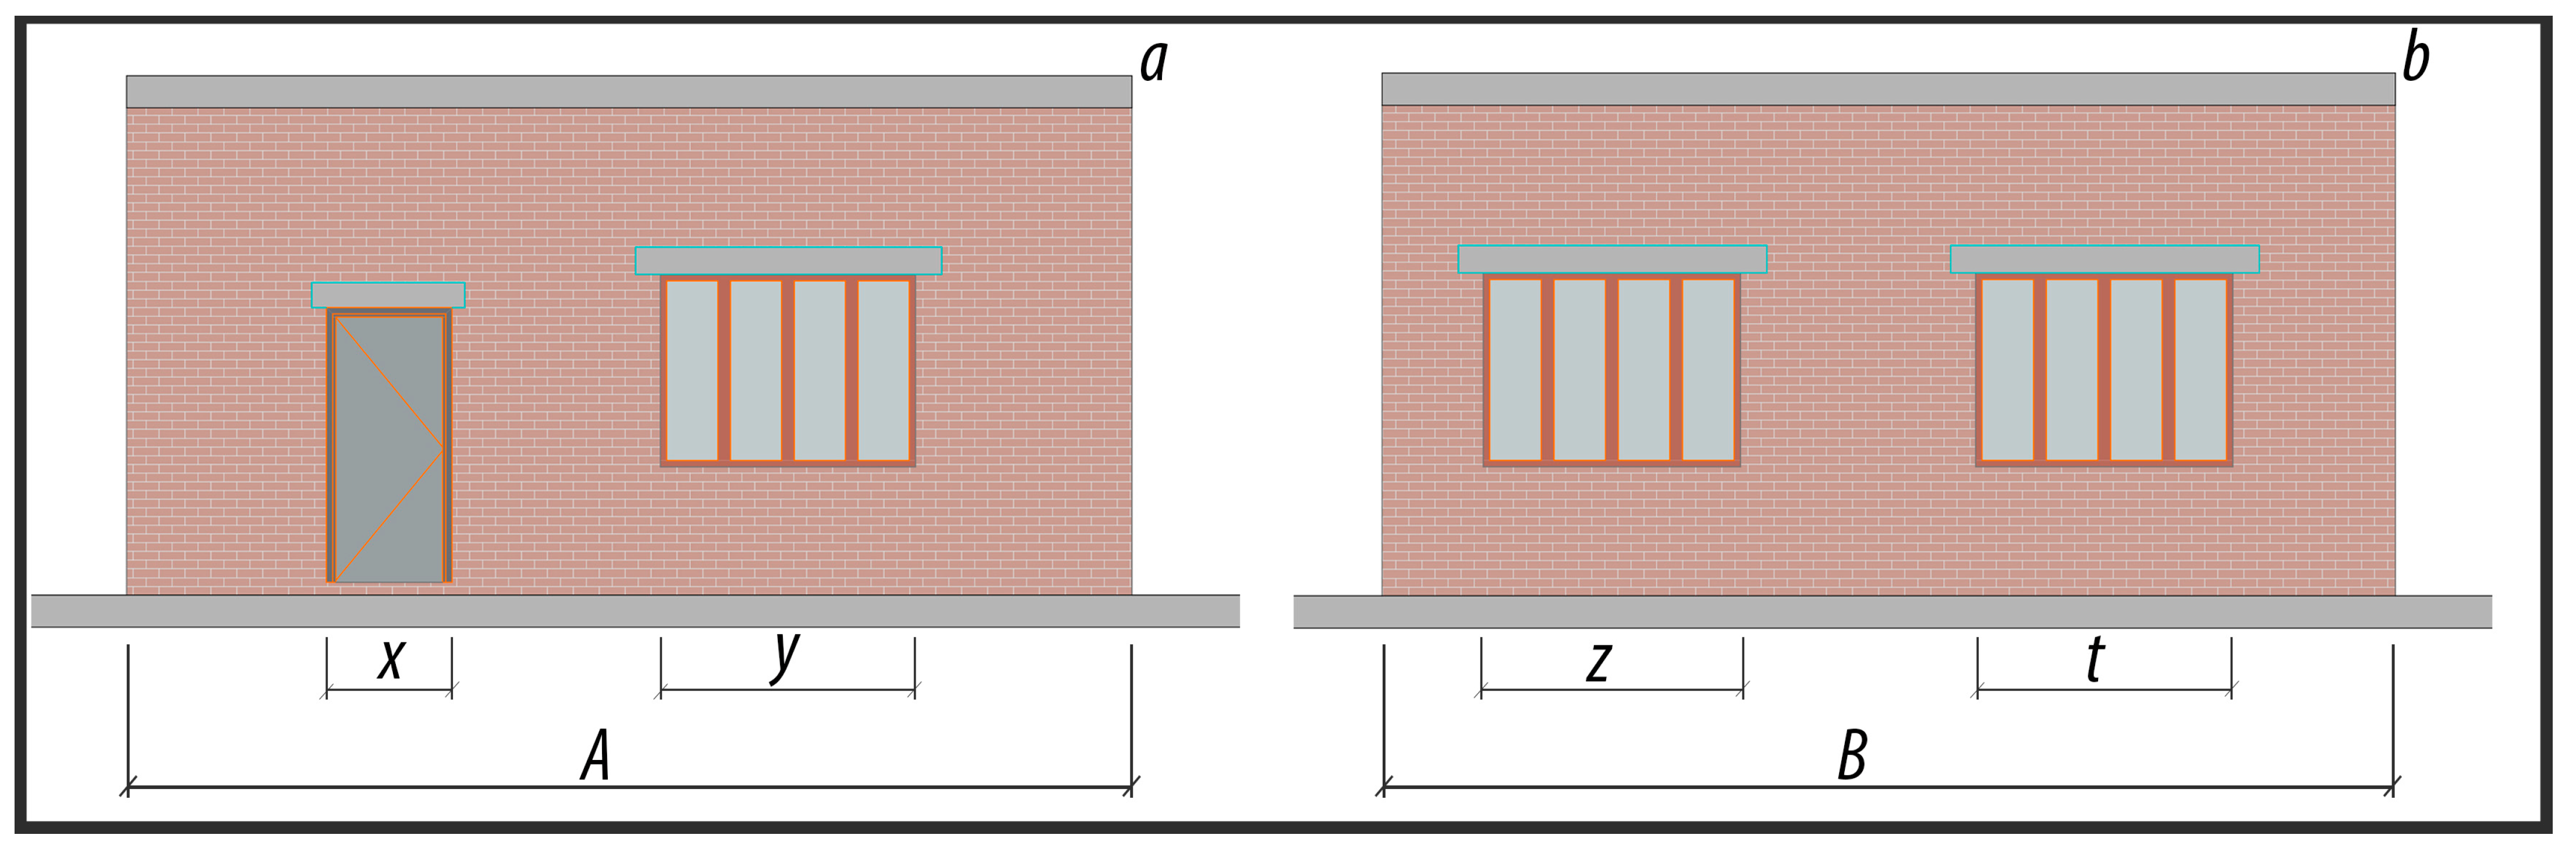
Insufficient wall quantity: Facade wall length in both perpendicular directions will be determined on the critical floor (usually the ground floor) of the building, as shown in
Figure 11. Accordingly, the number of walls (DM) in the building is high if the length of the door and window openings on the front or side facades on the ground floor is less than 1/3 of the facade length, and medium if the length of the gaps is between 1/3 and 2/3 of the facade length. If the length of the gaps is more than 2/3 of the facade length, it will be considered low. Calculations for the wall quantity are shown in
Table 7.
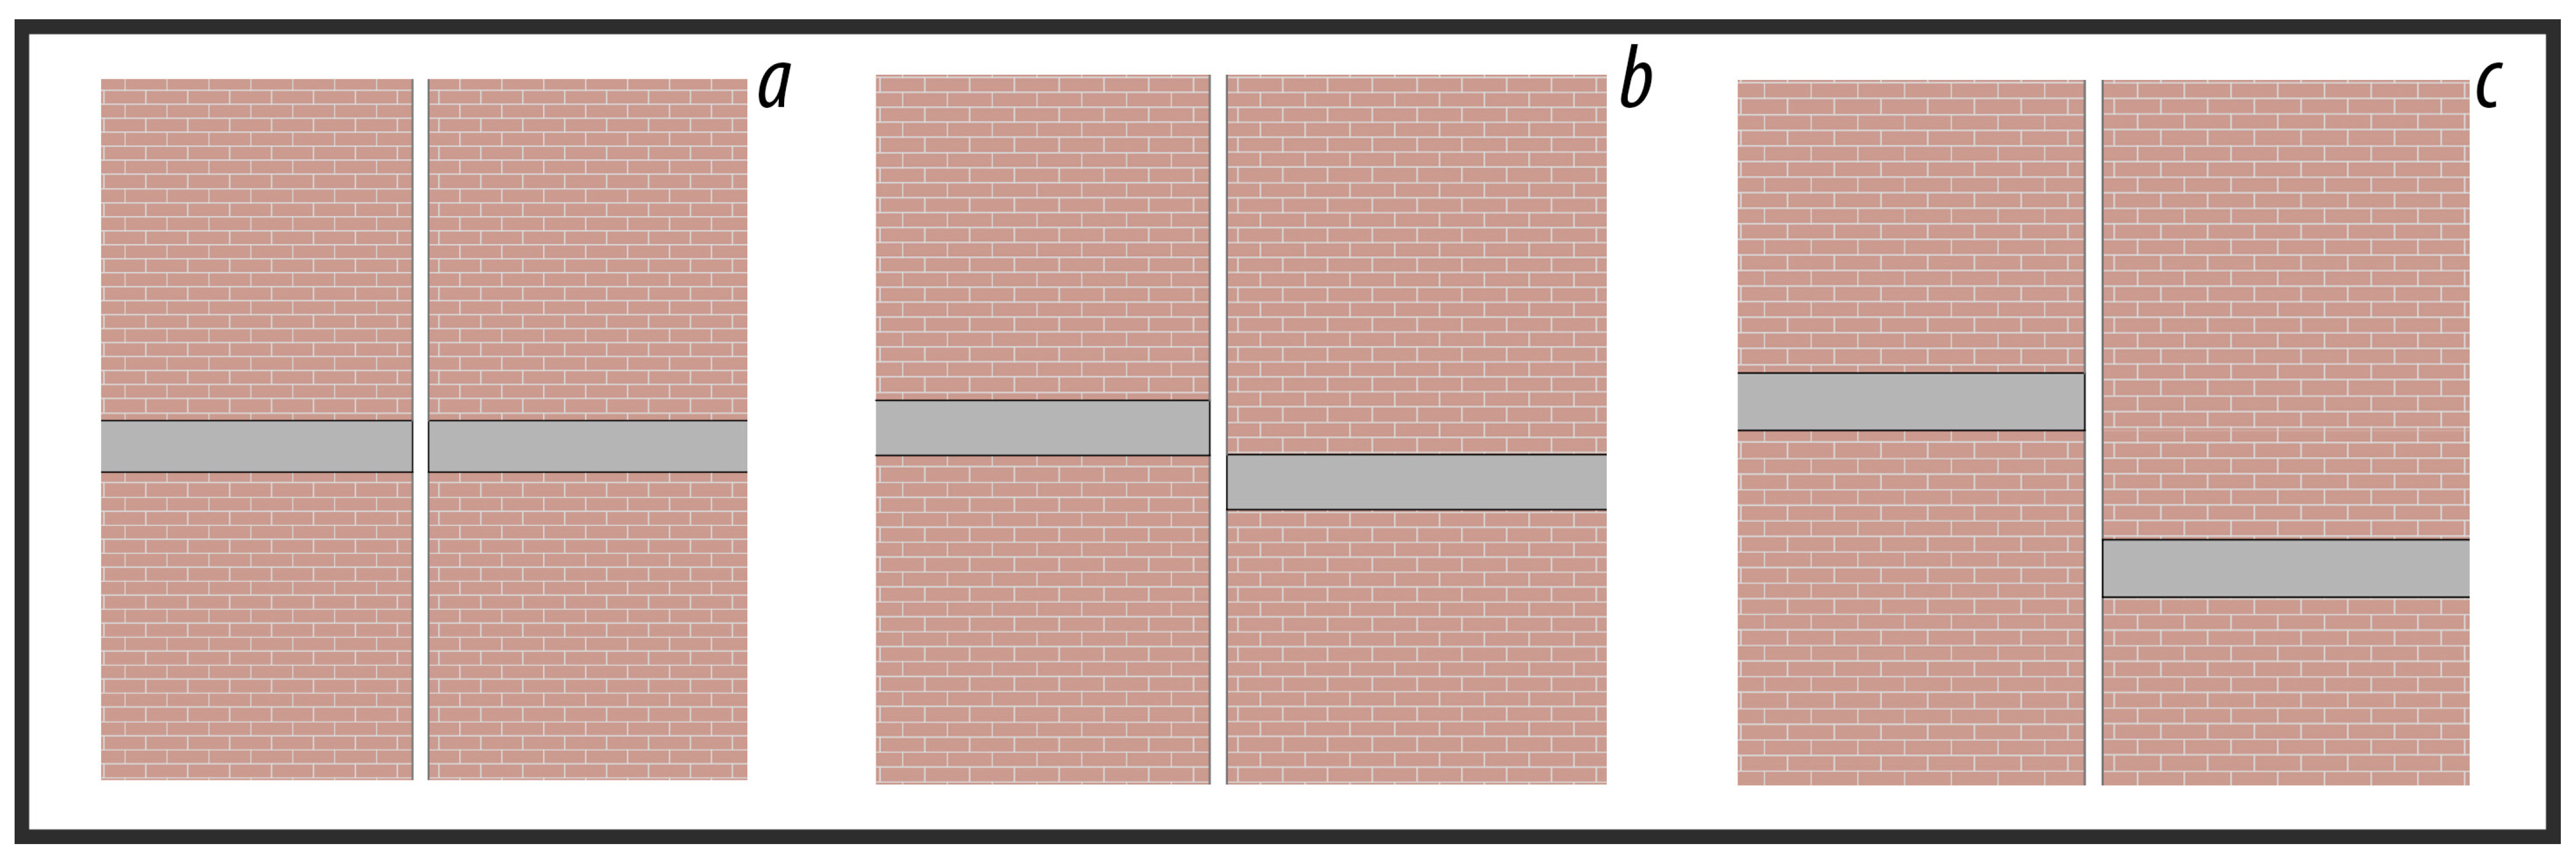
Vertical spacing irregularity: the vertical spacing according to the vertical placement of the door and window spaces in the building: regular, less regular, and irregular (
Figure 12).
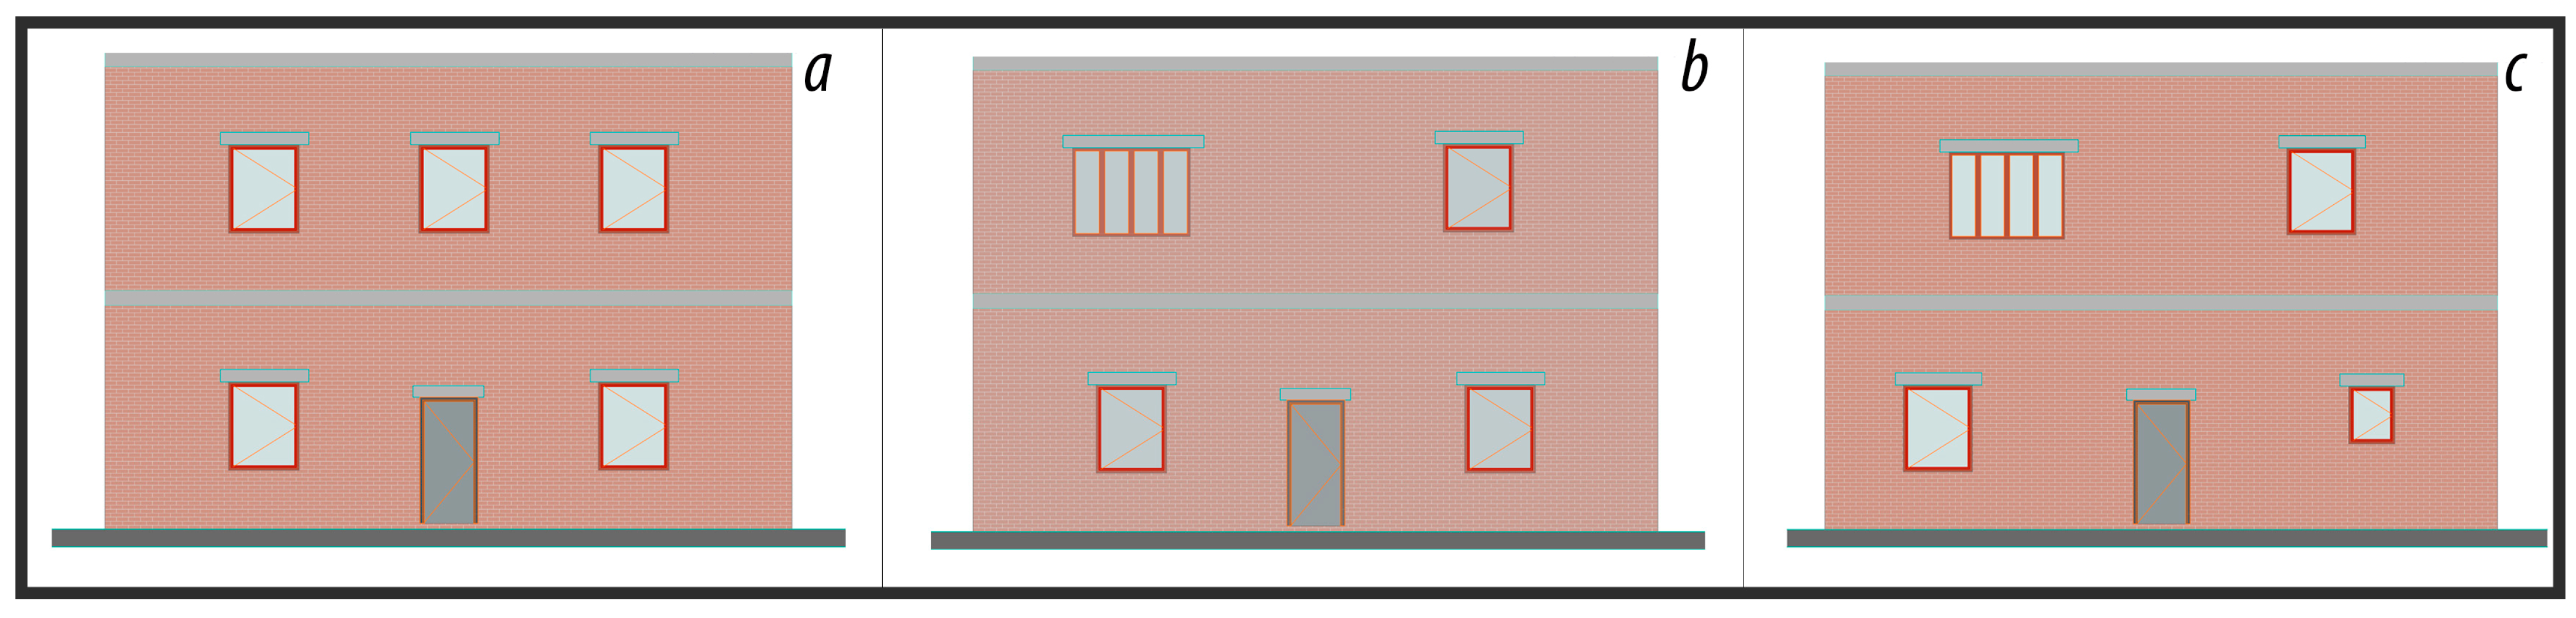
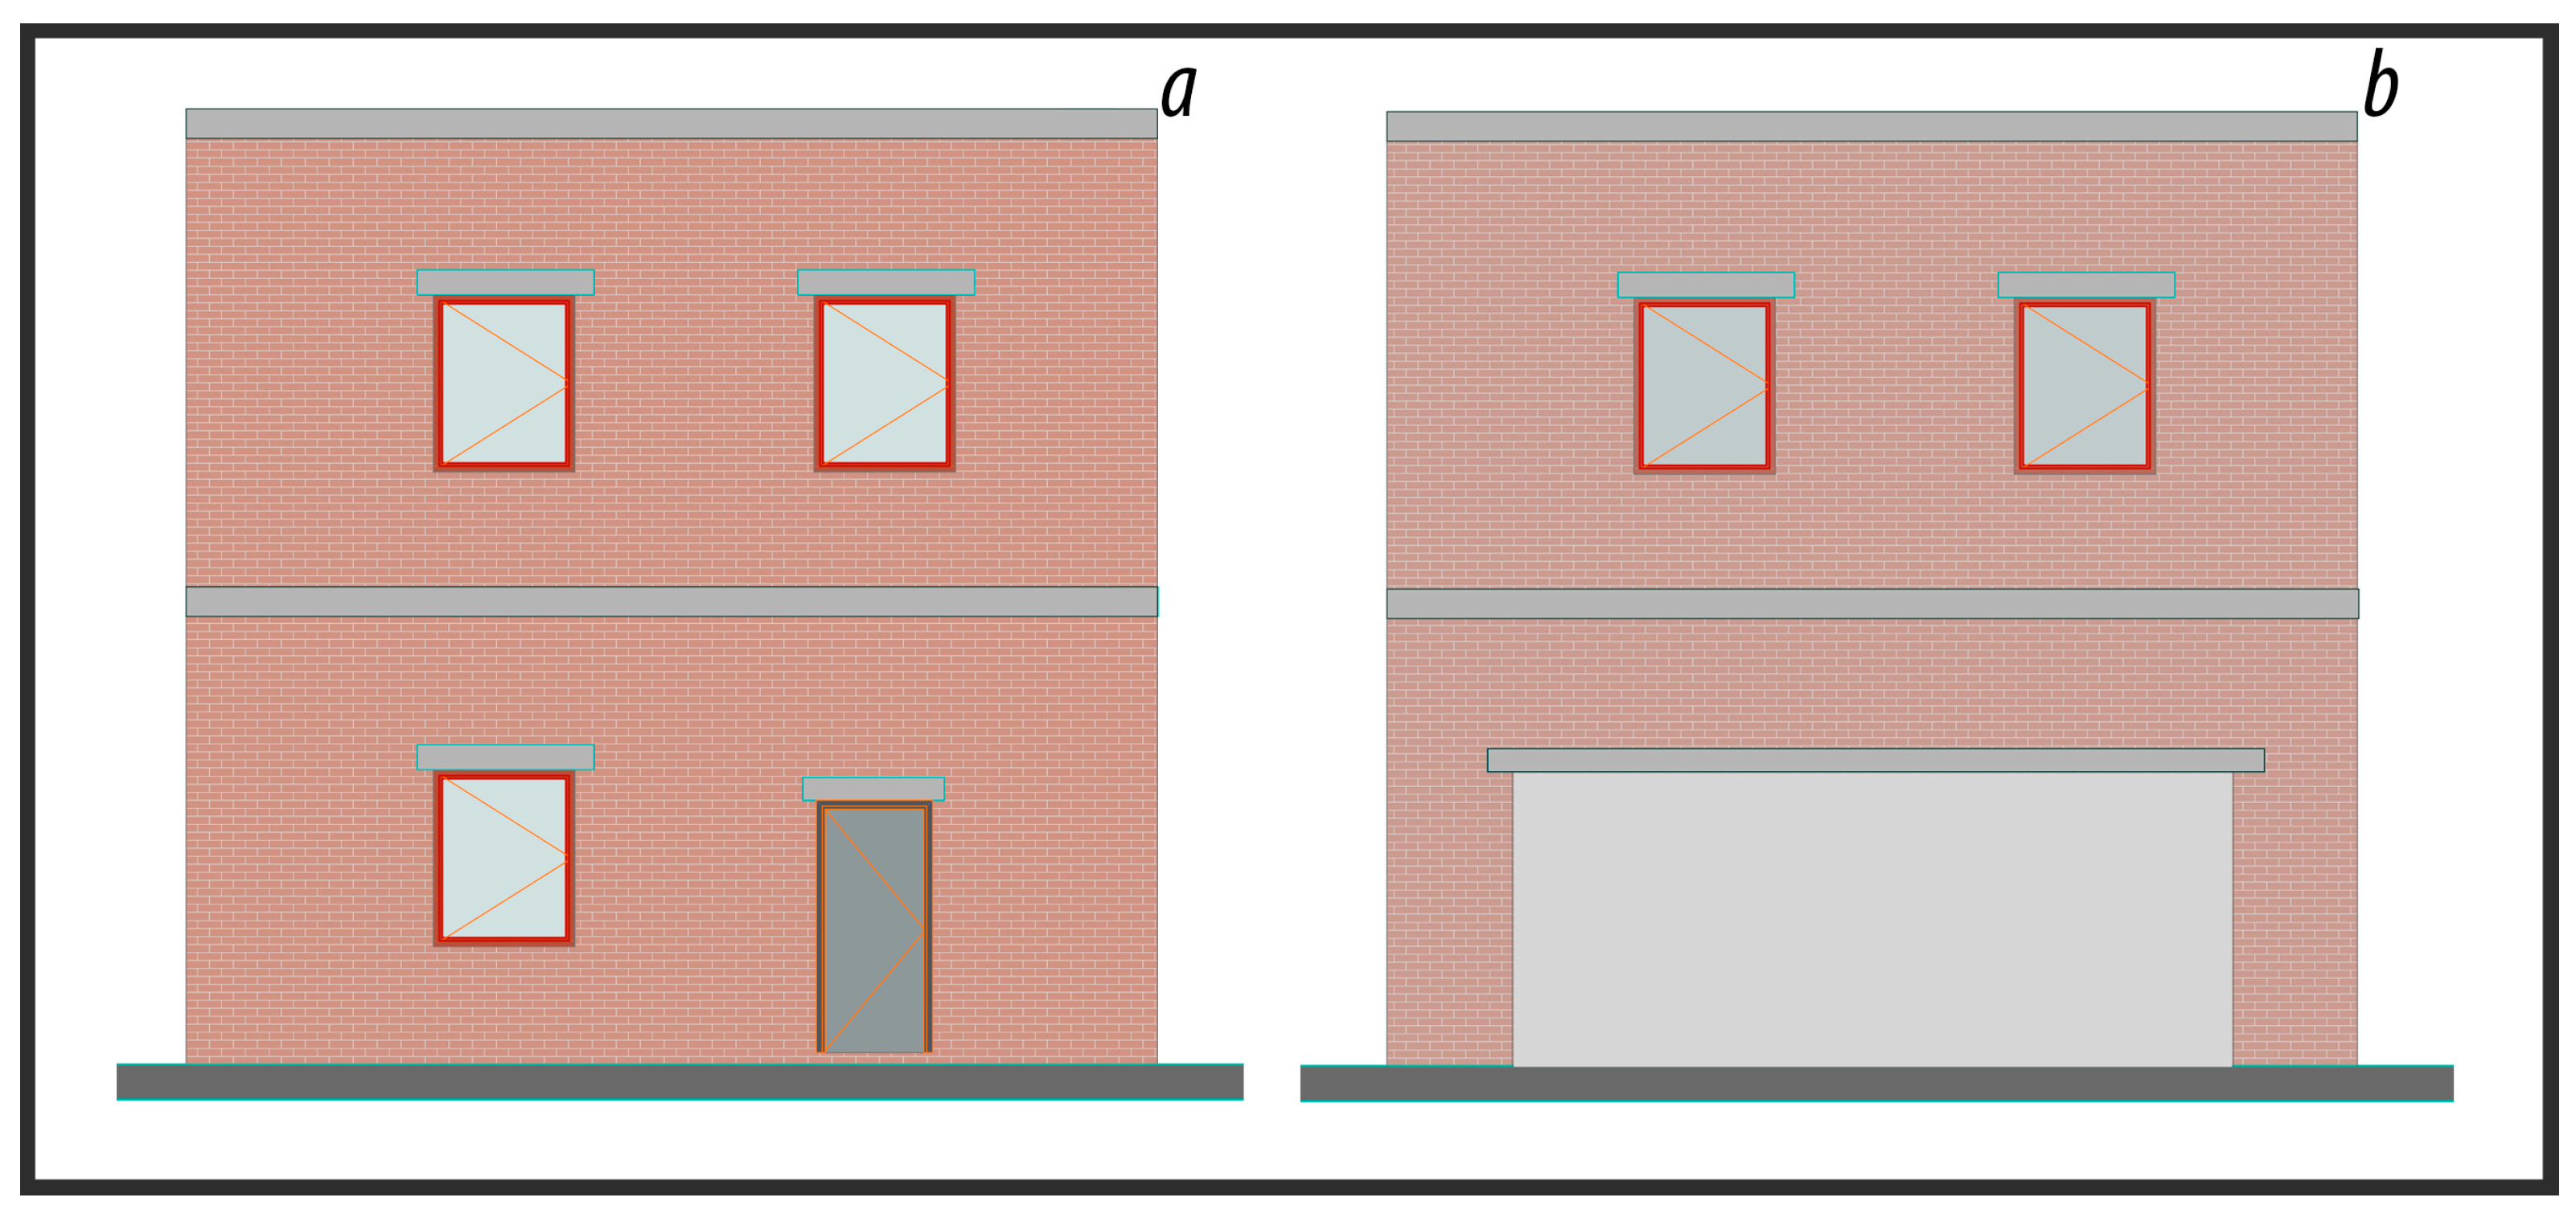
Changing the number of stories according to the facade: it will be determined whether different facades of the building have different floors, as shown in
Figure 13.
Soft/weak story: it will be determined observationally, taking into account the apparent stiffness difference between floors as well as story height difference as shown in
Figure 14.
Out-of-plane behavioral problems: It will be determined whether masonry building walls tend to exhibit out-of-plane behavior. The negativities that trigger out-of-plane behavior in masonry buildings and which can usually be detected from outside the building can be listed as follows:
- a.
Weak wall-to-wall and wall-to-floor connections (cracks or damage where the connections are located, no bond beam in the joint).
- b.
No slab exhibiting rigid diaphragm behavior (only masonry structures with reinforced concrete slabs will be deemed to exhibit this type of behavior).
- c.
Very poor quality of mortar or no mortar (causing the wall to separate in an out-of-plane direction).
Roof material: this parameter will only be set for earth roof masonry buildings.
Earthquake region: it is determined in accordance with earthquake ground motion levels and local soil classes.
Geographic coordinates: the latitude and longitude to be obtained for each structure are expressed.
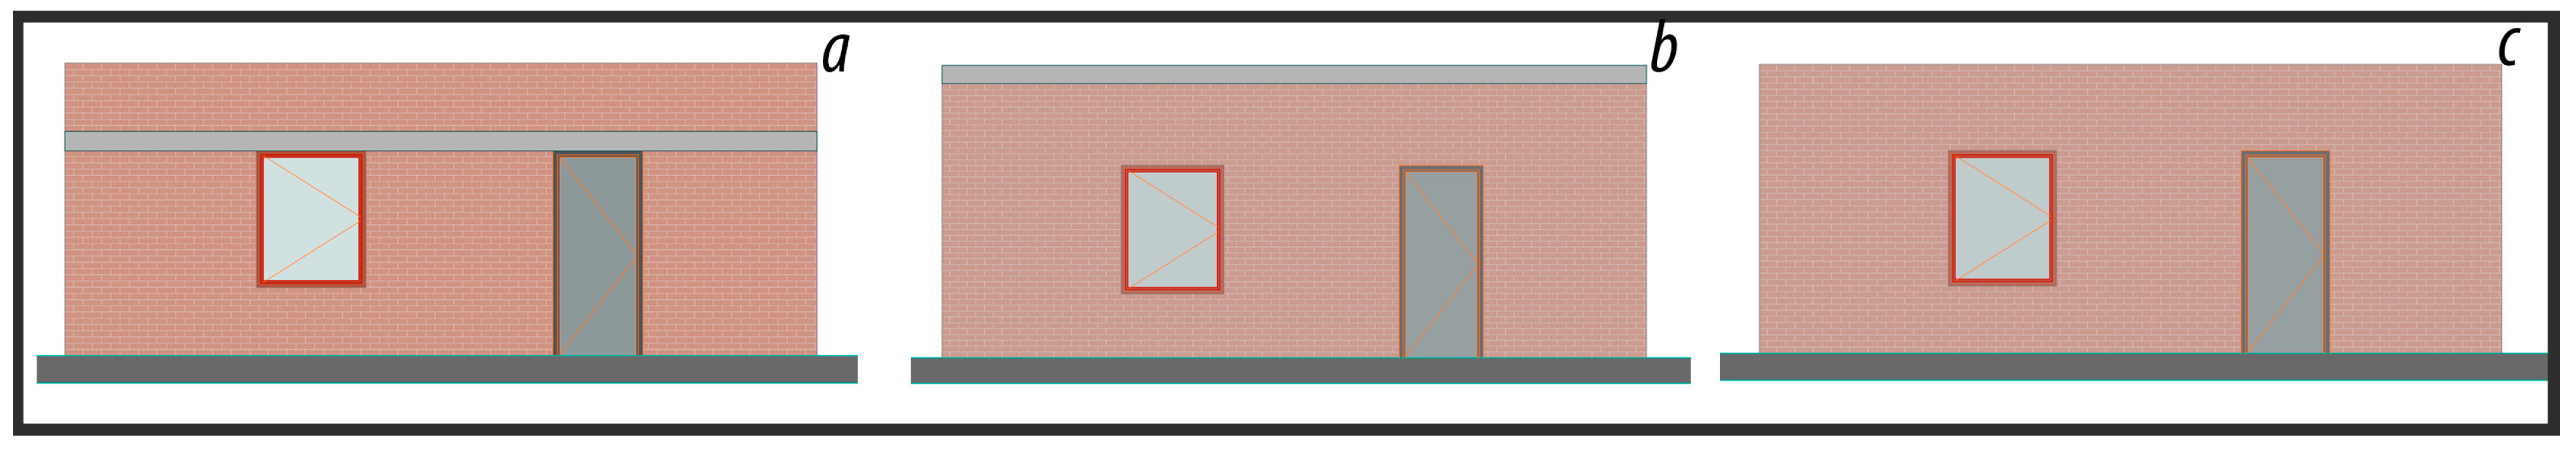
Lack of horizontal bond beam: a selection is made by looking at whether there are bond beams or not as shown in
Figure 15.
In order to determine the regional earthquake risks used in the study, the negativity parameter values taken into account in masonry structures are given in
Table 8.
The current situation in the masonry structures, the wall labor, and the estimated negativity scores for the damages are shown in
Table 9.
With the method regarded in this paper, the negativity scores for geometry, wall quantity, and bond beam/lintel as irregularities in the plan are shown in
Table 10.
Vertical negativity scores are also shown in
Table 11.
The relationship between the building and the negativity scores estimated for the floor level are demonstrated in
Table 12.
All results and building performance scores will be determined with the help of the following formula.
where
PP denotes the performance score,
TP denotes the base score,
Oi denotes each negativity parameter,
OPi denotes the negativity parameter score, and
YSP stands for the positive parameter score as the structural system score. The effect of the structural system type will be considered as a positive score. The structural system score (
YSP) shows the parameter that reflects the effect of the structural system type of the building on the earthquake performance. The
YSP value is taken as zero for unreinforced and mixed masonry buildings. The
YSP value was taken as zero since all the buildings considered were unreinforced masonry.
6. Determination of Seismic Risk Priorities for Investigated Masonry Structures
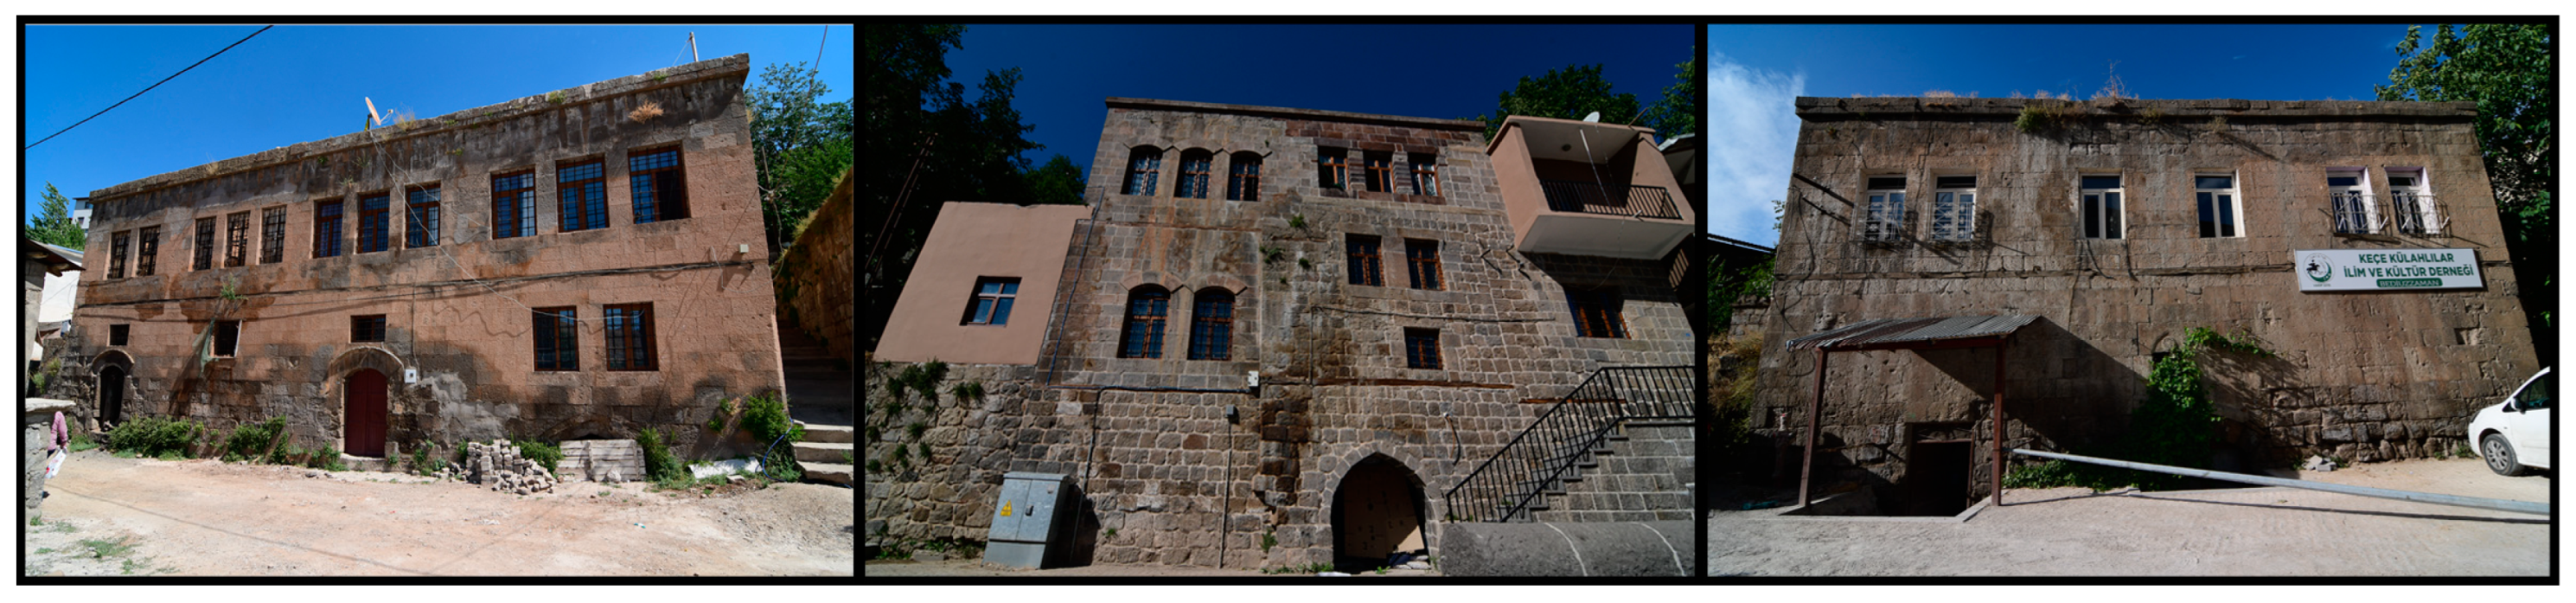
Within the scope of the study, twenty traditional houses built with a masonry system from different districts within Bitlis’ city center were examined, as shown in
Figure 16. Some examples of masonry structures considered in this context are shown in
Figure 17. The ground floor plans of the masonry structures examined are shown in
Figure 18.
The negativity parameters and values obtained for twenty masonry structures considered within the scope of the study are shown in
Table 13.
While six of the examined buildings are three-storey, thirteen of them are two-storey, and only one of them is one-storey. In general, traditional Bitlis houses are built as two-storey buildings. With the growth of the nuclear family, storeys were added to the existing structure as much as the masonry construction technique allowed. In houses built in this way, the wall thickness on the lower storey can be two storeys, since it is not suitable for three storeys. Due to the topographical structure of the province of Bitlis and the limited land use, the buildings were built adjacently. A total of 75% of the examined structures were built in adjacent order. These reasons also caused irregularity in the plan of the buildings. Bitlis stone was used in traditional Bitlis houses. These stones, which lost their properties over time, did not encounter any significant problems in terms of material due to the interventions made by the relevant building owners. Since masonry stone workmanship is highly developed in the Bitlis province and there are sufficient personnel in this regard, no significant problems were observed in terms of masonry walls. Mud was used as a joint mortar in all of the buildings. The wall–wall and wall–floor connections are sufficient due to good masonry stone workmanship. Different levels of damage to the masonry structures have been observed over time due to the heavy and long winter season, the heavy snowfall, and the temperature differences between day and night in Bitlis. In addition, the weak strength properties of the stone used are among the main causes of damage. In many masonry structures, load-bearing walls, windows, and doors are not used symmetrically. Soft story risk was not observed in any examined structures. In general, the purpose of use in the building does not change much. Heavy earthen roofs are used in all masonry structures. Heavy earthen roofs cause additional forces in the structure under the effect of an earthquake and directly affect the level of damage that may occur in the structure. Generally, horizontal/vertical beams were not used in these structures, which were built without any engineering service.
The parameter values and structural result scores obtained using the Turkish Rapid assessment method are shown in
Table 14.
The result scores obtained for 20 traditional Bitlis houses, which are the subject of the study, vary between 25 and 85 points. While the lowest building performance score was 25 for building number 3, the highest score was 85 for building number 16. When all structures were taken into account, the average building performance score was 62. The resulting score of the six structures examined was below this score. Therefore, these six structures, which are below 62 points, must first be subjected to a detailed evaluation. In the Turkish Rapid Assessment Method, buildings with low structural performance are buildings with high-risk priority. This result is used to determine regional risk priorities. The risk priorities for the examined buildings were 3, 4, 11, 20, and 2 buildings in the first five buildings, respectively. The lowest risk priority was obtained for building 16.
7. Conclusions
In this study, 20 traditional masonry structures located in the city center of Bitlis were taken into account in order to determine regional risk priorities. These structures in the province of Bitlis, located in the Lake Van Basin with high seismic risk, were built without any engineering services. Traditional Bitlis houses have an important status in terms of historical and cultural heritage. The main causes of damage in these structures are severe climatic conditions, day–night temperature differences, and low-strength building materials. In addition, the result of people leaving the buildings, their use, and the impact of natural disasters, to a lesser extent, should not be ignored.
It is possible to determine the regional earthquake risk of the building stock with the studies to be carried out on the building stock in areas with earthquake risks. However, the large number of building stock reveals that using rapid assessment techniques is a practical and scientific solution for determining risk priorities. Within the scope of this study, a sample application was carried out for the province of Bitlis using the current Turkish Rapid Assessment Method recommended for masonry structures. The study is one of the first studies in which this method was used.
Necessary data were obtained due to the observational assessments and measurements made in the field related to the buildings. The seismic parameters for each building location were obtained according to the current earthquake hazard map using some of these data. The risk priorities of the sample buildings were determined with the help of the Turkish Rapid Assessment Method using some of the seismic parameters and other data. While the low structural performance scores obtained in the Turkish Rapid Assessment Method increase the risk priority, the risk priority ranking decreases in high-rise buildings. It cannot be said with certainty whether buildings with low structural result scores comply with the seismic design code. As stated in the regulation, this is only the first evaluation stage. Therefore, definitive results will only emerge from detailed analyses.
This study is limited to twenty different buildings in total. In future studies, all risky buildings can be determined by considering all masonry structures in the city center and its districts. To determine risk priority, this work should also be done in reinforced concrete structures. This study will be a guide for similar studies to be done in the future. Since there is no similar study in Bitlis, the results could not be analyzed comparatively. This study will provide a comparison opportunity for future studies to be carried out in the Bitlis province.
In order for the structural system to gain flexibility, it is necessary to support the structures with modern systems. Strengthening, such as increasing or renewing the number of wooden bond beams in the openings of the sections with insufficient wall quantity and adding steel ties, will provide flexibility; in cases where these methods are not suitable, the use of methods such as carbon fiber should be encouraged. In this context, recyclable applications should be made without damaging the cultural heritage.
In the traditional construction system, the floor heights of the adjacent buildings are compatible and their floors are at the same level. In restoration (especially reconstruction) applications, the floor slab height can be increased in a way that is contrary to the original structure, with the desire to obtain a more spacious space. These situations, which increase the risks of impact from collision with the adjacent order, should be avoided. Likewise, since the window openings whose dimensions have been changed will cause a change in the vertical space order, the continuation of the original building systems is recommended.
Traditional Bitlis houses are built in masonry style by local masters and workers with the wishes of the building owners without any engineering services. In this context, training local craftsmen about the relevant regulations and developing building materials, and the implementation of these trainings, will be important in terms of increasing building performance.
Author Contributions
Conceptualization, E.A., F.A., E.H., M.T. and E.I.; methodology, E.I., E.H. and F.A.; software, E.A. and E.I.; validation, E.I. and E.H.; formal analysis, F.A., E.H. and M.T.; investigation, E.I, E.A. and F.A.; resources, E.I, M.T. and E.A.; data curation, E.I, E.A. and M.T., writing—original draft preparation, E.I, F.A. and E.H.; writing—review and editing, E.A., M.T., F.A. and E.I.; visualization, E.H.; supervision, E.I. and E.A; project administration, E.I.; funding acquisition, E.H. All authors have read and agreed to the published version of the manuscript.
Funding
This research received no external funding.
Institutional Review Board Statement
Not applicable.
Informed Consent Statement
Not applicable.
Data Availability Statement
Most data are included in the manuscript.
Conflicts of Interest
The authors declare no conflict of interest.
References
- Dogan, G.; Ecemis, A.S.; Korkmaz, S.Z.; Arslan, M.H.; Korkmaz, H.H. Buildings damages after Elazığ, Turkey earthquake on 24 January 2020. Nat. Hazards 2021, 109, 161–200. [Google Scholar] [CrossRef]
- Šipoš, T.K.; Hadzima-Nyarko, M. Rapid seismic risk assessment. Int. J. Dis. Risk Reduct. 2017, 24, 348–360. [Google Scholar] [CrossRef]
- Arslan, M.H. An evaluation of effective design parameters on earthquake performance of RC buildings using neural networks. Eng. Struct. 2010, 32, 1888–1898. [Google Scholar] [CrossRef]
- Bektaş, N.; Kegyes-Brassai, O. Development in fuzzy logic-based rapid visual screening method for seismic vulnerability assessment of buildings. Geosciences 2023, 13, 6. [Google Scholar] [CrossRef]
- Bülbül, M.A.; Harirchian, E.; Işık, M.F.; Aghakouchaki Hosseini, S.E.; Işık, E. A hybrid ANN-GA model for an automated rapid vulnerability assessment of existing RC buildings. Appl. Sci. 2022, 12, 5138. [Google Scholar] [CrossRef]
- Aynur, S.; Atalay, H.M. Comparative analysis of existing reinforced concrete buildings damaged at different levels during past earthquakes using rapid assessment methods. Struct. Eng. Mech. 2023, 85, 793–808. [Google Scholar]
- Harirchian, E.; Hosseini, S.E.A.; Jadhav, K.; Kumari, V.; Rasulzade, S.; Işık, E.; Lahmer, T. A review on application of soft computing techniques for the rapid visual safety evaluation and damage classification of existing buildings. J. Build. Eng. 2021, 43, 102536. [Google Scholar] [CrossRef]
- Kassem, M.M.; Beddu, S.; Ooi, J.H.; Tan, C.G.; Mohamad El-Maissi, A.; Mohamed Nazri, F. Assessment of seismic building vulnerability using rapid visual screening method through web-based application for Malaysia. Buildings 2021, 11, 485. [Google Scholar] [CrossRef]
- Kapetana, P.; Dritsos, S. Seismic assessment οf buildings by rapid visual screening procedures. Earthq. Resist. Eng. Struct VI 2007, 93, 409. [Google Scholar]
- Işık, E.; Karaşin, İ.B.; Demirci, A.; Büyüksaraç, A. Seismic risk priorities of site and mid-rise RC buildings in Turkey. Chall. J. Struct. Mech. 2020, 6, 191–203. [Google Scholar] [CrossRef]
- Ademović, N.; Kalman Šipoš, T.; Hadzima-Nyarko, M. Rapid assessment of earthquake risk for Bosnia and Herzegovina. Bull. Earthq. Eng. 2020, 18, 1835–1863. [Google Scholar] [CrossRef]
- Isik, E. Consistency of the rapid assessment method for reinforced concrete buildings. Earthq. Struct. 2016, 11, 873–885. [Google Scholar] [CrossRef]
- Alam, N.; Alam, M.S.; Tesfamariam, S. Buildings’ seismic vulnerability assessment methods: A comparative study. Nat. Haz. 2012, 62, 405–424. [Google Scholar] [CrossRef]
- Işık, M.F.; Işık, E.; Harirchian, E. Application of IOS/Android rapid evaluation of post-earthquake damages in masonry buildings. Gazi Mühendislik Bilimleri Dergisi 2021, 7, 36–50. [Google Scholar]
- Işık, M.F.; Işık, E.; Bülbül, M.A. Application of iOS/Android based assessment and monitoring system for building inventory under seismic impact. Gradevinar 2018, 70, 1043–1056. [Google Scholar]
- PDRB-2019. The Principles of Determining Risky Buildings; Türkiye Ministry of Environment and Urbanization Ankara: Ankara, Türkiye, 2019; RG-16/2/2019-30688. [Google Scholar]
- TBEC-2018. Turkish Building Earthquake Code; T.C. Resmi Gazete: Ankara, Türkiye, 2018. [Google Scholar]
- AFAD-2023. Available online: https://tdth.afad.gov.tr (accessed on 2 February 2023).
- Bicen, V.S.; Isık, E.; Arkan, E.; Ulu, A.E. A study on determination of regional earthquake risk distribution of masonry structures. J. Arch. Eng. Fine Arts 2020, 2, 74–86. [Google Scholar]
- Işık, E. The evaluation of existing masonry buildings in Bitlis using a visual screening method. BEU J. Sci. 2013, 2, 21–29. [Google Scholar]
- Bilgin, H.; Shkodrani, N.; Hysenlliu, M.; Ozmen, H.B.; Isik, E.; Harirchian, E. Damage and performance evaluation of masonry buildings constructed in 1970s during the 2019 Albania earthquakes. Eng. Fail. Anal. 2022, 131, 105824. [Google Scholar] [CrossRef]
- Karaşin, İ.B.; Eren, B.; Işık, E. Investigation of an existing masonry building with different rapid assessment method. Dicle Uni. J. Inst. Nat. Appl. Sci 2016, 5, 70–76. [Google Scholar]
- Yakut, A.; Erberik, M.A.; Ilki, A.; Sucuoğlu, H.; Akkar, S. Rapid seismic assessment procedures for the Turkish Building Stock. In Seismic Evaluation and Rehabilitation of Structures; Springer: Cham, Switzerland, 2014; pp. 15–35. [Google Scholar]
- Nanda, R.P.; Damarla, R.; Nayak, K.A. Android application of rapid visual screening for buildings in Indian context. Structures 2022, 46, 1823–1836. [Google Scholar] [CrossRef]
- Harirchian, E.; Lahmer, T. Improved rapid visual earthquake hazard safety evaluation of existing buildings using a type-2 fuzzy logic model. Appl. Sci. 2020, 10, 2375. [Google Scholar] [CrossRef] [Green Version]
- Pavić, G.; Hadzima-Nyarko, M.; Plaščak, I.; Pavić, S. Seismic vulnerability assessment of historical unreinforced masonry buildings in Osijek using capacity spectrum method. Acta Phys. Pol. A 2019, 135, 1138–1141. [Google Scholar] [CrossRef]
- Harirchian, E.; Lahmer, T.; Buddhiraju, S.; Mohammad, K.; Mosavi, A. Earthquake safety assessment of buildings through rapid visual screening. Buildings 2020, 10, 51. [Google Scholar] [CrossRef] [Green Version]
- Latifi, R.; Hadzima-Nyarko, M.; Radu, D.; Rouhi, R. A brief overview on crack patterns, repair and strengthening of historical masonry structures. Materials 2023, 16, 1882. [Google Scholar] [CrossRef]
- Yüksek, İ.; Esin, T. Analysis of traditional rural houses in Turkey in terms of energy efficiency. Int. J. Sustain. Energy 2013, 32, 643–658. [Google Scholar] [CrossRef]
- Formisano, A.; Vaiano, G.; Davino, A.; Citro, S.; D’Amato, M. Seismic vulnerability assessment of two territorial case studies of Italian ancient churches: Comparison between simplified and refined numerical models. Int. J. Mason. Res. Innov. 2022, 7, 172–216. [Google Scholar] [CrossRef]
- Fabbrocino, F.; Vaiano, G.; Formisano, A.; D’Amato, M. Large-scale seismic vulnerability and risk of masonry churches in seismic-prone areas: Two territorial case studies. Front. Built Environ. 2019, 5, 102. [Google Scholar] [CrossRef]
- Khemis, A.; Athmani, A.; Ademović, N. Rapid application of the RISK-UE LM2 method for the seismic vulnerability analysis of the Algerian masonry buildings. Int. J. Archit. Herit. 2023, 1–21. [Google Scholar] [CrossRef]
- Ademović, N.; Hadzima-Nyarko, M.; Zagora, N. Seismic vulnerability assessment of masonry buildings in Banja Luka and Sarajevo (Bosnia and Herzegovina) using the macroseismic model. Bull. Earthq. Eng. 2020, 18, 3897–3933. [Google Scholar] [CrossRef]
- Pirchio, D.; Walsh, K.Q.; Kerr, E.; Giongo, I.; Giaretton, M.; Weldon, B.D.; Sorrentino, L. Seismic risk assessment and intervention prioritization for Italian medieval churches. J. Build. Eng. 2021, 43, 103061. [Google Scholar] [CrossRef]
- Formisano, A.; Marzo, A. Simplified and refined methods for seismic vulnerability assessment and retrofitting of an Italian cultural heritage masonry building. Comput. Struct. 2017, 180, 13–26. [Google Scholar] [CrossRef] [Green Version]
- Lourenço, P.B.; Oliveira, D.V.; Leite, J.C.; Ingham, J.M.; Modena, C.; Da Porto, F. Simplified indexes for the seismic assessment of masonry buildings: International database and validation. Eng. Fail. Anal. 2013, 34, 585–605. [Google Scholar] [CrossRef]
- Özsoy Özbay, A.; Sanrı Karapınar, I. Earthquake preliminary assessment of masonry buildings in historical centers. Karaelmas Fen ve Mühendislik Dergisi 2021, 11, 1–11. [Google Scholar]
- Sayan, Y.; Öztürk, Ş. Bitlis Evleri; Kültür Bakanlığı Yayınları: Ankara, Turkey, 2001. [Google Scholar]
- Payaslı Oğuz, G. Mekansal ve Sosyal Yapısıyla Bitlis Geleneksel Sivil Mimarisi; TAÇ Vakfı yayınları: Istanbul, Turkey, 2012. [Google Scholar]
- Işık, E.; Büyüksaraç, A.; Avşar, E.; Kuluöztürk, M.F.; Günay, M. Characteristics and properties of Bitlis ignimbrites and their environmental implications. Materiales de Construcción 2020, 70, 214. [Google Scholar] [CrossRef] [Green Version]
- Işık, E.; Harirchian, E.; Arkan, E.; Avcil, F.; Günay, M. Structural analysis of five historical minarets in Bitlis (Turkey). Buildings 2022, 12, 159. [Google Scholar] [CrossRef]
- Aydin, M.C.; Işhik, E. Evaluation of ground snow loads in the micro-climate regions. Russ. Meteorol. Hydrol. 2015, 40, 741–748. [Google Scholar] [CrossRef]
- Ekinci, R.; Büyüksaraç, A.; Ekinci, Y.L.; Işık, E. Natural disaster diversity assessment of Bitlis Province. J. Nat. Haz. Environ. 2020, 6, 1–11. [Google Scholar]
- Işık, E.; Özlük, M.H. Natural disasters analysis of Bitlis Province and suggestions. In Proceedings of the 3rd International Science Technology and Engineering Conference (ISTE-C 2012), Dubai, United Arab Emirates, 20–21 December 2012. [Google Scholar]
- Bilgin, H.; Hadzima-Nyarko, M.; Isik, E.; Ozmen, H.B.; Harirchian, E. A comparative study on the seismic provisions of different codes for RC buildings. Struct. Eng. Mech. 2022, 83, 195–206. [Google Scholar]
- Arun, G. Yığma kagir yapı davranışı. In Yığma Yapıların Deprem Güvenliğinin Arttırılması Çalıştayı; Orta Doğu Teknik Üniversitesi: Ankara, Turkey, 2005. [Google Scholar]
- Karaşin, A.; Öncü, M.E. Evaluation of earthquake safety of multi-storey masonry buildings. Doğu Anadolu Araştırmaları Dergisi 2009, 2009, 63–68. [Google Scholar]
- Çırak, İ.F. Damages observed in masonry structures, causes and recommendations. SDU Int. Techn. Sci. 2011, 3, 55–60. [Google Scholar]
- Bayülke, N. Yığma yapıların deprem davranışı ve güvenliği. In Türkiye Deprem Mühendisliği ve Sismoloji Konferansı; Orta Doğu Teknik Üniversitesi: Ankara, Turkey, 2011. [Google Scholar]
- Korkmaz, A.; Çarhoğlu, A.I.; Orhon, A.V.; Nuhoğlu, A. Effects of different structural material properties on masonry building structural behaviour. Nevşehir J. Sci. Technol. 2014, 3, 69–78. [Google Scholar]
- Koç, V. Examined to the behavior of earthquake exposed masonry and rural buildings with construction rules to be considered in masonry structures. J. Grad. Sch. Nat. Appl. Sci. 2016, 2, 36–57. [Google Scholar]
- Hadzima-Nyarko, M.; Ademović, N.; Pavić, G.; Šipoš, T.K. Strengthening techniques for masonry structures of cultural heritage according to recent Croatian provisions. Earthq. Struct. 2018, 15, 473–485. [Google Scholar]
- Biçen, V.S.; Işık, E. Evaluation of building elements and material usage in traditional Bitlis houses on a sample structure. In Proceedings of the International Conference on Multidisciplinary, Science, Engineering and Technology, Dubai, United Arab Emirates, 25–27 October 2018. [Google Scholar]
- Işık, E.; Ulu, A.E.; Büyüksaraç, A.; Aydın, M.C. A study on damages in masonry structures and determination of damage levels in the 2020 Sivrice (Elazig) earthquake. In Advanced Technologies, Systems, and Applications VII, Proceedings of the International Symposium on Innovative and Interdisciplinary Applications of Advanced Technologies (IAT) 2022, Sarajevo, Bosnia and Herzegovina, 23–26 June 2022; Springer International Publishing: Cham, Switzerland, 2022; pp. 35–54. [Google Scholar]
Figure 1.
The location of the places where a traditional construction system is seen in the city of Bitlis.
Figure 1.
The location of the places where a traditional construction system is seen in the city of Bitlis.
Figure 2.
Section of the structure built with a masonry system.
Figure 2.
Section of the structure built with a masonry system.
Figure 3.
Wall detail: (a) Model of a 3-storey building, (b) Section, (c) Plans.
Figure 3.
Wall detail: (a) Model of a 3-storey building, (b) Section, (c) Plans.
Figure 4.
Some of the observed damages to the structures: (a) Collapsed roof, (b) Moisture and lichen formation, (c) Surface loss, color change, vegetation.
Figure 4.
Some of the observed damages to the structures: (a) Collapsed roof, (b) Moisture and lichen formation, (c) Surface loss, color change, vegetation.
Figure 5.
The current Earthquake Hazard Map of Türkiye [
18].
Figure 5.
The current Earthquake Hazard Map of Türkiye [
18].
Figure 6.
Type of masonry building: (a) Unreinforced masonry, (b) Reinforced masonry, (c) Contained masonry. (d) Mixed system (RC frame and masonry wall).
Figure 6.
Type of masonry building: (a) Unreinforced masonry, (b) Reinforced masonry, (c) Contained masonry. (d) Mixed system (RC frame and masonry wall).
Figure 7.
Specification of the number of stories (for the 3-stories buildings): (a) Hill slope effect, (b) Below ground level, (c) Below ground level and has a basement, (d) Having a basement in the building, (e) Having partial basement in the building.
Figure 7.
Specification of the number of stories (for the 3-stories buildings): (a) Hill slope effect, (b) Below ground level, (c) Below ground level and has a basement, (d) Having a basement in the building, (e) Having partial basement in the building.
Figure 8.
Structure order: (a) Separate, (b) Adjacent middle, (c) Adjacent edge, (d) Adjacent corner.
Figure 8.
Structure order: (a) Separate, (b) Adjacent middle, (c) Adjacent edge, (d) Adjacent corner.
Figure 9.
Floor levels in adjacent buildings: (a) Same, (b)Same (Limit condition), (c) Different.
Figure 9.
Floor levels in adjacent buildings: (a) Same, (b)Same (Limit condition), (c) Different.
Figure 10.
Examples of irregularity in plan: (a) Regular, (b) Irregular, (c) Regular, (d) Irregular, (e) Extremely irregular.
Figure 10.
Examples of irregularity in plan: (a) Regular, (b) Irregular, (c) Regular, (d) Irregular, (e) Extremely irregular.
Figure 11.
Necessary measurements to determine the insufficient amount of wall: (a) Front facade, (b) Side facade.
Figure 11.
Necessary measurements to determine the insufficient amount of wall: (a) Front facade, (b) Side facade.
Figure 12.
Vertical spacing irregularity: (a) Regular, (b) Less irregular, (c) Irregular.
Figure 12.
Vertical spacing irregularity: (a) Regular, (b) Less irregular, (c) Irregular.
Figure 13.
Differences between the floors according to the facade: (a) None, (b) Available, (c) Available.
Figure 13.
Differences between the floors according to the facade: (a) None, (b) Available, (c) Available.
Figure 14.
Soft/weak story: (a) None, (b) Available.
Figure 14.
Soft/weak story: (a) None, (b) Available.
Figure 15.
Lack of horizontal bond beam: (a) Above the window, (b) Above the wall, (c) No bond beam.
Figure 15.
Lack of horizontal bond beam: (a) Above the window, (b) Above the wall, (c) No bond beam.
Figure 16.
Locations of the twenty investigated structures in the city.
Figure 16.
Locations of the twenty investigated structures in the city.
Figure 17.
Some examined masonry structures.
Figure 17.
Some examined masonry structures.
Figure 18.
The ground floor plans of the examined masonry structures.
Figure 18.
The ground floor plans of the examined masonry structures.
Table 1.
Earthquake ground motion levels [
17].
Table 1.
Earthquake ground motion levels [
17].
| Ground Motion | Probability of Exceedance
(in 50 Years) | Repetition Period | Definition |
|---|
| DD-1 | 0.02 | 2475 | Largest earthquake ground motion |
| DD-2 | 0.1 | 475 | Standard design earthquake ground motion |
| DD-3 | 0.5 | 72 | Frequent earthquake ground motion |
| DD-4 | 0.68 | 43 | Service earthquake ground motion |
Table 2.
PGA and PGV values obtained for the different probabilities of exceedance.
Table 2.
PGA and PGV values obtained for the different probabilities of exceedance.
| No | Peak Ground Acceleration (g) | Peak Ground Velocity (cm/s)—PGV |
|---|
| Probability of Exceedance in 50 Years | Probability of Exceedance in 50 Years |
|---|
| 2% | 10% | 50% | 68% | 2% | 10% | 50% | 68% |
|---|
| 1 | 0.501 | 0.266 | 0.104 | 0.074 | 27.887 | 14.714 | 6.172 | 4.548 |
| 2 | 0.500 | 0.266 | 0.104 | 0.074 | 27.867 | 14.708 | 6.172 | 4.548 |
| 3 | 0.500 | 0.266 | 0.104 | 0.074 | 27.853 | 14.699 | 6.159 | 4.536 |
| 4 | 0.501 | 0.267 | 0.104 | 0.074 | 27.887 | 14.713 | 6.170 | 4.546 |
| 5 | 0.500 | 0.266 | 0.104 | 0.074 | 27.842 | 14.707 | 6.170 | 4.546 |
| 6 | 0.500 | 0.266 | 0.104 | 0.074 | 27.864 | 14.696 | 6.160 | 4.537 |
| 7 | 0.501 | 0.266 | 0.104 | 0.074 | 27.891 | 14.716 | 6.174 | 4.549 |
| 8 | 0.500 | 0.266 | 0.104 | 0.074 | 27.892 | 14.717 | 6.177 | 4.552 |
| 9 | 0.500 | 0.266 | 0.104 | 0.074 | 27.853 | 14.703 | 6.169 | 4.545 |
| 10 | 0.500 | 0.266 | 0.104 | 0.074 | 27.853 | 14.703 | 6.169 | 4.546 |
| 11 | 0.501 | 0.267 | 0.104 | 0.074 | 27.860 | 14.705 | 6.170 | 4.546 |
| 12 | 0.499 | 0.266 | 0.104 | 0.074 | 27.801 | 14.683 | 6.157 | 4.535 |
| 13 | 0.500 | 0.267 | 0.104 | 0.074 | 27.839 | 14.693 | 6.158 | 4.532 |
| 14 | 0.500 | 0.267 | 0.104 | 0.074 | 27.839 | 14.693 | 6.154 | 4.532 |
| 15 | 0.500 | 0.266 | 0.104 | 0.074 | 27.839 | 14.695 | 6.160 | 4.537 |
| 16 | 0.500 | 0.266 | 0.104 | 0.074 | 27.838 | 14.694 | 6.159 | 4.536 |
| 17 | 0.501 | 0.267 | 0.104 | 0.074 | 27.855 | 14.700 | 6.159 | 4.536 |
| 18 | 0.500 | 0.266 | 0.104 | 0.074 | 27.829 | 14.692 | 6.158 | 4.536 |
| 19 | 0.500 | 0.266 | 0.104 | 0.074 | 27.816 | 14.687 | 6.157 | 4.535 |
| 20 | 0.500 | 0.267 | 0.104 | 0.074 | 27.849 | 14.698 | 6.157 | 4.535 |
Table 3.
SS and S1 values were obtained for the different probabilities of exceedance.
Table 3.
SS and S1 values were obtained for the different probabilities of exceedance.
| No | SS | S1 |
|---|
| Probability of Exceedance in 50 Years | Probability of Exceedance in 50 Years |
|---|
| 2% | 10% | 50% | 68% | 2% | 10% | 50% | 68% |
|---|
| 1 | 1.222 | 0.625 | 0.237 | 0.169 | 0.306 | 0.167 | 0.072 | 0.053 |
| 2 | 1.220 | 0.624 | 0.237 | 0.169 | 0.306 | 0.167 | 0.072 | 0.053 |
| 3 | 1.222 | 0.625 | 0.237 | 0.169 | 0.306 | 0.167 | 0.072 | 0.053 |
| 4 | 1.222 | 0.625 | 0.237 | 0.169 | 0.306 | 0.167 | 0.072 | 0.053 |
| 5 | 1.221 | 0.624 | 0.237 | 0.169 | 0.306 | 0.167 | 0.072 | 0.053 |
| 6 | 1.221 | 0.625 | 0.237 | 0.169 | 0.306 | 0.167 | 0.072 | 0.053 |
| 7 | 1.222 | 0.625 | 0.237 | 0.169 | 0.306 | 0.167 | 0.072 | 0.053 |
| 8 | 1.221 | 0.624 | 0.237 | 0.169 | 0.306 | 0.167 | 0.072 | 0.053 |
| 9 | 1.220 | 0.624 | 0.237 | 0.169 | 0.306 | 0.167 | 0.072 | 0.053 |
| 10 | 1.220 | 0.624 | 0.237 | 0.169 | 0.306 | 0.167 | 0.072 | 0.053 |
| 11 | 1.222 | 0.625 | 0.237 | 0.169 | 0.306 | 0.167 | 0.072 | 0.053 |
| 12 | 1.219 | 0.624 | 0.237 | 0.169 | 0.306 | 0.167 | 0.072 | 0.053 |
| 13 | 1.222 | 0.625 | 0.237 | 0.169 | 0.306 | 0.167 | 0.072 | 0.053 |
| 14 | 1.222 | 0.624 | 0.237 | 0.169 | 0.306 | 0.167 | 0.072 | 0.053 |
| 15 | 1.221 | 0.625 | 0.237 | 0.169 | 0.306 | 0.167 | 0.072 | 0.053 |
| 16 | 1.221 | 0.625 | 0.237 | 0.169 | 0.306 | 0.167 | 0.072 | 0.053 |
| 17 | 1.222 | 0.625 | 0.237 | 0.169 | 0.306 | 0.167 | 0.072 | 0.053 |
| 18 | 1.221 | 0.624 | 0.237 | 0.169 | 0.306 | 0.167 | 0.072 | 0.053 |
| 19 | 1.220 | 0.625 | 0.237 | 0.169 | 0.306 | 0.167 | 0.072 | 0.053 |
| 20 | 1.221 | 0.625 | 0.237 | 0.169 | 0.306 | 0.167 | 0.072 | 0.053 |
Table 4.
Local soil class type ZB [
17].
Table 4.
Local soil class type ZB [
17].
| Local Soil Class | Soil Type | Upper Average at 30 m |
|---|
| (VS)30 [m/s] | (N60)30
[Pulse/30 cm] | (cu)30 [kPa] |
|---|
| ZB | Slightly weathered, medium-tough rocks | 760–1500 | --- | --- |
Table 5.
Seismic parameters for selected locations.
Table 5.
Seismic parameters for selected locations.
| No | FS | F1 | SDS | SD1 | TA | TB | TAD | TBD |
|---|
| 1 | 0.900 | 0.800 | 0.563 | 0.134 | 0.048 | 0.238 | 0.016 | 0.079 |
| 2 | 0.900 | 0.800 | 0.562 | 0.134 | 0.048 | 0.238 | 0.016 | 0.079 |
| 3 | 0.900 | 0.800 | 0.563 | 0.134 | 0.048 | 0.238 | 0.016 | 0.079 |
| 4 | 0.900 | 0.800 | 0.563 | 0.134 | 0.048 | 0.238 | 0.016 | 0.079 |
| 5 | 0.900 | 0.800 | 0.562 | 0.134 | 0.048 | 0.238 | 0.016 | 0.079 |
| 6 | 0.900 | 0.800 | 0.563 | 0.134 | 0.048 | 0.238 | 0.016 | 0.079 |
| 7 | 0.900 | 0.800 | 0.563 | 0.134 | 0.048 | 0.238 | 0.016 | 0.079 |
| 8 | 0.900 | 0.800 | 0.562 | 0.134 | 0.048 | 0.238 | 0.016 | 0.079 |
| 9 | 0.900 | 0.800 | 0.562 | 0.134 | 0.048 | 0.238 | 0.016 | 0.079 |
| 10 | 0.900 | 0.800 | 0.562 | 0.134 | 0.048 | 0.238 | 0.016 | 0.079 |
| 11 | 0.900 | 0.800 | 0.563 | 0.134 | 0.048 | 0.238 | 0.016 | 0.079 |
| 12 | 0.900 | 0.800 | 0.562 | 0.133 | 0.047 | 0.236 | 0.016 | 0.079 |
| 13 | 0.900 | 0.800 | 0.563 | 0.133 | 0.047 | 0.236 | 0.016 | 0.079 |
| 14 | 0.900 | 0.800 | 0.563 | 0.133 | 0.047 | 0.236 | 0.016 | 0.079 |
| 15 | 0.900 | 0.800 | 0.563 | 0.134 | 0.048 | 0.238 | 0.016 | 0.079 |
| 16 | 0.900 | 0.800 | 0.563 | 0.133 | 0.047 | 0.236 | 0.016 | 0.079 |
| 17 | 0.900 | 0.800 | 0.563 | 0.134 | 0.048 | 0.238 | 0.016 | 0.079 |
| 18 | 0.900 | 0.800 | 0.562 | 0.133 | 0.047 | 0.236 | 0.016 | 0.079 |
| 19 | 0.900 | 0.800 | 0.562 | 0.133 | 0.047 | 0.236 | 0.016 | 0.079 |
| 20 | 0.900 | 0.800 | 0.563 | 0.134 | 0.048 | 0.238 | 0.016 | 0.079 |
Table 6.
Earthquake hazard zones and base score for masonry structures [
16].
Table 6.
Earthquake hazard zones and base score for masonry structures [
16].
Number of
Stories | Earthquake Hazard Zone |
|---|
Region I
| Region II–III
| Region IV
|
|---|
| 1 | 110 | 120 | 130 |
| 2 | 100 | 110 | 120 |
| 3 | 90 | 100 | 110 |
| 4 | 80 | 90 | 100 |
| 5 | 70 | 80 | 90 |
Table 7.
Parameters for calculating the wall quantity.
Table 7.
Parameters for calculating the wall quantity.
| Plan Width (Front Facade) (m) | A | Plan Width (Side Facade) (m) | B |
| Distance of Gap (Front Facade) (m) | x + y | Distance of Gap (Side Facade) (m) | z + t |
| Gap-to-Length Ratio (BO) = (x + y + z + t)/(A + B) |
| Amount of wall (DM) |
If BO ≤ 1/3 DM = High
If 1/3 < BO ≤ 2/3 DM= Medium
If 2/3 < BO DM = Low |
Table 8.
Negative parameter values
[
16].
Table 8.
Negative parameter values
[
16].
| Number | Negativity Parameter | Case 1 | Case 2 |
|---|
| Parameter Detection | Parameter Value | Parameter Detection | Parameter Value |
|---|
| 1 | Building Order | Separate | 0 | Adjacent/Adjacent to Corner | 1 |
| 2 | Material Quality | Good | 0 | Moderate, (Bad) | 1, (2) |
| 3 | Wall Labor | Good | 0 | Moderate, (Bad) | 1, (2) |
| 4 | Current Damage | None | 0 | Available | 1 |
| 5 | Irregularity in the Plan | None | 0 | Irregular, (Extremely Irregular) | 1, (2) |
| 6 | Lack of horizontal bond beam | Above the window, Above the wall | 0 | None | 1 |
| 7 | Insufficient wall quantity (DM) | High | 0 | Moderate, (Low) | 1, (2) |
| 8 | Vertical spacing irregularity | None | 0 | Less Irregular, (Irregular) | 1, (2) |
| 9 | Floor Difference by Facade | None | 0 | Available | 1 |
| 10 | Soft/Weak Story | None | 0 | Available | 1 |
| 11 | Floor Type | Reinforced concrete | 0 | Wood, Volto | 1 |
| 12 | Mortar Material | Cement | 0 | Lime, Mud, None | 1 |
| 13 | Wall-to-Wall Connection | Good | 0 | Bad | 1 |
| 14 | Wall-to-Floor Connection | Good | 0 | Bad | 1 |
| 15 | Roof Material | Tile, Sheet, Concrete | 0 | Soil | 1 |
Table 9.
Current status and quality negativity scores [
16].
Table 9.
Current status and quality negativity scores [
16].
| Material Quality (0/1/2) | Wall Labor (0/1/2) | Current Damage (0/1) |
|---|
| −10 | −5 | −5 |
Table 10.
Negative scores in the plan [
16].
Table 10.
Negative scores in the plan [
16].
Geometry
(0/1/2) | Amount of Wall
(0/1/2) | Bond Beam/Lintel (0/1) |
|---|
| −5 | −5 | −5 |
| −10 | −5 | −5 |
| −10 | −10 | −5 |
| −15 | −10 | −5 |
| −20 | −15 | −5 |
Table 11.
Vertical negativity scores (PDRB-2019).
Table 11.
Vertical negativity scores (PDRB-2019).
| Number of Floors | Space Layout (0/1/2) | Floor Difference
According to the
Facade (0/1) | Soft/Weak Story (0/1) |
|---|
| 1 | 0 | −5 | 0 |
| 2 | −5 | −5 | −5 |
| 3 | −5 | −5 | −5 |
| 4 | −10 | −5 | −10 |
| 5 | −10 | −5 | −10 |
Table 12.
Negativity scores of building order and floor level (PDRB-2019).
Table 12.
Negativity scores of building order and floor level (PDRB-2019).
| Separate | Adjacent Middle–Same | Adjacent Edge–Same | Adjacent
Middle–Different | Adjacent
Edge–Different |
|---|
| 0 | 0 | −5 | −5 | −10 |
Table 13.
Parameters of the investigated masonry structures.
Table 13.
Parameters of the investigated masonry structures.
| Parameters | 1 | 2 | 3 | 4 | 5 | 6 | 7 | 8 | 9 | 10 |
|---|
| Number of floors | 1 | 2 | 3 | 2 | 3 | 2 | 2 | 2 | 2 | 2 |
| Building Order | Adjacent corner | Adjacent corner | Adjacent corner | Adjacent Medium | Adjacent corner | Separate | Separate | Separate | Separate | Adjacent corner |
| Material Quality | Bad | Good | Moderate | Bad | Good | Moderate | Moderate | Good | Good | Good |
| Wall Labor | Moderate | Good | Moderate | Bad | Good | Moderate | Moderate | Good | Good | Good |
| Current Damage | Available | Available | Available | Available | None | Available | None | Available | Available | Available |
| Irregularity in the Plan | Regular | Extremely Irregular | Extremely Irregular | Regular | Regular | Regular | Irregular | Irregular | Irregular | Irregular |
| Lack of horizontal bond beam | None | Available | Available | Available | Available | Available | Available | Available | Available | Available |
| Insufficient amount of wall (DM) | 0.15 | 0.17 | 0.21 | 0.15 | 0.08 | 0.24 | 0.18 | 0.23 | 0.15 | 0.06 |
| Vertical spacing irregularity | Regular | Less Irregular | Irregular | Irregular | Less Irregular | Less Irregular | Less Irregular | Less Irregular | Less Irregular | Less Irregular |
| Floor Difference by Facade | None | Available | Available | Available | Available | Available | Available | None | Available | Available |
| Soft /Weak Story | None | None | None | None | None | None | None | None | None | None |
| Mortar Material | Mud | Mud | Mud | Mud | Mud | Mud | Mud | Mud | Mud | Mud |
| Wall-to-Wall Connection | Moderate | Moderate | Good | Bad | Good | Moderate | Moderate | Bad | Good | Bad |
| Wall-to-Floor Connection | Moderate | Moderate | Good | Bad | Good | Moderate | Moderate | Bad | Good | Bad |
| Roof Material | Soil | Soil | Soil | Soil | Soil | Soil | Soil | Soil | Soil | Soil |
| Parameters | 11 | 12 | 13 | 14 | 15 | 16 | 17 | 18 | 19 | 20 |
| Number of floors | 3 | 2 | 3 | 2 | 3 | 2 | 2 | 2 | 2 | 3 |
| Building Order | Adjacent corner | Adjacent corner | Adjacent
Medium | Adjacent Medium | Adjacent corner | Separate | Adjacent
corner | Adjacent
corner | Adjacent
corner | Adjacent corner |
| Material Quality | Bad | Moderate | Moderate | Moderate | Good | Good | Good | Good | Good | Moderate |
| Wall Labor | Bad | Moderate | Moderate | Bad | Good | Good | Good | Good | Good | Moderate |
| Current Damage | Available | None | None | Available | Available | Available | Available | Available | None | None |
| Irregularity in the Plan | Regular | Regular | Regular | Regular | Regular | Regular | Regular | Irregular | Irregular | Irregular |
| Lack of horizontal bond beam | Available | Available | Available | Available | Available | Available | Available | None | Available | Available |
| Insufficient amount of wall (DM) | 0.1 | 0.09 | 0.14 | 0.14 | 0.03 | 0.06 | 0.17 | 0.31 | 0.19 | 0.06 |
| Vertical spacing irregularity | Irregular | Less Irregular | Less Irregular | Less Irregular | Irregular | Irregular | Irregular | Regular | Less Irregular | Less Irregular |
| Floor Difference by Facade | Available | Available | Available | Available | Available | Available | Available | Available | Available | Available |
| Soft /Weak Story | None | None | None | None | None | None | None | None | None | None |
| Mortar Material | Mud | Mud | Mud | Mud | Mud | Mud | Mud | Mud | Mud | Mud |
| Wall-to-Wall Connection | Good | Good | Good | Good | Bad | Good | Bad | Good | Good | Good |
| Wall-to-Floor Connection | Good | Good | Good | Good | Bad | Good | Bad | Good | Good | Good |
| Roof Material | Soil | Soil | Soil | Soil | Soil | Soil | Soil | Soil | Soil | Soil |
Table 14.
Parameter values and structural result scores of the examined structures.
Table 14.
Parameter values and structural result scores of the examined structures.
| Parameters | Building No |
|---|
| 1 | 2 | 3 | 4 | 5 | 6 | 7 | 8 | 9 | 10 | 11 | 12 | 13 | 14 | 15 | 16 | 17 | 18 | 19 | 20 |
|---|
| Base Score | 120 | 110 | 100 | 110 | 100 | 110 | 110 | 110 | 110 | 110 | 100 | 110 | 100 | 110 | 100 | 110 | 110 | 110 | 110 | 100 |
| Building Order | −5 | −5 | −5 | −5 | 0 | 0 | 0 | 0 | 0 | −5 | −5 | −5 | 0 | 0 | −5 | 0 | −5 | −5 | −5 | −5 |
| Material Quality | −20 | 0 | −10 | −20 | 0 | −10 | −10 | 0 | 0 | 0 | −20 | −10 | −10 | −10 | 0 | 0 | 0 | 0 | 0 | −10 |
| Wall Labor | −5 | 0 | −5 | −10 | 0 | −5 | −5 | 0 | 0 | 0 | −10 | −5 | −5 | −5 | 0 | 0 | 0 | 0 | 0 | −5 |
| Current Damage | −5 | −5 | −5 | −5 | 0 | −5 | 0 | −5 | −5 | −5 | −5 | 0 | 0 | −5 | −5 | −5 | −5 | −5 | 0 | 0 |
| Irregularity in the Plan | 0 | −20 | −20 | 0 | 0 | 0 | 0 | −10 | −10 | −10 | 0 | 0 | 0 | 0 | 0 | 0 | 0 | −10 | −10 | −10 |
| Lack of horizontal bond beam | 0 | −5 | −5 | −5 | −5 | −5 | −5 | −5 | −5 | −5 | −5 | −5 | −5 | −5 | −5 | −5 | −5 | 0 | −5 | −5 |
| Insufficient wall amount (DM) | 0 | 0 | 0 | 0 | 0 | 0 | 0 | 0 | 0 | 0 | 0 | 0 | 0 | 0 | 0 | 0 | 0 | 0 | 0 | 0 |
| Vertical spacing irregularity | 0 | −5 | −10 | −10 | −5 | −5 | −5 | −5 | −5 | −5 | 0 | 0 | 0 | 0 | 0 | 0 | 0 | −5 | −5 | −5 |
| Floor Difference by Facade | 0 | −5 | −5 | −5 | −5 | −5 | −5 | 0 | −5 | 0 | −5 | −5 | −5 | −5 | −5 | −5 | −5 | −5 | −5 | −5 |
| Soft/Weak Story | 0 | 0 | 0 | 0 | 0 | 0 | 0 | 0 | 0 | 0 | 0 | 0 | 0 | 0 | 0 | 0 | 0 | 0 | 0 | 0 |
| Floor Type | 0 | 0 | 0 | −10 | 0 | 0 | 0 | −10 | 0 | −10 | 0 | 0 | 0 | 0 | −10 | 0 | −10 | 0 | 0 | 0 |
| Mortar Material |
| Wall-to-Wall Connection |
| Wall-to-Floor Connection |
| Roof Material | −10 | −10 | −10 | −10 | −10 | −10 | −10 | −10 | −10 | −10 | −10 | −10 | −10 | −10 | −10 | −10 | −10 | −10 | −10 | −10 |
| Building performance score | 75 | 55 | 25 | 30 | 75 | 65 | 70 | 65 | 70 | 60 | 40 | 70 | 65 | 70 | 60 | 85 | 70 | 70 | 70 | 45 |
| Disclaimer/Publisher’s Note: The statements, opinions and data contained in all publications are solely those of the individual author(s) and contributor(s) and not of MDPI and/or the editor(s). MDPI and/or the editor(s) disclaim responsibility for any injury to people or property resulting from any ideas, methods, instructions or products referred to in the content. |
© 2023 by the authors. Licensee MDPI, Basel, Switzerland. This article is an open access article distributed under the terms and conditions of the Creative Commons Attribution (CC BY) license (https://creativecommons.org/licenses/by/4.0/).


