Author Contributions
E.M.D.: Conceptualization, Software, Methodology, Visualization, Investigation, Validation, Writing-Reviewing and Editing, Data curation. P.R.: Writing-Original draft preparation, Visualization, Investigation, Methodology. V.B.: Supervision, Methodology, Writing- Reviewing and Editing. A.S.: Conceptualization, Methodology, Validation, Investigation, Writing- Reviewing and Editing. F.A.: Investigation, Data curation, Writing- Reviewing and Editing. All authors have read and agreed to the published version of the manuscript.
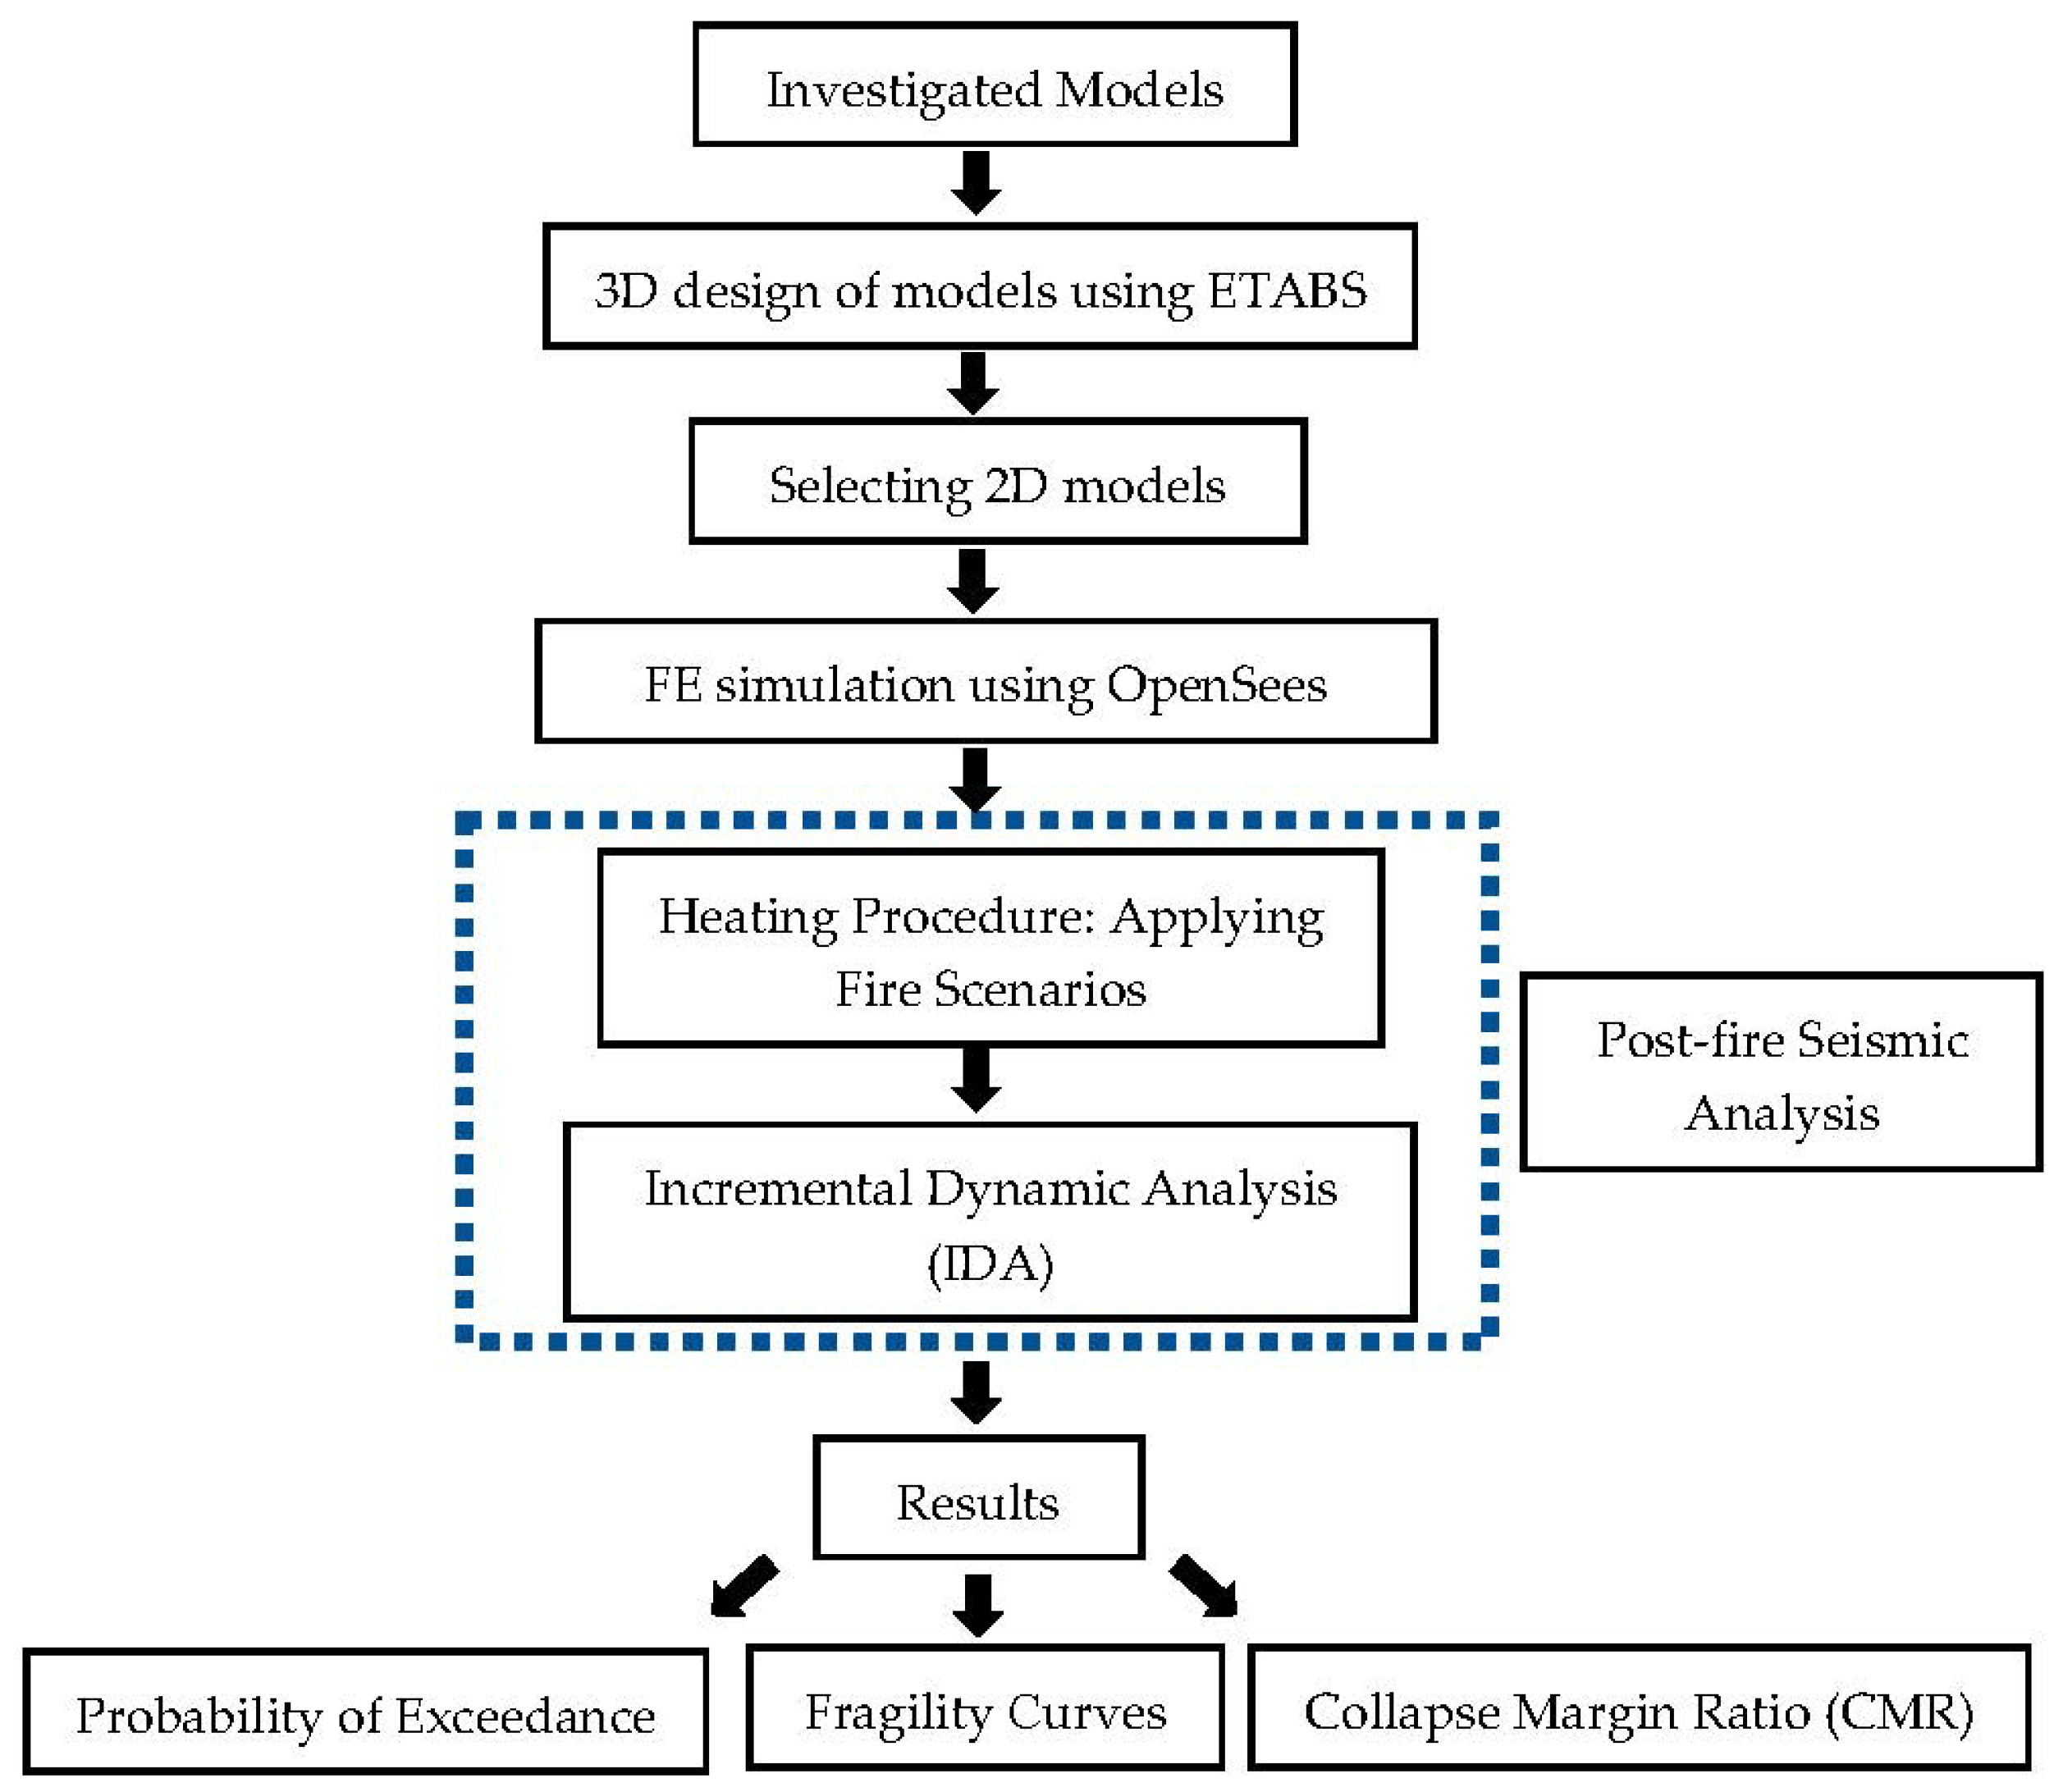
Figure 1.
Assessment procedure for post-fire seismic analyses.
Figure 1.
Assessment procedure for post-fire seismic analyses.
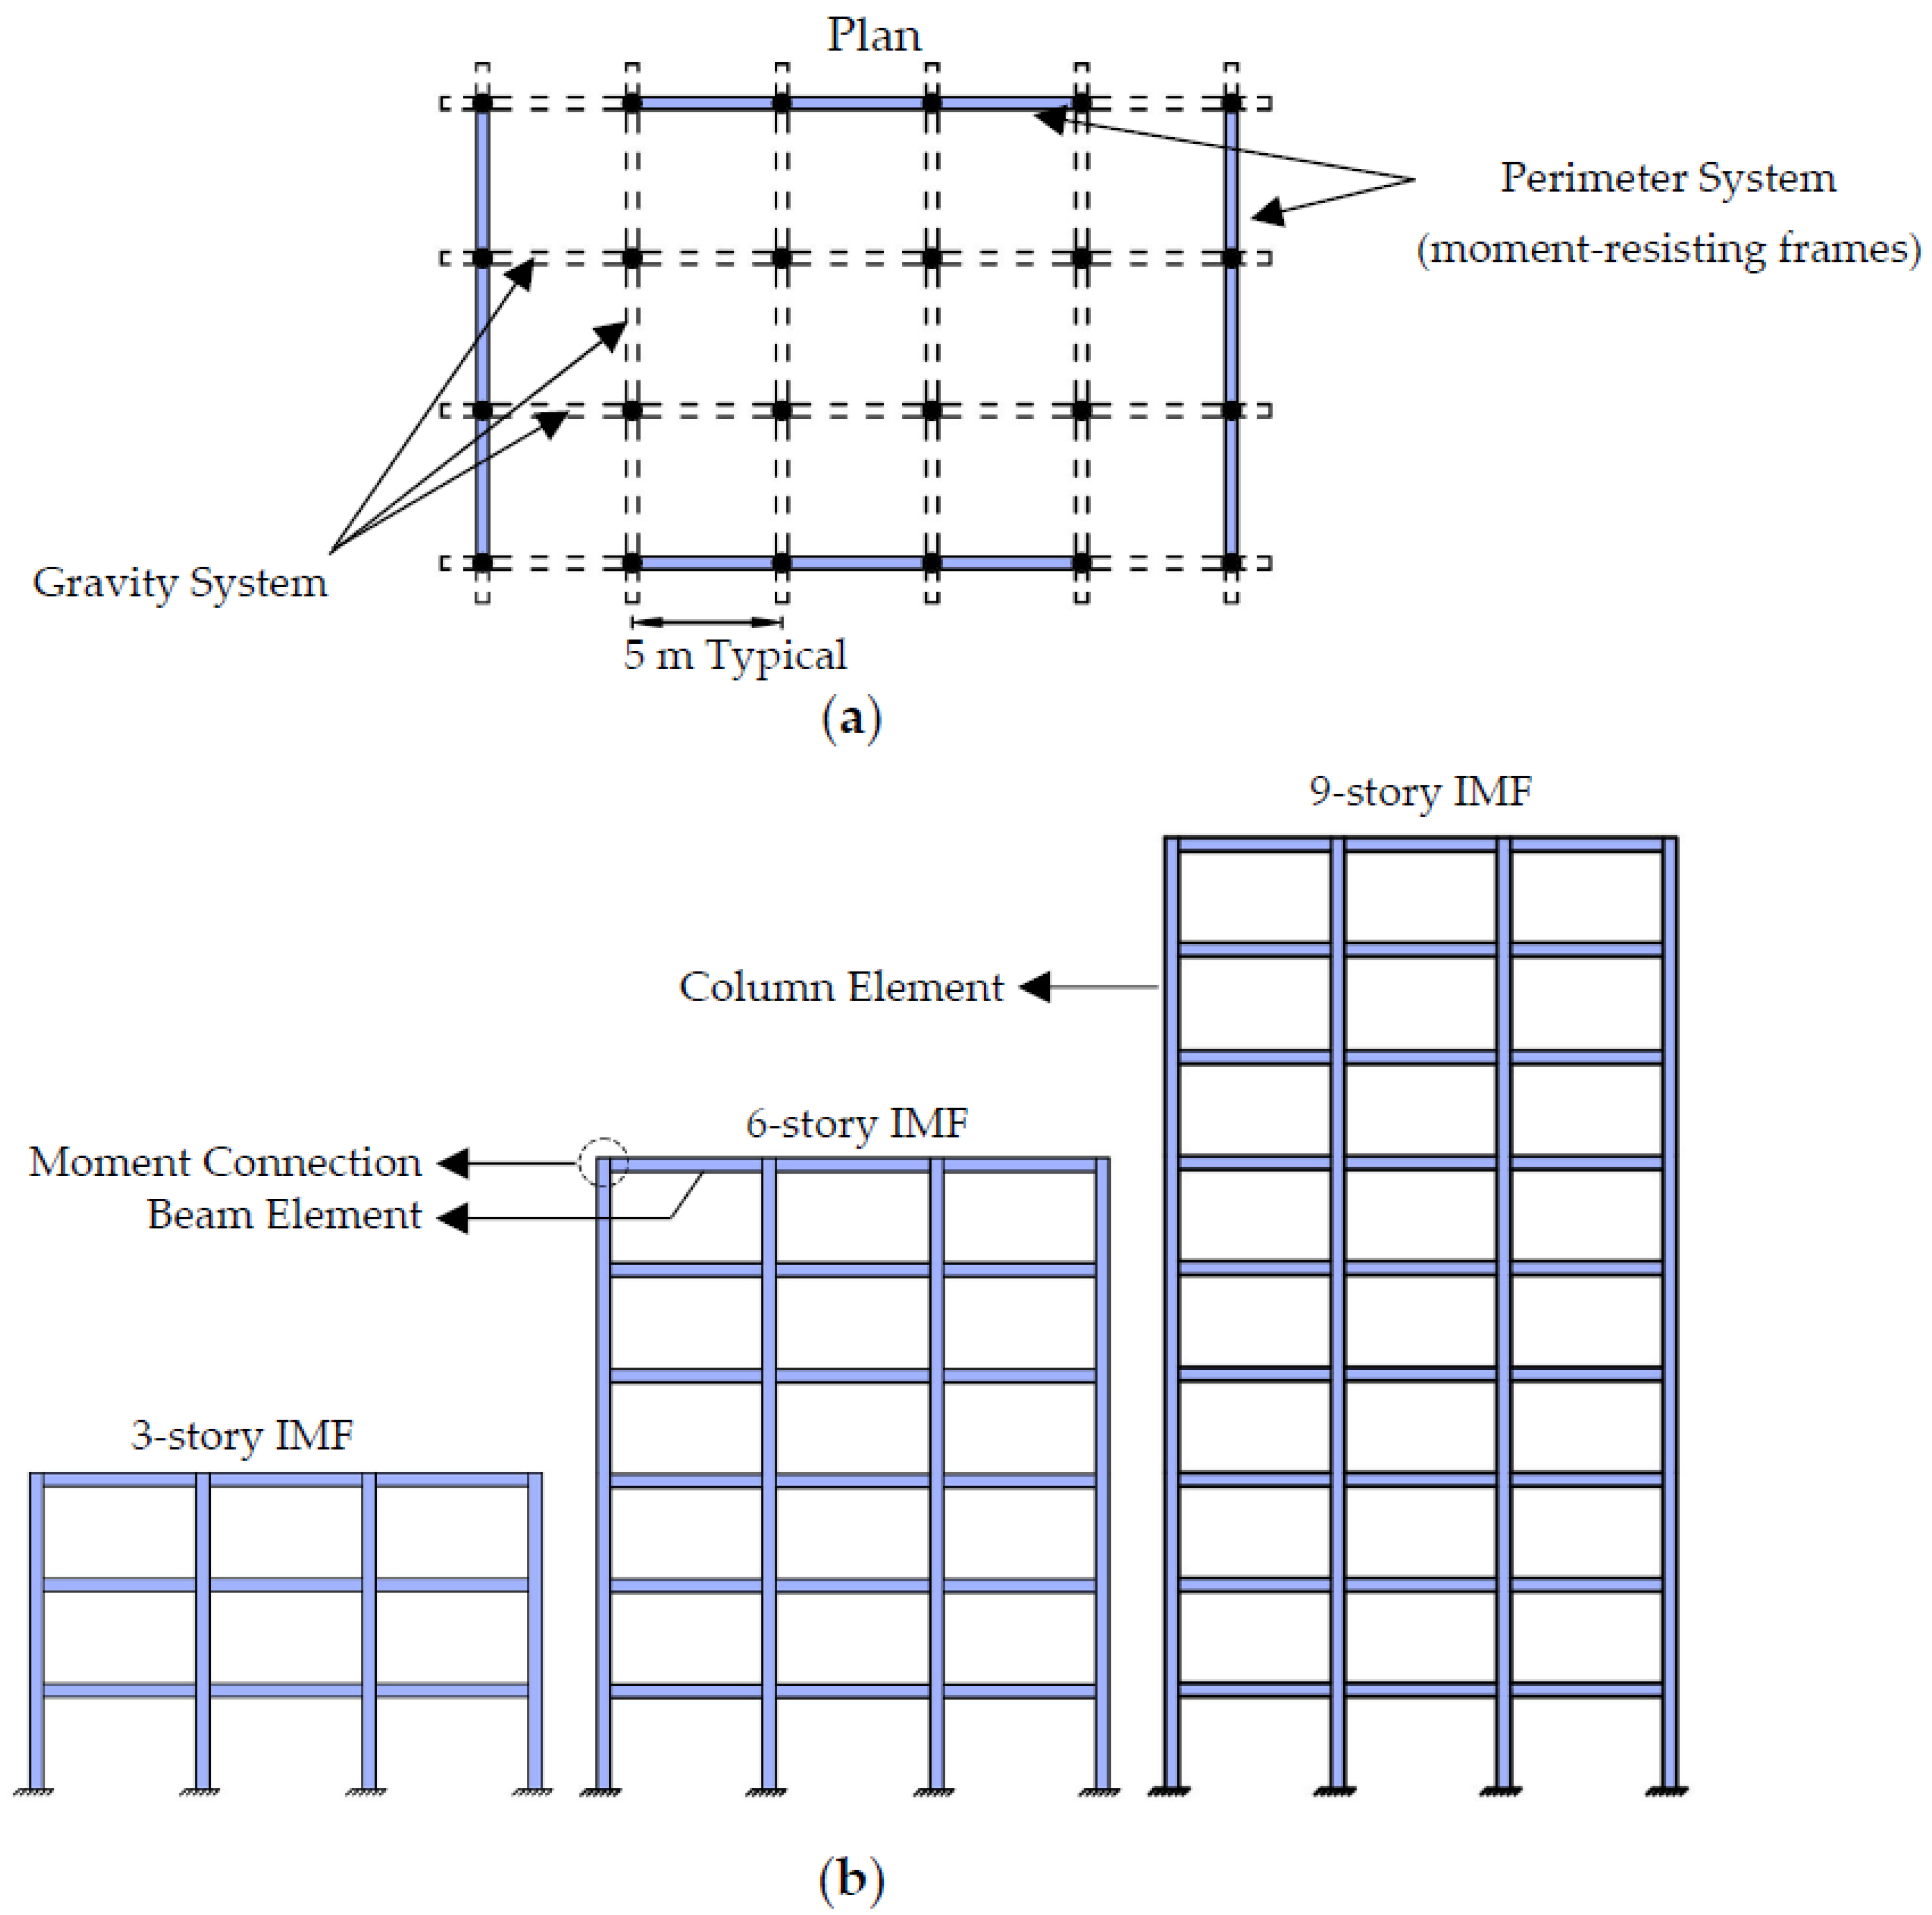
Figure 2.
Configuration of models: (a) Typical Plan; (b) Elevation of structures.
Figure 2.
Configuration of models: (a) Typical Plan; (b) Elevation of structures.
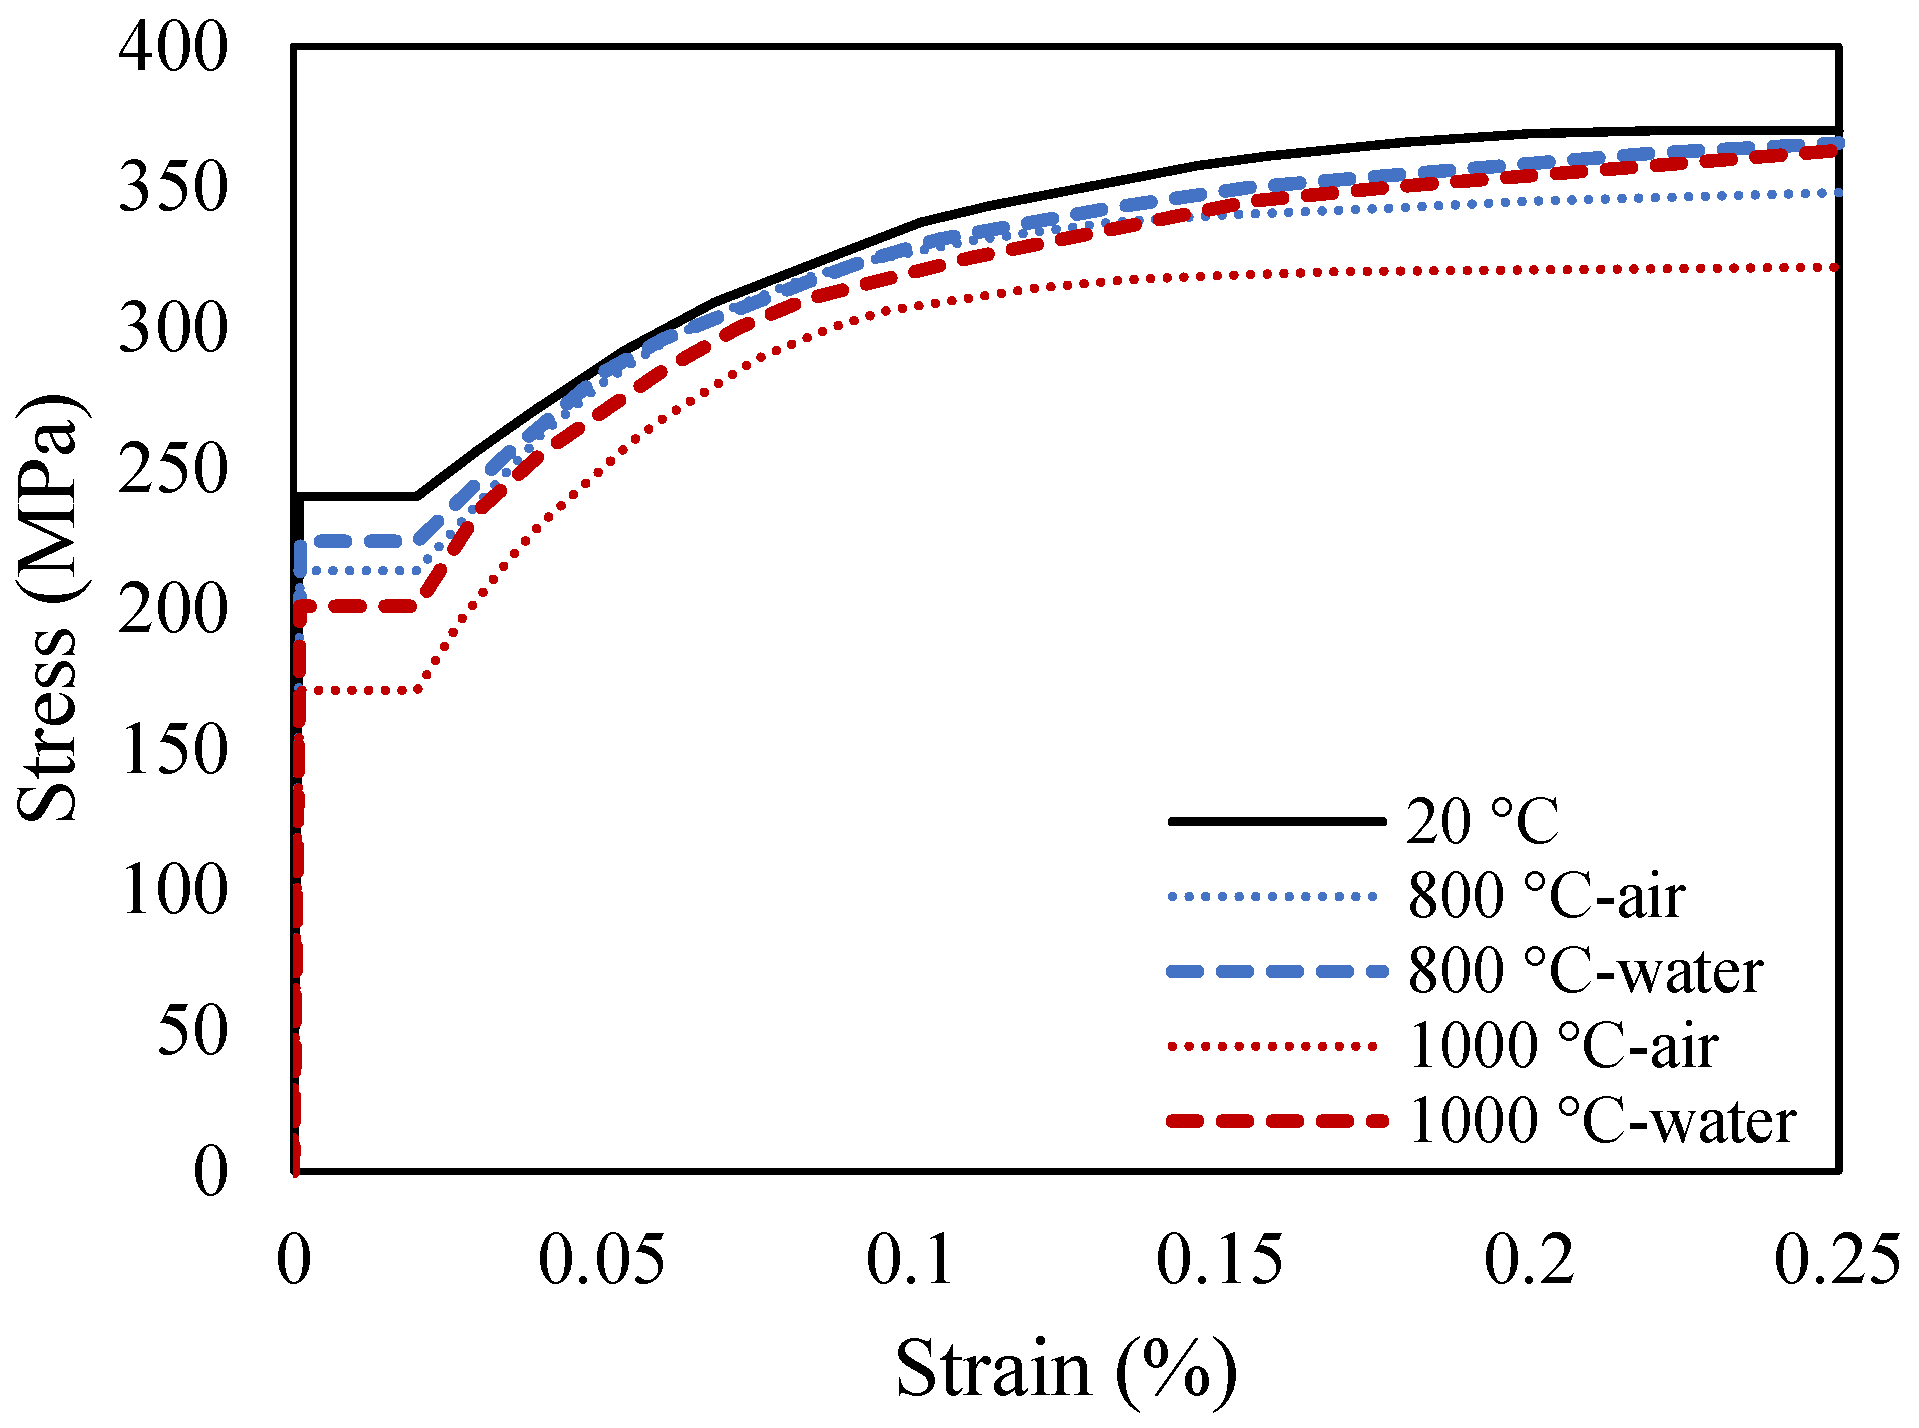
Figure 3.
Stress–strain curve of steel material at the elevated temperatures.
Figure 3.
Stress–strain curve of steel material at the elevated temperatures.
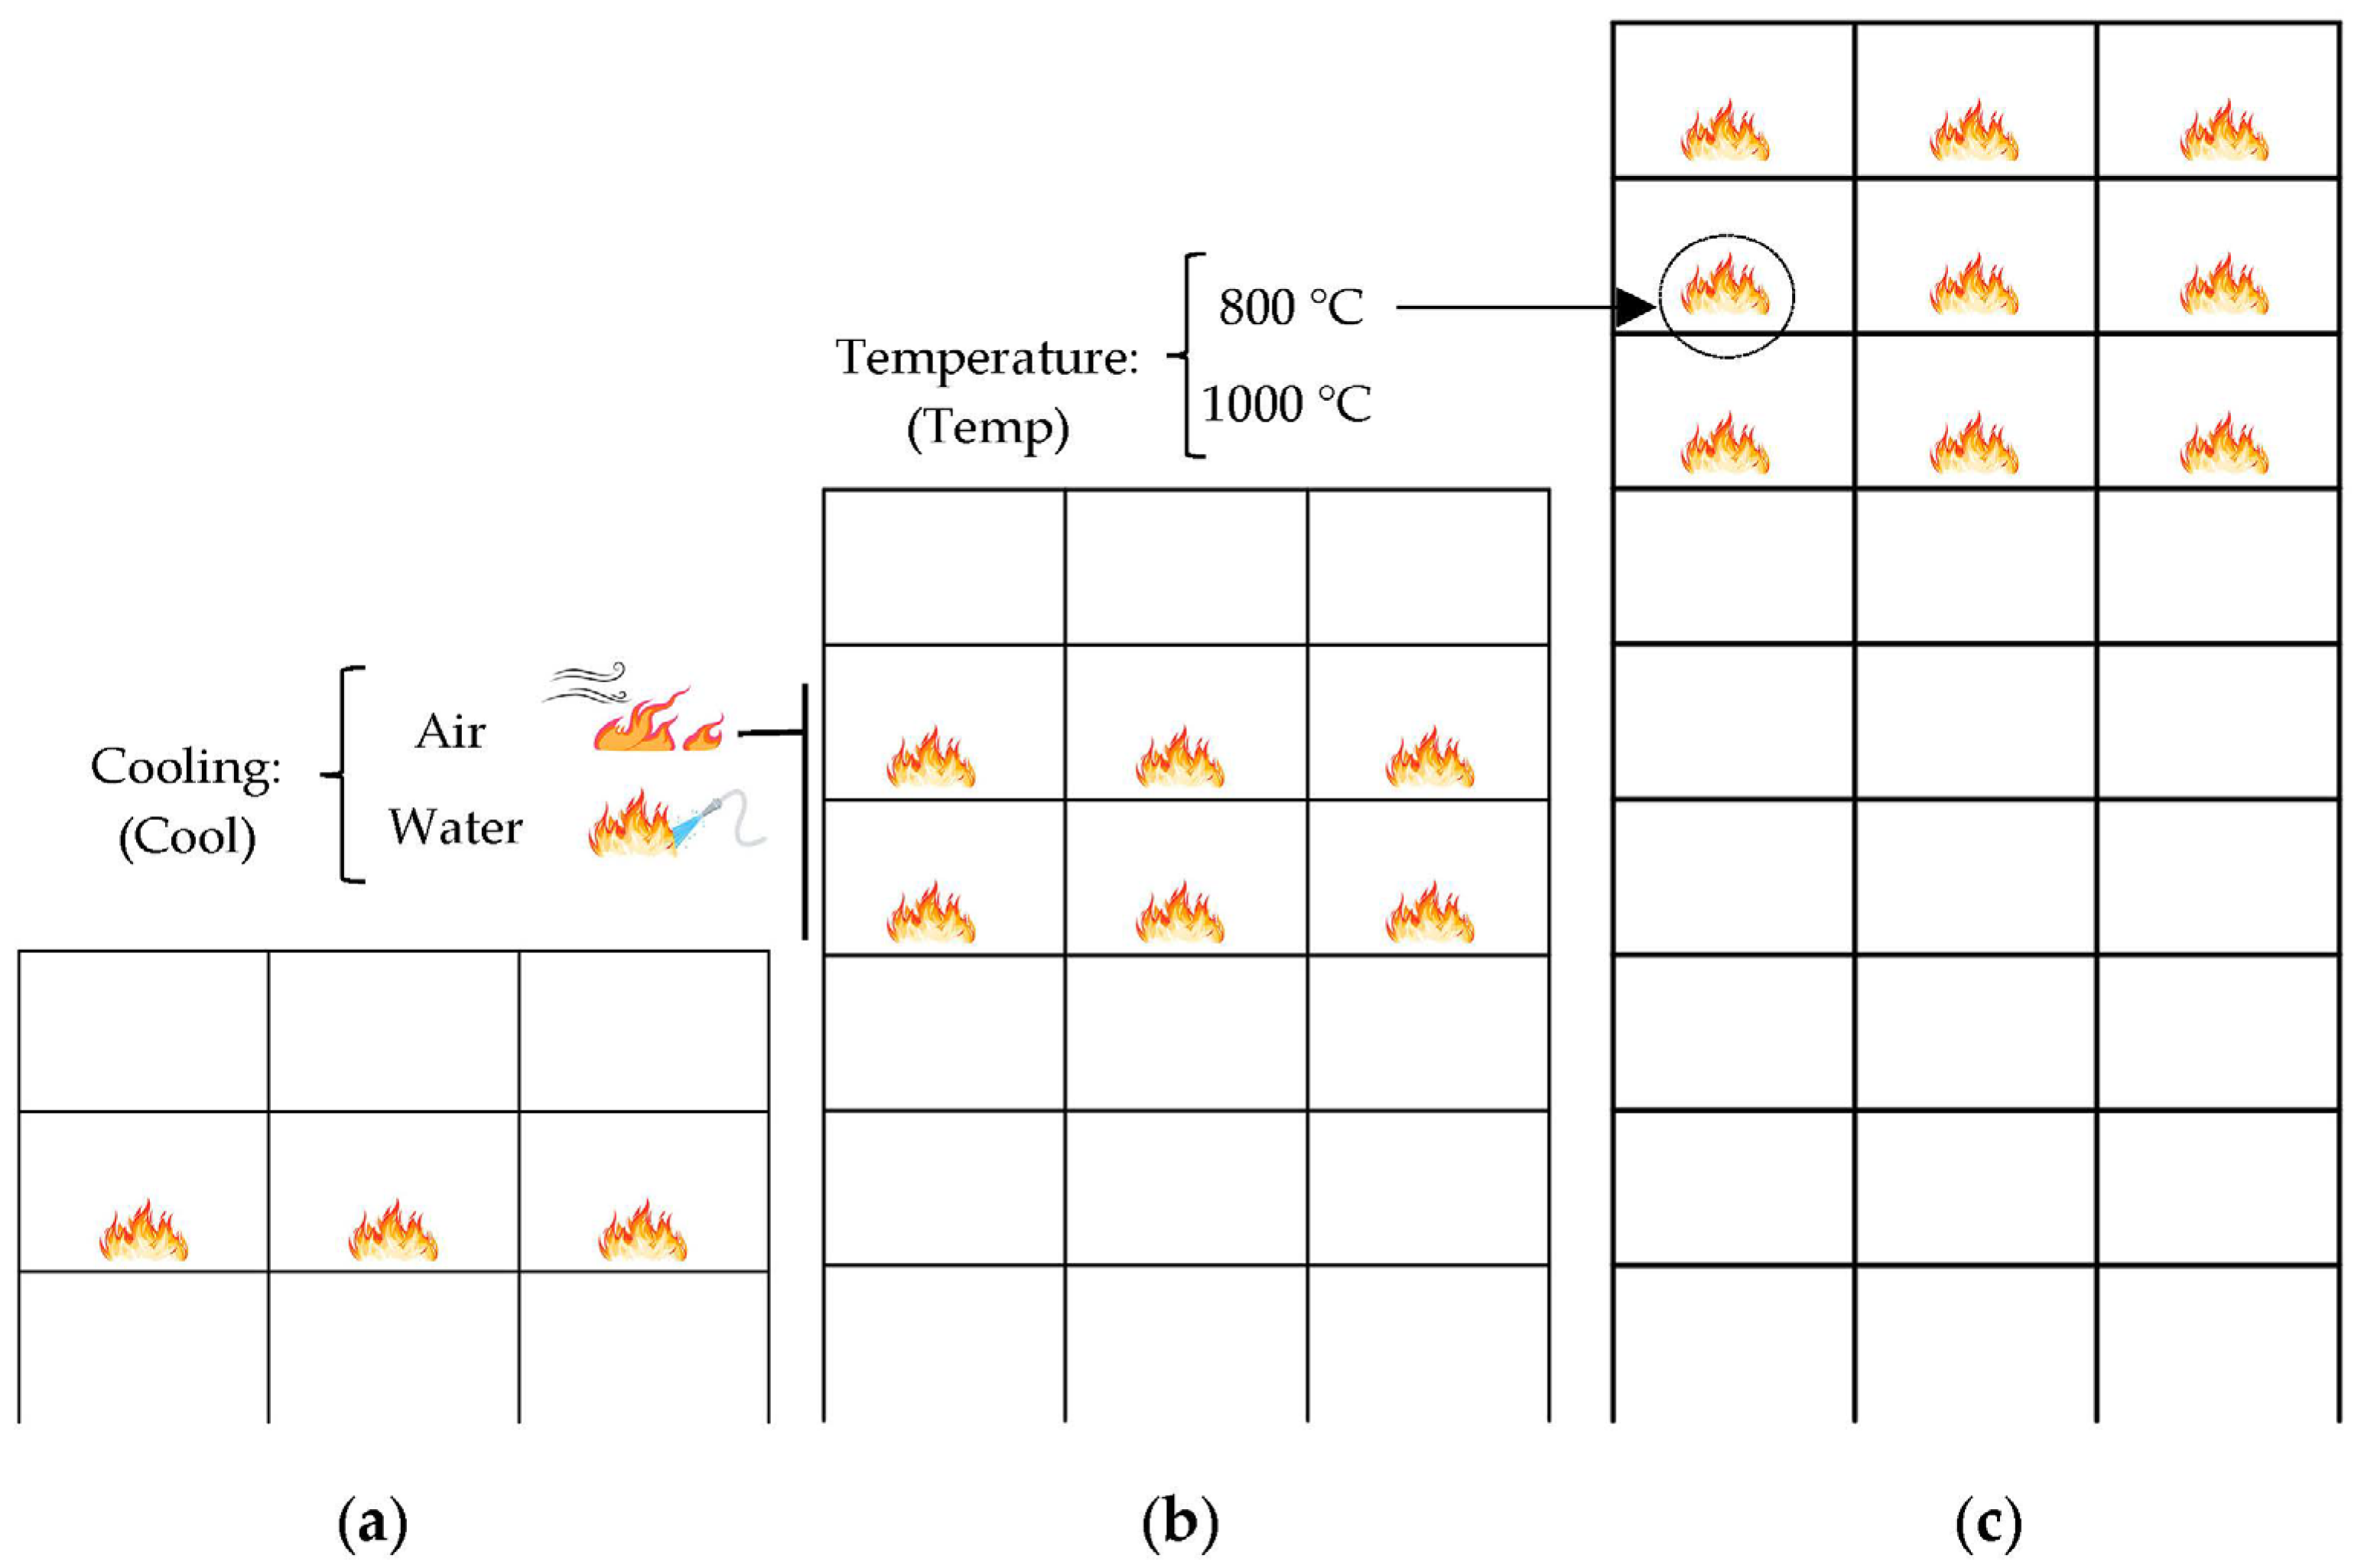
Figure 4.
Scheme of the fire scenarios; (a) [MRF03-2-Temp-Cool]; (b) [MRF06-4to5-Temp-Cool]; (c) [MRF09-7to9-Temp-Cool].
Figure 4.
Scheme of the fire scenarios; (a) [MRF03-2-Temp-Cool]; (b) [MRF06-4to5-Temp-Cool]; (c) [MRF09-7to9-Temp-Cool].
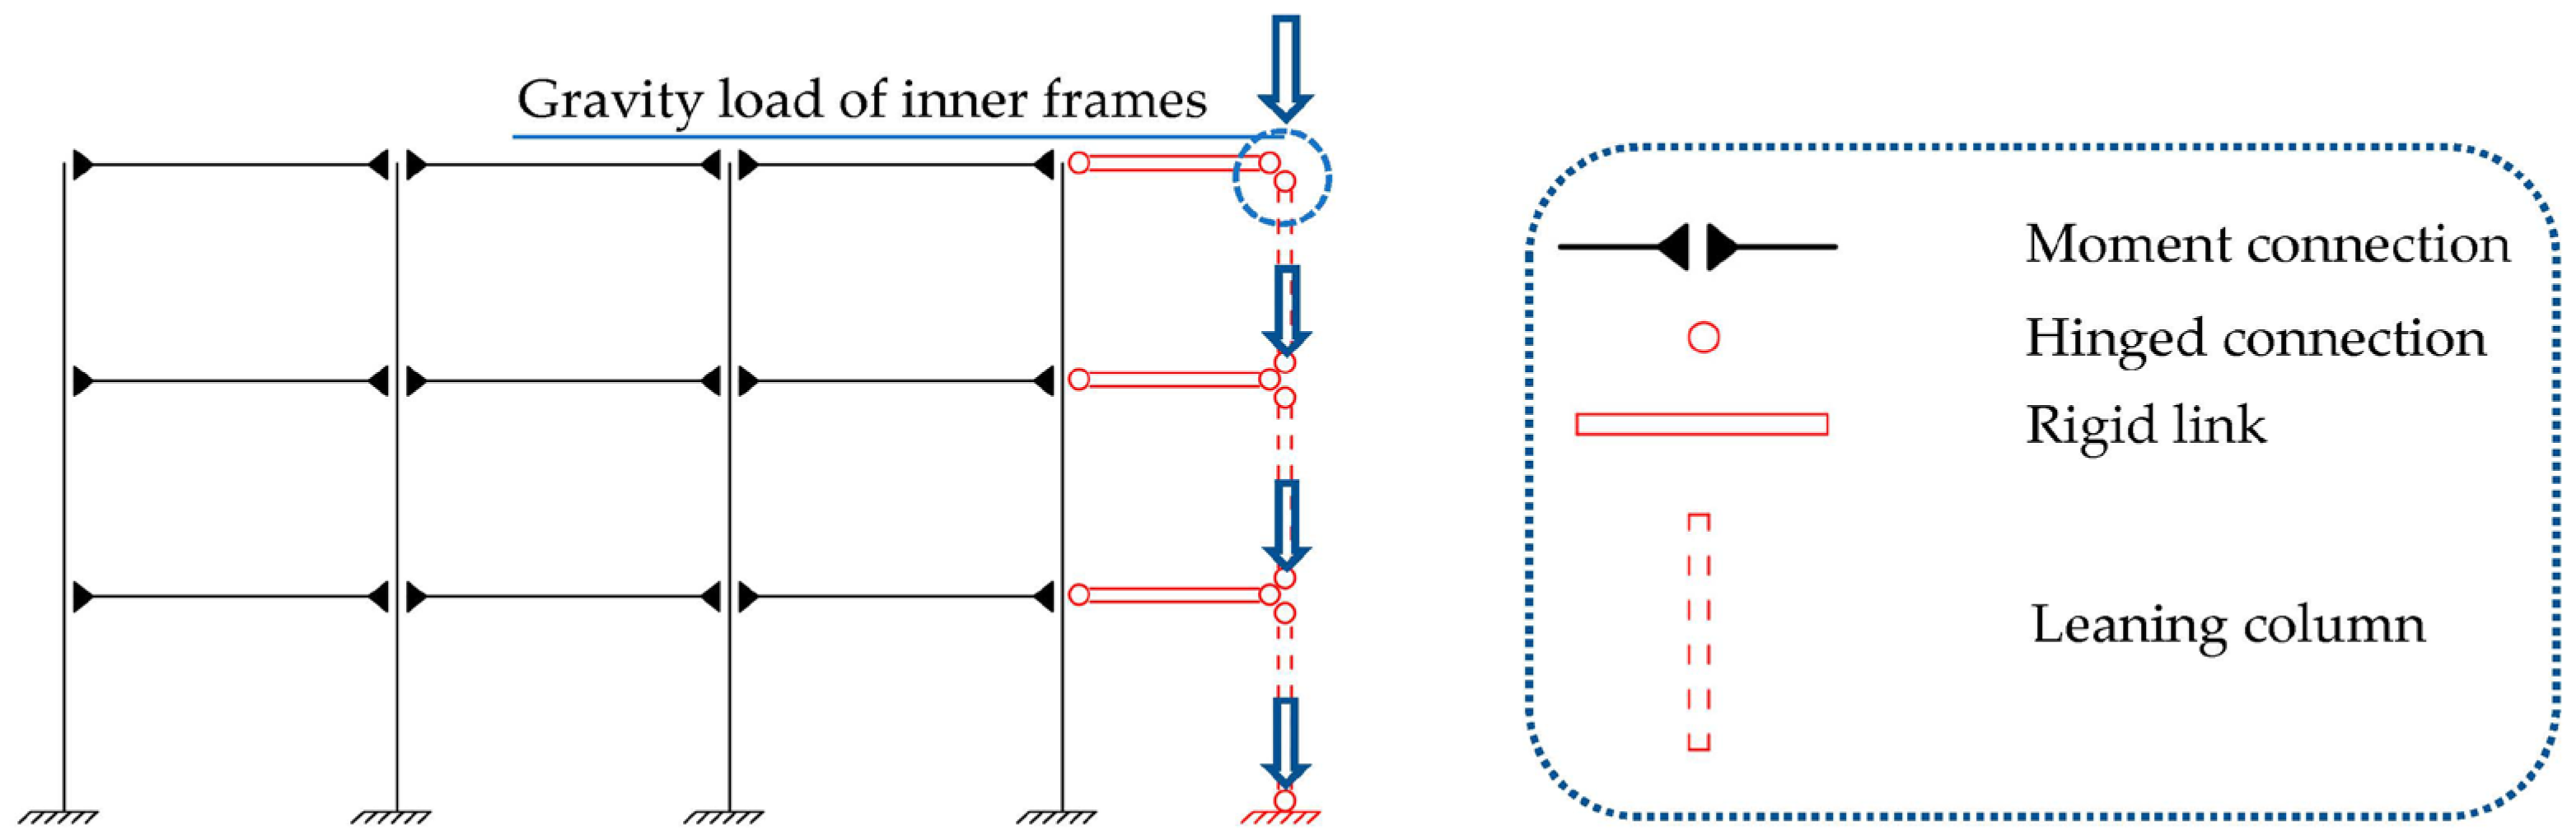
Figure 5.
Illustration of P-Δ column in 3-story FE model.
Figure 5.
Illustration of P-Δ column in 3-story FE model.
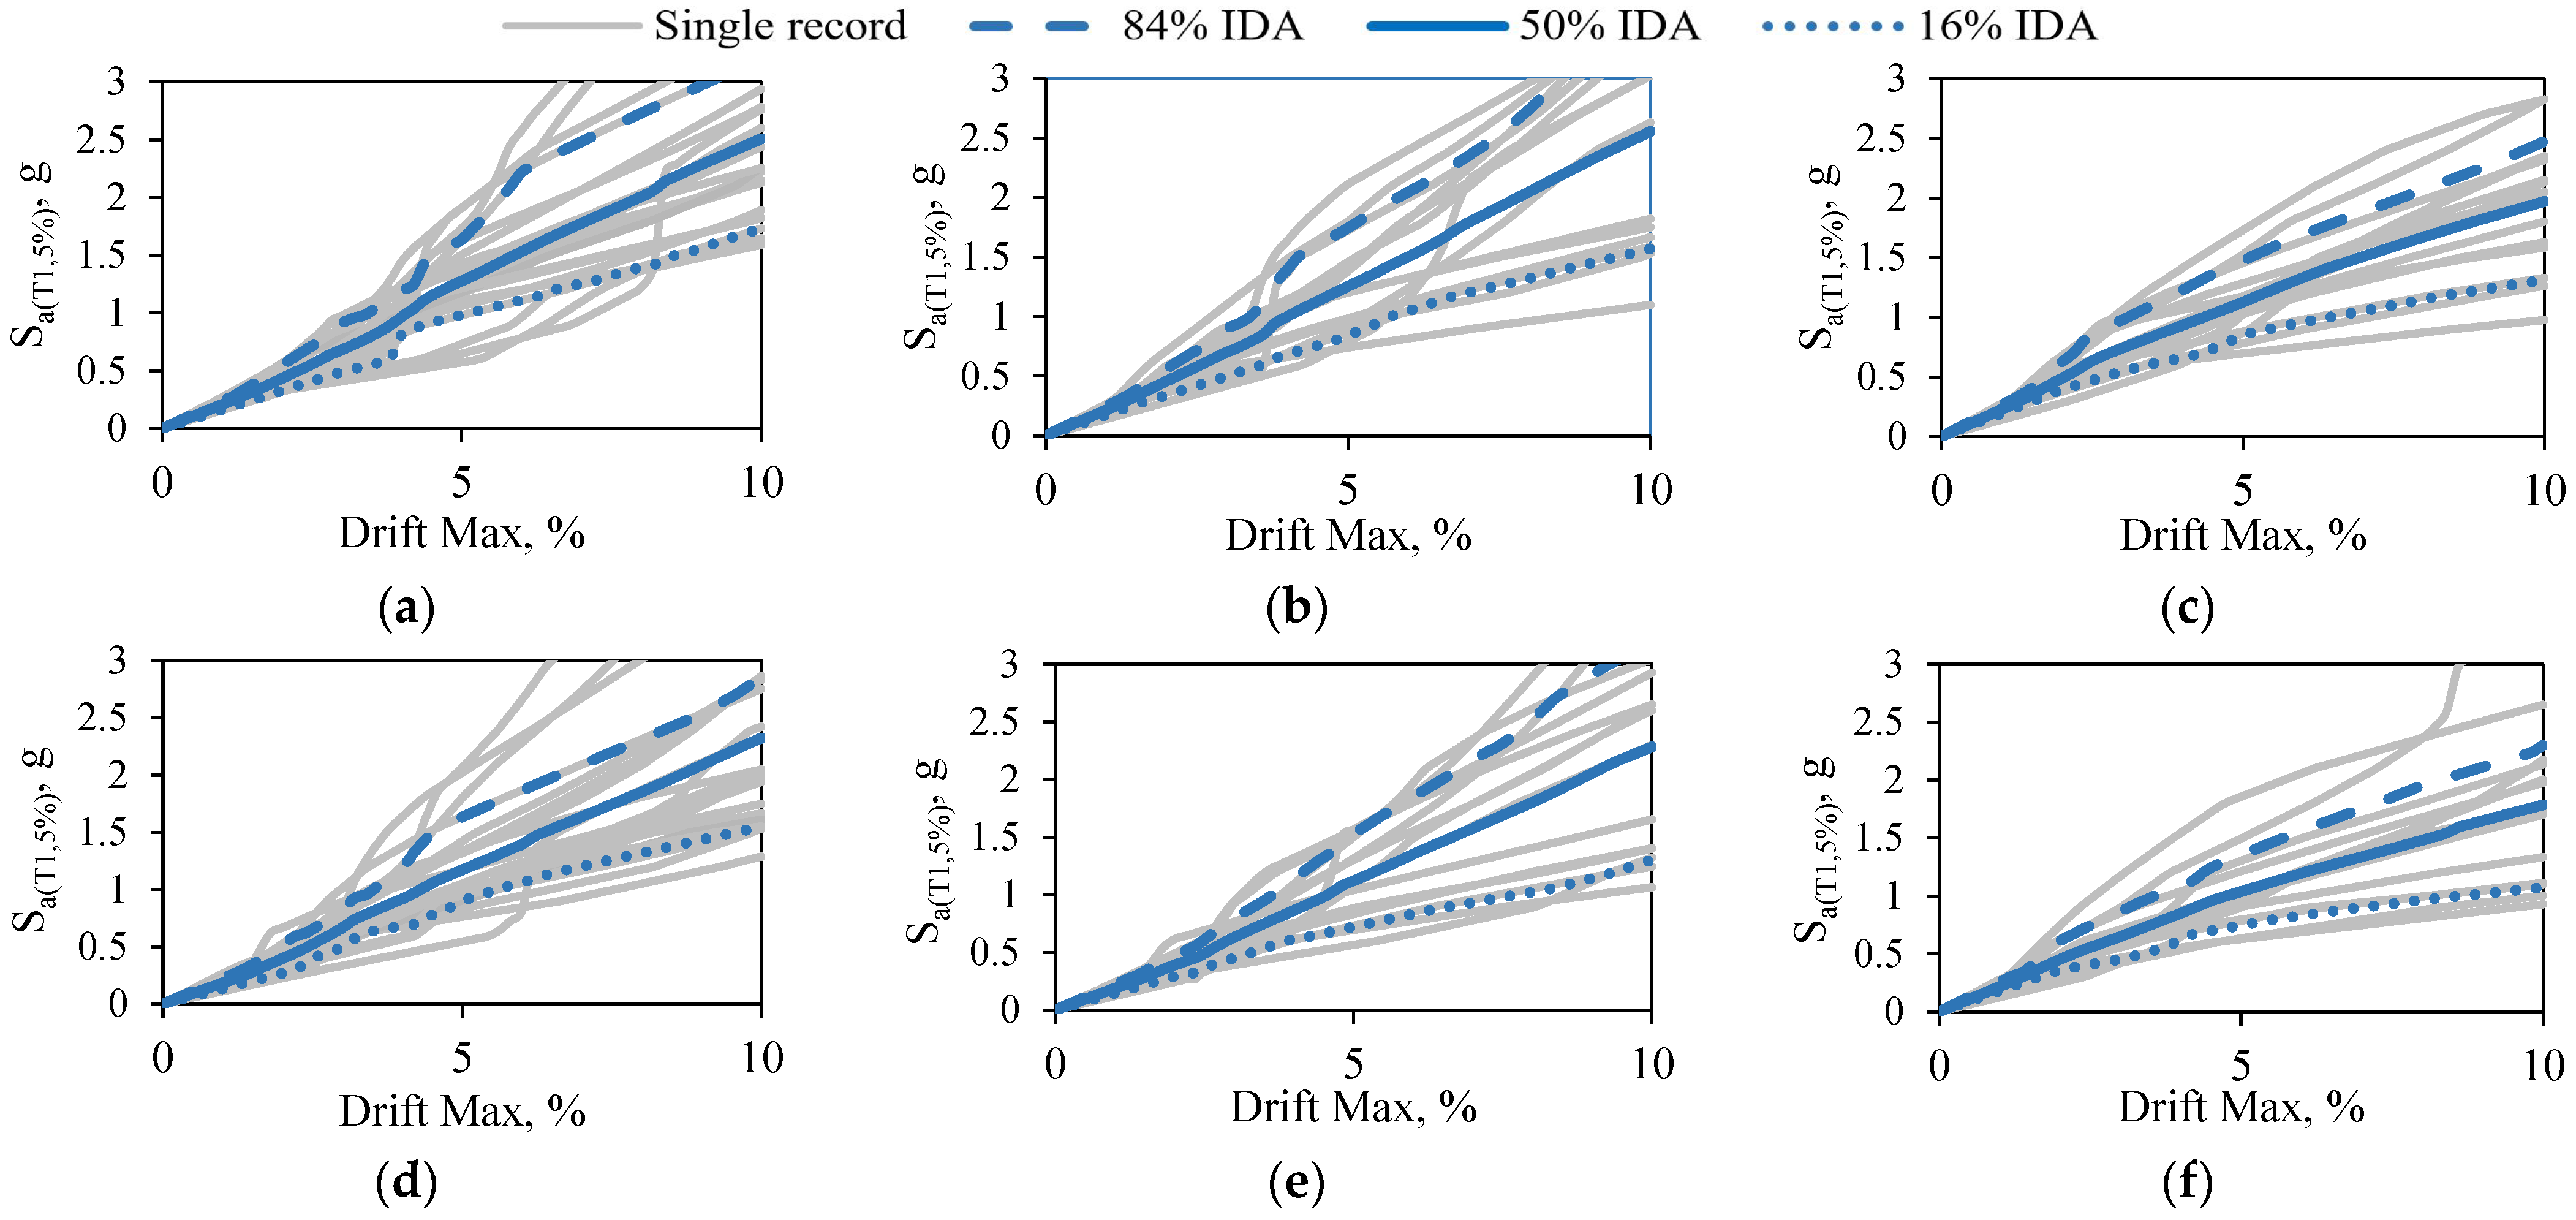
Figure 6.
The 16%, 50%, and 84% fractile IDAs for 3-story initial and MRF03-1to3-1000a scenario models subjected to (a,d) FF, (b,e) NF-No Pulse, and (c,f) NF-Pulse records, respectively.
Figure 6.
The 16%, 50%, and 84% fractile IDAs for 3-story initial and MRF03-1to3-1000a scenario models subjected to (a,d) FF, (b,e) NF-No Pulse, and (c,f) NF-Pulse records, respectively.
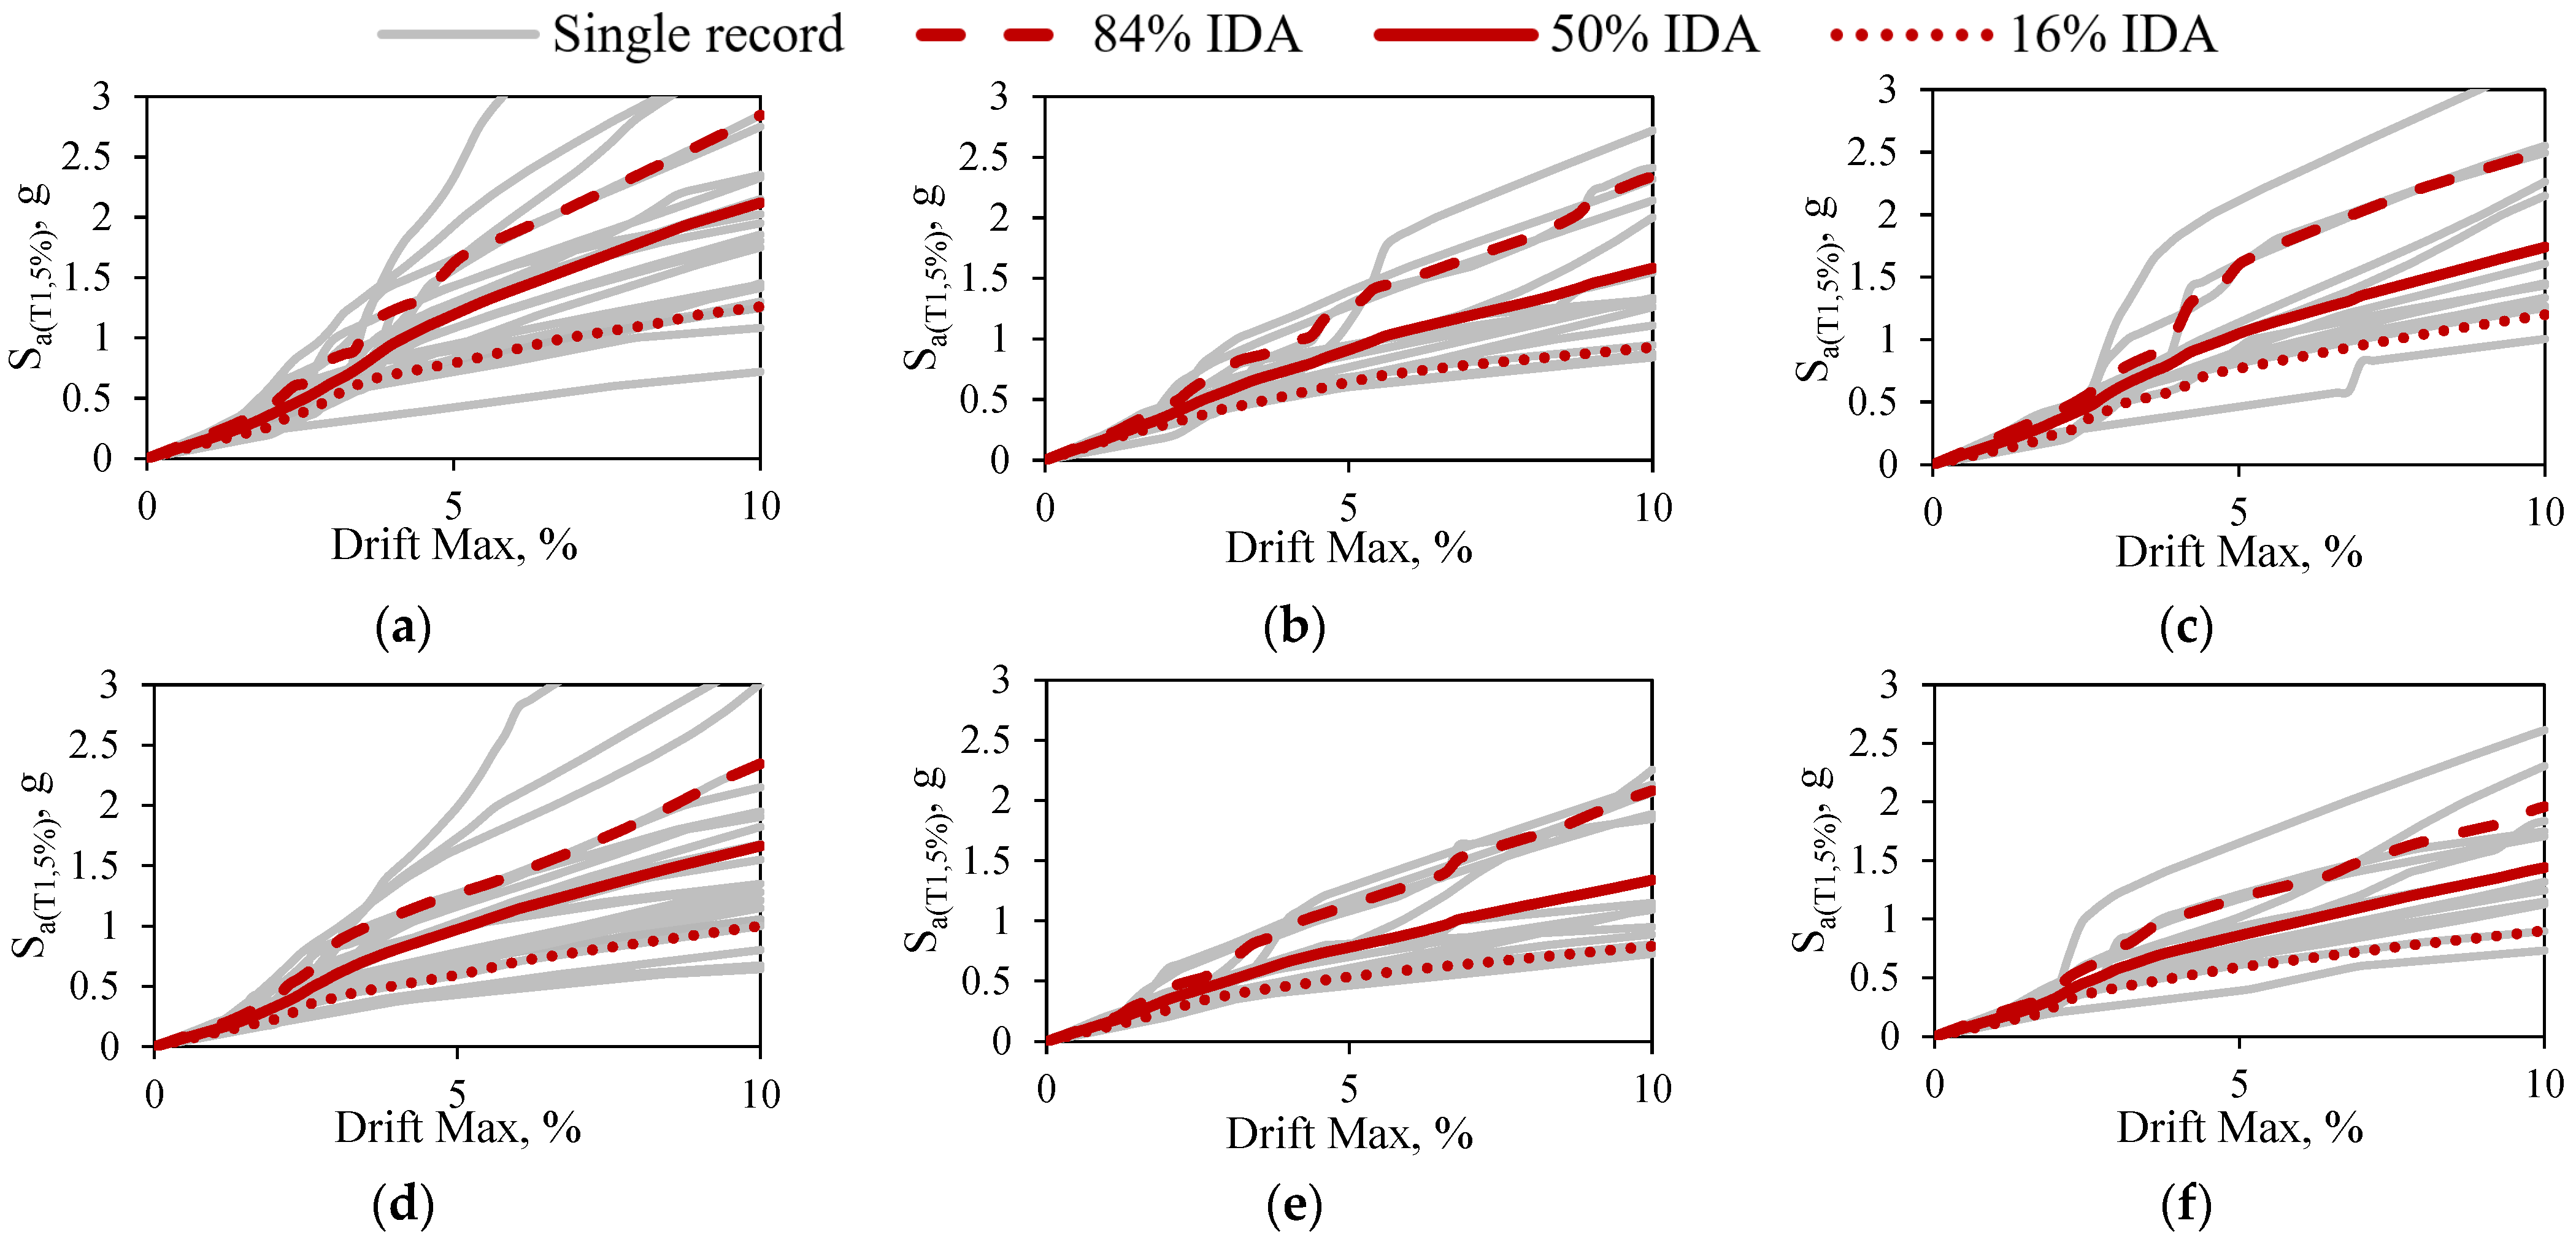
Figure 7.
The 16%, 50%, and 84% fractile IDAs for 6-story initial and MRF06-1to6-1000a scenario models subjected to (a,d) FF, (b,e) NF-No Pulse, and (c,f) NF-Pulse records, respectively.
Figure 7.
The 16%, 50%, and 84% fractile IDAs for 6-story initial and MRF06-1to6-1000a scenario models subjected to (a,d) FF, (b,e) NF-No Pulse, and (c,f) NF-Pulse records, respectively.
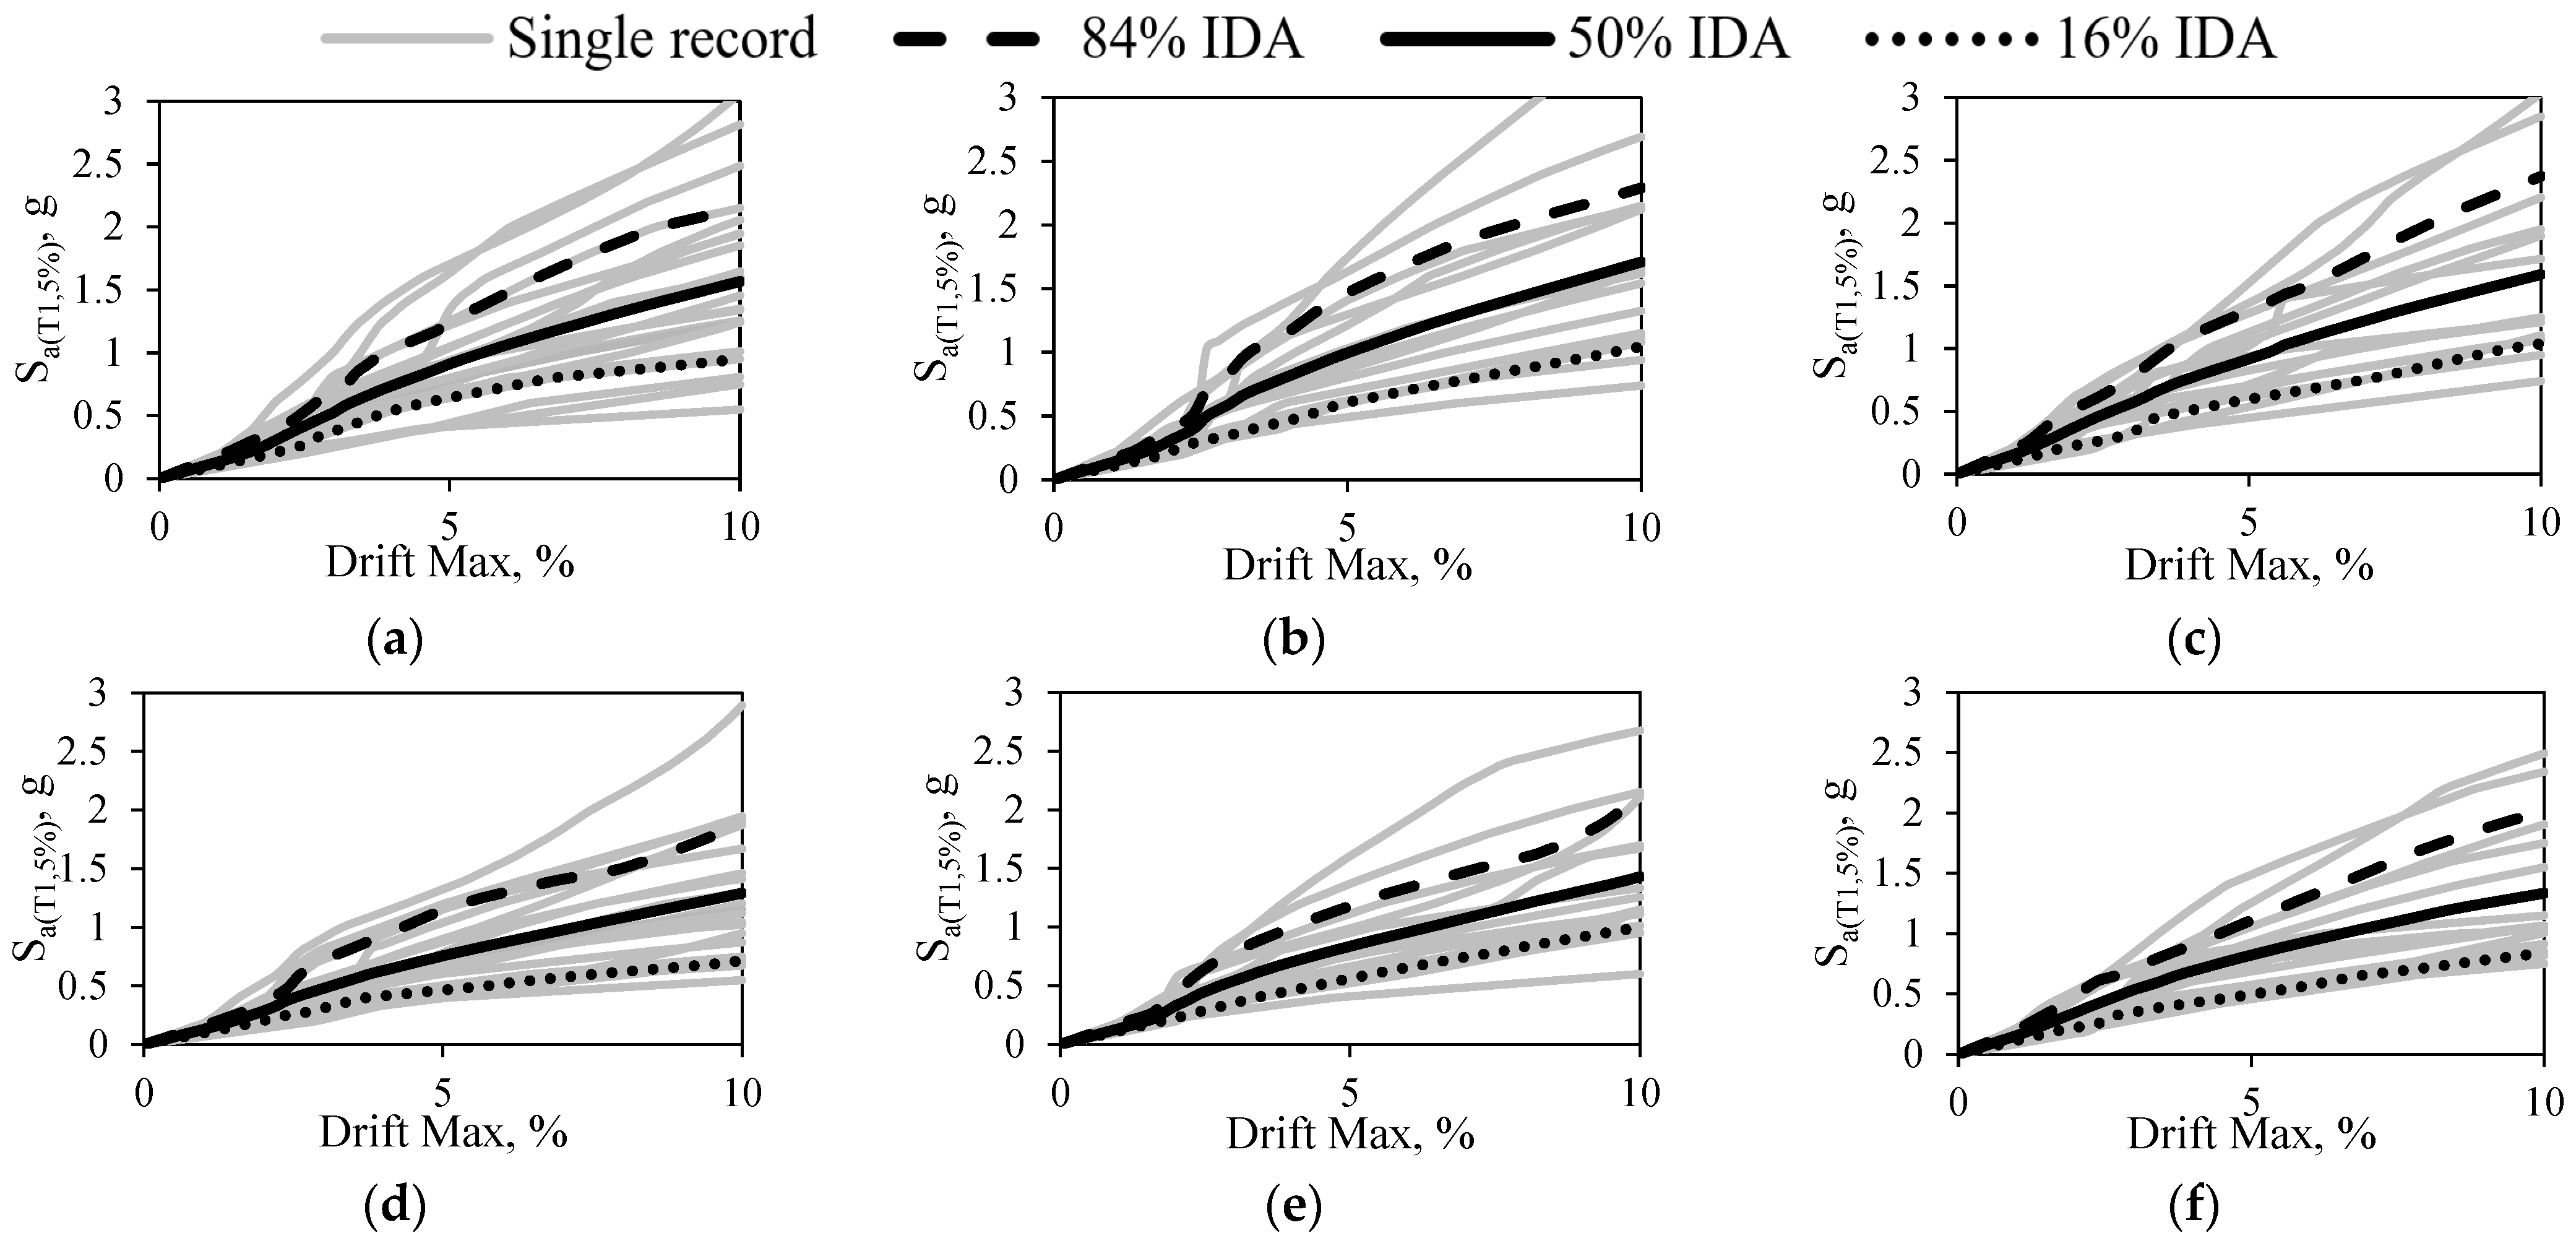
Figure 8.
The 16%, 50%, and 84% fractile IDAs for 9-story initial and MRF09-1to9-1000a scenario models subjected to (a,d) FF, (b,e) NF-No Pulse, and (c,f) NF-Pulse records, respectively.
Figure 8.
The 16%, 50%, and 84% fractile IDAs for 9-story initial and MRF09-1to9-1000a scenario models subjected to (a,d) FF, (b,e) NF-No Pulse, and (c,f) NF-Pulse records, respectively.
Figure 9.
Fragility curves of 3-story structure subjected to (a) FF, (b) NF-No Pulse, and (c) NF-Pulse records, respectively.
Figure 9.
Fragility curves of 3-story structure subjected to (a) FF, (b) NF-No Pulse, and (c) NF-Pulse records, respectively.
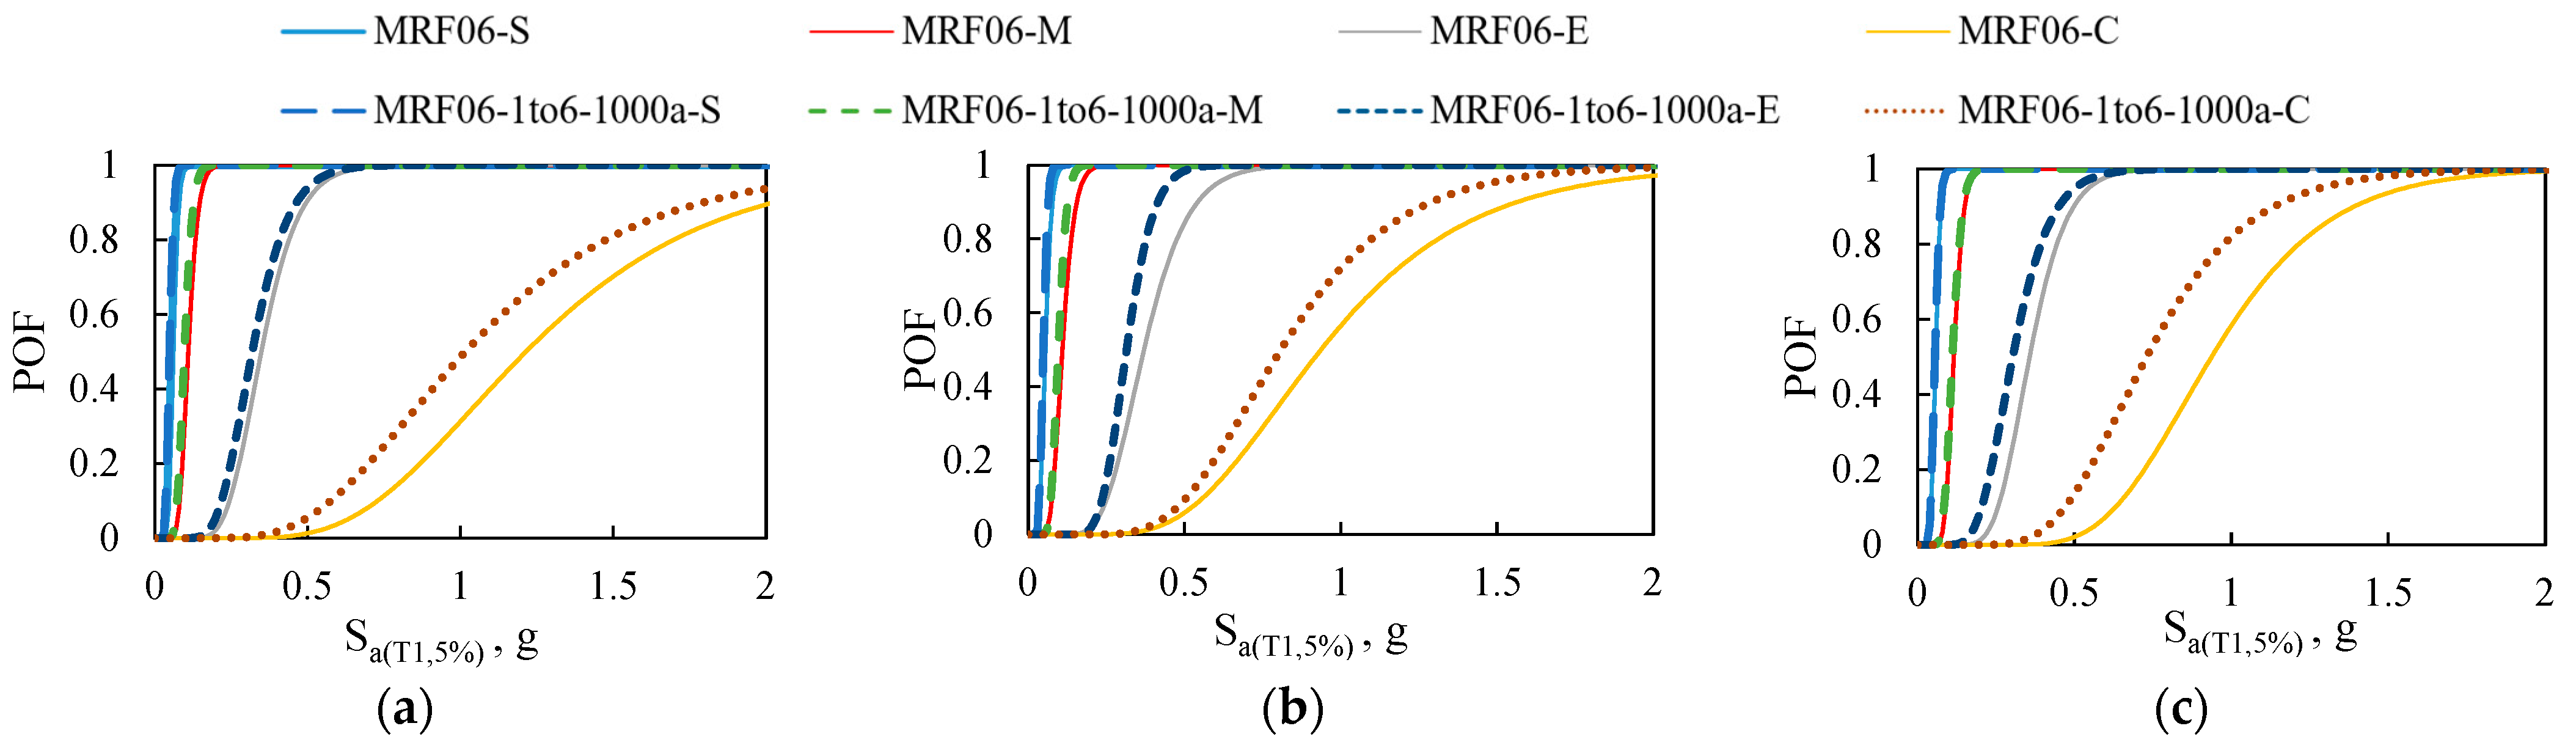
Figure 10.
Fragility curves of 6-story structure subjected to (a) FF, (b) NF-No Pulse, and (c) NF-Pulse records, respectively.
Figure 10.
Fragility curves of 6-story structure subjected to (a) FF, (b) NF-No Pulse, and (c) NF-Pulse records, respectively.
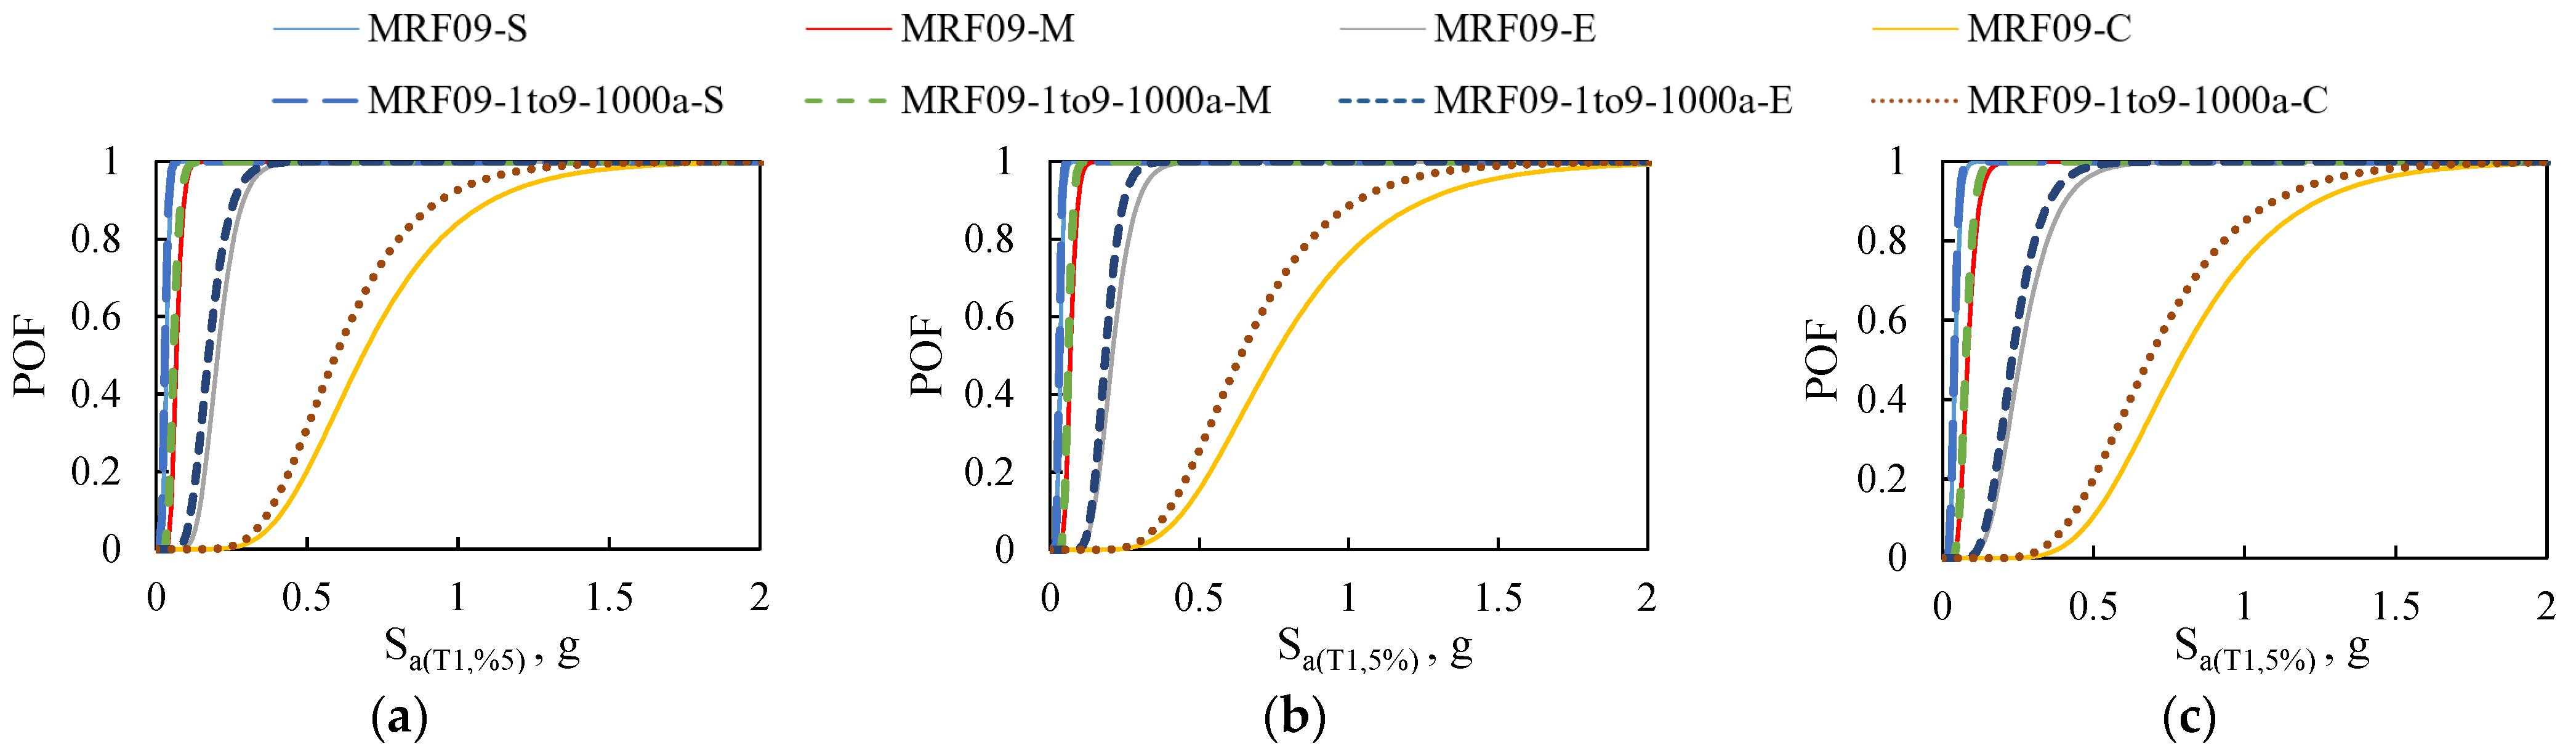
Figure 11.
Fragility curves of 9-story structure subjected to (a) FF, (b) NF-No Pulse, and (c) NF-Pulse records, respectively.
Figure 11.
Fragility curves of 9-story structure subjected to (a) FF, (b) NF-No Pulse, and (c) NF-Pulse records, respectively.
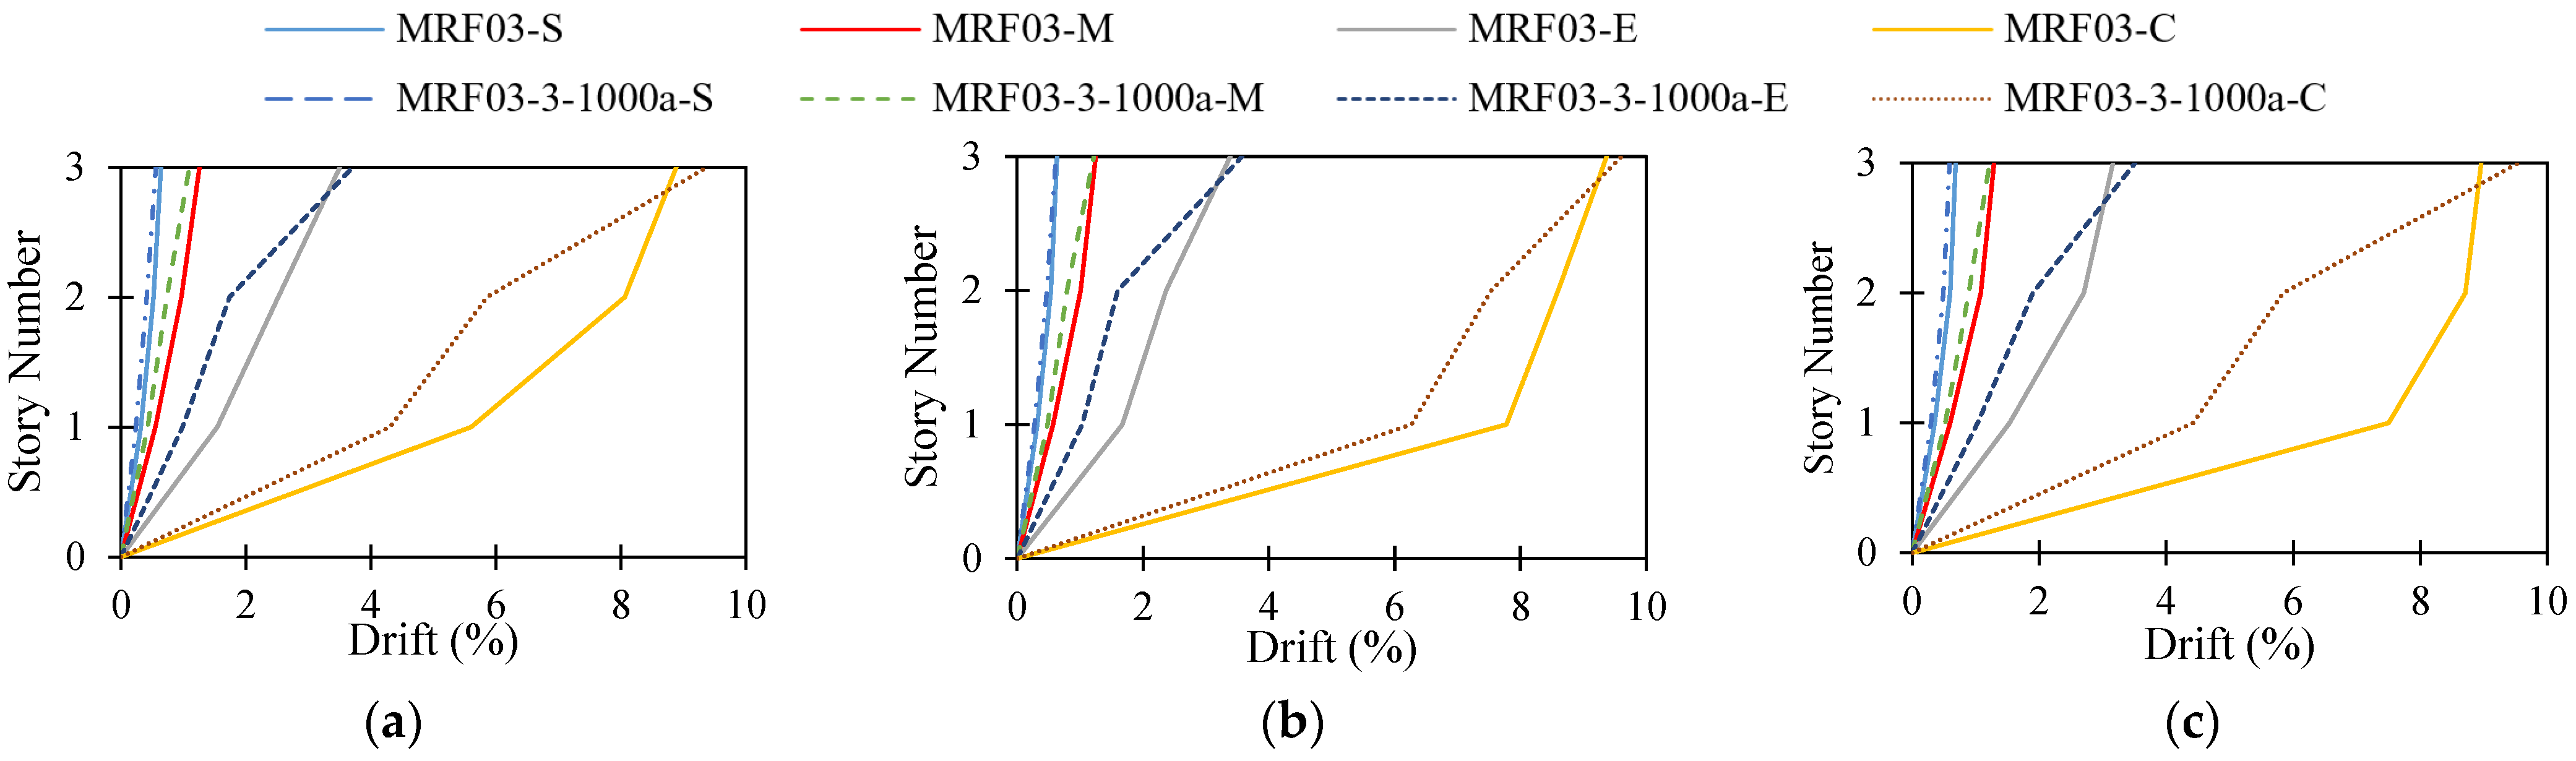
Figure 12.
Inter-story drift ratios for 3-story structure subjected to (a) FF, (b) NF-No Pulse, and (c) NF-Pulse records, respectively.
Figure 12.
Inter-story drift ratios for 3-story structure subjected to (a) FF, (b) NF-No Pulse, and (c) NF-Pulse records, respectively.
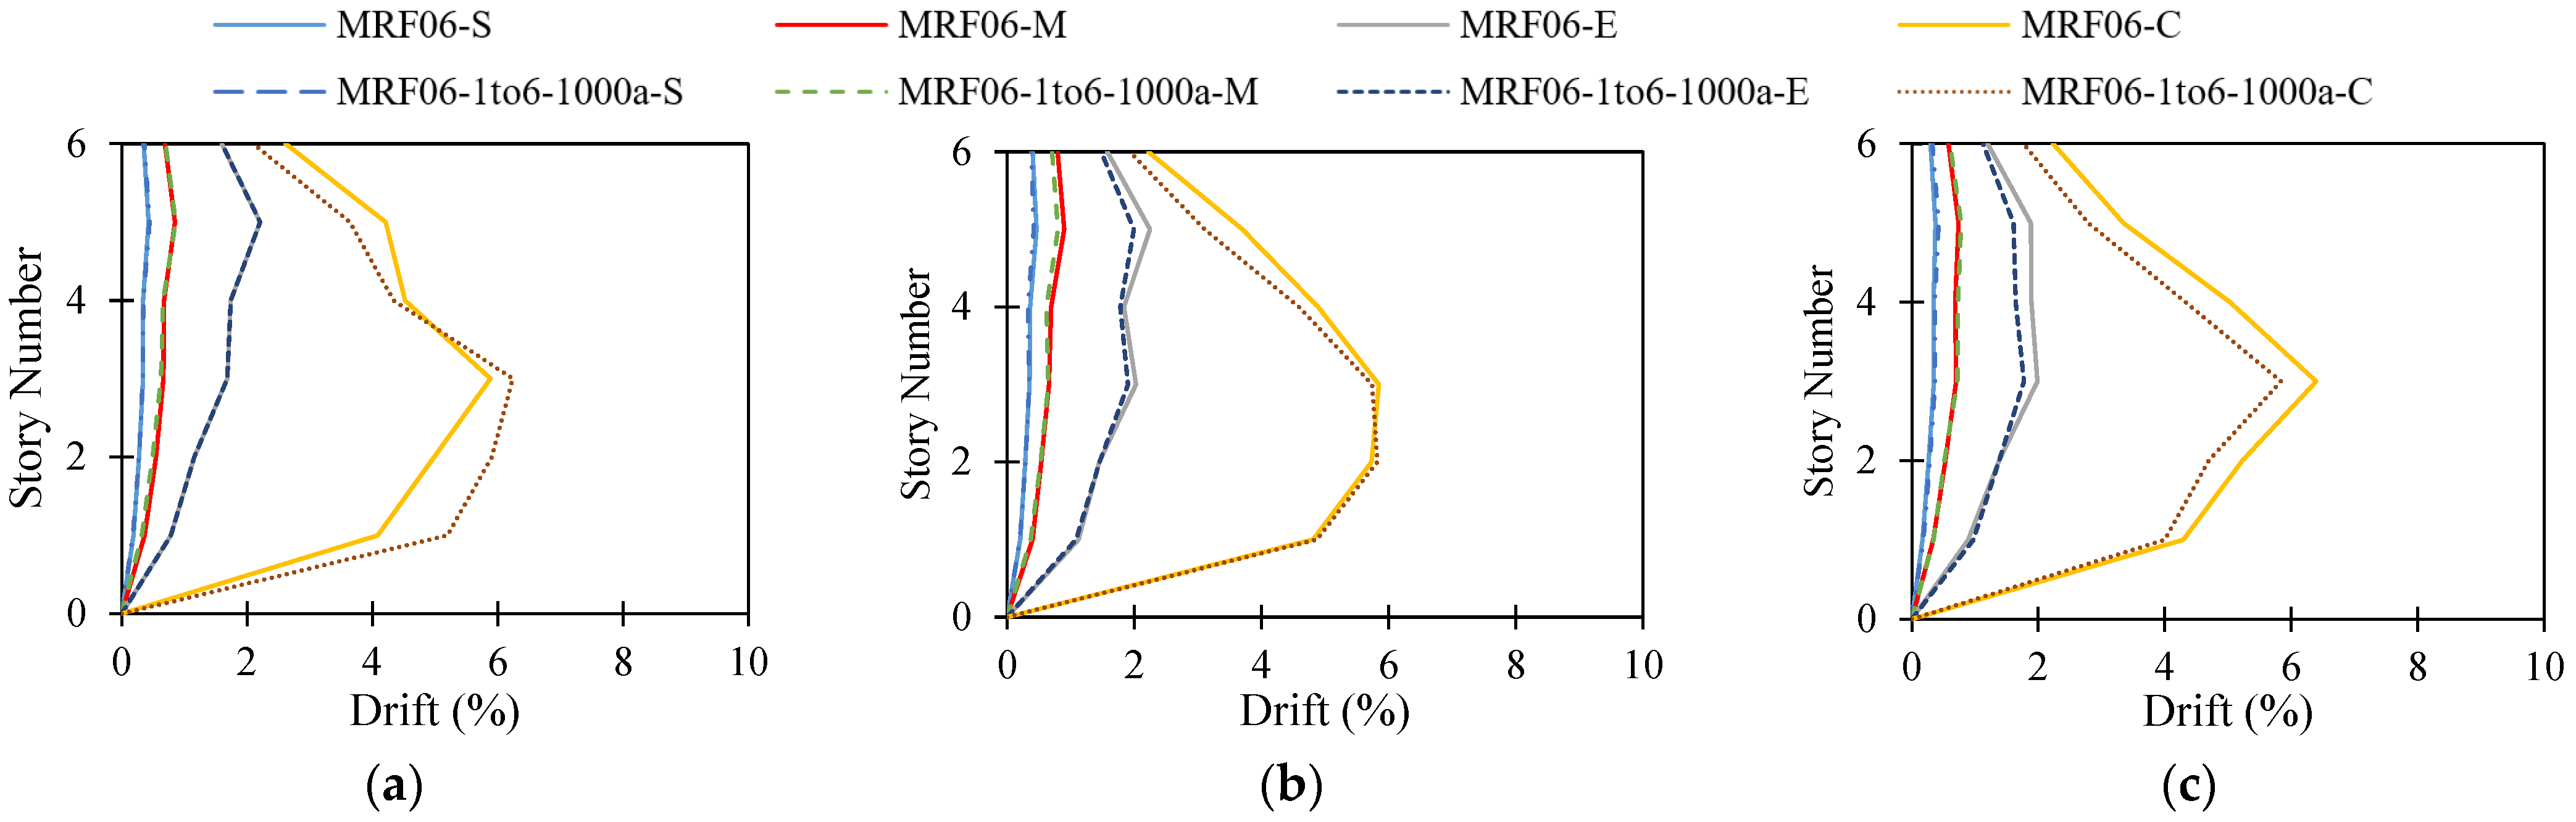
Figure 13.
Inter-story drift ratios for 6-story structure subjected to (a) FF, (b) NF-No Pulse, and (c) NF-Pulse records, respectively.
Figure 13.
Inter-story drift ratios for 6-story structure subjected to (a) FF, (b) NF-No Pulse, and (c) NF-Pulse records, respectively.
Figure 14.
Inter-story drift ratios for 9-story structure subjected to (a) FF, (b) NF-No Pulse, and (c) NF-Pulse records, respectively.
Figure 14.
Inter-story drift ratios for 9-story structure subjected to (a) FF, (b) NF-No Pulse, and (c) NF-Pulse records, respectively.
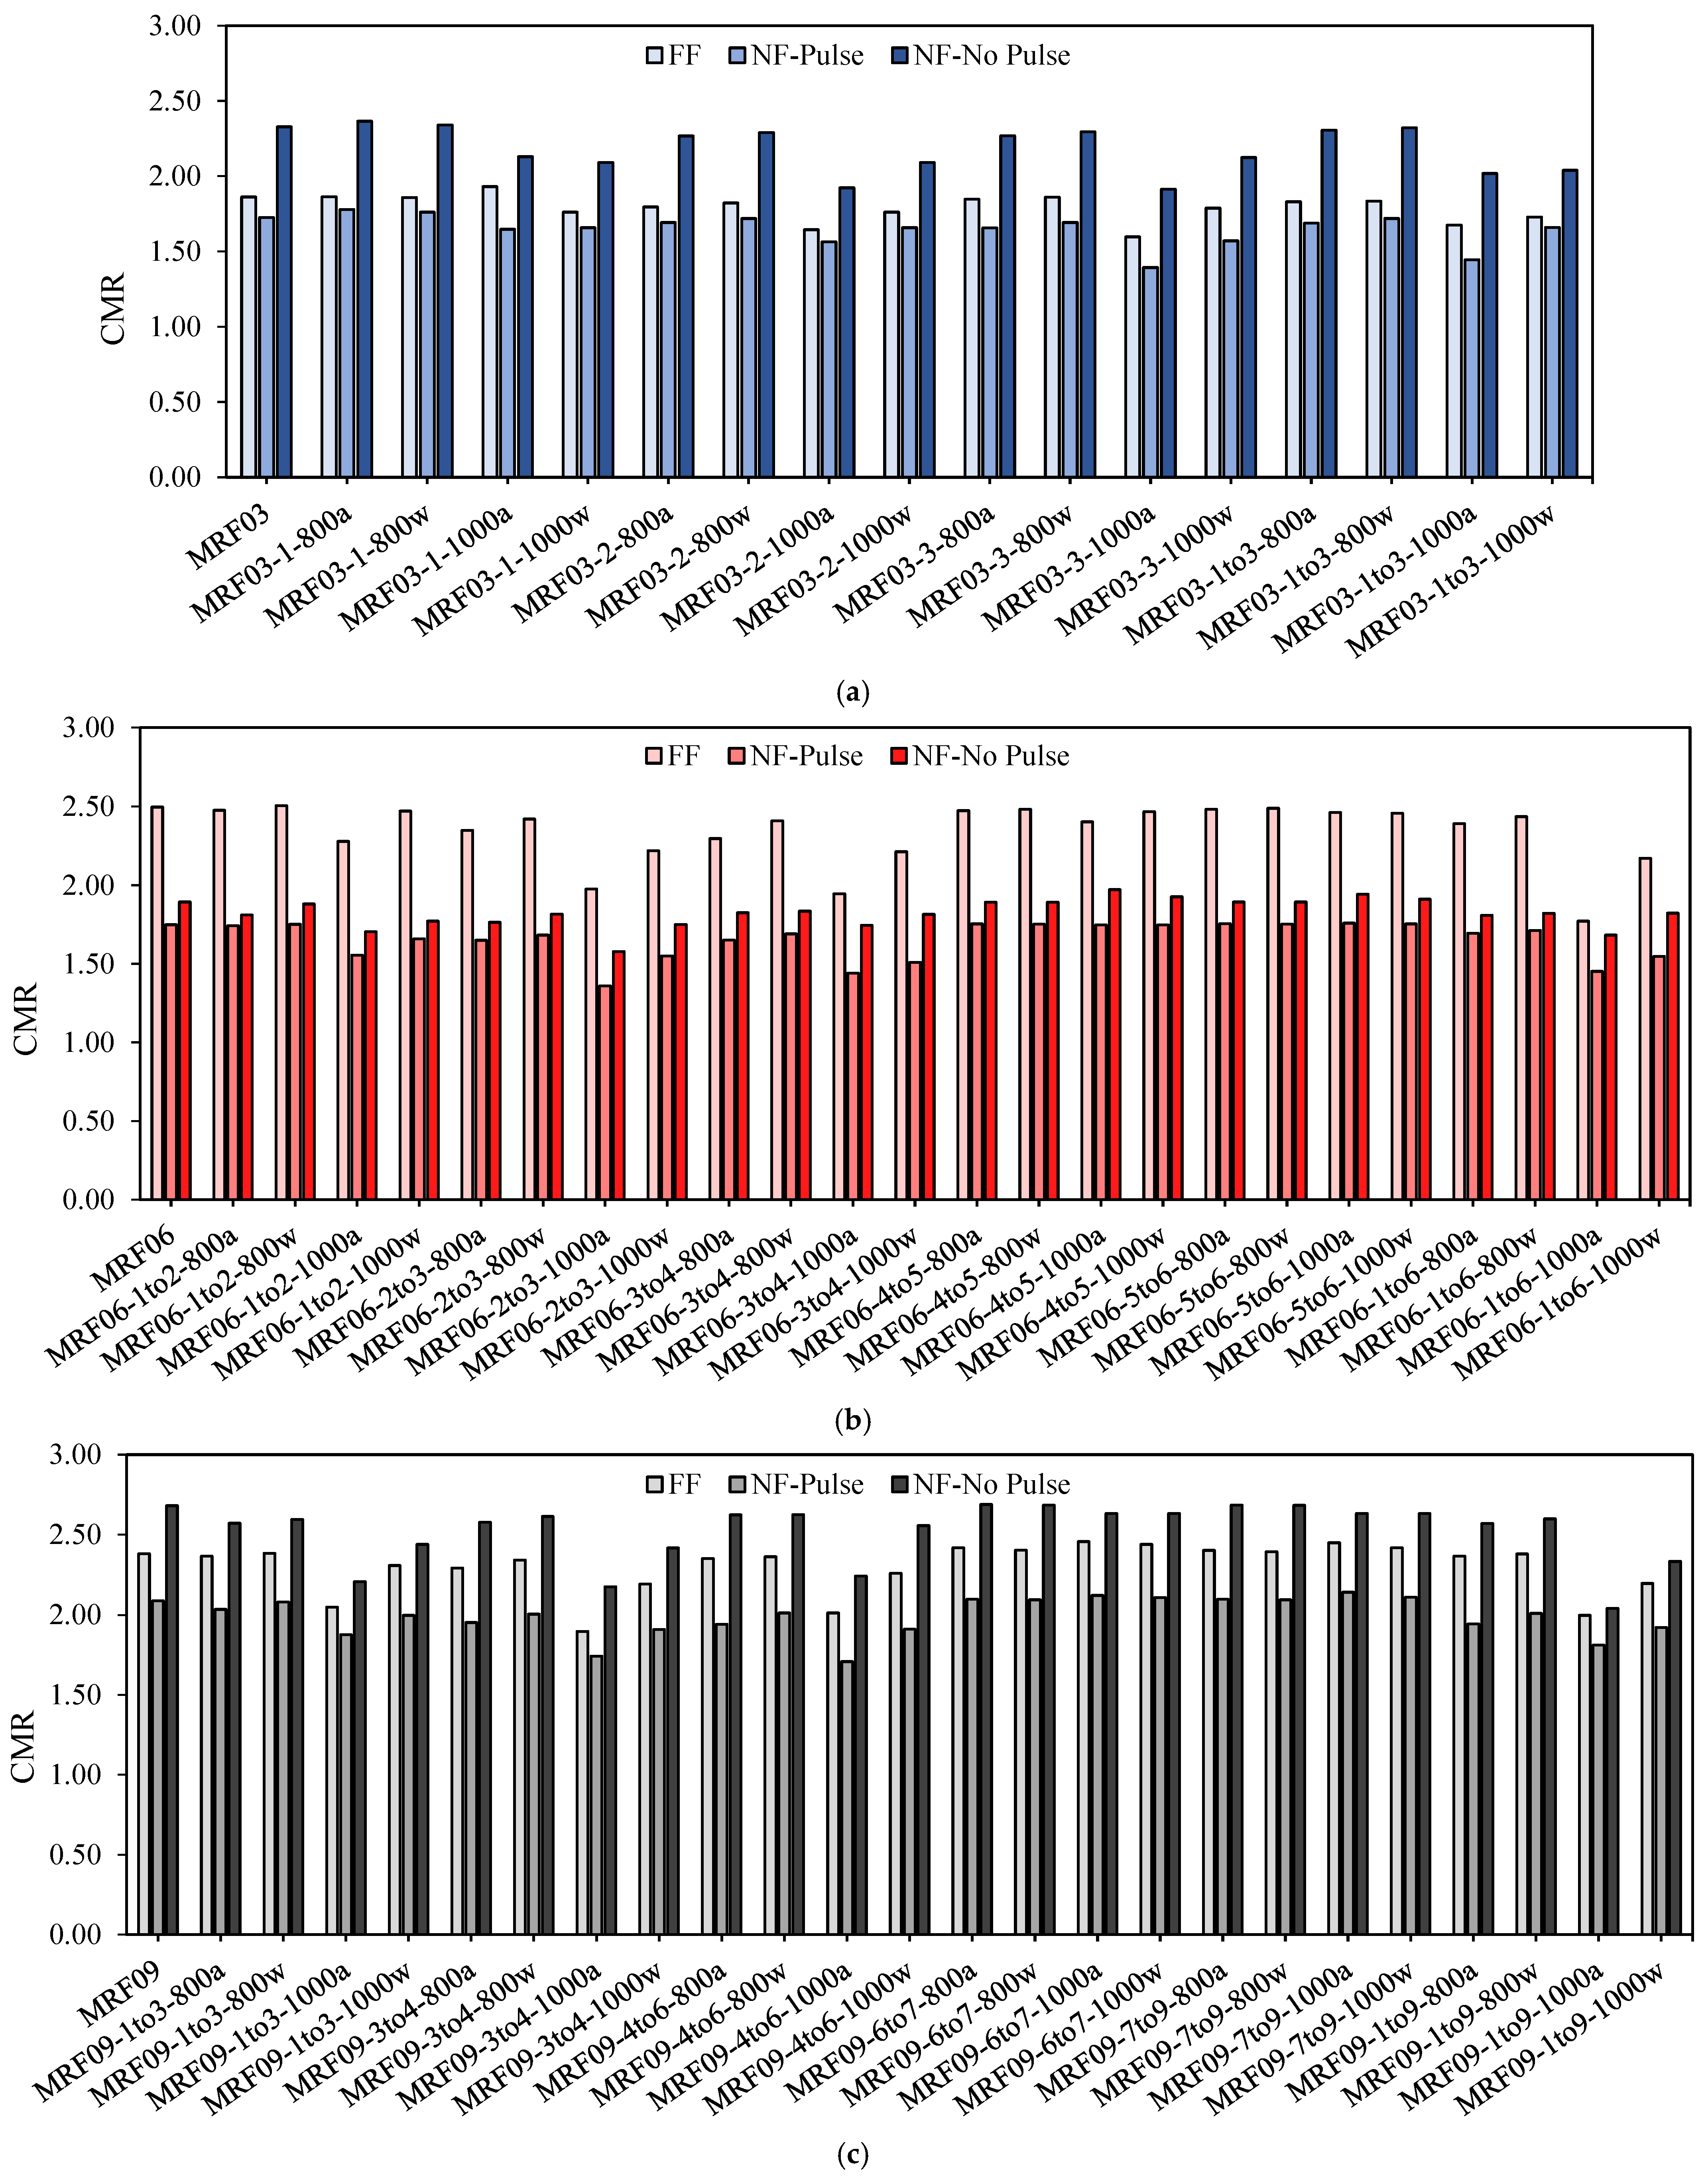
Figure 15.
Calculation of CMR for two-dimensional frames of: (a) 3-story; (b) 6-story; (c) 9-story structure.
Figure 15.
Calculation of CMR for two-dimensional frames of: (a) 3-story; (b) 6-story; (c) 9-story structure.
Table 1.
Post-fire mechanical properties at two elevated temperatures.
Table 1.
Post-fire mechanical properties at two elevated temperatures.
| Steel Type | Temperature (°C) |
|---|
| 800 | 1000 |
|---|
| Cooling Method |
|---|
| Air | Water | Air | Water |
|---|
| E (MPa) | 2.0 × 10⁵ | 2.0 × 10⁵ | 1.8 × 10⁵ | 1.9 × 10⁵ |
| fy (MPa) | 213.5 | 224 | 171 | 201 |
| fu (MPa) | 348 | 365.6 | 321.5 | 363 |
| εy (-) | 0.001 | 0.001 | 0.0009 | 0.001 |
| εu (-) | 0.20 | 0.21 | 0.19 | 0.2 |
| εp (-) | 0.19 | 0.16 | 0.18 | 0.13 |
Table 2.
Description of fire scenarios.
Table 2.
Description of fire scenarios.
| Structure | Stories Exposed to Fire | Temperature (°C) |
|---|
| 800 | 1000 |
|---|
| Cooling Method |
|---|
| Air | Water | Air | Water |
|---|
| 3 | 1st | MRF03-1-800a | MRF03-1-800w | MRF03-1-1000a | MRF03-1-1000w |
| 2nd | MRF03-2-800a | MRF03-2-800w | MRF03-2-1000a | MRF03-2-1000w |
| 3rd | MRF03-3-800a | MRF03-3-800w | MRF03-3-1000a | MRF03-3-1000w |
| 1st to 3rd | MRF03-1to3-800a | MRF03-1to3-800w | MRF03-1to3-1000a | MRF03-1to3-1000w |
| 6 | 1st + 2nd | MRF06-1to2-800a | MRF06-1to2-800w | MRF06-1to2-1000a | MRF06-1to2-1000w |
| 2nd + 3rd | MRF06-2to3-800a | MRF06-2to3-800w | MRF06-2to3-1000a | MRF06-2to3-1000w |
| 3rd + 4th | MRF06-3to4-800a | MRF06-3to4-800w | MRF06-3to4-1000a | MRF06-3to4-1000w |
| 4th + 5th | MRF06-4to5-800a | MRF06-4to5-800w | MRF06-4to5-1000a | MRF06-4to5-1000w |
| 5th + 6th | MRF06-5to6-800a | MRF06-5to6-800w | MRF06-5to6-1000a | MRF06-5to6-1000w |
| 1st to 6th | MRF06-1to6-800a | MRF06-1to6-800w | MRF06-1to6-1000a | MRF06-1to6-1000w |
| 9 | 1st to 3rd | MRF09-1to3-800a | MRF09-1to3-800w | MRF09-1to3-1000a | MRF09-1to3-1000w |
| 3rd + 4th | MRF09-3to4-800a | MRF09-3to4-800w | MRF09-3to4-1000a | MRF09-3to4-1000w |
| 4th to 6th | MRF09-4to6-800a | MRF09-4to6-800w | MRF09-4to6-1000a | MRF09-4to6-1000w |
| 6th + 7th | MRF09-6to7-800a | MRF09-6to7-800w | MRF09-6to7-1000a | MRF09-6to7-1000w |
| 7th to 9th | MRF09-7to9-800a | MRF09-7to9-800w | MRF09-7to9-1000a | MRF09-7to9-1000w |
| 1st to 9th | MRF09-1to9-800a | MRF09-1to9-800w | MRF09-1to9-1000a | MRF09-1to9-1000w |
Table 3.
Specification of PGA and PGV for record sets.
Table 3.
Specification of PGA and PGV for record sets.
| Record Type | PGA (g) | PGV (cm/s) | Distance ** (km) |
|---|
| Min. | Max. | Ave. * | Min. | Max. | Ave. | Min. | Max. | Ave. |
|---|
| FF | 0.21 | 0.82 | 0.43 | 19 | 115 | 46 | 11.7 | 35.5 | 18.5 |
| NF-Pulse | 0.22 | 0.87 | 0.53 | 29.8 | 169.3 | 98.99 | 3.5 | 10.8 | 6.17 |
| NF-No Pulse | 0.28 | 1.43 | 0.65 | 34.7 | 126.4 | 80.1 | 3.9 | 12.1 | 7.6 |
Table 4.
Percentage of drift ratio for high-code design level [
38].
Table 4.
Percentage of drift ratio for high-code design level [
38].
| Structures | Drift Ratio of Damage State Levels |
|---|
| S | M | E | C |
|---|
| 3-story | 0.6 | 1.2 | 3.0 | 8.0 |
| 6-story | 0.4 | 0.8 | 2.0 | 5.33 |
| 9-story | 0.3 | 0.6 | 1.5 | 4.0 |
Table 5.
Comparison of exceedance probability in pre- and post-fire seismic event.
Table 5.
Comparison of exceedance probability in pre- and post-fire seismic event.
| Scenario | FF (%) | NF-No Pulse (%) | NF-Pulse (%) |
|---|
| S | M | E | C | S | M | E | C | S | M | E | C |
|---|
| 3-story | Initial | 100.0 | 100.0 | 69.7 | 0.4 | 100.0 | 100.0 | 67.6 | 0.5 | 100.0 | 100.0 | 72.7 | 0.6 |
| PF * | 100.0 | 100.0 | 74.14 | 0.77 | 100.0 | 100.0 | 75.19 | 0.87 | 100.0 | 100.0 | 77.53 | 1.44 |
| 6-story | Initial | 100.0 | 100.0 | 91.4 | 1.4 | 100.0 | 100.0 | 85.5 | 6.4 | 100.0 | 100.0 | 91.2 | 2.4 |
| PF | 100.0 | 100.0 | 91.9 | 2.5 | 100.0 | 100.0 | 89.7 | 7.6 | 100.0 | 100.0 | 93.7 | 5.8 |
| 9-story | Initial | 100.0 | 100.0 | 99.5 | 7.0 | 100.0 | 100.0 | 98.9 | 5.3 | 100.0 | 100.0 | 88.2 | 2.7 |
| PF | 100.0 | 100.0 | 99.4 | 9.7 | 100.0 | 100.0 | 99.3 | 7.0 | 100.0 | 100.0 | 91.6 | 5.2 |
Table 6.
Comparison of CMR.
Table 6.
Comparison of CMR.
| Scenario | FF | % ** | NF-No Pulse | % | NF-Pulse | % | Avg. *** | % |
|---|
| 3-story | Initial | 1.86 | | 2.33 | | 1.73 | | 1.97 | |
| PF * | 1.79 | −3.9 | 2.17 | −7.4 | 1.64 | −5.5 | 1.87 | −5.3 |
| PFc * | 1.60 | −16.2 | 1.91 | −22.0 | 1.39 | −24.5 | 1.63 | −20.9 |
| 6-story | Initial | 2.50 | | 1.89 | | 1.75 | | 2.05 | |
| PF | 2.34 | −6.8 | 1.82 | −3.8 | 1.65 | −6.1 | 1.94 | −5.7 |
| PFc | 1.77 | −41.2 | 1.68 | −12.5 | 1.45 | −20.7 | 1.64 | −25.0 |
| 9-story | Initial | 2.38 | | 2.68 | | 2.09 | | 2.38 | |
| PF | 2.30 | −3.5 | 2.52 | −6.3 | 1.99 | −5.0 | 2.27 | −4.8 |
| PFc | 1.90 | −25.3 | 2.18 | −22.9 | 1.74 | −20.1 | 1.94 | −22.7 |


 ,
, 


