Review

Synthesized Evaluation of Reinforced Concrete Bridge Defects, Their Non-Destructive Inspection and Analysis Methods: A Systematic Review and Bibliometric Analysis of the Past Three Decades

1
Department of Building and Real Estate, Faculty of Construction and Environment, The Hong Kong Polytechnic University, Kowloon, Hong Kong 999077, China
2
Structural Engineering Department, Faculty of Engineering, Cairo University, Giza 12613, Egypt
*
Author to whom correspondence should be addressed.
Buildings 2023, 13(3), 800; https://doi.org/10.3390/buildings13030800
Submission received: 1 March 2023 / Revised: 13 March 2023 / Accepted: 16 March 2023 / Published: 17 March 2023
(This article belongs to the Collection Advanced Concrete Materials in Construction)

Abstract

:
Defects are essential indicators to gauge the structural integrity and safety of reinforced concrete bridges. Non-destructive inspection has been pervasively explored over the last three decades to localize and characterize surface and subsurface anomalies in reinforced concrete bridges. In addition, different fuzzy set theory-based, computer vision and artificial intelligence algorithms were leveraged to analyze the data garnered from non-destructive evaluation techniques. In light of the foregoing, this research paper presents a mixed review method that encompasses both bibliometric and systematic analyses of the state-of-the-art work pertinent to the assessment of reinforced concrete bridge defects using non-destructive techniques (CBD_NDT). In this context, this study reviews the literature of journal articles and book chapters indexed in Scopus and Web of Science databases from 1991 to the end of September 2022. To this end, 505 core peer-reviewed journal articles and book chapters are compiled for evaluation after conducting forward and backward snowballing alongside removing irrelevant papers. This research study then exploits both VOSVIEWER and Bibiometrix R Package for the purpose of network visualization and scientometric mapping of the appended research studies. Thereafter, this paper carries out a multifaceted systematic review analysis of the identified literature covering tackled bridge defects, used non-destructive techniques, data processing methods, public datasets, key findings and future research directions. The present study is expected to assist practitioners and policymakers to conceive and synthesize existing research and development bodies, and future trends in the domain of the assessment of bridge defects using non-destructive techniques. It can also aid in raising awareness of the importance of defect management in bridge maintenance systems.

1. Introduction

Bridges are cited as one of the prominent elements of infrastructure networks that are necessary for the public welfare, economic growth and social wellbeing of countries [1,2]. In this regard, they must be preserved within acceptable limits of functionality, serviceability, safety and sustainability [3,4]. In recent years, it is reported that there is a notable increase in the number of structurally deficient bridges as a consequence of severe environmental conditions, limited available funds, untimely maintenance schedules and increases in traffic volumes [5,6,7,8,9]. This state of affairs impelled researchers and bridge managers to develop optimum programs for bridge maintenance. Condition assessment is a paramount perquisite of bridge maintenance strategies, whereas visual inspection is the dominant routine practice to monitor the structural condition of bridges [10,11]. However, the latter is criticized for its subjective, error-prone, laborious, unsafe and time-consuming nature [12,13,14]. Over The past three decades, non-destructive evaluation has emerged, evolved and been established and recognized as the forefront research interest in the field of bridge maintenance management [15]. Many non-destructive techniques are available in the literature and they can be clustered into seven main categories, namely electromagnetic-based (ground penetrating radar), electrochemical-based (half-cell potential, linear polarization resistance), magnetic-based (magnetic flux leakage, induced magnetic field), thermal-based (infrared thermography), acoustic-based (impact echo, ultrasonic pulse velocity), optical-based (digital photogrammetry, laser scanning) and sensors-based (acoustic emission, optical fiber) [16,17,18]. In this context, the use of multi-sensor non-destructive evaluation equips transportation agencies with an efficacious tool for rapid, informed, methodical, cost-effective and consistent in situ assessment of bridges. Hence, their timely monitoring and evaluation is anticipated to assist in optimizing available resources for bridge inspection and prioritizing maintenance budgets through the identification of the most deficient zones of bridges, which can eventually aid in boosting the serviceability, integrity and safety of bridges. The processing and analysis of garnered raw data from non-destructive techniques is essential for automating, systematizing and ameliorating the detection, classification and evaluation of potential deterioration zones in bridges.
There are several reported data analysis methods such as computer vision, deep learning, machine learning, feature selection, unsupervised learning, meta-heuristics, multi-criteria decision-making, stochastic modeling, etc. Reinforced concrete bridges are referenced as the most common type of structures in transportation networks [19,20]. Their damage types include surface and subsurface defects such as corrosion, delamination, surface cracks, deformation, spalling, scaling, efflorescence, erosion, voids, moisture, etc. In light of the foregoing, this literature review study aims to unravel, consolidate, visualize and dissect state-of-the-art research papers pertinent to the analysis of reinforced concrete bridge defects using non-destructive techniques. The remainder of this article is arranged in the following manner. Section 2 demonstrates the developed research methodology for retrieving and scrutinizing previous literature studies. Section 3 renders a bibliometric analysis of relevant research papers over the time frame between 1990 and 2022, including countries’ co-authorship, institutions’ co-authorship, journals’ co-citation, core journals, publishers’ productivity, published documents and contributing authors. Section 4 encompasses a systematic review analysis of previous research endeavors. In that vein, it expounds on the frequency distribution of tackled concrete defects, used non-destructive techniques and employed artificial intelligence models. It also explicates the applicability rate of each non-destructive technique across each bridge defect. It thereafter categorizes and extensively overviews previous research studies according to the studied defects, enumerating the implemented NDTs, data interpretation methods, bridge element and testing type. Finally, it sheds light on the available public datasets and used performance evaluation indicators. Section 5 draws the paramount conclusions and future research directions arising from this literature review study. The complete list of used abbreviations and their descriptions are elucidated in Abbreviations.

2. Research Methodology

This research is designated for reviewing, categorizing, mapping and dissecting reported research articles and book chapters pertaining to the analysis of concrete bridge defects using non-destructive techniques. The time frame of this research study extends from 1990 to the end of September 2022. Figure 1 explicates the developed research methodology schema for pertinent literature in the CBD_NDT domain. This study capitalizes on retrieving papers from two different literature databases, Web of Science and Scopus. Two Boolean query strings are formulated to carry out the literature search. In this regard, the used query string in the Web of Science database and Scopus database are depicted in Figure 2 and Figure 3, respectively.
As a result, the conducted literature search resulted in the identification of 537 and 669 papers from Scopus and Web of Science databases, respectively. The next step involves screening the merged database by removing duplicate and out-of-scope studies. In this regard, the irrelevant studies were determined by reviewing their titles, abstracts and full text. This results in the presence of 491 papers that are composed of 486 articles alongside 4 book chapters. The next step encompasses complementing forward with backward snowball search methods to track missing publications pertinent to the scope of this research study. This is addressed by reviewing the citations of the papers and reported references used for their writing [21,22]. In this context, Google Scholar was utilized to capture citations associated with each paper. The forward and backward search methods induced 14 papers. Hence, the appended database encompasses 505 papers of 500 journal articles and 5 book chapters. A bibliometric/scientometric analysis (version 4.0.1) is fulfilled using the Bibliometrix R package and VOSviewer software (version 1.6.19) [23]. In this respect, thesaurus files for appended bibliography were created for data cleansing and truncation of duplicate elements. The prominent elements of the conduced scientometric analysis encompassed countries’ collaboration, journals’ co-citation, institutions’ collaboration, prolific publishers, core journals, published documents, authors’ productivity and paramount authors in the domain. In addition, the systematic review analysis reviews and synthesizes the published papers in relation to investigated defects, utilized NDTs, deployed data processing techniques, bridge element, testing type and available public datasets.

3. Scientometric Analysis

This section renders the results of the conducted scientometric analysis of related research publications in the CBD_NDT domain.

3.1. Publication Trend

Figure 4 presents a graphical representation of the yearly CBD_NDT-related publications from 1991 to 2022. Overall, it can be conceived that the CBD_NDT has been in an upward trend with an average annual growth of 31.5%. According to the variations in the number of published articles, the publication period is partitioned into three main phases. The publication growth is low in the exploration period from 1991 to 2001, whereas the number of annual publications doesn’t exceed five papers. The publication rate then gained momentum in the steady development period between 2002 and 2014. In this period, the number of annually published papers fluctuated between 5 and 12. The publication trend then dramatically increased in the rapid development period from 2015 onwards. In this regard, the number of academic publications soared, surging to 61 papers in 2021. It is worth mentioning that 2020 and 2021 are collectively responsible for 24.15% of the total number of publications in CBD_NDT research. In this period, scholars carried out extensively more exploration and research in the CBD_NDT domain. The publication regression line can be expressed using a fourth-order polynomial function of A P = 2.3915 E 4 Y 4 + 1.9242 Y 3 5.8055 E + 3 Y 2 + 7.7846 E + 6 Y 3.9143 E + 9 ; R 2 = 91.3 % , where A P is the annual number of publications and Y is the publication year. Figure 5 depicts the distribution of average article citations per year in the CBD_NDT domain. It can be observed that a notable increase is sustained from 2016 onward in addition to a spike in the year 2003. As a consequence, the research output in the CBD_NDT domain is envisaged to continuously increase in the next few years.

3.2. Countries Co-Authorship Analysis

A countries’ co-authorship network is created to visualize the collaboration relationship and its strength between research groups of different countries (see Figure 6). In this regard, the bibliometric analysis of countries is carried out by undertaking minimum thresholds of one document and zero citations per country, which results in 46 countries and 12 colored clusters. The size of nodes marks the production degree of a country in terms of the number of co-authored documents [24,25]. The line between two countries manifests the co-operation degree between them, whilst thicker lines represent a significant occurrence of co-authorship between two countries [26,27]. In addition, countries present in the same cluster tend to tackle the same research trends in the field of CBD_NDT. In addition, the proximity of two countries envisages their relatedness with regard to their co-citation link [28,29]. It is observed that the United States of America’s collaboration with Japan stands out with a link strength of 21. This is followed by its partnership with South Korea and Canada with a link strength of 12. The conducted analysis also showed that a significant co-authorship relationship is maintained between scholars from China and Canada. It is also evident that scholars from Canada and Egypt work together in this research field, which is demonstrated by a link strength of 8.
Table 1 lists a quantitative description of the leading countries in CBD_NDT according to the number of documents, and the number and average normalized number of citations. The conducted analysis reveals that the United States of America, China, Canada, South Korea and Japan are the most productive countries with 211 (41.78%), 88 (17.42%), 66 (13.07%), 41 (8.12%) and 25 (4.95%) journal articles, respectively. This implies that CBD_NDT is progressing faster in developed high-income countries. It can be also observed that the measured total link strength of these countries is high, which signifies the presence of a large number of journal articles in which authors of these countries collaborated with authors from other countries. With regards to the total citations, scholars from the United States of America, Canada, China, South Korea and the United Kingdom lead other countries. The papers of the aforementioned countries received 5299, 1365, 1120, 713 and 462 citation counts, respectively. It can be also observed that although there are some countries that published fewer journal articles, they received overall more citations. For instance, China produced 88 journal articles with 1120 citations, while Canada published 66 journal articles with 1365 citations. Chile, Singapore, Tunisia, Sweden and Switzerland are the most influential five countries based on average normalized citations with corresponding scores of 3.14, 2.45, 2.39, 2.37 and 2.02, respectively. It should also be noted that the average publication year of China, South Korea, Chile, Singapore and Sweden was between 2017 and 2020, which implies that scholars from these countries are active in research areas pertinent to CBD_NDT in the last few years.

3.3. Institutions Co-Authorship Analysis

Figure 7 presents a visualization of the institutions’ co-authorship network, in which a minimum threshold of one document is specified for inclusion. It is evident that Rutgers University and Concordia University lie at the center of collaboration. In this respect, Rutgers University sustains a notable co-authorship relationship with the Federal Highway Administration, the University of Texas at El Paso and Dong-a University with a link strength of 3. Furthermore, strong cooperation is observed between the three geographically distant institutions of Hong Kong Polytechnic University, Concordia University and Cairo University which is demonstrated in the form of a link strength of 7 between any two of them. In addition, a significant collaboration is viewed between the two geographically proximate institutions of Concordia University and Western University (link strength = 7).
Table 2 shows a quantitative summary of active institutions in the field of CBD_NDT. It is found that the most prolific and collaborative institutions are Rutgers University, Concordia University, Hong Kong Polytechnic University, the Federal Highway Administration and Cairo University. This is demonstrated by their large number of published documents and total link strength. In this regard, they were able to publish 23 (4.55%), 18 (3.56%), 14 (2.77%), 10 (1.98%) and 8 (1.58%) journal articles, respectively. The distribution of published documents shows that the United States of America is at the forefront, leading other countries in the research field of CBD_NDT. Furthermore, the conducted analysis shows that the leading five institutions according to the number of citations are Rutgers University (730), Concordia University (392), Clarkson University (339), Utah State University (339) and the University of Nevada, Reno (246). Looking at the average normalized citations, it is revealed that the most prominent institutions comprise Clarkson University (4.63), Utah State University (4.63), University of Nevada (4.38), Sungkyunkwan University (2.63) and the University of Texas at Austin (2.57).

3.4. Journals Co-Citation Analysis

Journal co-citation analysis is an effective tool for understanding the overarching composition of a designated research field and shedding light on possible and core avenues for publication [30,31]. Figure 8 shows a structured visualization of the journals’ co-citation network. The minimum number of citations of a certain source is set to 20, which results in the induction of 76 journals. The most significant co-citation relationship was spotted between Computer-Aided Civil and Infrastructure Engineering, and Automation in Construction with a total link strength of 1177, which implies that they share similarities in their research themes and interests. A notable intensity of co-citation is also seen between Construction and Building Materials and NDT & E International with a total link strength of 765. The journals are partitioned into four main clusters, in which the journals that belong to the same cluster have higher odds to feature in the references list. The first cluster focuses on civil infrastructure systems alongside computer vision technologies, and it includes 29 items such as Automation in Construction, Computer-Aided Civil and Infrastructure Engineering, Machine Vision and Applications, Neurocomputing, sensors, etc. The second cluster is related to journals of transportation networks in addition to non-destructive evaluation and it comprises 27 items such as the Journal of Transportation Engineering, NDT & E International, Transportation Research Record, the Journal of Bridge Engineering, Non-destructive Testing, Research in Nondestructive Evaluation, etc. The third cluster encompasses 10 journals such as the Journal of Structural Mechanics, Engineering Structures, Journal of Structural Engineering, Smart Materials and Structures, and others. The fourth cluster tackles journals focusing on materials and it involves 10 items such as Cement and Concrete Composites, Construction and Building Materials, Corrosion Science, Magazine of Concrete Research and Others.
Table 3 summarizes the contribution of influential journals on the research on CBD_NDT using the five input variables of the number of documents, total citations, normalized citations, average publication year, average normalized citations and total link strength. It is found that Construction and Building Materials (30 documents), Transportation Research Record (20 documents), NDT & E International (17 documents), Automation in Construction (14 documents) and Sensors (12 documents) occupy the top five positions according to the number of publications. From the perspective of total citations, Construction and Building Materials is cited the most, followed by NDT & E International and then the Journal of Computing in Civil Engineering in the third rank. In this context, the total citations of Construction and Buildings, NDT & E International, the Journal of Computing in Civil Engineering, Automation in Construction and Sensors are 1036, 841, 702, 657 and 338, respectively. With regards to average normalized citations, it is noted that the most productive and cited journal may not have the highest average normalized citations. In this regard, IEEE Transactions on Automation Science and Engineering (5.09), Computer-Aided Civil and Infrastructure Engineering (2.79), Structural Health Monitoring (2.78), Cement and Concrete Composites (2.52) and Automation in Construction (2.28) are placed in the top five ranks based on their average normalized citations.

3.5. Core Journals Analysis

Bradford’s law is one of the fundamental methods in bibliometrics to identify the core journals in a designated subject over a specified period of time [32,33]. Under this law, relevant journals are categorized into three zones such that number of journals in each zone is proportional to 1:n:n2, where n denotes the number of journals. According to this law, the entire collection of articles is partitioned into three groups of an approximately equal number of articles [34,35]. The core journals based on Bradford’s law are given in Figure 9. As a result, Zone 1 of core journals is found to comprise nine journals with 170 articles, and these journals account for 4.94% of the number of journals in this study. The identified core sources are Construction and Building Materials, Transportation Research Record, NDT & E International, Automation in Construction, the Journal of Bridge Engineering, the Journal of Performance of Constructed Facilities, ACI Materials Journal, Structure and Infrastructure Engineering and Sensors. Moreover, Zone 2 contains 33 journals (18.13% of the total journals) with 169 articles, while Zone 3 encompasses 140 journals with 166 articles, which covers 76.92% of the total journals in the CBD_NDT research.

3.6. Categorization Based on Publisher

This sort of categorization aims at drawing the attention of readers to the notable publishers in the topic of CBD_NDT. Table 4 encapsulates the contribution of the top 20 active publishers on the topic of CBD_NDT. There are another 34 publishers with less than three publications. It can be observed that the 505 acquired journal articles were produced by different publishers. As shown, Elsevier Ltd. Is the leading publisher in CBD_NDT with 130 journal articles, which accounts for 25.74% of the total published papers. This is followed by ASCE, Springer, MDPI and SAGE Publishing Ltd., which represent 12.87%, 9.31%, 7.92% and 7.33% of all published articles, respectively. Other publishers in the top 10 list comprise John Wiley & Sons Ltd., Taylor & Francis, American Concrete Institute, IEEE and Hindawi Limited. The higher number of record counts for Elsevier Ltd. is ascribed to its large number of journals designated to smart performance assessment of infrastructure systems such as Construction and Building Materials, NDT & E International and Automation in Construction.

3.7. Keyword Co-Occurrence Analysis

Keyword co-occurrence analysis stands as an efficacious tool in bibliometric studies to grasp the body of knowledge of a designated research domain and pinpoint its trends, hot spots and frontiers [36,37]. The keywords’ co-occurrence network is elucidated in Figure 10, and it describes the relationships between the defined author keywords, and how often they appear together. The minimum number of occurrences of a keyword is specified as four, and thus 66 keywords and 3 colored clusters were retrieved. The green cluster has a primary focus on corrosion and delamination assessment using nondestructive techniques. It is led by some keywords such as “nondestructive testing”, “ground penetrating radar”, “corrosion”, “delamination”, “infrared thermography”, “impact echo”, “electrical resistivity”, “half-cell potential”, “surface waves” and “K-means clustering”. To this end, it can be seen that K-means clustering is the most commonly adopted algorithm in corrosion and delamination assessment. The red cluster is composed of 27 keywords, and it covers the research areas of surface defects detection and assessment using computer vision technologies. Its most notable keywords include “cracks”, “crack detection”, “crack segmentation”, “crack extraction”, “computer vision”, “image processing”, “machine learning”, “deep learning”, “transfer learning”, “neural network”, “support vector machine”, “wavelet transform” and “unmanned aerial vehicle”. The blue cluster concentrates on the use of structural health monitoring and digital image correlation measurements, and it includes some author keywords such as “structural health monitoring”, “health monitoring and assessment”, “digital image correlation” and “acoustic emission”.
The conducted key word co-occurrence analysis points out that ground penetrating radar and half-cell potential were largely used for corrosion assessment. This is exemplified in the form of a link strength equals to 11 between corrosion and ground penetrating radar besides a link strength of 6 between corrosion and half-cell potential. In addition, a high link strength is observed between delamination and the nondestructive techniques of infrared thermography (17) and impact echo (11). It is also noticed that digital photogrammetry and embedded sensors are exploited more than Lidar in surface cracks assessment. Deep learning is found to be utilized than machine learning in in surface cracks analysis, and artificial neural network and support vector machines are shown to be the most implemented machine learning algorithms. Figure 11 illustrates analysis of author keywords’ co-occurrence with time information. The generated overlay visualization map indicates that most of the research before 2014 was primarily focusing on corrosion, and then attention became more directed towards delamination from 2016 to 2018. In the recent few years (after 2019), the use of deep leaning in structural defects assessment and structural health monitoring emerged as notable research topic that require significant awareness and exploration.
Table 5 summarizes the quantitative detailed information about the paramount keywords in the research on CBD_NDT. It reports the top 40 keywords based on their occurrences. It was found that the most frequently used keywords are “nondestructive testing” (109), “ground penetrating radar” (73), “concrete” (70), “concrete bridge decks” (70), “concrete bridges” (59), “corrosion” (52), “delamination” (50), “bridge inspection” (40), “infrared thermography” (40) and “deep learning” (39). This demonstrates that ground penetrating radar and infrared thermography cameras are the most periodically utilized nondestructive evaluation techniques in bridge inspection. In addition, the bridge deck is found to be the most investigated bridge component. Furthermore, corrosion and delamination are identified as the most studied bridge defects in terms of either detection or severity evaluation. Deep learning is determined as the most widely used artificial intelligence sub-field in bridge inspection whether through transfer learning-based networks or networks trained from scratch. It was also noticed that the author keywords of “ground penetrating radar” (39), “infrared thermography” (27) and “impact echo” (23) are accompanied by the highest total link strength. This manifests that these NDTs were heavily leveraged in the literature to complement other nondestructive techniques to analyze bridge defects.

3.8. Document Analysis

Table 6 elucidates a summary of the highly cited articles pertaining to CBD_NDT research. It is worth mentioning that articles are sorted based on their total citations during the specified study period. The article entitled “Analysis of Edge-Detection Techniques for Crack Identification in Bridges” is ranked first with 418 citations and 3.58 normalized citations. It reports the implementation of four edge detection algorithms for identifying surface cracks in bridges, namely, fast Haar transform, fast Fourier transform, Canny and Sobel. The authors suggested that fast Haar rendered significantly better detection accuracies than the other edge detection algorithms. It was also revealed that the article entitled “Application of infrared thermography to the non-destructive testing of concrete and masonry bridges” is ranked second with 266 citations and 2.27 normalized citations. this study relied on visual analysis of infrared thermograms to localize potential delamination spots in the bridge deck and abutment.
The article entitled “Comparison of deep convolutional neural networks and edge detectors for image-based crack detection in concrete” is in the third ranking and it was cited 246 times and accompanied by 10.35 normalized citations. The authors analyzed the AlexNet deep convolutional neural network and six edge detection algorithms to detect surface cracks. These algorithms comprised Butterworth, Gaussian, Laplacian of Gaussian, Sobel, Prewitt and Roberts. It was evinced that AlexNet was able to detect cracks with better accuracies and shorting testing times than the edge detection algorithms. The article entitled “Automated Crack Detection on Concrete Bridges” obtained 197 citation counts and 7.83 normalized citations. In this, a crack density map for the bridge mosaic was created using a spatially tuned robust multi-feature (STRUM) classifier. Their model consisted of a line segment detector, spatially tuned feature selection and a machine learning classifier. The article with the title “Image-based retrieval of concrete crack properties for bridge inspection” is the fifth-ranked. In this, an experimental setup was designed to correlate crack depth and width. In addition, an artificial neural network with one hidden layer and ten hidden neurons was trained to forecast the depth of crack images.

3.9. Authors’ Productivity

Lokta’s law is one of the paramount laws in bibliometric studies used to characterize authors’ productivity in any designated field [48,49]. According to this law, 60% of authors will publish only one research article on a certain subject, 15% of authors will publish two articles and 6.6% of authors will publish three articles [50,51]. The frequency distribution of scientific productivity in CBD_NDT research is depicted in Figure 12. The dashed lines and solid lines elucidate the theoretical and observed frequency distributions, respectively of authors’ productivity in CBD_NDT research. It can be seen that 74% of authors published one journal article, 14% of authors published two journal articles, and 5.8% of authors published three journal articles. This implies the presence of many occasional authors in CBD_NDT research. This can be elicited from the intertwining between surface defects analysis with the computer science field, which creates transient collaboration groups between scholars of civil engineering and computer science, whereas this area is not regarded as the core research domain of the latter.

3.10. Analysis of Most Impactful Authors

The contributions of authors are analyzed based on their h-index, m-index, g-index and total citations. H-index is a commonly-used metric in bibliometric studies to gauge author/journal research output. It is defined as the maximum value h , where a given scholar/journal published at least h journals that received at least h citation counts [52,53]. Furthermore, the indicator g-index is expressed as the largest unique number that the top g articles that obtained together at least g 2 citations in a given set of articles sorted in descending order according to their citation counts [54,55]. The indicator m-index is a variant of h-index and it is equal to the h-index divided by the number of years elapsed between the author’s first and last publication [56,57]. Table 7 reports the most influential authors based on their h-index, m-index and total citation counts. According to h-index, the top ten scholars are GUCUNSKI N (13), WASHER G (10), AZARI H (8), ZAYED T (8), ABUDAYYEH O (7), DINH K (7), MOSELHI O (7), LI G (7), YEHIA S (7) and KEE S (7). The values of the g-index reveal that GUCUNSKI N (24), AZARI H (14), ZAYED T (13), WASHER G (12) and DINH K (12) are the top five ranked authors. With regards to m-index, DORAFSHAN S (1), DALLA R F (1) and NEHDI M (0.86) are the top three most influential authors. In terms of citation count, GUCUNSKI N (823) is the most cited author, followed by ABUDAYYEH O (720) and LA H (571).

4. Systematic Review Analysis

This section delineates the results of a systematic review analysis of the relevant literature in the CBD_NDT domain.

4.1. Distribution of Defects and NDTs

Figure 13 depicts a visualization of the tackled defects in the CBD_NDT domain. The “Others” category comprises the defects of bulge, erosion, deflection, pitting and pop-out. It was found that delamination (29.83%), surface cracks (28.26%), corrosion (19.33%), voids (7.98%) and spalling (5.04%) are the five most investigated defects in the research field of CBD_NDT. Furthermore, surface defects are also found to account for a considerable portion of 35.5% of the pool of studied defects in this literature review study. Several NDTs were exploited in the literature to detect and characterize surface and subsurface defects. The used NDTs in the research field of CBD_NDT are shown in Figure 14. Among the identified NDTs in this literature review study, are digital photogrammetry (DP), ground penetrating radar (GPR), impact echo (IE), infrared thermography (IRT), half-cell potential (HCP), electrical resistivity (ER), chain drag (CD), ultrasonic surface waves (USW), laser scanning (SI) and linear polarization resistance (LPR). The category “AE + OF” includes acoustic emission and optical fiber sensors. In addition, reported studies used NDTs like hammer sounding (HS), ultrasonic testing (UT), ultrasonic pulse echo (UPE), Electrochemical impedance spectroscopy (EIS), magnetic-based test (MB), satellite imaging (SI), sound testing (ST), ultrasonic pulse velocity (UPV) and impulse response (IR). The “Others” category includes the NDTs of 3D neutron tomography, 3D X-ray tomography, acoustic scanning, acousto-ultrasonic, ball chain impact source, ultrasonic linear array, chloride content, electromagnetic resonance, Tafel plot, displacement sensors, reinforced concrete tomography, microwave method, time domain reflectometry and eddy heat imaging (EHI). The magnetic-based NDTs comprise magnetic flux leakage (MFL), induced magnetic field (IMF), infrastructure corrosion assessment method, magnetic force induced vibration evaluation, micro-magnetic sensor and squid magnetometer. In addition, the category “AE + OF” include acoustic emission and optical fiber sensors. It was seen that digital photogrammetry (24.05%), ground penetrating radar (17.05%), impact echo (13.45%), infrared thermography (12.31%) and half-cell potential (8.52%) are the most five utilized NDTs in the literature. In addition, it was observed that electrical resistivity, chain drag, ultrasonic surface waves, laser scanning (terrestrial or unmanned aerial vehicle (UAV)) and linear polarization resistance were utilized by 4.92%, 2.46%, 2.46%, 2.08% and 1.89%, respectively. Overall, it was derived that electromagnetic, electrochemical, magnetic, thermal, acoustic, optical and sensors constitute 17.99%, 16.67%, 1.7%, 12.31%, 22.92%, 26.7% and 1.7%, respectively. Table 8 and Table 9 list some of the tackled research papers in this study elucidating their studied defects and used NDTs.
Table 10, Table 11 and Table 12 explicate literature review matrices of concrete bridge defects against used NDTs. It can be conceived that DP is the most utilized NDT to assess cracking (17.48%), spalling (3.78%) and scaling (1.26%). It is reported that the detection of thin cracks is a particularly sophisticated task and they become difficult to distinguish, most notably in low contrast, nonuniform and noisy textures alongside various lighting conditions [86,87]. Moreover, the use of deep learning algorithms in surface defects is time-consuming since it needs large datasets for their training and annotation [88,89]. In addition, HCP is the most implemented NDT to evaluate corrosion at 6.74%. However, it is highly challenging in a global-level assessment of an entire bridge element. Additionally, its measurements are influenced by the presence of moisture and chloride in concrete [16,90]. Moreover, it is observed that GPR is the second most used NDT for corrosion analysis (6.3%). Yet, the interpretation of GPR signals is complicated by factors such as rebar spacing, location of girders and columns, moisture ingress and pavement thickness [91,92]. ER (3.78%) and LPR (1.73%) are found to be the third and fourth most used NDTs to examine concrete corrosion. However, ER and HCP cannot be used to appraise corrosion in concrete bridge decks with asphalt overlay [90,93]. In addition, the use of HCP, ER and LPR requires diverting traffic [90]. IRT (9.76%), IE (8.19%) and GPR (4.41%) are the three most specialized NDTs to deal with concrete delamination. In the same vein, CD and HS were leveraged to detect delamination in 1.88% and 0.63% of studies, respectively. Nevertheless, they are laborious, tedious, subjective and vulnerable to traffic noise [69,94]. Voids in concrete are primarily detected by IE (3.31%), GPR (2.2%) and IRT (1.42%). Nevertheless, IE is sensitive to boundary conditions [16,95]. Furthermore, GPR is noticed to be the forefront NDT to find moisture with 1.26%. DP (0.63%), SI (0.47%) and LS (0.31%) are noted to be the most constantly used NDT for deformation recognition in bridge elements. Concrete quality is principally evaluated using USW (1.42%) and GPR (1.26%). It can be also seen that GPR (0.63%), IRT (0.63%) and UT (0.47%) are the most effective NDTs to detect debonding damage. Nonetheless, the results of IRT are affected by ambient environmental conditions, it is unable to detect the depth of anomalies and encounters difficulties in finding deep subsurface defects [16,90,96].

4.2. Corrosion Detection and Diagnosis

This section attempts to exemplify some of the references that used non-destructive testing for corrosion detection and diagnosis. Some of the references devoted to corrosion detection and evaluation are shown in Table 13. A vast portion of the studies used ground penetrating radar for the evaluation of rebar corrosion. Some researchers relied on visual examination of waveforms or radargrams to interpret the GPR surveys [97,98,99]. Further studies created K-means clustering-based corrosion maps by analyzing the reflection amplitudes of reinforcement [100,101,102,103,104,105]. On the same note, Ata et al. [106] compared the clustering algorithms of expectation maximization, K-means and X-means using the Davies–Bouldin index and Dunn index for identifying the optimum threshold values of GPR reflection amplitudes. Mohammed Abdelkader et al. [107] created a standardized amplitude scale using a compilation of clustering, meta-heuristic optimization and multi-criteria decision-making algorithms. Martino et al. [108] leveraged receiver operating characteristic (ROC) curves to find the optimum threshold that establishes the appropriate correlation between half-cell potential measurements and ground penetrating radar amplitudes. Alsharqawi et al. [79] deployed a chi-squared test to determine the best distribution of threshold values after applying K-means clustering to multiple bridge decks. Monte Carlo simulation was then implemented to generate designated probability distributions of threshold values.
Other research efforts were devoted to the depth correction of GPR signals. Barnes et al. [109] carried out depth correction by fitting the 90th percentile amplitude value using linear regression analysis. In this regard, the two-way travel times are partitioned into bins of 0.5 ns, and the 90th percentile amplitude values are computed and fitted. Romero et al. [110] reviewed three depth correction methods for GPR data: the first finds the best-fit slope between two-way travel time and amplitude values, the second uses maximum reflection amplitudes of rebar, and the third utilizes the 90th percentile amplitudes. Dinh et al. [111] obtained normalized depth-corrected amplitudes by incorporating the attenuations elicited from geometric loss, dielectric loss and conductive loss. Several other studies primarily focused on looking at the problem of corrosion severity evaluation. Rahman et al. [112] adopted the Viola–Jones classifier to localize the hyperbolic reflections of reinforcement. Entropy values were computed for the intensity arrangements of detected regions and segmented into four deterioration zones using K-means clustering. Liu et al. [113] coupled H-Alpha polarization decomposition with reverse time migration algorithms for appraising early-stage corrosion. In this context, H-alpha decomposition was utilized for scattering classification and the creation of reconstructed color-coded GPR images. Dinh et al. [114] utilized the synthetic aperture focusing technique (SAFT) to visualize rebar locations and corroded areas. In addition, interpolation functions were elaborated for the reconstruction of 3D images from depth-corrected radargrams. Moselhi et al. [59] conducted pixel-level fusion using discrete Wavelet Transform (DWT) for GPR and IRT images. Histogram equalization and threshold segmentation were then applied to extract deterioration features present in the images. Ma et al. [115] detected peaks of rebar hyperbolas using the sum of square difference (SSD) with adaptive entropy thresholding. In addition, the GPR signal-to-noise ratio was utilized to examine the clarity of detected hyperbolas and subsequently assess the corrosion severities of rebar. Mohamadi et al. [116] suggested a fusion between multiple NDTs (HCP, ER, GPR and IE) for the detection of corrosion and delamination. In this regard, DWT was used to capture features of waveform signals. Machine learning classifiers of support vector machines (SVM), artificial neural network (ANN), decision tree (DT) and logistic regression (LR), were implemented for the feature-level fusion of measurements from NDTs.
A large number of research works utilized measurements from HCP, LPR and ER to assess the corrosion activity of rebar. Elsener [117] interpreted corrosion potential by looking at the gradients between passive and active areas. It was indicated that a drop in the potential to −0.6 V implies the presence of chloride-induced corrosion. Qian et al. [118] assessed the corrosion condition of reinforcement using measurements from concrete resistivity, half-cell potential and electrical resistivity. It was evinced that −450 mV (90% probability of corrosion) is a proper threshold value to interpret corrosion. In a latter study, Kim et al. [119] studied concrete quality and corrosion activity using P-wave transmission testing and half-cell potential, respectively. In this regard, potential values of −200 mV, −350 mV and −500 mV were set as thresholds for the rating system of corrosion risk. Soleymani and Ismail [120] evaluated corrosion activity using NDTs of LPR, HCP, Tafel plot (TP) and chloride content. The threshold values of 0.2 and 1 µA were used to differentiate between passive, moderate and active states of corrosion. It was deduced that the four NDTs agreed on 24% of the entire specimen. Furthermore, LPR and TP overestimated corrosion activity more than HCP and chloride content. Bourreau et al. [121] utilized HCP and ER for corrosion diagnosis on bridge piers. Threshold values of 50 KΩ and 100 KΩ were used to separate areas with negligible, moderate and high corrosion risks. Kamde et al. [122] employed LPR, HCP and EIS to measure corrosion states of fusion-bonded epoxy (FBE) coated steel rebar. Results demonstrated that LPR and HCP failed to detect early stages of corrosion in FBE-coated steel reinforcement.
A fourth branch of research efforts was designated for the multi-modal non-destructive evaluation of bridge defects. Pailes et al. [123] used the multimodal NDTs of GPR, HCP, ER, IE and HS to analyze the corrosion and delamination of bridge decks. Potential values of −350 mv and −200 mv were used to depict a 90% probability of active and passive corrosion, respectively. It was also highlighted that high correlation levels were exhibited between the pairs (HCP, ER), (ER, HS) and (HS, GPR). Gucunski et al. [124] created an autonomous system for bridge non-destructive evaluation called “RABIT”. It encompasses four NDTs, namely, ER, GPR, IE and USW, to assess corrosion, delamination and concrete quality. A condition index was thereafter calculated for each NDT based on weighted averaging of the deterioration areas in each condition state. Gucunski et al. [125] investigated five NDTs, namely, IE, GPR, HCP, USW and ER, for evaluating the delamination, corrosion and concrete quality of bridge decks. A weighted condition index was constructed for IE, GPR, HCP and ER, and a combined condition curve was subsequently created from their blending. Furthermore, significant agreements were experienced between the pairs (ER, HCP), (ER, GPR) and (HCP, GPR). Kilic and Caner [126] performed non-destructive evaluation using augmented reality technology, visual inspection, GPR, IRT, laser distance sensors and a telescopic camera. Robison et al. [80] evaluated bridge decks with and without asphalt overlays using CD, IE, IRT and GPR. Reasonable levels of correlation were sustained between CD, IE, IRT and GPR. Their approach aimed to investigate cracks, voids, moisture, delamination and corrosion.
A fifth group of research studies contains the less frequently utilized NDTs. Frigerio et al. [127] applied reinforced concrete tomography (RCT) with gamma rays for corrosion and honeycombing detection. In this context, defects were detected and discriminated by analyzing the gammagraphy of the designated bridge element. Fernandes et al. [128] adopted induced magnetic field and magnetic flux leakage tests to identify hidden corrosion in prestressing strands. Corrosion was determined by observing the shape and size of the variations of the magnetic flux patterns. It was concluded that both IMF and MFL were able to provide satisfactory detection results with a slight advantage for MFL. Zhao and Xiong [129] used electrochemical impedance spectroscopy to measure corrosion in the bridge deck. The analysis of variance (ANOVA) test was applied to investigate the implication of temperature on the impedance performance of concrete slab, and they suggested that temperature could influence the impedance performance and expedite the corrosion process. Zhu et al. [130] presented a piece of equipment that utilized EHI for the detection and quantification of corrosion. Through an ANOVA test, it was proved that there was a correlation between surface temperature and cover thickness and rebar diameter as well as between surface temperature and corrosion amount. Oh et al. [131] implemented a magnetic flux detection method for corrosion detection in tendons of prestressed concrete bridges. Kernel principal component analysis was adopted to remove intrinsic noises in MFL data. Thereafter, corrosion was obtained from a damage index that was retrieved from the denoised signals of a search coil and a Chattock coil. Mosharafi et al. [132] utilized a passive magnetic-based NDT called “iCAMM” for the corrosion assessment of bridge decks. In this context, gradient values and standard deviation of gradient values were exploited to process the raw magnetic data.
Table 13. Summary of some of the research studies devoted to corrosion assessment.
ReferencePublication YearNon-Destructive TechniqueData Processing TechniqueTesting TypeElement Type
[112]2022Ground penetrating radarViola–Jones + K-means clusteringFieldDeck
[113]2022Ground penetrating radarH-alpha polarization decomposition + reverse time migrationLaboratorySlab
[106]2021Ground penetrating radarExpectation maximization, X-means and K-means clusteringFieldDeck
[131]2020Magnetic flux leakageKernel principal component analysisLaboratoryExternal tendon
[79]2020Ground penetrating radarChi-squared test + K-means clustering + Monte Carlo simulationFieldDeck
[116]2020Half-cell potential, ground penetrating radar and electrical resistivityDWT + ML (SVM, ANN, DT and LR)LaboratorySlab
[114]2019Ground penetrating radarSAFT and interpolation algorithmsFieldDeck
[115]2018Ground penetrating radarSSD with adaptive thresholdingFieldDeck
[59]2017Ground penetrating radarPixel-level image fusion using DWTFieldDeck
[105]2016Ground penetrating radarFuzzy set theory + K-means clusteringFieldDeck
[108]2014Ground penetrating radar and half-cell potentialROC curvesFieldDeck
[99]2013Ground penetrating radarVisual investigation of radargramsFieldDeck

4.3. Diagnosis and Assessment of Delamination

Table 14 lists some of the reported state of art models for the detection and assessment of delamination. The first group of studies discussed herein used CD/HS in their inspection. In their study, Henderson et al. [133] employed high-pass filtering and mechanical soundproofing to eradicate traffic noise from the recorded signals of a chain drag. In addition, a linear prediction coefficient was used to depict spectrograms of chain drag signals. Scott et al. [134] compared the NDTs of CD, IE and GPR in an investigation of delaminated bridge decks. The results demonstrated that IE and CD produced results compatible with the taken cores with a slight advantage to IE due to the subjective and inconsistent nature of CD. Conversely, GPR wasn’t able to properly find delamination features. Yehia et al. [135] evaluated the use of GPR and CD in the inspection of decks with anomalies of delamination, voids and cracks. The coring results of two decks manifested that CD and GPR could identify 23% and 77% of the deteriorated areas, respectively. Oh et al. [94] analyzed the utilization of CD, air-coupled IE and IRT in the detection of delaminated areas. They managed to detect most of the near-surface delamination, which aligned with the drilled cores. Additionally, they urged the use of IE and IRT based on a point-based system that tackled the physical, economical and logistic features of each NDT. Guthrie et al. [136] reviewed the use of air-coupled IE and CD in mapping delaminated areas. They pointed out that similar delamination maps were obtained by CD and IE demonstrated in the form of a variation of 3 percentage points between them.
The second set of research endeavors was primarily devoted to the use of GPR in delamination inspection. Shamsudin et al. [137] utilized GPR and VI for the detection and quantification of air-filled and water-filled delaminated areas in concrete decks. It was shown that VI was incapable of finding early delamination. In addition, the differences in delaminated areas between the two techniques varied from 2.3% to 32.6%. Clem et al. [138] pointed out that GPR could detect shallow delamination based on laboratory experiments for concrete specimens. The authors of [64] studied the influences of concrete mixes, concrete maturity and temperature on the capability of GPR to detect delamination, cracks, voids, corrosion, honeycombing and missing rebar. It was derived that delamination was successfully detected by GPR with an accuracy surpassing 91%. In another study, Dinh and Gucunski [139] investigated the factors implicating the capability of GPR to detect delaminated areas. They indicated that delamination thickness, depth and closeness to rebar highly influence the detectability of delamination by GPR. Yehia et al. [140] explored the applicability of IRT, IE and GPR in the detection of flaws like cracks and delamination. It was shown that GPR yielded high accuracies in the detection of voids and delamination, but failed to find surface cracks. Moreover, IRT could identify voids and delamination when they are shallow and large. In addition, IE managed to identify the three types of flaws with high efficiency. Sultan and Washer [141] scrutinized the applicability of GPR to identify corrosion-induced and non-corrosion delamination using ROC curves. It was interpreted that the area under the curve (AUC) lay between 0.475 and 0.672, which implied that GPR is not a preferable NDT to detect delamination even in bridges with a high chloride activity.
A third group of research studies principally focused on acoustic techniques in their inspection. Zhang et al. [142] proposed an automatic impact-based delamination detection (AIDD) system to find delamination between concrete slab and repair patches. In this regard, modified ICA was for noise suppression, and mel frequency cepstral coefficients were utilized as dominant input features. Moreover, a radial basis function network of 20 hidden neurons with a spread value of 10 was implemented for delamination detection. Hendricks et al. [143] utilized a high-speed acoustic impact-echo sound system for delamination localization. The acoustic responses were then fed into a CNN model to be trained and facilitate the automated detection of delamination based on spectrograms. In a study presented by Sengupta et al. [144], a multi-class SVM model with a Gaussian kernel function was used for the automated characterization of IE signals into condition ratings. Ref. [145] compared the performances of 1D-CNN, 1D recurrent neural network using bidirectional LSTM units, AlexNet, ResNet and GoogleNet for automated classification of IE spectrograms into defected and sound regions. It was indicated that 1D-CNN could outperform other models attaining accuracies of 0.95 and 0.7 for healthy and defected regions, respectively. Ref. [146] employed 1D-CNN and AlexNet (full training and transfer learning) on IE signals to discriminate between defected, sound and de-boned areas. In this context, 1D-CNN sustained the best prediction performance reaching 0.68 and 0.58 for cement overlay and asphalt overlay specimens, respectively.
The fourth collection of papers based their delamination inspection on IRT. It was observed that some research endeavors capitalized on the manual analysis of thermal images for delamination localization [39,147,148,149]. Omar and Nehdi [44] investigated the use of unmanned aerial vehicle infrared thermography for the assessment of subsurface delamination. They applied histogram equalization to enhance the contrast of thermal images and distribute their intensities. Thereafter, K-means clustering was utilized to cluster the temperature values of pixels into three clusters, namely warning, monitoring and sound. Sultan and Washer [150] exploited ROC curves to specify the optimum threshold valuer of thermal contrast, which differentiates sound from delaminated regions. In this regard, impact echo and coring were used for ground-truth labeling of pixels. Omar et al. [151] utilized an IRT camera mounted on a car for the detection of delamination. A mosaicked thermogram for the whole bridge deck was created based on temperature thresholds that were defined using K-means clustering. Cheng et al. [152] carried out pixel-level segmentation using an encoder-decoder deep learning architecture that encompassed DenseNet with densely connected atrous pyramid pooling (DenseASPP). A sliding window detector algorithm was introduced to apply the pixel-level detection model to the entirety of the bridge deck. Cheng et al. [153] presented edge detection-based LSM for detecting the edges of subsurface delamination. In this context, a temperature gradient map was constructed based on a modified edge detector that comprised the use of the Sobel kernel function and anisotropic flux function. Pozzer et al. [154] established multiple regression analysis functions to interpret the most important influencers of concrete surface temperature. They inferred that the most influential factors comprised inspection time, solar radiation, ambient temperature and atmospheric pressure.

4.4. Detection of Voids

Table 15 reports some of the conducted research studies for void detection. The authors of [155] detected the presence of voids under concrete decks through the visual examination of GPR radargrams. The authors of [156] conducted an investigation using ultrasonic tomography to find voids in tendon ducts of post-tensioned bridge beams. In this regard, they can be localized by monitoring the time-of-flight of ultrasonic pulses. Iyer et al. [157] investigated the presence of voids by studying 2D ultrasonic C-scan images. In this regard, flaw gates were applied to retrieve the A-line signals, and transform them into C-scan images. Tinkey and Olson [158] obtained a three-dimensional visualization of IE scanning for the localization of grouting discontinuities like voids. Belli et al. [159] studied the discrepancies in the response amplitudes of A-scans between defective and healthy bridge decks. In this context, voids can be determined by subtracting the response amplitude of healthy decks from the response amplitudes of defective decks with voids. Oh et al. [160] utilized LSTM to train processed IE data while considering the distance between measured and hit points, the depth of the ducts and the thickness of the slab. Lee et al. [161] used a CNN autoencoder to detect voids based on captured IE signal data. Moreover, continuous wavelet transform (CWT) was utilized to convert the IE signals to scalogram images. Oh et al. [162] implemented LSTM to analyze the time series characteristics of IE signals, and a feed-forward neural network (FFNN) was adopted to characterize the frequency spectrum of the IE signals. A multiplication operation was then performed to consolidate the feature vectors from the outputs of LSTM and FFNN, which was further studied to detect the presence of voids. Pedram et al. [163] carried out an investigation using IRT of slabs with simulated voids. Maximum thermal contrast was utilized to understand the relationship between temperature variations and the depth of the voids. Then, multivariate linear regression functions were proposed to predict the maximum thermal contrast with void depth and initial temperature set as explanatory variables.
A second collection of research studies were dedicated to the detection of other defects alongside voids like debonding, delamination, corrosion and cracks. Gassman et al. [164] carried out an investigation of precast and reinforced concrete slab using IE. In this context, Fast Fourier Transform (FFT) was applied to analyze the resonant peaks of P-waves, which are then used to characterize delamination and voids in slabs. Yehia et al. [140] evaluated the application of IRT, IE and GPR in the detection of surface cracks, delamination and voids. In this regard, designated anomalies were monitored through the examination of frequency responses, radargrams and thermograms. Abdel-Qader et al. [165] deployed IRT for the detection of voids and delamination in concrete slabs. A modified seeded region growing algorithm and dilation morphological operation were applied to segment the thermal images into defected and non-defected regions. Abdel-Qader et al. [166] utilized GPR for the detection of voids and delamination. In this context, three deconvolution algorithms consisting of SVD, independent component analysis (ICA) and subset selection were applied and reviewed for diminishing the overlap between reflections and improving the estimation of round-trip travel times. Coleman and Schindler [167] compared the use of IE, GPR and IRT in the detection of voids, delamination and corrosion. It was revealed that GPR wasn’t able to identify voids and delamination. In addition, IE succeeded in finding shallow and deep delamination alongside shallow voids but failed to detect deep voids.
Table 14. Review of some of the research studies on delamination detection and assessment.
ReferencePublication YearNon-Destructive TechniqueData Processing TechniqueElement TypeTesting Type
[144]2021IESVMDeckField
[154]2020IRTMultiple regression analysisSlabLaboratory
[153]2020IRTTemperature gradient-based level set method (TLSM)DeckField + laboratory
[152]2020IRTEncode-decoder deep learning architecture (DenseNet + DenseASPP)SlabField + laboratory
[143]2020IECNNDeckField
[168]2018Ball-chain impact sourceShort-time Fourier transformDeckField
[151]2018IRTK-means clusteringDeckField
[141]2018GPRROC curvesDeckField
[44]2017IRTHistogram equalization + K-means clusteringDeckField
[150]2017IRTThermal contrast threshold + ROC curvesDeckField
[149]2013IRTManual examination of thermogramsDeckField
[142]2012AIDDModified ICA + Mel-frequency spectral coefficients + RBFNDeckField + laboratory
[39]2003IRTManual examination of thermogramsDeck and abutmentField

4.5. Detection of Moisture, Debonding, Deformation and Rupture

Some researchers counted on the visual analysis of waveforms/radargrams of GPR data for the investigation of moisture ingress in concrete [46,98,169,170,171,172]. Ref. [63] developed a three-layered FFNN for the automated detection of moisture ingress based on GPR surveys. In this regard, the input signals of GPR were processed using a sliding window, 64 samples in size, with a step of one sample between two consecutive windows. (Kilic et al. [173]) deployed the techniques of split-spectrum processing and order-statistic filtering to enhance the signal-to-noise ratio of GPR signals, which can lead to better detection of moisture ingress. Earlier studies examined debonding of the overlay through visual investigation of GPR radargrams or IRT thermograms [148,174]. Rhim et al. [175] investigated debonding between concrete and fiber-reinforced plastic using microwave and ultrasonic methods. The inspection was performed using a horn antenna with a frequency bandwidth and center frequency of 10 GHz and 15 GHz, respectively. Hing and Halabe [71] inspected air-filled and water-filled debonding using 1.5 GHz ground-coupled GPR and IRT. They concluded that IRT and GPR are beneficial in finding air-filled and water-filled debonding, respectively. Ghosh and Karbhari [176] used IRT to pinpoint interlaminar debonding inside fiber-reinforced polymer composite or interface debonding between concrete and composite. Processed two-dimensional thermal profiles were compared against baseline thermal profiles to quantitively find debonding. Crawford [177] studied the bonding condition of carbon fiber-reinforced polymer laminates using impact echo. In this context, a significant correlation was sustained between signal frequency and bonding condition, whereas the peak frequencies of bonded and de-bonded areas were 3.26 and 2.88 kHz, respectively.
Table 15. Review of some of the research studies on void detection.
ReferencePublication YearNon-Destructive TechniqueData Processing TechniqueElement TypeTesting Type
[161]2022Impact echoCNN auto encoder + CWTDuctLaboratory
[163]2022Infrared thermography cameraMaximum thermal contrast + multivariate linear regressionSlabLaboratory
[162]2022Impact echoHeterogenous neural networkDuctLaboratory
[160]2020Impact echoLSTM + FFNNDuctLaboratory
[159]2008Ground penetrating radarNelder-Mead unconstrained nonlinear optimizationDeckLaboratory
[98]2008Ground penetrating radarVisual examination of radargramsDeckField
[158]2007Impact echoAnalysis of reflection of pulses from voidsDucts in posttensioned girderField
[157]2003Ultrasonic C-scan imagingAnalysis of patterns in C-scan imagesPost-tensioned tendonsLaboratory
[156]2001Ultrasonic tomographyAnalysis of time of flight of ultrasonic pulsesGrouted ducts in post-tensioned beamsLaboratory
[155]1996Ground penetrating radarVisual examination of radargramsDeckField
A third group of studies aimed to study deformation location and trends in bridges. The authors of [178] applied digital photogrammetry for deformation measurement in bridge columns. In this context, edge lines of columns were identified using the Robert threshold method. In addition, the odd-numbered and even-numbered horizontal lines of images were studied separately to ameliorate the calculation process of deformation. Hoppe et al. [179] implemented InSAR technology for long-term monitoring of deformation. They exploited the SqueeSAR algorithm to process the data obtained from the TerraSAR-X radar satellite. Wang et al. [72] applied Persistent Scatterer Pairs InSAR (PSP-InSAR) technology to deformation detection and the analysis of piers. In this regard, a three-dimensional deformation model was created using the Green spline interpolation algorithm. The most unfavorable condition method and temporal deformation data were used to identify the time and location of the deformation. Schlögl et al. [180] analyzed deformation trends in beams using interferometric synthetic aperture radar (InSAR), vehicle-mounted mobile laser scanning (MLS) and airborne laser scanning (ALS). It was pointed out that InSAR suits the long-term observation of deformation while ALS rendered more flexibility than MLS. The fourth group of research studies deals with rupture and corrosion in tendons. Krause et al. [181] utilized four-channel SQUID (superconducting quantum interference device) system for the detection of rupture in steel tendon. Signals of stirrups were repressed through: (1) best-fitting stirrups signals, and subtracting them from the measured signals, and (2) analyzing remnant field traces after amending the magnetization direction of the stirrups. Youn et al. [182] carried out an inspection using acoustic emission sensors to find corrosion-induced breaks in wires in grouted post-tensioned beams. In this regard, breaks were identified through the examination of dissipated energy and the arrival time of sound waves.

4.6. Surface Defects Detection and Classification

This section addresses research studies on the semantic detection of surface defects. Through systematically reviewing the literature, it is noted that most previous research was directed toward surface cracks. Table 16 and Table 17 record some selected research studies for the detection of surface cracks based on digital photogrammetry. The detection of surface defects has been a notable research area in bridge maintenance management. Unsupervised segmentation and edge detection algorithms have been actively utilized to detect surface cracks before 2020. In this respect, some of the developed models deliberated and urged some highly-acknowledged edge detection techniques like the fast Haar transform [38], Sobel operator [183] and Laplacian of Gaussian operator [184]. Other relevant studies adopted some improvements to unsupervised segmentation techniques like the modified C-V algorithm [185,186], entropy meta-heuristic algorithm [187], 2D maximum entropy [188], fuzzy logic [189] and two-dimensional amplitude and phase estimation [190].
Another set of studies leveraged machine learning, which has achieved great success in surface defects detection since the embryonic stages of bridge maintenance management. One early approach was the use of principal component analysis to analyze cracks in bridge decks. In this model, local detection was carried out, whereas each image was partitioned into several blocks and each block was then processed individually. Other studies used supervised machine learning to detect crack patches. In the study by Adhikari et al. [42], a segmentation model was proposed based on finding crack connectivity, and then a skeleton image was created for crack segments to retrieve their descriptors of length and width. An artificial neural network was then proposed to predict the depth of the crack given its width. Prasanna et al. [41] investigated the prediction performances of support vector machines, Adaboost and random forest models fed by scale-space, intensity-based and gradient-based features. Lei et al. [191] introduced a crack central point method to characterize the features of crack fragments. Support vector machines and sequential minimal optimization were integrated for rapid crack inspection. Principal component analysis and integral projection were employed for optimal diagnosis of crack features. Then, an integrated model of support vector machines, enhanced salp swam algorithm (ESSA) and Dempster–Shafer (D–S) fusion algorithm was used to enhance crack detection accuracies. Jia and Huang [192] identified some hand-crafted geometric features like crack area, distribution density, projection vector and Euler number. A back-propagation artificial network was then implemented to distinguish between longitudinal, transverse and reflective cracks.
Deep learning has been pervasively applied to address crack detection problems since the year 2018. Some studies used the AlexNet architecture to find crack patches [40,193]. Sharma et al. [194] conducted a comparative study between the application of pre-trained deep networks of AlexNet, GoogleNet and ResNet-18 and deduced that GoogleNet and ResNet-15 had better accuracies. Another branch of studies utilized the region convolutional neural network (R-CNN) family such as R-CNN [195], faster R-CNN [196] and mask R-CNN [197]. Zheng et al. [198] reviewed the prediction performances of fully convolutional networks, R-CNN and the richer fully convolutional neural network (RFCN). It was suggested that RFCN could render fewer prediction errors and a more robust performance than the other deep learning topologies. A third branch of studies utilized the You Only Look Once (YOLO) family in crack detection. Zhang et al. [199] proposed an improved YOLO network for performing crack detection (CR-YOLO). Their approach was based on tuning the architecture of CSPDarkNet53, and an attention model was used to increase the focus on crack details. Yu et al. [200] built a crack detection and quantification model using the YOLO V5 network. A radio filter was exploited to eliminate speckle noises and a mask filter was implemented to eradicate handwritten markings. Kun et al. [201] designed a deep bridge crack classification network (DBCC-net) by employing YOLOX as the backbone architecture of the object detector and then pruning. Deng et al. [202] developed a YOLO V2-based model for bounding box-level detection of cracks and differentiation of them from handwriting scripts. Stochastic gradient descent with momentum algorithm was exploited for end-to-end training of the YOLO V2 network. Jiang et al. [203] used YOLO V4 as a first stage for the creation of coarse region details of crack patches. In the second stage, a deep learning-based network with a hybrid dilated convolutional block (HDCB-net) was presented for pixel-level crack detection.
A fourth group of research efforts leveraged the ResNet family of networks for carrying out crack detection. Kim et al. [204] adopted ResNet-18 for crack localization and characterization in bridge piers. Li et al. [205] created a crack identification model based on the ResNeXt framework and a post-processing module. It was inspired by Inception and Visual Geometry Group (VGG) networks, and the input dataset is divided into smaller batches and each previous batch is appended as the initial batch in the next iteration. The fifth branch of studies is designated for research efforts using VGG networks. Xu et al. [206] created a VGG-16-based network “CDFFHNet” for semantic segmentation of crack pixels. In that study, multiscale supervised learning and holistically nested network are utilized to merge the prediction results of different scales. Ye et al. [207] assessed the diagnostic performance generated from three deep neural networks consisting of a VGG-based fully convolutional network (FCN), Deeplab V3 and a pruned crack recognition network (PCR-Net). It was shown that the VGG-based FCN and PCR-Net could attain superior accuracies and lower computational time.
The final group of studies encompasses diverse sets of deep neural networks. Chu et al. [208] developed a multi-scale fusion network with an attenuation mechanism (Tiny-Crack-Net) for the segmentation of tiny cracks. In this model, a dual attention module and modified residual network were included to model the local characteristic of cracks and separate them from the background. Zheng et al. [209] built a lightweight deep-learning network based on the SegNet network and bottleneck depth separable convolution with residuals. A Root Mean Squared prop algorithm was implemented for learning the network, and cross-entropy was used as the loss training function. Zhang et al. [210] developed a crack detection approach by combining a one-dimensional convolutional neural network (1D-CNN) and a long-short-term memory network (LSTM). The images were pre-processed before training by converting them to the frequency domain using a fast Fourier transform to reduce the computational time. Qiao et al. [211] presented an improved U-net for crack identification. They incorporated Atrous Spatial Pyramid Pooling and improved inception modules to boost the efficiency of multi-feature fusion. Bae et al. [212] devised an end-to-end deep super-resolution crack network called “SrcNet”. In this network, a deep learning-based super-resolution technique is employed to circumvent the issues of resolution and blurring.
Chen [213] introduced a convolution neural network-based transfer learning framework for conducting box-level localization and the extraction of cracks. In this model, a migration learning technique was exploited to address the large size of the training dataset and alleviate overfitting and local minima issues. Flah et al. [214] integrated a convolutional neural network and Otsu thresholding to detect and quantify cracks. Dilation and erosion morphological operations were undertaken to remove noise from the images. Li et al. [215] presented a pixel-level crack segmentation model by coupling a convolutional neural network (CNN) with naïve Bayes (NB). After segmentation, skeletonization was performed to find the width of crack fragments. Zhu and Song [216] developed a weakly supervised network for pixel-level crack segmentation. It comprised CNN, K-means clustering (KMC) and an autoencoder, and network training was done using a stochastic gradient descent algorithm. Ni et al. [217] proposed a generative adversarial network-(GAN) based strategy for crack detection in bridge piers. In it, a GAN-based distance was presented to calculate the morphological differences between manual and predicted labels. In addition, fault tolerance indices were introduced to measure the level of morphological similarity. Tang et al. [218] Measured crack width using backbone double-scale features. U-net was used for crack segmentation, and the backbone refining algorithm used eight neighborhood pixels for morphological processing. In the same vein, another set of studies used other types of non-destructive evaluation techniques like laser scanner surveys [219,220,221], acoustic emission sensors [222,223,224] and ultrasonic pulse velocity [225].
Limited research work addressed other surface defects like spalling and scaling. Table 18 lists some of the research studies on the detection and quantification of spalling and scaling defects. Kasireddy and Akinci [226] introduced a point-cloud-based model for spall defect detection. In it, the Eigen entropy measure was used to find the optimal neighborhood size of K-nearest neighbors (KNN). Thereafter, the features of surface variation (SV), normal vector (NV) and curvature variation (CV) were extracted to be fitted to probability distribution functions. Al-Sabbag et al. [227] created an extended reality (XR) system to interactively detect and measure the size of spalling. In it, a feature back-propagating refinement scheme (F-BRS) was used to distinguish the damaged regions. Moreover, a ray-casting algorithm was implemented for projection from 2D image to 3D real-world coordinates. Mohammed Abdelakder et al. [228] proposed an integrated model for segmentation and severity prediction of scaling in reinforced concrete decks. In it, an invasive weed optimizer (IWO) was coupled with Kapur entropy and Renyi’s entropy functions for detecting spalling pixels. Discrete wavelet transform and singular value decomposition (SVD) were blended to build a feature map of spalling pixels. Elman neural network and invasive weed optimization were merged to predict automatically area of spalling in images.
With regards to scaling assessment, Mohammed Abdelkader et al. [74] blended a cross-entropy (CE) function and grey wolf optimizer (GWO) for differentiating scaling pixels from the background. Then, ENN and GWO were hybridized for automated measurement of scaling area based on the input feature vector of SVD and DWT. Adhikari et al. [229] presented an image-based approach to predict scaling depth. The selected geometric features comprised depth, area, perimeter, major axis length, minor axis length, aspect ratio and gray value. Then, a back-propagation artificial neural network was fed with the pre-defined extracted features for evaluating scaling depth, and it was able to outperform naïve Bayes- and bagged decision tree (BDT)-based methods. Mizoguchi et al. [67] assessed scaling depth in concrete piers using long-distance terrestrial laser scanning. In their model, a customized region growing algorithm with an interactive selection of seed points and use of primitive surfaces for quantitative evaluation of scaling depth from a 3D laser scanned point cloud. In addition, they managed to monitor secular variations in scaling depth using iterative closest point (ICP) and feature sampling (FS) algorithms.
Table 16. Summary of some of the research studies for detection of surface cracks using digital photogrammetry.
ReferencePublication YearData Processing TechniqueDetection TypeTesting TypeElement Type
[208]2022Tiny-Crack-NetPixel levelFieldDeck
[199]2022CR-YOLO network (YOLO for bridge crack detection)Pixel levelFieldColumn
[206]2022Convolution–deconvolution feature fusion with holistically nested networks (CDFFHNet)Pixel levelFieldDeck
[209]2021SegNet + bottleneck depth-separable convolution with residualsPixel levelFieldDeck
[203]2021YOLO V4 + deep learning-based network with hybrid dilated convolutional block (HDCB)Pixel levelFieldDeck
[188]2021Image blocking + 2D maximum entropy segmentationPixel levelLabBeam
[230]2021Feature extraction (integral project + principal component analysis) + crack detection (SVM + ESSA (D-S) fusion)Pixel levelFieldPier and girder
[211]2021Improved UNet convolutional neural networkPixel levelFieldGirder
[210]20211D-CNN-LSTMPixel levelFieldDeck
[212]2021SrcNetPixel levelFieldPier
Table 17. Summary of some of the research studies for detection of surface cracks using digital photogrammetry (Cont’d).
ReferencePublication YearData Processing TechniqueDetection TypeTesting TypeElement Type
[213]2021Transfer learning-based CNNBounding box levelFieldSubstructure
[194]2020AlexNet, GoogleNet and ResNet-18Image levelFieldDeck
[192]2020Geometric features (area, projection vector, distribution density and Euler number) + projection and wavelet denoising + ANNPixel levelFieldSubstructure
[214]2020Otsu + morphological operations + CNNPixel levelFieldBeam, girder, pier and cap
[191]2020Crack central point method + support vector machinesPixel levelFieldSuperstructure
[197]2020Mask R-CNNPixel levelFieldColumn and deck
[215]2020NB-FCNPixel levelFieldSubstructure
[216]2020FCN + KMCPixel levelFieldDeck
[184]2019Edge detection;
spatial domain (Roberts, Prewitt, Sobel, Laplacian of Gaussian), frequency domain (Butterworth, Gaussian)
Pixel levelFieldDeck
[195]2018Region with convolutional neural network (R-CNN) with transfer learningBounding box levelFieldRail
Table 18. Summary of some of the research studies for detection of spalling and scaling.
ReferencePublication YearNon-Destructive TechniqueTypes of Surface DefectData Processing TechniqueDetection TypeElement TypeTesting Type
[226]2022UAV Laser scannerSpallingEntropy-based approach + KNN + FS (SV + NV + CV)Deck, pier and abutmentField
[227]2022Digital photogrammetrySpallingXRIV + f-BRS + ray-castingPixel levelAbutmentField
[228]2021Digital photogrammetrySpallingSegmentation (KE + RE + IWO) + detection (SVD + DWT + ENN + IWO)Pixel levelDeckField
[74]2021Digital photogrammetryScalingSegmentation (CE + GWO) +detection (SVD + DWT + ENN + GWO)Pixel levelDeckField
[229]2014Digital photogrammetryScalingGeometric features + ML (BPNN, NB, BDT)Image levelDeckField
[67]2013Terrestrial laser scanningScalingRegion growing + ICP+ FSPierField

4.7. Classification of Surface Defects

This section reviews research studies devoted to the recognition of surface defects in different bridge components. Table 19 and Table 20 summarize some of the state-of-the-art studies devoted to the classification of surface defects in reinforced concrete bridges, indicating their data processing technique, detection type, component analysis and testing type. A few of the reported studies relied on the use of machine learning to categorize the type of defect. For instance, Mohammed Abdelkader et al. [231] presented an integrated machine-learning model for the classification of surface defects in bridge decks into cracks, spalling and scaling. Singular value decomposition was used to capture the intrinsic features of surface defects, and then an Elman neural network (ENN) and invasive weed optimization were integrated to characterize the type of surface defect. In addition, Kabir and Rivard [232] used a grey level co-occurrence matrix (GLCM) to map the texture features of the image. A maximum likelihood classifier (MLC) and un-supervised K-means clustering were applied to classify cracks, spalling, erosion and corrosion. In another study, Kabir et al. [233] combined Haar’s discrete wavelet transform and grey level co-occurrence matrix for texture analysis of surface damage. A multi-layer perceptron was then implemented to classify the damage into cracking, corrosion and spalling.
Another branch of studies exploited semantic thresholding for pixel-level classification of surface anomalies such as mean shift segmentation [234], Otsu, skeletonization and morphological operations [235] and thresholding and morphological operations [236]. In recent years, deep learning has soared as a solution for tackling complex problems of surface defect recognition. In this context, some research studies utilized the Inception V3 network [85,237], improved YOLO V3 [78], AdaNet [77], improved VGG-16 [238], modified ResNet-50 [239], GoogleNet [240], and MobileNet V2 [241]. Other relevant research studies exploited some of the highly acknowledged deep learning architectures such as VGG-16 [242], transformer networks [73], UNet + Efficientb0 backbone [243] and AlexNet [244].

4.8. Distribution of Artificial Intelligence Models and Evaluation Metrics

Figure 15 shows the distribution of the used artificial intelligence models with two or more occurrences in the domain of CBD_NDT. It can be seen that the trained-from-scratch CNN, VGG16 [245] and AlexNet [246] are the most utilized artificial intelligence networks. The increase in the use of some pre-trained networks like GoogleNet [247], ResNet-50 [248] and Unet [249] in recent years was also noted. Furthermore, the Elman neural network and ANN were the most implemented machine learning models. 
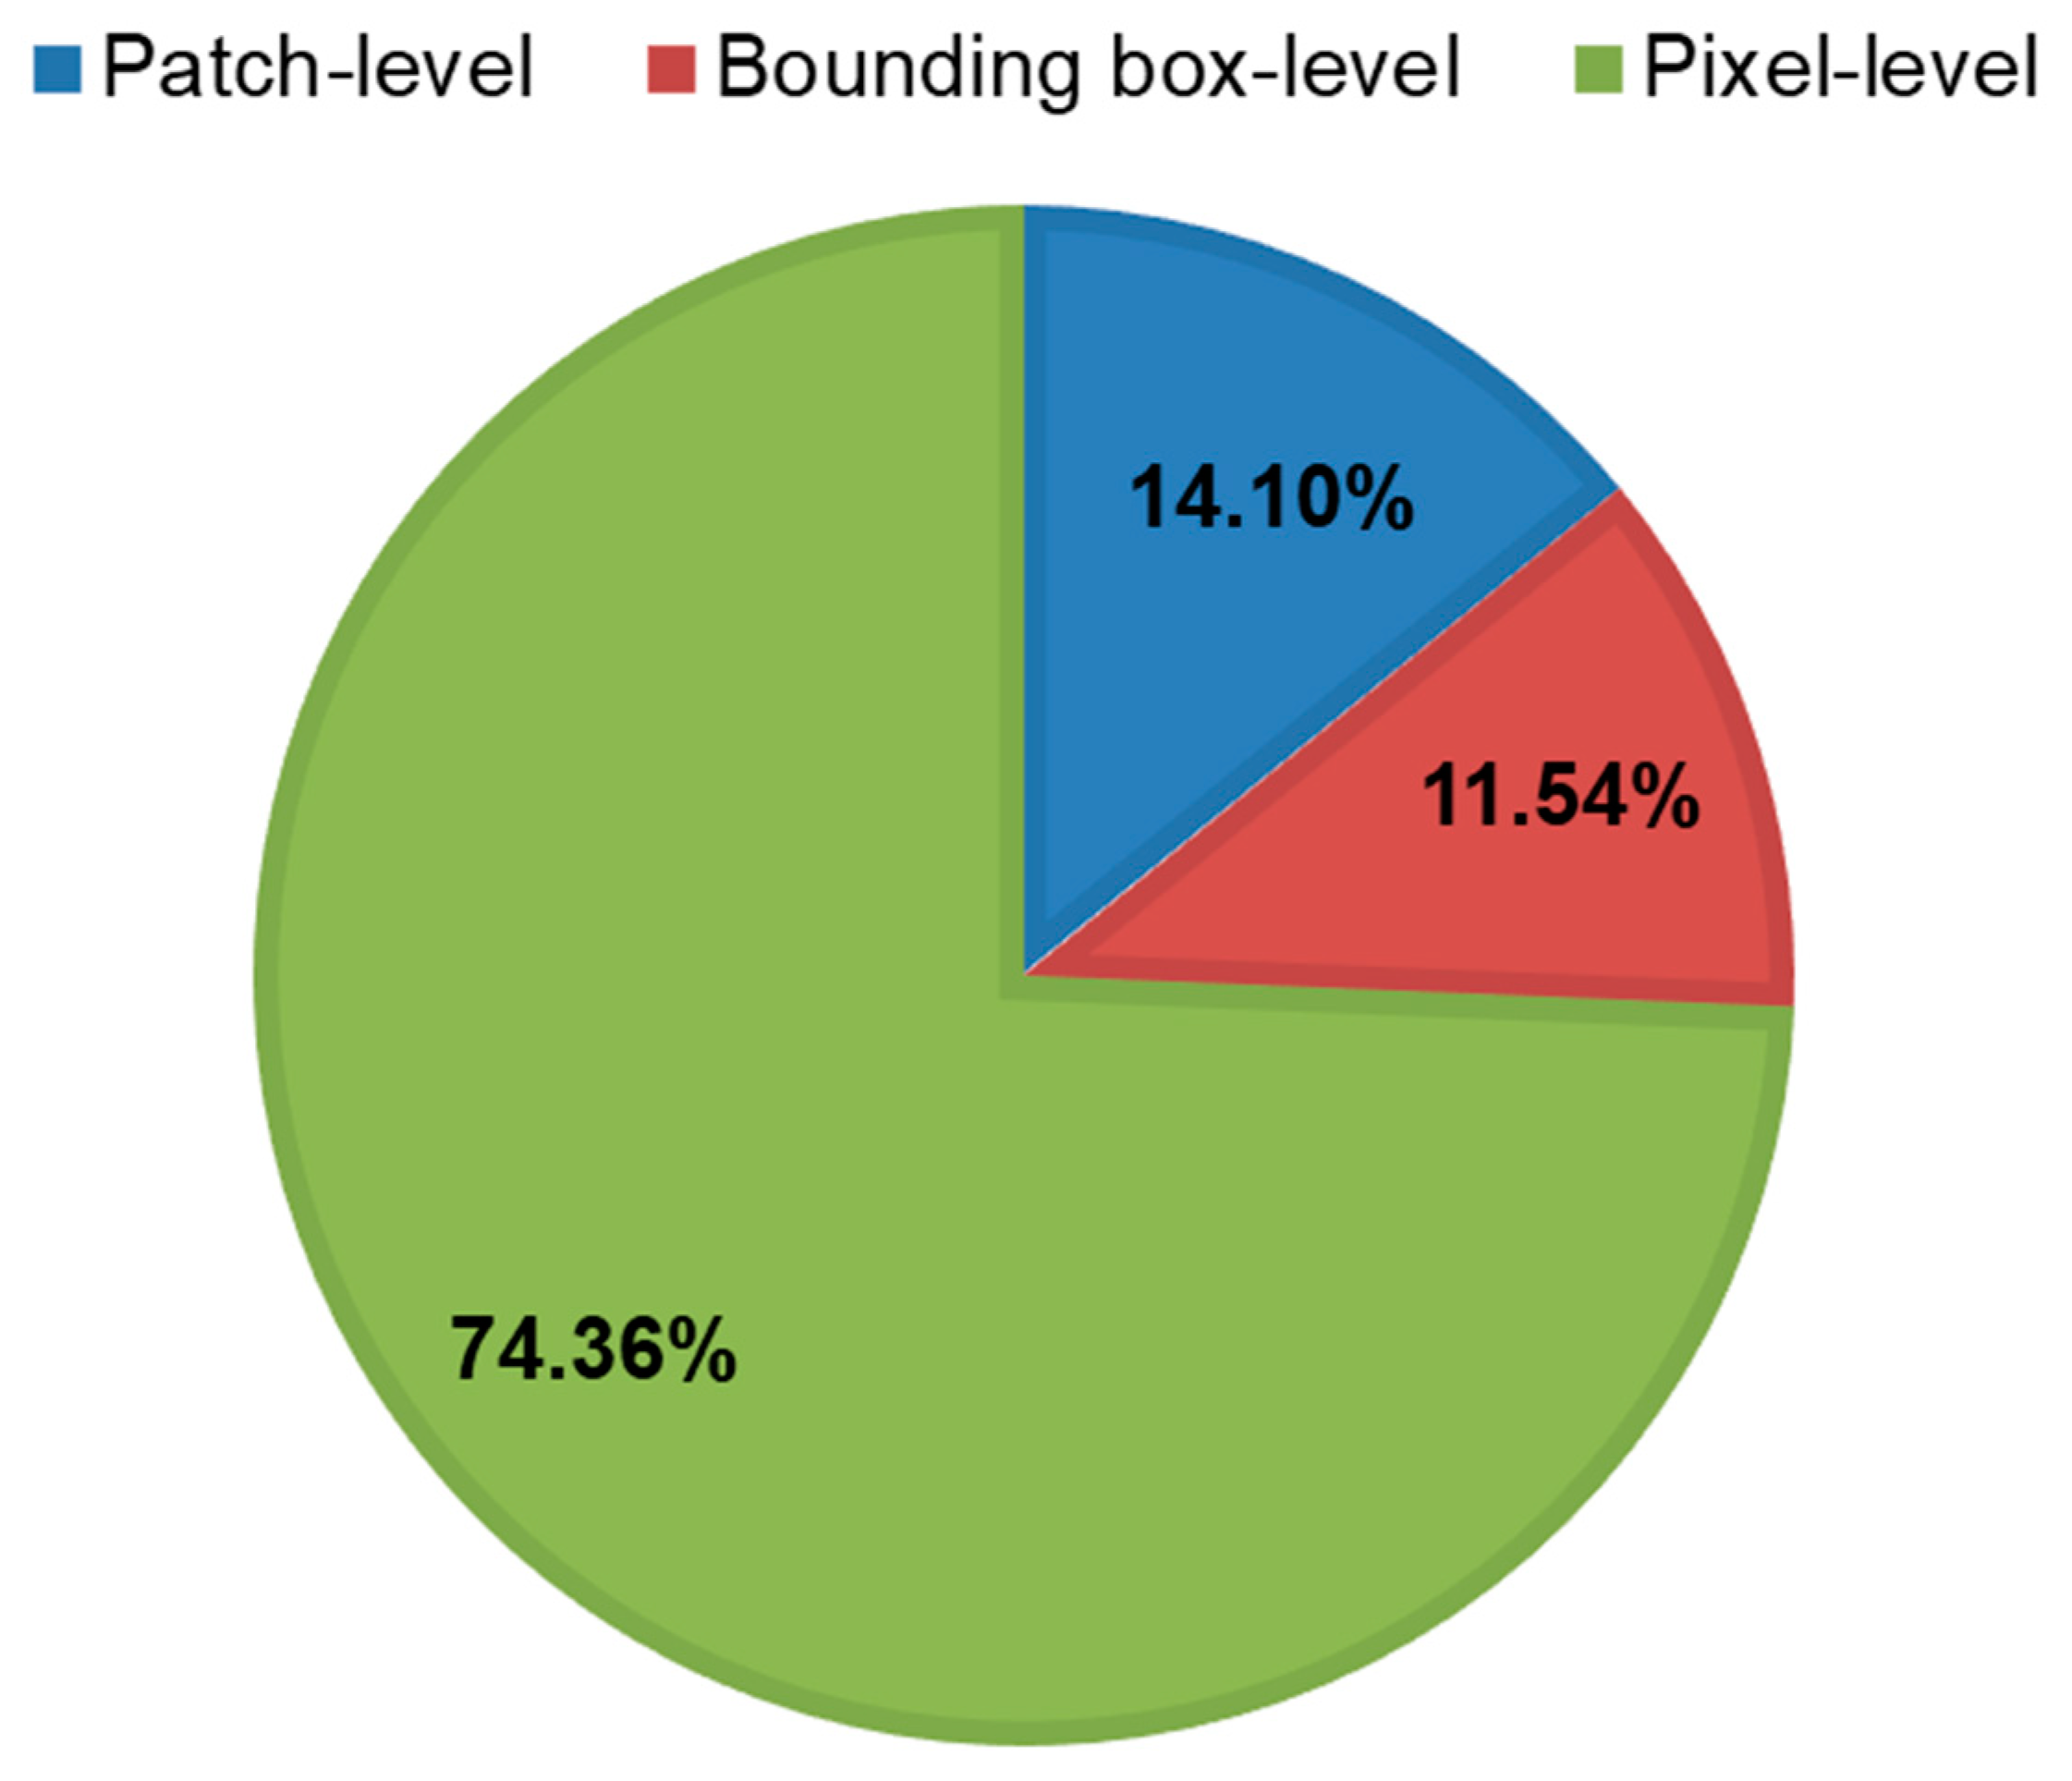
Figure 16 provides a visualization for the distribution of detection types of surface defects. It is found that most of the reported research studies counted on pixel-level detection (74.36%) of surface defects followed by patch-level detection (14.1%) and then bounding box-level detection (11.54%).
Table 19. Summary of some of the research studies on the classification of bridge surface defects.
ReferencePublication YearTypes of Surface DefectsData Processing TechniqueDetection TypeTesting TypeElement Type
[244]2022Cracks, spalling, honeycomb, bulge and backgroundAlexNet, GoogleNet and ResNetPixel levelFieldSubstructure superstructure and deck
[73]2022Cracks, efflorescence, general, no defect, scaling and spallingTransformer encoder + MLP headImage levelFieldDeck
[243]2022Cracks and spallingSegmentation (Unet, LinkNet, FPN and PSPNet) + classification backbone (Efficientnetb0, Densenet121 and Inceptionv3)Bounding box levelFieldSubstructure
[239]2021Cracks, erosion, honeycomb, scaling and spallingModified ResNet-50 + ANNBounding box levelFieldDeck, cap beams, pier, footing and parapet
[231]2021Cracks, spalling and scalingSVD + ENN + IWOImage levelFieldDeck
[242]2021Cracks, spalling, scaling, exposed reinforcement, rust staining and backgroundInception V3, ResNet-50 and VGG-16Pixel levelFieldDeck
[240]2021Cracks and delaminationAlexNet, SqueezeNet, ShuffleNet, ResNet-18, GoogleNet, ResNet-50, MobileNet-V2 and NasNet-mobileImage levelFieldDeck and pier
[78]2020Cracks, pop-out, scaling and rebar exposureImproved YOLOv3 networkBounding box-levelFieldDeck and column
Table 20. Summary of some of the research studies on the classification of bridge surface defects (Cont’d).
ReferencePublication YearTypes of Surface DefectsData Processing TechniqueDetection TypeTesting TypeElement Type
[238]2020Background, cracks, corner rupturing, edge/corner exfoliation, skeleton exposure and repairsImproved VGG16 networkImage levelFieldDeck
[77]2020Background, cracks and spallingAdaNetPixel-levelFieldDeck
[237]2019Cracks, efflorescence, scaling, spalling, general defect and no defectsInception V3 networkImage-levelFieldDeck and column
[85]2018Cracks, spalling and efflorescenceInception V3 networkBounding box-levelFieldDeck, pier, column and abutment
[232]2007Cracks, spalling, erosion and corrosionGLCM + MLC + KMCPixel-levelField + laboratoryDeck
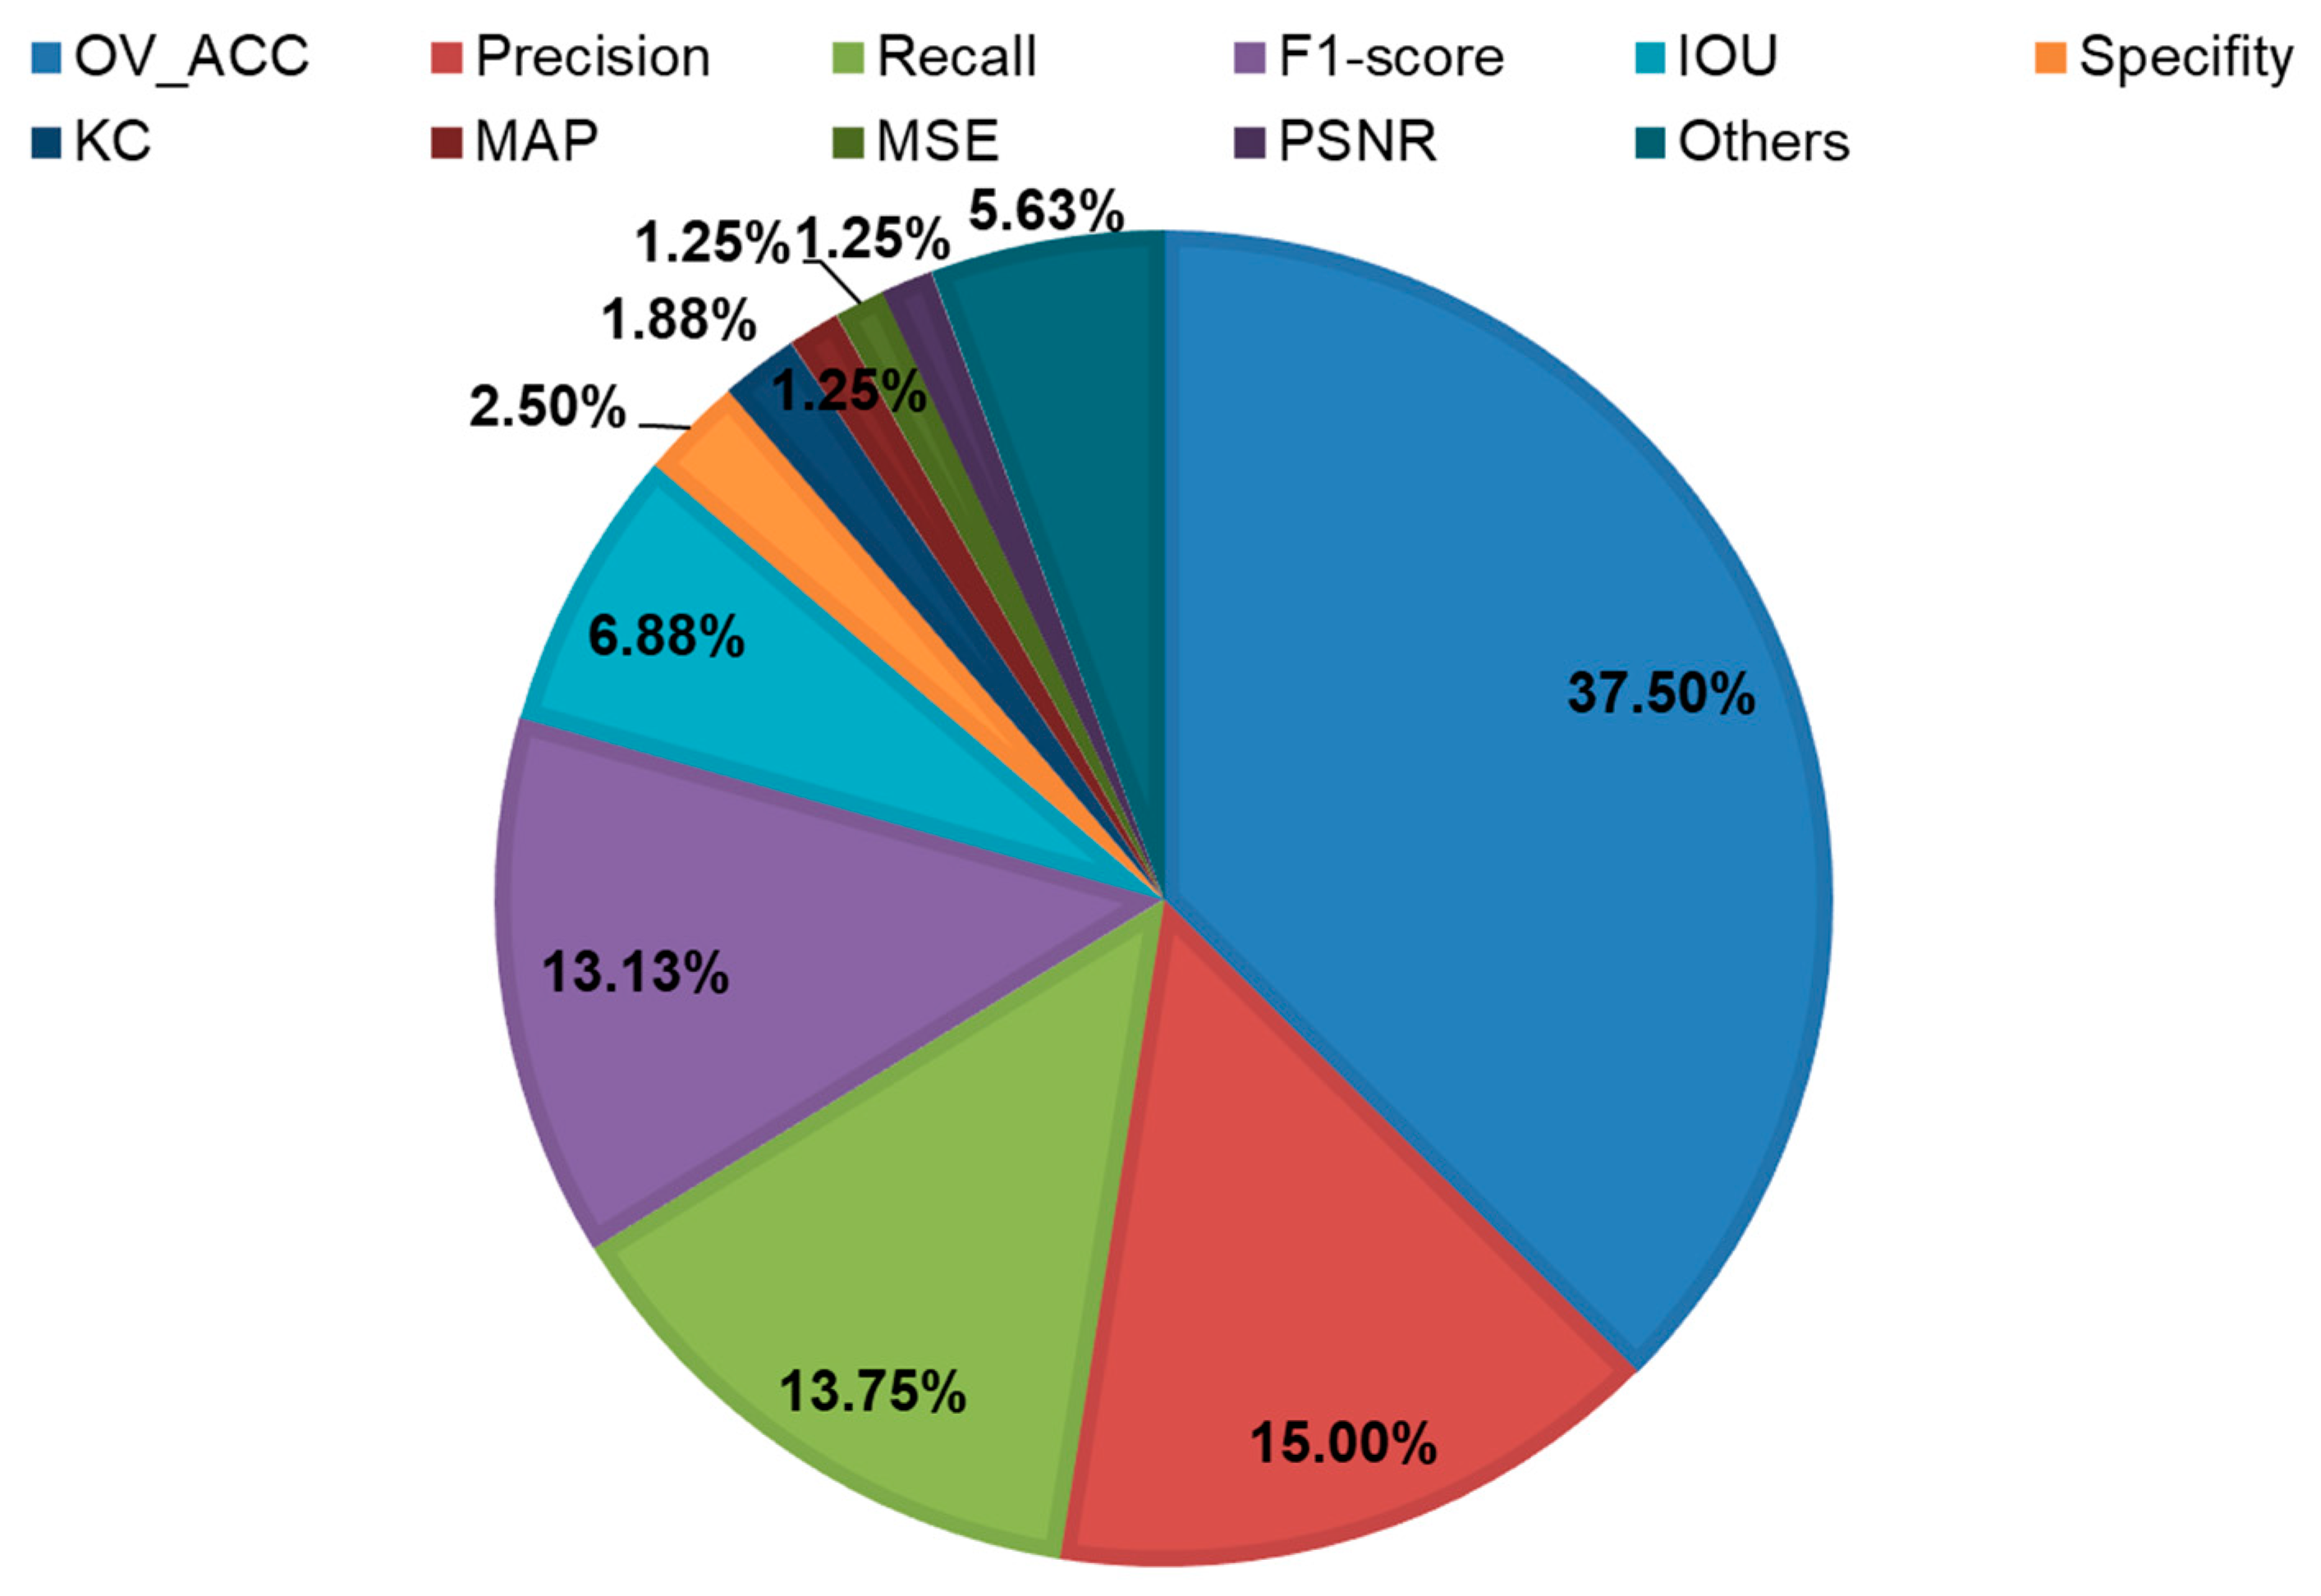
The distribution of performance evaluation metrics used in the CBD_NDT domain is illustrated in Figure 17. Overall accuracy (pixel or classification) is the most used performance indicator in the literature, accounting for 37.5% of the total number of times performance metrics were utilized. Precision, recall and F1-score come next, constituting 15%, 13.75% and 13.13%, respectively. In addition, intersection over union, specificity, Kappa coefficient, mean average precision, mean squared error and peak signal-to-noise ratio were featured by 6.88%, 2.5%, 1.88%, 1.25%, 1.25% and 1.25%, respectively. The lesser-used indicators were grouped in the “Others” category, and included area under the curve, balanced accuracy, error rate, mean absolute error, Matthew’s correlation coefficient, negative predictive value, structural similarity index measure, Dice similarity coefficient and frequency-weighted intersection over union.

4.9. Public Datasets

There are a few large-scale annotated datasets for surface defect detection and classification in the literature. These open-source datasets are essential for benchmarking state of art deep learning and machine learning models. In this regard, crack images constitute the dominant fraction of publicly available datasets. SDNET2018 is a patch-wise annotated dataset for the binary classification of surface cracks in bridge decks, walls and pavement [193]. Its bridge deck dataset comprises 2025 and 11,595 crack and non-crack images, respectively. The size of images is 256 × 256 with RGB channels, such that each image is labeled either “cracked” or “non-cracked”. Xu et al. [250] created a bridge crack detection dataset that encompasses image patches of size 512 × 512 pixels. The collected image dataset is composed of 4058 and 2011 crack and background images, respectively. These patches were further cropped to 224 × 224-pixel resolution and then flipped for augmentation purposes. Zoubir et al. [251] introduced an image dataset of cracks in decks and piers with captured images 224 × 224 pixels in size in RGB format. The acquired dataset was composed of 1304 and 5634 crack and non-crack images, respectively. In addition, the non-crack images contain details such as construction joints, stains and markings.
Li et al. [252] established a bridge crack dataset of 2000 images 1024 × 1024 pixels in size. They were cropped to 32,000 images 256×256 pixels in size in order to diminish the computational effort. The appended dataset consisted of 12,000 crack images and 19,500 non-cracked images, while 500 images were suspended for not contacting appropriate crack fragments. Hüthwohl et al. [237] presented a multi-target dataset for the classification of bridge defects. Its multi-label setting included defects annotated as cracks (789), efflorescence (311), general defect (264), no defect (452), spalling (427) and scaling (168). The subdirectories of the dataset included patches for exposed reinforcement (223), non-exposed reinforcement (203), rust staining (355) and no rust staining (415) which can be used for automated detection of corrosion and exposed reinforcement. CODEBRIM is another image dataset for the multi-label classification of bridge defects [253]. It contains five classes of defects, namely, crack (2507), spallation (1898), efflorescence (833), exposed bars (1507) and corrosion stain (1559). SDNET2021 is a new annotated dataset that was collected using ground penetrating radar, infrared thermography camera and impact echo [254]. It encompasses more than 663,102 labeled GPR signals, 4,580,680 labeled pixels of IRT and 1936 labeled impact echo signals.

5. Conclusions and Future Research Prospects

This literature review study carried out a scientometric and systematic analysis for state-of-the-art research pertinent to the assessment of reinforced concrete bridge defects using non-destructive techniques. In this context, this study reviewed 505 papers of 500 journal articles and 5 book chapters published between 1991 and 2022. The number of publications grew starting from 2002 onward and increased sharply from 2015 onward. In addition, the conducted performance analysis suggested that the average number of article citations per year has experienced significant growth since 2016. With regards to geographic distribution, the United States of America, China, Canada, South Korea and Japan are the most prolific countries in CBD_NDT research. The countries’ co-authorship analysis also revealed that significant collaboration relationships existed between the United States of America and Japan, between South Korea and Japan, and between China and Canada. Furthermore, the United States of America, Canada, China, South Korea and the United Kingdom were the top-placed nations according to citation counts. The conducted analysis exemplified that Rutgers University, Concordia University and Hong Kong Polytechnic University are the three most prominent institutions with regard to publication productivity. The top five active sources were Construction and Building Materials, Transportation Research Record, NDT & E International, Automation in Construction and Sensors. In addition, Construction and Building Materials, NDT & E International, the Journal of Computing in Civil Engineering, Automation in Construction and Sensors are the most cited journals. The Journals co-citation analysis exemplified the presence of a notable relationship between Computer-Aided Civil and Infrastructure Engineering and Automation in Construction, and between Construction and Building Materials and NDT & E International. In addition, the average normalized citations showed that the top five ranked journals were IEEE Transactions on Automation Science and Engineering, Computer-Aided Civil and Infrastructure Engineering, Structural Health Monitoring, Cement and Concrete Composites and Automation in Construction. At the same time, Bradford’s law identified the core journals as Construction and Building Materials, Transportation Research Record, NDT & E International, Automation in Construction, the Journal of Bridge Engineering, the Journal of Performance of Constructed Facilities, ACI Materials Journal, Structure and Infrastructure Engineering and Sensors.
The most relevant 10 keywords in the CBD_NDT domain were “nondestructive testing”, “ground penetrating radar”, “concrete”, “concrete bridge decks”, “concrete bridges”, “corrosion”, “delamination”, “bridge inspection”, “infrared thermography” and “deep learning”. The keyword co-occurrence analysis elucidated that GPR and HCP were the most used NDTs for corrosion assessment, IRT and IE were the most used for delamination evaluation, and DP, LS and sensors were the most dominant NDTs to deal with surface defects. The temporal keyword co-occurrence map elucidated that researchers’ main attention was directed toward corrosion assessment before 2014, transitioned towards delamination between 2016 and 2018, and then shifted toward surface defects from 2019 onward. In terms of author impact, GUCUNSKI N, WASHER G, AZARI H and ZAYED T were the foremost scholars according to h-index and g-index. Lotka’s law revealed the presence of many occasional authors contributing to the field of CBD_NDT research. Elsevier Ltd., ASCE, Springer, MDPI and SAGE Publishing Ltd. emerged as the leading publishers with respect to the number of produced papers. The systematic review analysis illustrated that scholars mostly used the NDTs of DP, GPR, IE, IRT and IRT in their research work. In that vein, most of the reported research endeavors were directed toward electromagnetic, electrochemical, optical and acoustic NDTs. In addition, the vast portion of research efforts studied the defects of corrosion, delamination and surface cracks. Conversely, limited research was devoted to honeycombing, rupture and efflorescence. The conduced analysis unveiled that trained-from-scratch CNN, VGG16, AlexNet, GoogleNet, ReseNet-50 and Unet are the most adopted deep learning models in the CBD_NDT domain. It was also noticed that surface detection models were carried out on pixel-level more than patch-level and bounding-box levels.
Future research directions need to pay more attention to other critical defects like deformation, efflorescence, honeycombing, erosion and pop-out. As for severity assessment, current research primarily focuses on delamination, corrosion and surface cracks. It is suggested that more exhaustive work needs to be performed on the severity evaluation of spalling, scaling, voids, moisture, rupture, efflorescence and debonding. Thirdly, the use of artificial intelligence and computer vision is mostly limited to surface crack detection and assessment. In this context, machine learning and deep learning models need to be further investigated and studied with other defects to ameliorate their automation and detection accuracy. Fourthly, there is a lack of integration models between sensors and electromagnetic or acoustic methods that can render both nondestructive evaluation and structural health monitoring. Fifthly, augmented reality can be coupled with NDTs to create an interactive display and assessment of bridge anomalies. Sixthly, most deterioration prediction and budget allocation models relied on visual inspection in their design due to the data-hungry nature of NDTs. To this end, NDTs need to be popularized in a wide range of case studies to be able to devise reliable deterioration prediction and maintenance budget allocation models. In addition, condition assessment using NDTs needs to be correlated with physical-related and environmental-related factors of bridges for reliable deterioration prediction. Seventhly, optimization models need to be constructed for bridge inspection using NDTs while considering the time, cost and societal constraints of their application. In this respect, most NDTs are applied in limited localized areas. To this end, inspection optimization can permit the application of NDTs efficaciously on a network level. Eighthly, there is a lack of publicly available datasets other than of surface cracks. These datasets are essential for the better application of artificial intelligence so that this research domain can reach a mature stage.

Author Contributions

Conceptualization, E.M.A., T.Z. and N.F.; methodology, E.M.A.; formal analysis, E.M.A.; data curation, E.M.A.; investigation, E.M.A., T.Z. and N.F.; resources, E.M.A. and N.F.; writing—original draft preparation, E.M.A. and N.F.; writing—review and editing, E.M.A., T.Z. and N.F. All authors have read and agreed to the published version of the manuscript.

Funding

The authors gratefully acknowledge the support from the Smart Traffic Fund (STF) under grant number PSRI/14/2109/RA.

Institutional Review Board Statement

Not applicable.

Informed Consent Statement

Informed consent was obtained from all subjects involved in the study.

Data Availability Statement

Some or all data that support the findings of this study are available from the corresponding author upon reasonable request.

Conflicts of Interest

The authors declare no conflict of interest.

Abbreviations

The following abbreviations are used in this article.
AcronymDescriptionAcronymDescription
CBD_NDTAssessment of reinforced concrete bridge defects using non-destructive techniques3DX3D X-ray tomography
STRUMSpatially tuned robust multifeature3DN3D neutron tomography
DPDigital photogrammetryM5Magnetic force induced vibration evaluation method
GPRGround penetrating radarSISatellite imaging
IEImpact echoBCISBall chain impact source
IRTInfrared thermographyASAcoustic scanning
HCPHalf-cell potentialEHIEddy heat imaging
ERElectrical resistivityiCAMMInfrastructure corrosion assessment magnetic method
CDChain dragASAcoustic scanning
USWUltrasonic surface wavesEHIEddy heat imaging
LSLaser scanning iCAMMInfrastructure corrosion assessment magnetic method
LPRLinear polarization resistanceAIDDAutomatic impact-based delamination detection
AE + OFAcoustic emission and optical fiber sensorsUAVUnmanned aerial vehicle
HSHammer soundingROCReceiver operating characteristic
UTUltrasonic testingSAFTSynthetic aperture focusing technique
UPEUltrasonic pulse echoDWTDiscrete Wavelet Transform
EISElectrochemical impedance spectroscopySSDSum of square difference
MBMagnetic-based SVMSupport vector machines
SISatellite imagingANNArtificial neural network
STSound testDTDecision tree
UPVUltrasonic pulse velocityLRLogistic regression
IRImpulse responseBDTBagged decision tree
MFLMagnetic flux leakageFBEFusion bonded epoxy
IMFInduced magnetic fieldANOVAAnalysis of variance
TDRTime domain reflectometry AUCArea under curve
SMSquid magnetometer ICAIndependent component analysis
RCTReinforced concrete tomographyDenseASPPDensely connected atrous pyramid pooling
CCChloride contentCWTContinuous wavelet transform
TPTafel plot FFNNFeed forward neural network
AUAcousto ultrasonicTLSM Temperature gradient-based level set method
MWMicrowave method FFTFast Fourier Transform
ERMElectromagnetic resonance measurementMLSVehicle mounted mobile laser scanning
ULAUltrasonic linear arrayALSAirborne laser scanning
MGSMicro-magnetic sensorPSP-InSARPersistent Scatterer Pairs InSAR
3DN3D neutron tomographyPSP-InSARPersistent Scatterer Pairs InSAR
ESSAEnhanced salp swam algorithmFCNFully convolutional network
D-SDempster-ShaferPCR-NetPruned crack recognition network
SQUIDSuperconducting quantum interference device1D-CNNOne dimensional convolutional neural network
R-CNNRegion convolutional neural networkLSTMLong short term memory network
RFCNRicher fully convolutional neural networkSrcNetSuper-resolution crack network
YOLOYou Only Look OnceCNNConvolutional neural network
CR-YOLOYOLO network for performing crack detectionGANGenerative adversarial network
DBCC-netDeep bridge crack classification networkF-BRSFeature back-propagating refinement scheme
HDCB-netDeep learning-based network with hybrid dilated convolutional blockNBNaïve Bayes
VGGVisual Geometry GroupKMCK-means clustering
MLCMaximum likelihood classifierKNNK-nearest neighbors
SVSurface variationGWOGrey wolf optimizer
NVnormal vectorICPIterative closest point
CVcurvature variationFSFeature sampling
XRExtended realityCDFFHNetConvolution–deconvolution feature fusion with holistically nested networks
IWOInvasive weed optimizerENNElman neural network
SVDSingular value decompositionGLCMGrey level co-occurrence matrix
CECross entropy

References

  1. Banerjee, S.; Vishwanath, B.S.; Devendiran, D.K. Multihazard Resilience of Highway Bridges and Bridge Networks: A Review. Struct. Infrastruct. Eng. 2019, 15, 1694–1714. [Google Scholar] [CrossRef]
  2. Hackl, J.; Adey, B.T.; Lethanh, N. Determination of Near-Optimal Restoration Programs for Transportation Networks Following Natural Hazard Events Using Simulated Annealing. Comput.-Aided Civ. Infrastruct. Eng. 2018, 33, 618–637. [Google Scholar] [CrossRef]
  3. Yang, D.Y.; Frangopol, D.M. Life-Cycle Management of Deteriorating Bridge Networks with Network-Level Risk Bounds and System Reliability Analysis. Struct. Saf. 2020, 83, 101911. [Google Scholar] [CrossRef]
  4. Zhang, W.; Wang, N. Bridge Network Maintenance Prioritization under Budget Constraint. Struct. Saf. 2017, 67, 96–104. [Google Scholar] [CrossRef]
  5. Mahdi, I.M.; Khalil, A.H.; Mahdi, H.A.; Mansour, D.M.M. Decision Support System for Optimal Bridge’ Maintenance. Int. J. Constr. Manag. 2022, 22, 342–356. [Google Scholar] [CrossRef]
  6. Rojob, H.; El-Hacha, R. Fatigue Performance of RC Beams Strengthened with Self-Prestressed Iron-Based Shape Memory Alloys. Eng. Struct. 2018, 168, 35–43. [Google Scholar] [CrossRef]
  7. Lou, P.; Nassif, H.; Su, D.; Truban, P. Impact of Overweight Trucks on the Service Life of Bridge Girders. Transp. Res. Rec. 2017, 2642, 103–117. [Google Scholar] [CrossRef]
  8. Zhang, Y.; Yuen, K.V. Review of Artificial Intelligence-Based Bridge Damage Detection. Adv. Mech. Eng. 2022, 14, 16878132221122770. [Google Scholar] [CrossRef]
  9. Piras, S.; Palermo, A.; Saiid Saiidi, M. State-of-the-Art of Posttensioned Rocking Bridge Substructure Systems. J. Bridge Eng. 2022, 27, 03122001. [Google Scholar] [CrossRef]
  10. Wang, J.; Huang, P.; Yuan, Y.; Zhou, G.; Han, W. Multifractal Analytical Method and Experimental Study on Crack Evolution of Dismantled RC Hollow-Slab Beam. Structures 2022, 40, 524–535. [Google Scholar] [CrossRef]
  11. Saleem, M.R.; Park, J.W.; Lee, J.H.; Jung, H.J.; Sarwar, M.Z. Instant Bridge Visual Inspection Using an Unmanned Aerial Vehicle by Image Capturing and Geo-Tagging System and Deep Convolutional Neural Network. Struct. Health Monit. 2021, 20, 1760–1777. [Google Scholar] [CrossRef]
  12. Jang, K.; Jung, H.; An, Y.K. Automated Bridge Crack Evaluation through Deep Super Resolution Network-Based Hybrid Image Matching. Autom. Constr. 2022, 137, 104229. [Google Scholar] [CrossRef]
  13. Rocha, J.H.A.; Póvoas, Y.V.; Santos, C.F. Detection of Delaminations in Sunlight-Unexposed Concrete Elements of Bridges Using Infrared Thermography. J. Nondestr. Eval. 2018, 38, 1–12. [Google Scholar] [CrossRef]
  14. Zhu, J.; Zhang, C.; Qi, H.; Lu, Z. Vision-Based Defects Detection for Bridges Using Transfer Learning and Convolutional Neural Networks. Struct. Infrastruct. Eng. 2020, 16, 1037–1049. [Google Scholar] [CrossRef]
  15. He, Z.; Li, W.; Salehi, H.; Zhang, H.; Zhou, H.; Jiao, P. Integrated Structural Health Monitoring in Bridge Engineering. Autom. Constr. 2022, 136, 104168. [Google Scholar] [CrossRef]
  16. Ahmed, M.H. Integrated NDE Methods Using Data Fusion for Bridge Condition Assessment; Concordia University: Montreal, QU, Canada, 2017. [Google Scholar]
  17. Jahangir, H.; Hasani, H.; Esfahani, M.R. Wavelet-Based Damage Localization and Severity Estimation of Experimental RC Beams Subjected to Gradual Static Bending Tests. Structures 2021, 34, 3055–3069. [Google Scholar] [CrossRef]
  18. Daneshvar, M.H.; Saffarian, M.; Jahangir, H.; Sarmadi, H. Damage Identification of Structural Systems by Modal Strain Energy and an Optimization-Based Iterative Regularization Method. Eng. Comput. 2022, 1–21. [Google Scholar] [CrossRef]
  19. Li, Z.; Liu, Y.; Yan, J.B.; Yu, W.L.; Huang, F.L. Experimental Investigation of P-Section Concrete Beams under Contact Explosion and Close-in Explosion Conditions. Def. Technol. 2018, 14, 540–549. [Google Scholar] [CrossRef]
  20. Yao, X. New Prospects for Designing Bridge Superstructure Reinforcements: Structural Aspects. In Structures; Elsevier: Amsterdam, The Netherlands, 2022; Volume 45, pp. 1–8. [Google Scholar] [CrossRef]
  21. Wnuk, K.; Garrepalli, T. Knowledge Management in Software Testing: A Systematic Snowball Literature Review. E-Inform. Softw. Eng. J. 2018, 12, 51–78. [Google Scholar]
  22. Ali, N.B.; Tanveer, B. A Comparison of Citation Sources for Reference and Citation-Based Search in Systematic Literature Reviews. E-Inform. Softw. Eng. J. 2022, 16, 1–12. [Google Scholar]
  23. van Eck, N.J.; Waltman, L. Software Survey: VOSviewer, a Computer Program for Bibliometric Mapping. Scientometrics 2010, 84, 523–538. [Google Scholar] [CrossRef] [Green Version]
  24. Iqbal, U.; Riaz, M.Z.B.; Barthelemy, J.; Perez, P.; Idrees, M.B. The Last Two Decades of Computer Vision Technologies in Water Resource Management: A Bibliometric Analysis. Water Environ. J. 2023, 1–17. [Google Scholar] [CrossRef]
  25. He, X.; Amin, M.N.; Khan, K.; Ahmad, W.; Althoey, F.; Vatin, N.I. Self-Healing Concrete: A Scientometric Analysis-Based Review of the Research Development and Scientific Mapping. Case Stud. Constr. Mater. 2022, 17, e01521. [Google Scholar] [CrossRef]
  26. Rana, I.A.; Khaled, S.; Jamshed, A.; Nawaz, A. Social Protection in Disaster Risk Reduction and Climate Change Adaptation: A Bibliometric and Thematic Review. J. Integr. Environ. Sci. 2022, 19, 65–83. [Google Scholar] [CrossRef]
  27. Shao, Z.; Li, M.; Yu, D. Bibliometric Analysis of Construction and Demolition Waste Recycling: Review and Prospects. Proc. Inst. Civ. Eng. Eng. Sustain. 2022, 175, 283–292. [Google Scholar] [CrossRef]
  28. Sgambati, S.; Gargiulo, C. The Evolution of Urban Competitiveness Studies over the Past 30 Years. A Bibliometric Analysis. Cities 2022, 128, 103811. [Google Scholar] [CrossRef]
  29. Zekhnini, K.; Cherrafi, A.; Bouhaddou, I.; Benghabrit, Y.; Garza-Reyes, J.A. Supply Chain Management 4.0: A Literature Review and Research Framework. Benchmarking 2021, 28, 465–501. [Google Scholar] [CrossRef]
  30. Umeokafor, N.; Umar, T.; Evangelinos, K. Bibliometric and Scientometric Analysis-Based Review of Construction Safety and Health Research in Developing Countries from 1990 to 2021. Saf. Sci. 2022, 156, 105897. [Google Scholar] [CrossRef]
  31. Zhang, L.; Dong, J.; Dong, Z.; Li, X. Research Hotspots and Trend Analysis in the Field of Regional Economics and Carbon Emissions since the 21st Century: A Bibliometric Analysis. Sustainability 2022, 14, 11210. [Google Scholar] [CrossRef]
  32. Wang, Q.; Huang, R.; Li, R. Impact of the COVID-19 Pandemic on Research on Marine Plastic Pollution—A Bibliometric-Based Assessment. Mar. Policy 2022, 146, 105285. [Google Scholar] [CrossRef]
  33. Borgohain, D.J.; Bhardwaj, R.K.; Verma, M.K. Mapping the Literature on the Application of Artificial Intelligence in Libraries (AAIL): A Scientometric Analysis. Library Hi Tech. 2022, 1–31. [Google Scholar] [CrossRef]
  34. Farooq, R. Knowledge Management and Performance: A Bibliometric Analysis Based on Scopus and WOS Data (1988–2021). J. Knowl. Manag. 2022, 1–44. [Google Scholar] [CrossRef]
  35. Basumatary, B.; Yuvaraj, M.; Verma, M.K. Scientific Communication of East Asian Countries on Internet of Things (IoT): A Performance Evaluation Based on Scientometric Tools. Inf. Dev. 2023, 02666669221151160. [Google Scholar] [CrossRef]
  36. Xu, M.; Nie, X.; Li, H.; Cheng, J.C.P.; Mei, Z. Smart Construction Sites: A Promising Approach to Improving on-Site HSE Management Performance. J. Build. Eng. 2022, 49, 104007. [Google Scholar] [CrossRef]
  37. Maier, D. Building Materials Made of Wood Waste a Solution to Achieve the Sustainable Development Goals. Materials 2021, 14, 7638. [Google Scholar] [CrossRef]
  38. Abdel-Qader, I.; Abudayyeh, O.; Kelly, M.E. Analysis of Edge-Detection Techniques for Crack Identification in Bridges. J. Comput. Civ. Eng. 2003, 17, 255–263. [Google Scholar] [CrossRef] [Green Version]
  39. Clark, M.R.; Mccann, D.M.; Forde, M.C. Application of Infrared Thermography to the Non-Destructive Testing of Concrete and Masonry Bridges. NDTE Int. 2003, 365, 265–275. [Google Scholar] [CrossRef]
  40. Dorafshan, S.; Thomas, R.J.; Maguire, M. Comparison of Deep Convolutional Neural Networks and Edge Detectors for Image-Based Crack Detection in Concrete. Constr. Build Mater. 2018, 186, 1031–1045. [Google Scholar] [CrossRef]
  41. Prasanna, P.; Dana, K.J.; Gucunski, N.; Basily, B.B.; La, H.M.; Lim, R.S.; Parvardeh, H. Automated Crack Detection on Concrete Bridges. IEEE Trans. Autom. Sci. Eng. 2016, 13, 591–599. [Google Scholar] [CrossRef]
  42. Adhikari, R.S.; Moselhi, O.; Bagchi, A. Image-Based Retrieval of Concrete Crack Properties for Bridge Inspection. Autom. Constr. 2014, 39, 180–194. [Google Scholar] [CrossRef]
  43. Hutchinson, T.C.; Chen, Z. Improved Image Analysis for Evaluating Concrete Damage. J. Comput. Civ. Eng. 2006, 20, 210–216. [Google Scholar] [CrossRef]
  44. Omar, T.; Nehdi, M.L. Remote Sensing of Concrete Bridge Decks Using Unmanned Aerial Vehicle Infrared Thermography. Autom. Constr. 2017, 83, 360–371. [Google Scholar] [CrossRef]
  45. Elsener, B. Macrocell Corrosion of Steel in Concrete-Implications for Corrosion Monitoring. Cem. Concr. Compos. 2002, 24, 65–72. [Google Scholar] [CrossRef]
  46. Alani, A.M.; Aboutalebi, M.; Kilic, G. Applications of Ground Penetrating Radar (GPR) in Bridge Deck Monitoring and Assessment. J. Appl. Geophys. 2013, 97, 45–54. [Google Scholar] [CrossRef]
  47. Cheng, C.; Sansalone, M. The Impact-Echo Response of Concrete Plates Containing Delaminations: Numerical, Experimental and Field Studies. Mater. Struct. 1993, 26, 274–285. [Google Scholar] [CrossRef]
  48. Dharmani, P.; Das, S.; Prashar, S. A Bibliometric Analysis of Creative Industries: Current Trends and Future Directions. J. Bus Res. 2021, 135, 252–267. [Google Scholar] [CrossRef]
  49. Awan, W.A.; Abbas, A. Mapping the Quantity, Quality and Structural Indicators of Asian (48 Countries and 3 Territories) Research Productivity on Cloud Computing. Libr. Hi Tech. 2022, 1–24. [Google Scholar] [CrossRef]
  50. Batra, S.; Saini, M.; Yadav, M.; Aggarwal, V. Mapping the Intellectual Structure and Demystifying the Research Trend of Cross Listing: A Bibliometric Analysis. Manag. Financ. 2022, 1–25. [Google Scholar] [CrossRef]
  51. Chun-Hao, C.; Jian-Min, Y. A Bibliometric Study of Financial Risk Literature: A Historic Approach. Appl. Econ. 2012, 44, 2827–2839. [Google Scholar] [CrossRef]
  52. Bicen, S.; Celik, M. A Bibliometric Review on Maritime Inspection Analysis: Current and Future Insights. Proc. Inst. Mech. Eng. J. Eng. Marit. Environ. 2022, 14750902221119341. [Google Scholar] [CrossRef]
  53. Lü, L.; Zhou, T.; Zhang, Q.M.; Stanley, H.E. The H-Index of a Network Node and Its Relation to Degree and Coreness. Nat. Commun. 2016, 7, 10168. [Google Scholar] [CrossRef] [Green Version]
  54. Ayaz, S.; Afzal, M.T. Identification of Conversion Factor for Completing-h Index for the Field of Mathematics. Scientometrics 2016, 109, 1511–1524. [Google Scholar] [CrossRef]
  55. Ding, J.; Liu, C.; Kandonga, G.A. Exploring the Limitations of the H-Index and h-Type Indexes in Measuring the Research Performance of Authors. Scientometrics 2020, 122, 1303–1322. [Google Scholar] [CrossRef]
  56. Helal, M.A.; Anderson, N.; Wei, Y.; Thompson, M. A Review of Biomass-to-Bioenergy Supply Chain Research Using Bibliometric Analysis and Visualization. Energies 2023, 16, 1187. [Google Scholar] [CrossRef]
  57. Siccardi, S.; Villa, V. Trends in Adopting BIM, IoT and DT for Facility Management: A Scientometric Analysis and Keyword Co-Occurrence Network Review. Buildings 2023, 13, 15. [Google Scholar] [CrossRef]
  58. Lin, S.; Meng, D.; Choi, H.; Shams, S.; Azari, H. Laboratory Assessment of Nine Methods for Nondestructive Evaluation of Concrete Bridge Decks with Overlays. Constr. Build Mater. 2018, 188, 966–982. [Google Scholar] [CrossRef]
  59. Moselhi, O.; Ahmed, M.; Bhowmick, A. Multisensor Data Fusion for Bridge Condition Assessment. J. Perform. Constr. Facil. 2017, 31, 04017008. [Google Scholar] [CrossRef]
  60. Kim, J.; Gucunski, N.; Duong, T.H.; Dinh, K. Three-Dimensional Visualization and Presentation of Bridge Deck Condition Based on Multiple NDE Data. J. Infrastruct. Syst. 2017, 23, B4016012. [Google Scholar] [CrossRef]
  61. La, H.M.; Gucunski, N.; Dana, K.; Kee, S.-H. Development of An Autonomous Bridge Deck Inspection Robotic System. J. Field Robot 2017, 34, 1489–1504. [Google Scholar] [CrossRef] [Green Version]
  62. La, H.M.; Gucunski, N.; Kee, S.H.; van Nguyen, L. Data Analysis and Visualization for the Bridge Deck Inspection and Evaluation Robotic System. Vis. Eng. 2015, 3, 1–16. [Google Scholar] [CrossRef]
  63. Kilic, G.; Unluturk, M.S. Performance Evaluation of the Neural Networks for Moisture Detection Using GPR. Nondestruct. Test. Eval. 2014, 29, 283–296. [Google Scholar] [CrossRef]
  64. Yehia, S.; Qaddoumi, N.; Farrag, S.; Hamzeh, L. Investigation of Concrete Mix Variations and Environmental Conditions on Defect Detection Ability Using GPR. NDT E Int. 2014, 65, 35–46. [Google Scholar] [CrossRef]
  65. Kilic, G.; Unluturk, M.S. Corroboration of NDT and deconvolution neural networks for pedestrian bridge health assessment. Nondestruct. Test. Eval. 2015, 30, 89–103. [Google Scholar] [CrossRef]
  66. Gucunski, N.; Maher, A.; Ghasemi, H. Condition Assessment of Concrete Bridge Decks Using a Fully Autonomous Robotic NDE Platform. Bridge Struct. 2013, 9, 123–130. [Google Scholar] [CrossRef]
  67. Mizoguchi, T.; Koda, Y.; Iwaki, I.; Wakabayashi, H.; Kobayashi, Y.; Shirai, K.; Hara, Y.; Lee, H.S. Quantitative Scaling Evaluation of Concrete Structures Based on Terrestrial Laser Scanning. Autom. Constr. 2013, 35, 263–274. [Google Scholar] [CrossRef]
  68. Kee, S.-H.; Oh, T.; Popovics, J.S.; Arndt, R.W.; Zhu, J. Nondestructive Bridge Deck Testing with Air-Coupled Impact-Echo and Infrared Thermography. J. Bridge Eng. 2012, 17, 928–939. [Google Scholar] [CrossRef]
  69. Huston, D.; Cui, J.; Burns, D.; Hurley, D. Concrete Bridge Deck Condition Assessment with Automated Multisensor Techniques. Struct. Infrastruct. Eng. 2011, 7, 613–623. [Google Scholar] [CrossRef]
  70. Wang, Z.W.; Zhou, M.; Slabaugh, G.G.; Zhai, J.; Fang, T. Automatic Detection of Bridge Deck Condition from Ground Penetrating Radar Images. IEEE Trans. Autom. Sci. Eng. 2011, 8, 633–640. [Google Scholar] [CrossRef]
  71. Hing, C.L.C.; Halabe, U.B. Nondestructive Testing of GFRP Bridge Decks Using Ground Penetrating Radar and Infrared Thermography. J. Bridge Eng. 2010, 15, 391–398. [Google Scholar] [CrossRef]
  72. Wang, R.; Zhang, J.; Liu, X. A Most-Unfavorable-Condition Method for Bridge-Damage Detection and Analysis Using Psp-Insar. Remote Sens. 2022, 14, 137. [Google Scholar] [CrossRef]
  73. Wang, W.; Su, C. Automatic Classification of Reinforced Concrete Bridge Defects Using the Hybrid Network. Arab. J. Sci. Eng. 2022, 47, 5187–5197. [Google Scholar] [CrossRef]
  74. Mohammed Abdelkader, E.; Moselhi, O.; Marzouk, M.; Zayed, T. A Grey Wolf Optimization-Based Method for Segmentation and Evaluation of Scaling in Reinforced Concrete Bridges. Int. J. Inf. Technol. Decis. Mak. 2021, 20, 1561–1614. [Google Scholar] [CrossRef]
  75. Robuschi, S.; Tengattini, A.; Dijkstra, J.; Fernandez, I.; Lundgren, K. A Closer Look at Corrosion of Steel Reinforcement Bars in Concrete Using 3D Neutron and X-Ray Computed Tomography. Cem. Concr. Res. 2021, 144, 106439. [Google Scholar] [CrossRef]
  76. Pozzer, S.; Dalla Rosa, F.; Pravia, Z.M.C.; Rezazadeh Azar, E.; Maldague, X. Long-Term Numerical Analysis of Subsurface Delamination Detection in Concrete Slabs via Infrared Thermography. Appl. Sci. 2021, 11, 4323. [Google Scholar] [CrossRef]
  77. Yang, L.; Li, B.; Li, W.; Brand, H.; Jiang, B.; Xiao, J. Concrete Defects Inspection and 3D Mapping Using CityFlyer Quadrotor Robot. IEEE/CAA J. Autom. Sin. 2020, 7, 991–1002. [Google Scholar] [CrossRef]
  78. Zhang, C.; Chang, C.; Jamshidi, M. Concrete Bridge Surface Damage Detection Using a Single-Stage Detector. Comput.-Aided Civ. Infrastruct. Eng. 2020, 35, 389–409. [Google Scholar] [CrossRef]
  79. Alsharqawi, M.; Zayed, T.; Shami, A. Ground Penetrating Radar-Based Deterioration Assessment of RC Bridge Decks. Constr. Innov. 2020, 20, 1–17. [Google Scholar] [CrossRef]
  80. Robison, T.W.; Barnes, C.L.; Tinkey, Y.; Tanner, J.E. Evaluating Concrete Damage in Bridge Decks with and without Overlays Using Nondestructive Testing Procedures. J. Test Eval. 2020, 48, 352–367. [Google Scholar] [CrossRef]
  81. Liu, Y.F.; Nie, X.; Fan, J.S.; Liu, X.G. Image-Based Crack Assessment of Bridge Piers Using Unmanned Aerial Vehicles and Three-Dimensional Scene Reconstruction. Comput.-Aided. Civ. Infrastruct. Eng. 2020, 35, 511–529. [Google Scholar] [CrossRef]
  82. Morris, I.; Abdel-Jaber, H.; Glisic, B. Quantitative Attribute Analyses with Ground Penetrating Radar for Infrastructure Assessments and Structural Health Monitoring. Sensors 2019, 19, 1637. [Google Scholar] [CrossRef] [Green Version]
  83. Janků, M.; Cikrle, P.; Grošek, J.; Anton, O.; Stryk, J. Comparison of Infrared Thermography, Ground-Penetrating Radar and Ultrasonic Pulse Echo for Detecting Delaminations in Concrete Bridges. Constr. Build Mater. 2019, 225, 1098–1111. [Google Scholar] [CrossRef]
  84. Różański, L.; Ziopaja, K. Applicability Analysis of IR Thermography and Discrete Wavelet Transform for Technical Conditions Assessment of Bridge Elements. Quant Infrared. J. 2019, 16, 87–110. [Google Scholar] [CrossRef]
  85. Hüthwohl, P.; Brilakis, I. Detecting Healthy Concrete Surfaces. Adv. Eng. Inform. 2018, 37, 150–162. [Google Scholar] [CrossRef]
  86. Xiang, C.; Wang, W.; Deng, L.; Shi, P.; Kong, X. Crack Detection Algorithm for Concrete Structures Based on Super-Resolution Reconstruction and Segmentation Network. Autom. Constr. 2022, 140, 104346. [Google Scholar] [CrossRef]
  87. Miao, P.; Srimahachota, T. Cost-Effective System for Detection and Quantification of Concrete Surface Cracks by Combination of Convolutional Neural Network and Image Processing Techniques. Constr. Build Mater. 2021, 293, 123549. [Google Scholar] [CrossRef]
  88. Guo, J.; Wang, Q.; Li, Y. Semi-Supervised Learning Based on Convolutional Neural Network and Uncertainty Filter for Façade Defects Classification. Comput.-Aided Civ. Infrastruct. Eng. 2021, 36, 302–317. [Google Scholar] [CrossRef]
  89. Ding, J.; Li, X.; Gudivada, V. Augmentation and Evaluation of Training Data for Deep Learning. In Proceedings of the 2017 IEEE International Conference on Big Data (BIGDATA), Boston, MA, USA, 11–14 December 2017; pp. 1–9. [Google Scholar]
  90. Abdelkhalek, S. Managing the Inspection Process of Concrete Bridge Decks; The Hong Kong Polytechnic University: Kowloon, Hong Kong, 2022. [Google Scholar]
  91. Abouhamad, M.; Dawood, T.; Jabri, A.; Alsharqawi, M.; Zayed, T. Corrosiveness Mapping of Bridge Decks Using Image-Based Analysis of GPR Data. Autom. Constr. 2017, 80, 104–117. [Google Scholar] [CrossRef]
  92. Dinh, K.; Zayed, T.M.; Romero, F.; Tarussov, A. Method for Analyzing Time-Series GPR Data of Concrete Bridge Decks. J. Bridge Eng. 2015, 20, 1–8. [Google Scholar] [CrossRef]
  93. Maser, K.; Martino, N.; Doughty, J.; Birken, R. Understanding and Detecting Bridge Deck Deterioration with Ground-Penetrating Radar. Transp. Res. Rec. 2012, 2313, 116–123. [Google Scholar] [CrossRef]
  94. Oh, T.; Kee, S.-H.; Arndt, R.W.; Popovics, J.S.; Zhu, J. Comparison of NDT Methods for Assessment of a Concrete Bridge Deck. J. Eng. Mech. 2013, 139, 305–314. [Google Scholar] [CrossRef]
  95. Azari, H.; Nazarian, S.; Yuan, D. Assessing Sensitivity of Impact Echo and Ultrasonic Surface Waves Methods for Nondestructive Evaluation of Concrete Structures. Comput. Chem. Eng. 2014, 71, 384–391. [Google Scholar] [CrossRef]
  96. Tomita, K.; Chew, M.Y.L. A Review of Infrared Thermography for Delamination Detection on Infrastructures and Buildings. Sensors 2022, 22, 423. [Google Scholar] [CrossRef]
  97. Barnes, C.L.; Trottier, J.-F. Ground-Penetrating Radar for Network-Level Concrete Deck Repair Management. J. Transp. Eng. 2000, 126, 257–262. [Google Scholar] [CrossRef]
  98. Abudayyeh, O.; Yehia, S.; Abdel-Qader, I.; Zalt, A. GPR Imaging for Bridge Deck Condition Assessment. Bridge Struct. 2008, 4, 75–86. [Google Scholar] [CrossRef]
  99. Tarussov, A.; Vandry, M.; de La Haza, A. Condition Assessment of Concrete Structures Using a New Analysis Method: Ground-Penetrating Radar Computer-Assisted Visual Interpretation. Constr. Build Mater. 2013, 38, 1246–1254. [Google Scholar] [CrossRef]
  100. Alsharqawi, M.; Zayed, T.; Abu Dabous, S. Integrated Condition-Based Rating Model for Sustainable Bridge Management. J. Perform. Constr. Facil. 2020, 34, 04020091. [Google Scholar] [CrossRef]
  101. Omar, T.; Nehdi, M.L.; Zayed, T. Rational Condition Assessment of RC Bridge Decks Subjected to Corrosion-Induced Delamination. J. Mater. Civ. Eng. 2018, 30, 04017259. [Google Scholar] [CrossRef]
  102. Alsharqawi, M.; Zayed, T.; Abu Dabous, S. Integrated Condition Rating and Forecasting Method for Bridge Decks Using Visual Inspection and Ground Penetrating Radar. Autom. Constr. 2018, 89, 135–145. [Google Scholar] [CrossRef]
  103. Omar, T.; Nehdi, M.L.; Zayed, T. Integrated Condition Rating Model for Reinforced Concrete Bridge Decks. J. Perform. Constr. Facil. 2017, 31, 04017090. [Google Scholar] [CrossRef]
  104. Dinh, K.; Zayed, T.; Moufti, S.; Shami, A.; Jabri, A.; Abouhamad, M.; Dawood, T. Clustering-Based Threshold Model for Condition Assessment of Concrete Bridge Decks with Ground-Penetrating Radar. Transp. Res. Rec. 2015, 2522, 81–89. [Google Scholar] [CrossRef]
  105. Dinh, K.; Zayed, T. GPR-Based Fuzzy Model for Bridge Deck Corrosiveness Index. J. Perform. Constr. Facil. 2016, 30, 04015069. [Google Scholar] [CrossRef]
  106. Ata, M.; Abouhamad, M.; Hassanien Serror, M.; Marzouk, M. Data Acquisition and Structural Analysis for Bridge Deck Condition Assessment Using Ground Penetration Radar. J. Perform. Constr. Facil. 2021, 35, 04021064. [Google Scholar] [CrossRef]
  107. Mohammed Abdelkader, E.; Marzouk, M.; Zayed, T. An Optimization-Based Methodology for the Definition of Amplitude Thresholds of the Ground Penetrating Radar. Soft Comput. 2019, 23, 12063–12086. [Google Scholar] [CrossRef]
  108. Martino, N.; Maser, K.; Birken, R.; Wang, M. Determining Ground Penetrating Radar Amplitude Thresholds for the Corrosion State of Reinforced Concrete Bridge Decks. J. Env. Eng. Geophys. 2014, 19, 175–181. [Google Scholar] [CrossRef]
  109. Barnes, C.L.; Trottier, J.F.; Forgeron, D. Improved Concrete Bridge Deck Evaluation Using GPR by Accounting for Signal Depth-Amplitude Effects. NDT E Int. 2008, 41, 427–433. [Google Scholar] [CrossRef]
  110. Romero, F.A.; Barnes, C.L.; Azari, H.; Nazarian, S.; Rascoe, C.D. Validation of Benefits of Automated Depth Correction Method Improving Accuracy of Ground-Penetrating Radar Deck Deterioration Maps. Transp. Res. Rec. 2015, 2522, 100–109. [Google Scholar] [CrossRef]
  111. Dinh, K.; Gucunski, N.; Kim, J.; Duong, T.H. Understanding Depth-Amplitude Effects in Assessment of GPR Data from Concrete Bridge Decks. NDT E Int. 2016, 83, 48–58. [Google Scholar] [CrossRef]
  112. Rahman, M.A.; Zayed, T.; Bagchi, A. Deterioration Mapping of RC Bridge Elements Based on Automated Analysis of GPR Images. Remote Sens. 2022, 14, 1131. [Google Scholar] [CrossRef]
  113. Liu, H.; Zhong, J.; Ding, F.; Meng, X.; Liu, C.; Cui, J. Detection of Early-Stage Rebar Corrosion Using a Polarimetric Ground Penetrating Radar System. Constr. Build Mater. 2022, 317, 125768. [Google Scholar] [CrossRef]
  114. Dinh, K.; Gucunski, N.; Zayed, T. Automated Visualization of Concrete Bridge Deck Condition from GPR Data. NDT E Int. 2019, 102, 120–128. [Google Scholar] [CrossRef]
  115. Ma, X.; Liu, H.; Wang, M.L.; Birken, R. Automatic Detection of Steel Rebar in Bridge Decks from Ground Penetrating Radar Data. J. Appl. Geophys. 2018, 158, 93–102. [Google Scholar] [CrossRef]
  116. Mohamadi, S.; Lattanzi, D.; Azari, H. Fusion and Visualization of Bridge Deck Nondestructive Evaluation Data via Machine Learning. Front Mater. 2020, 7, 576918. [Google Scholar] [CrossRef]
  117. Elsener, B. Half-Cell Potential Mapping to Assess Repair Work on RC Structures. Constr. Build Mater. 2001, 15, 133139. [Google Scholar] [CrossRef]
  118. Qian, S.; Cusson, D.; Chagnon, N. Evaluation of Reinforcement Corrosion in Repaired Concrete Bridge Slabs-A Case Study. Corrosion 2003, 59, 457–468. [Google Scholar] [CrossRef] [Green Version]
  119. Kim, K.S.; Fratta, D.; Pincheira, J.A. Nondestructive Evaluation of Fiberglass Wrapped Concrete Bridge Columns. J. Nondestr. Eval. 2011, 30, 9–19. [Google Scholar] [CrossRef]
  120. Soleymani, H.R.; Ismail, M.E. Comparing Corrosion Measurement Methods to Assess the Corrosion Activity of Laboratory OPC and HPC Concrete Specimens. Cem. Concr. Res. 2004, 34, 2037–2044. [Google Scholar] [CrossRef]
  121. Bourreau, L.; Gaillet, L.; Bouteiller, V.; Schoefs, F.; Thauvin, B.; Schneider, J.; Naar, S. Spatial Identification of Exposure Zones of Concrete Structures Exposed to a Marine Environment with Respect to Reinforcement Corrosion. Struct. Infrastruct. Eng. 2020, 16, 346–354. [Google Scholar] [CrossRef]
  122. Kamde, D.K.; Kessler, S.; Pillai, R.G. Condition Assessment of Reinforced Concrete Systems with Fusion Bonded Epoxy Coated Rebars. Corrosion 2021, 77, 1332–1343. [Google Scholar] [CrossRef] [PubMed]
  123. Pailes, B.M.; Gucunski, N. Understanding Multi-Modal Non-Destructive Testing Data Through the Evaluation of Twelve Deteriorating Reinforced Concrete Bridge Decks. J. Nondestr. Eval. 2015, 34, 1–14. [Google Scholar] [CrossRef]
  124. Gucunski, N.; Basily, B.; Kim, J.; Yi, J.; Duong, T.; Dinh, K.; Kee, S.H.; Maher, A. RABIT: Implementation, Performance Validation and Integration with Other Robotic Platforms for Improved Management of Bridge Decks. Int. J. Intell. Robot Appl. 2017, 1, 271–286. [Google Scholar] [CrossRef]
  125. Gucunski, N.; Pailes, B.; Kim, J.; Azari, H.; Dinh, K. Capture and Quantification of Deterioration Progression in Concrete Bridge Decks through Periodical NDE Surveys. J. Infrastruct. Syst. 2017, 23, B4016005. [Google Scholar] [CrossRef]
  126. Kilic, G.; Caner, A. Augmented Reality for Bridge Condition Assessment Using Advanced Non-Destructive Techniques. Struct. Infrastruct. Eng. 2021, 17, 977–989. [Google Scholar] [CrossRef]
  127. Frigerio, T.; Mariscotti, M.A.J.; Ruffolo, M.; Thieberger, P. Development and Application of Computed Tomography in the Inspection of Reinforced Concrete. Insight Non-Destr. Test. Cond. Monit. 2004, 46, 742–745. [Google Scholar] [CrossRef] [Green Version]
  128. Fernandes, B.; Titus, M.; Douglas, K.N.; Nims, K.; Ghorbanpoor, A.; Devabhaktuni, V. Field Test of Magnetic Methods for Corrosion Detection in Prestressing Strands in Adjacent Box-Beam Bridges. J. Bridge Eng. 2012, 17, 984–988. [Google Scholar] [CrossRef]
  129. Zhao, X.; Xiong, J. Effectively Analysis of Concrete Bridge Deck Corrosion Using Electrochemical Impedance Spectroscopy. Int. J. Electrochem. Sci. 2016, 11, 5702–5709. [Google Scholar] [CrossRef] [Green Version]
  130. Zhu, H.; Liu, X.; Jia, C.; Du, B.; Liu, S.; Qian, Y. An Experimental Study on the Corrosion Amount Using a Statistical Analysis. Corros. Eng. Sci. Technol. 2018, 53, 26–35. [Google Scholar] [CrossRef]
  131. Oh, C.K.; Joh, C.; Lee, J.W.; Park, K.Y. Corrosion Detection in PSC Bridge Tendons Using Kernel PCA Denoising of Measured MFL Signals. Sensors 2020, 20, 5984. [Google Scholar] [CrossRef]
  132. Mosharafi, M.; Mahbaz, S.B.; Dusseault, M.B. Bridge Deck Assessment Using Infrastructure Corrosion Assessment Magnetic Method (ICAMMTM) Technology, a Case Study of a Culvert in Markham City, Ontario, Canada. NDT E Int. 2020, 116, 102356. [Google Scholar] [CrossRef]
  133. Henderson, M.E.; Dion, G.N.; Daniel Costley, R. Acoustic Inspection of Concrete Bridge Decks. Nondestruct. Eval. Bridge Highw. III 1999, 3587, 219–227. [Google Scholar]
  134. Scott, M.; Rezaizadeh, A.; Delahaza, A.; Santos, C.G.; Moore, M.; Graybeal, B.; Washer, G. A Comparison of Nondestructive Evaluation Methods for Bridge Deck Assessment. NDT E Int. 2003, 36, 245–255. [Google Scholar] [CrossRef]
  135. Yehia, S.; Abudayyeh, O.; Abdel-Qader, I.; Zalt, A. Ground-Penetrating Radar, Chain Drag, and Ground Truth: Correlation of Bridge Deck Assessment Data. Transp. Res. Rec. 2008, 2044, 39–50. [Google Scholar] [CrossRef]
  136. Guthrie, W.S.; Larsen, J.L.; Baxter, J.S.; Mazzeo, B.A. Automated Air-Coupled Impact-Echo Testing of a Concrete Bridge Deck from a Continuously Moving Platform. J. Nondestr. Eval. 2019, 38, 32. [Google Scholar] [CrossRef]
  137. Shamsudin, A.M.; Senin, S.F.; Hamid, R.; Yusuf, K. Concrete Delaminations Location and Its Severity Detection by Visual Inspection and Ground Penetrating Radar. J. Eng. Sci. Technol. 2015, 10, 1–12. [Google Scholar]
  138. Clem, D.J.; Schumacher, T.; Deshon, J.P. A Consistent Approach for Processing and Interpretation of Data from Concrete Bridge Members Collected with a Hand-Held GPR Device. Constr. Build Mater. 2015, 86, 140–148. [Google Scholar] [CrossRef]
  139. Dinh, K.; Gucunski, N. Factors Affecting the Detectability of Concrete Delamination in GPR Images. Constr. Build Mater. 2021, 274, 121837. [Google Scholar] [CrossRef]
  140. Yehia, S.; Abudayyeh, O.; Nabulsi, S.; Abdelqader, I. Detection of Common Defects in Concrete Bridge Decks Using Nondestructive Evaluation Techniques. J. Bridge Eng. 2007, 12, 215–225. [Google Scholar] [CrossRef]
  141. Sultan, A.A.; Washer, G.A. Reliability Analysis of Ground-Penetrating Radar for the Detection of Subsurface Delamination. J. Bridge Eng. 2018, 23, 04017131. [Google Scholar] [CrossRef]
  142. Zhang, G.; Harichandran, R.S.; Ramuhalli, P. An Automatic Impact-Based Delamination Detection System for Concrete Bridge Decks. NDT E Int. 2012, 45, 120–127. [Google Scholar] [CrossRef]
  143. Hendricks, L.J.; Baxter, J.S.; Chou, Y.; Thomas, M.; Boekweg, E.; Guthrie, W.S.; Mazzeo, B.A. High-Speed Acoustic Impact-Echo Sounding of Concrete Bridge Decks. J. Nondestr. Eval. 2020, 39, 39–58. [Google Scholar] [CrossRef]
  144. Sengupta, A.; Ilgin Guler, S.; Shokouhi, P. Interpreting Impact Echo Data to Predict Condition Rating of Concrete Bridge Decks: A Machine-Learning Approach. J. Bridge Eng. 2021, 26, 04021044. [Google Scholar] [CrossRef]
  145. Dorafshan, S.; Azari, H. Deep Learning Models for Bridge Deck Evaluation Using Impact Echo. Constr. Build Mater. 2020, 263, 120109. [Google Scholar] [CrossRef]
  146. Dorafshan, S.; Azari, H. Evaluation of Bridge Decks with Overlays Using Impact Echo, a Deep Learning Approach. Autom. Constr. 2020, 113, 103133. [Google Scholar] [CrossRef]
  147. Clark, M.R.; Mccann, D.M.; Forde, M.C. Infrared Thermographic Analysis of Bridges Case Study. Transp. Res. Rec. 2002, 1813, 242–246. [Google Scholar] [CrossRef]
  148. Halabe, U.B.; Vasudevan, A.; Klinkhachorn, P.; Gangarao, H.V.S. Detection of Subsurface Defects in Fiber Reinforced Polymer Composite Bridge Decks Using Digital Infrared Thermography. Nondestruct. Test Eval. 2007, 22, 155–175. [Google Scholar] [CrossRef]
  149. Washer, G.; Fenwick, R.; Nelson, S.; Rumbayan, R. Guidelines for Thermographic Inspection of Concrete Bridge Components in Shaded Conditions. Transp. Res. Rec. 2013, 2360, 13–20. [Google Scholar] [CrossRef]
  150. Sultan, A.A.; Washer, G. A Pixel-by-Pixel Reliability Analysis of Infrared Thermography (IRT) for the Detection of Subsurface Delamination. NDT E Int. 2017, 92, 177–186. [Google Scholar] [CrossRef]
  151. Omar, T.; Nehdi, M.L.; Zayed, T. Infrared Thermography Model for Automated Detection of Delamination in RC Bridge Decks. Constr. Build Mater. 2018, 168, 313–327. [Google Scholar] [CrossRef]
  152. Cheng, C.; Shang, Z.; Shen, Z. Automatic Delamination Segmentation for Bridge Deck Based on Encoder-Decoder Deep Learning through UAV-Based Thermography. NDT E Int. 2020, 116, 102341. [Google Scholar] [CrossRef]
  153. Cheng, C.; Shen, Z. The Application of Gray-Scale Level-Set Method in Segmentation of Concrete Deck Delamination Using Infrared Images. Constr. Build Mater. 2020, 240, 117974. [Google Scholar] [CrossRef]
  154. Pozzer, S.; Pravia, Z.M.C.; Rezazadeh Azar, E.; Dalla Rosa, F. Statistical Analysis of Favorable Conditions for Thermographic Inspection of Concrete Slabs. J. Civ. Struct. Health Monit. 2020, 10, 609–626. [Google Scholar] [CrossRef]
  155. Maser, K.R. Condition Assessment of Transportation Infrastructure Using Ground-Penetrating Radar. J. Infrastruct. Syst. 1996, 2, 94–101. [Google Scholar] [CrossRef]
  156. Martin, J.; Broughton, K.J.; Giannopolous, A.; Hardy, A.; Forde, M.C. Ultrasonic Tomography of Grouted Duct Post-Tensioned Reinforced Concrete Bridge Beams. NDT E Int. 2001, 34, 107–113. [Google Scholar] [CrossRef]
  157. Iyer, S.; Schokker, A.J.; Sinha, S.K. Ultrasonic C-Scan Imaging: Preliminary Evaluation for Corrosion and Void Detection in Posttensioned Tendons. Transp. Res. Rec. 2003, 1827, 44–52. [Google Scholar] [CrossRef]
  158. Tinkey, Y.; Olson, L.D. Sensitivity Studies of Grout Defects in Posttensioned Bridge Ducts Using Impact Echo Scanning Method. Transp. Res. Rec. 2007, 2028, 154–162. [Google Scholar] [CrossRef]
  159. Belli, K.; Wadia-Fascetti, S.; Rappaport, C. Model Based Evaluation of Bridge Decks Using Ground Penetrating Radar. Comput.-Aided. Civ. Infrastruct. Eng. 2008, 23, 3–16. [Google Scholar] [CrossRef]
  160. Oh, B.D.; Choi, H.; Song, H.J.; Kim, J.D.; Park, C.Y.; Kim, Y.S. Detection of Defect inside Duct Using Recurrent Neural Networks. Sens. Mater. 2020, 32, 171–182. [Google Scholar] [CrossRef] [Green Version]
  161. Lee, D.I.; Choi, H.; Kim, J.D.; Park, C.Y.; Kim, Y.S. Utilization of Unsupervised Machine Learning for Detection of Duct Voids inside PSC Box Girder Bridges. Appl. Sci. 2022, 12, 1270. [Google Scholar] [CrossRef]
  162. Oh, B.D.; Choi, H.; Kim, Y.J.; Chin, W.J.; Kim, Y.S. Nondestructive Evaluation of Ducts in Prestressed Concrete Bridges Using Heterogeneous Neural Networks and Impact-Echo. Sens. Mater. 2022, 34, 121–133. [Google Scholar] [CrossRef]
  163. Pedram, M.; Taylor, S.; Robinson, D.; Hamill, G.; O’Brien, E.; Uddin, N. Experimental Investigation of Subsurface Defect Detection in Concretes by Infrared Thermography and Convection Heat Exchange. J. Civ. Struct. Health Monit. 2022, 12, 1355–1373. [Google Scholar] [CrossRef]
  164. Gassman, S.L.; Tawhed, W.F. Nondestructive Assessment of Damage in Concrete Bridge Decks. J. Perform. Constr. Facil. 2004, 18, 220–231. [Google Scholar] [CrossRef]
  165. Abdel-Qader, I.; Yohali, S.; Abudayyeh, O.; Yehia, S. Segmentation of Thermal Images for Non-Destructive Evaluation of Bridge Decks. NDT E Int. 2008, 41, 395–405. [Google Scholar] [CrossRef]
  166. Abdel-Qader, I.; Krause, V.; Abu-Amara, F.; Abudayyeh, O. Comparative Study of Deconvolution Algorithms for GPR Bridge Deck Imaging. WSEAS Trans. Signal Process. 2014, 10, 9–20. [Google Scholar]
  167. Coleman, Z.W.; Schindler, A.K. Investigation of Ground-Penetrating Radar, Impact Echo, and Infrared Thermography Methods to Detect Defects in Concrete Bridge Decks. Transp. Res. Rec. 2022, 03611981221101027. [Google Scholar] [CrossRef]
  168. Sun, H.; Zhu, J.; Ham, S. Automated Acoustic Scanning System for Delamination Detection in Concrete Bridge Decks. J. Bridge Eng. 2018, 23, 04018027. [Google Scholar] [CrossRef]
  169. Alani, A.; Aboutalebi, M.; Kilic, G. Integrated Health Assessment Strategy Using NDT for Reinforced Concrete Bridges. NDT E Int. 2014, 61, 80–94. [Google Scholar] [CrossRef]
  170. Topczewski, Ł. Guidelines for the Application of Ground Penetrating Radar (GPR) to Inspection of Concrete Bridges-Reflection Mode. Roads Bridge Drog. Mosty 2012, 11, 329–343. [Google Scholar] [CrossRef]
  171. Sbartaï, Z.M.; Laurens, S.; Balayssac, J.P.; Ballivy, G.; Arliguie, G. Effect of Concrete Moisture on Radar Signal Amplitude. ACI Mater. J. 2006, 103, 419. [Google Scholar]
  172. Hugenschmidt, J.; Loser, R. Detection of Chlorides and Moisture in Concrete Structures with Ground Penetrating Radar. Mater. Struct. 2008, 41, 785–792. [Google Scholar] [CrossRef] [Green Version]
  173. Kilic, G. GPR Raw-Data Order Statistic Filtering and Split-Spectrum Processing to Detect Moisture. Remote Sens. 2014, 6, 4687–4704. [Google Scholar] [CrossRef] [Green Version]
  174. Fitch, M.G.; Abdulshafi, O.A. Field and Laboratory Evaluation of Silica Fume Modified Concrete Bridge Deck Overlays in Ohio. Transp. Res. Rec. 1998, 1610, 20–27. [Google Scholar] [CrossRef]
  175. Rhim, H.C.; Woo, S.K.; Song, Y.C. Detection of Debonding in Concrete Members Retrofitted with FRP Using Electromagnetic and Ultrasonic Methods. Key Eng. Mater. 2006, 321–323, 390–393. [Google Scholar] [CrossRef]
  176. Ghosh, K.K.; Karbhari, V.M. Use of Infrared Thermography for Quantitative Non-Destructive Evaluation in FRP Strengthened Bridge Systems. Mater. Struct. 2011, 44, 169–185. [Google Scholar] [CrossRef]
  177. Crawford, K.C. NDT Evaluation of Long-Term Bond Durability of CFRP-Structural Systems Applied to RC Highway Bridges. Int. J. Adv. Struct. Eng. 2016, 8, 161–168. [Google Scholar] [CrossRef] [Green Version]
  178. Alemdar, Z.F.; Browning, J.A.; Olafsen, J. Photogrammetric Measurements of RC Bridge Column Deformations. Eng. Struct. 2011, 33, 2407–2415. [Google Scholar] [CrossRef]
  179. Hoppe, E.J.; Novali, F.; Rucci, A.; Fumagalli, A.; del Conte, S.; Falorni, G.; Toro, N. Deformation Monitoring of Posttensioned Bridges Using High-Resolution Satellite Remote Sensing. J. Bridge Eng. 2019, 24, 04019115. [Google Scholar] [CrossRef]
  180. Schlögl, M.; Dorninger, P.; Kwapisz, M.; Ralbovsky, M.; Spielhofer, R. Remote Sensing Techniques for Bridge Deformation Monitoring at Millimetric Scale: Investigating the Potential of Satellite Radar Interferometry, Airborne Laser Scanning and Ground-Based Mobile Laser Scanning. PFG J. Photogramm. Remote Sens. Geoinf. Sci. 2022, 90, 391–411. [Google Scholar] [CrossRef]
  181. Krause, H.-J.; Wolf, W.; Glaas, W.; Zimmermann, E.; Faley, M.I.; Sawade, G.; Mattheus, R.; Neudert, G.; Gampe, U.; Krieger, J. SQUID Array for Magnetic Inspection of Prestressed Concrete Bridges. Phys. Supercond. 2002, 368, 91–95. [Google Scholar] [CrossRef]
  182. Youn, S.G.; Cho, S.K.; Kim, E.K. Acoustic Emission Technique for Detection of Corrosion-Induced Wire Fracture. Key Eng. Mater. 2005, 297–300, 2040–2045. [Google Scholar] [CrossRef]
  183. Xu, X.J.; Zhang, X.N. Crack Detection of Reinforced Concrete Bridge Using Video Image. J. Cent. South Univ. 2013, 20, 2605–2613. [Google Scholar] [CrossRef]
  184. Dorafshan, S.; Thomas, R.J.; Maguire, M. Benchmarking Image Processing Algorithms for Unmanned Aerial System-Assisted Crack Detection in Concrete Structures. Infrastructures 2019, 4, 19. [Google Scholar] [CrossRef] [Green Version]
  185. Li, G.; He, S.; Ju, Y.; Du, K. Long-Distance Precision Inspection Method for Bridge Cracks with Image Processing. Autom. Constr. 2014, 41, 83–95. [Google Scholar] [CrossRef]
  186. Li, G.; He, S.; Du, K.; Liu, W.; Du, Q. Modified C-V Model Algorithm of Crack Extraction for Bridge Substructure. J. Traffic. Transp. Eng. 2012, 12, 9–16. [Google Scholar]
  187. Mohammed Abdelkader, E.; Moselhi, O.; Marzouk, M.; Zayed, T. A Multi-Objective Invasive Weed Optimization Method for Segmentation of Distress Images. Intell. Autom. Soft Comput. 2020, 26, 643–661. [Google Scholar] [CrossRef]
  188. Qiao, W.; Wu, X.; Sun, W.; Wu, Q. Research on Concrete Beam Crack Recognition Algorithm Based on Block Threshold Value Image Processing. SDHM Struct. Durab. Health Monit. 2021, 14, 355–374. [Google Scholar] [CrossRef]
  189. Pragalath, H.; Seshathiri, S.; Rathod, H.; Esakki, B.; Gupta, R. Deterioration Assessment of Infrastructure Using Fuzzy Logic and Image Processing Algorithm. J. Perform. Constr. Facil. 2018, 32, 04018009. [Google Scholar] [CrossRef]
  190. Dan, D.; Dan, Q. Automatic Recognition of Surface Cracks in Bridges Based on 2D-APES and Mobile Machine Vision. Measurement 2021, 168, 108429. [Google Scholar] [CrossRef]
  191. Lei, B.; Ren, Y.; Wang, N.; Huo, L.; Song, G. Design of a New Low-Cost Unmanned Aerial Vehicle and Vision-Based Concrete Crack Inspection Method. Struct. Health Monit. 2020, 19, 1871–1883. [Google Scholar] [CrossRef]
  192. Jia, X.; Huang, Y. Multi-Characteristic Parameter Classification Algorithm of Cracks on Bridge Substructures. J. Eng. Sci. Technol. Rev. 2020, 13, 107–118. [Google Scholar] [CrossRef]
  193. Dorafshan, S.; Thomas, R.J.; Maguire, M. SDNET2018: An Annotated Image Dataset for Non-Contact Concrete Crack Detection Using Deep Convolutional Neural Networks. Data Brief. 2018, 21, 1664–1668. [Google Scholar] [CrossRef]
  194. Sharma, N.; Dhir, R.; Rani, R. Crack Detection in Concrete Using Transfer Learning. Adv. Math. Sci. J. 2020, 9, 3895–3906. [Google Scholar] [CrossRef]
  195. Kim, I.H.; Jeon, H.; Baek, S.C.; Hong, W.H.; Jung, H.J. Application of Crack Identification Techniques for an Aging Concrete Bridge Inspection Using an Unmanned Aerial Vehicle. Sensors 2018, 18, 1881. [Google Scholar] [CrossRef] [PubMed] [Green Version]
  196. Deng, J.; Lu, Y.; Lee, V.C.S. Concrete Crack Detection with Handwriting Script Interferences Using Faster Region-Based Convolutional Neural Network. Comput.-Aided. Civ. Infrastruct. Eng. 2020, 35, 373–388. [Google Scholar] [CrossRef]
  197. Ayele, Y.Z.; Aliyari, M.; Griffths, D.; Droguett, E.L. Automatic Crack Segmentation for Uav-Assisted Bridge Inspection. Energies 2020, 13, 6250. [Google Scholar] [CrossRef]
  198. Zheng, M.; Lei, Z.; Zhang, K. Intelligent Detection of Building Cracks Based on Deep Learning. Image Vis. Comput. 2020, 103, 103987. [Google Scholar] [CrossRef]
  199. Zhang, J.; Qian, S.; Tan, C. Automated Bridge Surface Crack Detection and Segmentation Using Computer Vision-Based Deep Learning Model. Eng. Appl. Artif. Intell. 2022, 115, 105225. [Google Scholar] [CrossRef]
  200. Yu, L.; He, S.; Liu, X.; Jiang, S.; Xiang, S. Intelligent Crack Detection and Quantification in the Concrete Bridge: A Deep Learning-Assisted Image Processing Approach. Adv. Civ. Eng. 2022, 2022, 15. [Google Scholar] [CrossRef]
  201. Kun, J.; Zhenhai, Z.; Jiale, Y.; Jianwu, D. A Deep Learning-Based Method for Pixel-Level Crack Detection on Concrete Bridges. IET Image Process 2022, 16, 2609–2622. [Google Scholar] [CrossRef]
  202. Deng, J.; Lu, Y.; Lee, V.C.S. Imaging-Based Crack Detection on Concrete Surfaces Using You Only Look Once Network. Struct. Health Monit. 2021, 20, 484–499. [Google Scholar] [CrossRef]
  203. Jiang, W.; Liu, M.; Peng, Y.; Wu, L.; Wang, Y. HDCB-Net: A Neural Network with the Hybrid Dilated Convolution for Pixel-Level Crack Detection on Concrete Bridges. IEEE Trans. Ind. Inf. 2021, 17, 5485–5494. [Google Scholar] [CrossRef]
  204. Kim, H.; Sim, S.H.; Spencer, B.F. Automated Concrete Crack Evaluation Using Stereo Vision with Two Different Focal Lengths. Autom. Constr. 2022, 135, 104136. [Google Scholar] [CrossRef]
  205. Li, G.; Ren, X.; Qiao, W.; Ma, B.; Li, Y. Automatic Bridge Crack Identification from Concrete Surface Using ResNeXt with Postprocessing. Struct. Control Health Monit. 2020, 27, e2620. [Google Scholar] [CrossRef]
  206. Xu, S.; Hao, M.; Liu, G.; Meng, Y.; Han, J.; Shi, Y. Concrete Crack Segmentation Based on Convolution–Deconvolution Feature Fusion with Holistically Nested Networks. Struct. Control Health Monit. 2022, 29, e2965. [Google Scholar] [CrossRef]
  207. Ye, X.W.; Jin, T.; Li, Z.X.; Ma, S.Y.; Ding, Y.; Ou, Y.H. Structural Crack Detection from Benchmark Data Sets Using Pruned Fully Convolutional Networks. J. Struct. Eng. 2021, 147, 04721008. [Google Scholar] [CrossRef]
  208. Chu, H.; Wang, W.; Deng, L. Tiny-Crack-Net: A Multiscale Feature Fusion Network with Attention Mechanisms for Segmentation of Tiny Cracks. Comput.-Aided. Civ. Infrastruct. Eng. 2022, 37, 1914–1931. [Google Scholar] [CrossRef]
  209. Zheng, X.; Zhang, S.; Li, X.; Li, G.; Li, X. Lightweight Bridge Crack Detection Method Based on Segnet and Bottleneck Depth-Separable Convolution with Residuals. IEEE Access 2021, 9, 161649–161668. [Google Scholar] [CrossRef]
  210. Zhang, Q.; Barri, K.; Babanajad, S.K.; Alavi, A.H. Real-Time Detection of Cracks on Concrete Bridge Decks Using Deep Learning in the Frequency Domain. Engineering 2021, 7, 1786–1796. [Google Scholar] [CrossRef]
  211. Qiao, W.; Zhang, H.; Zhu, F.; Wu, Q. A Crack Identification Method for Concrete Structures Using Improved U-Net Convolutional Neural Networks. Math Probl. Eng. 2021, 2021, 6654996. [Google Scholar] [CrossRef]
  212. Bae, H.; Jang, K.; An, Y.K. Deep Super Resolution Crack Network (SrcNet) for Improving Computer Vision–Based Automated Crack Detectability in in Situ Bridges. Struct. Health Monit. 2021, 20, 1428–1442. [Google Scholar] [CrossRef]
  213. Chen, R. Migration Learning-Based Bridge Structure Damage Detection Algorithm. Sci. Program 2021, 2021, 1102521. [Google Scholar] [CrossRef]
  214. Flah, M.; Suleiman, A.R.; Nehdi, M.L. Classification and Quantification of Cracks in Concrete Structures Using Deep Learning Image-Based Techniques. Cem. Concr. Compos. 2020, 114, 103781. [Google Scholar] [CrossRef]
  215. Li, G.; Liu, Q.; Zhao, S.; Qiao, W.; Ren, X. Automatic Crack Recognition for Concrete Bridges Using a Fully Convolutional Neural Network and Naive Bayes Data Fusion Based on a Visual Detection System. Meas. Sci. Technol. 2020, 31, 075403. [Google Scholar] [CrossRef]
  216. Zhu, J.; Song, J. Weakly Supervised Network Based Intelligent Identification of Cracks in Asphalt Concrete Bridge Deck. Alex. Eng. J. 2020, 59, 1307–1317. [Google Scholar] [CrossRef]
  217. Ni, F.; He, Z.; Jiang, S.; Wang, W.; Zhang, J. A Generative Adversarial Learning Strategy for Enhanced Lightweight Crack Delineation Networks. Adv. Eng. Inform. 2022, 52, 101575. [Google Scholar] [CrossRef]
  218. Tang, Y.; Huang, Z.; Chen, Z.; Chen, M.; Zhou, H.; Zhang, H.; Sun, J. Novel Visual Crack Width Measurement Based on Backbone Double-Scale Features for Improved Detection Automation. Eng. Struct. 2023, 274, 115158. [Google Scholar] [CrossRef]
  219. Yan, Y.; Mao, Z.; Wu, J.; Padir, T.; Hajjar, J.F. Towards Automated Detection and Quantification of Concrete Cracks Using Integrated Images and Lidar Data from Unmanned Aerial Vehicles. Struct. Control Health Monit. 2021, 28, e2757. [Google Scholar] [CrossRef]
  220. Turkan, Y.; Hong, J.; Laflamme, S.; Puri, N. Adaptive Wavelet Neural Network for Terrestrial Laser Scanner-Based Crack Detection. Autom. Constr. 2018, 94, 191–202. [Google Scholar] [CrossRef] [Green Version]
  221. Valença, J.; Puente, I.; Júlio, E.; González-Jorge, H.; Arias-Sánchez, P. Assessment of Cracks on Concrete Bridges Using Image Processing Supported by Laser Scanning Survey. Constr. Build Mater. 2017, 146, 668–678. [Google Scholar] [CrossRef]
  222. Yapar, O.; Basu, P.K.; Volgyesi, P.; Ledeczi, A. Structural Health Monitoring of Bridges with Piezoelectric AE Sensors. Eng. Fail. Anal. 2015, 56, 150–169. [Google Scholar] [CrossRef] [Green Version]
  223. Anay, R.; Cortez, T.M.; Jáuregui, D.V.; Asce, M.; Elbatanouny, M.K.; Ziehl, P. On-Site Acoustic-Emission Monitoring for Assessment of a Prestressed Concrete Double-Tee-Beam Bridge without Plans. J. Perform. Constr. Facil. 2016, 30, 04015062. [Google Scholar] [CrossRef]
  224. Sagar, R.V.; Prasad, B.K.R.; Sharma, R. Evaluation of Damage in Reinforced Concrete Bridge Beams Using Acoustic Emission Technique. Nondestruct. Test. Eval. 2012, 27, 95–108. [Google Scholar] [CrossRef]
  225. Toutanji, H. Ultrasonic Wave Velocity Signal Interpretation of Simulated Concrete Bridge Decks. Mater. Struct./MaMriaux Constr. 2000, 33, 207–215. [Google Scholar] [CrossRef]
  226. Kasireddy, V.; Akinci, B. Assessing the Impact of 3D Point Neighborhood Size Selection on Unsupervised Spall Classification with 3D Bridge Point Clouds. Adv. Eng. Inform. 2022, 52, 101624. [Google Scholar] [CrossRef]
  227. Al-Sabbag, Z.A.; Yeum, C.M.; Narasimhan, S. Interactive Defect Quantification through Extended Reality. Adv. Eng. Inform. 2022, 51, 101473. [Google Scholar] [CrossRef]
  228. Mohammed Abdelkader, E.; Moselhi, O.; Marzouk, M.; Zayed, T. Entropy-Based Automated Method for Detection and Assessment of Spalling Severities in Reinforced Concrete Bridges. J. Perform. Constr. Facil. 2021, 35, 04020132. [Google Scholar] [CrossRef]
  229. Adhikari, R.S.; Bagchi, A.; Moselhi, O. Automated Condition Assessment of Concrete Bridges with Digital Imaging. Smart Struct. Syst. 2014, 13, 901–925. [Google Scholar] [CrossRef]
  230. Yu, Y.; Rashidi, M.; Samali, B.; Yousefi, A.M.; Wang, W. Multi-Image-Feature-Based Hierarchical Concrete Crack Identification Framework Using Optimized Svm Multi-Classifiers and d–s Fusion Algorithm for Bridge Structures. Remote Sens. 2021, 13, 240. [Google Scholar] [CrossRef]
  231. Mohammed Abdelkader, E.; Moselhi, O.; Marzouk, M.; Zayed, T. Hybrid Elman Neural Network and an Invasive Weed Optimization Method for Bridge Defect Recognition. Transp. Res. Rec. 2021, 2675, 167–199. [Google Scholar] [CrossRef]
  232. Kabir, S.; Rivard, P. Damage Classification of Concrete Structures Based on Grey Level Co-Occurrence Matrix Using Haar’s Discrete Wavelet Transform. Comput. Concr. 2007, 4, 243–257. [Google Scholar] [CrossRef]
  233. Kabir, S.; Rivard, P.; Ballivy, G. Neural-Network-Based Damage Classification of Bridge Infrastructure Using Texture Analysis. Can. J. Civ. Eng. 2008, 35, 258–267. [Google Scholar] [CrossRef]
  234. Zollini, S.; Alicandro, M.; Dominici, D.; Quaresima, R.; Giallonardo, M. UAV Photogrammetry for Concrete Bridge Inspection Using Object-Based Image Analysis (OBIA). Remote Sens. 2020, 12, 3180. [Google Scholar] [CrossRef]
  235. Adhikari, R.S.; Moselhi, O.; Bagchi, A.; Rahmatian, A. Tracking of Defects in Reinforced Concrete Bridges Using Digital Images. J. Comput. Civ. Eng. 2016, 30, 04016004. [Google Scholar] [CrossRef]
  236. Lattanzi, D.; Miller, G.R.; Eberhard, M.O.; Haraldsson, O.S. Bridge Column Maximum Drift Estimation via Computer Vision. J. Comput. Civ. Eng. 2016, 30, 04015051. [Google Scholar] [CrossRef]
  237. Hüthwohl, P.; Lu, R.; Brilakis, I. Multi-Classifier for Reinforced Concrete Bridge Defects. Autom. Constr. 2019, 105, 102824. [Google Scholar] [CrossRef]
  238. Zhu, J.; Song, J. An Intelligent Classification Model for Surface Defects on Cement Concrete Bridges. Appl. Sci. 2020, 10, 972. [Google Scholar] [CrossRef] [Green Version]
  239. Kruachottikul, P.; Cooharojananone, N.; Phanomchoeng, G.; Chavarnakul, T.; Kovitanggoon, K.; Trakulwaranont, D. Deep Learning-Based Visual Defect-Inspection System for Reinforced Concrete Bridge Substructure: A Case of Thailand’s Department of Highways. J. Civ. Struct. Health Monit. 2021, 11, 949–965. [Google Scholar] [CrossRef]
  240. Savino, P.; Tondolo, F. Automated Classification of Civil Structure Defects Based on Convolutional Neural Network. Front. Struct. Civ. Eng. 2021, 15, 305–317. [Google Scholar] [CrossRef]
  241. Pozzer, S.; Rezazadeh Azar, E.; Dalla Rosa, F.; Chamberlain Pravia, Z.M. Semantic Segmentation of Defects in Infrared Thermographic Images of Highly Damaged Concrete Structures. J. Perform. Constr. Facil. 2021, 35, 04020131. [Google Scholar] [CrossRef]
  242. Bukhsh, Z.A.; Jansen, N.; Saeed, A. Damage Detection Using In-Domain and Cross-Domain Transfer Learning. Neural. Comput. Appl. 2021, 33, 16921–16936. [Google Scholar] [CrossRef]
  243. Karaaslan, E.; Zakaria, M.; Catbas, F.N. Mixed Reality-Assisted Smart Bridge Inspection for Future Smart Cities. In The Rise of Smart Cities: Advanced Structural Sensing and Monitoring Systems; Elsevier: Amsterdam, The Netherlands, 2022; pp. 261–280. ISBN 9780128177846. [Google Scholar]
  244. Chen, A.; Fang, X.; Pan, Z.; Wang, D.; Pan, Y.; Peng, B. Engineering Practices on Surface Damage Inspection and Performance Evaluation of Concrete Bridges in China. Struct. Concr. 2022, 23, 16–31. [Google Scholar] [CrossRef]
  245. Simonyan, K.; Zisserman, A. Very Deep Convolutional Networks for Large-Scale Image Recognition. arXiv 2014, arXiv:1409.1556. [Google Scholar]
  246. Krizhevsky, A.; Sutskever, I.; Hinton, G.E. ImageNet Classification with Deep Convolutional Neural Networks. Commun. ACM 2017, 60, 84–90. [Google Scholar] [CrossRef] [Green Version]
  247. Szegedy, C.; Liu, W.; Jia, Y.; Sermanet, P.; Reed, S.; Anguelov, D.; Erhan, D.; Vanhoucke, V.; Rabinovich, A. Going Deeper with Convolutions. In Proceedings of the IEEE Conference on Computer Vision and Pattern Recognition, Boston, MA, USA, 7–12 June 2015; pp. 1–9. [Google Scholar]
  248. He, K.; Zhang, X.; Ren, S.; Sun, J. Deep Residual Learning for Image Recognition. In Proceedings of the IEEE Computer Society Conference on Computer Vision and Pattern Recognition, Las Vegas, NV, USA, 27–30 June 2016; Volume 2016, pp. 770–778. [Google Scholar]
  249. Ronneberger, O.; Fischer, P.; Brox, T. U-Net: Convolutional Networks for Biomedical Image Segmentation. In Proceedings of the Medical Image Computing and Computer-Assisted Intervention—MICCAI 2015, Munich, Germany, 5–9 October 2015; pp. 234–241. [Google Scholar]
  250. Xu, H.; Su, X.; Wang, Y.; Cai, H.; Cui, K.; Chen, X. Automatic Bridge Crack Detection Using a Convolutional Neural Network. Appl. Sci. 2019, 9, 2867. [Google Scholar] [CrossRef] [Green Version]
  251. Zoubir, H.; Rguig, M.; Elaroussi, M. Crack Recognition Automation in Concrete Bridges Using Deep Convolutional Neural Networks. MATEC Web Conf. 2021, 349, 03014. [Google Scholar] [CrossRef]
  252. Li, B.; Guo, H.; Wang, Z.; Li, M. Automatic Crack Classification and Segmentation on Concrete Bridge Images Using Convolutional Neural Networks and Hybrid Image Processing. Intell. Transp. Infrastruct. 2022, 1, 1–9. [Google Scholar] [CrossRef]
  253. Mundt, M.; Majumder, S.; Murali, S.; Panetsos, P.; Ramesh, V. Meta-Learning Convolutional Neural Architectures for Multi-Target Concrete Defect Classification with the COncrete DEfect BRidge IMage Dataset. In Proceedings of the IEEE/CVF Conference on Computer Vision and Pattern Recognition 2019, Long Beach, CA, USA, 15–20 June 2019; pp. 1–9. [Google Scholar]
  254. Ichi, E.; Jafari, F.; Dorafshan, S. SDNET2021: Annotated NDE Dataset for Subsurface Structural Defects Detection in Concrete Bridge Decks. Infrastructures 2022, 7, 107. [Google Scholar] [CrossRef]
Figure 1. Framework of the developed research methodology for relevant literature in the CBD_NDT domain.
Buildings 13 00800 g001
Figure 2. Boolean query string in Web of Science database.
Buildings 13 00800 g002
Figure 3. Boolean query string in Scopus database.
Buildings 13 00800 g003
Figure 4. Annual production growth in CBD_NDT research from 1991 to 2022.
Buildings 13 00800 g004
Figure 5. Temporal evolution of mean total citations per year in CBD_NDT research from 1992 to 2022.
Buildings 13 00800 g005
Figure 6. Co-authorship network of countries in the research on CBD_NDT.
Buildings 13 00800 g006
Figure 7. Co-authorship network of institutions in the research on CBD_NDT.
Buildings 13 00800 g007
Figure 8. Co-citation network of journals in the research on CBD_NDT.
Buildings 13 00800 g008
Figure 9. Core journals in CBD_NDT research according to Bradford’s law.
Buildings 13 00800 g009
Figure 10. Co-occurrence network of author keywords in the research on CBD_NDT.
Buildings 13 00800 g010
Figure 11. Temporal co-occurrence network of author keywords in the research on CBD_NDT.
Buildings 13 00800 g011
Figure 12. Authors’ productivity in CBD_NDT research according to Lotka’s law.
Buildings 13 00800 g012
Figure 13. Distribution of the tackled defects in the CBD_NDT domain.
Buildings 13 00800 g013
Figure 14. Distribution of the utilized NDTs in the CBD_NDT domain.
Buildings 13 00800 g014
Figure 15. Distribution of used artificial intelligence models in CBD_NDT.
Buildings 13 00800 g015
Figure 16. Distribution of detection types of surface defects.
Buildings 13 00800 g016
Figure 17. Distribution of performance metrics in the CBD_NDT domain.
Buildings 13 00800 g017
Table 1. Quantitative summary of active countries in the field of CBD_NDT with regards to publication count, total citations and average normalized citations.
RankCountryNumber of DocumentsTotal CitationsNormalized CitationsAverage Publication YearAverage CitationsAverage Normalized CitationsTotal Link Strength
Publication count
1United States of America2115299220.922013.3725.111.0568
2China88112090.362019.4512.731.0338
3Canada66136562.552015.4020.680.9547
4South Korea4171342.242017.3417.391.0324
5Japan2536719.342014.7414.681.0513
Total citations
1United States of America2115299220.922013.3725.111.0568
2Canada66136562.552015.4020.680.9547
3China88112090.362019.4512.731.0338
4South Korea4171342.242017.3417.391.0324
5United Kingdom1646223.592012.2528.881.4717
Average normalized citations
1Chile49712.572020.2524.253.143
2Singapore2654.892020.532.52.451
3Tunisia1212.392005212.391
4Sweden3717.12201723.672.371
5Switzerland21204.042009.5602.023
Table 2. Quantitative summary of active institutions in the field of CBD_NDT with respect to publication count, total citations and average normalized citations.
RankCountryNumber of DocumentsTotal CitationsNormalized CitationsAverage Publication YearAverage CitationsAverage Normalized CitationsTotal Link Strength
Publication count
1Rutgers University2373032.862014.8331.741.4334
2Concordia University1839216.542017.9421.780.9224
3Hong Kong Polytechnic University141066.32019.857.570.4526
4Federal Highway Administration102319.19201623.10.9220
5Cairo University8373.132020.384.630.3914
Total citations
1Rutgers University2373032.862014.8331.741.4334
2Concordia University1839216.542017.9421.780.9224
3Clarkson University333913.92018.331134.634
4Utah State University333913.92018.331134.634
5University of Nevada, Reno22468.762016.51234.383
Average normalized citations
1Clarkson University333913.92018.331134.634
2Utah State University333913.92018.331134.634
3University of Nevada, Reno22468.762016.51234.383
4Sungkyunkwan University275.262021.53.52.633
5University of Texas at Austin31377.702015.6745.672.577
Table 3. Quantitative summary of active journals in the field of CBD_NDT with respect to publication count, total citations and average normalized citations.
RankCountryNumber of DocumentsTotal CitationsNormalized CitationsAverage Publication YearAverage CitationsAverage Normalized CitationsTotal Link Strength
Publication count
1Construction and Building Materials30103644.362016.3734.531.48189
2NDT & E International2084121.052013.8542.051.05150
3Transportation Research Record1721510.052013.4412.650.59101
4Automation in Construction1465731.952018.0046.932.28124
5Sensors1233816.042018.7528.171.3466
Total citations
1Construction and Building Materials30103644.362016.3734.531.48189
2NDT & E International2084121.052013.8542.051.05150
3Journal of Computing in Civil Engineering970214.362015.78781.674
4Automation in Construction1465731.95201846.932.28124
5Sensors1233816.042018.7528.171.3466
Average normalized citations
1IEEE Transactions on Automation Science and Engineering224810.182013.51245.0919
2Computer-Aided Civil and Infrastructure Engineering727919.54202039.862.7929
3Structural Health Monitoring515913.882020.431.82.7817
4Cement and Concrete Composites31757.562008.6758.332.526
5Automation in Construction1465731.95201846.932.28124
Table 4. Categorization of journal articles according to the publisher.
RankPublisherRecord CountCorresponding Percentage
1Elsevier Ltd.13025.74%
2ASCE6512.87%
3Springer479.31%
4MDPI407.92%
5SAGE Publishing Ltd.377.33%
6John Wiley & Sons Ltd.336.53%
7Taylor & Francis254.95%
8American Concrete Institute163.17%
9IEEE122.38%
10Hindawi Limited101.98%
11Technology center91.78%
12Canadian Science Publishing71.39%
13British Institute of Non-Destructive Testing40.79%
14Emerald Publishing Limited40.79%
15National Association of Corrosion Engineers40.79%
16American Society for Nondestructive Testing40.79%
17Environmental and Engineering Geophysical Society30.59%
18Trans Tech Publications Ltd.30.59%
19American Society for Testing and Materials30.59%
20IOP Publishing30.59%
Table 5. Quantitative summary of the main keywords in the field of CBD_NDT.
KeywordOccurrencesAverage Publication YearTotal Link Strength
Nondestructive testing1092014.86297
Ground penetrating radar732014.07192
Concrete702012.67219
Concrete bridge decks702014.28197
Concrete bridges592015.63165
Corrosion522013.75126
Delamination502017.06156
Bridge inspection402016.79112
Infrared thermography392016.63106
Deep learning342020.3685
Crack detection302018.4772
Impact echo272015.5998
Image processing232016.6157
Reinforced concrete232017.6147
Cracks212013.5252
Structural health monitoring202019.5347
Convolutional neural network172020.0645
Computer vision162019.0737
Condition assessment15201953
Concrete structures132017.0828
Damage detection12201724
Deterioration122013.0953
Durability122015.3628
Electrical resistivity122015.5842
Infrastructure monitoring122014.31
Machine learning122019.6737
Unmanned aerial vehicle122019.6725
Half-cell potential112013.5534
Defect detection102018.219
Surface waves102011.935
Visual inspection102018.2228
Infrastructure92016.3830
Semantic segmentation92020.7523
Bridge maintenance82011.2530
Damage assessment82016.1321
Acoustic emission72013.7112
Bridge condition assessment7201418
Data fusion72017.2922
Defects7201323
Lidar72018.8619
Table 6. Summary of the most influential articles in CBD_NDT research.
RankReferenceTitlePublication YearTotal CitationsNormalized CitationsKey Findings
1[38]Analysis of Edge-Detection Techniques for Crack Identification in Bridges20034193.58Fast Haar transform is more efficient in edge detection of surface cracks than fast Fourier transform, Sobel and Canny
2[39]Application of infrared thermography to the non-destructive testing of concrete and masonry bridges20032662.27A temperature range of 0.2–0.3 °C differentiates delaminated from non-delaminated regions
3[40]Comparison of deep convolutional neural networks and edge detectors for image-based crack detection in concrete201824610.35AlexNet Deep convolutional neural network yielded better detection accuracies and shorter testing time than edge detectors
4[41]Automated Crack Detection on Concrete Bridges20161977.83Spatially tuned robust multifeatured classifier created accurate crack density maps of bridge decks
5[42]Image-based retrieval of concrete crack properties for bridge inspection20141816.66Artificial neural network is a practical tool to analyze surface cracks in concrete beams
6[43]Improved Image Analysis for Evaluating Concrete Damage20061412.74Bayesian decision theory coupled with receiver operating characteristics analysis could locate surface cracks in bridge components
7[44]Remote sensing of concrete bridge decks using unmanned aerial vehicle infrared thermography20171093.59Image-based analysis of infrared thermograms can render delamination maps of reinforced concrete bridges
8[45]Macrocell corrosion of steel in concrete—implications for corrosion monitoring20021083.69Active/passive model-macrocell can be used in accordance with the measurements of half-cell potential and linear polarization resistance can be used for corrosion monitoring
9[46]Applications of ground penetrating radar (GPR) in bridge deck monitoring and assessment20131062.88Ground penetrating radar surveys are useful in localization of reinforcement, estimation of concrete cover and moisture detection
10[47]The impact-echo response of concrete plates containing delaminations: numerical, experimental and field studies1993951.42Impact echo can detect shallow corrosion-induced delamination
Table 7. Most influential authors in CBD_NDT research.
Authorh-Indexg-Indexm-IndexTotal Citations
GUCUNSKI N13240.72823
WASHER G10120.48287
AZARI H8140.67196
ZAYED T8130.8203
ABUDAYYEH O780.33720
DINH K7120.78174
MOSELHI O7100.7288
LI G790.58206
YEHIA S780.39327
KEE S780.58324
KIM J6100.75120
DORAFSHAN S661426
NEHDI M660.86209
LA H550.56571
BASILY B440.44506
DANA K330.39490
DALLA R F33138
LIM R220.25441
PARVARDEH H220.25441
PRASANNA P220.25441
ABDEL-QADER L110.05419
Table 8. Description of some of the studies in the research domain of CBD_NDT.
ReferenceNDTsDefect
CorrosionDelaminationSurface CracksConcrete QualityMoistureVoidsHoneycombingDebondingScaling
[58]SST, USW, IE, UT, IR, GPR, ER, HCP and IRT
[59]IRT and GPR
[60]ER, IE, USW and DP
[61]ER, IE, USW and DP
[62]ER, GPR and IE
[63]GPR
[64]GPR
[65]GPR
[66]GPR, ER, IE and USW
[67]LS
[68]IE and IRT
[69]HCP, IE, GPR and CD
[70]GPR
[71]GPR and IRT
Table 9. Description of some of the studies in the research domain of CBD_NDT (Cont’d).
ReferenceNDTsDefect
CorrosionDelaminationSurface CracksDeformationPop-OutVoidsEfflorescenceSpallingScaling
[72]SI
[73]DP
[74]DP
[75]3D neutron tomography and 3DX-ray tomography
[76]IRT
[77]DP
[78]DP
[79]GPR
[80]GPR, IE, CD and IRT
[81]DP
[82]GPR
[83]IRT, GPR and UPE
[84]IRT
[85]DP
Table 10. Literature review matrix of concrete bridge defects and some used NDTs.
NDTsHCPLPRIEGPRUSWCDUPVSTTDRIRDPSMEIS
Defects
Corrosion6.74%1.72%0.31%6.27%0.16%0.00%0.00%0.16%0.16%0.31%0.00%0.00%0.47%
Delamination0.16%0.00%8.15%4.39%0.47%1.88%0.00%0.31%0.00%9.72%0.00%0.00%0.00%
Void0.16%0.00%3.29%2.19%0.31%0.00%0.31%0.47%0.00%1.41%0.00%0.00%0.00%
Cracks0.00%0.00%0.78%0.94%0.00%0.00%0.16%0.00%0.00%0.31%17.40%0.00%0.00%
Debonding0.16%0.00%0.16%0.63%0.16%0.00%0.00%0.16%0.00%0.63%0.00%0.00%0.00%
Deformation0.00%0.00%0.00%0.00%0.00%0.00%0.00%0.00%0.00%0.00%0.63%0.00%0.00%
Rupture0.00%0.00%0.00%0.00%0.00%0.00%0.00%0.00%0.00%0.00%0.00%0.16%0.00%
Honeycombing0.16%0.00%0.47%0.16%0.16%0.00%0.00%0.16%0.00%0.16%0.16%0.00%0.00%
Moisture0.00%0.00%0.00%1.25%0.00%0.00%0.00%0.00%0.00%0.00%0.00%0.00%0.00%
Erosion0.00%0.00%0.00%0.00%0.00%0.00%0.00%0.00%0.00%0.00%0.31%0.00%0.00%
Spalling0.00%0.00%0.00%0.00%0.00%0.00%0.00%0.00%0.00%0.00%3.76%0.00%0.00%
Det/Quality0.00%0.00%0.00%1.25%1.41%0.00%0.00%0.00%0.00%0.00%0.00%0.00%0.00%
Scaling0.00%0.00%0.00%0.00%0.00%0.00%0.00%0.00%0.00%0.00%1.25%0.00%0.00%
Efflorescence0.00%0.00%0.00%0.00%0.00%0.00%0.00%0.00%0.00%0.00%0.94%0.00%0.00%
Pop-out0.00%0.00%0.00%0.00%0.00%0.00%0.00%0.00%0.00%0.00%0.16%0.00%0.00%
Rebar exposure0.00%0.00%0.00%0.00%0.00%0.00%0.00%0.00%0.00%0.00%0.31%0.00%0.00%
Floating0.00%0.00%0.00%0.00%0.00%0.00%0.00%0.00%0.00%0.16%0.00%0.00%0.00%
Bulge0.00%0.00%0.00%0.00%0.00%0.00%0.00%0.00%0.00%0.00%0.16%0.00%0.00%
Pitting0.00%0.00%0.00%0.00%0.00%0.00%0.00%0.00%0.00%0.00%0.16%0.00%0.00%
Deflection0.00%0.00%0.00%0.00%0.00%0.00%0.00%0.00%0.00%0.00%0.16%0.00%0.00%
Table 11. Literature review matrix of concrete bridge defects and other used NDTs.
NDTsERRCTCCTFAUAE + OFHSUTMWMFLERMLSUPE
Defects
Corrosion3.76%0.16%0.16%0.16%0.00%0.16%0.00%0.16%0.00%0.31%0.00%0.00%0.00%
Delamination0.16%0.00%0.00%0.00%0.16%0.31%0.63%0.31%0.00%0.00%0.00%0.00%0.47%
Void0.16%0.00%0.00%0.00%0.00%0.00%0.00%0.31%0.00%0.00%0.00%0.00%0.31%
Cracks0.00%0.00%0.00%0.00%0.00%0.78%0.00%0.00%0.00%0.00%0.00%0.78%0.16%
Debonding0.16%0.00%0.00%0.00%0.00%0.00%0.00%0.47%0.16%0.00%0.00%0.00%0.00%
Deformation0.00%0.00%0.00%0.00%0.00%0.00%0.00%0.00%0.00%0.00%0.00%0.31%0.00%
Rupture0.00%0.00%0.00%0.00%0.00%0.16%0.00%0.00%0.00%0.16%0.16%0.00%0.00%
Honeycombing0.16%0.16%0.00%0.00%0.00%0.00%0.00%0.16%0.00%0.00%0.00%0.00%0.00%
Moisture0.00%0.00%0.00%0.00%0.00%0.00%0.00%0.00%0.00%0.00%0.00%0.00%0.00%
Erosion0.00%0.00%0.00%0.00%0.00%0.00%0.00%0.00%0.00%0.00%0.00%0.00%0.00%
Spalling0.00%0.00%0.00%0.00%0.00%0.00%0.00%0.00%0.00%0.00%0.00%0.47%0.00%
Det/Quality0.00%0.00%0.00%0.00%0.00%0.00%0.00%0.00%0.00%0.00%0.00%0.00%0.00%
Scaling0.00%0.00%0.00%0.00%0.00%0.00%0.00%0.00%0.00%0.00%0.00%0.16%0.00%
Efflorescence0.00%0.00%0.00%0.00%0.00%0.00%0.00%0.00%0.00%0.00%0.00%0.00%0.00%
Pop-out0.00%0.00%0.00%0.00%0.00%0.00%0.00%0.00%0.00%0.00%0.00%0.00%0.00%
Rebar exposure0.00%0.00%0.00%0.00%0.00%0.00%0.00%0.00%0.00%0.00%0.00%0.00%0.00%
Floating0.00%0.00%0.00%0.00%0.00%0.00%0.00%0.00%0.00%0.00%0.00%0.00%0.00%
Bulge0.00%0.00%0.00%0.00%0.00%0.00%0.00%0.00%0.00%0.00%0.00%0.00%0.00%
Pitting0.00%0.00%0.00%0.00%0.00%0.00%0.00%0.00%0.00%0.00%0.00%0.00%0.00%
Deflection0.00%0.00%0.00%0.00%0.00%0.00%0.00%0.00%0.00%0.00%0.00%0.16%0.00%
Table 12. Literature review matrix of concrete bridge defects and other used NDTs (Continued).
NDTsULAIMLMMS3DN3DXIRSIBCISASEHIiCAMMM5AIDD
Defects
Corrosion0.00%0.16%0.16%0.16%0.16%0.16%0.00%0.00%0.00%0.16%0.16%0.16%0.00%
Delamination0.16%0.00%0.00%0.00%0.00%0.31%0.00%0.16%0.16%0.00%0.00%0.00%0.31%
Void0.00%0.00%0.00%0.00%0.00%0.16%0.00%0.00%0.00%0.00%0.00%0.00%0.00%
Cracks0.00%0.00%0.00%0.00%0.00%0.00%0.00%0.00%0.00%0.00%0.00%0.00%0.00%
Debonding0.00%0.00%0.00%0.00%0.00%0.16%0.00%0.00%0.00%0.00%0.00%0.00%0.00%
Deformation0.00%0.00%0.00%0.00%0.00%0.00%0.47%0.00%0.00%0.00%0.00%0.00%0.00%
Rupture0.00%0.00%0.00%0.00%0.00%0.00%0.00%0.00%0.00%0.00%0.00%0.00%0.00%
Honeycombing0.00%0.00%0.00%0.00%0.00%0.16%0.00%0.00%0.00%0.00%0.00%0.00%0.00%
Moisture0.00%0.00%0.00%0.00%0.00%0.00%0.00%0.00%0.00%0.00%0.00%0.00%0.00%
Erosion0.00%0.00%0.00%0.00%0.00%0.00%0.00%0.00%0.00%0.00%0.00%0.00%0.00%
Spalling0.00%0.00%0.00%0.00%0.00%0.00%0.00%0.00%0.00%0.00%0.00%0.00%0.00%
Det/Quality0.00%0.00%0.00%0.00%0.00%0.00%0.00%0.00%0.00%0.00%0.00%0.00%0.00%
Scaling0.00%0.00%0.00%0.00%0.00%0.00%0.00%0.00%0.00%0.00%0.00%0.00%0.00%
Efflorescence0.00%0.00%0.00%0.00%0.00%0.00%0.00%0.00%0.00%0.00%0.00%0.00%0.00%
Pop-out0.00%0.00%0.00%0.00%0.00%0.00%0.00%0.00%0.00%0.00%0.00%0.00%0.00%
Rebar exposure0.00%0.00%0.00%0.00%0.00%0.00%0.00%0.00%0.00%0.00%0.00%0.00%0.00%
Floating0.00%0.00%0.00%0.00%0.00%0.00%0.00%0.00%0.00%0.00%0.00%0.00%0.00%
Bulge0.00%0.00%0.00%0.00%0.00%0.00%0.00%0.00%0.00%0.00%0.00%0.00%0.00%
Pitting0.00%0.00%0.00%0.00%0.00%0.00%0.00%0.00%0.00%0.00%0.00%0.00%0.00%
Deflection0.00%0.00%0.00%0.00%0.00%0.00%0.00%0.00%0.00%0.00%0.00%0.00%0.00%
Disclaimer/Publisher’s Note: The statements, opinions and data contained in all publications are solely those of the individual author(s) and contributor(s) and not of MDPI and/or the editor(s). MDPI and/or the editor(s) disclaim responsibility for any injury to people or property resulting from any ideas, methods, instructions or products referred to in the content.

