Article

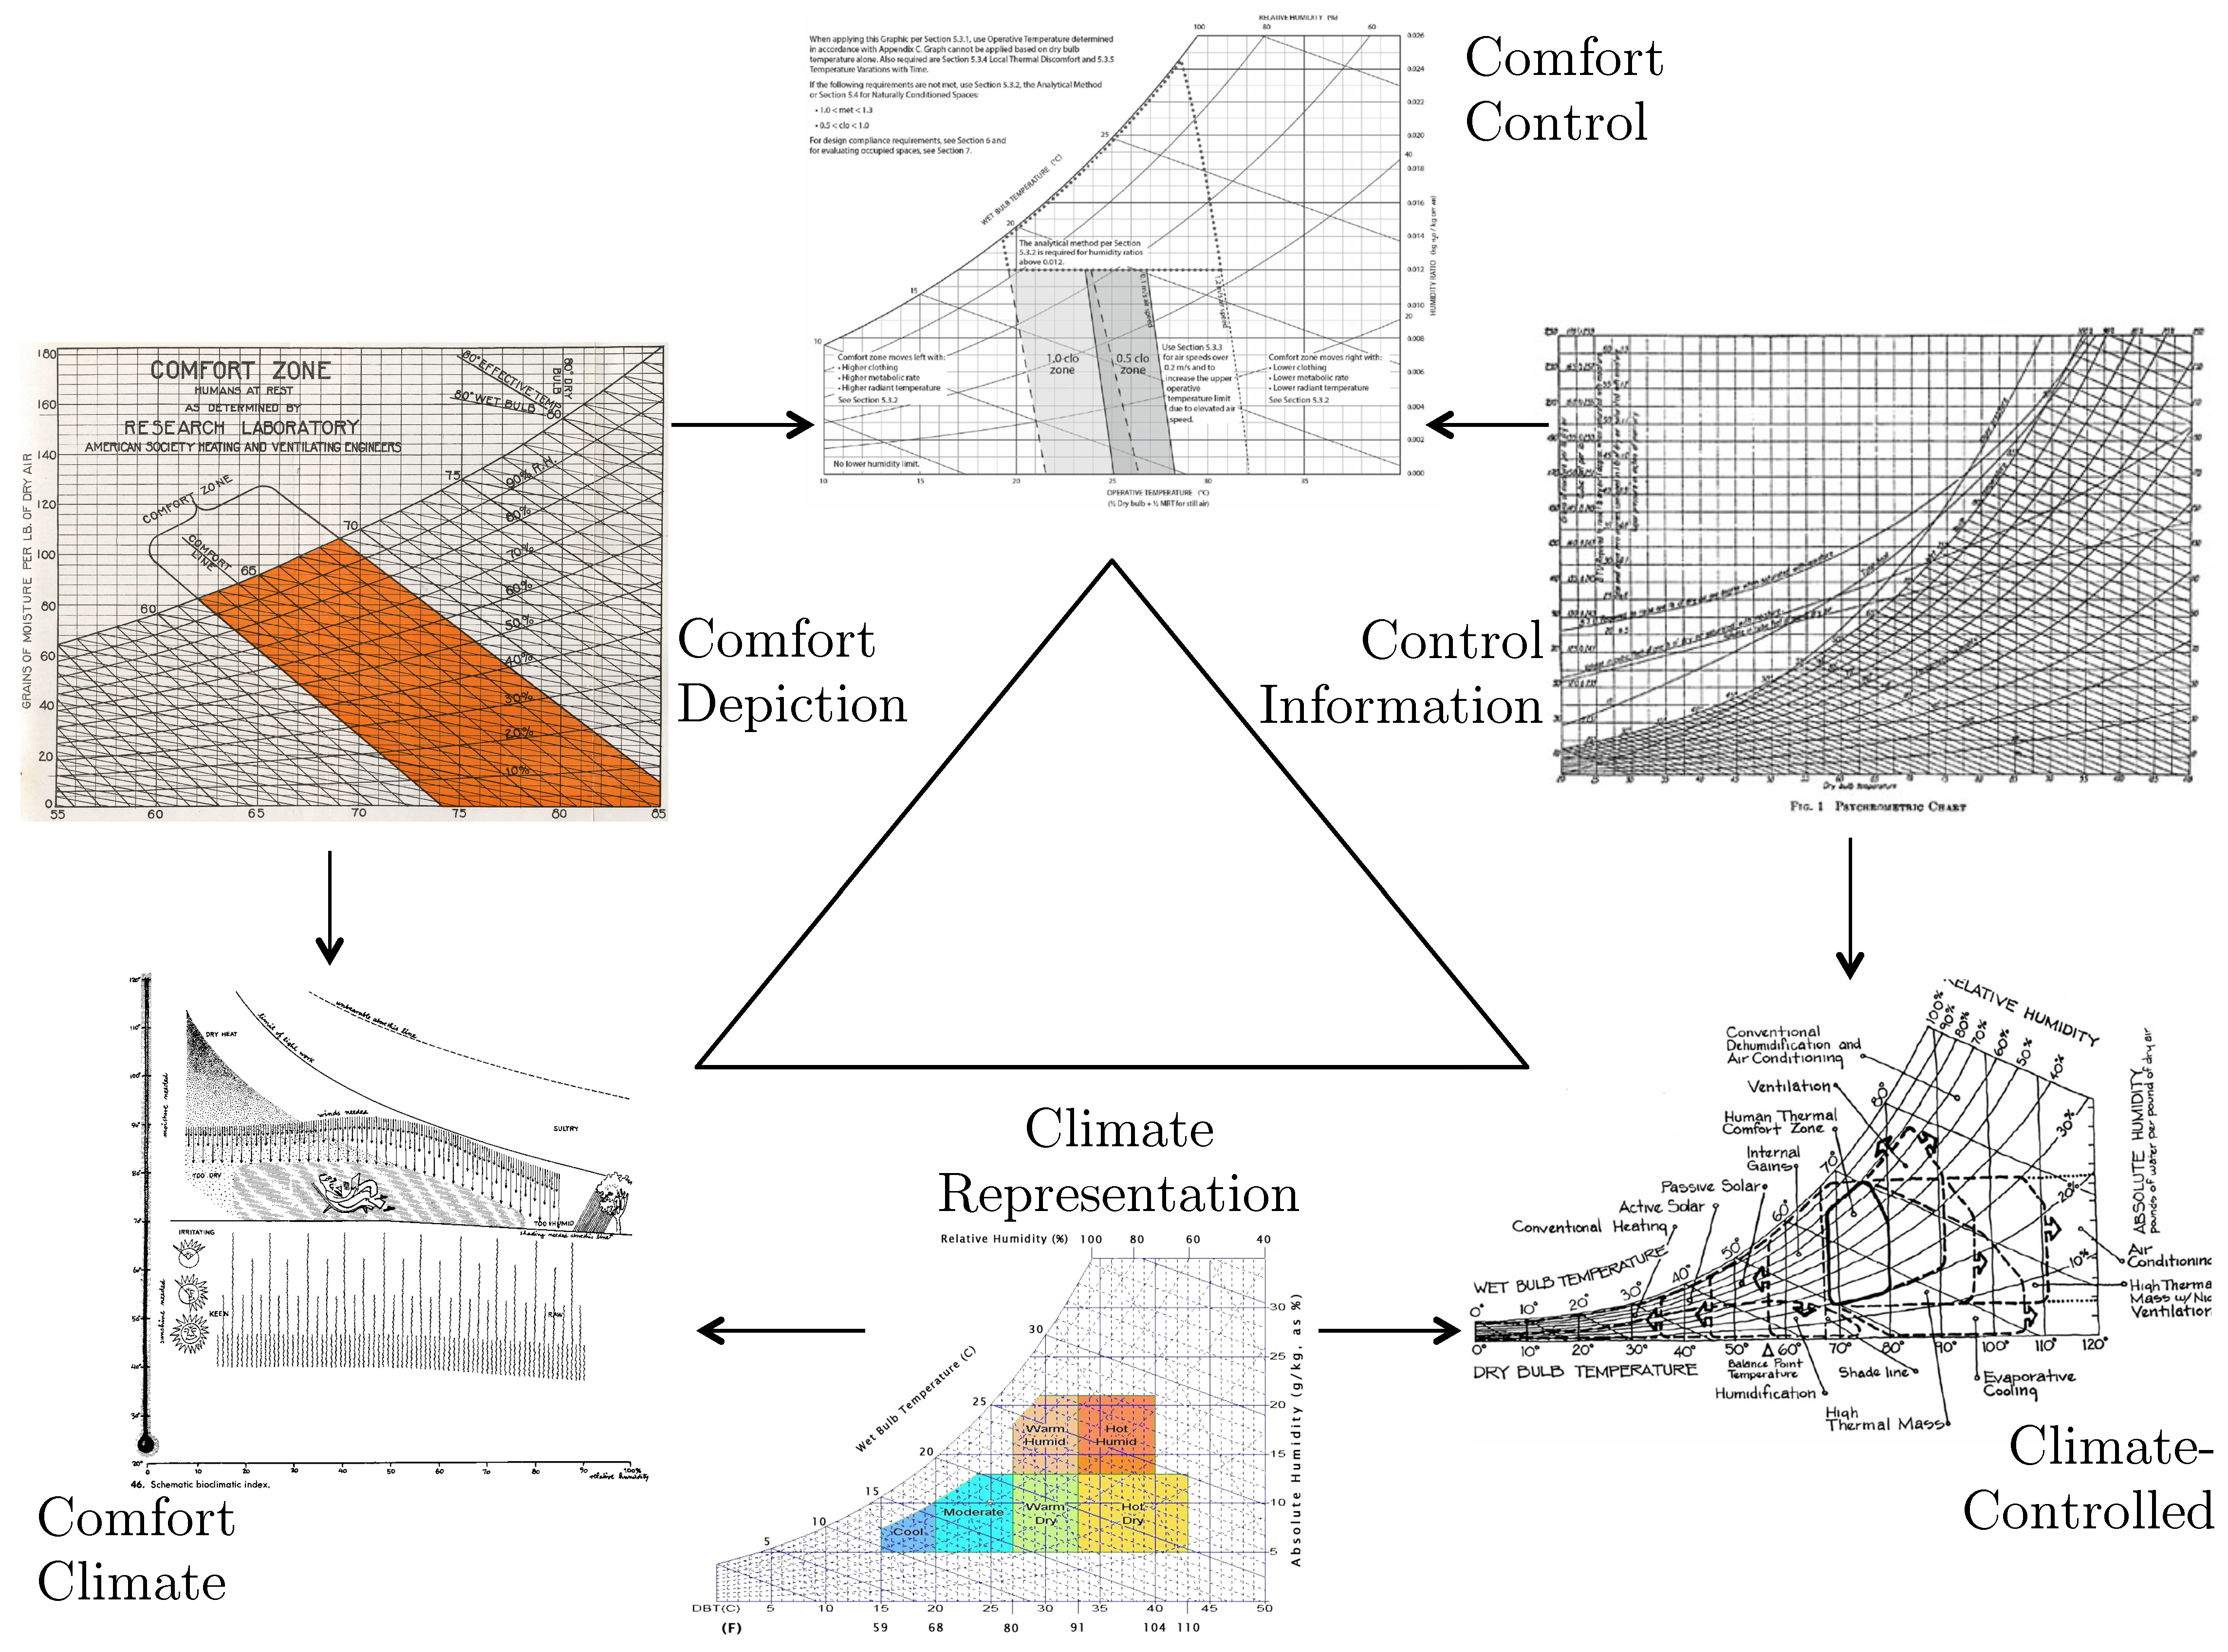
Highway to the Comfort Zone: History of the Psychrometric Chart

1
Cooling and Heating for Architecturally Optimized Systems (CHAOS) Lab, Andlinger Center for Energy and the Environment, Princeton University, Princeton, NJ 08544, USA
2
Building and Urban Data Science (BUDS) Laboratory, Department of the Built Environment, College of Design and Engineering (CDE), National University of Singapore, Singapore 119077, Singapore
*
Author to whom correspondence should be addressed.
Buildings 2023, 13(3), 797; https://doi.org/10.3390/buildings13030797
Submission received: 30 December 2022 / Revised: 3 March 2023 / Accepted: 10 March 2023 / Published: 17 March 2023
(This article belongs to the Special Issue Indoor Environment and Thermal Comfort Performance of Buildings)

Abstract

:
The psychrometric chart is the most common data visualization technique for the designers of thermal comfort systems worldwide. From its humble roots as means of expressing the characteristics of air in building systems design, the use of the chart has grown to include the representation of the zones of human thermal comfort according to both conventional and adaptive models. In this paper, we present an extensive history of this development and the fallacies with representing comfort simply as a box that sometimes moves on the chart. The origins of the link between refrigeration control and comfort control are examined through archival reviews, examining the works of Carrier, Yagoglou, and their contemporaries in the context of modern comfort mischaracterizations. A clearer understanding of the mapping of comfort, control, and climate metrics with psychrometrics is reported, and a critique of the conflation is reported to increase awareness of the limitations of such treatment of these three critical domains.

1. Introduction

Since its first use in 1911, the psychrometric chart has been the mainstay visual representation of air attributes for heating, ventilation, and air-conditioning (HVAC) design and operations. It started as a method of characterizing the properties of air as it moves through a comfort conditioning system. Unfortunately, the chart has been used in its current form as a means of assessing comfort in the occupied space. The chart can be misleading for designers and operations professionals in its primary emphasis on only two aspects of thermal comfort: sensible and latent energy of air. This paper gives an extensive overview of the birth, growth of use, and the ubiquitous use of the chart in most aspects of the comfort conditioning industry.
This paper begins by giving an extensive overview of the invention of the chart by Willis Carrier in the early twentieth century and its development over time. Section 2 gives this historical perspective in a detailed analysis of the original intentions of the chart, how it began to be ill-used as the primary means of comfort representation, and how modern thermal comfort frameworks and systems have rendered this representation obsolete in its current form. Remarks are provided to summarize the issues associated with abstractions of thermal comfort treated as absolute characterizations and the inaccuracies that result from using comfort indices rather than examining heat transfer itself. Concluding remarks are provided, summarizing the individual sections.
In preparing research for this paper, American Society for Heating and Ventilation Engineers (ASHVE) publications from 1910 through their merger with the American Society of Heating, Refrigerating and Air-Conditioning Engineers (ASHRAE) in 1959 were reviewed for mentions of thermal comfort studies, psychrometrics, and related frameworks. The authors were especially interested in studies that mapped comfort findings onto axes, especially the psychrometric chart. As much original thermal comfort research was done for industrial workers, studies were also taken from the Journal of Industrial Hygiene in the same time period. For contemporary literature, several seminal works for commonly cited indoor thermal comfort frameworks were explored.

2. History of the Psychrometric Chart

The study of thermal comfort in buildings is largely dependent on a seemingly unrelated body of work: the vapor liquid equilibria established between water and air. Practical considerations of this work are apparent in everyday life, such as interpreting the relative humidity, %RH, given in daily weather reports, or calculating the wind chill, both with significant intuitive implications for thermal comfort. To engineers, the continuous relationship between air temperature, T a i r , and %RH, known as psychrometrics, was towards the end of the 19th century the holy grail of mechanical engineering as large amounts of moisture in the air require greater energy input for vapor compression technology, and also reduce the effectiveness of swamp coolers [1]. These two technologies did not exist in their modern forms in 1911 when the first psychrometric diagram was published [1] by Willis Carrier, shown in Figure 1, but engineers had the foresight to fully understand the implications of these relationships on refrigeration in the twentieth century.
Several other chart formats were presented concurrently for representing vapor liquid equilibria in air. Synthetic air charts were popular during the 1910s [2], and the Bulkeley chart was proposed in 1926 [3] to supersede Carrier’s psychrometric chart as ASHVE’s official chart. The motion was put in place and seconded by Carrier himself [3], but at this point, his original psychrometric chart had already become ingrained in the comfort industry.
These early Carrier and Bulkeley studies were motivated by the invention of air conditioning, another heat engine that was now capable of delivering air at a maintained temperature, much like the human body thermoregulates its core temperature. Interestingly, the first version of air conditioning as we know it today was an ammonia chiller, a complex system with limited cooling performance. Because of this, the first writings on air conditioning for spaces were essentially “swamp coolers,” as we call them today. Swamp coolers operate by humidifying air while lowering the temperature through latent exchanges. The operation of both systems, swamp coolers and ammonia chillers, required specific sets of knowledge as to how the human body would feel comfortable when subjected to these manufactured climate conditions in addition to the energy demand for producing a desired volume of air at a given temperature through the condensation of moisture from the air [1].

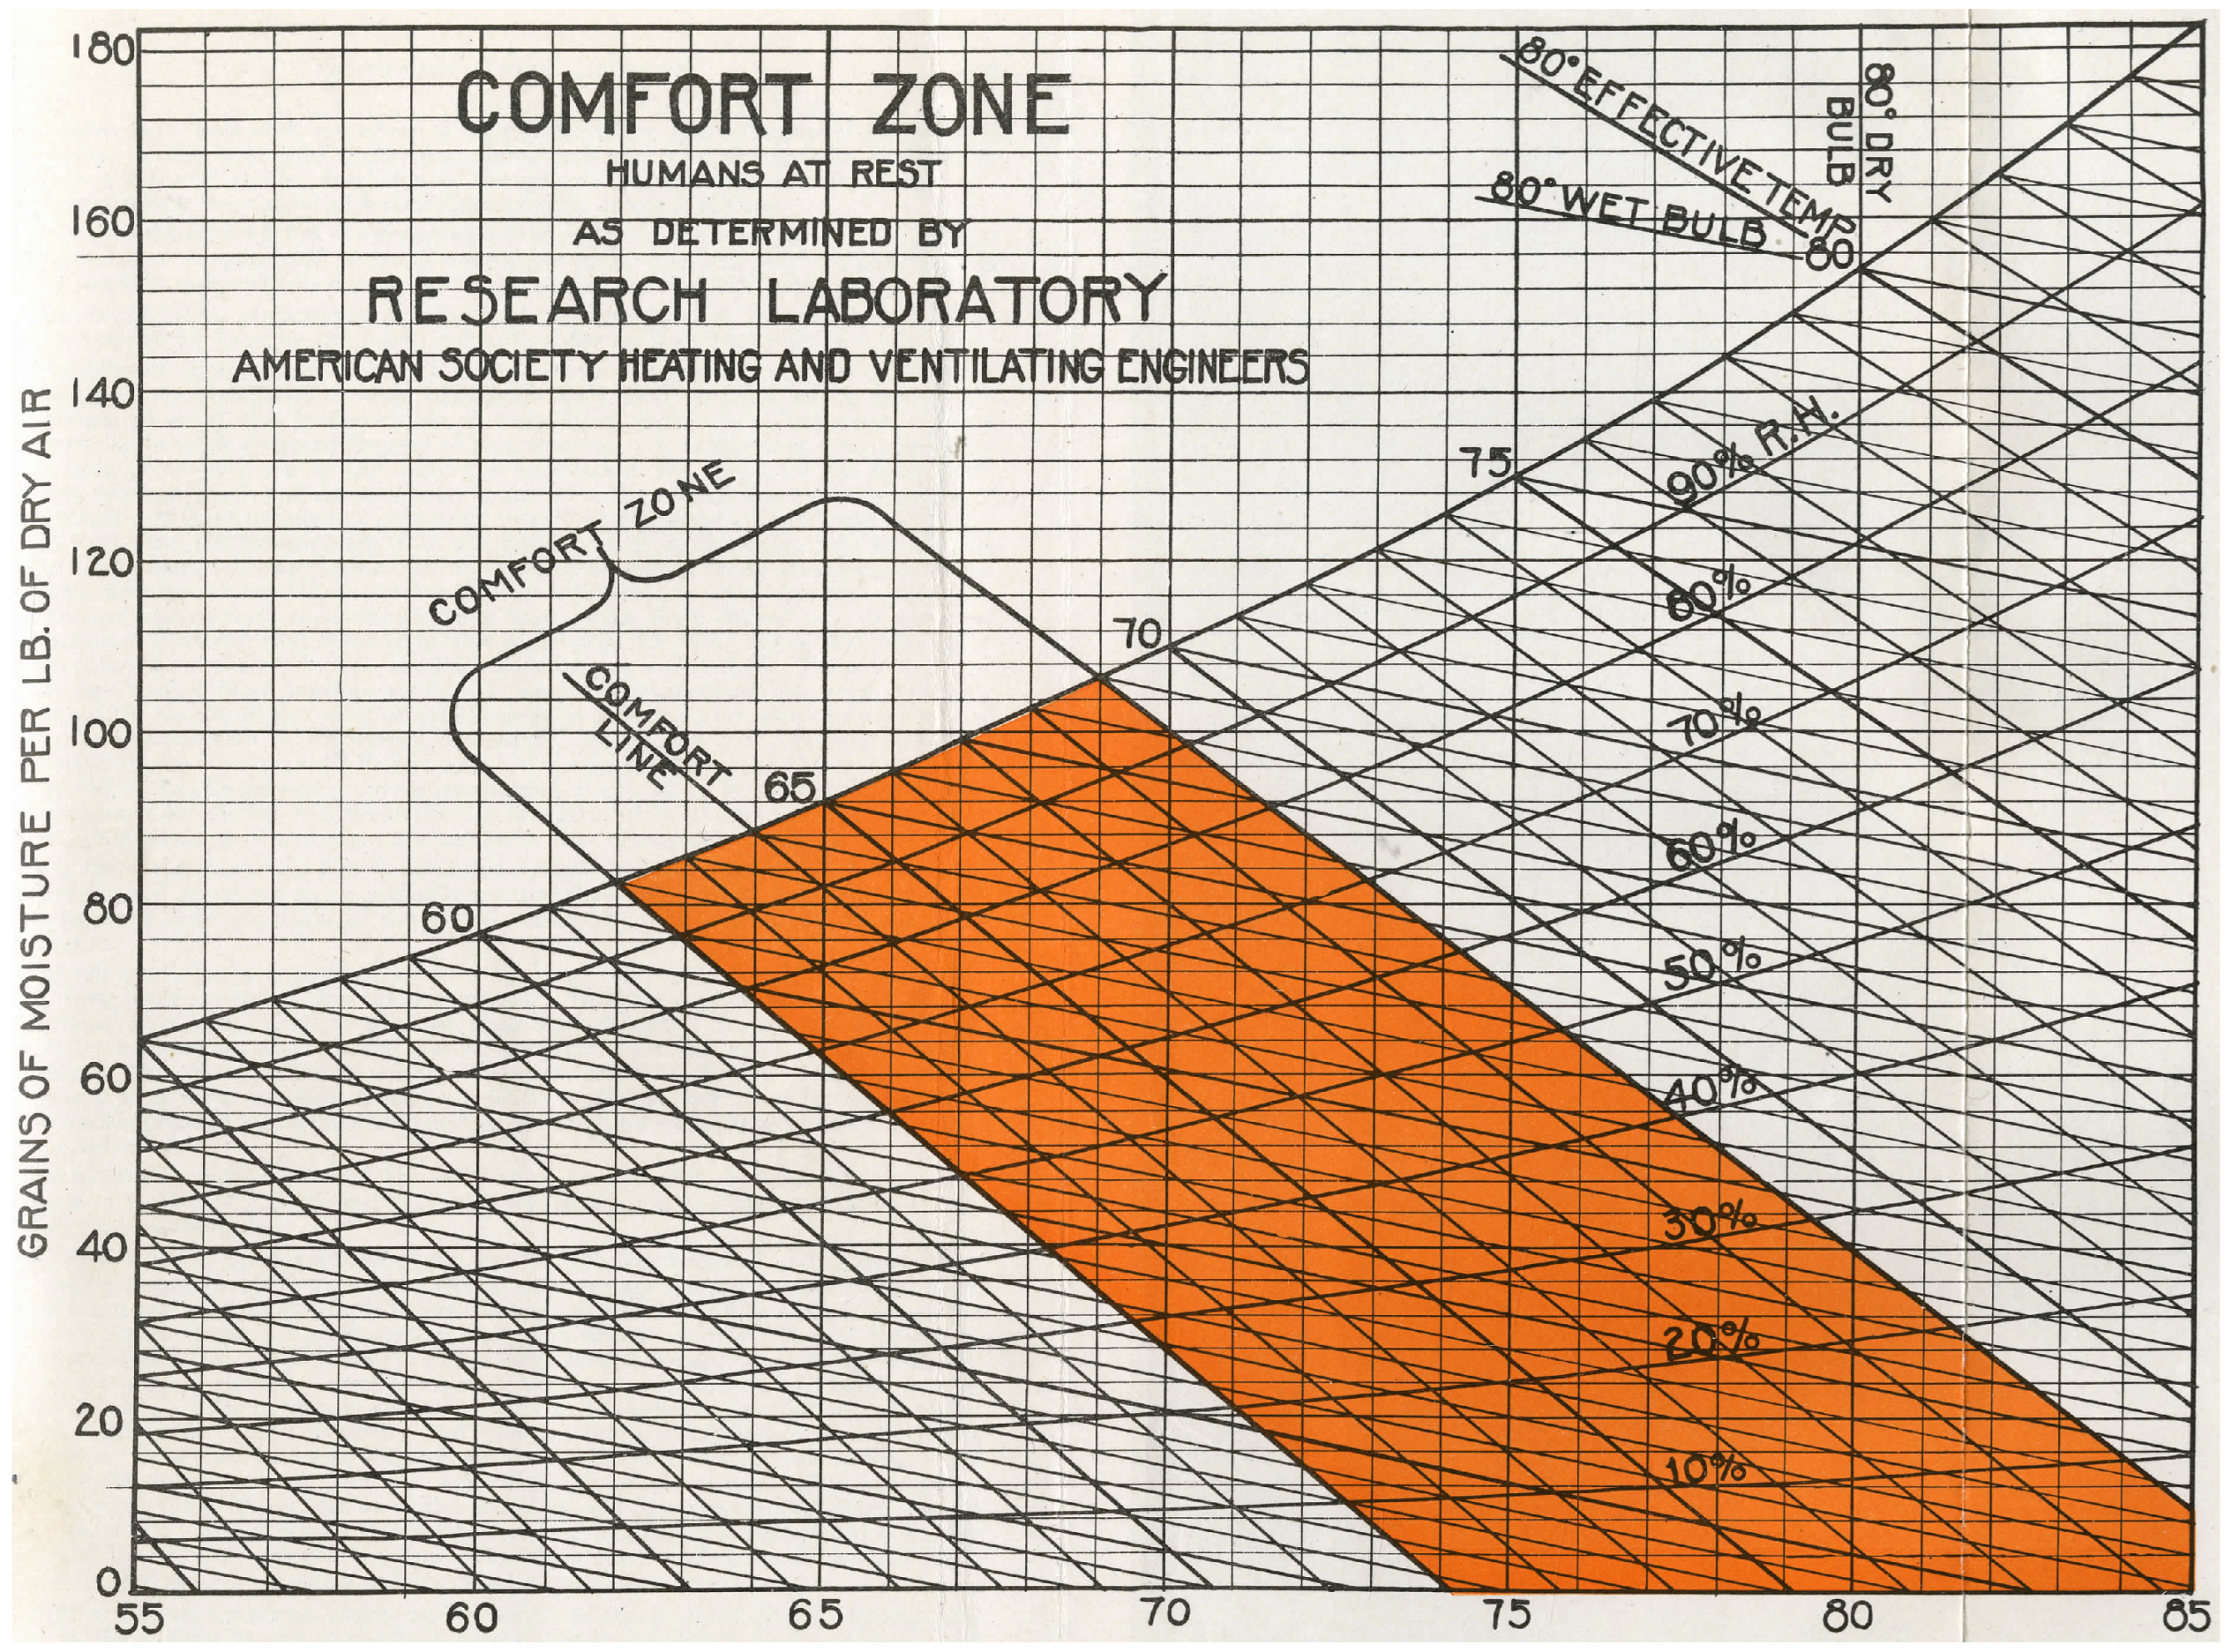
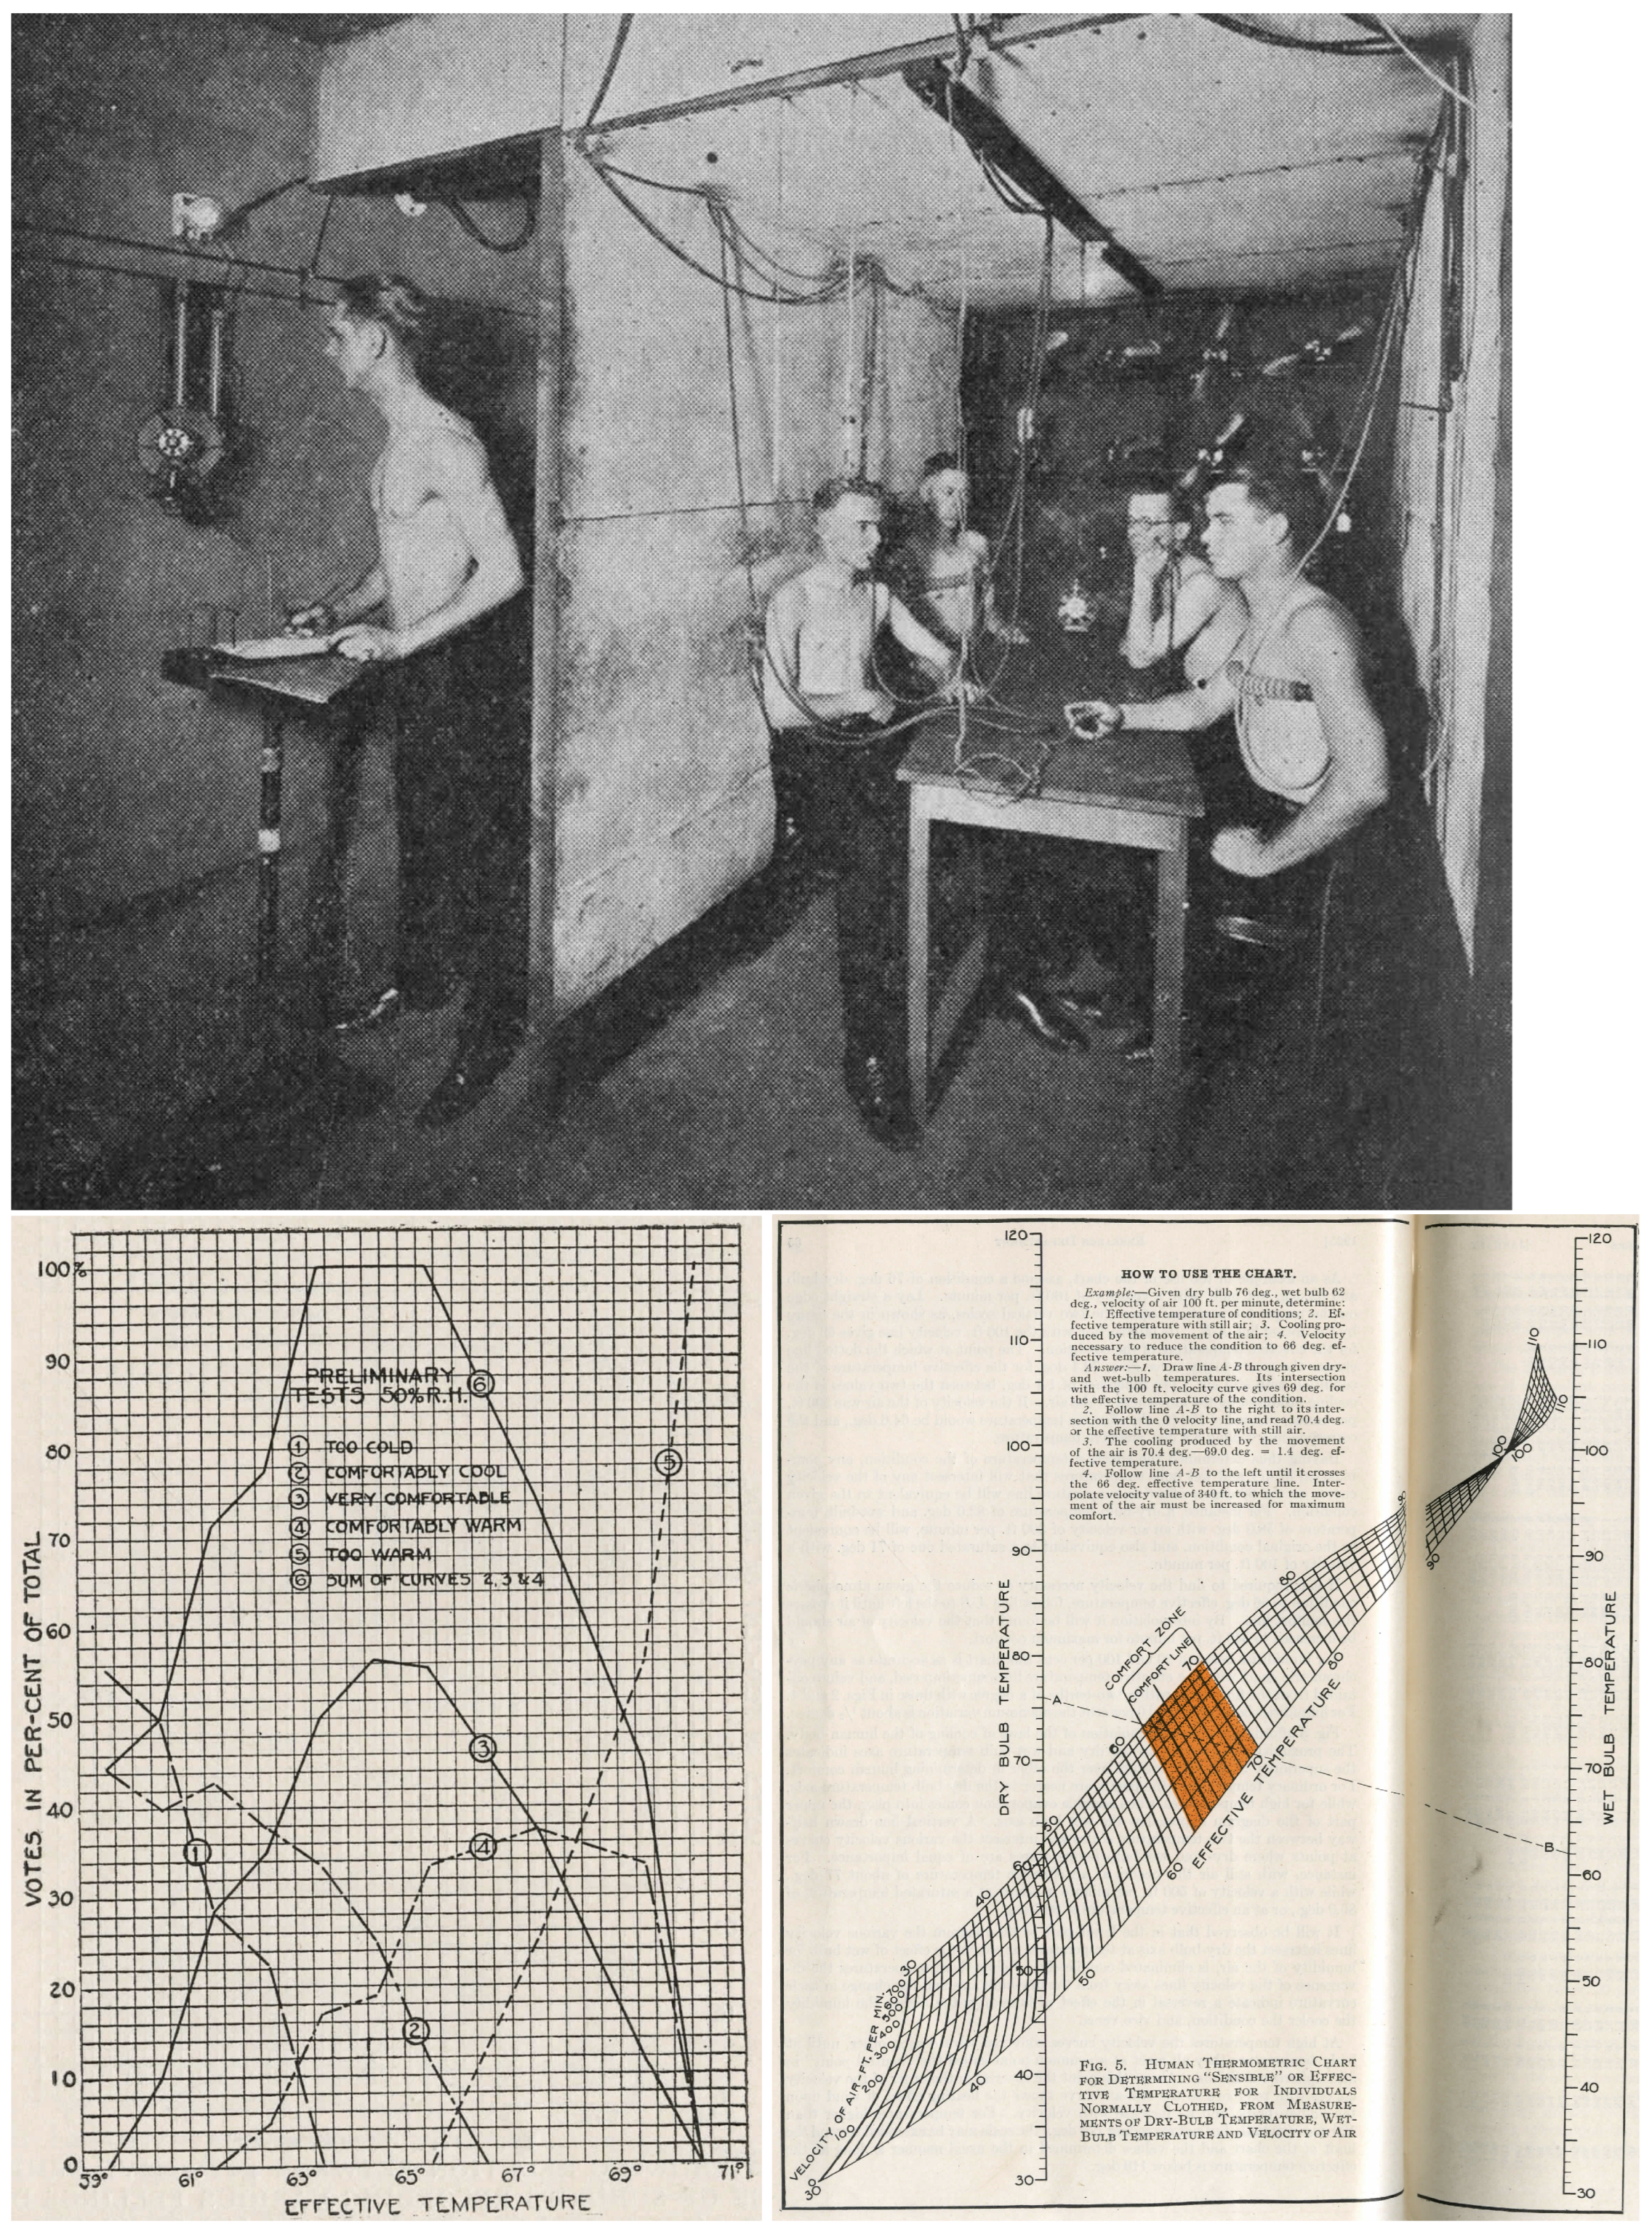
2.1. Conflation with Comfort

Not coincidentally, as scientists and engineers gained the ability to formally draw and calculate the spontaneous thermodynamic response of a body of water in contact with a dry atmosphere by moving along lines of constant enthalpy, the notion that the human body was no different fell into popularity. Almost immediately after the academic introduction of the psychrometric chart in 1911, thermal comfort studies seeking lines of “Constant temperature” or “Equivalent temperature” were conducted [4,5,6], which had the same theoretical underpinnings as the psychrometric constant enthalpy lines, whereby air temperature changes could be compensated by changes in relative humidity, or vice versa. The first version of such a chart is shown in Figure 2, with the diagonal lines that define the “Comfort Zone” representing a human’s equivalent temperature perception range, rather than the constant enthalpy lines of the atmospheric system in Figure 1. Such charts even began to borrow nomenclature, becoming referred to as “Thermometric” charts by 1925 [6].
Thermometric theory is elegant for many reasons. Humans, viewed as biological heat engines as early as Lavoisier in the late 18th century [7], combined with Carnot’s wisdom that engines must dissipate heat [8], led to the notions of thermal comfort being described simply as an equivalence between heat generated by the human body and heat removed by the environment. These thermometric charts [6] mimicked the notion that the human body responds both to changes in relative humidity and air temperature, which, while not wrong, was incomplete. Unfortunately, this incomplete interpretation of comfort, inherently limited in its degrees of freedom by the success of the psychrometric chart for controlling refrigeration systems, persists today. Such frameworks do not factor in other variables such as the radiant exchange between the refrigerator and its surroundings to be properly controlled.

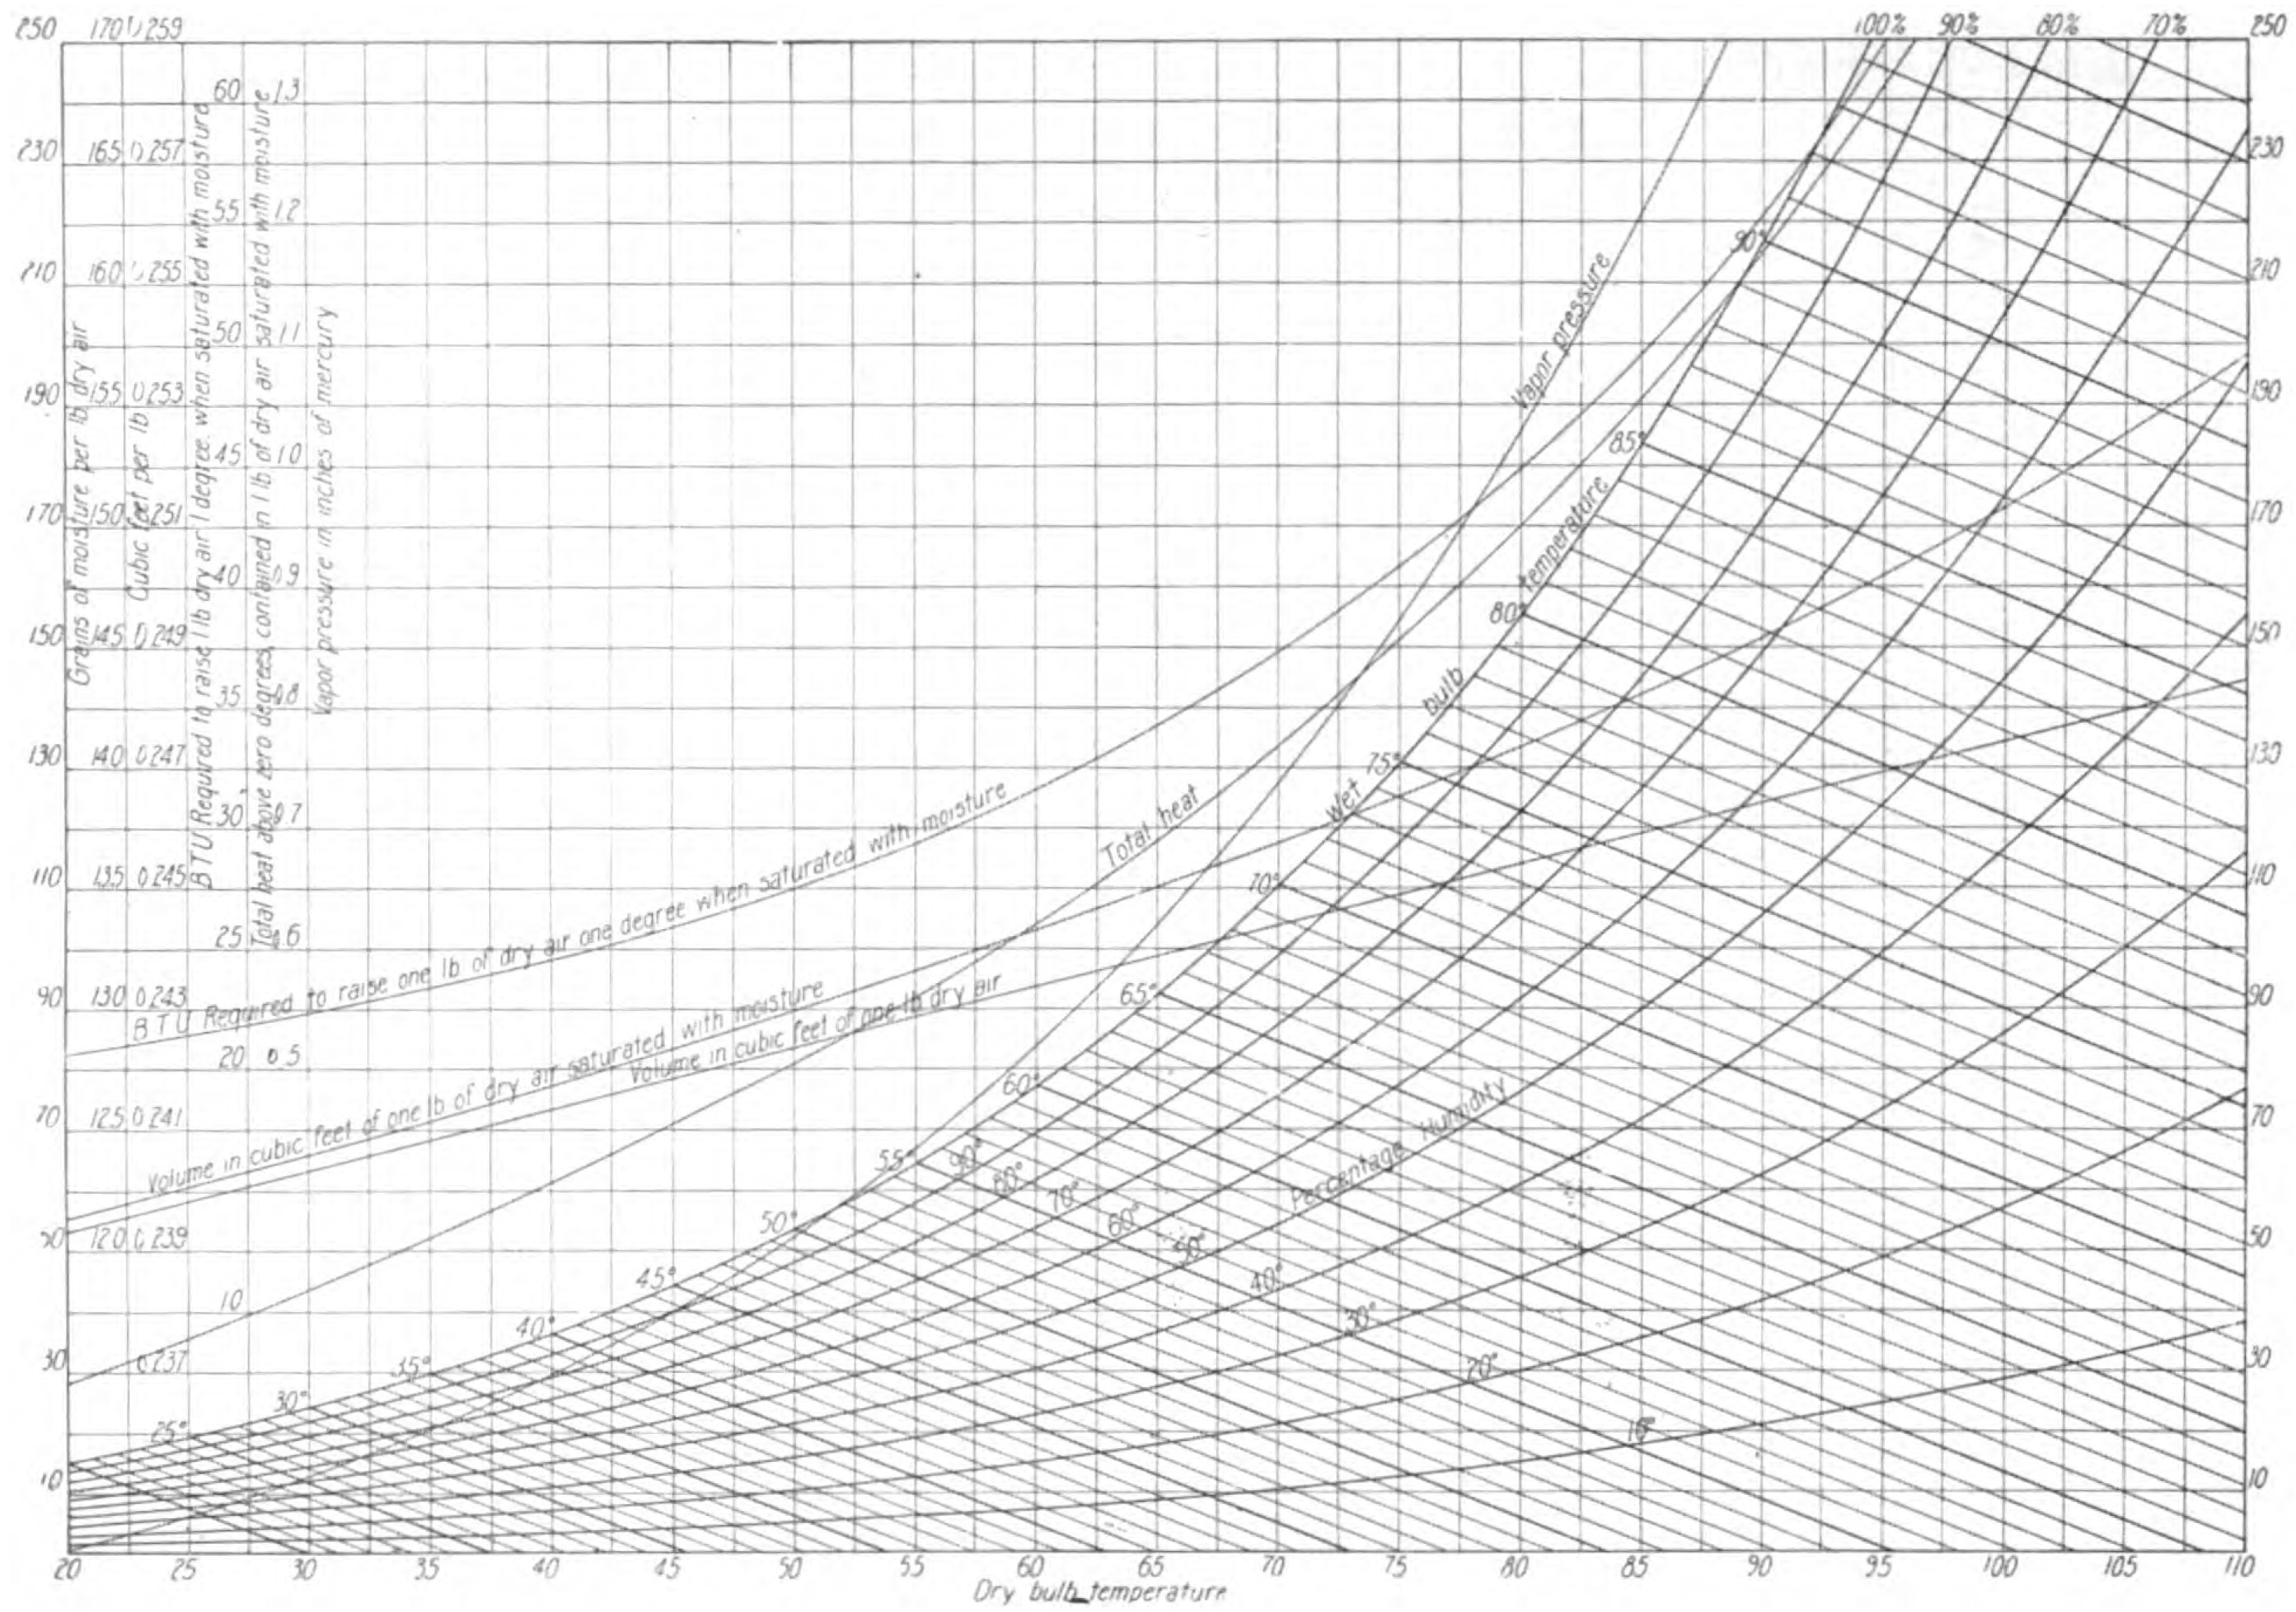
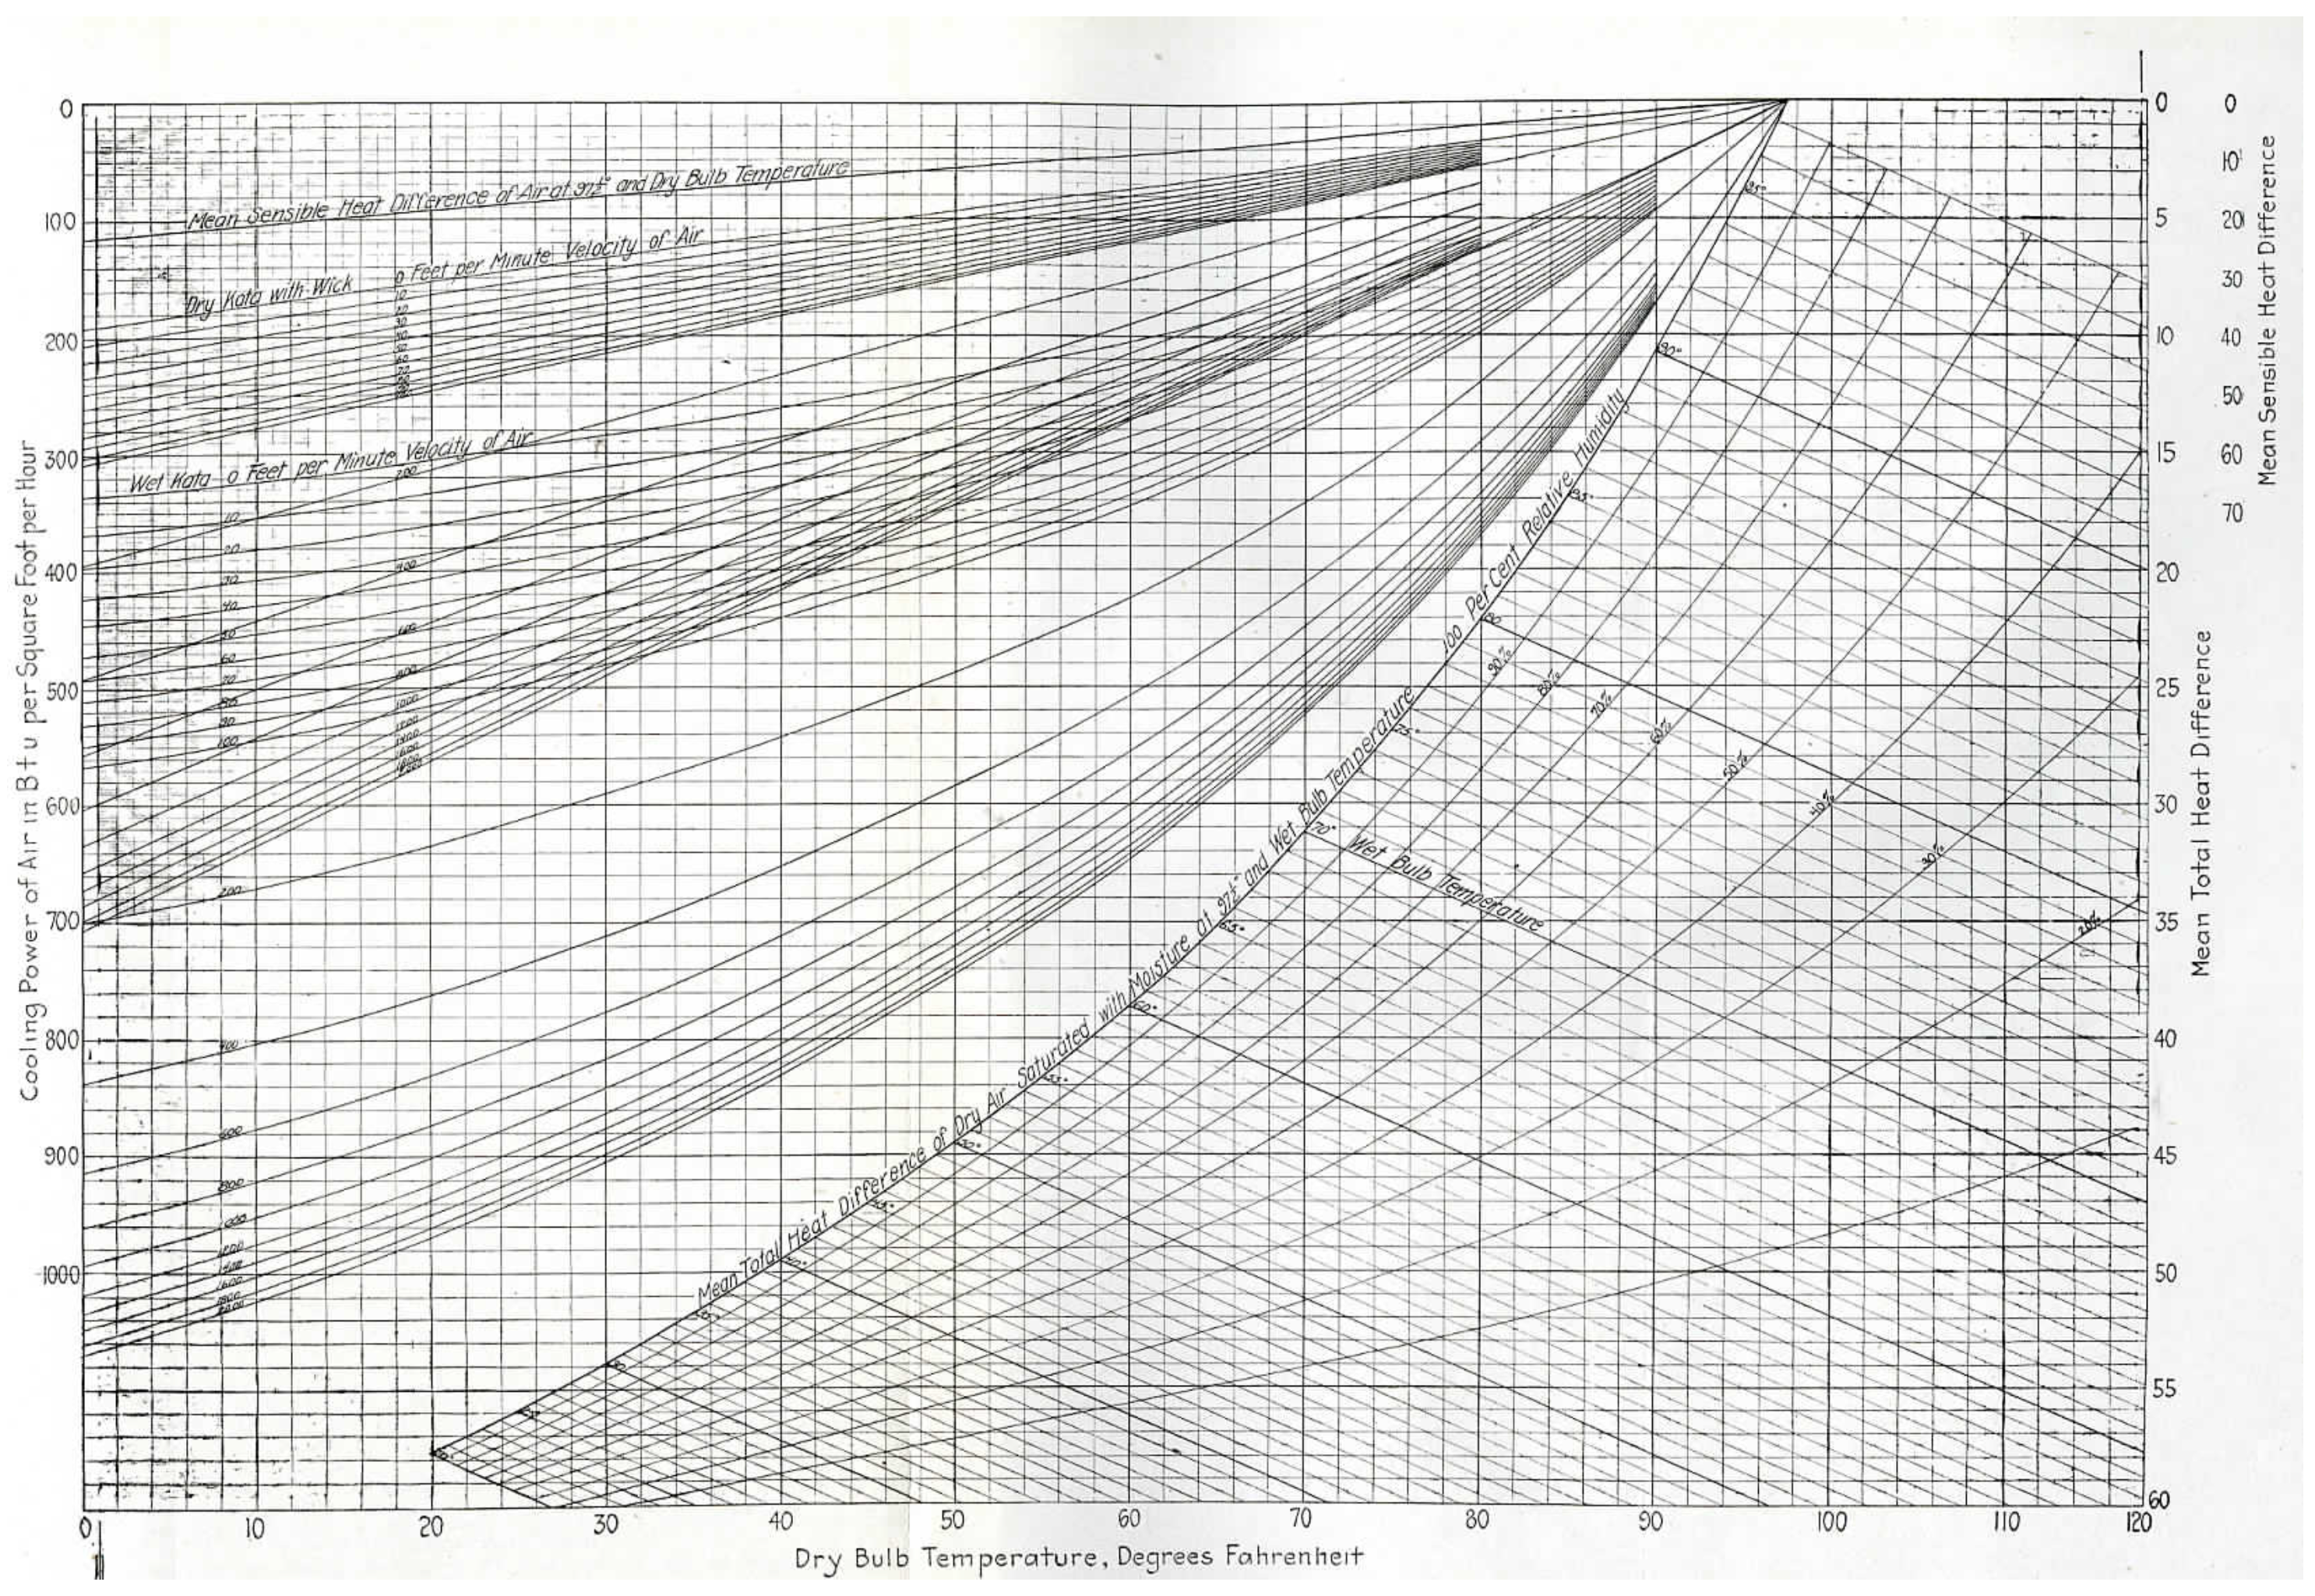
2.2. Reconciling Other Variables

Since humans are convectively and evaporatively connected to the atmosphere, data from controlled experiments did agree well with thermometric logic from experiments measuring latent (involving water vapor) and sensible (heat transfer only) exchanges between the body and the environment. Specifically, air at 22 °C and 50% relative humidity (%RH) should feel warmer than air at 22 °C and 40% RH because of the higher potential for latent heat transfer in the drier air stream. Studies were performed to understand the way the human body underwent exchanges with the environment, maintaining constant comfort conditions.
Data were often noisy and produced in environments of questionable thermal stability. For example, Figure 3 shows the experimental setup, data, and output of the first found attempt at rigorously deriving the thermometric framework with forced convection [6]. However, the interpolation of the noisy data into the clearly delineated comfort zone in Figure 3 is questionable (although this chart is still shown in the modern ASHRAE handbooks [9]).
However, Yagoglou and Miller’s [6] work on including forced convection into a human thermal comfort landscape was profound, as it represented the first attempt at empirically correlating variables, aside from just air temperature and relative humidity, that influenced thermal comfort within a meaningful framework. Their research gave way to similar subsequent studies [10] and were likewise among the first to begin questioning the psychrometric framework associating human thermal comfort with air-side controls. As many authors in this time period eluded, thermal comfort is influenced by many factors, and in fact, the exact ratios between convection, conduction, and evaporation the body experienced under steady-state conditions were calculated [11]. In fact, Yagoglou writes [11]
The greatest regulation is done on the heat loss side principally controlled by the amount given off by radiation, by convection, and by evaporation of moisture from the surface of the body. The relative loss by these means will naturally depend upon the temperature difference between the body and surrounding air and objects, the humidity, and velocity of the air… With saturated air at body temperature heat loss becomes impossible as a result of which the temperature of the body rises.
which is in stark contrast to the overall sentiment of the American Society of Heating and Ventilating Engineers (ASHVE) as seen in their 1926 transactions [12], just two years after Yagoglou’s writing, and coincidentally at the end of Yagoglou’s professional relationship with ASHVE.
This scale of equivalent temperatures is a true index of a person’s feeling of warmth for all combinations of temperature, humidity, and air motion and determines all physiological effects produced, and hence it has been called a Scale of Effective Temperatures
The choice of independent variables such as air temperature and relative humidity for thermal comfort signifies a strong relationship between refrigeration controls and human thermal comfort, as the field tends to hone its understanding of air-based variables, neglecting others.
The ability to sense other variables was available, and therefore the negligence was not due to difficult measurements. Armspach and Ingels wrote a beautifully formulated study focusing on the Kata thermometer invented by Leonard Hill, and assessing the cooling power of air in different radiant temperature environments, among others [13]. The output of the study was an annotated psychrometric chart demonstrating the difference in the cooling power of air in different environments, Figure 4. The study occurred in 1922 and was quickly forgotten.
Yet the study includes a succinct and complete description of considerations for radiant heat transfer in buildings [13].
Radiation-(a) Temperature of surrounding walls and objects; (b) Amount of window area; (c) Proximity and temperature of radiators, cooling coils and other high or low temperature sources of heat; (d) Clothing; (e) Temperature and humidity of air.
Subsequent studies published in the Journal of Industrial Hygiene [14,15] looked at the role of radiation in thermal comfort, and questioned some of the climate studies performed by Yagoglou and Houghton primarily. Yagoglou typically responded directly in print to these criticisms [16] demonstrating the completeness of his work, and subsequently the influential ASHVE body of work was not superseded within ASHVE itself.
In 1932, Vernon replaced the dry bulb thermometer with the black globe thermometer explicitly with the intent of measuring the effect of radiation on thermal comfort [15,17]. In addition, Bedford’s seminal paper introducing the black globe thermometer specifically in the context of measuring the mean radiant temperature pointed out that the black globe alone was not sufficient to establish comfort and developed an equivalent temperature framework for air velocity, globe thermometer temperature, and air temperature [18]. However, since radiation was again considered a fixed parameter, this analysis was considered most useful for studying the deviation of measured equivalent temperature from the theoretical comfort zone. There was a paper by Carrier and Mackey in 1937 that corrected the original psychrometric data for radiation exchange not considered in the original study [19], an example of standards adopted in the field without subsequent literature-based critique.
These alternative measurement techniques form the established ASHVE standards were popular in fields such as industrial hygiene and biometeorology because of their ability to measure heat fluxes from radiation and evaporation more directly. Yet the desire to maintain a common language and diagrammatic tool between the industries creating comfort systems and the installation of these systems was strong. In particular, because none of these studies viewed radiation as an independent variable for comfort regulation, it seemed as if a two-dimensional comfort landscape was sufficient for describing the modulations available to maintain thermal comfort in buildings, sometimes adding a third dimension in air velocity if required.
Fanger in the 1970s published several seminal works attempting to rethink thermal comfort including all thermal comfort variables, namely air temperature, relative humidity, mean radiant temperature, clothing level, air velocity, metabolic rate, and skin wettedness [20]. His development of the predicted mean vote, whose origins can be found in earlier articles [21], was consequential to the state of the HVAC industry through the present day. Similar to Bedford’s development of an equivalent temperature framework that included radiant temperature, Fanger’s plots represent thermal comfort frameworks that iterate through all variables, although each representational framework is limited by the dimensionality of monochromatic illustrations. Such a framework is not designing with comfort directly, but instead designing for a comfort setpoint.
It is important to note that Fanger’s primary research was conducted abroad at the Technical University of Denmark and therefore was physically isolated from the American societies fostering the globalization of air conditioning. We can speculate that Fangers’s research was not viewed holistically by manufacturers developing air conditioning technology contemporaneously.
Not surprisingly, pushback was conveyed within the same representational framework. Victor Olgyay published in 1963 “Design with Climate” which was a direct response to the popularization of manufactured air that was central to the modernism movement. However, the charts [22] which studied four representative climate scenarios around the United States were often based in psychrometric axes. While not truly conforming psychrometric charts, they were clearly recognizable as a relationship between humidity, temperature, and comfort. Radiation was cleverly added as a limit for requiring shade in certain climatic conditions, and a contour relating to metabolic rate was also included, indicating when light work was acceptable, for instance. Such a relationship allowed architects to design with the local climate, through the system dynamics between humans and environments.
More technical research was conducted by Baruch Givoni [23,24], and practical systems consideration was generated as a function of annual climate for a site. Again placed on a psychrometric axes, these bioclimatic charts are a beautiful conflation of climate and control, attempting to harmoniously derive comfortable building situations through spontaneous thermodynamics. Both Givoni’s and Olgyay’s charts are referenced in the contemporary literature [25,26,27].
Yet the general critique of each of these diagrams is the inherent limitations of representing thermal comfort variables in two- or three-dimensional space. Through the history of these comfort representations, air and relative humidity have been selected as the major contributors to thermal comfort. Consequentially, architects no longer engage with the other dimensions, and instead of solving problems related to thermal comfort intuitively, we are stuck in the 2D psychrometric landscape. Figure 5 summarizes the limitation of architecture, by demonstrating the permeation of psychrometrics through the controls, climate, and comfort domains. The drive to have a consistent language and representation decision framework is important when computing power is minimal, but this is not the case in today’s world. Since computing power is now easily accessible, rather than consulting 2D charts for comfort ranges, integrating comfort simulations in the design process taking into account CFD, ray tracing for thermal radiant heat transfer, etc., can be achieved. Such a design-stage approach to comfort systems allows architects to regain control of the thermal performance of their designs.
Further, these steady-state frameworks fail to address the dynamics of thermal comfort, from walls and floors that change temperatures under solar loading, varying wind velocities, different skin wettedness values in transitional zones, etc. Moreover, rather than developing more 2D representational frameworks for design, the road maps of the future should be holistic computational models for generating holistic architectural and engineering solutions through programming, geometry, and thermodynamics. Through time, the systematic reduction of the comfort landscape, discarding air velocity, surface temperatures, and clothing as variables, perpetuates an oversimplified approach to thermal comfort, and we must design adequate computational road maps for moving forwards, bridging gaps in data collection, decision-making, and design, and returning thermal agency to the architect.

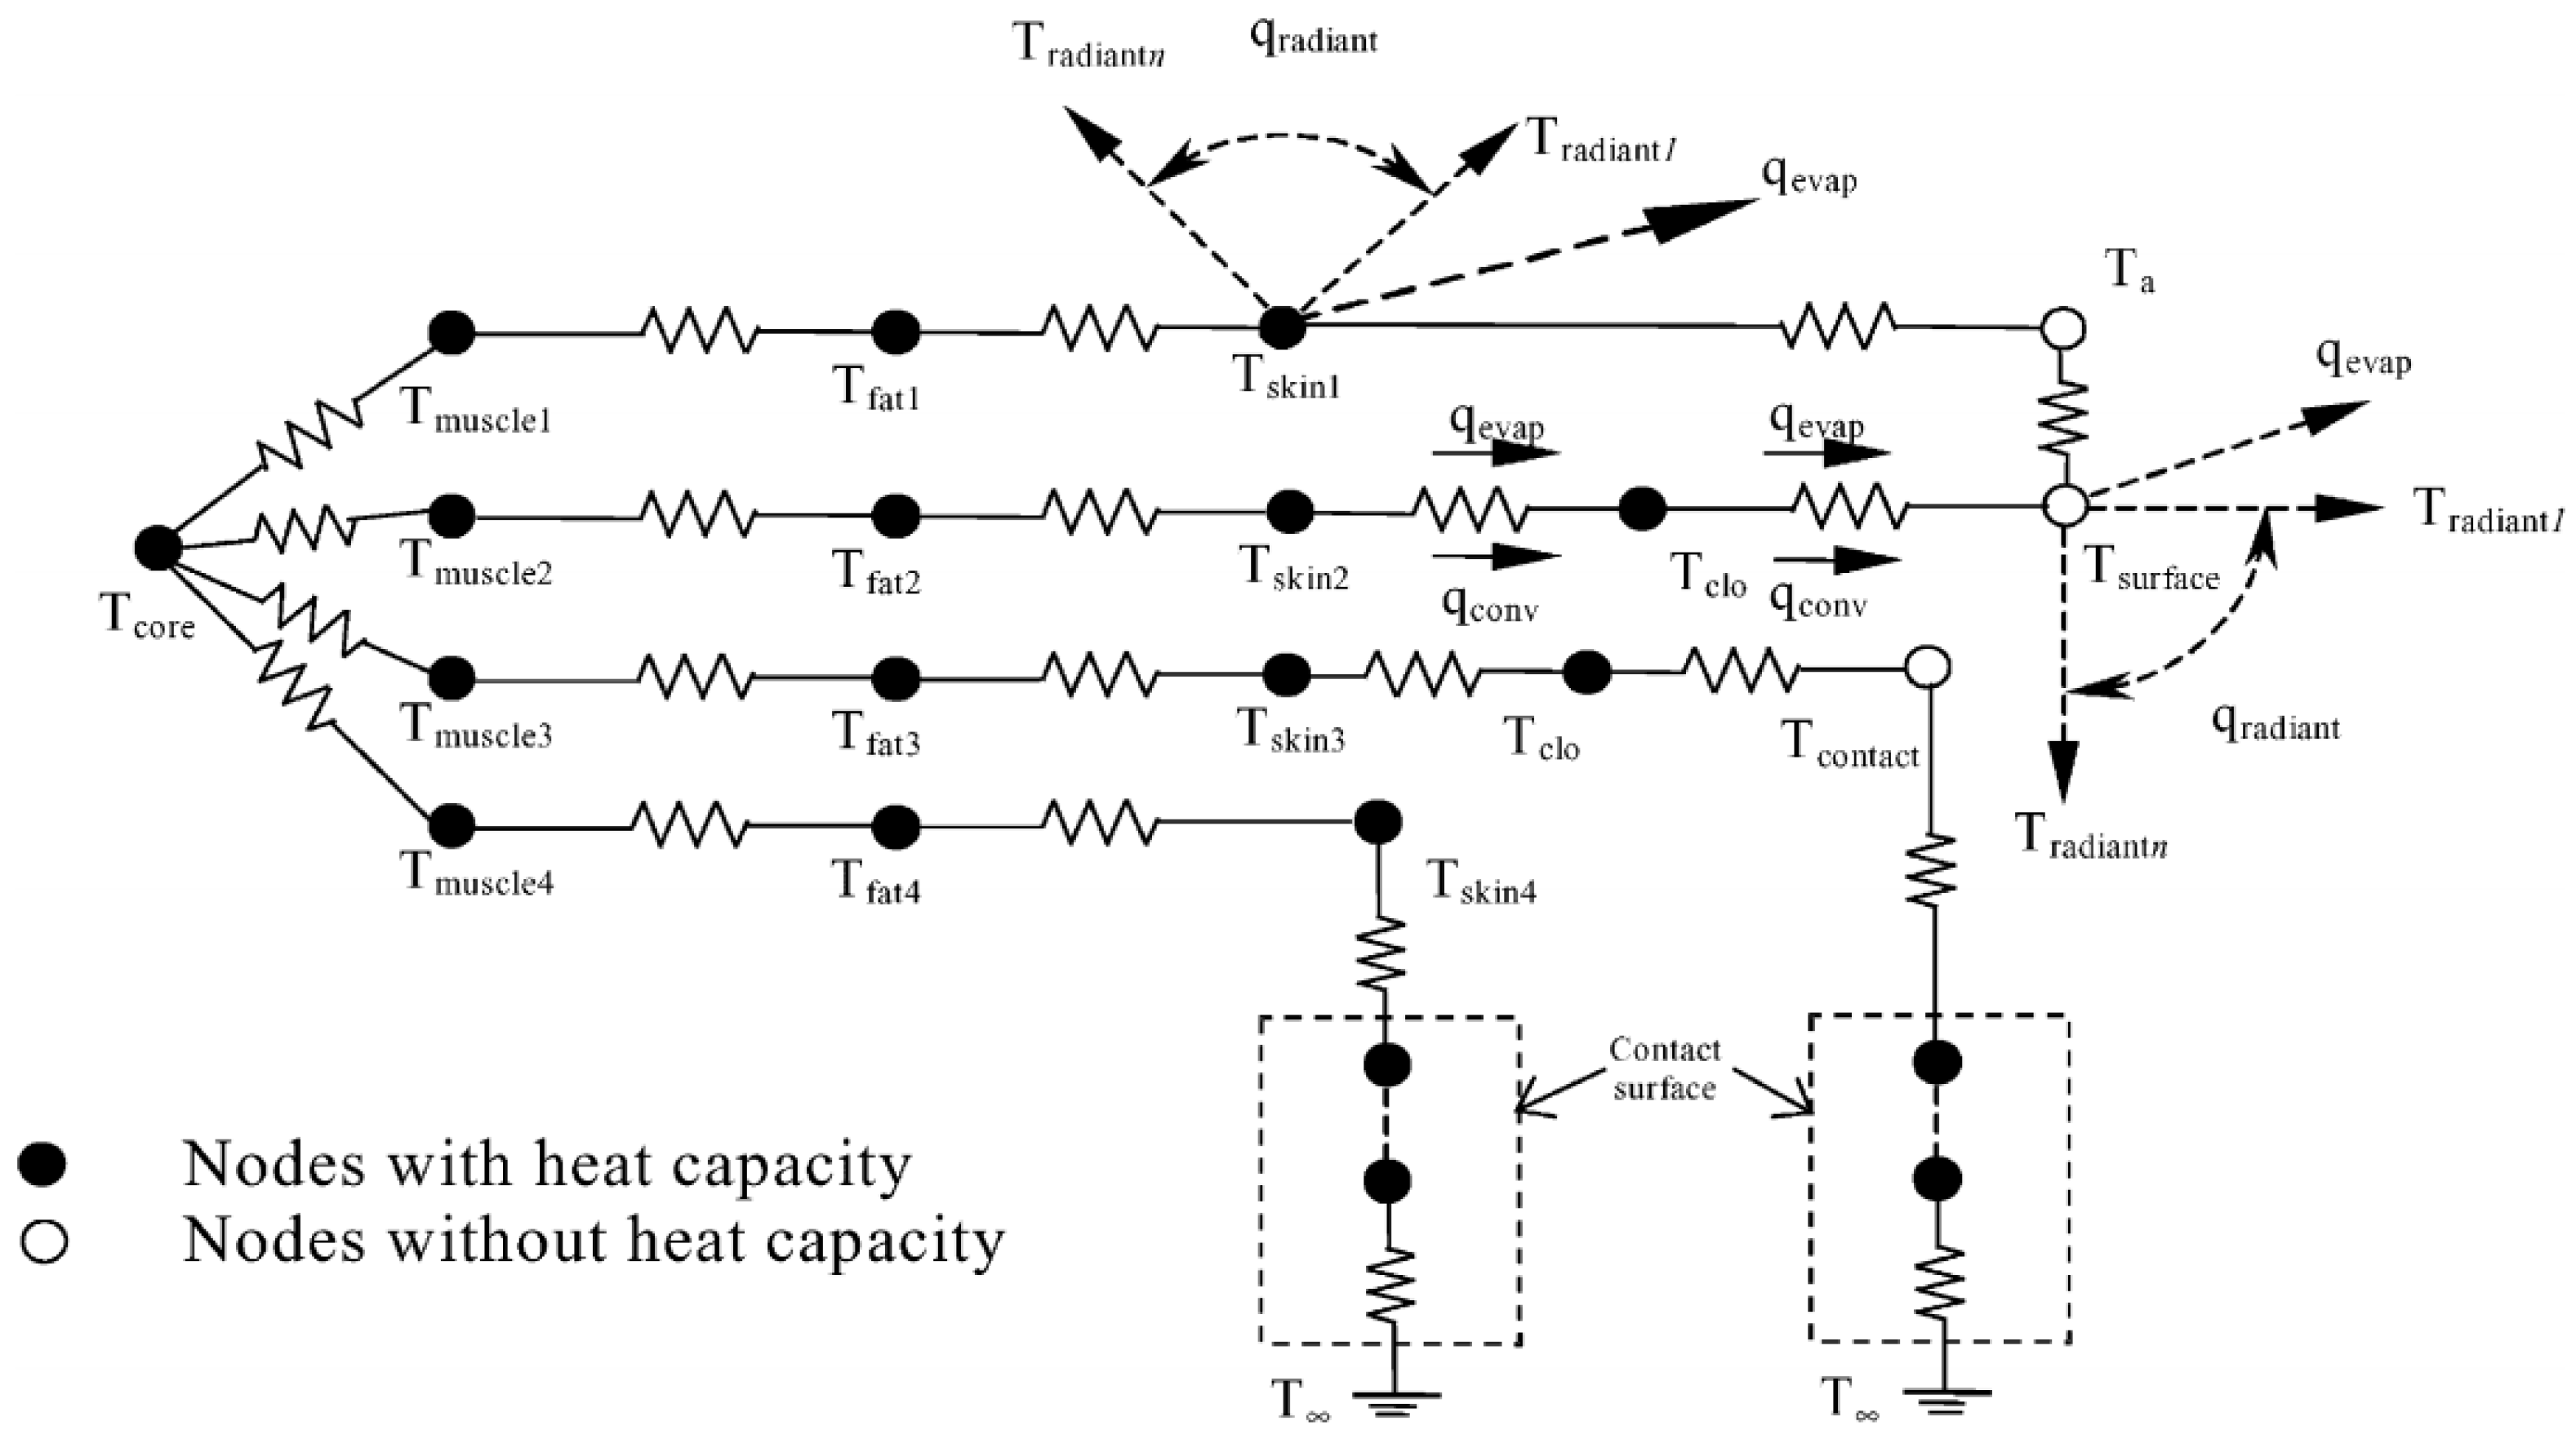
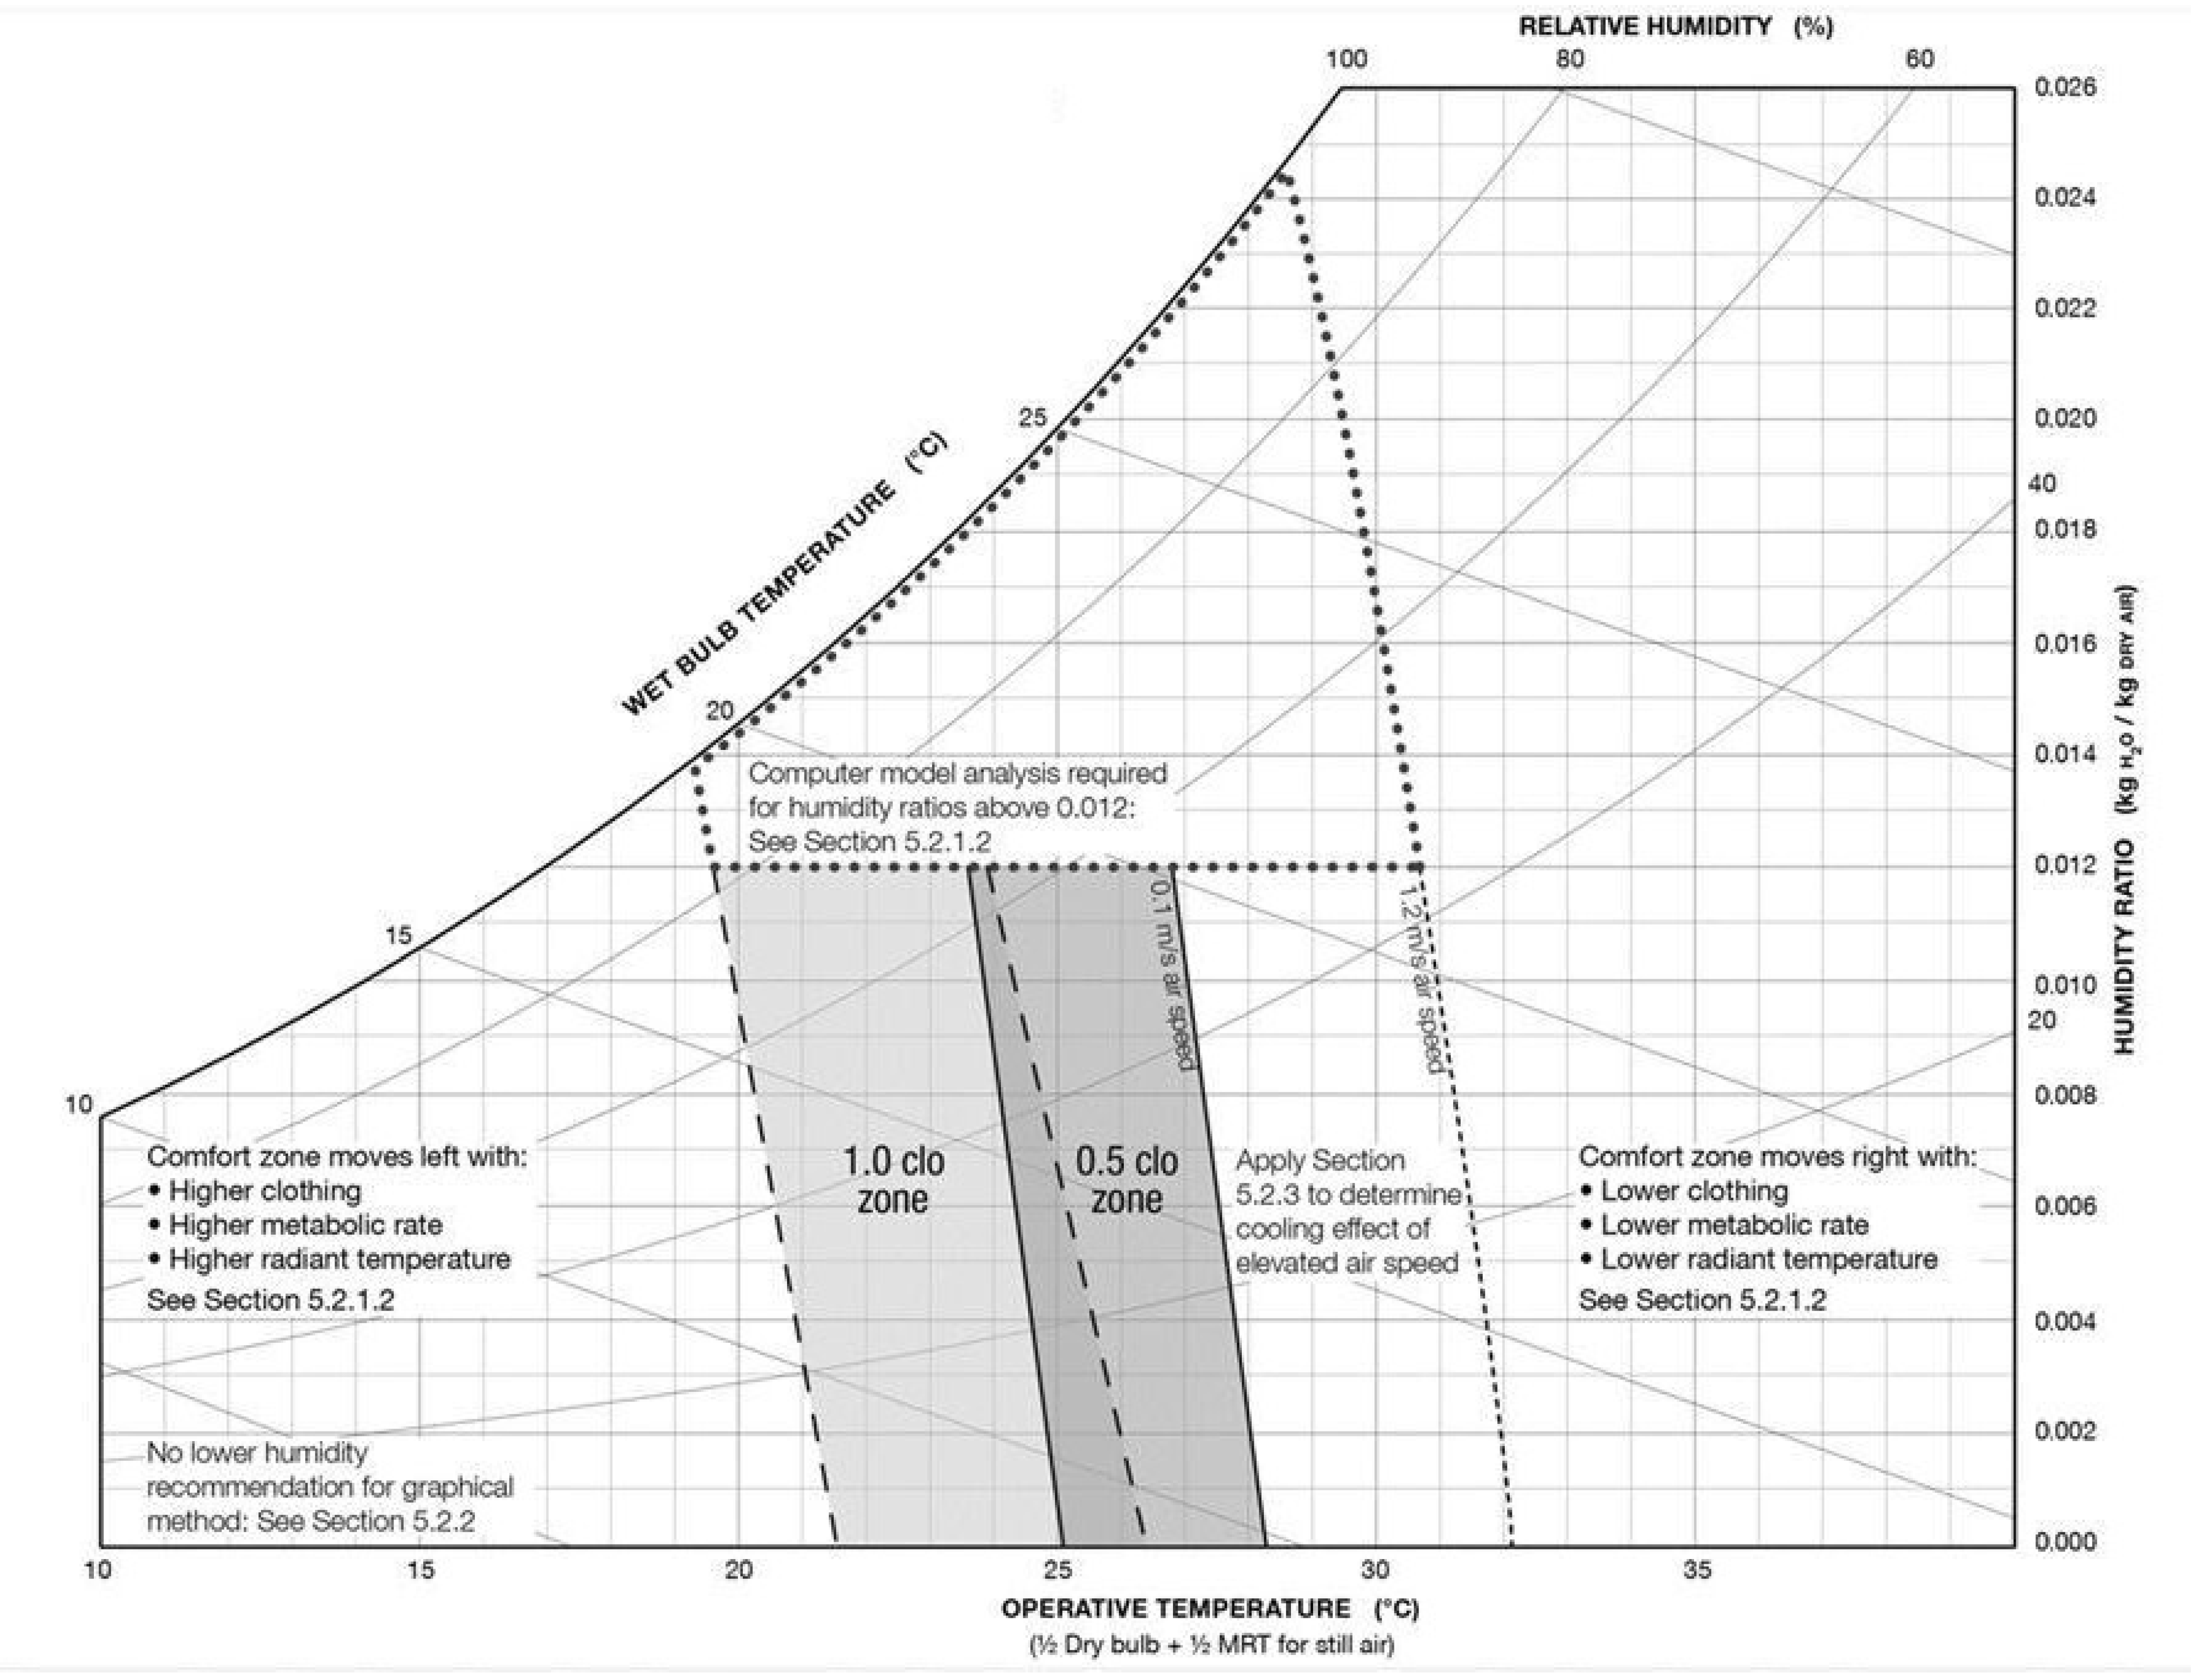
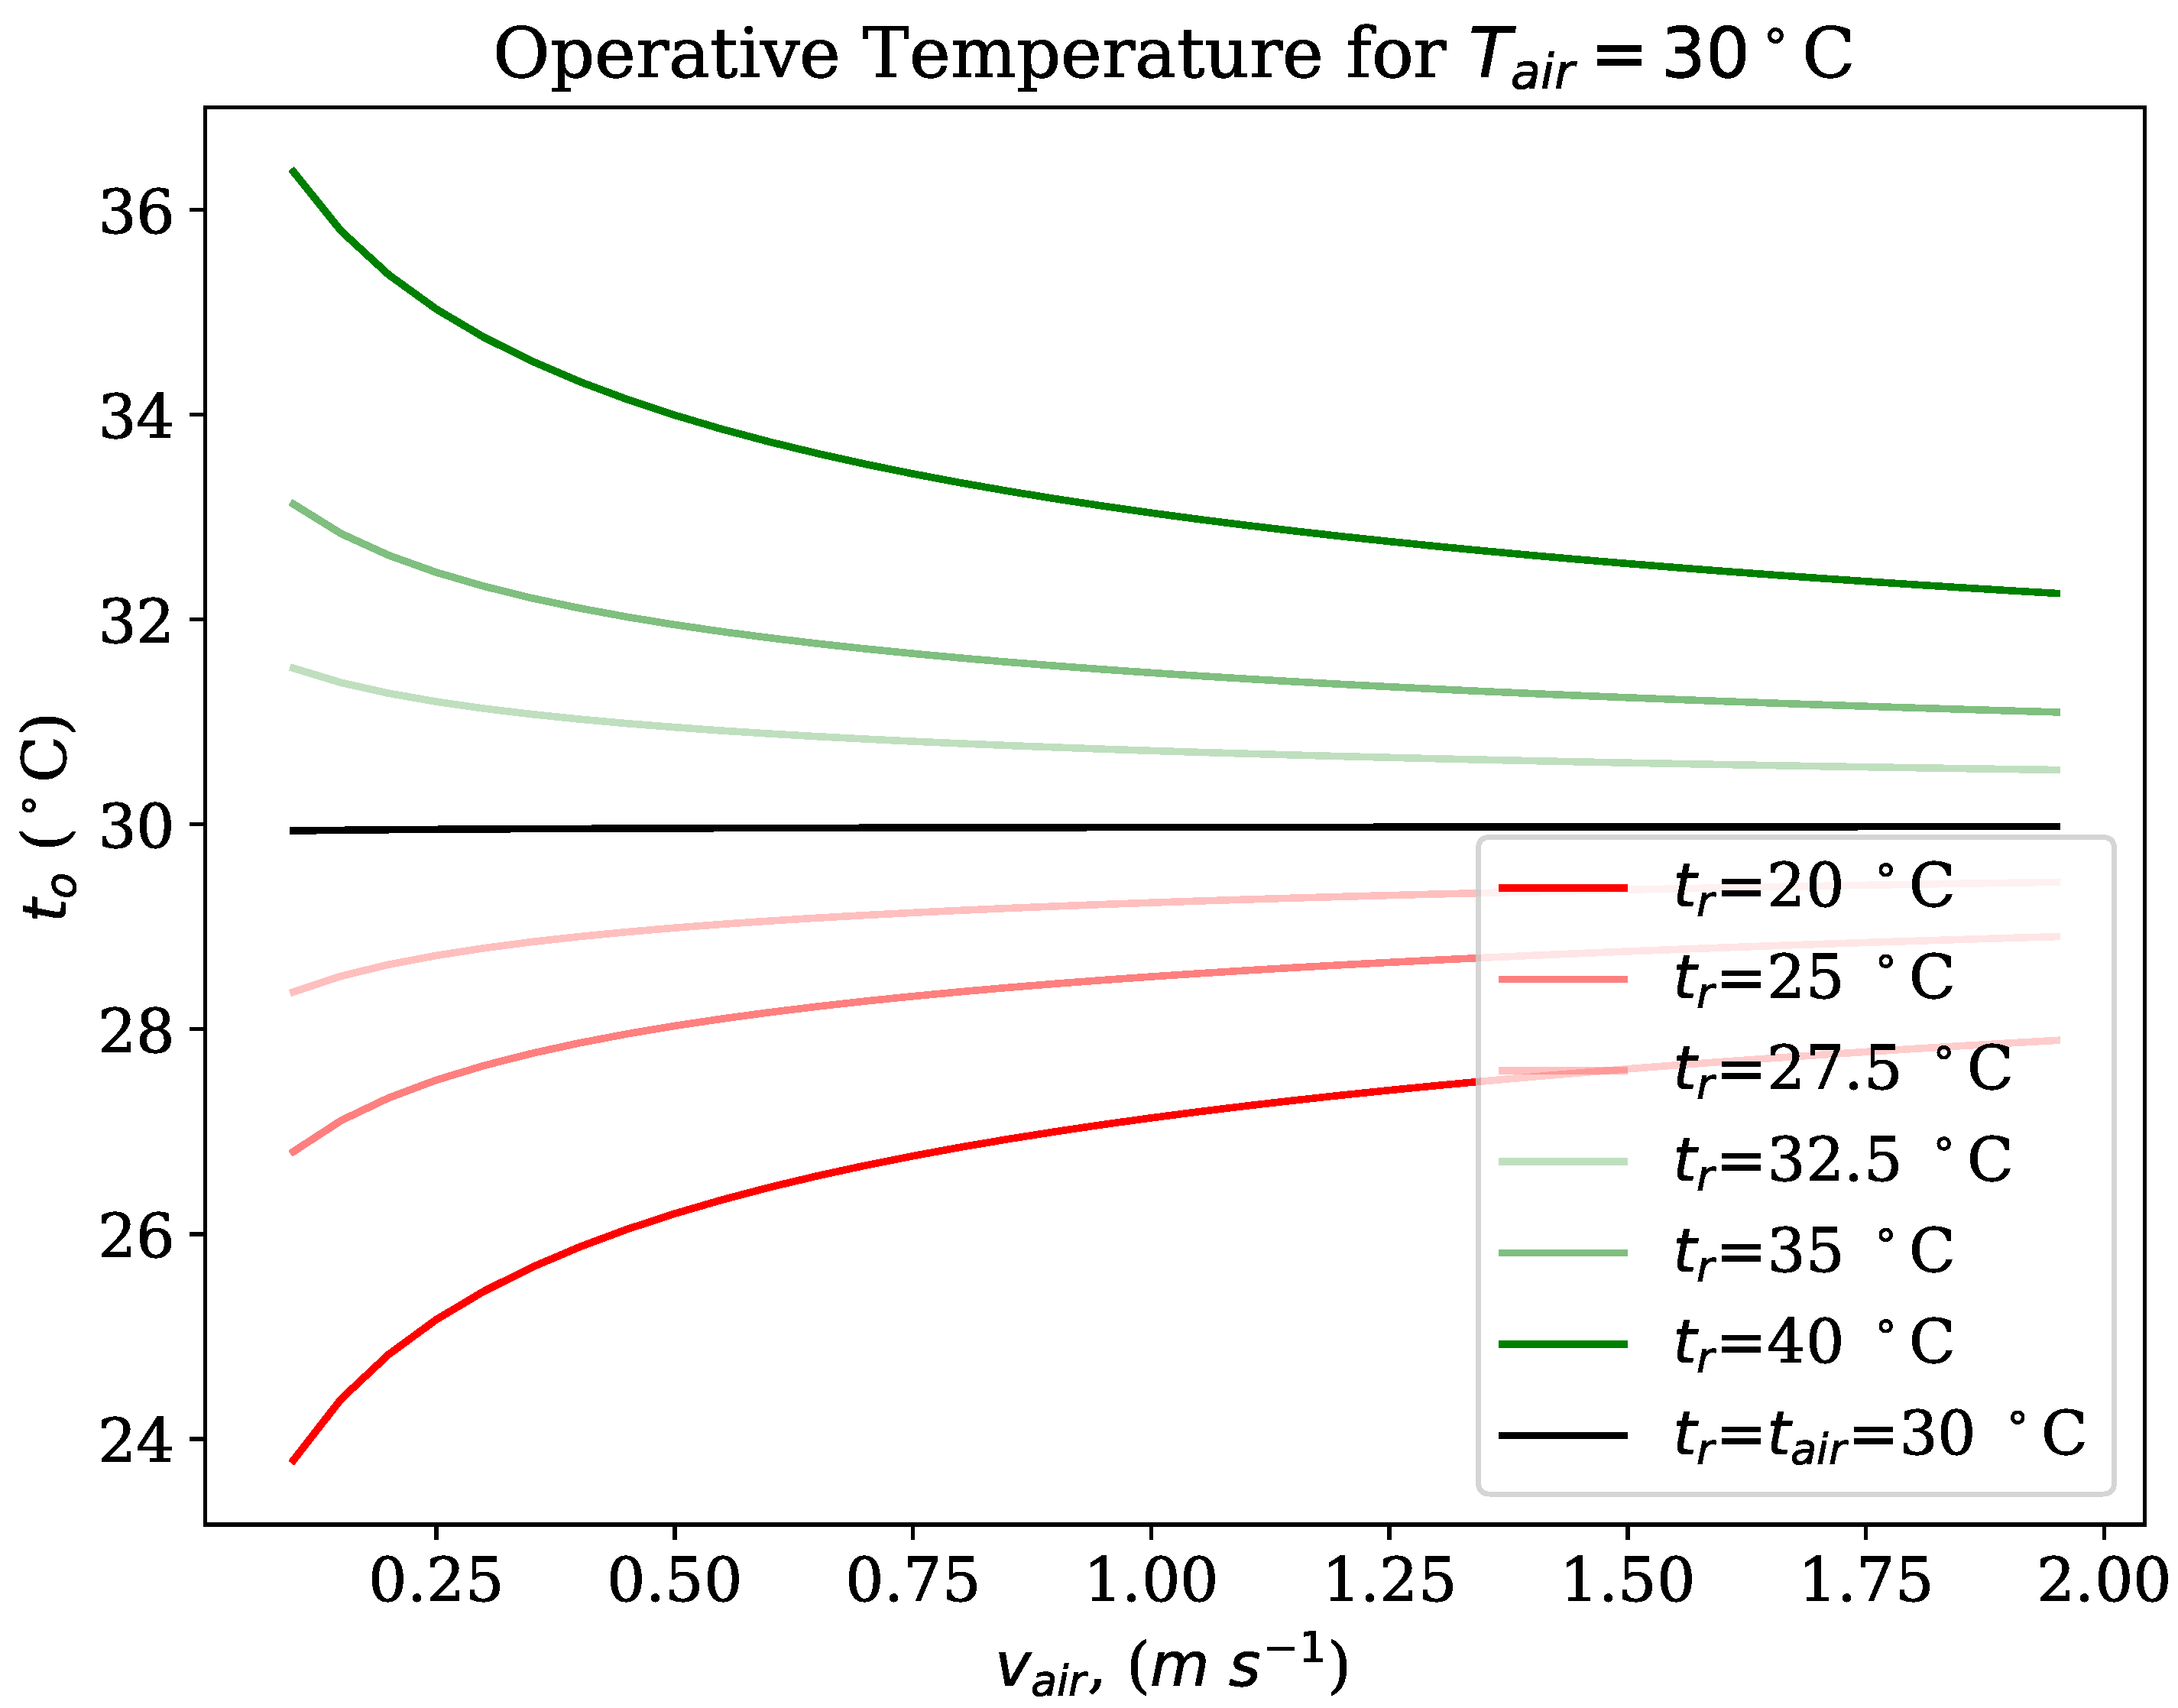
2.3. Modern Frameworks of Thermal Comfort

Modern frameworks for thermal comfort are often extensions of previous studies that attempt to reconcile discrepancies with the ASHRAE model. de Dear et al. and Arens revisited fundamental heat fluxes about human body segments to build human-centric models for thermal comfort transcending the artificial air notions from the middle of the century [30,31]. Upon realizing again the power for natural ventilation, Zhang et al. at the Center for the Built Environment (CBE) studied the role of personal comfort systems that leveraged nonlinearities in convection to derive thermal comfort [32].
Also at the CBE, Schiavon and Hoyt published an online thermal comfort tool, allowing users to alter any thermal comfort variable to continuously redefine a comfort zone [33,34]. These representations were particularly strong at demonstrating the nonlinearities in thermal comfort but abstracted the role of architecture. Similar attempts by the author at adding other comfort variables to landscapes were useful at demonstrating counterintuitive effects that changed the relative importance of convection and radiation to one’s thermal comfort but still did not demonstrate to the user modes of restoring comfort or architectural opportunities for leveraging systems and geometries [35,36].
Modern architecture texts discount the role of other thermal comfort contributors, unsurprisingly, as engineers have similarly done. -Arium, a set of case studies for designing with the prevailing weather conditions, describes comfort in terms of air temperature only with “Air temperature is the most dominant factor in human comfort, followed by humidity, wind, and sunshine” [37]. Despite returning later in the text to talk about human body radiation budgets, the failures of reductionism are pervasive in the text.
Attempts to include more thermal comfort variables have looked at redefining thermal comfort around physiological responses, namely constant sweating loci [38]. More recent attempts by de Dear et al. [39,40] revisited phenomena of thermal delight [41] as a means for designing certain transitional zones of buildings, or more generally non-steady-state thermal comfort regions.
At the heart of that work was an improved understanding of the thermophysiology of the human body [42]. Understanding the rates and pathways of heat transfer in the human body, including thermal capacitance, helped create a fuller understanding of the pathways available for leveraging building systems to generate comfort. That diagram is shown in Figure 6 and stops abruptly at the boundary, a useful framework for developing boundary conditions. The authors specified that the applications included interfacing with novel HVAC systems, in both transient and steady states.
This level of physiological discussion was not present in the original Fanger thermal comfort studies still predominantly referenced today [20]. Instead, the original framework of thermal comfort research was to generate a comfortable building, striving for homogeneous indoor environments, referred to by Heschong as “thermal monotony” [43]. Thermal monotony was meant to reduce discomfort in buildings because a uniform, standard environment was to be deployed with air conditioning at the locus. However, instead, this framework was only successful at eliminating vernacular architecture engaging local climates.

2.4. Adaptive Comfort

The most recent attempt to reconcile physiology and the built environment is known as “Adaptive Comfort” that operates under the deceptively simple principle that “If a change occurs such as to produce discomfort, people react in ways which tend to restore their comfort” [44]. Intentionally vague, this definition includes both physiological responses, e.g., vasodilation, and behavioral changes, e.g., putting on a sweater, and includes motivating factors such as seasonal changes at long time scales or sunsets at shorter time scales. Under the adaptive comfort framework, comfort is comprised of four major pillars, namely, physics, psychophysics, physiology, and behavior [44]. Nichol remarks several times throughout the text that the least researched domain is the intersection of physics and physiology, or the building and the body. Nonetheless, the first implementation of the standard, ASHRAE Standard 55, is remarkable in its ability to dynamically update acceptable indoor temperatures as a function of outdoor temperature, officially reflecting a link between physiology and the built environment [28].
This work is a signal of dynamic comfort in future system design, despite its official designation that selects air temperature and longer seasonal timescales as the operating criteria. While sometimes psychrometric axes are chosen to represent adaptive comfort data, often it is other criteria, and there are never clear attempts to have higher-dimensionality functions such as the overall human heat balance. Parameters become fixed, eliminating options to control for comfort.

2.5. Comfort Is More Than Temperature and Humidity

However, at the heart of comfort mischaracterization is the predisposition of air-based comfort systems, a practice which systematically neglects the possibility of engaging with T M R T as an independent variable for efficient comfort control.
The psychrometric chart shown in Figure 7 has become the standard for thermal comfort system design and evaluation, and based on the latest ASHRAE 55-2013 standard for thermal environmental conditions [28], there is a plethora of information conveyed regarding the clothing level, metabolic rate, wind velocity, and the associated level of comfort at a given operative temperature and humidity. The chart can be used for both quick visual reference, confirmation of comfort conditions, and even more in-depth calculations for sensible and latent loads associated with delivering conditioned air to occupants. However, the tool falls short of allowing users to quickly visualize trends to gain insight about system design. Users are guided to consult computer simulations or very qualitatively instructed the comfort zone shifts a certain direction with regard to clothing, wind, and humidity changes.
Additionally, using the operative temperature as the average of air temperature and mean radiant temperature is a misleading notion since physiological response does not necessarily correlate with just the average of the two [45]. Such a discrepancy is perhaps best demonstrated when using a weighting mechanism that takes air speed into account when determining the operative temperature using Equation (1). In this equation, h c and h r are the convective and radiative heat transfer coefficients, respectively, and t o , t r , and t a are the operative, mean radiant, and air temperatures, respectively. Results of using this equation are shown for two regimes, illustrated in green and red, representing when t r > t a (red) and t r < t a (green) in Figure 1.
t o = h r t r + h c t a h r + h c
The relationship, while a well-intentioned method of abstracting the effects of mean radiant temperature, air temperature, and air speed all together, results in a misrepresentation of the importance of radiant cooling. As shown in Figure 8, if radiant cooling is used to create an environment with a lower mean radiant temperature than the air temperature, as air speed increases and the environment feels even cooler, the operative temperature increases. Such a counterintuitive relationship does not allow a clear design methodology for radiant cooling that attempts to reduce operative temperature values. Such a system reduces the freedom that can be applied to radiant systems integration. Rather than calculating the operative temperature, it should be desirable to use precise measurements for air temperature, humidity, mean radiant temperature, and air speed to derive comfort conditions.
Moreover, the culture of achieving sensible cooling of air is problematic for several reasons. Air is a poor choice of heat-transfer working fluid, as its low density and low specific heat capacity require large temperature gradients, large flow rates, or both to provide a comfortable environment. Water on the other hand is dense and has a very high specific heat capacity making it a better choice to perform heat transfer work. In addition, the latent heat of evaporation is high, providing extra cooling capacity in the form of a phase change from its liquid to vapor phase.
In the United States, there is generally a large inequality between latent and sensible loads for air conditioning [46], but unfortunately, the two are entangled based on the vapor compression technology most predominantly deployed for air conditioning. Moreover, for an air-conditioning paradigm, the latent and sensible loads must be linked as only so much sensible cooling can be achieved before the heat of condensation is activated. That paper provides a framework for how to design setpoints for systems that do not rely only on air cooling, and instead can modulate air velocity, mean radiant temperature, and air humidity as the means to control thermal comfort.

3. Conclusions

Willis Carrier was successful at creating a concise representational framework for the dependence of relative humidity on air temperature, from which engineers can quickly size and calculate refrigeration units. Yet the success of the psychrometric chart to convey controls information has uniquely guided a century of comfort researchers, operating with the incorrect assumption that thermoregulation by the human body must be linked to the same framework. Even as trends shift towards personal comfort models and methods for predicting comfort, the origins of the psychrometric and equivalent-temperature-based frameworks persist in the form of neglecting the importance of radiative heat transfer and more broadly the opportunities for designers and even occupants to directly engage with comfort. As climate and carbon-constrained futures prompt research into efficient comfort systems, rethinking the comfort zone requires updated representational frameworks to help designers and engineers think outside the comfort box.

Author Contributions

Conceptualization, E.T., C.M. and F.M.; data curation, E.T.; formal analysis, E.T.; funding acquisition, F.M.; investigation, E.T. and F.M.; methodology, E.T.; project administration, F.M.; supervision, C.M. and F.M.; writing—original draft, E.T.; writing—review and editing, C.M. and F.M. All authors have read and agreed to the published version of the manuscript.

Funding

This paper was partially funded by a Princeton University Andlinger Center for Energy and the Environment Innovation Grant.

Institutional Review Board Statement

Not applicable.

Informed Consent Statement

Not applicable.

Data Availability Statement

Data and guidance on using the psychrometric chart expanding upon its historical background can be found at: http://ComfortCh.art/.

Acknowledgments

This work would not be possible without Willis Carrier, ASHRAE, and the millions of engineers who have made the psychrometric chart ubiquitous. The authors would like to acknowledge Axel Kilian for his guidance during the model development.

Conflicts of Interest

The authors declare no conflict of interest.

References

  1. Carrier, W.H. Rational psychometric formulae. Trans. Am. Soc. Mech. Eng. 1911, 33, 1005. [Google Scholar]
  2. Allen, J. Modus Operandi of the SYnthetic Air Chart. Am. Soc. Heat. Vent. Eng. 1920, 26, 597–603. [Google Scholar]
  3. Bukeley, C. A New Psychrometric or Humidity Chart. Am. Soc. Heat. Vent. Eng. 1926, 32, 237–243. [Google Scholar]
  4. Houghton, F.; Yaglou, C. Determining equal comfort lines. J. ASHVE 1923, 29, 165–176. [Google Scholar]
  5. Yagoglou, C. Report of Committee to Consider the Report of the New York State Commission on Ventilation. Am. Soc. Heat. Vent. Eng. 1924, 30, 254–256. [Google Scholar]
  6. Yagoglou, C.; Miller, W. Effective Temperature with Clothing. Am. Soc. Heat. Vent. Eng. 1925, 31. [Google Scholar]
  7. Nichols, B.L. Atwater and USDA nutrition research and service: A prologue of the past century. J. Nutr. 1994, 124, 1718S–1727S. [Google Scholar] [CrossRef]
  8. Keesom, W. Note sur la calorie, unité de chaleur. BIPM Com. Cons. Thermom. 1939, 1, T110–T120. [Google Scholar]
  9. ASHRAE. ASHRAE Pocket Guide for Air Conditioning, Heating, Ventilation, Refrigeration (I-P Edition), 8th ed.; ASHRAE: Peachtree Corners, GA, USA, 2013. [Google Scholar]
  10. Houghten, F.; Teague, W. Body-Temperature Regulation and other physiological reactions in their relation to the physical characteristics of man’s atmospheric environment. J. Am. Soc. Heat. Vent. Eng. 1928, 34, 873–885. [Google Scholar]
  11. Yagoglou, C. Heat given up by the human body and its effect on heating and ventilating problems. Am. Soc. Heat. Vent. Eng. 1924, 30, 597–609. [Google Scholar]
  12. Of Cooperative Work by ASHVE, R. Practical Application of Temperature, Humidity, and Air Motion Data to Air Conditioning Problems. Am. Soc. Heat. Vent. Eng. 1926, 32. [Google Scholar]
  13. Armspach, O.; Ingels, M. Temperature, Humidity, and Air Motion Effects in Ventillation. Am. Soc. Heat. Vent. Eng. 1922, 28, 173–190a. [Google Scholar]
  14. Vernon, H. Is Effective Temperature or Cooling Power the Better Index of Comfort? J. Ind. Hyg. 1926, 8, 392–401. [Google Scholar]
  15. Vernon, H.; Warner, C. The influence of the humidity of the air on capacity for work at high temperatures. J. Ind. Hyg. 1932, 32, 431–462. [Google Scholar] [CrossRef] [Green Version]
  16. Yagoglou, C. Effective Temperatures versus Kata-Thermometer: A Reply to H.M. Vernon. J. Ind. Hyg. 1926, 8, 402–413. [Google Scholar]
  17. Blazejczyk, K.; Epstein, Y.; Jendritzky, G.; Staiger, H.; Tinz, B. Compatison of UTCI to selected thermal indices. Int. J. Biometeorol. 2012, 56, 515–535. [Google Scholar] [CrossRef] [Green Version]
  18. Bedford, T.; Warner, C. The Globe Thermometer in Studies of Heating and Ventilation. J. Hyg. 1934, 34, 458–473. [Google Scholar] [CrossRef] [Green Version]
  19. Carrier, W.; Mackey, C. A Review of Existing Psychrometric Data in Relation to Practical Engineering Problems. Am. Soc. Mech. Eng. 1937, 59, 33–47. [Google Scholar] [CrossRef]
  20. Fanger, P.O. Thermal Comfort: Analysis and Applications in Environmental Engineering; R.E. Krieger Pub. Co.: Malabar, FL, USA, 1970. [Google Scholar]
  21. Yagoglou, C. The Comfort Zone for Men at Rest and Stripped to the Waist. Am. Soc. Heat. Vent. Eng. 1927, 33, 285–298. [Google Scholar]
  22. Olgyay, V. Design with Climate; Princeton University Press: Princeton, NJ, USA, 1963. [Google Scholar]
  23. Givoni, B. Man, Climate and Architecture, 2nd ed.; Architectural Science Series; Applied Science Publishers: London, UK, 1976. [Google Scholar]
  24. Givoni, B. Climate Considerations in Building and Urban Design; Van Nostrand Reinhold: New York, NY, USA, 1998. [Google Scholar]
  25. Fitch, J.M.; Bobenhausen, W. American Building: The Environmental Forces that Shape It; Oxford University Press: New York, NY, USA, 1999. [Google Scholar]
  26. Lechner, N. Heating, Cooling, Lighting: Sustainable Design Methods for Architects, 3rd ed.; John Wiley and Sons: Hoboken, NJ, USA, 2009. [Google Scholar]
  27. Gallo, C.; Sala, M.; Sayigh, A.A.M. Architecture: Comfort and Energy, 1st ed.; Elsevier Science: New York, NY, USA, 1998. [Google Scholar]
  28. Standard 55-2013; Thermal Environmental Conditions for Human Occupancy. ASHRAE: Peachtree Corners, GA, USA, 2013.
  29. Xu, P.; Ma, X.; Zhao, X.; Fancey, K. Experimental investigation of a super performance dew point air cooler. Appl. Energy 2017, 203, 761–777. [Google Scholar] [CrossRef]
  30. de Dear, R.J.; Arens, E.; Hui, Z.; Oguro, M. Convective and radiative heat transfer coefficients for individual human body segments. Int. J. Biometeorol. 1997, 40, 141–156. [Google Scholar] [CrossRef] [PubMed] [Green Version]
  31. Arens, E.; Zhang, H. Chapter: The Skin’s Role in Human Thermoregulation and Comfort. In Thermal and Moisture Transport in Fibrous Materials; Woodhead Publishing: Sawston, UK, 2006. [Google Scholar]
  32. Zhang, H.; Arens, E.; Zhai, Y. A review of the corrective power of personal comfort systems in non-neutral ambient environments. Build. Environ. 2015, 91, 15–41. [Google Scholar] [CrossRef] [Green Version]
  33. Hoyt, T.; Schiavon, S.; Piccioli, A.; Moon, D.; Steinfeld, K. CBE Thermal Comfort Tool. Center for the Built Environment, University of California Berkeley. 2013. Available online: http://cbe.berkeley.edu/comforttool (accessed on 1 December 2022).
  34. Schiavon, S.; Hoyt, T.; Piccioli, A. Web application for thermal comfort visualization and calculation according to ASHRAE Standard 55. In Proceedings of the Building Simulation, Atlanta, GA, USA, 10–12 September 2014; Volume 7. [Google Scholar]
  35. Teitelbaum, E.; Meggers, F. Expanded psychrometric landscapes for radiant cooling and natural ventilation system design and optimization. Energy Procedia 2017, 122, 1129–1134. [Google Scholar] [CrossRef]
  36. Teitelbaum, E. Expanded Psychrometrics for Novel Integrated Design of Radiant and Passive Building Systems. Master’s Thesis, Princeton University, Princeton, NJ, USA, 2017. [Google Scholar]
  37. Mayer H., J.; Bhatia, N. -Arium: Weather + Architecture; Hatje Cantz: Ostfildern, Germany, 2010. [Google Scholar]
  38. Gagge, A.; Stolwijk, J.; Nishi, Y. An Effective Temperature Scale based on a Simple Mofel of Human Physioloigcal Regulatory Response. ASHRAE Trans. 1971, 77, 247–262. [Google Scholar]
  39. de Dear, R. Revisiting an old hypothesis of human thermal perception: Alliesthesia. Build. Res. Inf. 2011, 39, 108–117. [Google Scholar] [CrossRef]
  40. Parkinson, T.; de Dear, R. Thermal pleasure in built environments: Physiology of alliesthesia. Build. Res. Inf. 2015, 43, 288–301. [Google Scholar] [CrossRef]
  41. Heschong, L. Thermal Delight in Architecture; MIT Press: Cambridge, MA, USA, 1979. [Google Scholar]
  42. Huizenga, C.; Zhang, H.; Arens, E. A model of human physiology and comfort for assessing complex thermal environments. Build. Environ. 2001, 36, 691–699. [Google Scholar] [CrossRef] [Green Version]
  43. Fitzgerald, E. Thermal Delight. 99% Invisible. 2018. Available online: https://99percentinvisible.org/episode/thermal-delight/transcript/ (accessed on 1 December 2022).
  44. Nicol, F.; Humphreys, M.A.; Roaf, S. Adaptive Thermal Comfort: Principles and Practice; Routledge: London, UK, 2012. [Google Scholar]
  45. Teitelbaum, E.; Jayathissa, P.; Miller, C.; Meggers, F. Design with Comfort: Expanding the psychrometric chart with radiation and convection dimensions. Energy Build. 2020, 209, 109591. [Google Scholar] [CrossRef]
  46. Harriman, L.G., III; Plager, D.; Kosar, D. Dehumidification and cooling loads from ventilation air. ASHRAE J. 1997, 39, 37. [Google Scholar] [CrossRef]
Figure 1. Willis Carrier’s first psychrometric chart [1]. Here, the abscissa is labeled “Dry bulb temperature” and provided in degrees Fahrenheit; the ordinate is “Grains of moisture per lb dry air”.
Buildings 13 00797 g001
Figure 2. Yagoglou and Houghton’s equal temperature framework [5]. Here, the abscissa is “Dry bulb temperature” and provided in degrees Fahrenheit; the ordinate is “Grains of moisture per lb dry air”.
Buildings 13 00797 g002
Figure 3. Experimental setup, data, and output of a study determining the comfort zone with air velocity introduced as an independent variable [6].
Buildings 13 00797 g003
Figure 4. Kata thermometer study from 1922 [13]. Here the abscissa is labeled “Dry bulb temperature, Degrees Fahrenheit”; the ordinate is “Cooling Power of Air in Btu per Square Foot per Hour”.
Buildings 13 00797 g004
Figure 5. Use of psychrometrics throughout comfort, controls, and climate frameworks, combining pure psychrometric representations along the lines of the triangle into applied frameworks at the vertices. Beginning with the “Comfort Control” chart and proceeding clockwise, references for each chart are provided [1,6,22,23,28,29].
Buildings 13 00797 g005
Figure 6. Heat transfer through the human body [42].
Buildings 13 00797 g006
Figure 7. A standard psychrometric chart for system design [28].
Buildings 13 00797 g007
Figure 8. Demonstrating two regimes of operative temperature versus air speed calculated using Equation (1); green represents a regime where t r > t a , which results in an intuitive relationship where the operative temperature decreases as air speed increases; red represents a regime where t r < t a , which results in operative temperature increasing as air speed increases. This is counterintuitive since an increase in air speed results in more cooling capacity relative to a human body; however, an increasing operative temperature implies warmer conditions.
Buildings 13 00797 g008
Disclaimer/Publisher’s Note: The statements, opinions and data contained in all publications are solely those of the individual author(s) and contributor(s) and not of MDPI and/or the editor(s). MDPI and/or the editor(s) disclaim responsibility for any injury to people or property resulting from any ideas, methods, instructions or products referred to in the content.

