
Hazard Evaluation of Indoor Air Quality in Bank Offices
 , , and
Abstract
:1. Introduction
2. Methodology
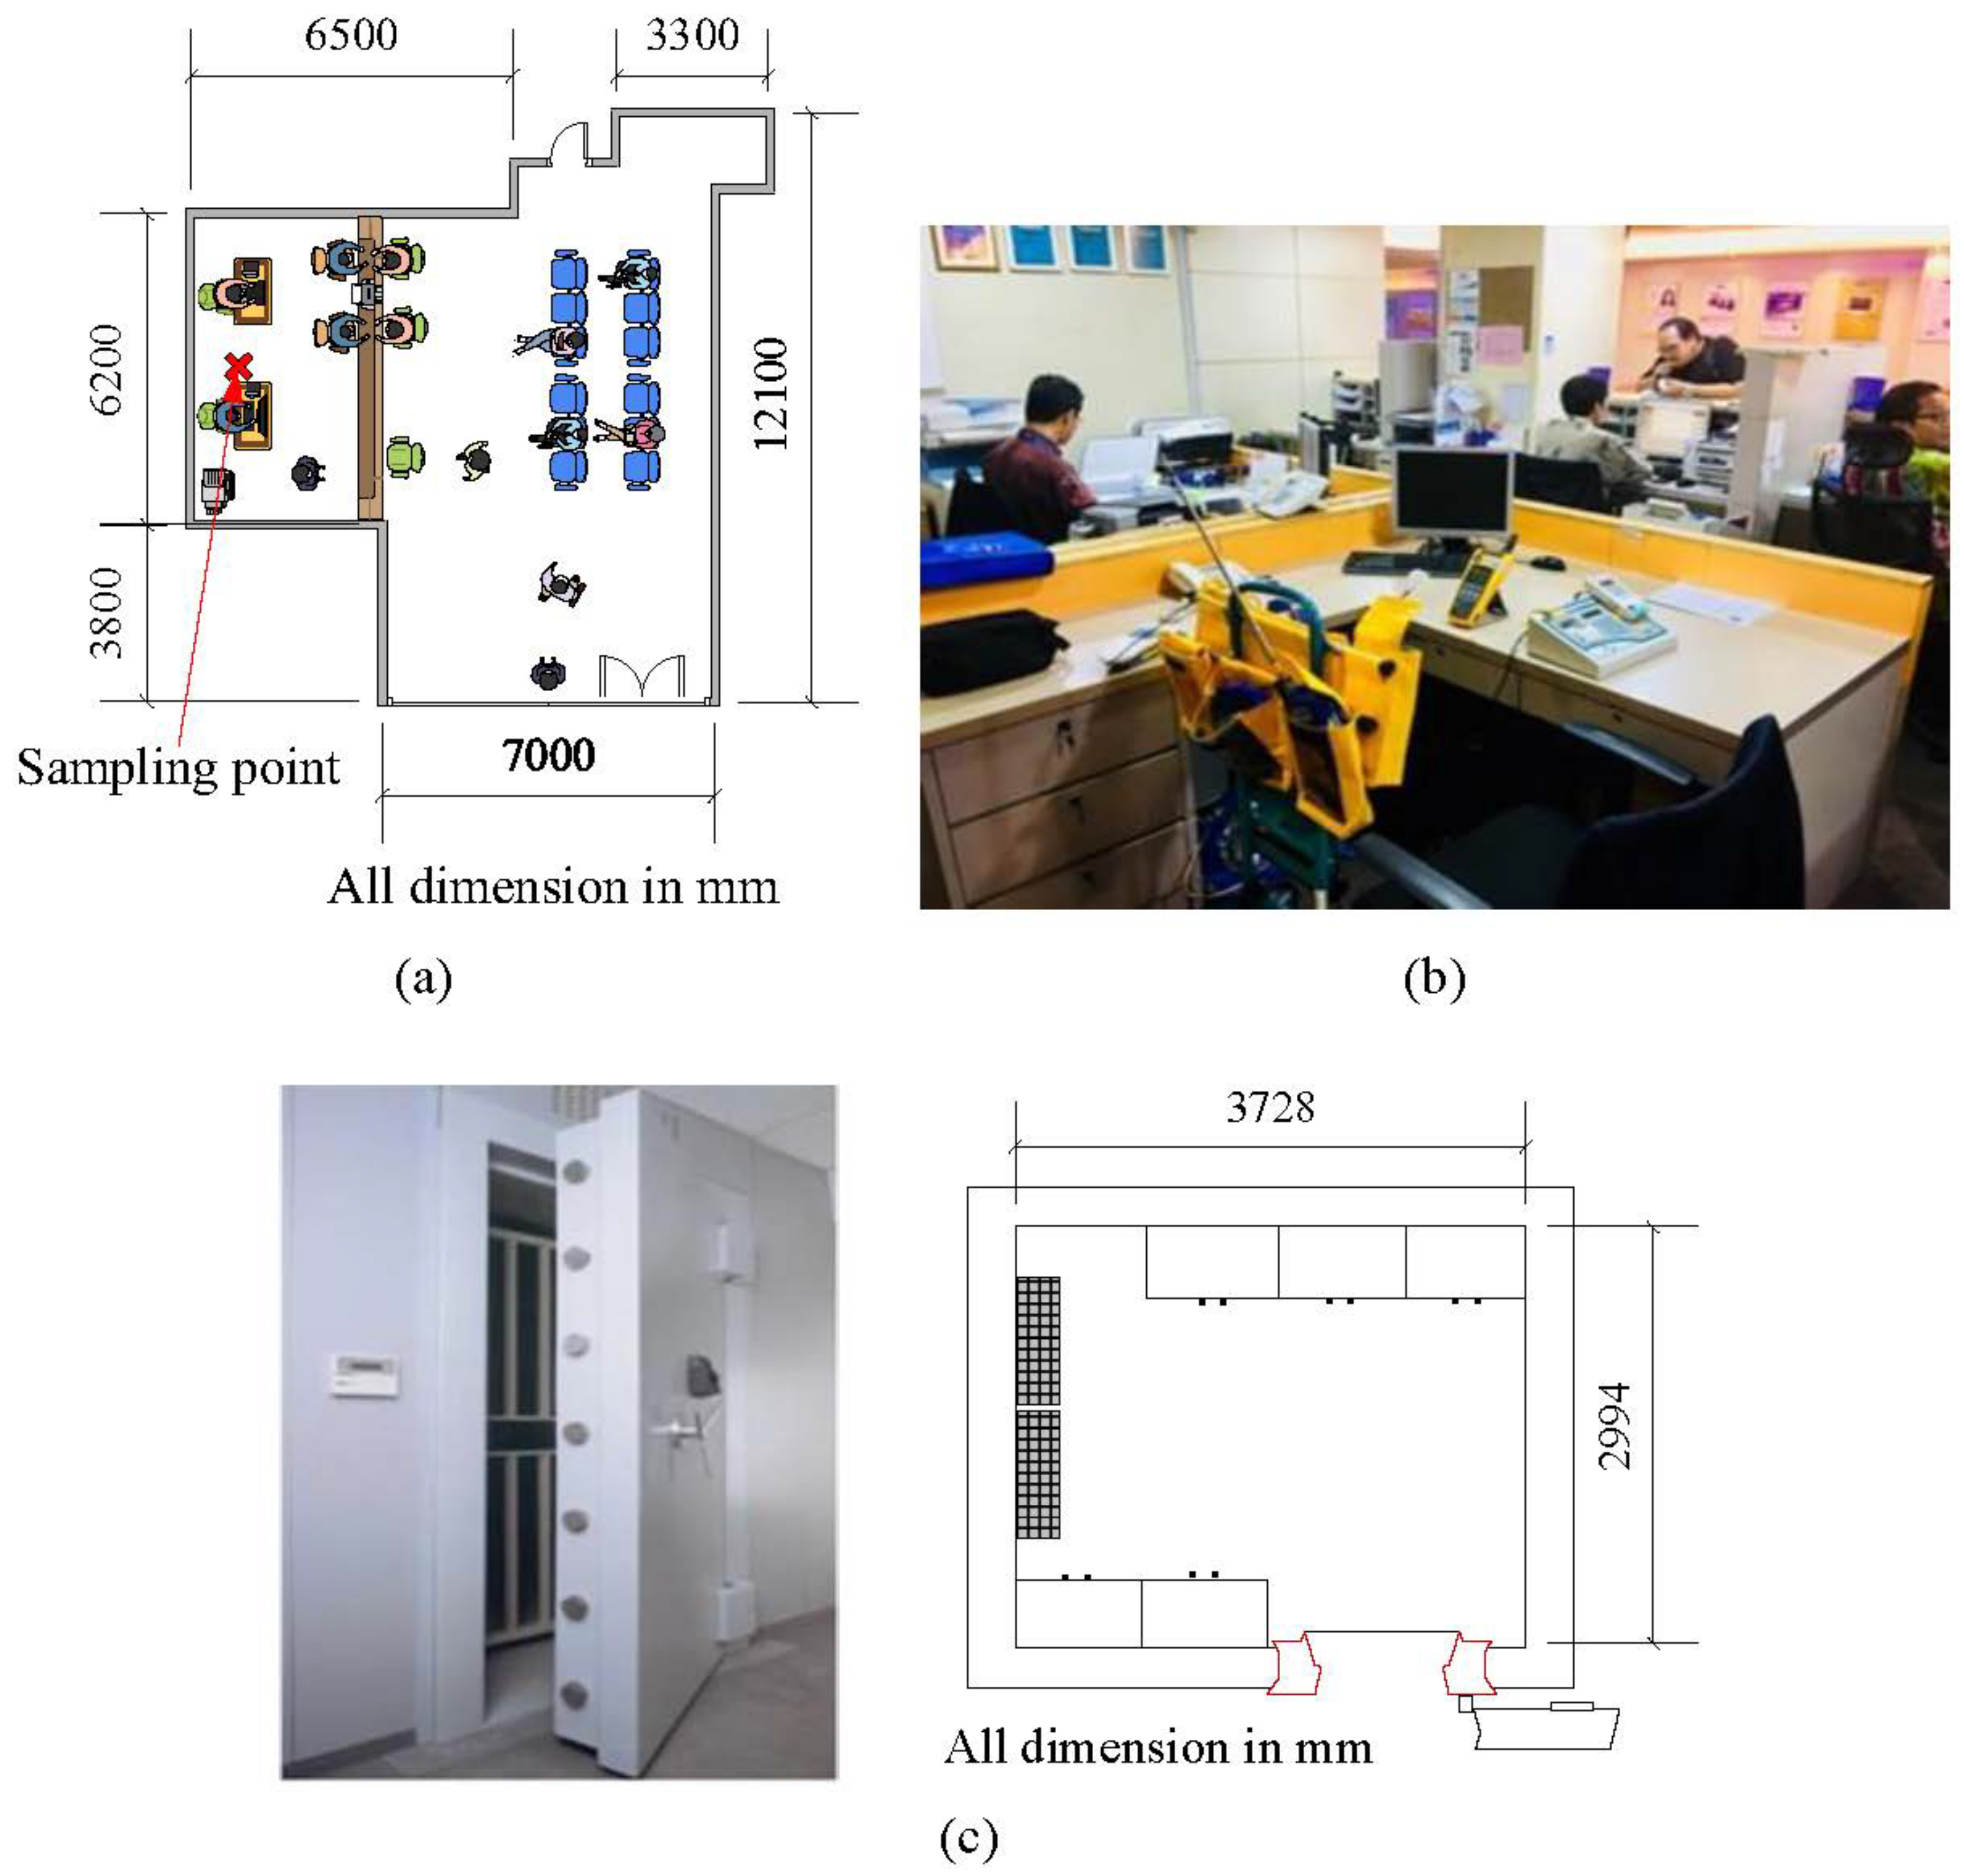
2.1. Measurement of IAQ Parameter
2.2. Hazard Ratio Analysis
2.3. Evaluation of the Results
3. Results
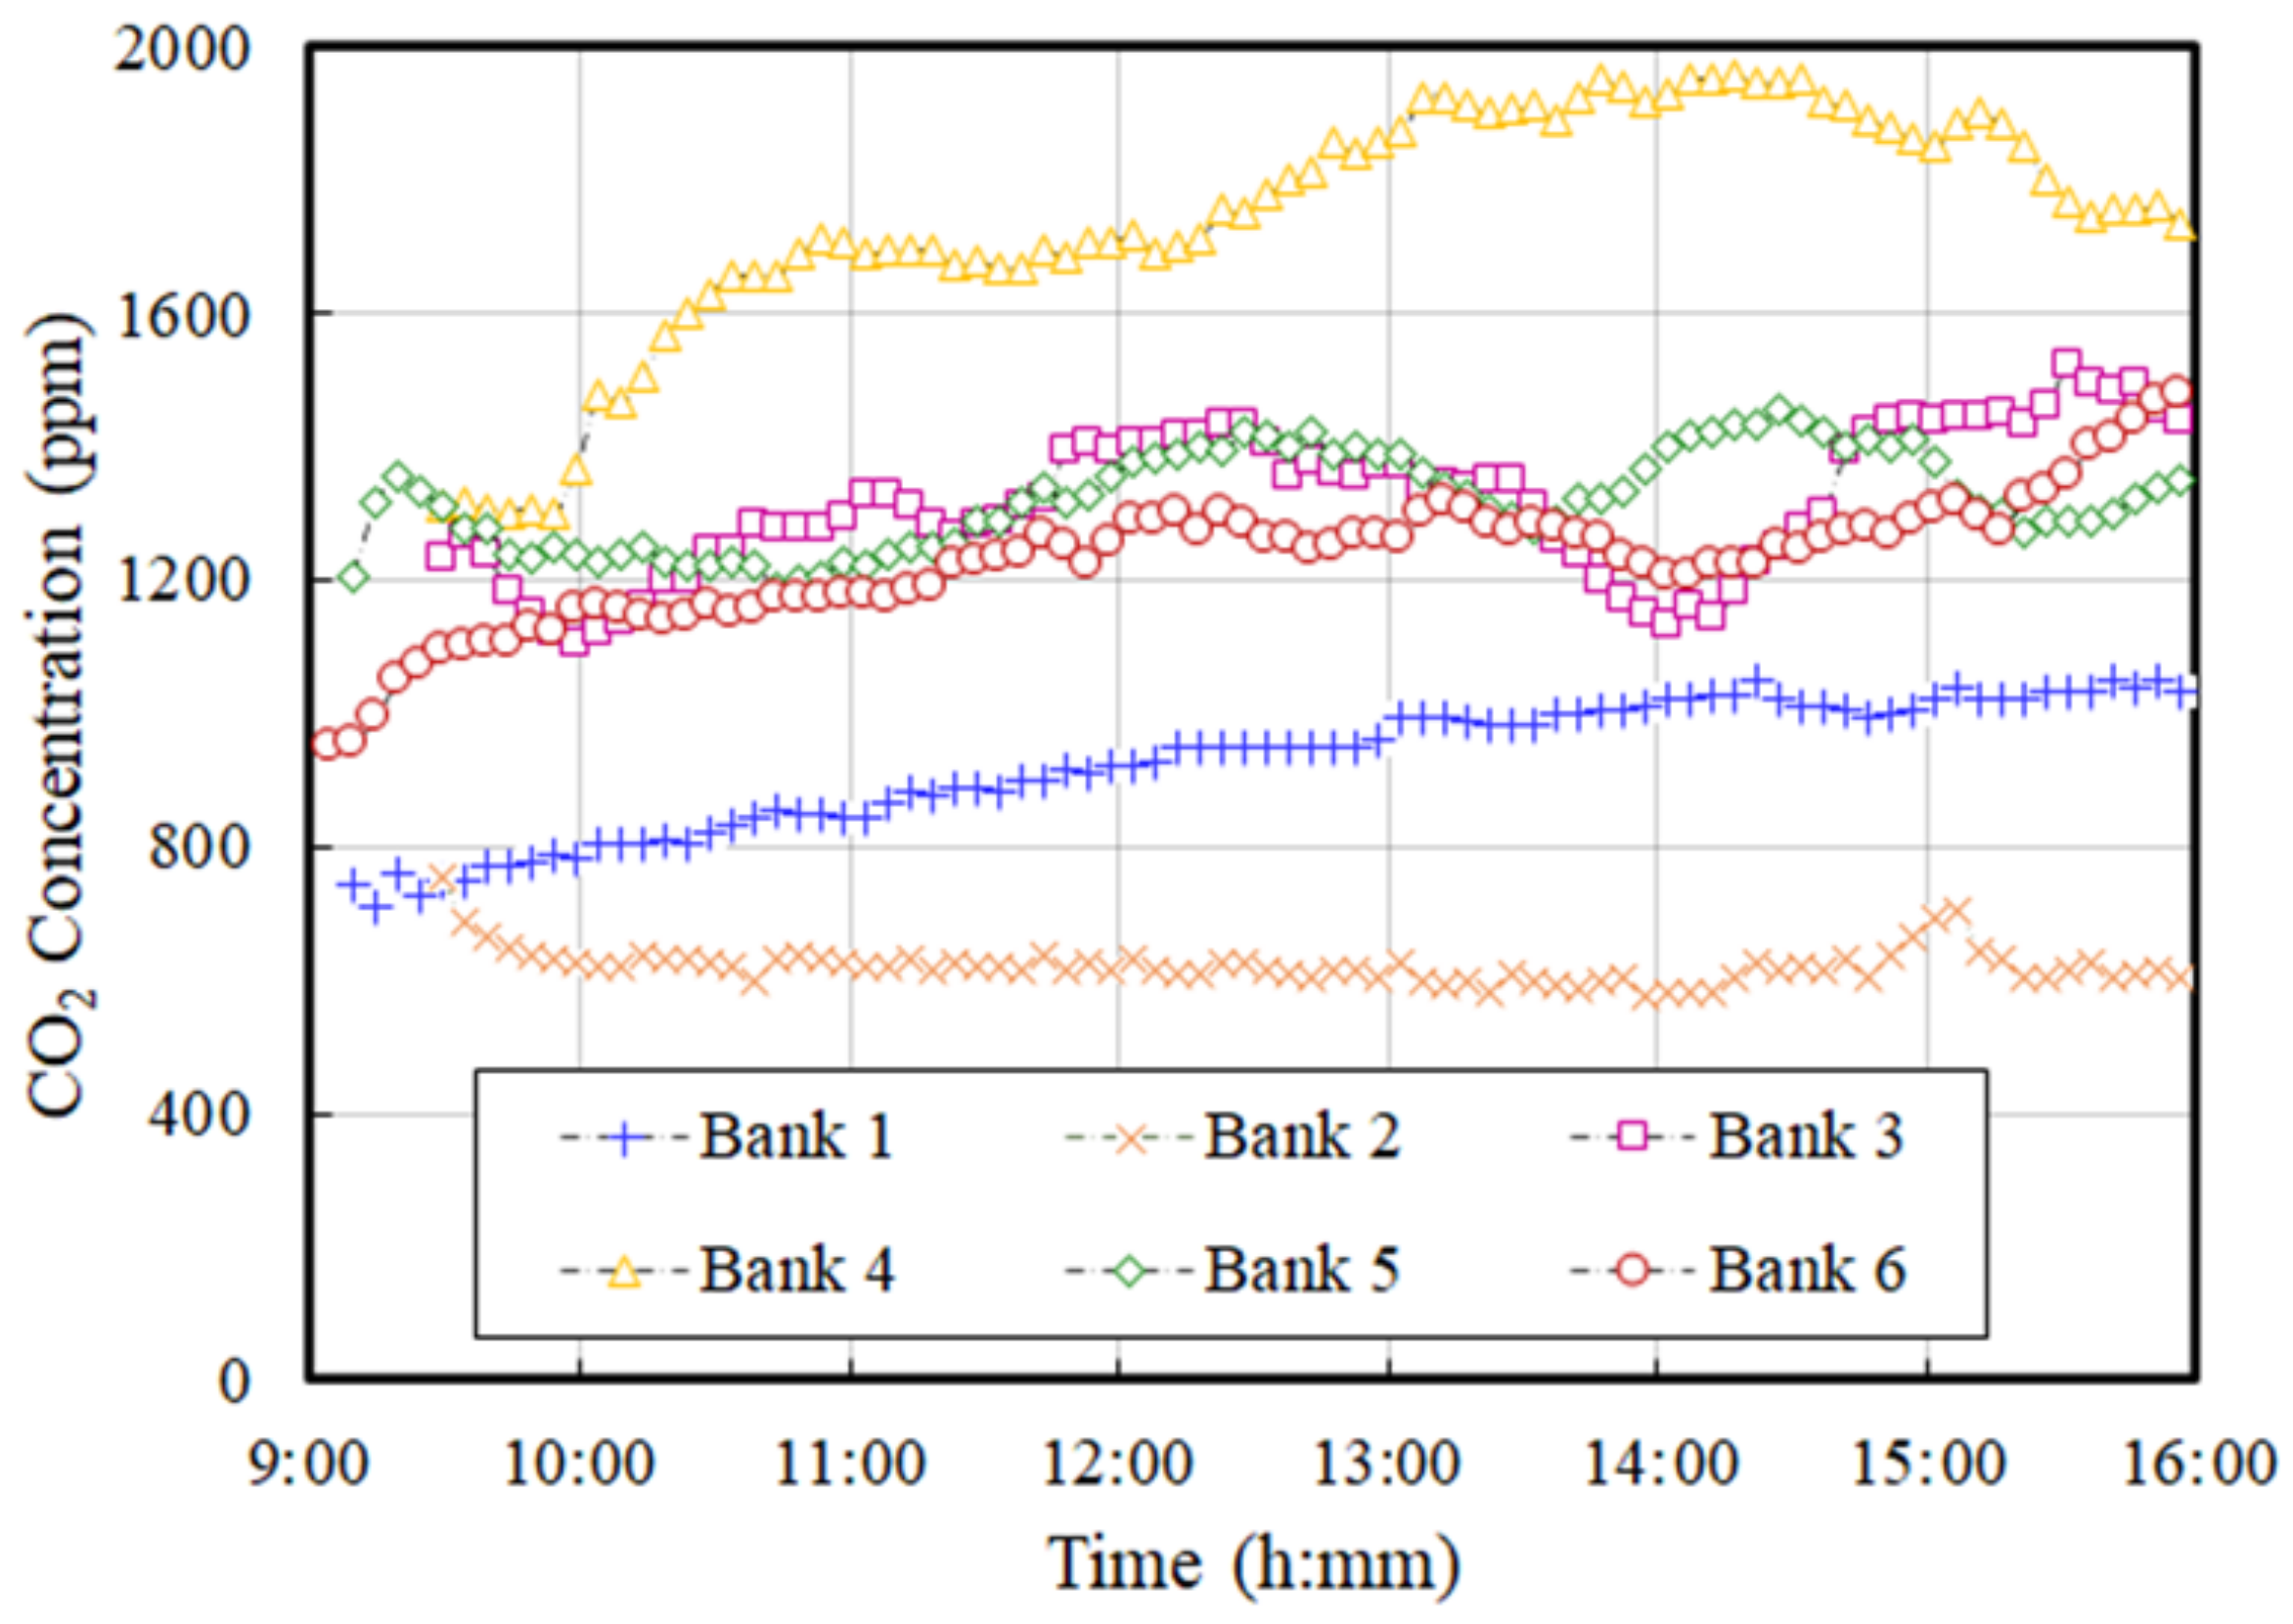
3.1. IAQ Parameters at Bank Vault
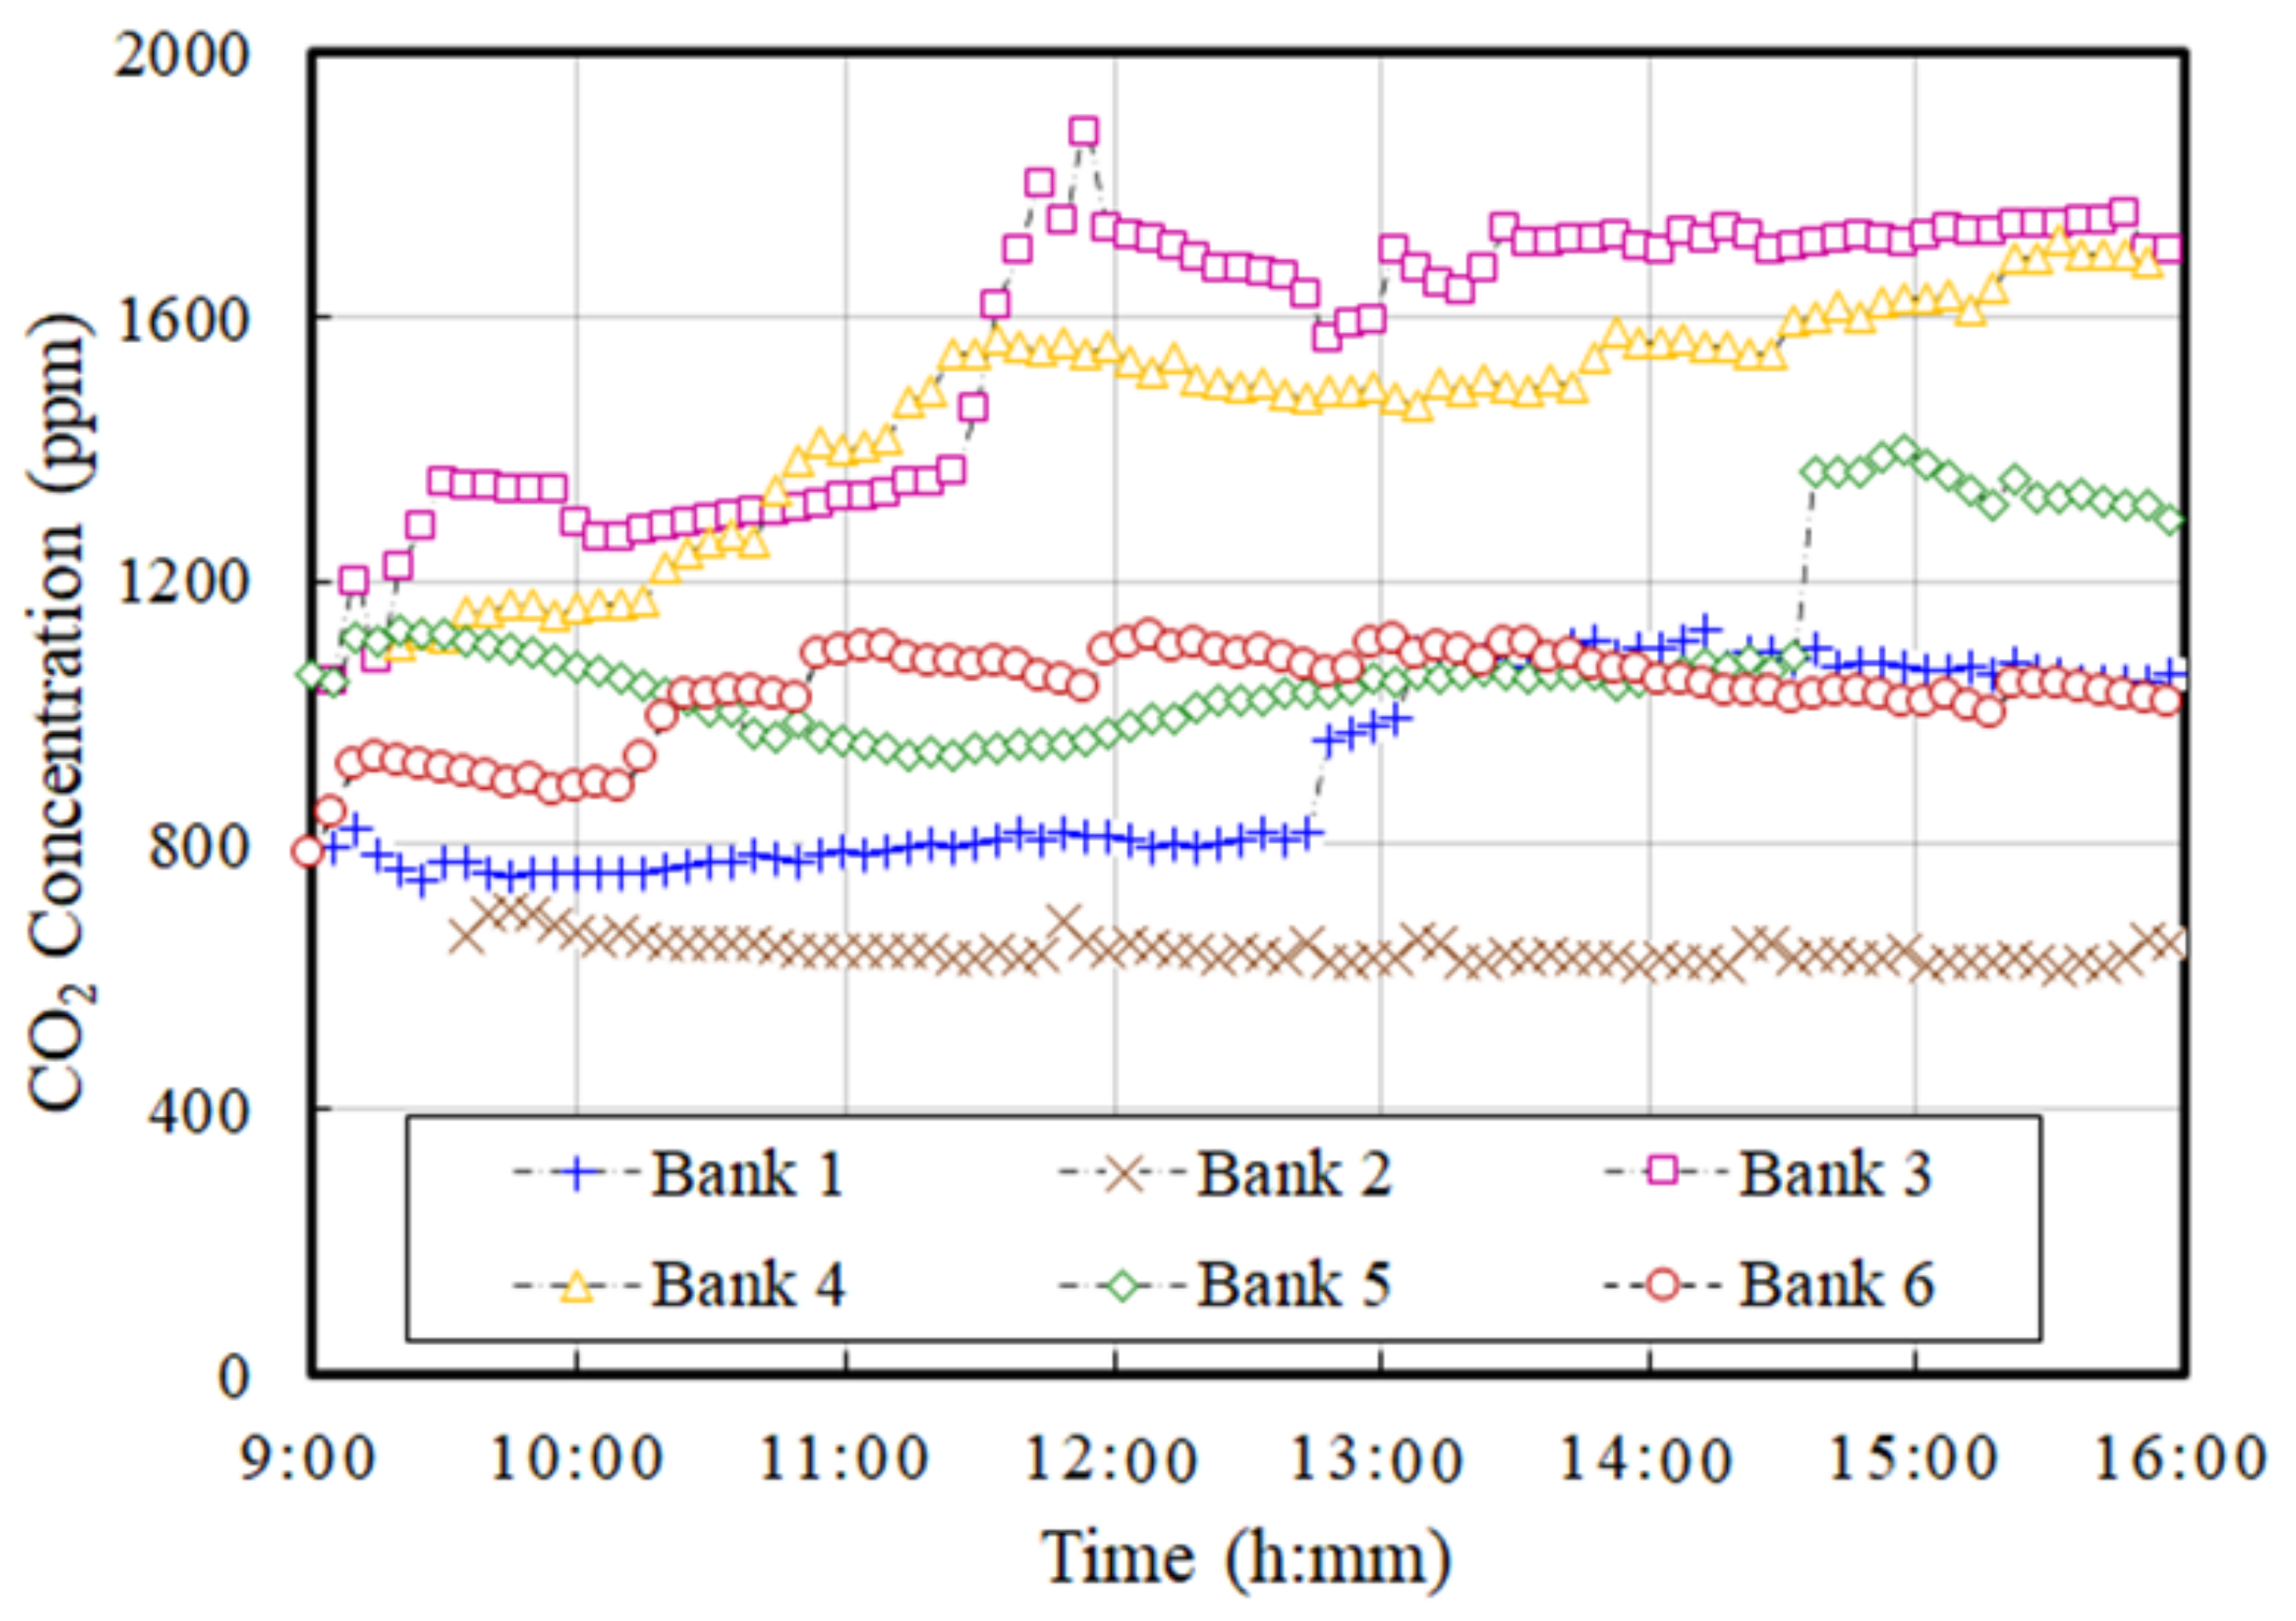
3.2. IAQ Parameters at Operation Area (Teller Counter)
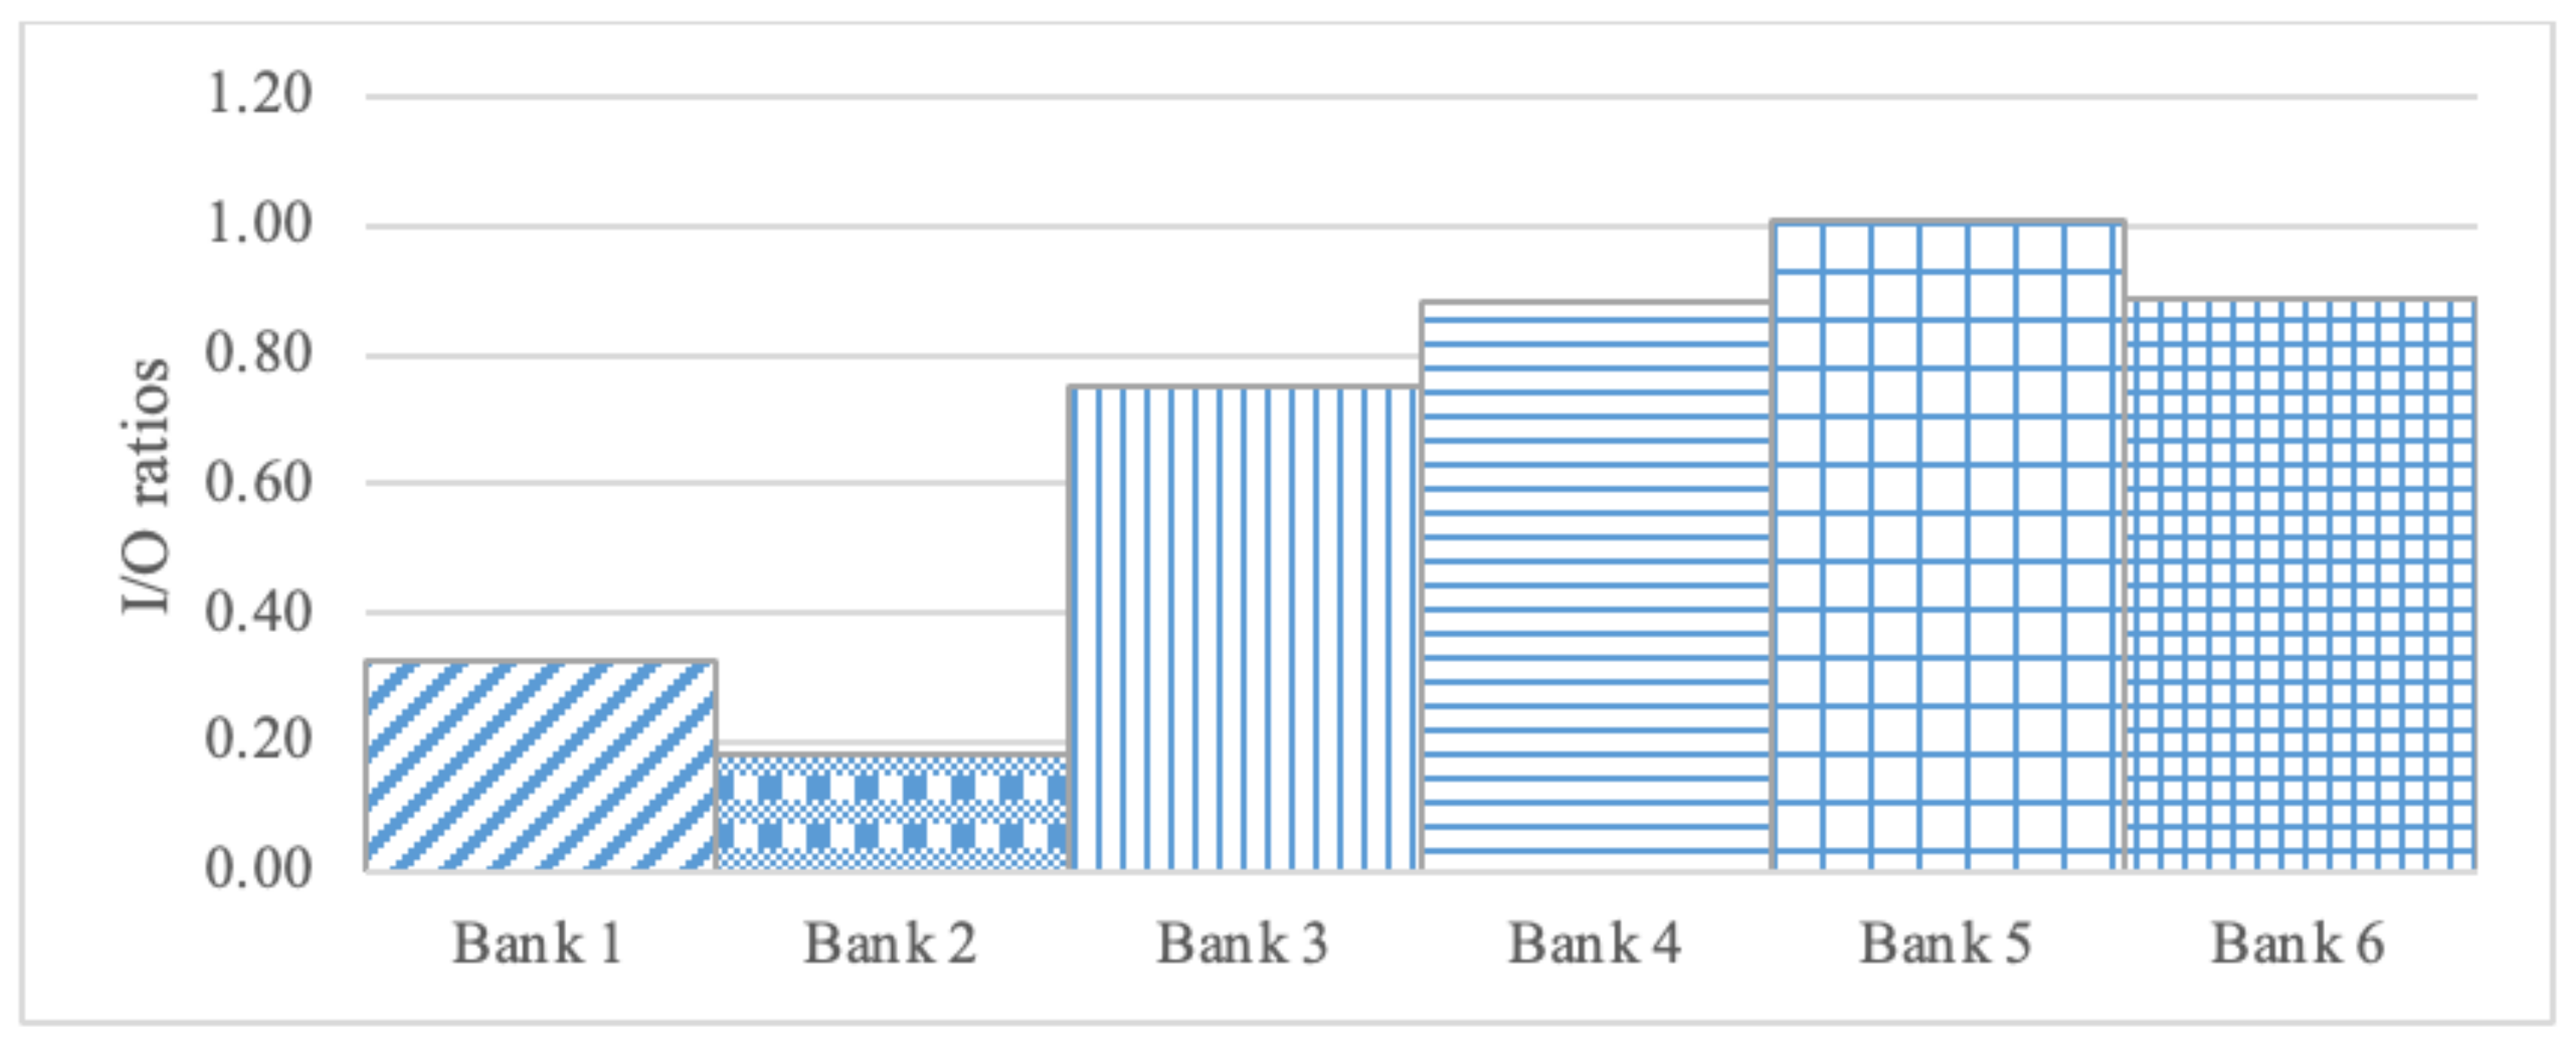
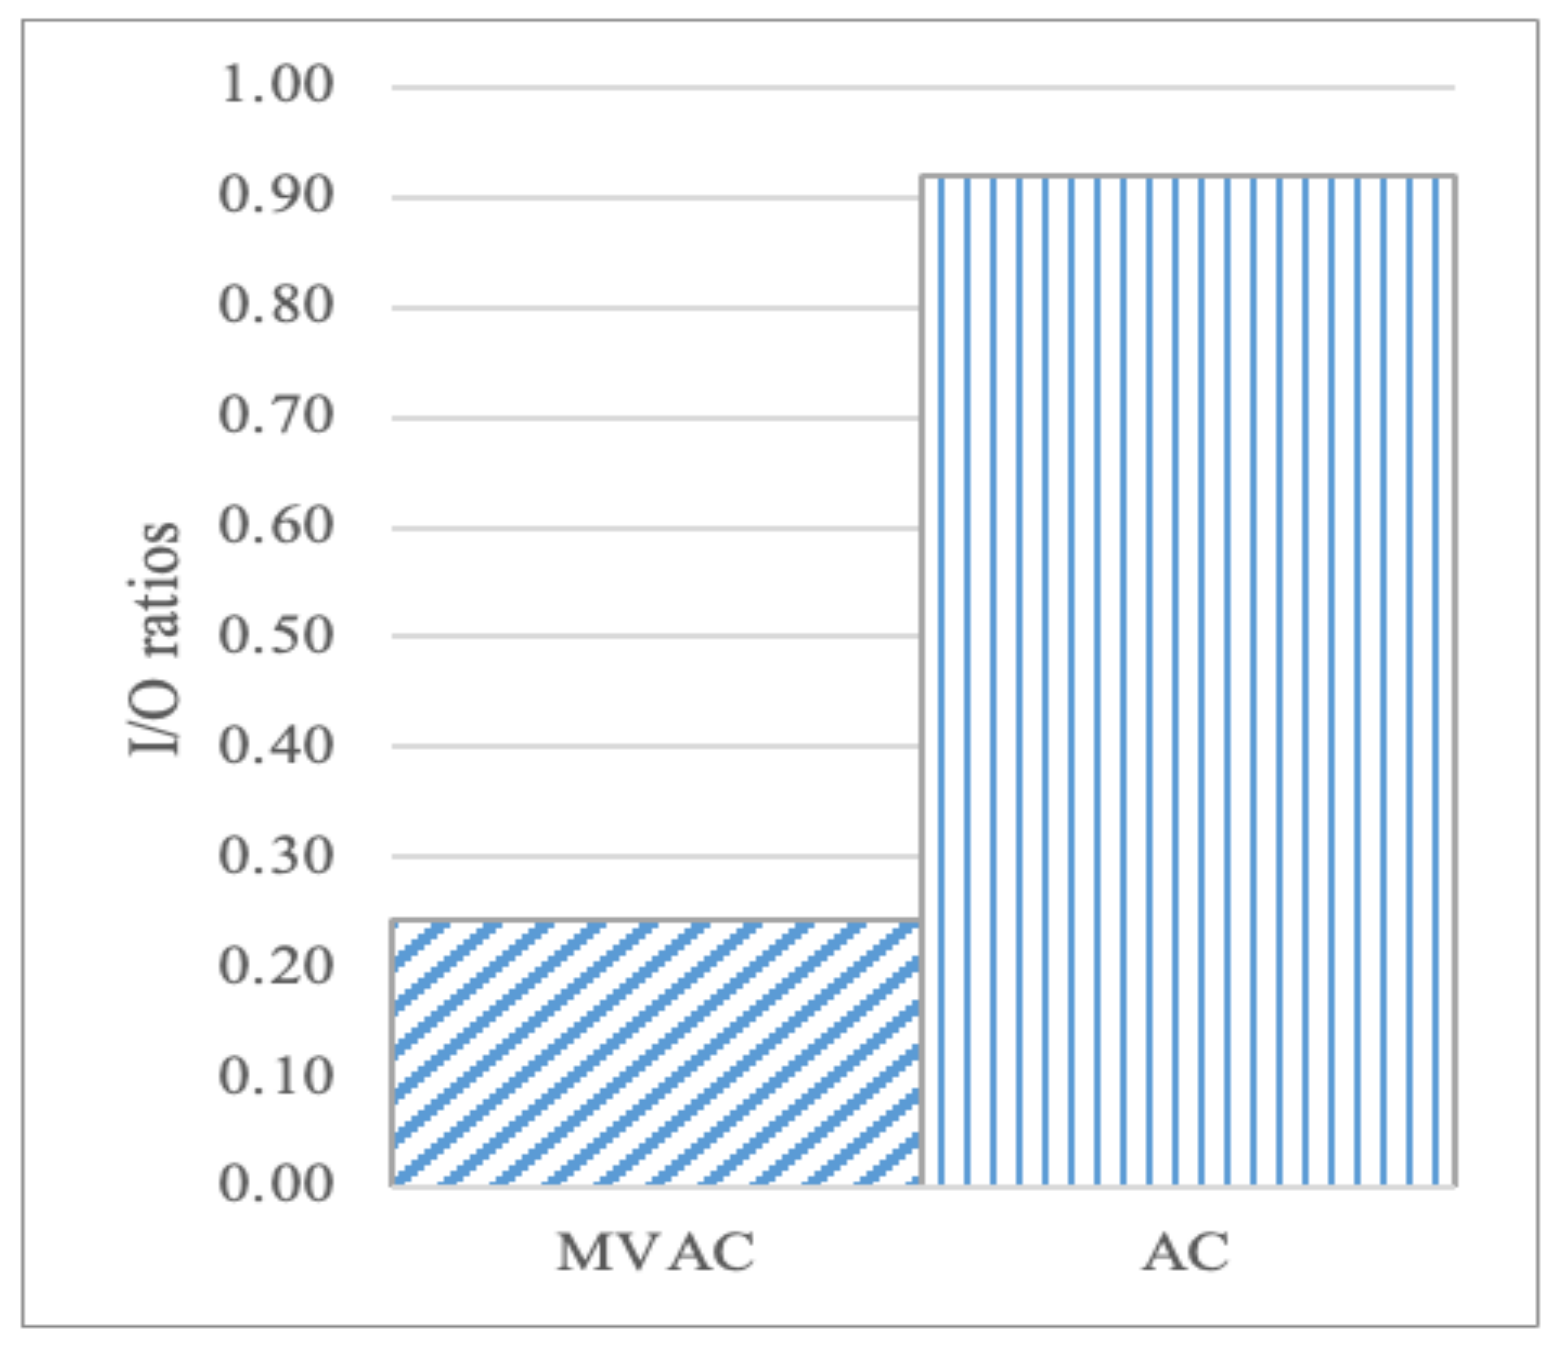
3.3. PM10 Indoor/Outdoor Ratio (I/O)
3.4. Total Hazard Ratio Indicator
4. Discussion
4.1. CO2 Concentration
4.2. PM10 and PM2.5
4.3. TVOC Concentration inside Building
4.4. Physical Parameter
4.5. Total Hazard Ratio Indicator
5. Conclusions
Study Limitation
Author Contributions
Funding
Data Availability Statement
Acknowledgments
Conflicts of Interest
References
- Spengler, J.D.; Samet, J.M.; MacCarthy, J.F. Indoor Air Quality Handbook; McGraw-Hill Education: New York, NY, USA, 2000. [Google Scholar]
- Carrer, P.; Wolkoff, P. Assessment of Indoor Air Quality Problems in Office-like Environments: Role of Occupational Health Services. Int. J. Environ. Res. Public Health 2018, 15, 741. [Google Scholar] [CrossRef] [PubMed] [Green Version]
- Wargocki, P.; Sundell, J.; Biskos, G.; Brundrett, G.; Fanger, P.O.; Gyntelberg, F.; Hanssen, S.O.; Harrison, P.; Pickering, A.; Seppanen, O.; et al. Ventilation and Health in Non—Industrial Indoor Environments: Report from a European Multidisciplinary Scientific Consensus Meeting (EUROVEN). Indoor Air 2002, 12, 113–128. [Google Scholar] [CrossRef]
- Department of Occupational Safety and Health. Industry Code of Practice on Indoor Air Quality; Department of Occupational Safety and Health (DOSH): Putrajaya, Malaysia, 2010; ISBN 983201471-3.
- Ma, F.; Zhan, C. Investigation and Evaluation of Winter Indoor Air Quality of Primary Schools in Severe Cold Weather Area of China. Energies 2019, 12, 1602. [Google Scholar] [CrossRef] [Green Version]
- Wu, Y.; Lu, Y.; Chou, D. Indoor Air Quality Investigation of a University Library Based on Field Measurement and Questionnaire Survey. Int. J. Low-Carbon Technol. 2018, 13, 148–160. [Google Scholar] [CrossRef]
- Goyal, G.; Phukan, A.C.; Hussain, M.; Lal, V.; Modi, M.; Goyal, M.K.; Sehgal, R. Critical Review on Emerging Health Effects Associated with the Indoor Air Quality and Its Sustainable Management. J. Neurol. Sci. 2023, 872, 116544. [Google Scholar]
- Azuma, K.; Ikeda, K.; Kagi, N.; Yanagi, U.; Osawa, H. Prevalence and Risk Factors Associated with Nonspecific Building-Related Symptoms in Office Employees in Japan: Relationships between Work Environment, Indoor Air Quality, and Occupational Stress. Indoor Air 2015, 25, 499–511. [Google Scholar] [CrossRef]
- Babaoglu, U.T. Sick Building Symptoms among Hospital Workers Associated with Indoor Air Quality and Personal Factors. Indoor Built Environ. 2020, 29, 645–655. [Google Scholar] [CrossRef]
- Maddalena, R.; Mendell, M.J.; Eliseeva, K.; Chan, W.R.; Sullivan, D.P.; Russell, M.; Satish, U.; Fisk, W.J. Effects of Ventilation Rate per Person and per Floor Area on Perceived Air Quality, Sick Building Syndrome Symptoms, and Decision-Making. Indoor Air 2015, 25, 362–370. [Google Scholar] [CrossRef]
- Lukcso, D.; Guidotti, T.L.; Franklin, D.E.; Burt, A. Indoor Environmental and Air Quality Characteristics, Building-Related Health Symptoms, and Worker Productivity in a Federal Government Building Complex. Arch. Environ. Occup. Health 2016, 71, 85–101. [Google Scholar] [CrossRef]
- Al Horr, Y.; Arif, M.; Katafygiotou, M.; Mazroei, A.; Kaushik, A.; Elsarrag, E. Impact of Indoor Environmental Quality on Occupant Well-Being and Comfort: A Review of the Literature. Int. J. Sustain. Built Environ. 2016, 5, 1–11. [Google Scholar] [CrossRef]
- Stabile, L.; Dell’Isola, M.; Russi, A.; Massimo, A.; Buonanno, G. The Effect of Natural Ventilation Strategy on Indoor Air Quality in Schools. Sci. Total Environ. 2017, 595, 894–902. [Google Scholar] [CrossRef] [PubMed]
- Kamaruzzaman, S.N.; Azmal, A.M. Evaluation of Occupants’ Well-Being and Perception towards Indoor Environmental Quality in Malaysia Affordable Housing. J. Facil. Manag. 2019, 17, 90–106. [Google Scholar] [CrossRef]
- Mahyuddin, N.; Awbi, H.B. A Review of CO2 Measurement Procedures in Ventilation Research. Int. J. Vent. 2012, 10, 353–370. [Google Scholar]
- Seppanen, O.A.; Fisk, W.J.; Mendell, M.J. Association of Ventilation Rates and CO2 Concentrations with Health and Other Responses in Commercial and Institutional Buildings. Indoor Air 1999, 9, 226–252. [Google Scholar] [CrossRef] [Green Version]
- Licina, D.; Melikov, A.; Pantelic, J.; Sekhar, C.; Tham, K.W. Human Convection Flow in Spaces with and without Ventilation: Personal Exposure to Floor-Released Particles and Cough-Released Droplets. Indoor Air 2015, 25, 672–682. [Google Scholar] [CrossRef] [Green Version]
- Wong, L.T.; Mui, K.W. An Energy Performance Assessment for Indoor Environmental Quality (IEQ) Acceptance in Air-Conditioned Offices. Energy Convers. Manag. 2009, 50, 1362–1367. [Google Scholar] [CrossRef]
- Afroz, R.; Hassan, M.N.; Ibrahim, N.A. Review of Air Pollution and Health Impacts in Malaysia. Environ. Res. 2003, 92, 71–77. [Google Scholar] [CrossRef]
- Rahman, S.A.; Hamzah, M.S.; Elias, M.S.; Salim, N.A.A.; Hashim, A.; Shukor, S.; Siong, W.B.; Wood, A.K. A Long Term Study on Characterization and Source Apportionment of Particulate Pollution in Klang Valley, Kuala Lumpur. Aerosol Air Qual. Res. 2015, 15, 2291–2304. [Google Scholar] [CrossRef]
- Xing, Y.F.; Xu, Y.H.; Shi, M.H.; Lian, Y.X. The Impact of PM2.5 on the Human Respiratory System. J. Thorac. Dis. 2016, 8, E69–E74. [Google Scholar]
- Weisel, C.P.; Alimokhtari, S.; Sanders, P.F. Indoor Air VOC Concentrations in Suburban and Rural New Jersey. Environ. Sci. Technol. 2008, 42, 8231–8238. [Google Scholar] [CrossRef] [Green Version]
- Solomon, S.J.; Schade, G.W.; Kuttippurath, J.; Ladstätter-Weissenmayer, A.; Burrows, J.P. VOC Concentrations in an Indoor Workplace Environment of a University Building. Indoor Built Environ. 2008, 17, 260–268. [Google Scholar] [CrossRef]
- Brown, S.K.; Sim, M.R.; Abramson, M.J.; Gray, C.N. Concentrations of Volatile Organic Compounds in Indoor Air—A Review. Indoor Air 1994, 4, 123–134. [Google Scholar] [CrossRef]
- Wolkoff, P. Indoor Air Humidity, Air Quality, and Health—An Overview. Int. J. Hyg. Environ. Health 2018, 221, 376–390. [Google Scholar] [CrossRef] [PubMed]
- Malik, A.; Shaharudin, R.; Abd Razak, A.; Mat Nawi, M.R.; Mohamad, M.F.; Shaikh Salim, S.A.Z. Prevalence and Risk Factors for Respiratory Symptoms among Children at Child Care Centers in Malaysia. Sci. Technol. Built Environ. 2020, 27, 129–138. [Google Scholar] [CrossRef]
- Leung, D.Y.C. Outdoor-Indoor Air Pollution in Urban Environment: Challenges and Opportunity. Front. Environ. Sci. 2015, 2, 69. [Google Scholar] [CrossRef] [Green Version]
- Asere, L.; Mols, T.; Blumberga, A. Assessment of Indoor Air Quality in Renovated Buildings of Liepāja Municipality. Energy Procedia 2016, 91, 907–915. [Google Scholar] [CrossRef] [Green Version]
- Šujanová, P.; Rychtáriková, M.; Mayor, T.S.; Hyder, A. A Healthy, Energy-Efficient and Comfortable Indoor Environment, a Review. Energies 2019, 12, 1414. [Google Scholar] [CrossRef] [Green Version]
- Jones, A.P. Indoor Air Quality and Health. Atmos. Environ. 1999, 33, 4535–4564. [Google Scholar] [CrossRef]
- Datta, A.; Suresh, R.; Gupta, A.; Singh, D.; Kulshrestha, P. Indoor Air Quality of Non-Residential Urban Buildings in Delhi, India. Int. J. Sustain. Built Environ. 2017, 6, 412–420. [Google Scholar] [CrossRef]
- Naz, M.Y.; Sulaiman, S.A.; Syukrullah, S.; Sagir, M. Investigation of Air Quality and Suspended Particulate Matter inside and Outside of University Research Laboratories. Appl. Sci. Res. 2014, 9, 43–53. [Google Scholar] [CrossRef]
- Wu, Y.L.; Kuo, Y.Z.; Liu, Y.L.; Chen, H.C.; Cheng, Y.J.; Yen, H.C. Analysis of Indoor Air Quality for the Split-Type Air Conditioner with Air Change Function in an Office Environment. Appl. Mech. Mater. 2013, 328, 328–333. [Google Scholar] [CrossRef]
- Sireesha, N.L. Correlation amongst Indoor Air Quality, Ventilation and Carbon Dioxide. J. Sci. Res. 2017, 9, 179–192. [Google Scholar] [CrossRef] [Green Version]
- Kumar, P.; Hama, S.; Abbass, R.A.; Nogueira, T.; Brand, V.S.; Wu, H.W.; Abulude, F.O.; Adelodun, A.A.; de Fatima Andrade, M.; Asfaw, A.; et al. CO2 Exposure, Ventilation, Thermal Comfort and Health Risks in Low-Income Home Kitchens of Twelve Global Cities. J. Build. Eng. 2022, 61, 105254. [Google Scholar] [CrossRef]
- Prill, R. Why Measure Carbon Dioxide Inside Buildings? Washington State University Extension Energy Program: Spokane, WA, USA, 2000; pp. 1–5. [Google Scholar]
- Varjo, J.; Hongisto, V.; Haapakangas, A.; Maula, H.; Koskela, H.; Hyönä, J. Simultaneous Effects of Irrelevant Speech, Temperature and Ventilation Rate on Performance and Satisfaction in Open-Plan Offices. J. Environ. Psychol. 2015, 44, 16–33. [Google Scholar] [CrossRef] [Green Version]
- Tungjai, A.; Kubaha, K. Indoor Air Quality Evaluation of Isolation Room for Hospital in Thailand. Energy Procedia 2017, 138, 858–863. [Google Scholar] [CrossRef]
- McCunney, R.J. Health and Productivity: A Role for Occupational Health Professionals. J. Occup. Environ. Med. 2001, 43, 30–35. [Google Scholar] [CrossRef] [PubMed]
- Kim, J.; Hong, T.; Lee, M.; Jeong, K. Analyzing the Real-Time Indoor Environmental Quality Factors Considering the Influence of the Building Occupants’ Behaviors and the Ventilation. Build. Environ. 2019, 156, 99–109. [Google Scholar] [CrossRef]
- Pantelic, J.; Rysanek, A.; Miller, C.; Peng, Y.; Teitelbaum, E.; Meggers, F.; Schlüter, A. Comparing the Indoor Environmental Quality of a Displacement Ventilation and Passive Chilled Beam Application to Conventional Air-Conditioning in the Tropics. Build. Environ. 2018, 130, 128–142. [Google Scholar] [CrossRef]
- Llewellyn, D.; Dixon, M. 4.26 Can Plants Really Improve Indoor Air Quality. In Comprehensive Biotechnology, 2nd ed.; Academic Press: Burlington, MA, USA, 2011; pp. 331–338. [Google Scholar]
- Lazovic, I.; Stevanovic, Z.; Jovasevic-Stojanovic, M.; Zivkovic, M.; Banjac, M. Impact of CO2 Concentration on Indoor Air Quality and Correlation with Relative Humidity and Indoor Air Temperature in School Buildings in Serbia. Therm. Sci. 2016, 20, S297–S307. [Google Scholar] [CrossRef]
- Schweizer, C.; Edwards, R.D.; Bayer-Oglesby, L.; Gauderman, W.J.; Ilacqua, V.; Juhani Jantunen, M.; Lai, H.K.; Nieuwenhuijsen, M.; Künzli, N. Indoor Time-Microenvironment-Activity Patterns in Seven Regions of Europe. J. Expo. Sci. Environ. Epidemiol. 2007, 17, 170–181. [Google Scholar] [CrossRef] [Green Version]
- Hamidi, Z.S.; Shariff, N.N.M.; Monstein, C. Understanding Climate Changes in Malaysia through Space Weather Study. Int. Lett. Nat. Sci. 2014, 13, 9–16. [Google Scholar] [CrossRef]
- Akther, T.; Ahmed, M.; Shohel, M.; Ferdousi, F.K.; Salam, A. Particulate Matters and Gaseous Pollutants in Indoor Environment and Association of Ultra-Fine Particulate Matters (PM 1) with Lung Function. Environ. Sci. Pollut. Res. 2019, 26, 5475–5484. [Google Scholar] [CrossRef]
- Gupta, A.; Goyal, R.; Kulshreshtha, P.; Jain, A. Environmental Monitoring of PM2.5 and CO2 in Indoor Office Spaces of Delhi, India. In Proceedings of the Indoor Environmental Quality: Select Proceedings of the 1st ACIEQ, New Delhi, India, 1–2 February 2019; Springer: Berlin/Heidelberg, Germany, 2020; pp. 67–76. [Google Scholar]
- World Health Organization. WHO Guidelines for Indoor Air Quality: Selected Pollutants; World Health Organization (WHO): Copenhagen, Denmark, 2010. [Google Scholar]
- Deshpande, B.K.; Frey, H.C.; Cao, Y. Modeling of the Penetration of Ambient PM2.5 to Indoor Residential Microenvironment. In Proceedings of the 102nd Annual Conference and Exhibition, Air & Waste Management Association, Detroit, MI, USA, 16–19 June 2009; pp. 1–11. [Google Scholar]
- Goyal, R.; Khare, M. Indoor Air Quality Modeling for PM10, PM2.5, and PM1.0 in Naturally Ventilated Classrooms of an Urban Indian School Building. Environ. Monit. Assess. 2011, 176, 501–516. [Google Scholar] [CrossRef]
- Molhave, L.; Clausen, G.; Berglund, B.; De Ceaurriz, J.; Kettrup, A.; Lindvall, T.; Maron, M.; Pickering, A.; Rothweiler, H.; Seifert, B.; et al. Total Volatile Organic Compounds (TVOC) in Indoor Air Quality Investigations. Indoor Air 1997, 7, 225–240. [Google Scholar] [CrossRef]
- Wong, L.T.; Mui, K.W.; Hui, P.S. A Statistical Model for Characterizing Common Air Pollutants in Air-Conditioned Offices. Atmos. Environ. 2006, 40, 4246–4257. [Google Scholar] [CrossRef]
- Hodgson, A.T. Volatile Organic Compound Concentrations and Emission Rates in New Manufactured and Site-Built Houses. Indoor Air 2000, 10, 178–192. [Google Scholar] [CrossRef] [PubMed] [Green Version]
- Weschler, C.J. Changes in Indoor Pollutants since the 1950s. Atmos. Environ. 2009, 43, 153–169. [Google Scholar] [CrossRef]
- Tang, X.; Misztal, P.K.; Goldstein, A.H. Volatile Organic Compound Emissions from Humans Indoors. Environ. Sci. Technol. 2016, 50, 12686–12694. [Google Scholar] [CrossRef] [Green Version]
- Campagnolo, D.; Saraga, D.E.; Cattaneo, A.; Spinazzè, A.; Mandin, C.; Mabilia, R.; Perreca, E.; Sakellaris, I.; Canha, N.; Mihucz, V.G.; et al. VOCs and Aldehydes Source Identification in European Office Buildings—The OFFICAIR Study. Build. Environ. 2017, 115, 18–24. [Google Scholar] [CrossRef]
- Goodman, N.B.; Wheeler, A.J.; Paevere, P.J.; Selleck, P.W.; Cheng, M.; Steinemann, A. Indoor Volatile Organic Compounds at an Australian University. Build. Environ. 2018, 135, 344–351. [Google Scholar] [CrossRef]
- Colman Lerner, J.E.; Gutierrez, M.D.L.A.; Mellado, D.; Giuliani, D.; Massolo, L.; Sanchez, E.Y.; Porta, A. Characterization and Cancer Risk Assessment of VOCs in Home and School Environments in Gran La Plata, Argentina. Environ. Sci. Pollut. Res. 2018, 25, 10039–10048. [Google Scholar] [CrossRef]
- Caro, J.; Gallego, M. Environmental and Biological Monitoring of Volatile Organic Compounds in the Workplace. Chemosphere 2009, 77, 426–433. [Google Scholar] [CrossRef]
- Hodgson, A.T.; Fisk, W.J.; Mendell, M.J.; Brinke, J.T.E.N. Volatile Organic Compounds in Twelve California Office Buildings: Classes, Concentrations and Sources. Atmos. Environ. 1994, 28, 3557–3562. [Google Scholar]
- Lee, S.C.; Lam, S.; Kin Fai, H. Characterization of VOCs, Ozone, and PM10 Emissions from Office Equipment in an Environmental Chamber. Build. Environ. 2001, 36, 837–842. [Google Scholar] [CrossRef]
- Destaillats, H.; Maddalena, R.L.; Singer, B.C.; Hodgson, A.T.; McKone, T.E. Indoor Pollutants Emitted by Office Equipment: A Review of Reported Data and Information Needs. Atmos. Environ. 2008, 42, 1371–1388. [Google Scholar] [CrossRef] [Green Version]
- Jo, W.; Sohn, J. The Effect of Environmental and Structural Factors on Indoor Air Quality of Apartments in Korea. Build. Environ. 2009, 44, 1794–1802. [Google Scholar] [CrossRef]
- Son, B.; Breysse, P.; Yang, W. Volatile Organic Compounds Concentrations in Residential Indoor and Outdoor and Its Personal Exposure in Korea. Environ. Int. 2003, 29, 79–85. [Google Scholar] [CrossRef]
- De Gennaro, G.; Farella, G.; Marzocca, A.; Mazzone, A.; Tutino, M. Indoor and Outdoor Monitoring of Volatile Organic Compounds in School Buildings: Indicators Based on Health Risk Assessment to Single out Critical Issues. Int. J. Environ. Res. Public Health 2013, 10, 6273–6291. [Google Scholar] [CrossRef] [PubMed] [Green Version]


| Parameter | Bank 1 | Bank 2 | Bank 3 | Bank 4 | Bank 5 | Bank 6 |
|---|---|---|---|---|---|---|
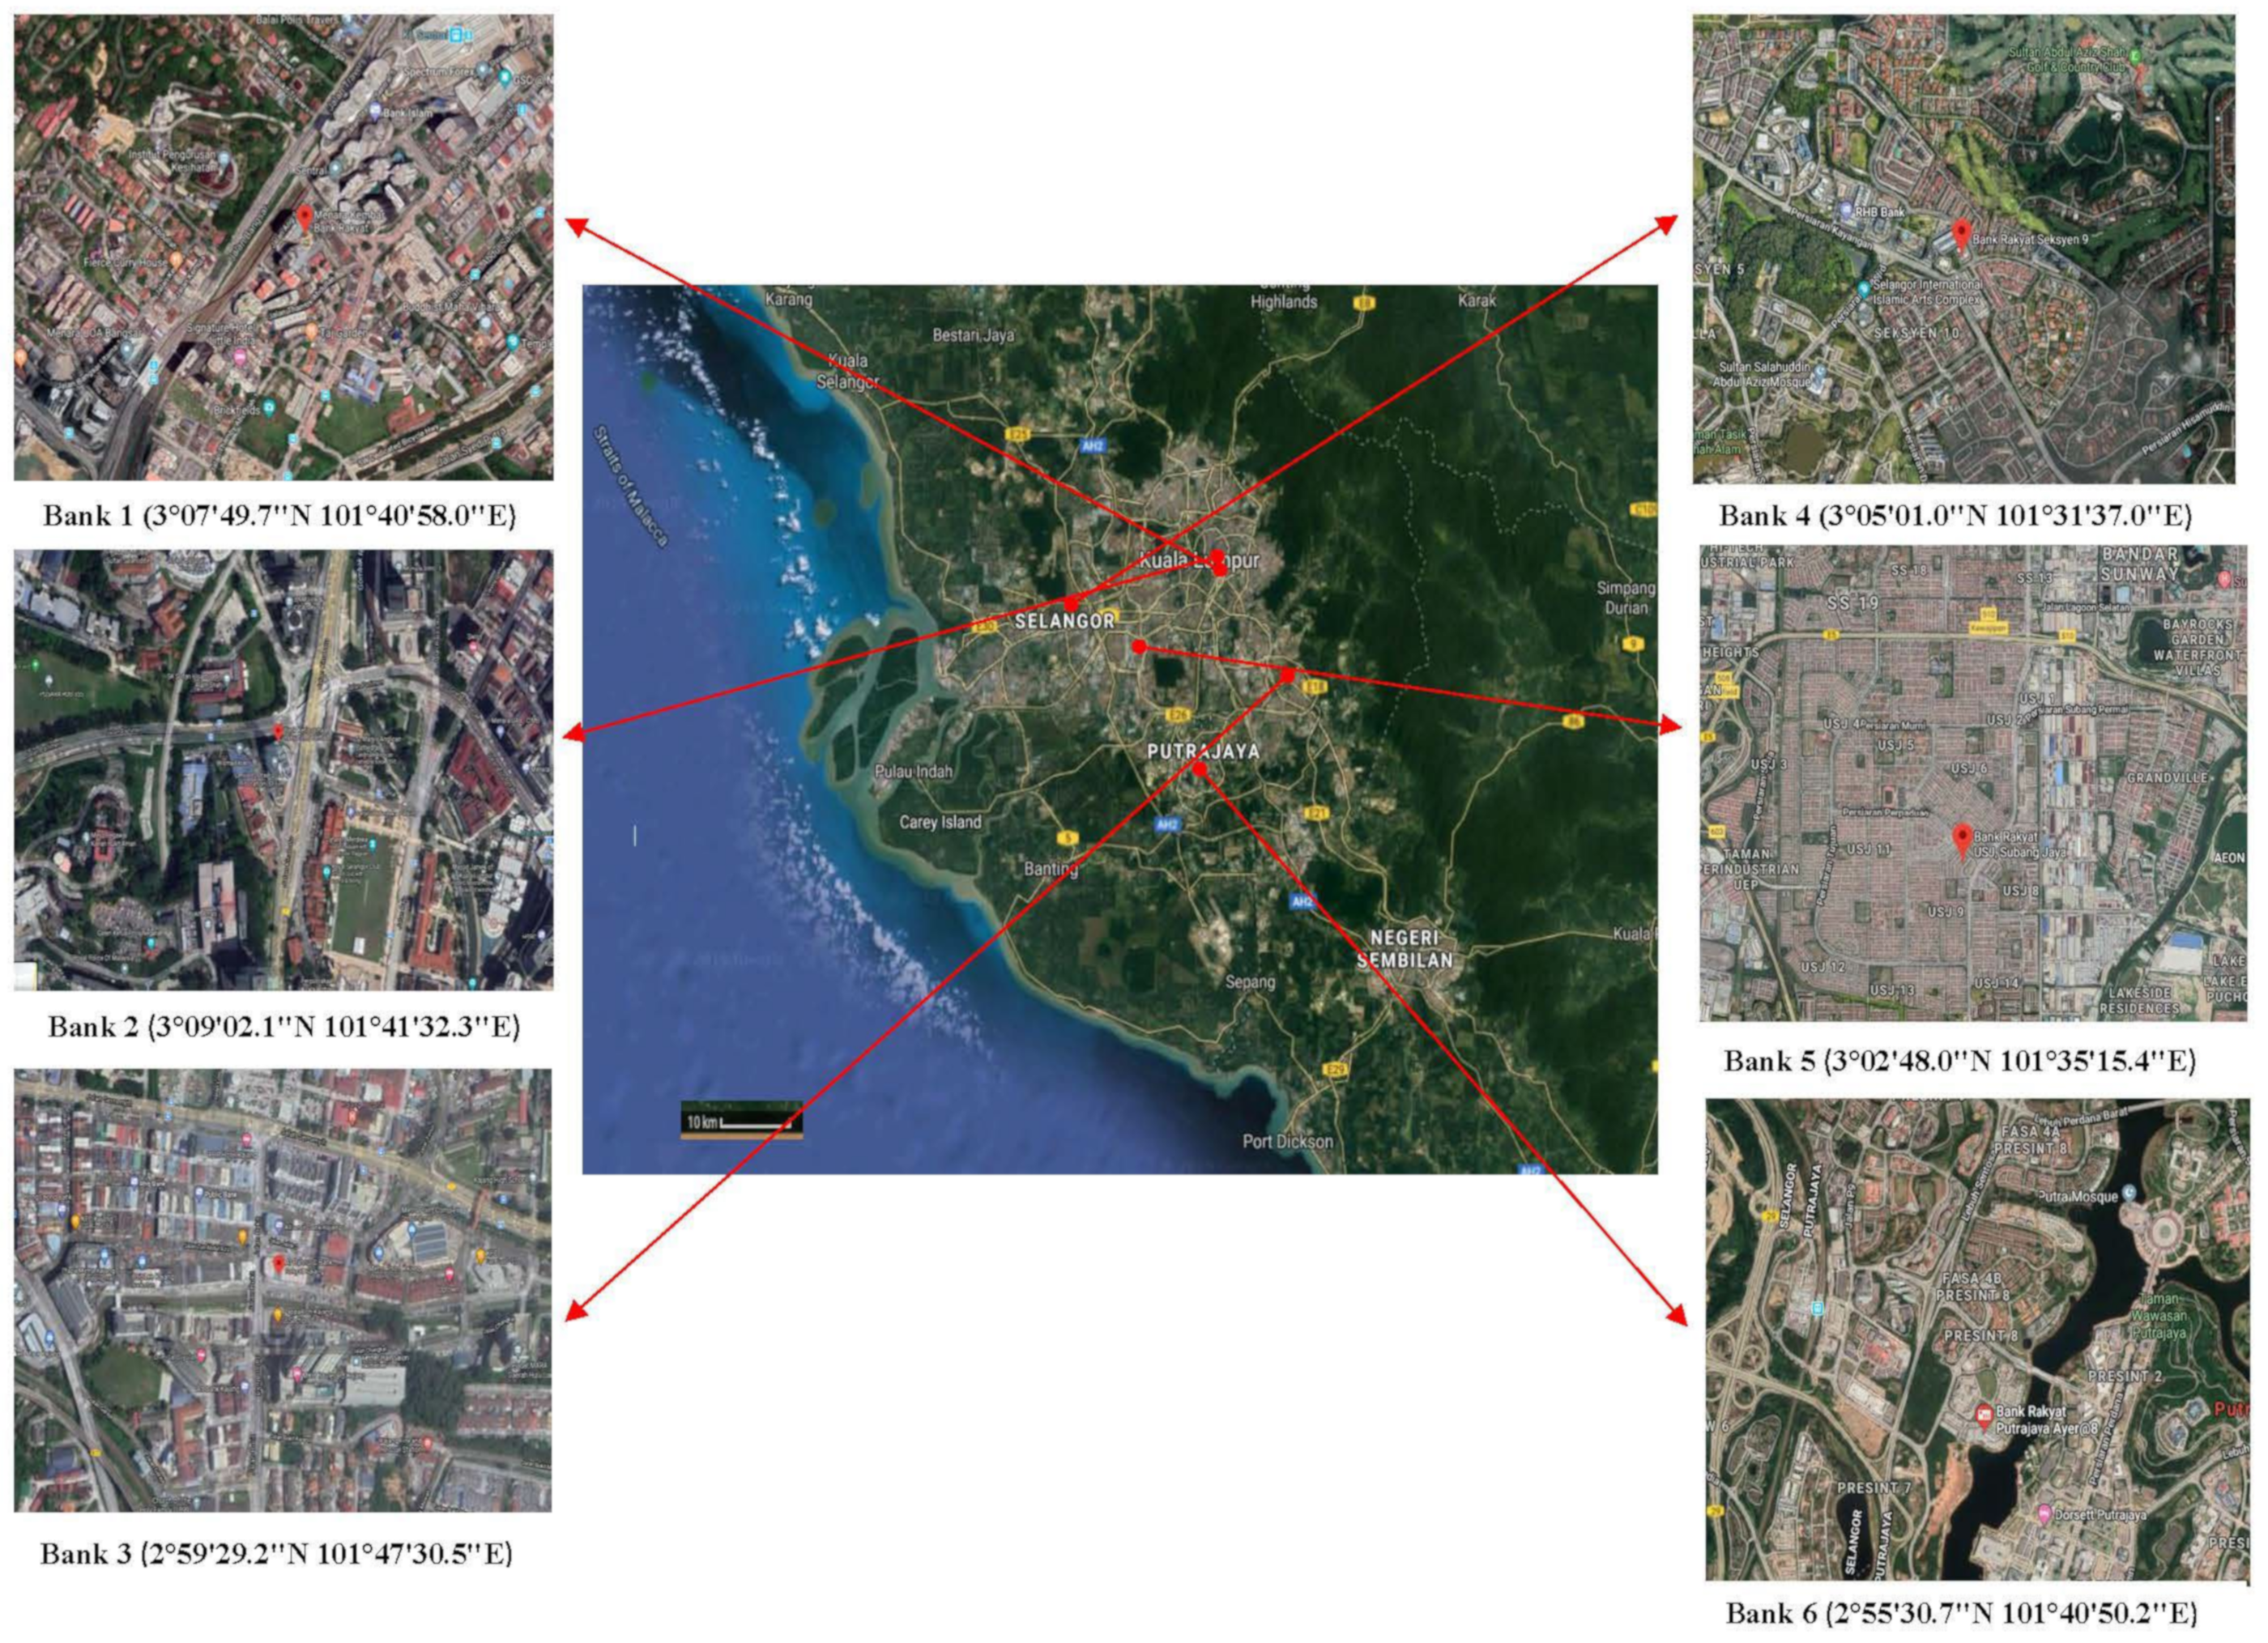
| Location | Brickfield, KL | Jalan Tangsi, KL | Kajang | Seksyen 9, Shah Alam | USJ, Subang Jaya | Putrajaya |
| Type of building | Ground floor, high rise building | Ground floor, high rise building | 2 story commercial building | 2 story commercial building | 2 story commercial building | 3 story commercial building |
| Year of construction | 2014 | 1982 | 2008 | 1996 | 1996 | 2015 |
| Ventilation type | ACMV | ACMV | AC | AC | AC | AC |
| Vault volume [m3] | 22.56 | 202.37 | 22.66 | 39.18 | 25.14 | 28.38 |
| Operation Division volume [m3] | 189.70 | 860.30 | 149.73 | 140.50 | 134.60 | 193.67 |
| Occupant (min-max) | 9–18 | 8–16 | 10–26 | 10–34 | 6–18 | 4–22 |
| Environment | Town, High traffic | Town, High traffic | Town, High traffic | Town, Low traffic | Town, Low traffic | Town, Low traffic |
| Door area [m2] | 4.1 | 4.1 | 4.1 | 4.1 | 4.1 | 4.1 |
| Floor type [Operation Division] | Tile & Carpet | Tile | Tile | Tile | Tile | Tile & Carpet |
| Floor type [Vault] | cement | Carpet | Cement | cement | cement | cement |
| Bank 1 | Bank 2 | Bank 3 | Bank 4 | Bank 5 | Bank 6 | Reference Standard | |||||||||||||||||||
|---|---|---|---|---|---|---|---|---|---|---|---|---|---|---|---|---|---|---|---|---|---|---|---|---|---|
| Ventilation Type | ACMV | ACMV | AC | AC | AC | AC | |||||||||||||||||||
| IAQ Parameter | Mean | SD | Min | Max | Mean | SD | Min | Max | Mean | SD | Min | Max | Mean | SD | Min | Max | Mean | SD | Min | Max | Mean | SD | Min | Max | |
| CO2 (ppm) | 920.1 | 143.2 | 744 | 1128 | 640.9 | 18.35 | 615 | 700 | 1560 | 205.6 | 1050 | 1877 | 1465 | 168.4 | 1102 | 1716 | 1093 | 135.8 | 934 | 1399 | 1027 | 72.14 | 784 | 1112 | 1000 ppm (ICOP/ASHRAE) |
| PM2.5 (μg/m3) | 7.23 | 2.41 | 4.00 | 13.00 | 12.06 | 1.29 | 10.00 | 17.00 | 27.44 | 10.48 | 15.40 | 57.70 | 26.72 | 2.89 | 21.00 | 37.00 | 18.72 | 1.90 | 16.00 | 25.00 | 30.63 | 6.67 | 20.00 | 45.00 | 25 μg/m3 (WHO) |
| PM10 (μg/m3) | 8.28 | 2.60 | 5.00 | 15.00 | 13.00 | 1.30 | 11.00 | 18.00 | 29.17 | 10.30 | 17.00 | 60.00 | 30.62 | 2.40 | 25.00 | 39.00 | 21.48 | 1.40 | 19.00 | 27.00 | 35.12 | 7.30 | 26.00 | 49.00 | 150 μg/m3 (ICOP) |
| TVOC (ppb) | 1113.2 | 16.46 | 58 | 133 | 607.7 | 38.76 | 525 | 666 | 118.9 | 30.39 | 68 | 185 | 160.4 | 35.08 | 114 | 229 | 187 | 34.95 | 35 | 237 | 143 | 18.83 | 58 | 159 | 3000 ppb (ICOP) |
| Temperature | 28.09 | 0.829 | 24.3 | 28.8 | 27.44 | 0.683 | 23.2 | 27.7 | 27.9 | 0.922 | 24.2 | 29 | 26.34 | 0.907 | 22.5 | 27.3 | 27.05 | 0.538 | 24.3 | 27.5 | 27.04 | 0.858 | 23.2 | 28.1 | 23–26 °C |
| RH (%RH) | 42.91 | 1.55 | 40 | 49 | 49.62 | 1.35 | 46.5 | 55 | 51.7 | 1.67 | 50 | 58.1 | 39.95 | 1.52 | 38.4 | 48.7 | 51.49 | 1.55 | 49.1 | 59.3 | 41.99 | 2.27 | 40 | 55.1 | 40–70% RH |
| Air Movement (m/s) | 0.01 | 0.05 | 0 | 0.02 | 0.005 | 0.018 | 0 | 0.1 | 0.012 | 0.027 | 0 | 0.1 | 0.001 | 0.004 | 0 | 0.02 | 0.002 | 0.006 | 0 | 0.03 | 0.014 | 0.004 | 0 | 0.15 | 0.15–0.5 m/s |
| Ventilation Type | ||||||
|---|---|---|---|---|---|---|
| ACMV | AC | |||||
| IAQ Parameter | Average | Min | Max | Average | Min | Max |
| CO2 (ppm) | 780.48 | 615 | 1128 | 1286.23 | 784 | 1877 |
| PM2.5 (μg/m3) | 9.64 | 4.00 | 17.00 | 25.88 | 15.40 | 57.70 |
| PM10 (μg/m3) | 10.64 | 5.00 | 18.00 | 29.10 | 17.00 | 60.00 |
| TVOC (ppb) | 360.46 | 58 | 666 | 152.34 | 35 | 237 |
| Temperature | 27.76 | 23.2 | 28.8 | 27.08 | 22.5 | 29.0 |
| RH (%RH) | 46.26 | 40 | 55 | 46.28 | 38.4 | 59.3 |
| Air movement (m/s) | 0.003 | 0.00 | 0.10 | 0.007 | 0.00 | 0.15 |
| Bank 1 | Bank 2 | Bank 3 | Bank 4 | Bank 5 | Bank 6 | Reference Standard | |||||||||||||||||||
|---|---|---|---|---|---|---|---|---|---|---|---|---|---|---|---|---|---|---|---|---|---|---|---|---|---|
| Ventilation Type | ACMV | ACMV | AC | AC | AC | AC | |||||||||||||||||||
| IAQ Parameter | Mean | SD | Min | Max | Mean | SD | Min | Max | Mean | SD | Min | Max | Mean | SD | Min | Max | Mean | SD | Min | Max | Mean | SD | Min | Max | |
| CO2 (ppm) | 925.6 | 96.59 | 709 | 1050 | 620.5 | 26.85 | 577 | 753 | 1315 | 107.6 | 1105 | 1523 | 1743 | 180 | 1296 | 1956 | 1328 | 74.63 | 1190 | 1472 | 1232 | 101.8 | 951 | 1522 | 1000 ppm (ICOP/ASHRAE) |
| PM2.5 (μg/m3) | 16.87 | 2.62 | 12.00 | 22.00 | 8.09 | 2.61 | 1.00 | 15.00 | 53.05 | 1.21 | 49.00 | 56.00 | 51.01 | 4.62 | 41.00 | 59.00 | 39.59 | 4.12 | 29.00 | 46.00 | 31.69 | 6.80 | 22.00 | 44.00 | 25 μg/m3 (WHO) |
| PM10 (μg/m3) | 18.45 | 2.70 | 13.00 | 24.00 | 9.34 | 2.90 | 4.00 | 17.00 | 54.68 | 1.50 | 51.00 | 55.00 | 54.90 | 5.00 | 52.00 | 54.00 | 42.64 | 4.30 | 30.00 | 49.00 | 35.84 | 7.30 | 25.00 | 49.00 | 150 μg/m3 (ICOP) |
| TVOC (ppb) | 538.8 | 23.75 | 430 | 570 | 22.32 | 3.366 | 18 | 30 | 139.6 | 10.47 | 121 | 165 | 167.9 | 13.6 | 151 | 200 | 157.8 | 13.82 | 97 | 179 | 223 | 25.47 | 84 | 268 | 3000 ppb (ICOP) |
| Temperature | 23.72 | 0.23 | 22.7 | 24.2 | 19.98 | 0.5 | 19.2 | 21.7 | 20.3 | 1.414 | 18.4 | 23 | 20.44 | 1.752 | 18.9 | 25.1 | 22.49 | 0.282 | 22.1 | 23.6 | 20.86 | 0.421 | 20.1 | 21.5 | 23–26 °C |
| RH (%RH) | 50.64 | 0.199 | 50.2 | 50.9 | 60.45 | 0.46 | 59.9 | 61.7 | 52.27 | 1.737 | 44.4 | 49.7 | 55.83 | 1.258 | 52.6 | 58.6 | 52.85 | 1.699 | 50.5 | 59.6 | 51.48 | 1.029 | 49.8 | 53.7 | 40–70% RH |
| Air Movement (m/s) | 0.124 | 0.013 | 0.11 | 0.17 | 0.079 | 0.013 | 0.05 | 0.11 | 0.152 | 0.055 | 0.09 | 0.31 | 0.06 | 0.03 | 0 | 0.12 | 0.057 | 0.007 | 0.05 | 0.09 | 0.015 | 0.007 | 0 | 0.03 | 0.15–0.5 m/s |
| Ventilation Type | ||||||
|---|---|---|---|---|---|---|
| ACMV | AC | |||||
| IAQ Parameter | Average | Min | Max | Average | Min | Max |
| CO2 (ppm) | 773.05 | 577 | 1050 | 1404.40 | 951 | 1956 |
| PM2.5 (μg/m3) | 12.48 | 1.00 | 22.00 | 43.84 | 22.00 | 59.00 |
| PM10 (μg/m3) | 13.90 | 4.00 | 24.00 | 47.02 | 25.00 | 55.00 |
| TVOC (ppb) | 281 | 18 | 570 | 172 | 84 | 268 |
| Temperature | 21.6 | 19.2 | 24.2 | 21.0 | 18.4 | 25.1 |
| RH (%RH) | 55.5 | 50.2 | 61.7 | 53.1 | 44.4 | 59.6 |
| Air movement (m/s) | 0.101 | 0.05 | 0.17 | 0.071 | 0.00 | 0.31 |
| Location | Type | CO2 | HR TVOC | PM10 | PM2.5 | THR |
|---|---|---|---|---|---|---|
| Bank 1 | ACMV | 0.92 | 0.04 | 0.06 | 0.29 | 1.30 |
| Bank 2 | ACMV | 0.64 | 0.20 | 0.09 | 0.48 | 1.41 |
| Bank 3 | AC | 1.56 | 0.04 | 0.19 | 1.10 | 2.89 |
| Bank 4 | AC | 1.46 | 0.05 | 0.20 | 1.07 | 2.79 |
| Bank 5 | AC | 1.09 | 0.06 | 0.14 | 0.74 | 2.04 |
| Bank 6 | AC | 1.03 | 0.05 | 0.23 | 1.23 | 2.54 |
| Total | 6.70 | 0.44 | 0.92 | 4.91 | 12.97 |
| Location | Type | CO2 | HR TVOC | PM10 | PM2.5 | THR |
|---|---|---|---|---|---|---|
| Bank 1 | ACMV | 0.93 | 0.18 | 0.12 | 0.67 | 1.90 |
| Bank 2 | ACMV | 0.62 | 0.01 | 0.06 | 0.32 | 1.01 |
| Bank 3 | AC | 1.32 | 0.05 | 0.36 | 2.12 | 3.85 |
| Bank 4 | AC | 1.74 | 0.06 | 0.37 | 2.04 | 4.21 |
| Bank 5 | AC | 1.33 | 0.05 | 0.28 | 1.58 | 3.25 |
| Bank 6 | AC | 1.23 | 0.07 | 0.24 | 1.27 | 2.81 |
| Total | 7.16 | 0.42 | 1.44 | 8.01 | 17.03 |
Disclaimer/Publisher’s Note: The statements, opinions and data contained in all publications are solely those of the individual author(s) and contributor(s) and not of MDPI and/or the editor(s). MDPI and/or the editor(s) disclaim responsibility for any injury to people or property resulting from any ideas, methods, instructions or products referred to in the content. |
© 2023 by the authors. Licensee MDPI, Basel, Switzerland. This article is an open access article distributed under the terms and conditions of the Creative Commons Attribution (CC BY) license (https://creativecommons.org/licenses/by/4.0/).
Share and Cite
Saidin, H.; Razak, A.A.; Mohamad, M.F.; Ul-Saufie, A.Z.; Zaki, S.A.; Othman, N. Hazard Evaluation of Indoor Air Quality in Bank Offices. Buildings 2023, 13, 798. https://doi.org/10.3390/buildings13030798
Saidin H, Razak AA, Mohamad MF, Ul-Saufie AZ, Zaki SA, Othman N. Hazard Evaluation of Indoor Air Quality in Bank Offices. Buildings. 2023; 13(3):798. https://doi.org/10.3390/buildings13030798
Chicago/Turabian StyleSaidin, Hamidi, Azli Abd Razak, Mohd Faizal Mohamad, Ahmad Zia Ul-Saufie, Sheikh Ahmad Zaki, and Nor’azizi Othman. 2023. "Hazard Evaluation of Indoor Air Quality in Bank Offices" Buildings 13, no. 3: 798. https://doi.org/10.3390/buildings13030798