1. Introduction
1.1. Overview
The indoor thermal environment is part of the indoor environmental quality and is closely influenced by climatic conditions [
1]. Thermal comfort deficiencies in buildings may affect occupants’ well-being [
2]. Building spaces in hot and humid climates are regularly uncomfortable due to high temperatures, relative humidity, and low air movement [
3], leading to thermal discomfort in the indoor space. In hot and humid climates such as Malaysia and Singapore, the recommended temperature setting should be maintained between 24 and 26 °C [
4,
5]. Thailand’s standards adhere to the American Society of Heating, Refrigerating, and Air-Conditioning Engineers (ASHRAE) standards [
6]—between 23 and 25 °C. However, indoor conditions are maintained based on design [
4] and mode of cultural habits concerning climatic conditions [
7].
The adaptations in any thermal condition primarily depend on a building’s physiology, environment, and behavior [
5,
8], with a conservative state of response under unfavorable conditions. The neutral thermal sensation in a condition of feeling neither cold nor hot is widely used when applying the American Society of Heating, Refrigerating and Air-Conditioning Engineers (ASHRAE) Standard 55—a seven-point thermal sensation scale to assess thermal comfort [
9]. People living in hotter climates tend to find lower temperatures to be thermally comfortable [
7]. Hence, the implicit correlation of relevant local and international standards regarding the findings of the observed acclimatization of indoor comfort—especially for non-commercial buildings—needs to be sufficiently studied. In contrast, personal factors based on gender and body mass index, along with adaptive behaviors such as drinking water and clothing insulation, are commonly associated with a substantial impact on the thermal comfort parameter to improve indoor thermal comfort. However, none of these studies has determined the statistical significance of personal characteristics with respect to thermal comfort requirements. The objectives of the present study on AC usage at various setpoint temperatures were as follows:
To evaluate the effects of personal characteristics and adaptive behavior on thermal comfort.
To estimate comfort at various indoor temperatures in a student activity room space based on field survey data.
To develop an adaptive model of thermal comfort in AC spaces.
To compare the estimated comfort temperature with local and international indoor thermal environmental standards.
The common perception that using the lowest thermostat setting helps speed up cooling for indoor spaces is wrong. People living in hot and humid climates such as Malaysia [
10] and Indonesia [
11] tend to use AC at the lowest setpoint temperature. In this scenario, the occupants in the cooling space might desire the indoor air temperature to correspond to the setpoint temperature of the AC. There is a potential interaction between indoor thermal conditions and human habitual adaptive behavior, adjusting to a comfortable indoor environment according to the occupants’ thermal expectations [
12]. In addition, all government offices in Malaysia are urged to offset the AC temperature no lower than 24 °C, as stated in Malaysia Standard-MS1525 [
13], to promote energy-efficient practices.
1.2. Significance of Study
The identified comfort temperature will represent the guidelines for the tolerable range of temperature settings for residential buildings equipped with AC in the living room in Malaysia. Enhanced indoor thermal comfort may improve the occupants’ satisfaction and help to attain environmental sustainability. Therefore, from the health point of view, optimal satisfaction with the indoor thermal environment is vital, as the thermal conditions may potentially cause the improper function of human physiological processes. It is becoming essential to maintaining thermally comfortable conditions for a healthy indoor living environment and a holistic quality of life in urban environments.
2. Literature Review
Residential Buildings with AC Modes
The vernacular residential buildings in the hot and humid study region were developed and designed with passive cooling components based on prevailing winds and the buildings’ orientation. However, the high demands of modern residential buildings have neglected the importance of local climatic conditions and the need for energy conservation. These have resulted in new buildings having overall poor thermal performance and the need for mechanical ventilation and AC, leading to a high energy consumption rate [
4]. In the future, demand for AC usage is forecast to grow, which will drive a 30% increase in global electricity demand by 2050 [
5]. ASHRAE defines thermal comfort as ‘the state of mind which expresses fulfillment with the thermal condition’ regarding climatic conditions, which drives occupants to experience the desired room comfort temperature. However, this might vary depending on activity, behavior, clothing insulation, and humidity [
14]. Interventions originating from unfavorable thermal comfort could cause the occupants to feel unpleasant regardless of enhancing the condition of rooms [
15]—for example, regulating AC setpoint temperatures to ensure appropriate thermal surroundings. A field study was conducted to facilitate the measurement of the thermal environment, and a survey was carried out for living rooms, with reference to residential buildings with AC cooling modes. A summary of previous studies of residential buildings with AC modes is presented in
Table 1.
This study’s originality might be the findings with respect to the thermal environment under different set temperatures. Regardless, the objective of the experiment was to explore the thermal comfort conditions in living rooms, where people are relaxed and exhibit a sedentary manner of activity. This is similar to the environment and respondents’ behavior in student activity rooms. The university building’s cooling systems are regularly controlled by centralized air-conditioning systems, making it inconvenient for researchers to intrude on the learning process, due to relatively high temperature changes from 16 to 28 °C.
3. Methodology
3.1. Climate of the Studied Area
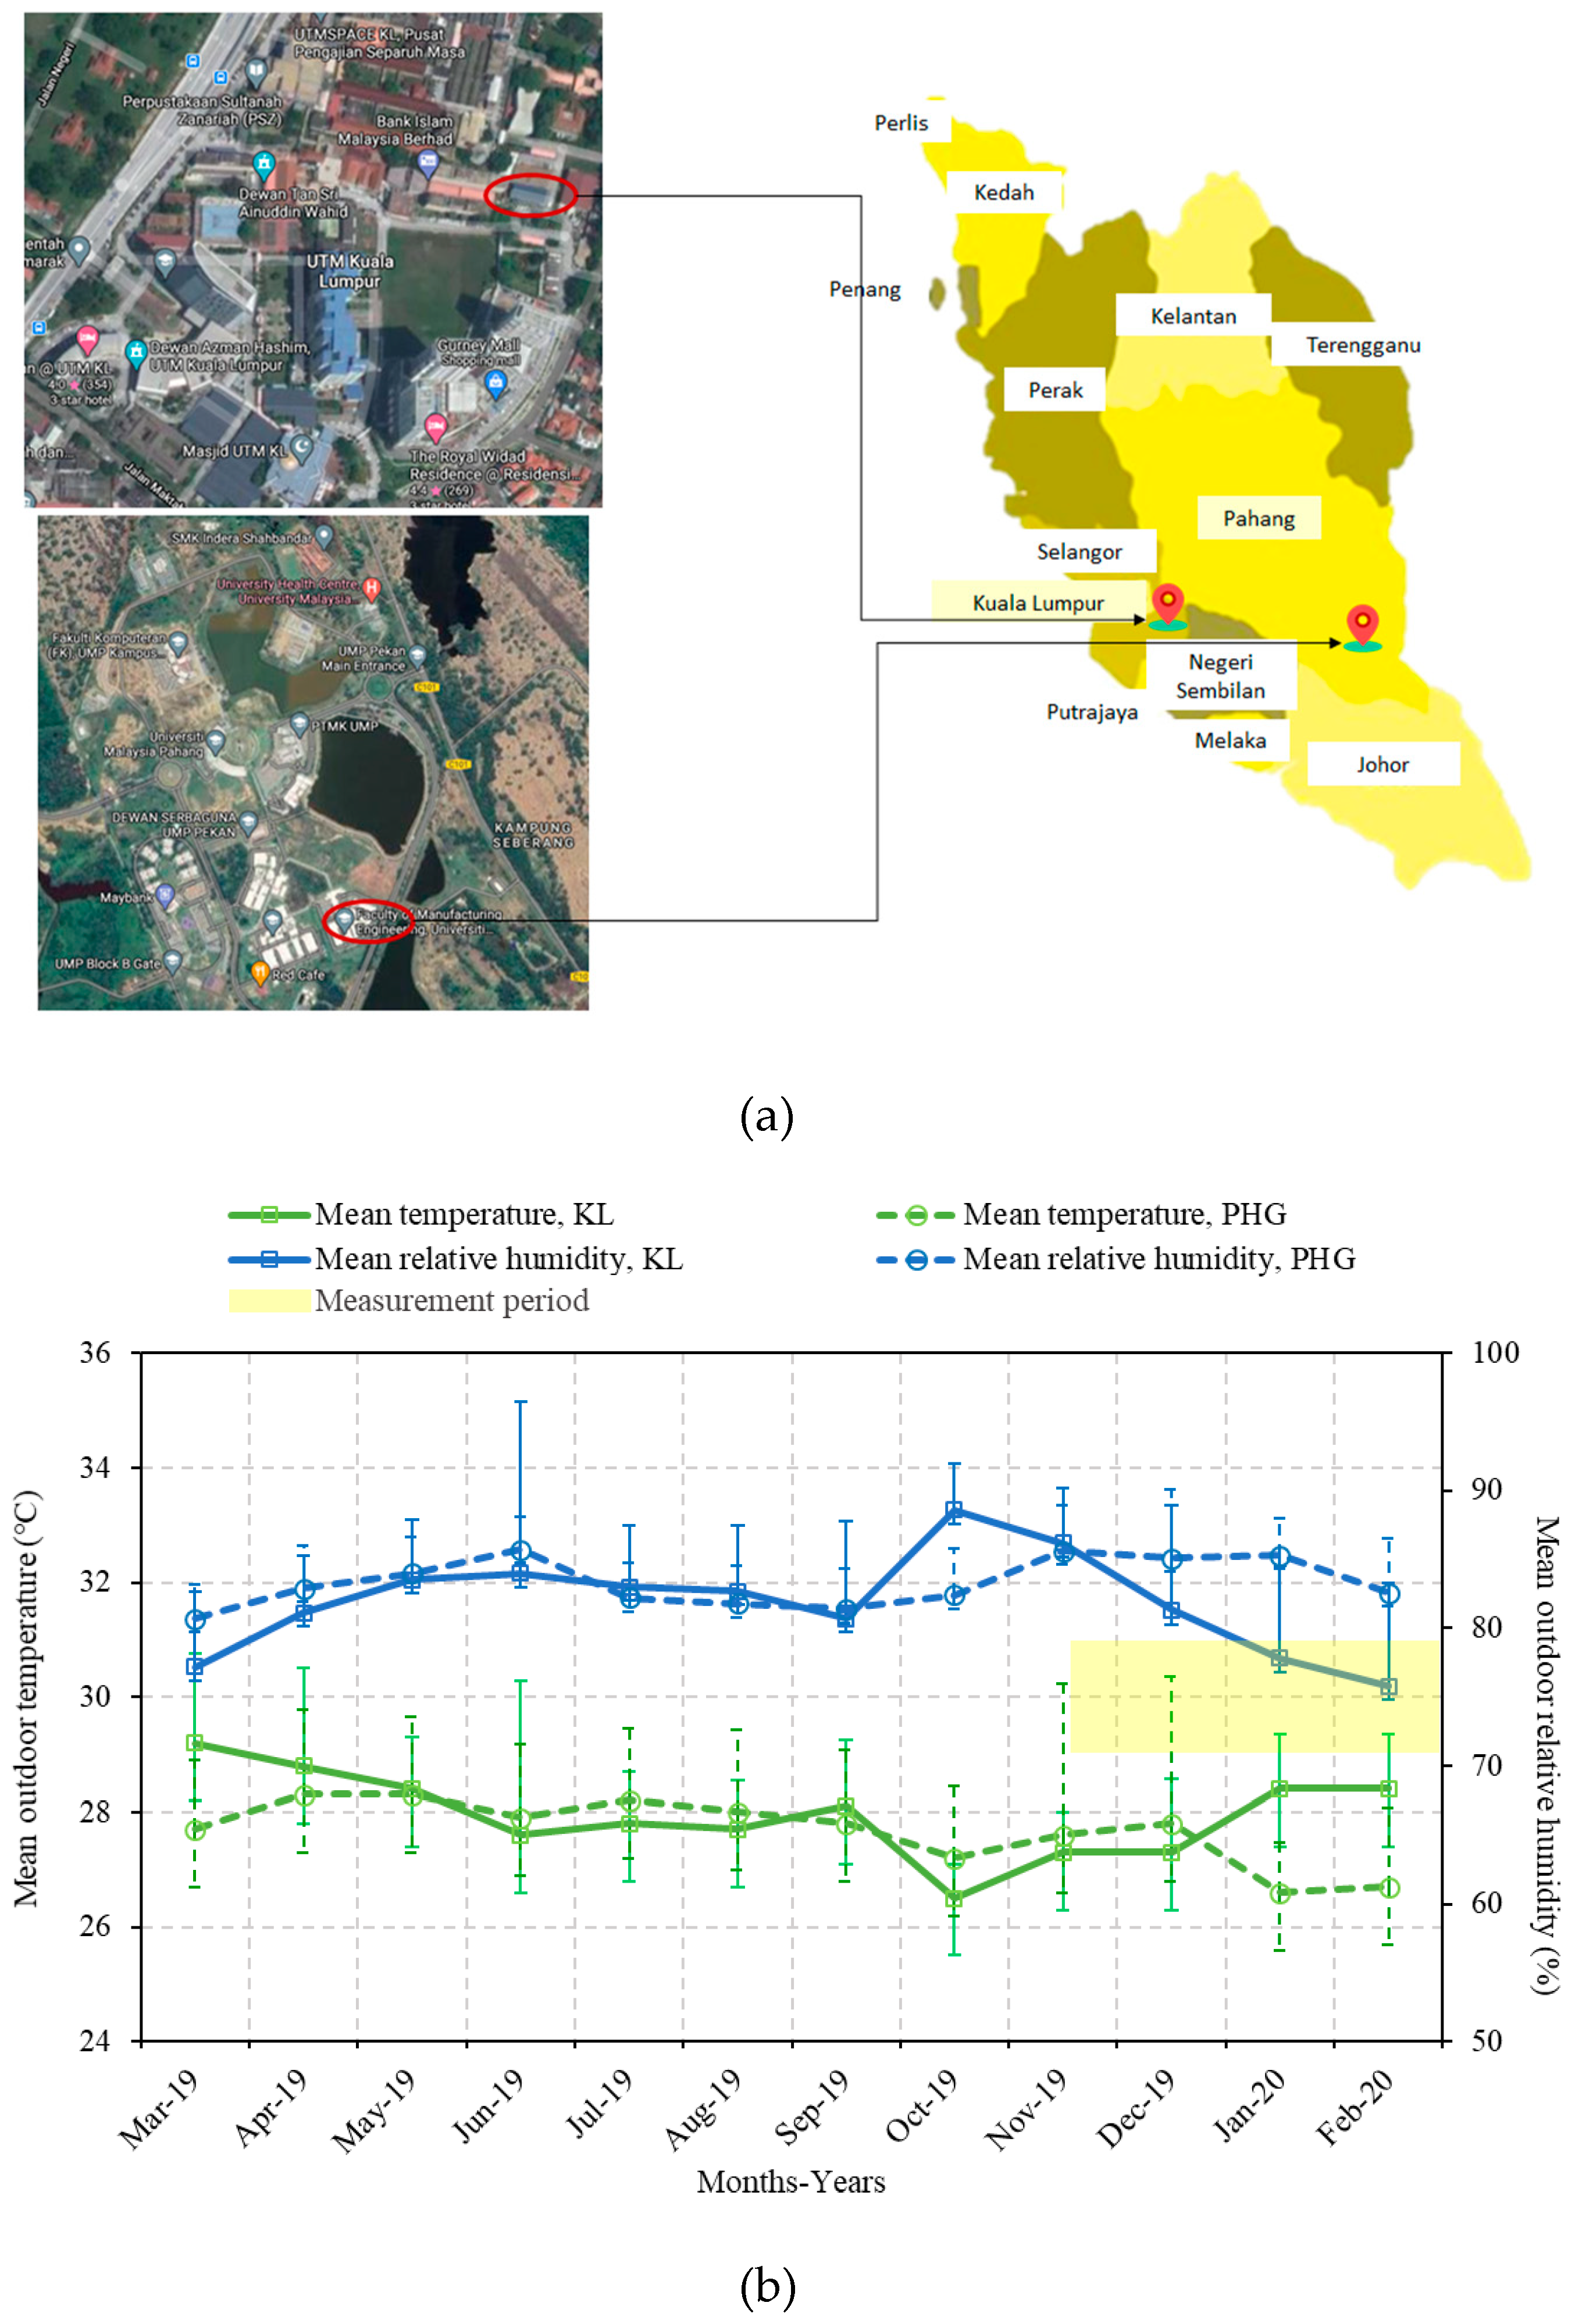
People who live in hot and humid climates must adapt to the climatic conditions, mainly characterized by high relative humidity (between 70 and 90%) and an ambient air temperature of 26 to 33 °C throughout the year [
34]. This study compared the similar characteristics of two buildings at different locations that experience the same geographic conditions (i.e., landforms, environment, and human activities). Annual variation in monthly outdoor air temperature and relative humidity was assessed according to measurements taken from March 2019 to February 2020 at the weather station installed at a height of 68 m on the rooftop of the Malaysia–Japan International Institute of Technology (MJIIT) building, Universiti Teknologi Malaysia, Kuala Lumpur, as well as on the ground near the building of Fakulti Kejuruteraan Pembuatan at Universiti Malaysia Pahang, Pekan, Pahang. The readings of mean outdoor air temperature and relative humidity recorded in Kuala Lumpur (3.1729° N; 101.7209° E) were 28 °C and 81%, respectively, while in Pahang (3.5437° N, 103.4289° E) they were 27.5 °C and 83%, respectively, as shown in
Figure 1.
3.2. Data Collection
Due to most residential buildings’ occupants going out for school/college/work or related activities during the day, people prefer to be undisturbed in their private lives and avoid disruptive equipment installation around the house. Student activity rooms provided a convenient place to facilitate the thermal environment measurements and to carry out the survey.
The aggregated data collected were 252 valid samples from 63 voluntary university students from May 2019 to February 2020. The focus on young adults among university students might be advantageous, as they prefer lower temperatures compared to the elderly [
35,
36]. In addition, student samples are prevalent in psychological studies, as these groups have been established to provide moderately good estimates as representative samples [
37]. However, only respondents in good health (i.e., not having the flu, cold, or fever, and currently not taking any medication) could proceed with the measurements. Field measurements and surveys were performed during the daytime between 8:00 and 17:00, subject to respondents’ availability.
3.3. Thermal Measurement
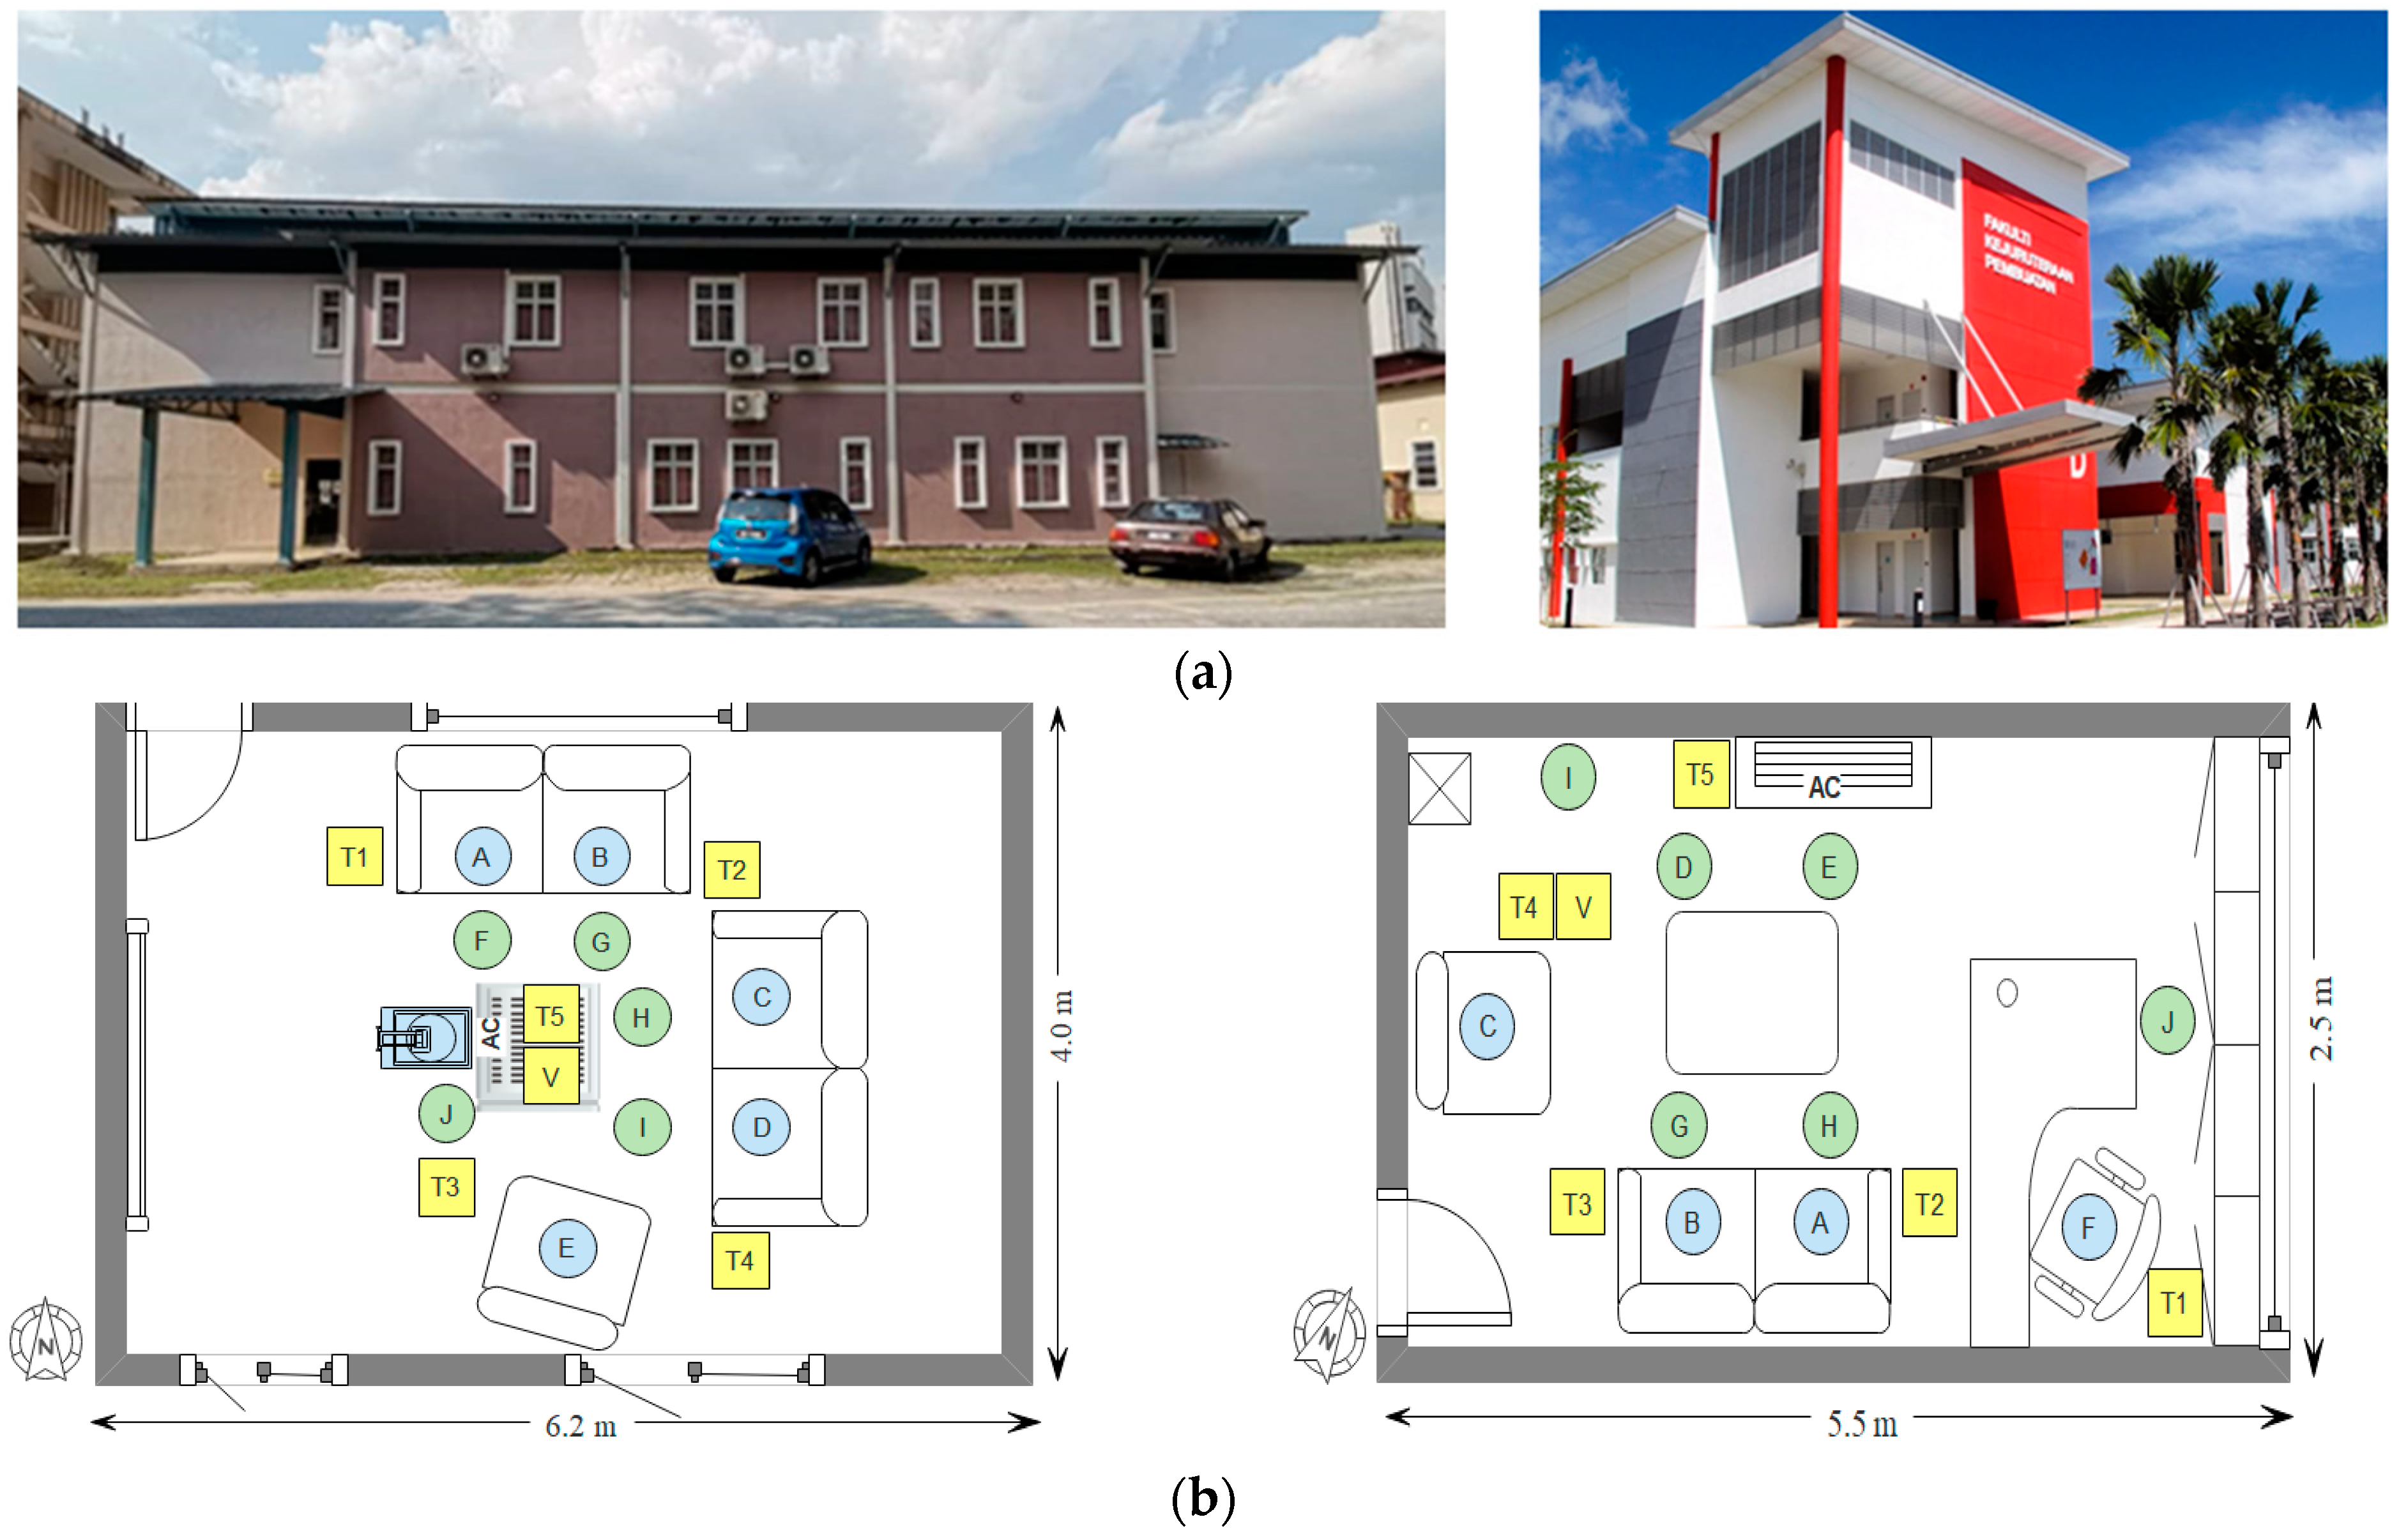
Field physical measurements and thermal comfort surveys were performed simultaneously for each AC setpoint temperature case in two student activity rooms. The student activity rooms are equipped with a split AC unit, couch, and coffee table, with an area of approximately 24.8 m
2 and 13.8 m
2, respectively. All equipment is mounted on a custom-made pipe stand installed at a height of 0.7 m from the floor within a radius of 1.0 m [
36,
37,
38], at the same height level as a normal sitting position. The studied building, its floor plan layout with the arrangement of the allowable seating locations and equipment (A–J refer to seating, while V refers to the location of the Kanomax hot-wire anemometer, and T1–T5 denote HOBO data loggers); the equipment setup, and photos of the respondents in the room are shown in
Figure 2. The equipment details are presented in
Table 2. All parameters of the indoor thermal environment were measured at 10 s intervals for an experimental period of approximately 45 min at each AC setpoint. The tips of the HOBO data logger sensors used to measure the air temperature were inserted into aluminum-foil-wrapped cups to improve their protection from direct radiation [
39,
40] and allow an accurate reading.
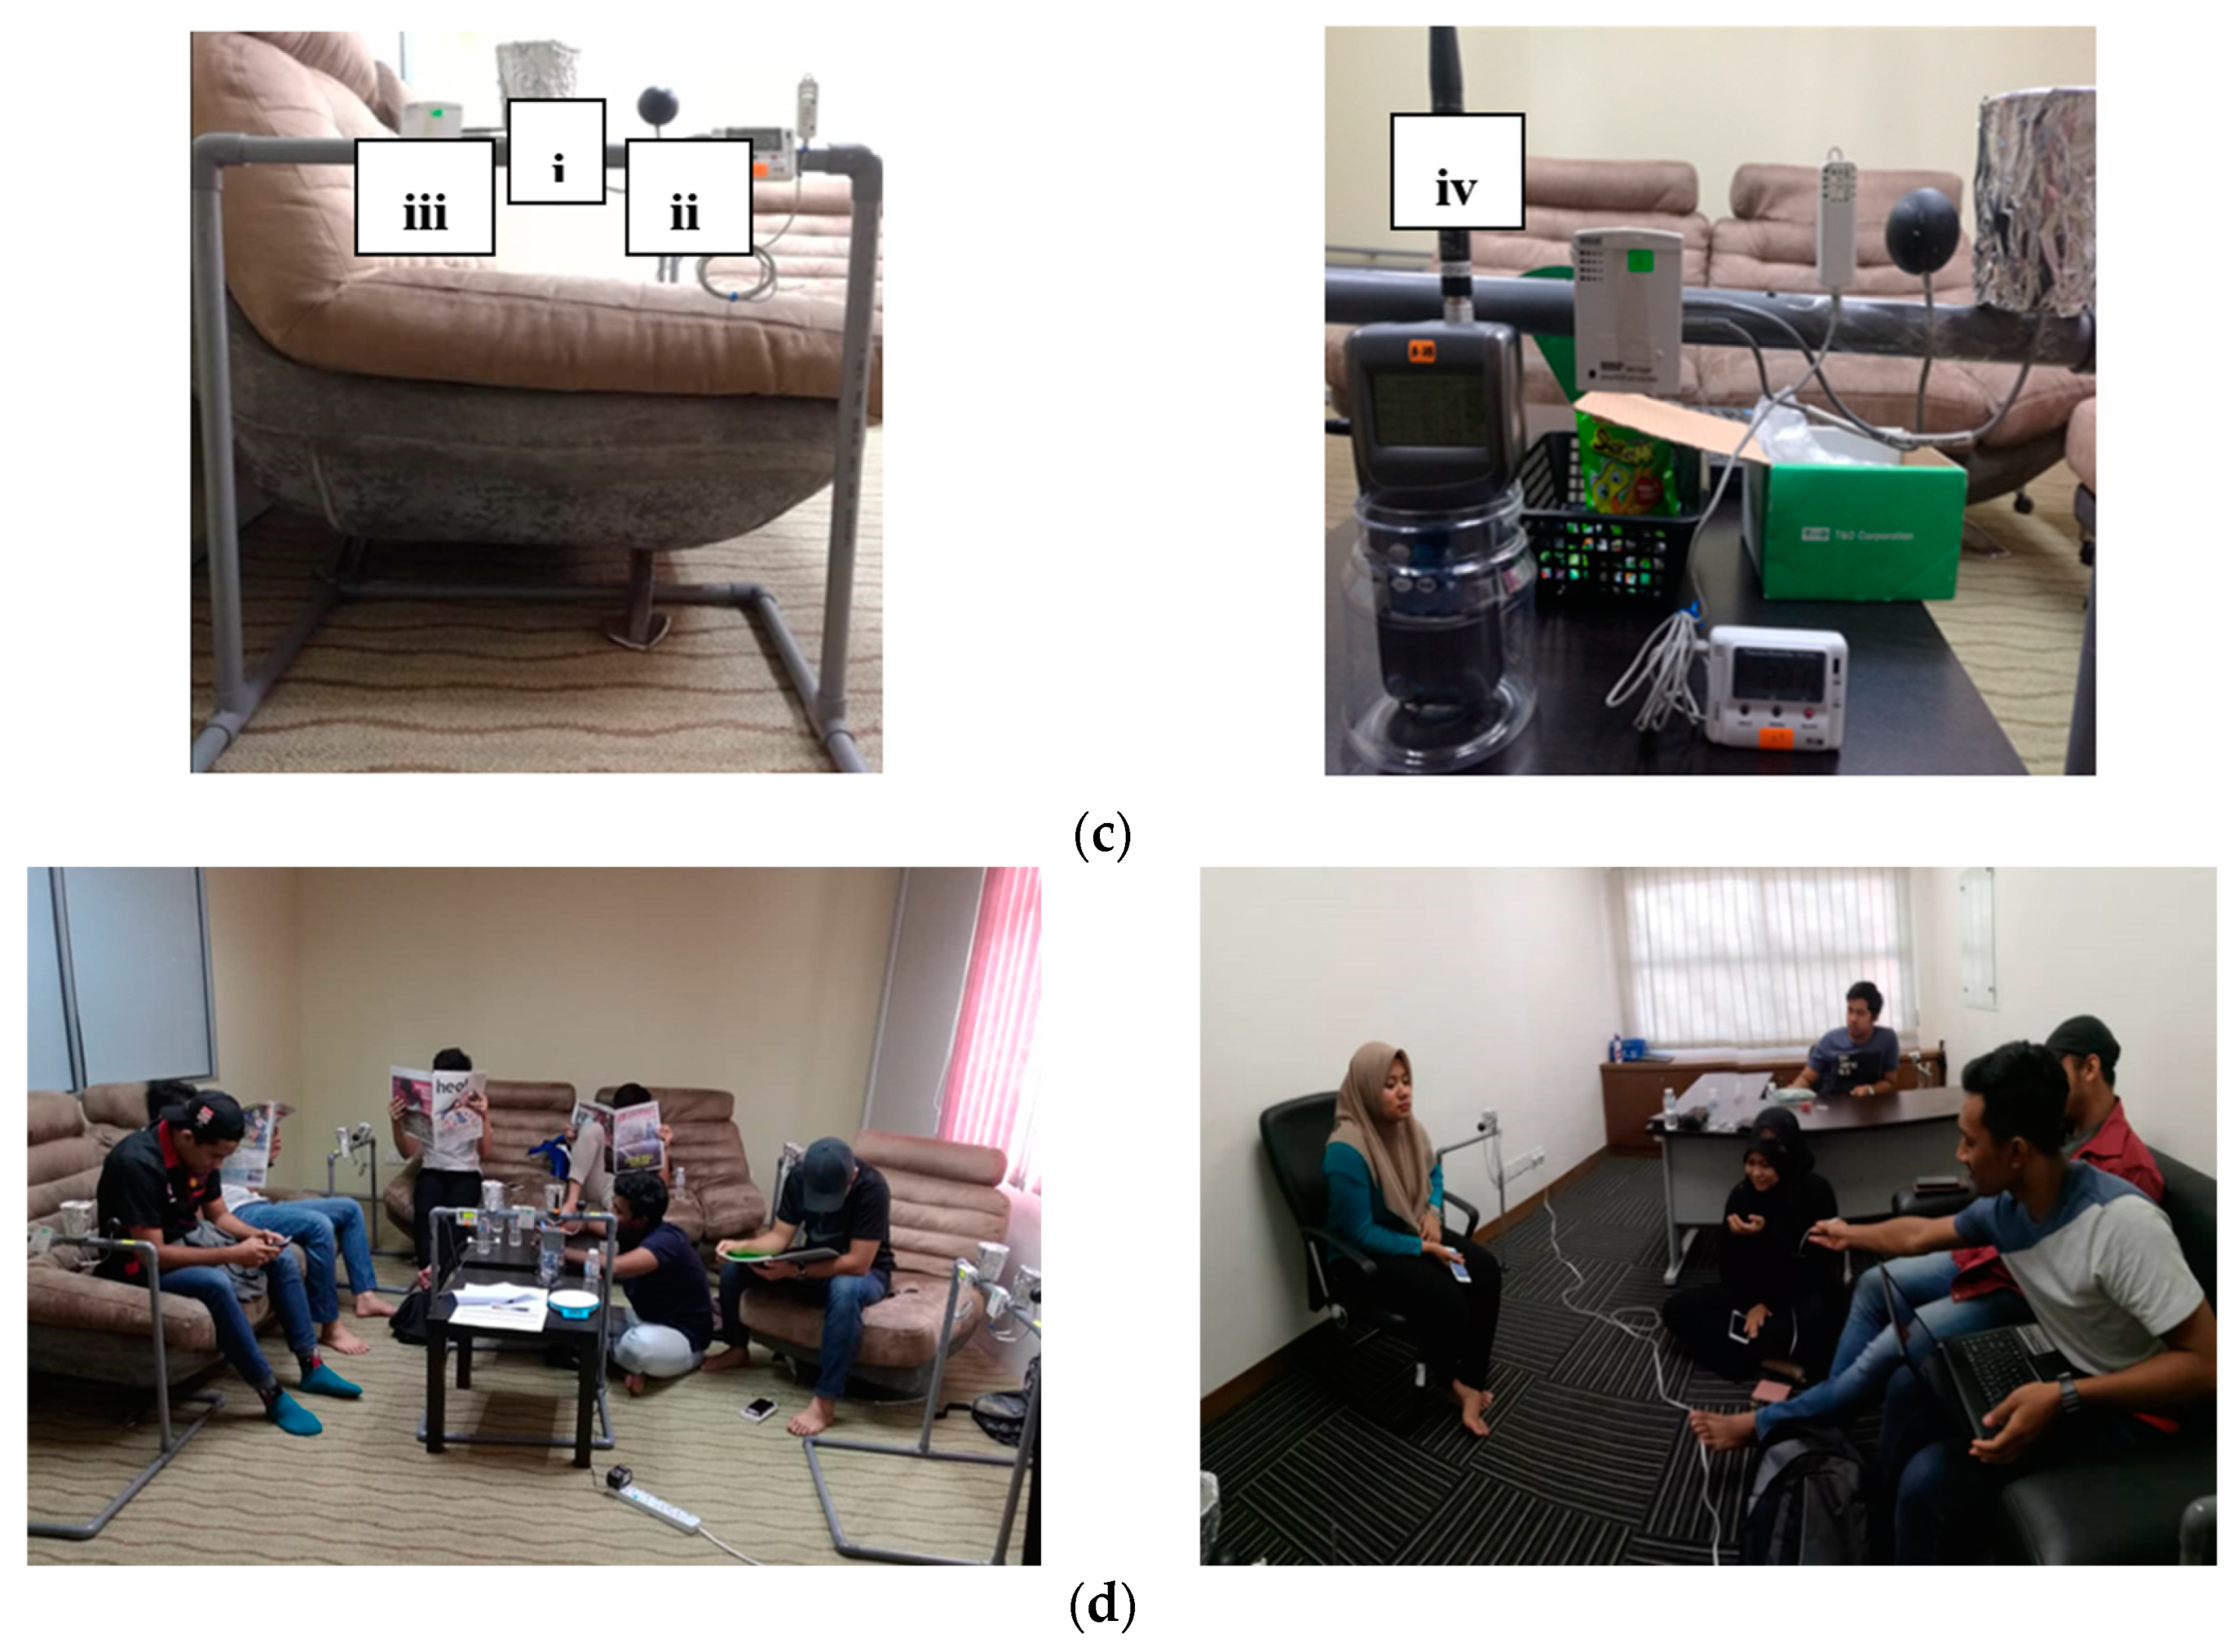
Respondents were exposed to setpoint temperatures of 16, 20, 24, and 28 °C in groups of 4–6 persons. Changing the current set temperature, wearing shoes, having a heavy meal, and exiting the room during the experiment were prohibited. Only certain low-intensity, passive physical activities were allowed (i.e., using a smartphone, reading, watching a movie or drama, having a low-volume chat, or sitting quietly). A 250 mL bottle of drinking water was provided and distributed to each respondent. Then, the amount of water intake was recorded. The data collected were analyzed using several statistical and analytical methods, which were determined through voting scales obtained from the physical and thermal measurements. The analysis method was performed using the International Business Machines (IBM) Statistical Package for Social Sciences (SPSS) software version 23. The two analytical methods used in this research to determine indoor comfort temperatures were Griffiths’ method and probit analysis. In addition, correlations, psychometric charts, and chi-squared tests were also used to describe the relationships between the variables with respect to the relevant thermal comfort parameters. The detailed structure of the research methodology followed to achieve each study objective is illustrated in
Figure 3.
3.4. Thermal Comfort Survey
This thermal comfort study was performed by administering a survey session to each group of students at the end of the experimental period before they left the room. The questionnaire survey, provided in English and accompanied by a Malay translation, was modified, improved, and compiled based on previous studies [
41,
42,
43], as in
Appendix A. The metabolic rate of the respondents was assumed to be 1.0 met, as only certain low-intensity physical activities could be performed throughout the experimental period. Post-occupancy evaluations (POEs) can be determined based on satisfaction with the indoor thermal environment. However, comprehensive aspects (e.g., lighting, indoor air quality, energy auditing) need to be considered in ensuring the possibility of meeting the buildings occupants’ demands, resulting in continuous improvements in the quality of the building space. In addition, tool development needs to be carefully enhanced in Malaysia, as currently there is no properly formatted adapted survey form [
44], as compared to the established methods in the United Kingdom, United States of America, Canada, and Australia [
45], which may not apply equally in other countries. It can be inferred that human satisfaction in different climates is likely to vary due to cultural differences [
46].
In this study, the thermal sensation vote (
TSV), the ASHRAE seven-point scale [
47], humidity sensation (
HS) [
48], and the air movement vote (
AMV) [
49] were the scales used, as shown in
Table 3. Additionally, the Nicol five-point scale [
42,
43] was used to assess thermal preference (
TP), a five-point scale was used to assess humidity preference (
HP), and a six-point scale was used to express overall comfort (
OC), as indicated in
Table 4.
4. Results and Discussion
4.1. Subject Characteristics
Groups of respondents consisting of university students (i.e., diploma, undergraduate, and postgraduate) participated in this study. By gender, the respondents were segregated into 42 (66.7%) males and 21 (33.3%) females. Their age range was only between 19 and 30 years old, with the mean age of respondents being within their 20 s. The range of ensemble clothing for females was between 0.19 and 0.54 clo, while the males were collectively between 0.14 and 0.47 clo (i.e., t-shirts, long trousers or shorts, and one-piece dresses). The body mass index data showed that almost 60% of the respondents had an ideal score—between 18.5 and 24.9 kg/m2—while the rest were overweight based on the calculation of weight measured in kilograms divided by the square of height in meters.
4.2. Indoor Environmental Data
The measured thermal variables of air temperature, globe temperature, relative humidity, and air speed were obtained directly from the data logging equipment. The estimated parameters of mean radiant temperature, operative temperature, and absolute humidity were determined based on calculations made under various indoor thermal conditions. The results from field measurements and surveys were compiled. The descriptive statistics of mean values and the standard deviation of each parameter are presented in
Table 5. The average indoor air temperature was measured only during the field measurement period with AC usage, and differences in the measured temperature were often due to humidity in the indoor air [
37]. The highest temperatures were recorded during sunny days in the afternoon. This occurrence proves that the outdoor climate is related to the factors of change in indoor thermal conditions [
50], as the indoor temperature was strongly correlated with outdoor temperature during warm outdoor conditions [
51,
52]. The results showed that the highest measured
difference was 2–3 °C, based on setpoint temperatures of 16 and 20 °C. The results for setpoints of 24 and 28 °C showed lower readings for measured indoor temperature. This phenomenon demonstrates that AC users underestimated the higher setpoints and the indoor thermal environment. The acceptable indoor conditions were correlated with the outdoor temperature, which was beneficial to assess the building’s performance and specifications [
53].
4.3. Thermal Responses
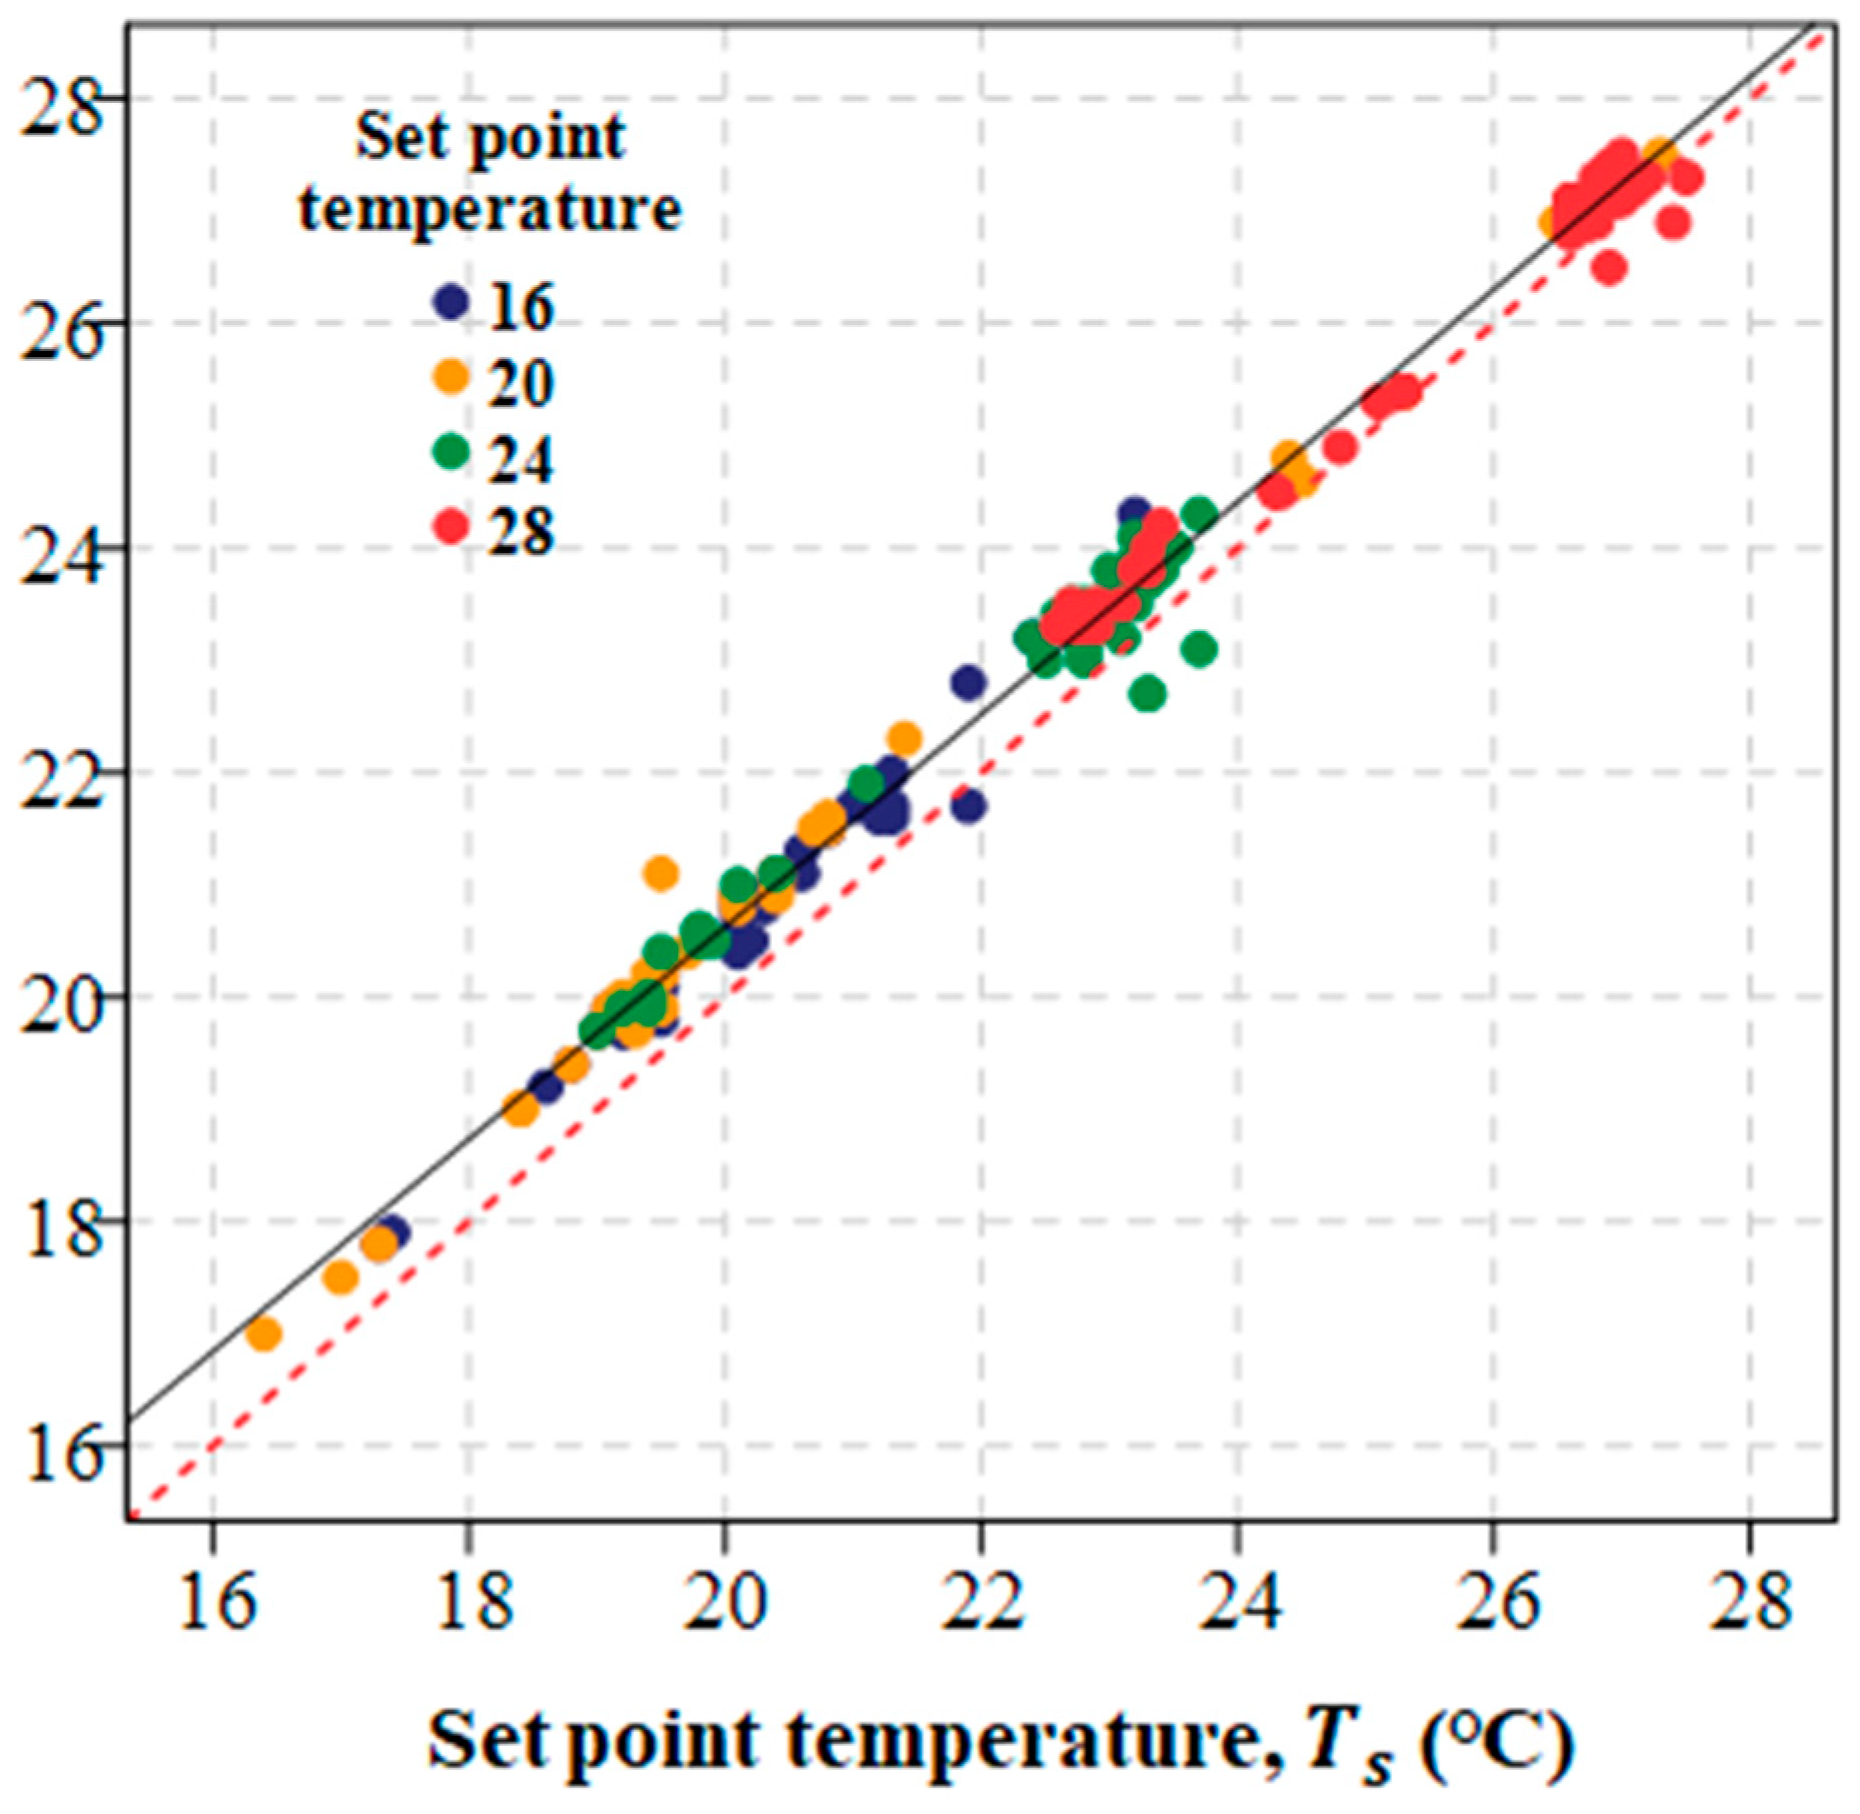
Each setpoint temperature distinctly influenced the operative temperatures. The correlation between setpoint temperatures and the operative temperature was determined by regression analysis between the outcomes of the dependent variables of both rooms, as shown in
Figure 4. A study by Han et al. [
54] also found that different indoor operative temperatures on each day, signified by the same setpoint temperatures, were reflected by daily weather conditions. An acceptable range of setpoint temperatures would optimize building energy consumption, as well as occupants’ comfort, and well-being. Hence, the setpoint should not be mistaken as being used only for reference, as its value is defended by operational regulations of air-conditioner systems [
55]. In this study, the setpoint temperatures were statistically significantly related to the operative temperatures (
p < 0.001), as presented in
Table 6.
4.3.1. Relationships between Variables in Thermal Comfort Parameters
The chi-squared test was carried out to determine the influence of individual characteristics—namely, gender, body mass index, water intake, and clothing insulation—on thermal comfort parameters. For gender differences, the mean
TSV scores assigned by male and female respondents were almost identical, at values of −1.04 and −1.05, respectively. A study by Karjalainen [
56] found no significant differences in neutral temperatures between the genders. Therefore, this factor can generally be considered insignificant with respect to thermal sensation for male and female respondents. However, the results obtained for the other thermal parameters—thermal preference, humidity sensation, humidity preference, air movement, and overall comfort—were statistically significant (
p < 0.05). This indicates that the gender difference affected other thermal parameters.
There is a need for a comprehensive study to grasp the influence of body mass index (
BMI) on thermal comfort [
57], since the previous studies were aggregate models designed for small sample sizes. The results revealed that the observed frequencies were statistically insignificant, except for the air movement, which had a significant effect (
p < 0.05) on respondents. Thus, the overall observed frequencies failed to reflect the independence of the respondents’ body mass index, as in previous studies conducted by Aleksandra [
57]; no statistically significant differences were observed in thermal parameter requirements due to body mass index.
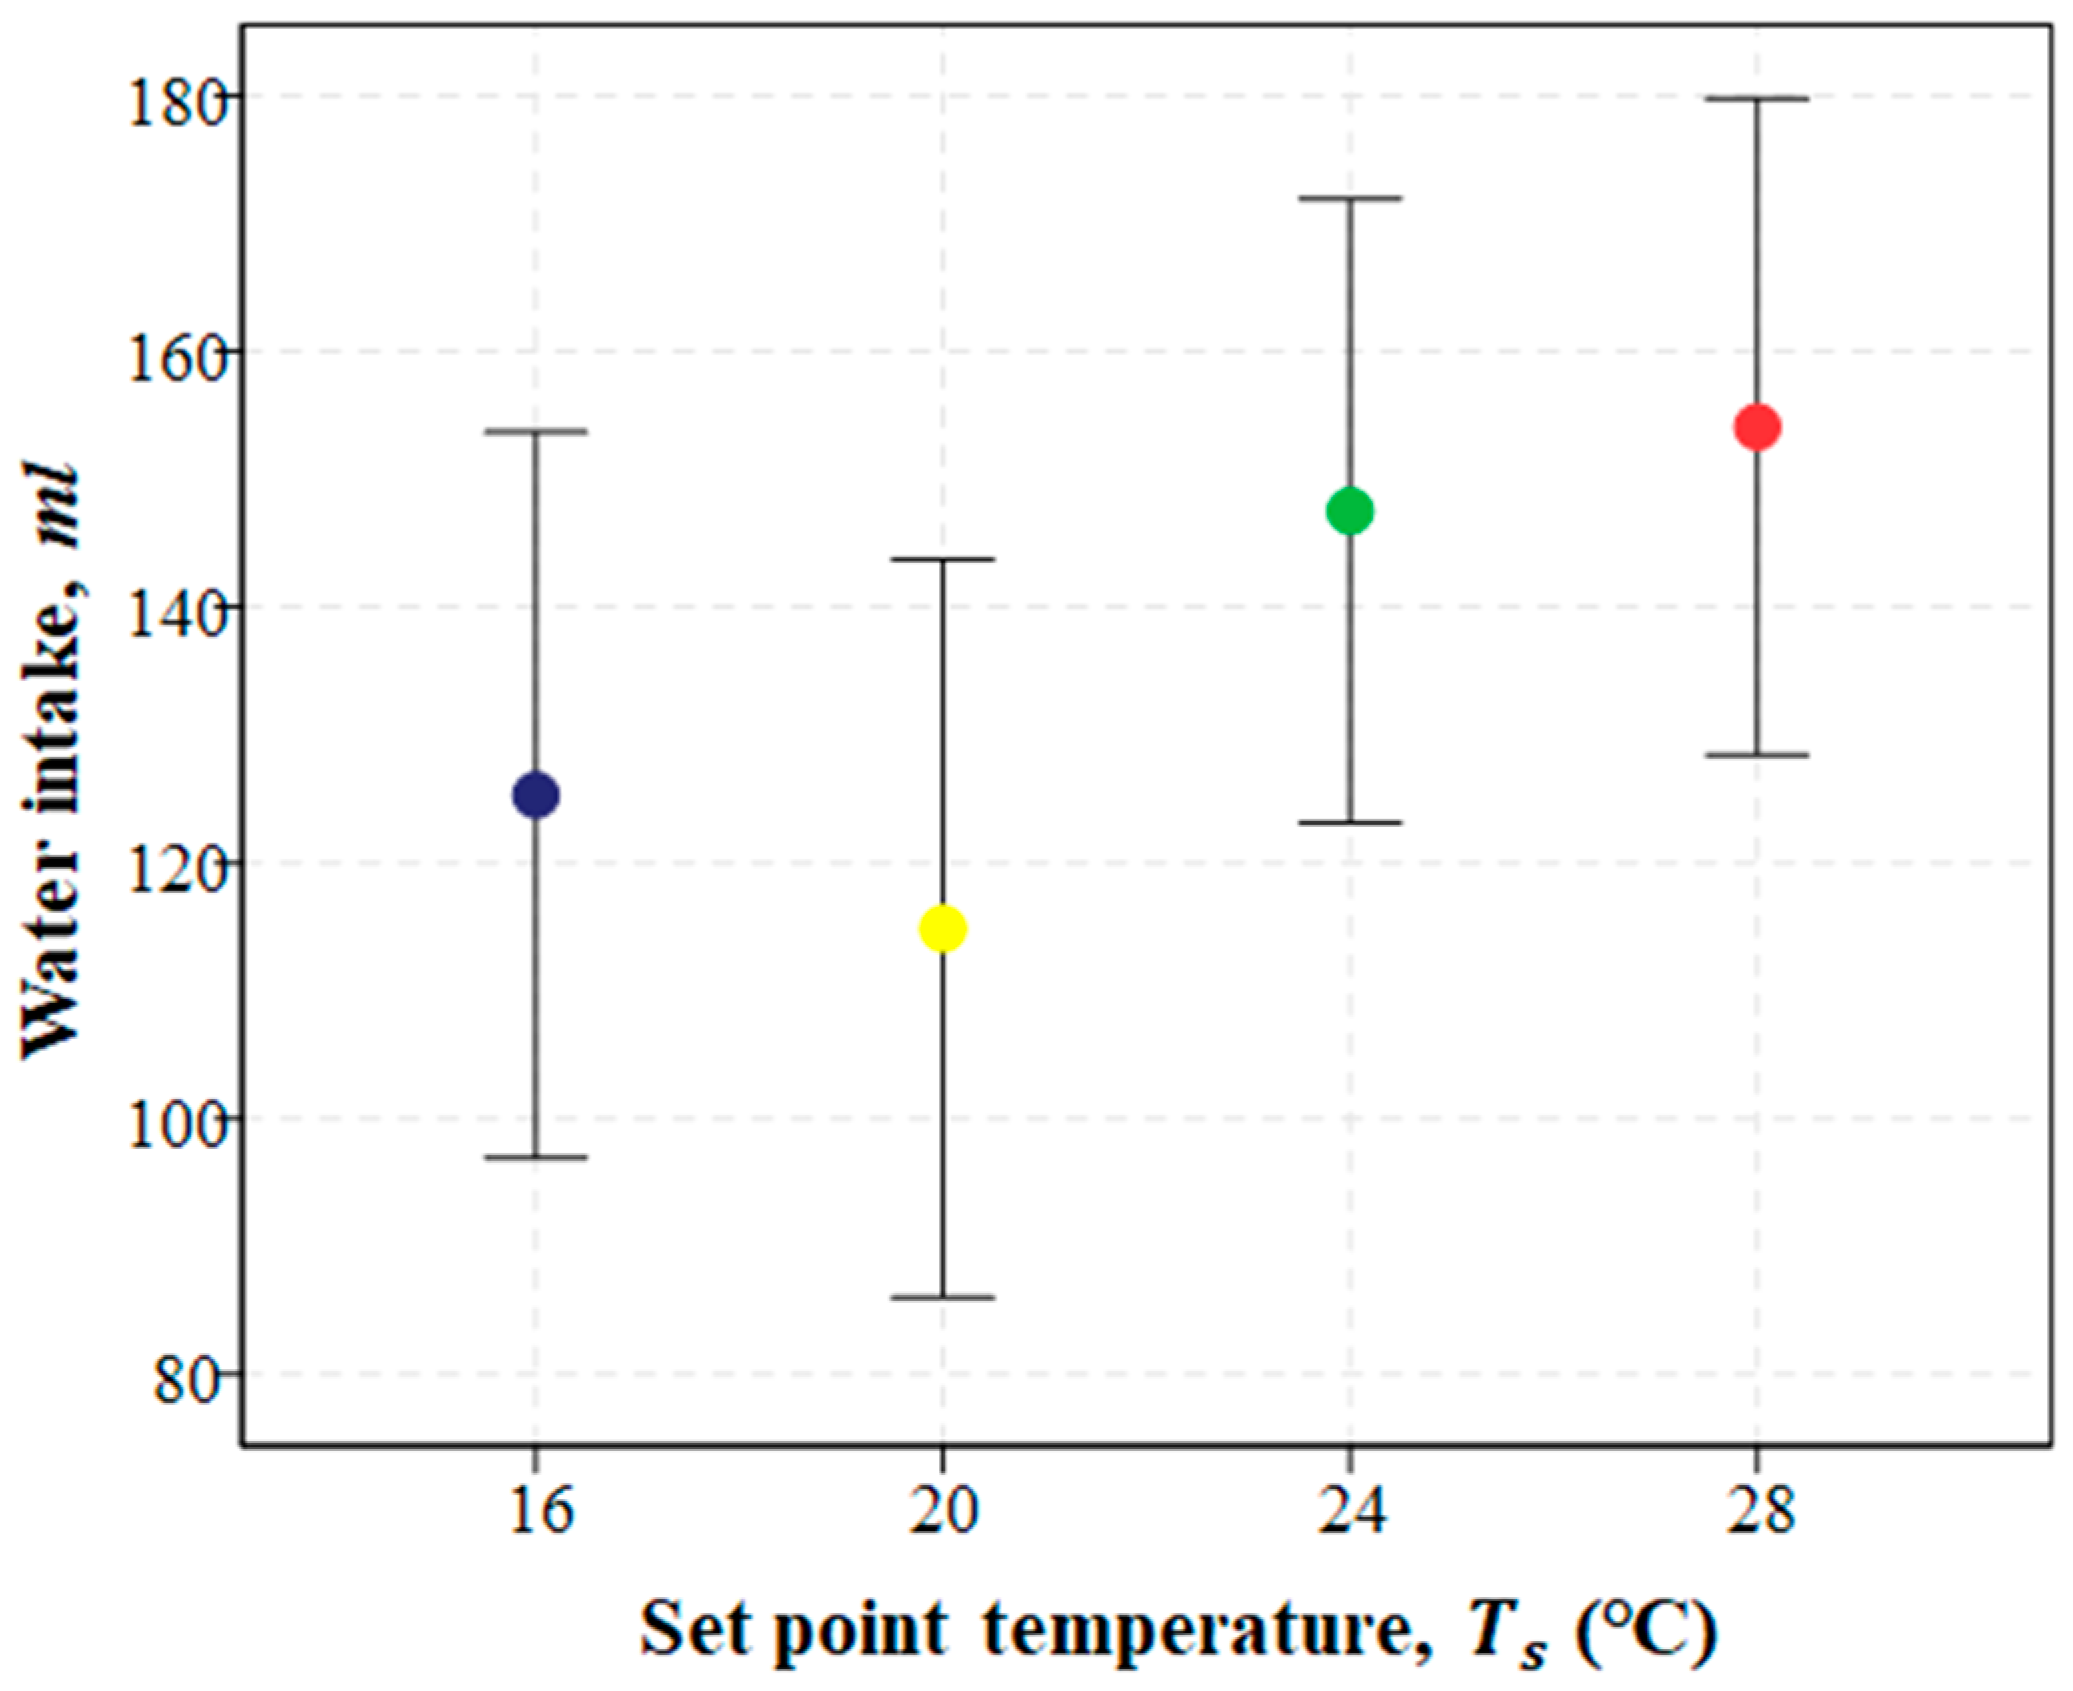
The respondents’ water intake was measured by observing the reduction in water content by subtracting the initial water content from the remaining water in the bottle. Generally, people will drink water when they feel uncomfortable in any circumstances—for instance, to stay hydrated; to avoid fatigue; to remedy dry eyes, mouth, and skin; or to maintain body temperature. Greenleaf suggested that the water intake of respondents increases at an ambient temperature of about 27 °C—the temperature at which sweating begins [
58]. However, there is inadequate information on the amount of water intake that will generally affect hydration [
59]. The results of the chi-squared test showed that respondents’ thermal sensation and overall comfort were statistically significant (
p < 0.05) and strongly correlated with water intake. In contrast, the other thermal parameters were statistically insignificant and independent of the respondents’ water intake. The comparison of the average water intake data at four different setpoint temperatures, as indicated with error bars, is presented in
Figure 5.
Effective practical clothing adjustments help to maintain thermal comfort in indoor environments, as clothing protects the body against the climatic influence and assists its thermal control functions under various environmental conditions and physical activities, enabling occupants to stay thermally comfortable [
60]. The
p-value for respondents’ overall comfort was statistically significant, indicating that their clothing affected their thermal parameters.
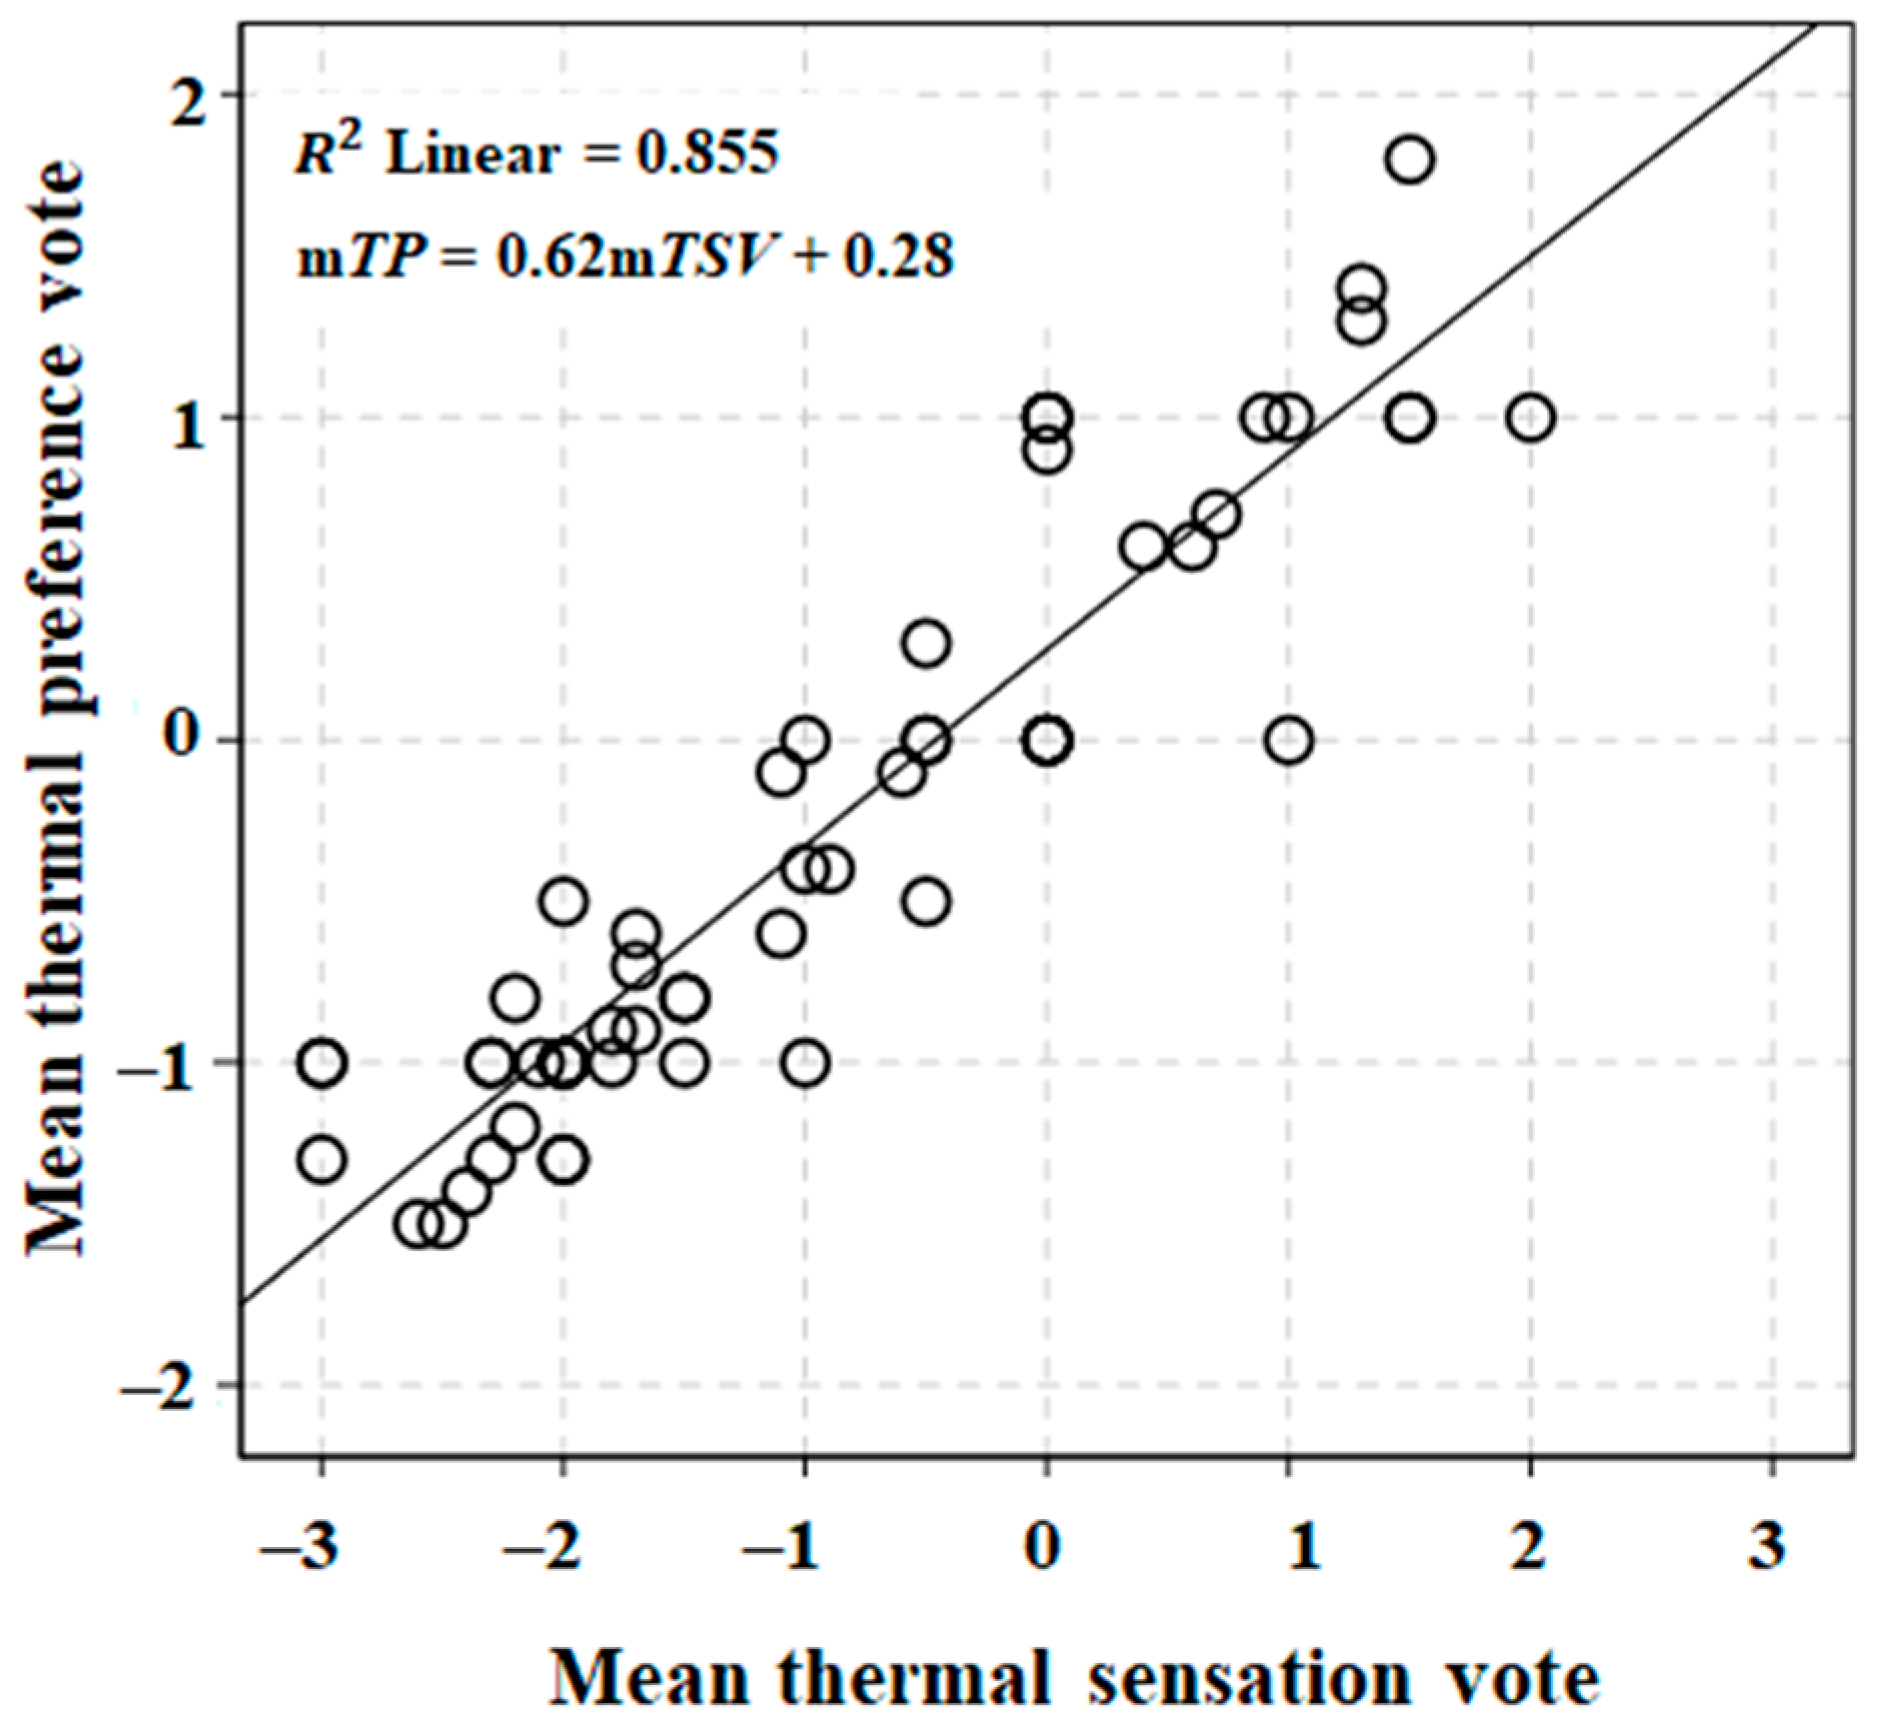
4.3.2. Mean Thermal Sensation and Preference Votes
A strong correlation between the mean value of thermal sensation and the mean preference vote was obtained, as shown in
Figure 6. The mean value of thermal sensation was between −1.7 and −2.5 for the setpoint temperatures of 16 and 20 °C, respectively. Concurrently, at the setpoint temperature of 24 °C, 41% of the respondents voted ‘0 neutral’ for thermal sensation, while 54% preferred ‘0 no change’. The highest percentage of preference votes obtained revealed that most respondents felt almost neutral at most of the seating locations in both rooms; 38% voted ‘1 warm’ for thermal sensation, with a mean value between 0.53 and 1.5, which lies in ‘0 neutral’, ‘1 slightly warm’, and ‘2 warm’ on the thermal sensation scale. The mean value of the thermal preference vote was between 0.6 and 1.8, with preferences of ‘1 a bit cooler’ and ‘2 much cooler’, respectively, at most of the seating locations in the rooms. This may be the natural preference of most people living in hot climates for cooler conditions, albeit the people could possibly have accepted any prevailing conditions [
61].
4.4. Comfort Temperatures
4.4.1. Griffiths’ Method
Griffiths’ method can be applied to determine the indoor comfort temperature of respondents in small-scale samples [
62]. In this case study, a Griffiths constant of 0.50 was derived from previous studies [
40,
63,
64] in hot and humid conditions. The comfort temperature was determined from Equation (1), where
T is the temperature, ‘0’ is a neutral condition, and α is the Griffiths constant or regression coefficient [
65].
Table 7 presents the mean comfort temperature determined by applying Griffiths’ method, with votes of ‘0 neutral’ for
TSV and overall comfort votes of ‘5 moderately comfortable’ and ‘6 very comfortable’. Overall, based on our findings from the comparison of Griffiths’ method with the thermal sensation vote and overall comfort, it was discovered that the mean indoor operative comfort temperature was 24.3 °C.
The thermal sensation votes of ‘0 neutral’ were found at a mean comfort temperature of 24.9 °C, with a 0.6 °C difference from the results estimated by Griffiths’ method. In contrast, the mean comfort temperature obtained from the overall comfort, with votes of either ‘5 moderately comfortable’ or ‘6 very comfortable’, was slightly lower, at 22.9 °C.
4.4.2. Comparison of Comfort Temperatures from Field Studies of AC Modes
The thermal comfort temperature is defined as human comfort under a given room condition, even if there are differences in individual perceptions or sensations. The results were compared to those of a previous study based on the mean indoor comfort temperature estimated by Griffiths’ method for residential buildings, as presented in
Table 8, with various temperature settings.
4.4.3. Thermal Comfort Zone
Probit regression was used for analysis to estimate respondents’ thermal comfort zone [
77], with the acceptable comfort limit based on
TSV results [
78]. The thermal comfort zones of respondents can be estimated by analyzing the data using probit regression. Each probit equation was calculated using a function (Equation (2)) [
37,
61,
76] representing the lines between the proportion of
TSV and the six lines encompassed within the area of seven-point scale votes [
79].
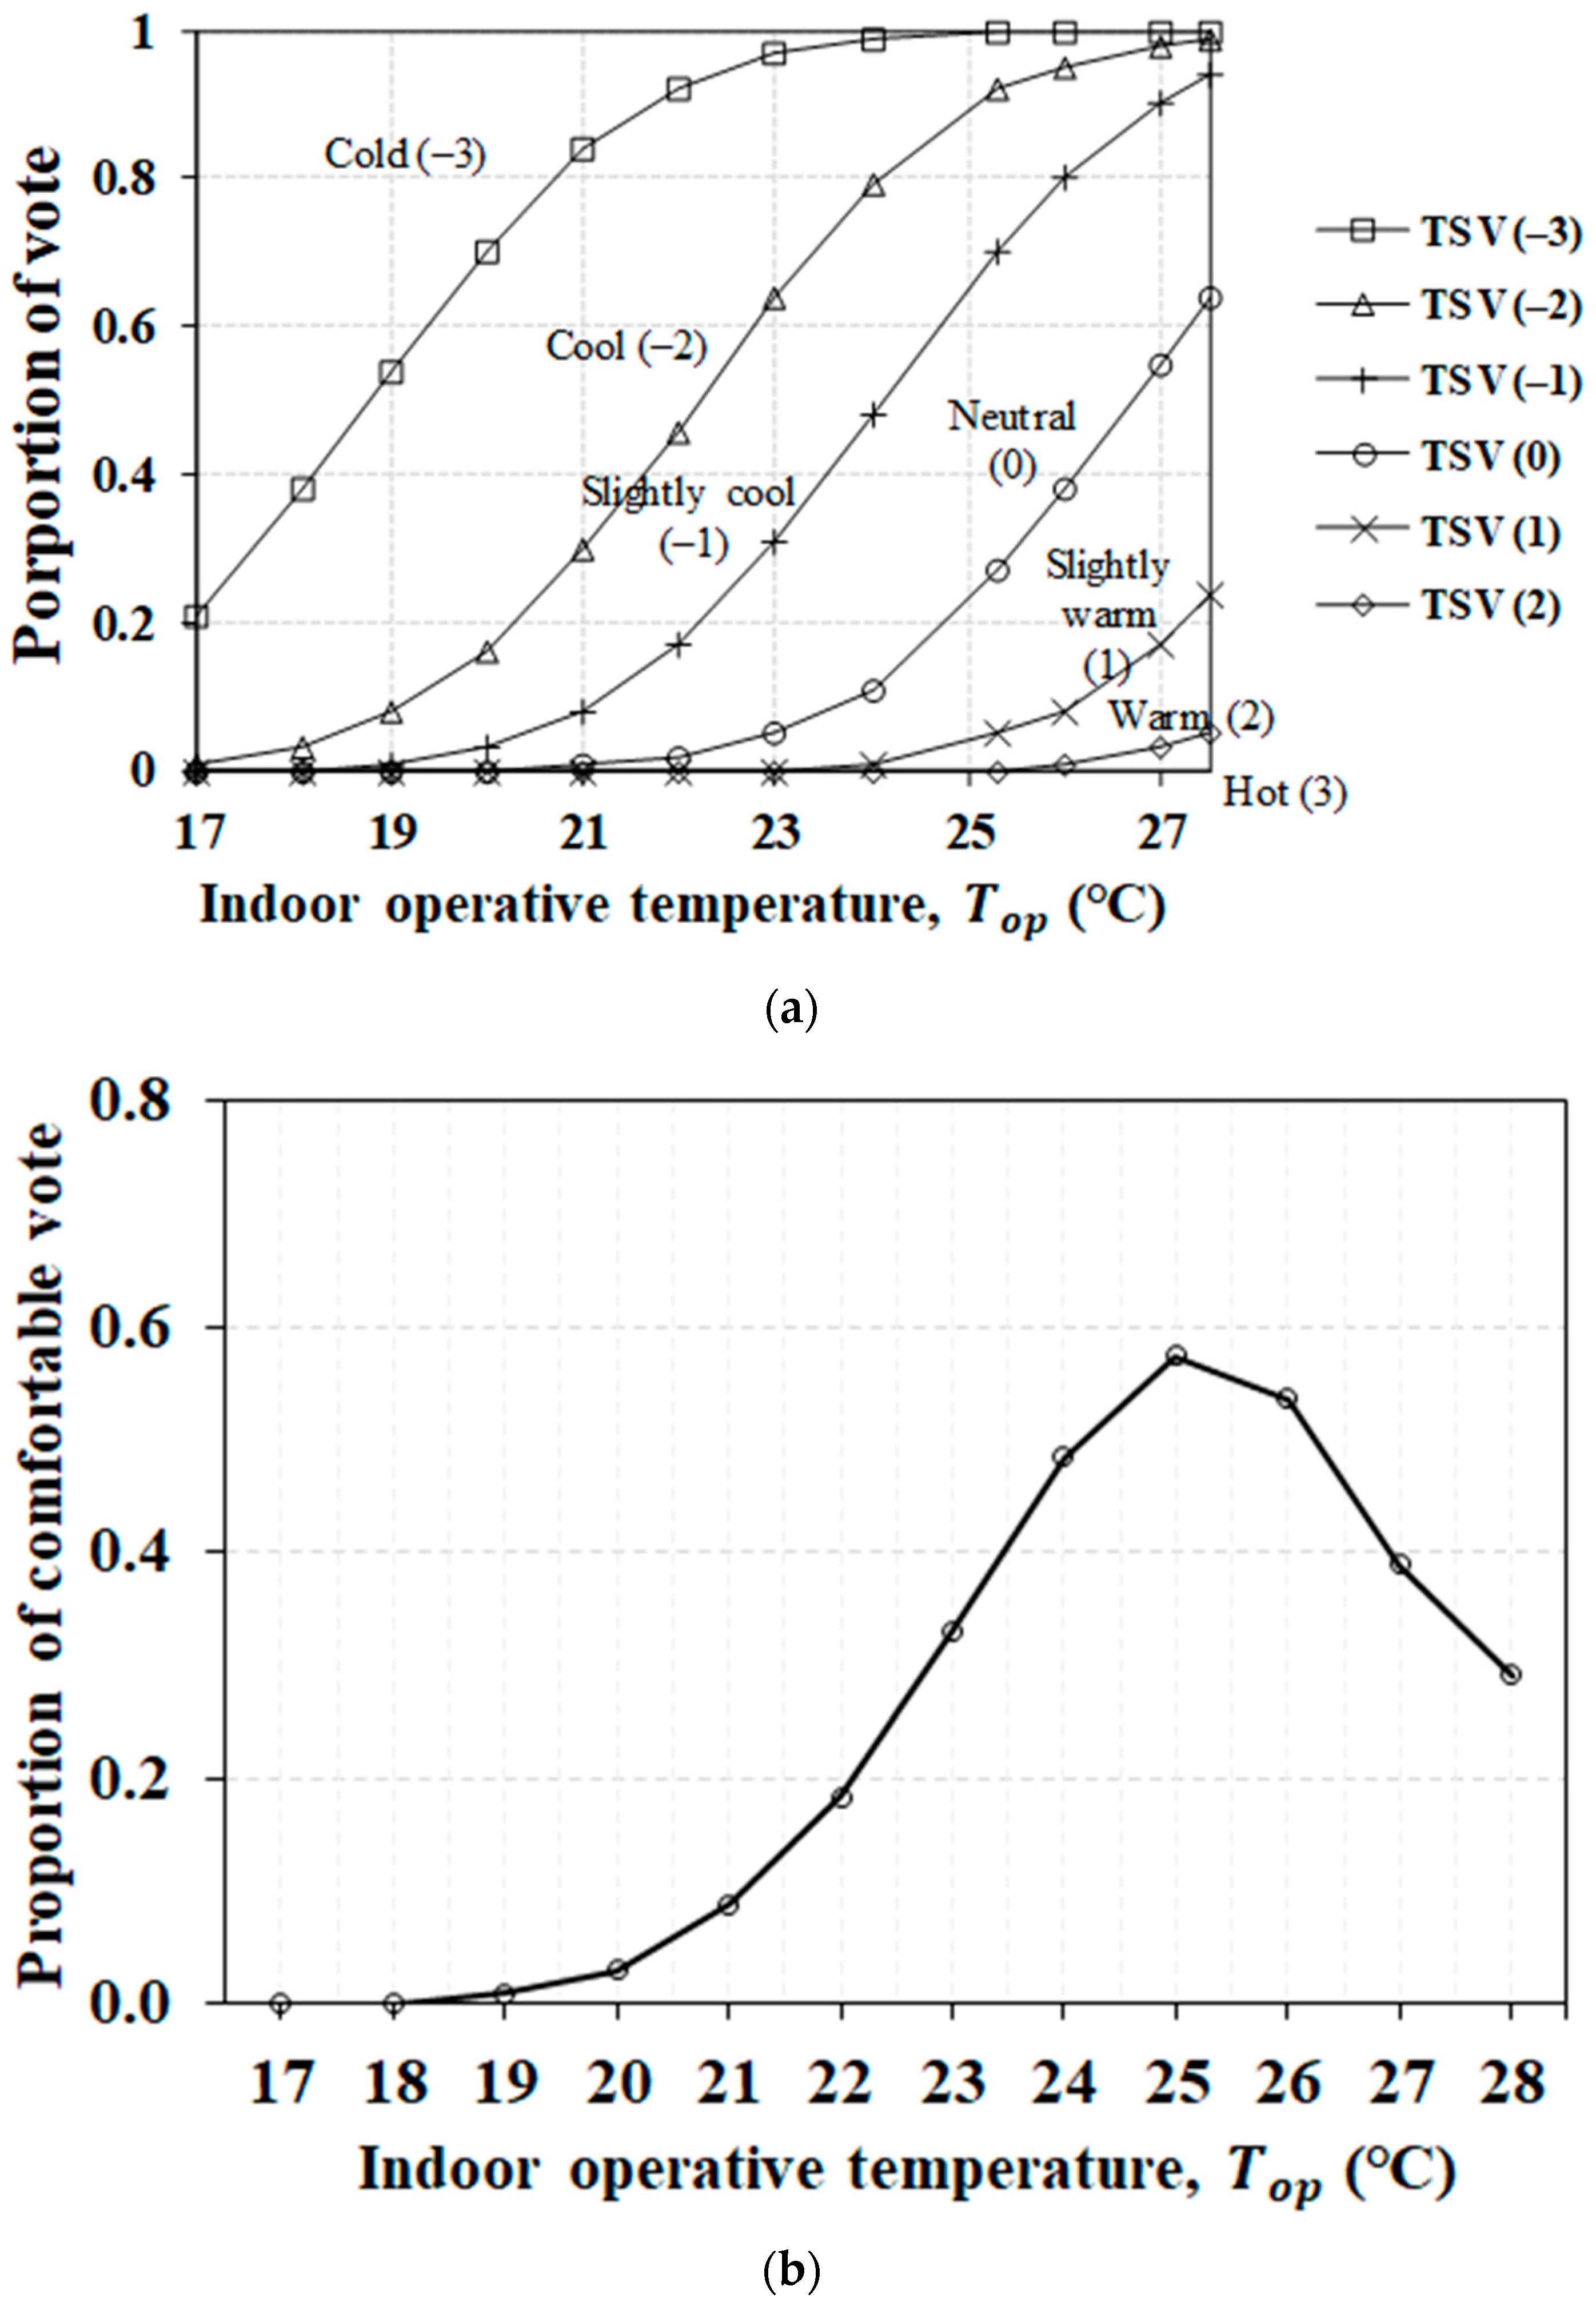
Figure 7 shows the curve of the proportional area. The mean indoor operative temperature of each probit equation was estimated by dividing the constant value by the regression coefficient, where
CDF.NORMAL is the cumulative distribution function for the normal distribution, ‘quant’ is the indoor air temperature (°C), and the ‘mean’ and ‘
S.D.’ are given in
Table 9.
The proportional area of each seven-point scale comfort vote was divided by the curves, as shown in
Figure 7a. The top line describes the proportional area of
TSV ‘−3 very cold’, followed by the second line, which is defined as the proportional area of
TSV ‘−2 cold’, and so on, until the bottom line of
TSV ‘3 hot’. The optimal proportion of indoor thermal comfort was 58% for respondents who voted either −1, 0, or 1, and it was statistically significant (
p < 0.001), indicating that the respondents were thermally comfortable within 24–26 °C in the student activity rooms.
The results were compared to those of a previous study based on mean indoor temperature estimated by probit analysis for residential buildings, as presented in
Table 10. The comparison was made based on location in a hot and humid climate or studies conducted during the summer season in specific areas.
4.4.4. Predicted Mean Vote and Percentage of Dissatisfied
Predicted mean vote (
PMV), developed to predict thermal sensation for humans as an empirical index, refers to the average of the group of people on the ASHRAE [
47] thermal sensation scale. The parameters measured to estimate the
PMV index included air temperature, mean radiant temperature, relative humidity, clothing insulation, and metabolic rate, to predict thermal comfort. The predicted percentage of dissatisfied (
PPD) index was derived from the
PMV index to determine the percentage of people experiencing thermal discomfort or dissatisfaction. People may feel either too hot or too cold in each thermal environment [
82]. Therefore, it depends on the thermal climatic conditions, which could present values of
PMV exceeding the range of −3 ≤
TSV ≤ 3 [
83]. The actual percentage of dissatisfied (
APD) was estimated by replacing the
PMV index with the
TSV index. The overall results of the
PMV and
PPD indices obtained, in comparison to
TSV and
APD, are shown in
Table 11.
4.5. Development of Adaptive Models in AC Spaces
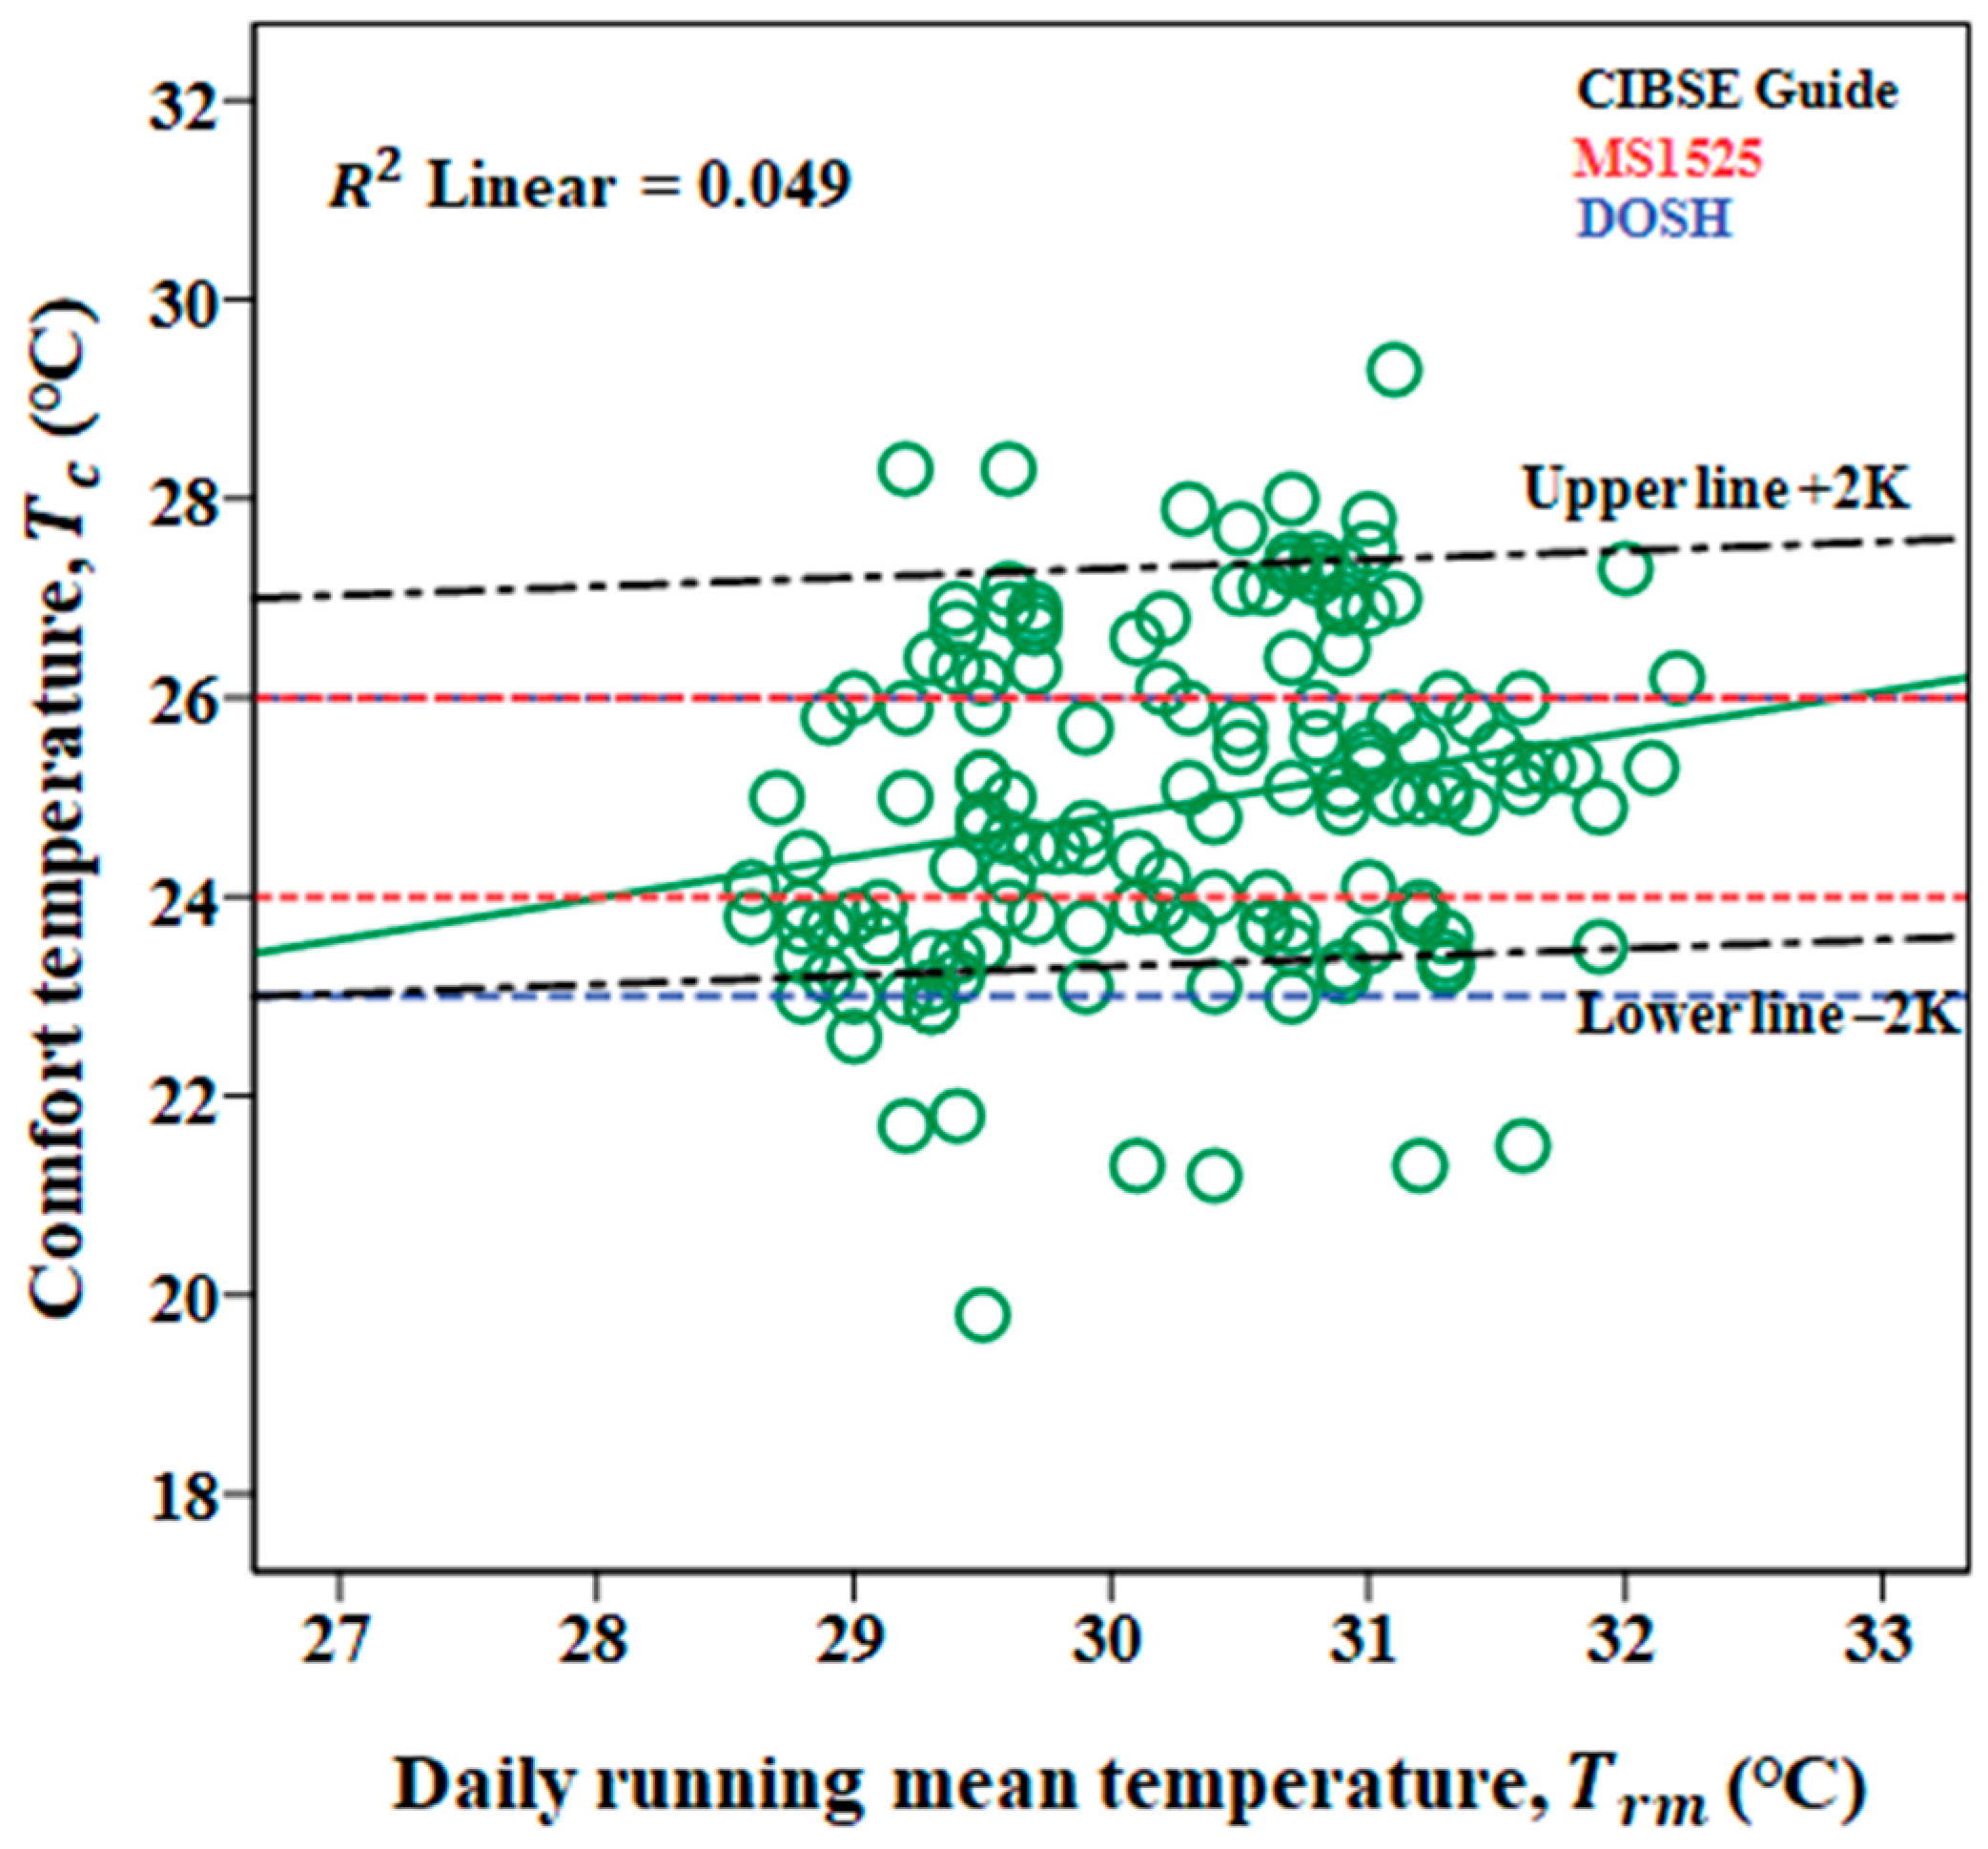
4.5.1. Running Mean Outdoor Temperature
The international standards of Environmental Design Guide A of the Chartered Institution of Building Services Engineers (CIBSE) were mainly designed for AC spaces. However, there are no standards explicitly for residential buildings; thus, the mentioned standards and guidelines were considered as a reference to verify the research conducted on the acceptability of indoor environments. The data were plotted according to Equation (3) from the CIBSE guidelines [
35], with upper and lower limits of ±2 K, where the operative comfort temperatures were plotted against the running mean temperatures as presented in
Figure 8. Running mean daily outdoor air temperature (
Trm) refers to the mean outdoor air temperature across seven consecutive days, depending on the day on which the field study was conducted. The
Trm was calculated based on the recorded outside air temperature by using Equation (4) [
35,
75,
76,
79,
84]:
where
Trm is the running mean outdoor temperature for the previous day (°C), and
Tod−1 is the daily mean outdoor temperature for the previous day (°C). Moreover, whenever the running mean has been calculated for one day, it can be readily calculated for the next day, and α is a constant assumed to be 0.8 [
53,
62,
85,
86].
The indoor comfort temperatures of respondents were found to be both inside and outside of the CIBSE, within 23–25 °C. The results were compared to MS1525, with a comfort zone between 24 and 26 °C, and the Department of Occupational Safety and Health (DOSH), with a comfort zone between 23 and 26 °C. Overall, the comfort temperatures were found to be within the range of the thermal comfort zone, excluding almost 40% who felt comfortable at low setpoint temperatures, as mentioned by Hoof and Hensen [
87] and Schellen et al. [
88], who noted that young adults might have a high preference for lower temperatures. Generally, there is no international adaptive standard for comfort temperature in AC buildings, as the infiltration of outdoor air into such buildings is assumed to be minimal [
61]. However, there is still a correlation between outdoor and indoor air temperatures in AC buildings [
49].
4.5.2. Adaptive Thermal Comfort Model
The adaptive model to predict comfort temperature is associated with climate. Outdoor climate may influence indoor thermal comfort [
49,
89], with the ability of humans to adapt to the environment. Naturally, humans will exhibit behavioral, physiological, and psychological reactions if they feel discomfort due to the thermal environment; concurrently, the thermal sensation can be expressed [
49,
90,
91]. Thus, the results obtained from this study were compared to the regression equation of the comfort temperature to the running mean outdoor temperature in hot and humid climates, derived from previous studies on cooling modes, as shown in
Table 12. The regression coefficient was higher than the CIBSE guideline for cooling and heating modes, at 0.09. The significant difference in the indoor temperature in the rooms reflects the high gradient for the adaptive model used in this study. The equation can predict the indoor comfort temperature for these buildings.
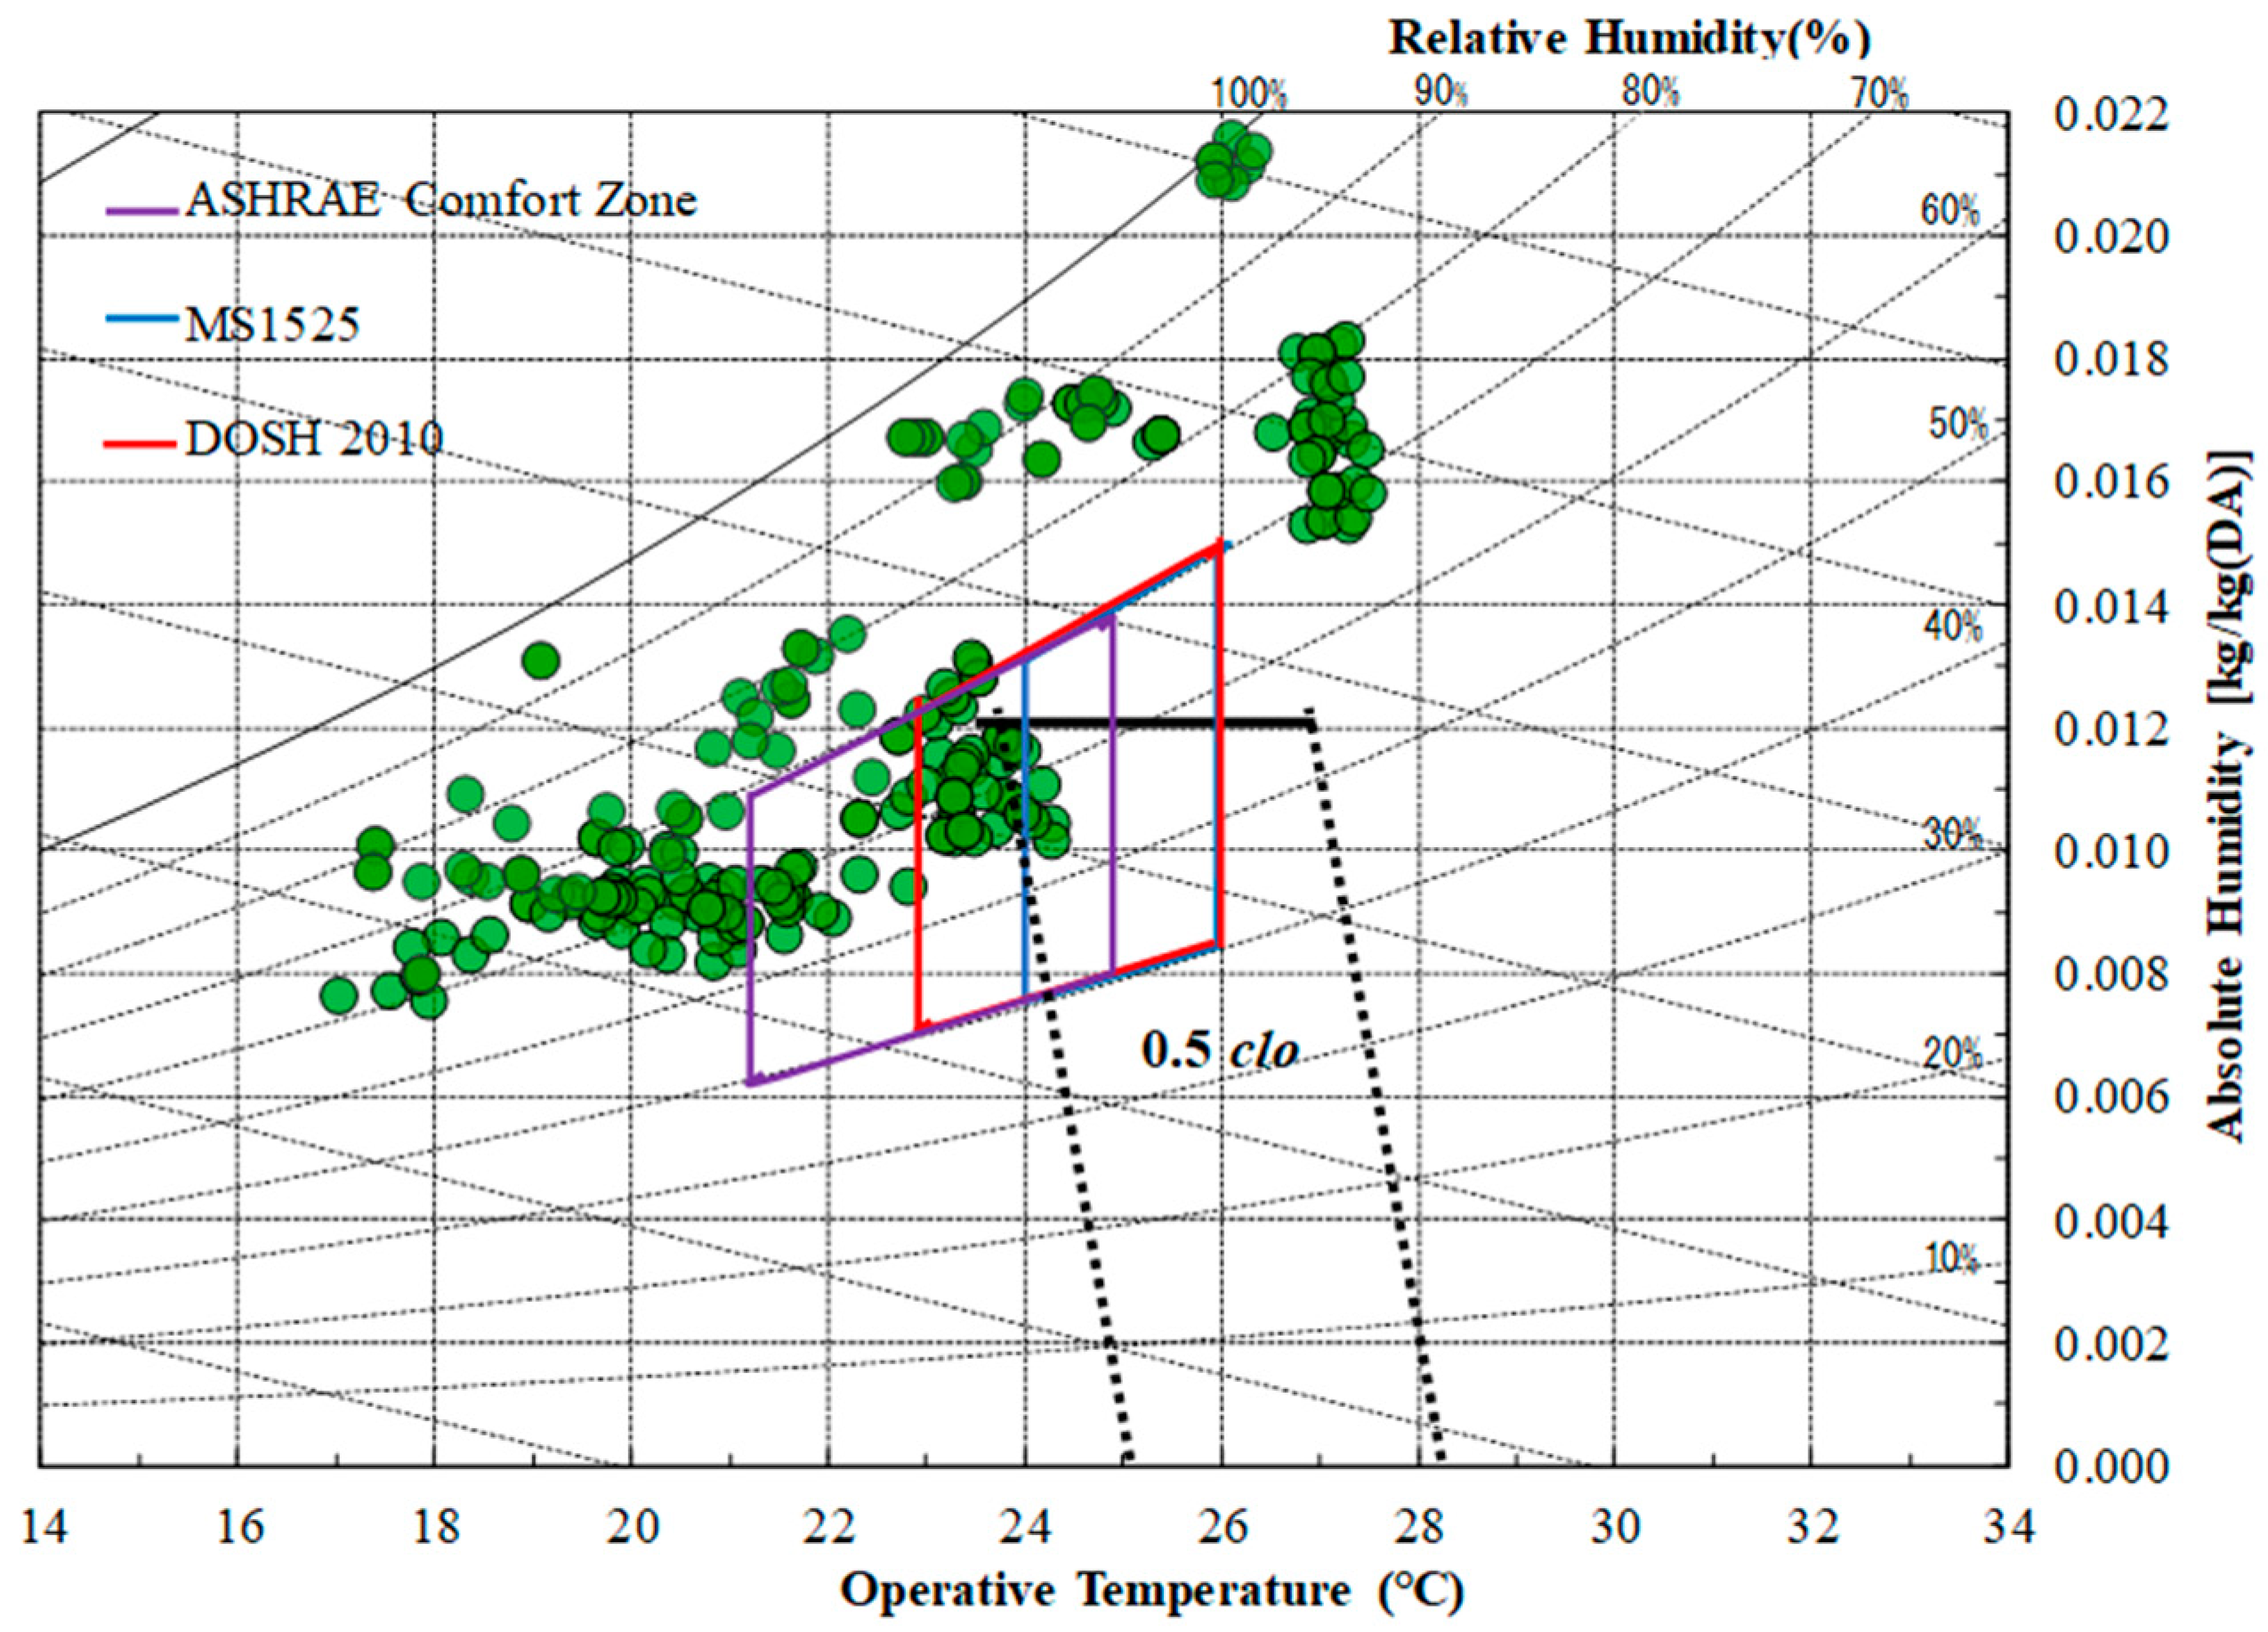
4.5.3. Indoor Environmental Conditions and Applicability of Standards
The results obtained from indoor thermal environment parameters such as temperature and humidity in the two student activity rooms were compared to the acceptable ranges set out by related standards. Hence, the data collected for various indoor air temperatures are presented in a psychrometric chart to assess the suitability of applying ASHRAE Standard 55 [
47], as shown in
Figure 9.
The measurement results showed that about 32% and 44% of the data were above the respective humidity guidelines. The maximum humidity ratio value was 0.012 kg/kg(DA) of indoor temperature, and humidity data were plotted on the psychrometric chart in ASHRAE Standard 55. According to ASHRAE [
96], the acceptable ranges are 21–24 °C and a maximum of 60%
RH, while based on the local standards, the acceptable air temperature ranges for AC spaces are 24–26 °C and 50–70%
RH, and 23–26 °C and 40–70%
RH, respectively. From the measured data, it was found that 29% of data fell within the ASHRAE and DOSH guidelines. These findings were consistent with those of previous studies on residential buildings in hot and humid climates or summer seasons, as presented in
Table 13.
5. Study Limitations
This study’s limitations arise from using setpoint temperatures as reference temperatures. At the same time, the measured readings were inconsistent with indoor air temperature relative to the varied outdoor conditions. Moreover, outdoor conditions tended to deviate between the datasets, as the measurements were conducted at different times and days. The study was conducted in student activity rooms with students in a relaxed mode, engaging in only light physical activities, to represent the human conditions in a living room area.
6. Conclusions
This study investigated thermal adaptation under AC setpoint temperatures of 16, 20, 24, and 28 °C in student activity rooms in a university building in Malaysia. The key findings from this study for the first objective, based on chi-squared results, revealed that body mass index and water intake did not affect the thermal comfort parameters (i.e., thermal preference, humidity sensation and preference, and air movement vote). Water intake had a significant effect on overall comfort. Moreover, gender and body mass index had no significant effects on the thermal sensation of respondents. In contrast, water intake and clothing insulation levels significantly affected personal thermal comfort. Then, the comfort temperature of the respondents was found to be 24.3 °C—within the thermal comfort zone recommended for commercial buildings, with a minimum setpoint of 24 °C based on the guidelines of Malaysian standards. The finding indicates that comfort temperature and preference are associated with the gap in occupants’ preferences in hot and humid climates for indoor thermal comfort. The survey supported this, revealing that 41% of respondents felt comfortable at lower indoor temperatures.
The adaptive model for the third objective was proposed to estimate and control indoor comfort temperature based on the relationship between indoor and outdoor conditions. This model can be applied for thermal simulation to estimate comfort temperature in buildings with a similar climate. Lastly, about 29% of data fell within the ASHRAE and DOSH guidelines for AC spaces. About 45%, 38%, and 40% were within the ASHRAE, DOSH, and MS1525 comfort zones, respectively, with 25% below the setpoint of 24 °C. Hence, the findings of the present study indicate that a minimum setpoint temperature of 24 °C could be implemented to promote energy-saving behavior without neglecting the occupants’ comfort, as agreed by Malaysian standards.
The suitability of the proper thermostat setting for mechanical cooling devices directly affects indoor cooling satisfaction. The appropriate guidelines and information on the manner of AC usage can be extended by educating the occupants on the importance of practicing better use behaviors to mitigate the impact on the environment in the long run.
Author Contributions
Data curation, N.I.; formal analysis, N.I.; funding acquisition, S.A.Z. and A.H.; investigation, N.I.; methodology, N.I.; project administration, S.A.Z. and N.A.; supervision, S.A.Z. and A.H.; validation, N.I.; writing—original draft, N.I.; writing—review and editing, S.A.Z., H.B.R. and J.A.A.R. All authors have read and agreed to the published version of the manuscript.
Funding
This work was supported by HITACHI-JOHNSON CONTROLS AIR CONDITIONING INC. JAPAN (Vot 4B395), the Ministry of Education (MOE) through the Fundamental Research Grant Scheme (FRGS/1/2019/TK07/UTM/02/5), Universiti Teknologi Malaysia (UTM) under the Industrial-International Incentive Grant (Vot 01M89), and Universidad Técnica Federico Santa Maria under FONDEF project (ID22I10153). We would like to express our sincere appreciation to all respondents in the field survey and measurements for their participation and cooperation.
Institutional Review Board Statement
Not applicable.
Informed Consent Statement
Not applicable.
Data Availability Statement
The data presented in this study are available upon request from the corresponding author.
Conflicts of Interest
The authors declare no conflict of interest. The funders had no role in the design of the study; in the collection, analyses, or interpretation of data; in the writing of the manuscript; or in the decision to publish the results.
Appendix A
Sample of a survey based on the scale for thermal comfort questionnaire in a student activity room
Thermal sensation, acceptability, preference, and comfort
| Good | 4 | |
| Fair | 3 | |
| Bad | 2 | |
| Very Bad | 1 | |
- 2.
How do you feel about the hotness and coldness in room right now?
| Very Cold | −3 | |
| Cold | −2 | |
| Slightly Cold | −1 | |
| Neutral | 0 | |
| Slightly warm | 1 | |
| Warm | 2 | |
| Very hot | 3 | |
- 3.
How do you prefer temperature now?
| Much warmer | −2 | |
| A bit warmer | −1 | |
| No change | 0 | |
| A bit cooler | 1 | |
| Much cooler | 2 | |
- 4.
Is the air movement acceptable?
- 5.
How do you feel the air humidity right now?
| Very dry | −3 | |
| Dry | −2 | |
| Slightly Dry | −1 | |
| Neutral | 0 | |
| Slightly humid | 1 | |
| Humid | 2 | |
| Very humid | 3 | |
- 6.
How do you prefer the air humidity right now?
| Much more humid | −2 | |
| A bit more humid | −1 | |
| No change | 0 | |
| A bit drier | 1 | |
| Much drier | 2 | |
- 7.
How do you feel the air movement right now?
| Very bad | −3 | |
| Bad | −2 | |
| Slightly Bad | −1 | |
| Neither bad nor good | 0 | |
| Slightly good | 1 | |
| Good | 2 | |
| Very Good | 3 | |
- 8.
How would you rate your overall comfort, by considering the condition right now?
| Very comfortable | 6 | |
| Moderately comfortable | 5 | |
| Slightly comfortable | 4 | |
| Slightly uncomfortable | 3 | |
| Moderately uncomfortable | 2 | |
| Very uncomfortable | 1 | |
- 9.
How do you spend up to 15 min before now? (Please select one main activity).
| Using smartphone | |
| Typing notes/assignment using PC | |
| Surfing the internet using PC | |
| Watching movies/dramas | |
| Reading books/magazines etc. | |
| Chatting | |
| Seated, quiet | |
Adaptive methods
| I drink a water bottle provided | |
| I roll up the shirt’s sleeve or pants | |
| I rubbed both palms | |
| I’m fanning myself using paper/thin book | |
| I did nothing | |
| Other (please write) | |
Clothing Insulation
Male:
| Inner | Men’s brief | |
![Buildings 13 00036 i001]() |
| Sleeveless shirt | |
![Buildings 13 00036 i002]() |
Thin pants
![Buildings 13 00036 i003]() | |
| Shirt | Sport shirt
![Buildings 13 00036 i004]() | |
T-shirt
![Buildings 13 00036 i005]() | |
Long sleeve shirt
![Buildings 13 00036 i006]() | |
| Bottom | Shorts
![Buildings 13 00036 i007]() | |
Light trousers
![Buildings 13 00036 i008]() | |
Female:
| Inner | Bra & panty
![Buildings 13 00036 i009]() | |
Sleeveless shirt
![Buildings 13 00036 i010]() | |
| Shirt | Sport shirt
![Buildings 13 00036 i011]() | |
T-shirt
![Buildings 13 00036 i012]() | |
Long sleeve shirt
![Buildings 13 00036 i013]() | |
| Bottom | Shorts
![Buildings 13 00036 i014]() | |
Long skirt
![Buildings 13 00036 i015]() | |
Thin long trousers
![Buildings 13 00036 i016]() | |
One-piece dress
![Buildings 13 00036 i017]() | |
References
- Jamaludin, N.; Mohammed, N.I.; Khamidi, M.F.; Wahab, S.N.A. Thermal Comfort of Residential Building in Malaysia at Different Micro-climates. Procedia Soc. Behav. Sci. 2015, 170, 613–623. [Google Scholar] [CrossRef] [Green Version]
- Rodriguez, C.M.; Medina, J.M.; Pinzón, A. Thermal comfort and satisfaction in the context of social housing: Case study in Bogotá, Colombia. J. Constr. Dev. Ctries. 2019, 24, 101–124. [Google Scholar] [CrossRef]
- Amasuomo, T.T.; Amasuomo, J.O. Perceived thermal discomfort and stress behaviours affecting students’ learning in lecture theatres in the humid tropics. Buildings 2016, 6, 18. [Google Scholar] [CrossRef] [Green Version]
- Tatarestaghi, F.; Ismail, M.A.; Ishak, N.H. A comparative study of passive design features/elements in malaysia and passive house criteria in the tropics. J. Des. Built Environ. 2018, 18, 15–25. [Google Scholar] [CrossRef]
- The ASEAN Post Team. The Rising Demand for Air Conditioners. 2020. Available online: https://theaseanpost.com/article/rising-demand-air-conditioners (accessed on 18 March 2021).
- Parsons, R.; Kuehn, T.H.; Couvillion, R.J.; Coleman, J.W.; Suryanarayana, N.; Ayub, Z. 2005 ASHRAE Handbook Fundamentals, I-P Edition; American Society of Heating, Refrigerating and Air-Conditioning Engineers: Peachtree Corners, GA, USA, 2005; p. 32. [Google Scholar]
- Taib, N.S.M.; Zaki, S.A.; Rijal, H.B.; Razak, A.A.; Hagishima, A.; Khalid, W.; Ali, M.S.M. Associating thermal comfort and preference in Malaysian universities ’ air-conditioned office rooms under various set-point temperatures. J. Build. Eng. 2022, 54, 104575. [Google Scholar] [CrossRef]
- Xiang, Z.; Maohui, L.; Bauman, Z.H.; Edward, F.; Yongchao, Z.; Darryl, D. Reducing building over-cooling by adjusting HVAC supply airflow setpoints and provinding personal comfort systems. Indoor Environ. Qual. 2018, 15, 250–260. [Google Scholar] [CrossRef]
- Shahzad, S.; Brennan, J.; Theodossopoulos, D.; Calautit, J.K.; Hughes, B.R. Does a neutral thermal sensation determine thermal comfort? Build. Serv. Eng. Res. Technol. 2018, 39, 183–195. [Google Scholar] [CrossRef]
- Zaki, S.A.; Hagishima, A.; Fukami, R.; Fadhilah, N. Development of a model for generating air-conditioner operation schedules in Malaysia. Build. Environ. 2017, 122, 354–362. [Google Scholar] [CrossRef]
- Uno, T.; Hokoi, S.; Ekasiwi, S.N.N. Survey on Thermal Environment in Residences in Surabaya, Indonesia: Use of Air Conditioner. J. Asian Archit. Build. Eng. 2003, 2, b15–b21. [Google Scholar] [CrossRef]
- de Dear, R.; Schiller Brager, G. The adaptive model of thermal comfort and energy conservation in the built environment. Int. J. Biometeorol. 2001, 45, 100–108. [Google Scholar] [CrossRef]
- MS 1525:2014; Energy Efficiency and Use of Renewable Energy for Non-Residential Buildings—Code of Practice (Second Revision). Department of Standards Malaysia: Cyberjaya, Malaysia, 2014.
- Djamila, H.; Ming, C.C.; Kumaresan, S. Investigation on hourly and monthly thermal comfort in the humid tropics of Malaysia. Buildings 2015, 5, 1025–1036. [Google Scholar] [CrossRef] [Green Version]
- Yong, K.; Abdullah, Z.; Che Din, N. The Perception of Thermal Comfort in Malaysia Public Low-Cost Housing. Built Environ. J. 2021, 18, 47–56. [Google Scholar] [CrossRef]
- Lin, Z.; Deng, S. A study on the thermal comfort in sleeping environments in the subtropics-Measuring the total insulation values for the bedding systems commonly used in the subtropics. Build. Environ. 2008, 43, 905–916. [Google Scholar] [CrossRef]
- Kubota, T.; Jeong, S.; Toe, D.; Ossen, D. Energy Consumption and Air-Conditioning Usage in Residential Buildings of Malaysia. J. Int. Dev. Coop. 2011, 17, 61–69. [Google Scholar] [CrossRef]
- Puangmalee, N.; Hussaro, K.; Boonyayothin, V.; Khedari, J. A Field of the Thermal Comfort in University Buildings in Thailand under Air Condition Room; Elsevier: Amsterdam, The Netherlands, 2015; Volume 79. [Google Scholar]
- Kim, J.; De Dear, R.; Parkinson, T.; Candido, C.; Cooper, P.; Ma, Z.; Saman, W. Field Study of Air Conditioning and Thermal Comfort in Residential Buildings. In Proceedings of the 9th Windsor Conference: Making Comfort Relevan, Windsor, UK, 7–10 April 2016. [Google Scholar]
- Zaki, S.; Fadhilah, N.; Hanip, M.; Hagishima, A.; Yakub, F. Survey of Resident Behaviour Related to Air Conditioner Operation in Low-Cost Apartments of Kuala Lumpur. Chem. Eng. Trans. 2018, 63, 259–264. [Google Scholar] [CrossRef]
- KC, R.; Rijal, H.B.; Shukuya, M.; Yoshida, K. An investigation of the behavioral characteristics of higher- and lower-temperature group families in a condominium equipped with a HEMS system. Buildings 2018, 9, 4. [Google Scholar] [CrossRef] [Green Version]
- Jaffar, B.; Oreszczyn, T.; Raslan, R.; Summerfield, A. Understanding energy demand in Kuwaiti villas: Findings from a quantitative household survey. Energy Build. 2018, 165, 379–389. [Google Scholar] [CrossRef]
- de Dear, R.; Kim, J.; Parkinson, T. Residential adaptive comfort in a humid subtropical climate—Sydney Australia. Energy Build. 2018, 158, 1296–1305. [Google Scholar] [CrossRef]
- Lee, W.V.; Shaman, J. Heat-coping strategies and bedroom thermal satisfaction in New York City. Sci. Total Environ. 2017, 574, 1217–1231. [Google Scholar] [CrossRef] [Green Version]
- Yoshida, A.; Manomivibool, P.; Tasaki, T.; Unroj, P. Qualitative study on electricity consumption of urban and rural households in Chiang Rai, Thailand, with a focus on ownership and use of air conditioners. Sustainability 2020, 12, 5796. [Google Scholar] [CrossRef]
- Panraluk, C.; Sreshthaputra, A. Developing guidelines for thermal comfort and energy saving during hot season of multipurpose senior centers in Thailand. Sustainability 2020, 12, 170. [Google Scholar] [CrossRef] [Green Version]
- Li, B.; You, L.; Zheng, M.; Wang, Y.; Wang, Z. Energy consumption pattern and indoor thermal environment of residential building in rural China. Energy Built Environ. 2020, 1, 327–336. [Google Scholar] [CrossRef]
- Aqilah, N.; Zaki, S.A.; Hagishima, A.; Rijal, H.B.; Yakub, F. Analysis on electricity use and indoor thermal environment for typical air-conditioning residential buildings in Malaysia. Urban Clim. 2021, 37, 100830. [Google Scholar] [CrossRef]
- Liu, H.; Zhang, Z.; Ma, X.; Lu, W.; Li, D.; Kojima, S. Optimization analysis of the residential window-to-wall ratio based on numerical calculation of energy consumption in the hot-summer and cold-winter zone of China. Sustainability 2021, 13, 6138. [Google Scholar] [CrossRef]
- Jeong, B.; Kim, J.; Ma, Z.; Cooper, P.; de Dear, R. Identification of environmental and contextual driving factors of air conditioning usage behaviour in the sydney residential buildings. Buildings 2021, 11, 122. [Google Scholar] [CrossRef]
- Sena, B.; Zaki, S.A.; Rijal, H.B.; Ardila-Rey, J.A.; Yusoff, N.M.; Yakub, F.; Ridwan, M.K.; Muhammad-Sukki, F. Determinant factors of electricity consumption for a Malaysian household based on a field survey. Sustainability 2021, 13, 818. [Google Scholar] [CrossRef]
- Ramos, G.; Lamberts, R.; Abrahão, K.C.F.J.; Bandeira, F.B.; Teixeira, C.F.B.; de Lima, M.B.; Broday, E.E.; Castro, A.P.A.S.; de Queiroz Leal, L.; De Vecchi, R.; et al. Adaptive behaviour and air conditioning use in Brazilian residential buildings. Build. Res. Inf. 2021, 49, 496–511. [Google Scholar] [CrossRef]
- Malik, J.; Bardhan, R.; Hong, T.; Piette, M.A. Contextualising adaptive comfort behaviour within low-income housing of Mumbai, India. Build. Environ. 2020, 177, 106877. [Google Scholar] [CrossRef]
- Feriadi, H.; Wong, N.H.; Chandra, S.; Cheong, K.W. Adaptive behaviour and thermal comfort in Singapore’s naturally ventilated housing. Build. Res. Inf. 2003, 31, 13–23. [Google Scholar] [CrossRef]
- Chartered Institution of Building Services Engineers. Environmental Design: CIBSE Guide A; Chartered Institution of Building Services Engineers: London, UK, 2006; ISBN 9781903287668. [Google Scholar]
- Al-Khatri, H.; Gadi, M.B. Investigating the behaviour of ASHRAE, Bedford, and Nicol thermal scales when translated into the Arabic language. Build. Environ. 2019, 151, 348–355. [Google Scholar] [CrossRef]
- The Path to Home Comfort. New Haven. 2016. Available online: https://hartmanbrothers.com/pdf/HomeSolutionsGuide.pdf. (accessed on 8 September 2020).
- Humphreys, M.A.; Hancock, M. Do people like to feel “neutral”?: Exploring the variation of the desired thermal sensation on the ASHRAE scale. Energy Build. 2007, 39, 867–874. [Google Scholar] [CrossRef]
- Cheung, T.; Schiavon, S.; Parkinson, T.; Li, P.; Brager, G. Analysis of the accuracy on PMV—PPD model using the ASHRAE Global Thermal Comfort Database II. Build. Environ. 2019, 153, 205–217. [Google Scholar] [CrossRef] [Green Version]
- de Dear, R.J.; Akimoto, T.; Arens, E.A.; Brager, G.; Candido, C.; Cheong, K.W.D.; Li, B.; Nishihara, N.; Sekhar, S.C.; Tanabe, S.; et al. Progress in thermal comfort research over the last twenty years. Indoor Air J. 2013, 23, 442–461. [Google Scholar] [CrossRef] [PubMed] [Green Version]
- Mustapa, M.S.; Salim, S.A.Z.S.; Ali, M.S.M.; Rijal, H.B. Investigation of thermal comfort at different temperature settings for cooling in university building. J. Mech. Eng. 2017, SI 4, 123–134. [Google Scholar]
- Zaki, S.A.; Damiati, S.A.; Rijal, H.B.; Hagishima, A.; Abd Razak, A. Adaptive thermal comfort in university classrooms in Malaysia and Japan. Build. Environ. 2017, 122, 294–306. [Google Scholar] [CrossRef]
- Rijal, H.B. Investigation of comfort temperature and occupant behavior in Japanese houses during the hot and humid season. Buildings 2014, 4, 437–452. [Google Scholar] [CrossRef] [Green Version]
- Ibrahim, F.; Harun, S.H.; Samad, A.; Hanim, M.; Harun, W.; Mariah, W. Post Occupancy Evaluation in Malaysia: The Need for Awareness and Knowledge. In Proceedings of the 2nd International Conference on Built Environment in Developing Countries 2008 (Icbed 2008), Penang, Malaysia, 3–4 December 2008; pp. 232–241. [Google Scholar]
- Hadjri, K.; Crozier, C. Post-occupancy evaluation: Purpose, benefits and barriers. Facilities 2009, 27, 21–33. [Google Scholar] [CrossRef]
- Humphreys, M.A. Quantifying occupant comfort: Are combined indices of the indoor environment practicable? Build. Res. Inf. 2005, 33, 317–325. [Google Scholar] [CrossRef]
- ISSN 1041-2336; Thermal Environmental Conditions for Human Occupancy. ASHRAE Inc: Peachtree Corners, GA, USA, 2017.
- Humphreys Revd, M.A. Thermal comfort temperatures world-wide—The current position. Renew. Energy 1996, 8, 139–144. [Google Scholar] [CrossRef]
- de Dear, R.J.; Brager, G.S. Developing an adaptive model of thermal comfort and preference. ASHRAE Trans. 1998, 104, 145–167. [Google Scholar]
- Adunola, A.O.; Ajibola, K. Factors Significant to Thermal Comfort Within Residential Neighborhoods of Ibadan Metropolis and Preferences in Adult Residents’ Use of Spaces. SAGE J. 2016, 6. [Google Scholar] [CrossRef] [Green Version]
- Lee, K.; Lee, D. The relationship between indoor and outdoor temperature in two types of residence. Energy Procedia 2015, 78, 2851–2856. [Google Scholar] [CrossRef]
- Akwasi, A.-S.; Thai, P.; Barnett, A.G.; Morawska, L. Pilot Study on Relationship between Indoor and Outdoor Temperatures in Brisbane Households. In Proceedings of the 7th International Conference on Energy and Environment of Residential Buildings, Brisbane, Australia, 20–24 November 2016. [Google Scholar]
- Williamson, T.; Daniel, L. Development of a model of adaptive thermal comfort and preference for housing in Australia. In Proceedings of the 52nd International Conference of the Architectural Science Association, Melbourne, Australia, 28 November–1 December 2018; pp. 3–10. [Google Scholar]
- Han, J.; Bae, J.; Jang, J.; Baek, J.; Leigh, S.B. The derivation of cooling set-point temperature in an HVAC system, considering mean radiant temperature. Sustainability 2019, 11, 5417. [Google Scholar] [CrossRef] [Green Version]
- Cabanac, M. Adjustable set point: To honor Harold T. Hammel. J. Appl. Physiol. 2006, 100, 1338–1346. [Google Scholar] [CrossRef]
- Karjalainen, S. Thermal comfort and gender: A literature review. Indoor Air 2012, 22, 96–109. [Google Scholar] [CrossRef]
- Lipczynska, A.; Mishra, A.; Schiavon, S. Experimental evaluation of the effect of body mass on thermal comfort perception. Indoor Environ. Qual. 2020, 15, 250–260. [Google Scholar]
- Greenleaf, J.E. Environmental Issues That Influence Intake of Replacement Beverages. In Fluid Replacement and Heat Stress; National Academies Press: Washington, DC, USA, 1994; pp. 195–214. [Google Scholar]
- Campbell, S. Dietary Reference Intakes: Water, Potassium, Sodium, Chloride, and Sulfate; National Academies Press: Washington, DC, USA, 2005. [Google Scholar]
- Oǧulata, R.T. The effect of thermal insulation of clothing on human thermal comfort. Fibres Text. East. Eur. 2007, 15, 67–72. [Google Scholar]
- Damiati, S.A.; Zaki, S.A.; Rijal, H.B.; Wonorahardjo, S. Field study on adaptive thermal comfort in office buildings in Malaysia, Indonesia, Singapore, and Japan during hot and humid season. Build. Environ. 2016, 109, 208–223. [Google Scholar] [CrossRef]
- Khalid, W.; Zaki, S.A.; Rijal, H.B.; Yakub, F. Investigation of comfort temperature and thermal adaptation for patients and visitors in Malaysian hospitals. Energy Build. 2019, 183, 484–499. [Google Scholar] [CrossRef]
- Sudprasert, S. Study of Thermal Comfort and the Adaptive Behaviors of the Elderly in Naturally Ventilated Houses. Int. J. Build. Urban Inter. Landsc. Technol. 2020, 16, 73–82. [Google Scholar] [CrossRef]
- Zhang, Y.; Chen, H.; Wang, J.; Meng, Q. Thermal comfort of people in the hot and humid area of China—Impacts of season, climate, and thermal history. Indoor Air 2016, 26, 820–830. [Google Scholar] [CrossRef] [PubMed]
- Humphreys, M.A.; Rijal, H.B.; Nicol, J.F. Updating the adaptive relation between climate and comfort indoors; new insights and an extended database. Build. Environ. 2013, 63, 40–55. [Google Scholar] [CrossRef]
- Karyono, T.H. Bandung Thermal Comfort Study: Assessing the Applicability of an Adaptive Model in Indonesia. Archit. Sci. Rev. 2008, 51, 60–65. [Google Scholar] [CrossRef]
- Karyono, T.H.; Heryanto, S.; Faridah, I. Air conditioning and the neutral temperature of the Indonesian university students. Archit. Sci. Rev. 2015, 58, 174–183. [Google Scholar] [CrossRef]
- Mishra, A.; Ramgopal, M. A thermal comfort field study of naturally ventilated classrooms in Kharagpur, India. Build. Environ. 2015, 92, 396–406. [Google Scholar] [CrossRef]
- Rangsiraksa, P. Thermal comfort in Bangkok residential buildings, Thailand. In Proceedings of the 23 rd Conference on Passive and Low Energy Architecture, Geneva, Switzerland, 6–8 September 2006. [Google Scholar]
- Zhang, Y.; Chen, H.; Meng, Q. Thermal comfort in buildings with split air-conditioners in hot-humid area of China. Build. Environ. 2013, 64, 213–224. [Google Scholar] [CrossRef]
- Honjo, M.; Rijal, H.B.; Kobayashi, R.; Nakaya, T. Investigation of comfort temperature and the adaptive model in Japanese houses. Archit. Sci. Rev. 2013, 56, 54–69. [Google Scholar]
- Budiawan, W.; Tsuzuki, K. Thermal Comfort and Sleep Quality of Indonesian Students Living in Japan during Summer and Winter. Buildings 2021, 11, 326. [Google Scholar] [CrossRef]
- Hwang, R.-L.; Chen, C.-P. Field study on behaviors and adaptation of elderly people and their thermal comfort requirements in residential environments. Indoor Air 2010, 20, 235–245. [Google Scholar] [CrossRef]
- Rajasekar, E.; Ramachandraiah, A. Adaptive comfort and thermal expectations-a subjective evaluation in hot humid climate. In Proceedings of the Adapting to Change: New Thinking on Comfort Cumberland Lodge, Windsor, UK, 9–11 April 2010. [Google Scholar]
- Indraganti, M. Adaptive use of natural ventilation for thermal comfort in Indian apartments. Build. Environ. 2010, 45, 1490–1507. [Google Scholar] [CrossRef]
- De Vecchi, R.; Cândido, C.; Lamberts, R. Thermal history and its influence on occupants’ thermal acceptability and cooling preferences in warm-humid climates: A new desire for comfort. In Proceedings of the 7th Windsor Conference: The changing Context of Comfort in an Unpredictable World, Windsor, UK, 12–15 April 2012. [Google Scholar]
- Ballantyne, E.R.; Hill, R.K.; Spencer, J.W. Probit analysis of thermal sensation assessments. Int. J. Biometeorol. 1977, 21, 29–43. [Google Scholar] [CrossRef] [PubMed]
- Toe, D.H.C.; Kubota, T. Development of an adaptive thermal comfort equation for naturally ventilated buildings in hot-humid climates using ASHRAE RP-884 database. Front. Archit. Res. 2013, 2, 278–291. [Google Scholar] [CrossRef] [Green Version]
- Nicol, F.; Humphreys, M.; Roaf, S. Adaptive Thermal Comfort: Principles and Practice; Routledge: Oxford, UK, 2012. [Google Scholar]
- Aryal, A.; Chaiwiwatsworakul, P.; Chirarattananon, S.; Wattanakit, S. A field survey of thermal comfort in air-conditioned space in songkhla’s hot humid climate. Eng. J. 2021, 25, 235–244. [Google Scholar] [CrossRef]
- Rijal, H.B.; Yoshida, K.; Humphreys, M.A.; Nicol, J.F. Development of an adaptive thermal comfort model for energy-saving building design in Japan. Archit. Sci. Rev. 2021, 64, 109–122. [Google Scholar] [CrossRef]
- Markov, D. Practical evaluation of the thermal comfort parameters. Annu. Int. Course Vent. Indoor Clim. Avangard Sofia 2002, 158–170. [Google Scholar]
- Golasi, I.; Salata, F.; de Lieto Vollaro, E.; Coppi, M.; de Lieto Vollaro, A. Thermal perception in the mediterranean area: Comparing the mediterranean outdoor comfort index (moci) to other outdoor thermal comfort indices. Energies 2016, 9, 550. [Google Scholar] [CrossRef]
- Rijal, H.B.; Humphreys, M.; Nicol, F. Adaptive thermal comfort in Japanese houses during the summer season: Behavioral Adaptation and the Effect of Humidity. Buildings 2015, 5, 1037–1054. [Google Scholar] [CrossRef]
- Popkin, B.M.; D’Anci, K.E.; Rosenberg, I.H. Water, hydration, and health. Nutr. Rev. 2010, 68, 439–458. [Google Scholar] [CrossRef]
- Djamila, H.; Chu, C.M.; Kumaresan, S. Field study of thermal comfort in residential buildings in the equatorial hot-humid climate of Malaysia. Build. Environ. 2013, 62, 133–142. [Google Scholar] [CrossRef]
- Van Hoof, J.; Hensen, J.L.M. Thermal comfort and older adults. Gerontechnology 2006, 4, 223–228. [Google Scholar] [CrossRef] [Green Version]
- Schellen, L.; van Marken Lichtenbelt, W.D.; Loomans, M.G.L.C.; Toftum, J.; de Wit, M.H. Differences between young adults and elderly in thermal comfort, productivity, and thermal physiology in response to a moderate temperature drift and a steady-state condition. Indoor Air 2010, 20, 273–283. [Google Scholar] [CrossRef]
- Humphreys, M. Outdoor temperatures and comfort indoors. Batim. Int. Build. Res. Pract. 1978, 6, 92. [Google Scholar] [CrossRef]
- Yao, R.; Li, B.; Liu, J. A theoretical adaptive model of thermal comfort—Adaptive Predicted Mean Vote (aPMV). Build. Environ. 2009, 44, 2089–2096. [Google Scholar] [CrossRef]
- Humphreys, M.; Nicol, F. Understanding the Adaptive Approach to Thermal Comfort. ASHRAE Trans. 1998, 104, 991–1004. [Google Scholar]
- Rijal, H.B.; Humphreys, M.A.; Nicol, J.F. Adaptive model and the adaptive mechanisms for thermal comfort in Japanese dwellings. Energy Build. 2019, 202, 109371. [Google Scholar] [CrossRef]
- Rijal, H.B.; Humphreys, M.A.; Nicol, J.F. Towards an adaptive model for thermal comfort in Japanese offices. Build. Res. Inf. 2017, 45, 717–729. [Google Scholar] [CrossRef]
- Rijal, H.B.; Humphreys, M.A.; Nicol, J.F. Study on Behavioural Adaptation for the Thermal Comfort and Energy Saving in Japanese Offices. J. Inst. Eng. 2020, 15, 292–299. [Google Scholar] [CrossRef]
- Takasu, M.; Ooka, R.; Rijal, H.B.; Indraganti, M.; Singh, M.K. Study on adaptive thermal comfort in Japanese offices under various operation modes. Build. Environ. 2017, 118, 273–288. [Google Scholar] [CrossRef]
- Turner, S.C.; Kwok, A.G.; Aynsley, R.M.; Brager, G.S.; Deringer, J.J.; Ferguson, J.M.; Filler, J.M.; Int-hout, D.; Levin, H.; Levy, H.F.; et al. ASHRAE Standard Thermal Environmental Conditions for Human Occupancy. 2008. Available online: http://www.ditar.cl/archivos/Normas_ASHRAE/T0080ASHRAE-55-2004-ThermalEnviromCondiHO.pdf (accessed on 3 November 2022).
- Imagawa, H.; Rijal, H.B. Field survey of the thermal comfort, quality of sleep and typical occupant behaviour in the bedrooms of Japanese houses during the hot and humid season. Archit. Sci. Rev. 2015, 58, 11–23. [Google Scholar] [CrossRef]
- He, Y.; Li, N.; Zhang, W.; Peng, J. Overall and local thermal sensation & comfort in air-conditioned dormitory with hot-humid climate. Build. Environ. 2016, 101, 102–109. [Google Scholar] [CrossRef]
- Kong, D.; Liu, H.; Wu, Y.; Li, B.; Wei, S.; Yuan, M. Effects of indoor humidity on building occupants’ thermal comfort and evidence in terms of climate adaptation. Build. Environ. 2019, 155, 298–307. [Google Scholar] [CrossRef] [Green Version]
- Zaki, S.A.; Rosli, M.F.; Rijal, H.B.; Sadzli, F.N.H.; Hagishima, A.; Yakub, F. Effectiveness of a cool bed linen for thermal comfort and sleep quality in air-conditioned bedroom under hot-humid climate. Sustainability 2021, 13, 9099. [Google Scholar] [CrossRef]
Figure 1.
(a) Location of study area and field measurement locations (source: Google Maps). (b) Monthly variation in outdoor temperature and outdoor relative humidity from March 2019 until February 2020. The error bars show the standard deviation.
Figure 1.
(a) Location of study area and field measurement locations (source: Google Maps). (b) Monthly variation in outdoor temperature and outdoor relative humidity from March 2019 until February 2020. The error bars show the standard deviation.
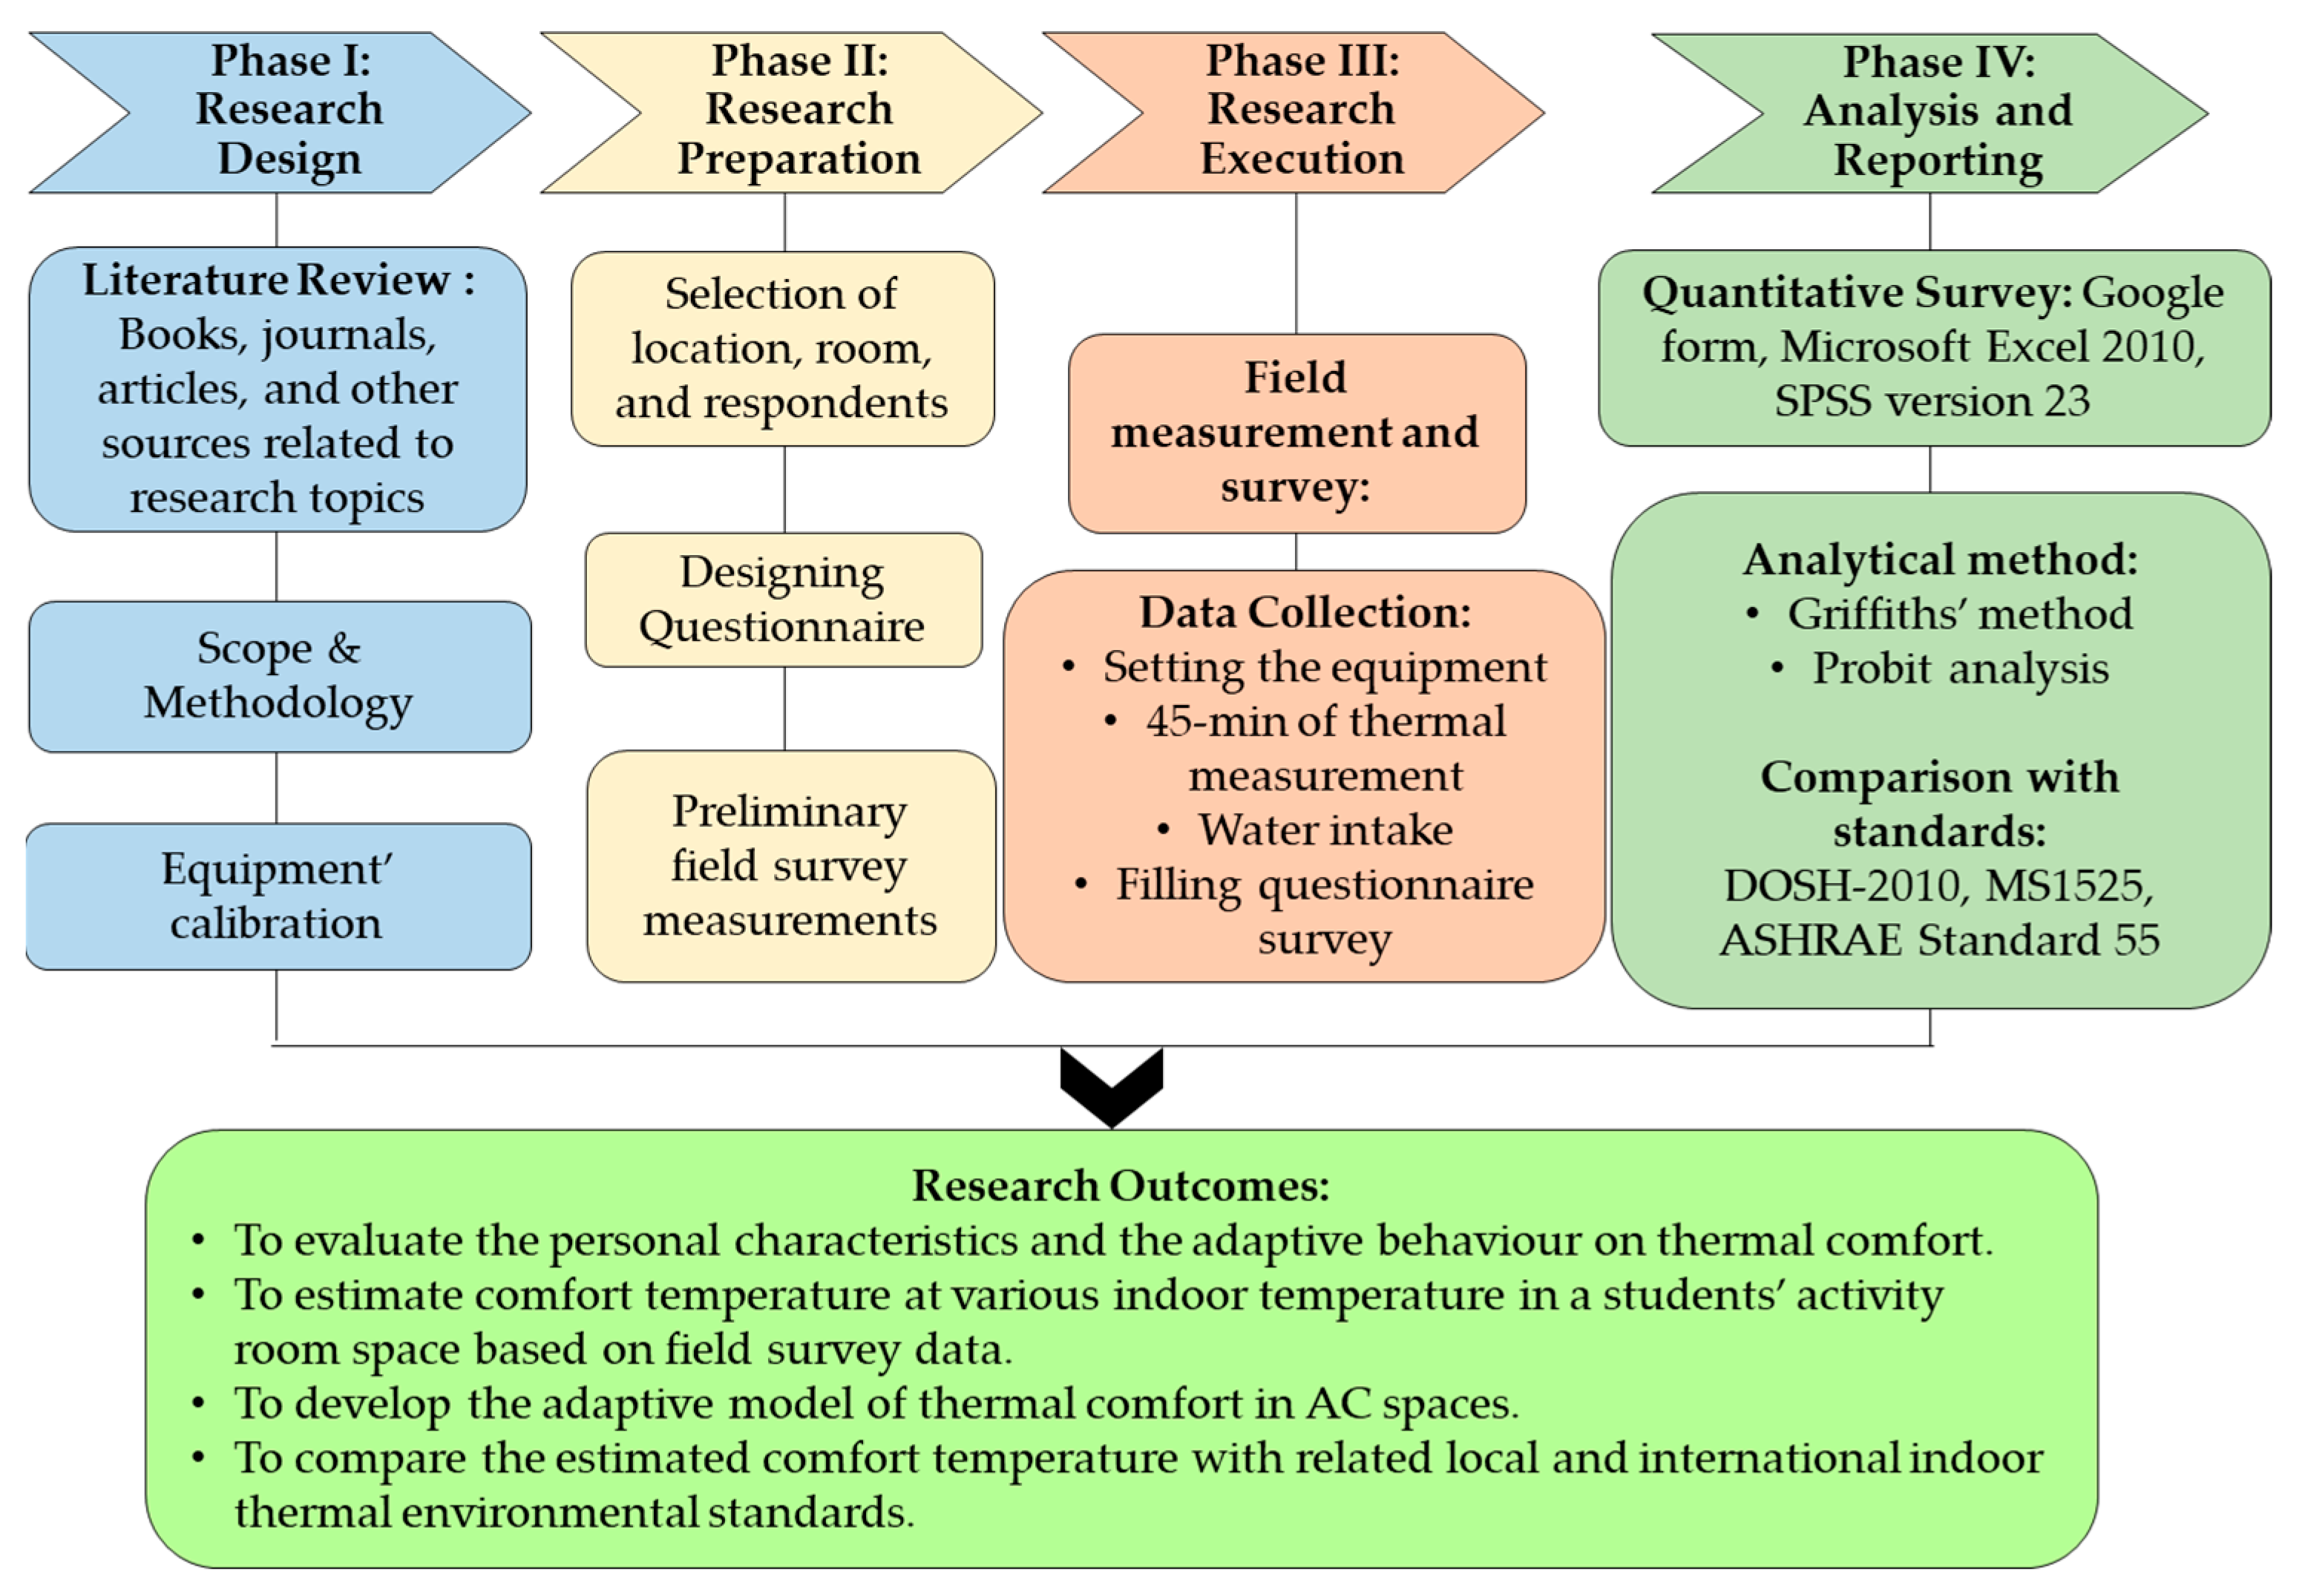
Figure 2.
(a) Studied building, (b) floor layout, (c) equipment setup—(i) air temperature, Ta; (ii) globe temperature, Tg; (iii) relative humidity, RH; (iv) air speed, Va—and (d) photos of respondents in the student activity rooms.
Figure 2.
(a) Studied building, (b) floor layout, (c) equipment setup—(i) air temperature, Ta; (ii) globe temperature, Tg; (iii) relative humidity, RH; (iv) air speed, Va—and (d) photos of respondents in the student activity rooms.
Figure 3.
Structure of the research methodology.
Figure 3.
Structure of the research methodology.
Figure 4.
Correlation of indoor operative temperatures with different setpoint temperatures for both student activity rooms.
Figure 4.
Correlation of indoor operative temperatures with different setpoint temperatures for both student activity rooms.
Figure 5.
Water intake of respondents at four different setpoint temperatures, with 95% confidence intervals.
Figure 5.
Water intake of respondents at four different setpoint temperatures, with 95% confidence intervals.
Figure 6.
Correlation of thermal preference votes with thermal sensation votes at various indoor operative temperatures for both student activity rooms.
Figure 6.
Correlation of thermal preference votes with thermal sensation votes at various indoor operative temperatures for both student activity rooms.
Figure 7.
Proportion of TSV with significant probit results: (a) each proportion of votes and (b) proportion of comfortable votes for both student activity rooms.
Figure 7.
Proportion of TSV with significant probit results: (a) each proportion of votes and (b) proportion of comfortable votes for both student activity rooms.
Figure 8.
Comparison of predicted comfort temperatures with relevant standards.
Figure 8.
Comparison of predicted comfort temperatures with relevant standards.
Figure 9.
Distribution of indoor thermal environment measurements on the ASHRAE Standard 55-2017 comfort chart; dashed lines represent summer clothing zones and solid lines represent humidity guidelines.
Figure 9.
Distribution of indoor thermal environment measurements on the ASHRAE Standard 55-2017 comfort chart; dashed lines represent summer clothing zones and solid lines represent humidity guidelines.
Table 1.
Previous field studies for residential buildings with AC modes.
Table 1.
Previous field studies for residential buildings with AC modes.
| Reference | Country | Climate | Types of Residential Buildings | Number of
Samples | Duration | Major Findings |
|---|
| Lin & Deng [16] | Hong Kong | Subtropical | High-rise | 554 | September 2002–May 2003 | AC usage peaks during sleeping hours for more than 8 h, at a temperature between 20 and 22 °C |
| Kubota et al. [17] | Malaysia | Hot and humid | One-story terrace | 800 | September–October 2004, 2009 | Occupants’ AC usage behavior uses very low setpoints |
| Puangmalee et al. [18] | Thailand | Hot and humid | Experimental room | 660 | 2015 | The effect of thermal sensation is based on different set temperatures with various air-speed levels |
| Kim et al. [19] | Australia | Humid subtropical | Detached house | 42 | March 2012–March 2014 | Occupants’ tolerance in cooler temperature conditions in relation to outdoor temperature |
Zaki, Hagishima,
et al. [10] | Malaysia | Hot and humid | Low-cost apartment | 38 | September 2013–May 2015 | The trend of AC usage peaked at night, caused by thermal discomfort |
| Zaki et al. [20] | Malaysia | Hot and humid | Low-cost apartment | 63 | September 2013–May 2015 | The habitual behavior of occupants to turn on the AC during sleeping hours |
| KC et al. [21] | Japan | Warm and temperate | Condominium | 18 | September 2016–October 2016 | The preference to adjust to adaptive behaviors such as opening windows and using fans |
| Jaffar et al. [22] | Kuwait | Hot and humid | Home villa | 250 | March–October | Thermostat setpoints contributed to a significant effect, including the building insulation and glazing |
| de Dear et al. [23] | Australia | Humid subtropical | Detached house | 42 | March 2012–March 2014 | The occupants were more tolerant of cooler temperatures |
| Lee and Shaman [24] | New York City | Humid subtropical | Apartments | 180 | September–October 2015 | AC usage at night with an average temperature setting of 21.1 °C for 8 h |
| Yoshida et al. [25] | Thailand | Hot and humid | Detached house | 32 | 2016 and 2017 | The AC usage in urban areas is longer and more frequent due to the occupants’ expectation of a comfortable lifestyle |
| Panraluk and Sreshthaputra [26] | Thailand | Hot and humid | Experimental room | 28 | March–May
2018 | The overweight elderly in Thailand felt comfortable at operative temperatures within the range of 27–29 °C. |
| Li et al. [27] | China | Hot and humid | Detached house | 150 | October 2013–December 2014 | The range of temperature settings was found between 21 and 27 °C. |
| Aqilah et al. [28] | Malaysia | Hot and humid | Low-cost apartment | 19 | March 2016–August 2017 | The occupants’ trend of turning on the AC |
| Liu et al. [29] | China | Hot and humid | Detached house;
multistory
high-rise | 38 | March–June
2018 | The AC operation is influenced by the occupants’ thermal experience |
| Jeong et al. [30] | Australia | Humid subtropical | Detached house | 42 | March 2012–March 2014 | The outdoor temperature affects the AC cooling behavior and the AC usage in living rooms |
| Sena et al. [31] | Malaysia | Hot and humid | Multistory | 214 | November 2017–
January 2018 | AC usage is among the factors affecting electricity consumption; most used temperature settings were between 19 and 25 °C |
| Ramos et al. [32] | Brazil | Humid subtropical | Multistory | 3, 259 | October 2018–January 2019 | The average duration of AC usage in living rooms was 9 h, with a temperature setting of 21 °C |
| Malik et al. [33] | Mumbai | Tropical | Multistory | 705 | January, May, August, and September | Adaptive behavior of opening windows and doors was correlated with indoor humidity, while ceiling fan usage was correlated with indoor globe temperature and humidity |
Table 2.
Equipment details and specifications.
Table 2.
Equipment details and specifications.
| Equipment | Parameter Measured | Type of Sensor | Resolution Accuracy and Tolerance |
|---|
| HOBO thermo recorder, U12—U13 | Air temperature | External sensor cable tmc1-hd + aluminum cup | 0.03 °C ± 0.35 °C
(0 to 50 °C) |
| | Globe temperature | External sensor cable tmc1-hd + 40 mm black sphere | |
| Relative humidity | Internal sensor | 0.03% ± 2.5% RH
(10% to 90%) |
| Kanomax hot-wire anemometer 6501 | Air speed | Needle probe 6542-2G | 0.01 m/s
±(2% reading ± 0.0125) m/s
(0.10 to 30.0 m/s) |
| Digital weighing scale | Water intake | Strain gauge | 0.1—1 g |
Table 3.
The scale of thermal sensation vote, humidity sensation, and air movement vote.
Table 3.
The scale of thermal sensation vote, humidity sensation, and air movement vote.
| Scale | Thermal Sensation Vote (TSV) | Humidity Sensation (HS) | Air Movement Vote (AMV) |
|---|
| −3 | Very cold | Very dry | Very bad |
| −2 | Cool | Dry | Bad |
| −1 | Slightly cool | Slightly dry | Slightly bad |
| 0 | Neutral | Neutral | Neither bad nor good |
| 1 | Slightly warm | Slightly humid | Slightly good |
| 2 | Warm | Humid | Good |
| 3 | Very hot | Very humid | Very good |
Table 4.
The scale of thermal preference, humidity preference, and overall comfort.
Table 4.
The scale of thermal preference, humidity preference, and overall comfort.
| Scale | Thermal Preference (TP) | Humidity Preference (HP) | Overall Comfort (OC) |
|---|
| 6 | - | - | Very comfortable |
| 5 | - | - | Moderately comfortable |
| 4 | - | - | Slightly comfortable |
| 3 | - | - | Slightly uncomfortable |
| 2 | Much cooler | Much drier | Moderately uncomfortable |
| 1 | A bit cooler | A bit drier | Very uncomfortable |
| 0 | No change | No change | - |
Table 5.
Descriptive statistics of indoor environmental parameters.
Table 5.
Descriptive statistics of indoor environmental parameters.
Students’ Activity
Rooms | Ts
(℃) | Var. | Ta
(°C) | Tg
(°C) | Tmrt
(°C) | Top
(°C) | RH
(%) | AH
(g/kg DA) | Va
(m/s) |
|---|
A1
(n = 172) | 16 | Mean | 19.0 | 19.7 | 20.6 | 19.7 | 53 | 8.8 | 0.15 |
| S.D. | 1.2 | 1.2 | 1.4 | 1.2 | 3 | 0.5 | 0.01 |
| 20 | Mean | 20.4 | 21.3 | 22.5 | 21.2 | 53 | 9.6 | 0.16 |
| S.D. | 1.2 | 1.3 | 2.0 | 1.2 | 5 | 0.6 | 0.02 |
| 24 | Mean | 23 | 23.5 | 24.2 | 23.5 | 54 | 11.4 | 0.17 |
| S.D. | 0.3 | 0.4 | 0.7 | 0.3 | 4 | 0.8 | 0.01 |
| 28 | Mean | 26.4 | 26.6 | 29.4 | 26.6 | 65 | 16.8 | 0.16 |
| S.D. | 0.9 | 0.9 | 2.3 | 0.9 | 5 | 0.8 | 0.01 |
A2
(n = 80) | 16 | Mean | 18.2 | 18.7 | 19.4 | 18.7 | 61 | 9.6 | 0.14 |
| S.D. | 0.9 | 1.0 | 1.4 | 1.05 | 4 | 0.7 | 0.01 |
| 20 | Mean | 20.9 | 21.0 | 21.5 | 21.1 | 66 | 12.2 | 0.70 |
| S.D. | 0.6 | 0.7 | 2.9 | 1.1 | 4 | 0.9 | 0.01 |
| 24 | Mean | 23.5 | 23.7 | 23.9 | 23.7 | 77 | 16.7 | 0.15 |
| S.D. | 0.6 | 0.7 | 0.9 | 0.7 | 2 | 0.5 | 0.02 |
| 28 | Mean | 26.7 | 26.7 | 26.6 | 26.7 | 84 | 22.1 | 0.38 |
| S.D. | 0.6 | 0.6 | 0.6 | 0.6 | 2 | 0.9 | 0.22 |
Table 6.
Regression between setpoint temperature and indoor air temperature.
Table 6.
Regression between setpoint temperature and indoor air temperature.
| Students’ Activity Rooms | n | Regression Equation | R2 | S.E. |
|---|
| A1 | 172 | Top = 0.95Ts + 1.70 | 0.99 | 0.013 |
| A2 | 80 | Top = 0.93Ts + 1.76 | 0.96 | 0.024 |
| Both | 252 | Top = 0.94Ts + 1.64 | 0.98 | 0.013 |
Table 7.
Griffiths comfort temperatures and mean operative temperatures with votes.
Table 7.
Griffiths comfort temperatures and mean operative temperatures with votes.
| Students’ Activity Room | Griffiths’ Method | TSV = 0 | OC = 5 or 6 |
|---|
| n | Tcop (°C) | S.D. | n | Tcop (°C) | S.D. | n | Tcop (°C) | S.D. |
|---|
| A1 | 172 | 25.1 | 1.8 | 32 | 25.1 | 1.6 | 63 | 23.4 | 2.4 |
| A2 | 80 | 24.4 | 1.5 | 16 | 24.6 | 1.5 | 19 | 21.7 | 2.3 |
| Both | 252 | 24.3 | 2.6 | 48 | 24.9 | 1.6 | 82 | 22.9 | 2.7 |
Table 8.
Comparison of comfort temperatures for residential buildings with AC modes.
Table 8.
Comparison of comfort temperatures for residential buildings with AC modes.
| Author | Country | (°C)
| (°C)
|
|---|
| This study | Malaysia | 16, 20, 24 and 28 | 24.3 |
| Uno et al. [11] | Indonesia | 18 to 26 | 25 to 27 |
| Karyono [66] | Indonesia | - | = 25.7
= 25.4 |
| Karyono et al. [67] | Indonesia | - | = 22.6 to 25.7
= 19.6 to 23.9 |
| Mishra & Ramgopal [68] | India | - | 22.1 to 31.5 |
| Rangsiraksa [69] | Thailand | - | 25 |
| Puangmalee et al. [18] | Thailand | 25 to 28 | 28 |
| Sudprasert [63] | Thailand | - | 29 |
| Zhang et al. [70] | China | 26 | 20.6 to 30.5 |
| Li et al. [27] | China | 21 to 27 | 26 to 28 |
| Honjo et al. [71] | Japan | - | 26.1 |
| Budiawan and Tsuzuki [72] | Japan | - | 28.1 |
| Hwang and Chen [73] | Taiwan | - | 23.2 to 27.1 |
| Rajasekar and Ramachandraiah [74] | India | - | 26.8 to 31 |
| Indraganti [75] | India | - | 26.0 to 32.5 |
| De Vecchi et al. [76] | Brazil | 21 to 24 | 22.5 |
Table 9.
Probit analysis of TSV and indoor operative temperature as covariates.
Table 9.
Probit analysis of TSV and indoor operative temperature as covariates.
| Probit Equation | Mean (°C) | S.D. | R2 | S.E. |
|---|
| P (≤−3) = 0.45Top + 8.38 | 18.8 | 0.033 | 0.58 | 0.033 |
| P (≤−2) = 0.45Top + 9.87 | 22.2 |
| P (≤−1) = 0.45Top + 10.72 | 24.1 |
| P (≤0) = 0.45Top + 11.89 | 26.7 |
| P (≤1) = 0.45Top + 12.95 | 29.1 |
| P (≤2) = 0.45Top + 13.87 | 30.5 |
Table 10.
Comparison of comfort temperatures of previous studies.
Table 10.
Comparison of comfort temperatures of previous studies.
| Location | Reference(s) | N | Observed Tc (°C) |
|---|
| Malaysia | This study | 252 | 25.0 |
| China | Hwang and Chen [73] | 1955 | 24.2 |
| Japan | Rijal [43] | 3991 | 26.0 |
| Thailand | Aryal et al. [80] | 300 | 26.3 |
| Japan | Rijal et al. [81] | 6872 | 25.0 |
Table 11.
PMV and TSV results.
Table 11.
PMV and TSV results.
Variables
(n = 252) | PMV | PPD (%) | TSV | APD (%) |
|---|
| Mean | 1.5 | 36 | 1.4 | 35 |
| S.D. | −2.2 | 67 | −1.0 | 51 |
Table 12.
Regression equations for cooling modes used in previous studies.
Table 12.
Regression equations for cooling modes used in previous studies.
| References | Buildings | Regression Equation | n | R2 | S.E. |
|---|
| This study | University | = 0.42 + 12.3 | 252 | 0.049 | 0.006 |
| Karyono [67] | University | = 0.75 + 5.95 | 72 | 0.38 | - |
| Honjo et al. [71] | Residential | = 0.29 + 18.8 | 1955 | 0.03 | - |
| Rijal et al. [92] | Residential | = 0.18 + 22.1 | 2109 | 0.10 | 0.013 |
| CIBSE [35] | Offices | = 0.09 ± 22.6 | - | - | - |
| Rijal et al. [93] | Offices | = 0.065 + 23.9 | 4857 | 0.08 | 0.005 |
| Rijal et al. [94] | Offices | = 0.359 − 8.5 | 1241 | 0.37 | 0.024 |
| Indraganti et al. [95] | Offices | = 0.15 + 22.1 | 4310 | 0.026 | 0.014 |
Table 13.
Comparison of indoor environmental conditions for residential buildings in a hot and humid climate or summer season.
Table 13.
Comparison of indoor environmental conditions for residential buildings in a hot and humid climate or summer season.
| References | n | Ta (°C) | RH (%) | Absolute Humidity,
AH (g/kg. DA) |
|---|
| This study | 252 | 17.0 to 27.5 | 50 to 98 | 8 to 22 |
| Imagawa and Rijal [97] | 1176 | 26.3 to 27.9 | 38 to 78 | - |
| He et al. [98] | 467 | 21.0 to 29.3 | 46 to 91 | - |
| Kong et al. [99] | 24 | 25.0 to 28.0 | 20 to 90 | - |
| Budiawan and Tsuzuki [72] | 18 | 24.6 to 29.0 | 55 to 79 | 12.9 to 21.5 |
| Zaki et al. [100] | 20 | 23.0 to 24.7 | 68 to 74 | 12.5 to 14.8 |
| Aryal et al. [80] | 300 | 24.9 to 26.7 | 37 to 98 | - |
| Disclaimer/Publisher’s Note: The statements, opinions and data contained in all publications are solely those of the individual author(s) and contributor(s) and not of MDPI and/or the editor(s). MDPI and/or the editor(s) disclaim responsibility for any injury to people or property resulting from any ideas, methods, instructions or products referred to in the content. |
© 2022 by the authors. Licensee MDPI, Basel, Switzerland. This article is an open access article distributed under the terms and conditions of the Creative Commons Attribution (CC BY) license (https://creativecommons.org/licenses/by/4.0/).


 ,
, 


