Article

Experimental Validation and Numerical Analysis of a High-Performance Blast Energy-Absorbing System for Building Structures

by
Gabriel de Jesus Gomes
1,*,
Valter José da Guia Lúcio
2,
Corneliu Cismaşiu
2 and
José Luis Mingote
3
1
CINAMIL and Military Academy, 1169-203 Lisbon, Portugal
2
CERIS NOVA and Department of Civil Engineering of NOVA School of Science and Technology, 2829-516 Caparica, Portugal
3
NATO Counter Improvised Explosive Devices Centre of Excellence, 28240 Madrid, Spain
*
Author to whom correspondence should be addressed.
Buildings 2023, 13(3), 601; https://doi.org/10.3390/buildings13030601
Submission received: 19 January 2023 / Revised: 10 February 2023 / Accepted: 16 February 2023 / Published: 24 February 2023

Abstract

:
The paper presents a full-scale blast testing experimental campaign conducted on an energyabsorbing connector comprising thin-walled inversion tubes as kernel elements mounted in a façade protective panel. LS-DYNA finite element predictions of the global and local deformation/inversion of the panel/connectors compared reasonably well with the experimental observations. After validation, the numerical model was used to analyze the response of a simple idealized reinforced concrete structure under three blast-loading scenarios: the first two scenarios produce, approximately, the same impulse but are significantly different in terms of load duration and overpressures, and represent a far-field and a near-field scenario (1600 kg TNT at 20 m (i) and 150 kg TNT at 5 m (ii), respectively); the third scenario is more demanding, and consists in a half standoff distance of the second (150 kg TNT at 2.5 m (iii)). These numerical simulations allow to assess the effect of standoff distance and blast loading on the effectiveness of the protective system. One may conclude that the introduction of EACs strongly limits the forces imparted to the protected structure, reducing significantly the corresponding energy absorption demand. Comparing the energy absorbed by the structure in different scenarios, with and without the protective system (8 × ϕ64 × 2 mm), one can see that these reductions can reach, respectively 67%, 72% and 68% in the far-field, near-field and very near-field explosions.

1. Introduction

Research on the effects of explosions in infrastructures is significant, particularly in the fields of military operations in high threat environments and hazard prevention in industrial facilities where explosion risks exist, such as oil, mining and chemical industries, but also as a response to the need for nations to protect citizens against terrorist threats. In expeditionary military missions, the limitations and logistical problems faced by the first military forces entering a new theater of operations are also known, namely, the lack of adequate infrastructure for the settle down of these forces, which sometimes leads to the re-use of existing buildings where important activities are run (e.g., command and staff) or have a considerable human presence (billeting, food areas, etc.). Therefore, taking into account a plausible threat and the need to protect civilians, workers and/or troops are of utmost importance to assess the extent of the potential damage and, consequently, to design adequate protection measures and systems.
Protection against explosions of military, industrial or governmental critical infrastructures has motivated the scientific community to develop technical solutions using a wide variety of materials and systems. In the case of vertical structural elements, such as columns and shear walls, most of the studied solutions focus on the strengthening of the elements and/or of the associated connections. Several protective solutions have been reported in the literature, especially jacketing, based either on high-performance concrete, including fiber incorporations [1,2,3] or on welded steel plates. Catching systems have also been used, allowing the existing elements to break under extreme loading and the resulting debris to be collected by an internal layer [4,5], or gathered together by elastomers glued to the surface of the walls, providing a significant increase in ductility [6]. The use of planar elements to protect supporting elements, i.e., columns and shear walls, or to perform an integral encapsulation of the structure, has been reported as well as an alternative option. The most common solutions use sacrificial panels coupled to the existing structure through rigid connectors. These sacrificial elements could be simply reinforced concrete panels [4], or, in the case of more sophisticated protective solutions, could include some kind of strengthening, such as ultra-high strength concrete layers or dissipative cores, such as cellular materials, honeycombs and lattice truss structures [7,8,9,10,11].
Typically, the effects of a near field explosion outside a building primarily affect local elements (e.g., supporting columns) and then might develop into a global failure of the whole structure (progressive collapse). This finding motivated the development of protective systems for structural and/or non-structural façade elements directly exposed to blast, shielding the structural elements from being directly loaded by the explosion. The system concept hereunder, that is fully explained in [12], is based on the use of a rigid panel connected to the building at floor levels through a series of ductile energy absorbing connectors (EACs) that exploit the external inversion of circular cross-section steel tubes to absorb part of the blast energy (see Figure 1). When the blast wave reaches the building, the façade panel is loaded and triggers the set of connectors that start to absorb the kinetic energy transmitted by the explosion. Depending on the blast magnitude and the design of the connecting devices, this mechanism ensures that only a residual part of the kinetic energy is transferred to the structure, mobilizing its resistant capacity to horizontal loading.
The present paper reports a full-scale blast tests campaign aimed to validate the application of EACs on a full-scale panel element and to allow a deep insight of the global response of the complete protective system. These experimental results allow to calibrate and validate FE numerical models that are then used to perform further studies on more complex interactions using an idealized structure to be protected. During the experimental campaign, the effects of the impulsive loading were evaluated, focusing on (i) the deformations of the sacrificial panel, with and without EACs, (ii) the force transmitted to the protected structure, with and without EACs, to estimate the force attenuation and absorbed energy, (iii) the deformations of the connectors (inversion length) to compare with predictions from numerical and analytical models, and (iv) the sensitivity of the system’s performance to the ratio between the panel and connectors resistance.
A series of finite element (FE) models were developed in LS-DYNA software [13] and used to simulate the dynamic response of the energy-absorbing system. After calibration and validation, the FE models were used to estimate the blast response of an idealized reinforced concrete structure subject to different blast loading scenarios (far field, near field and very near field) and to assess the performance of the energy-absorbing system under different demands.

2. Experimental Campaign

The present section reports on the experimental campaign, the test setup detailing, the geometry and the mechanical material characteristics of the tested components, the blast load, and the instrumentation. The recorded data are analyzed and used to calibrate the material and blast loading parameters in the LS-DYNA FE models.

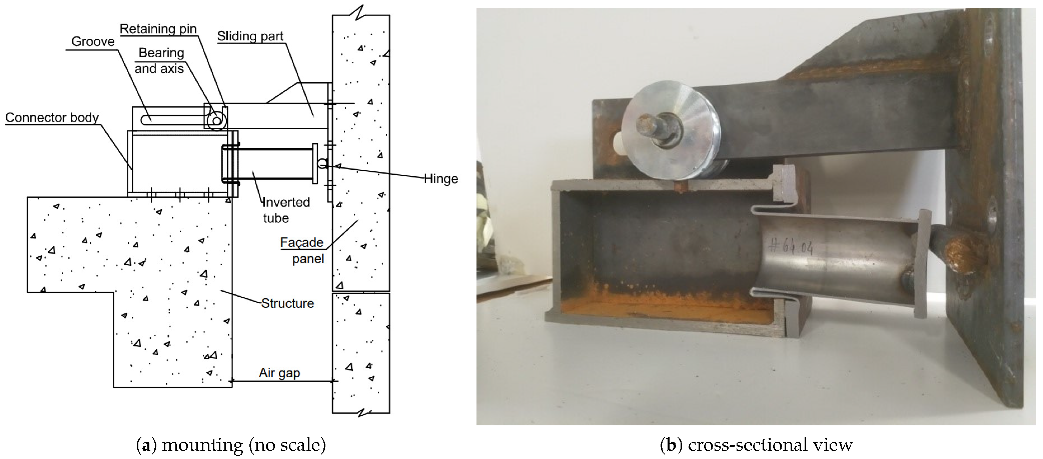
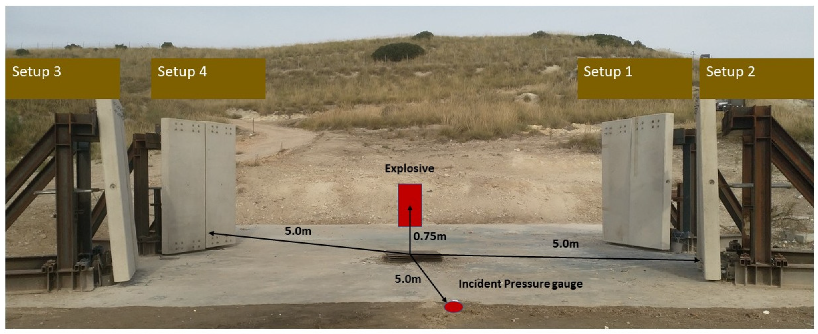
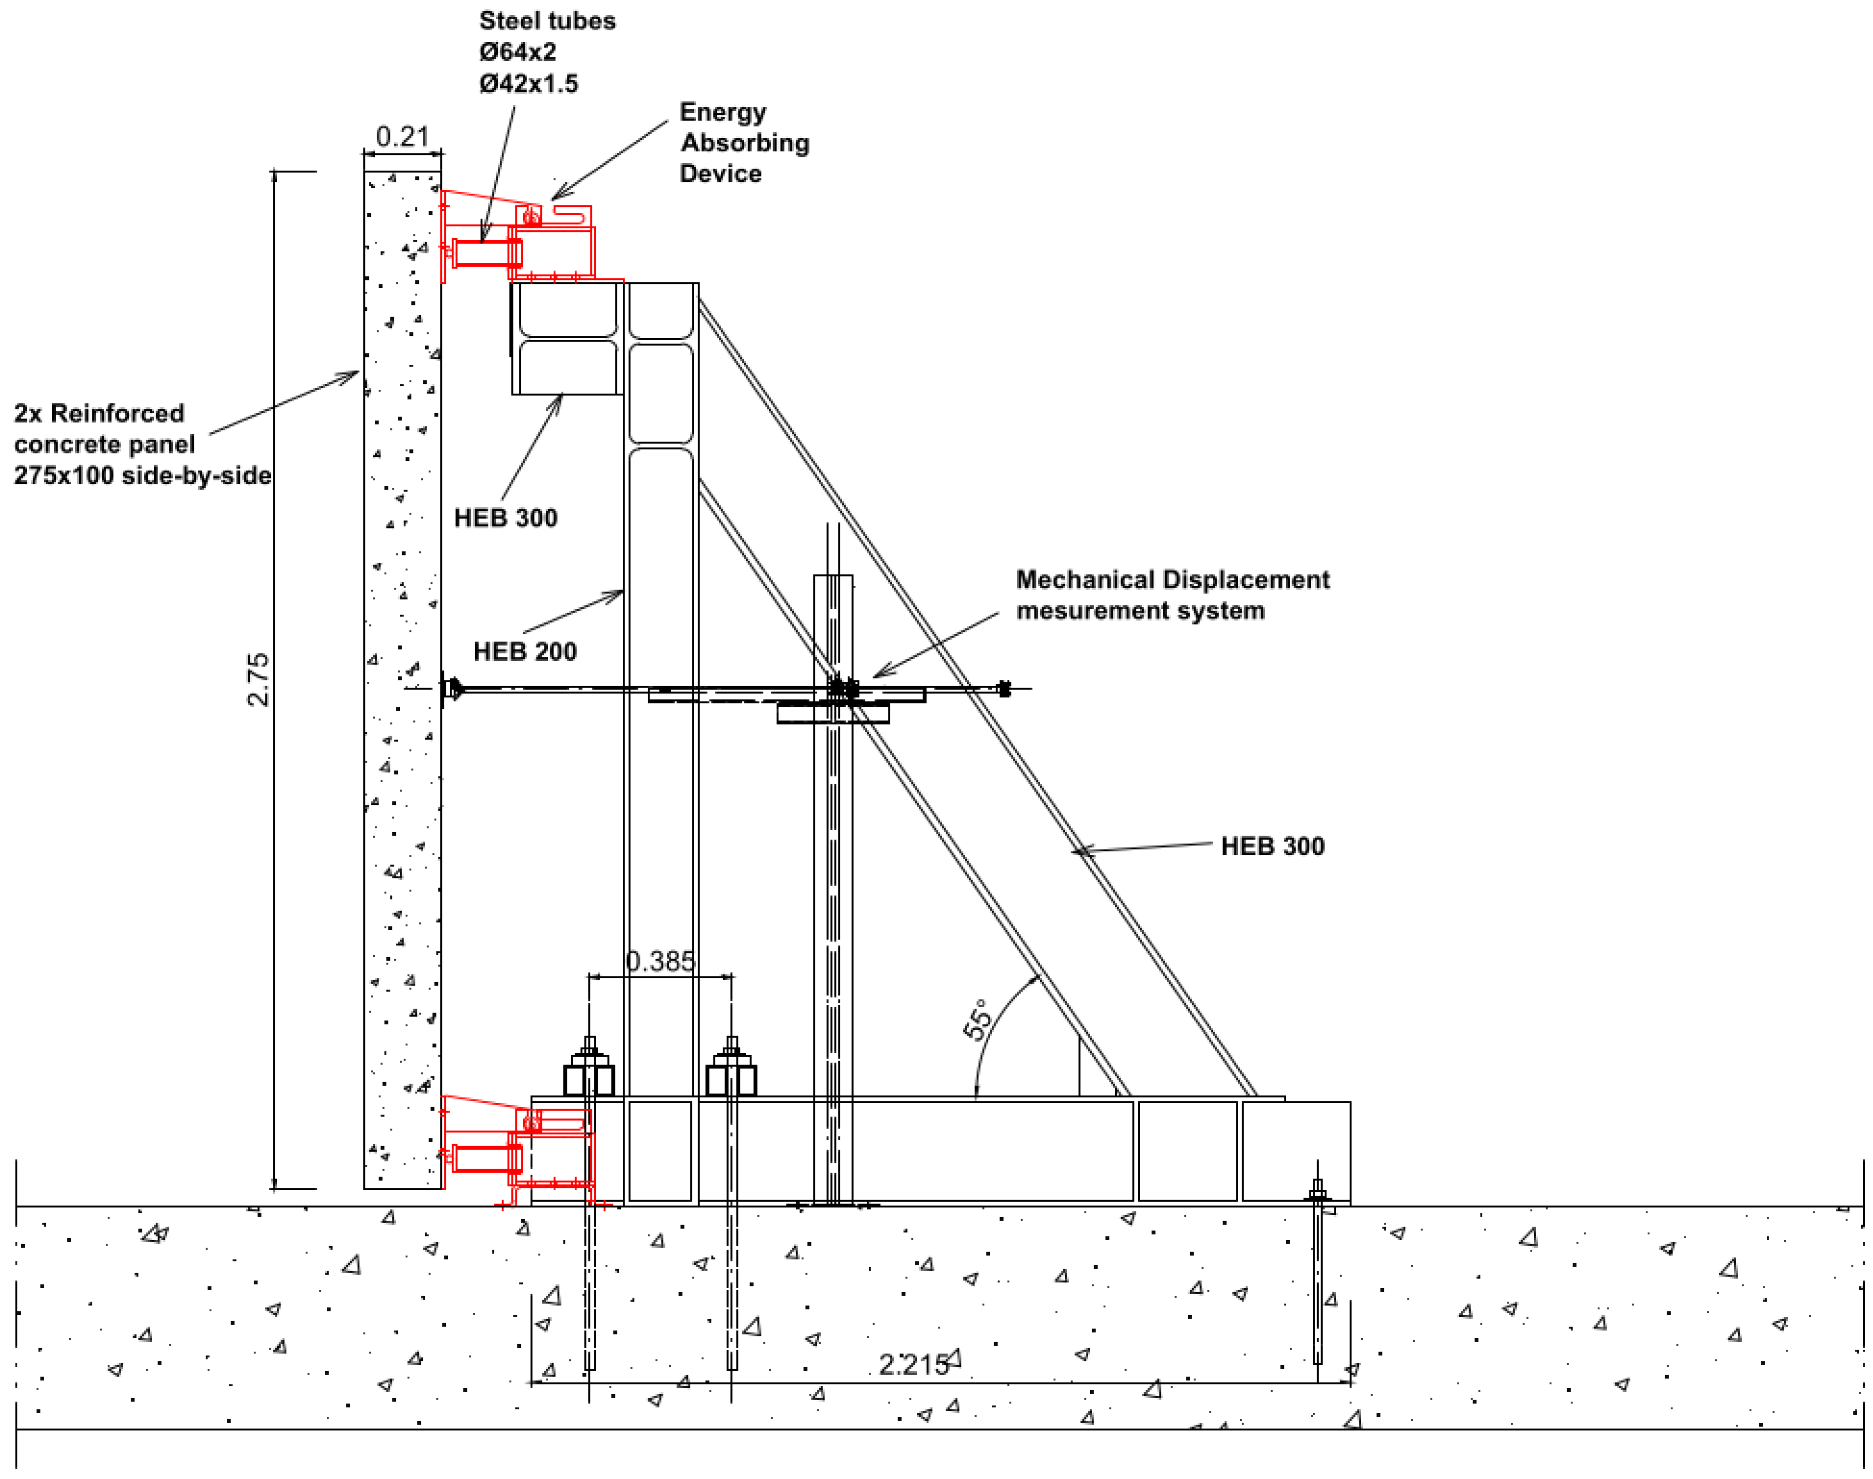
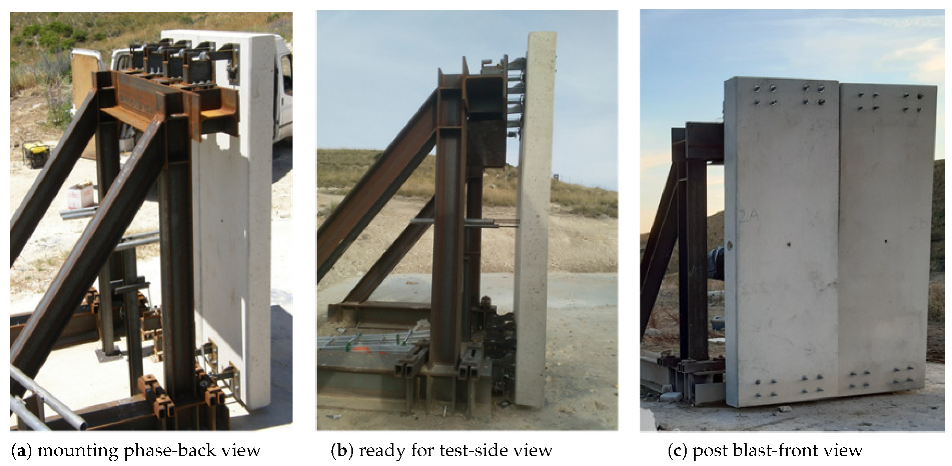
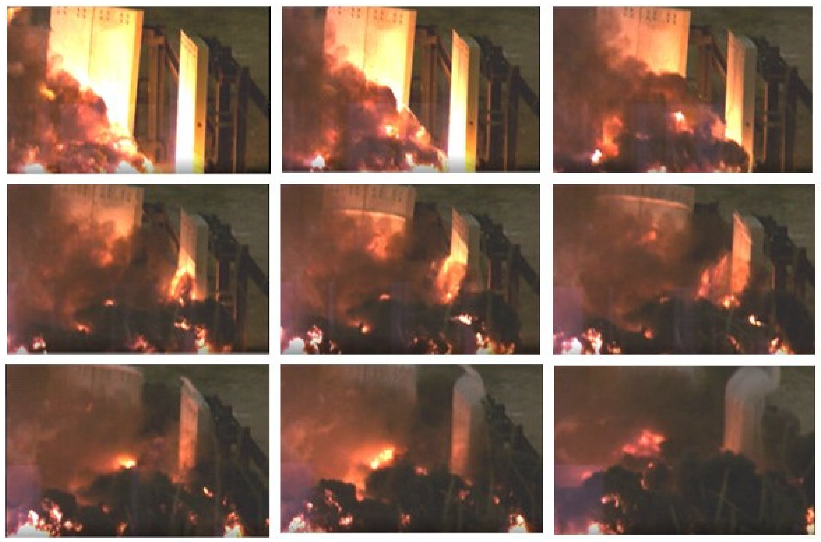
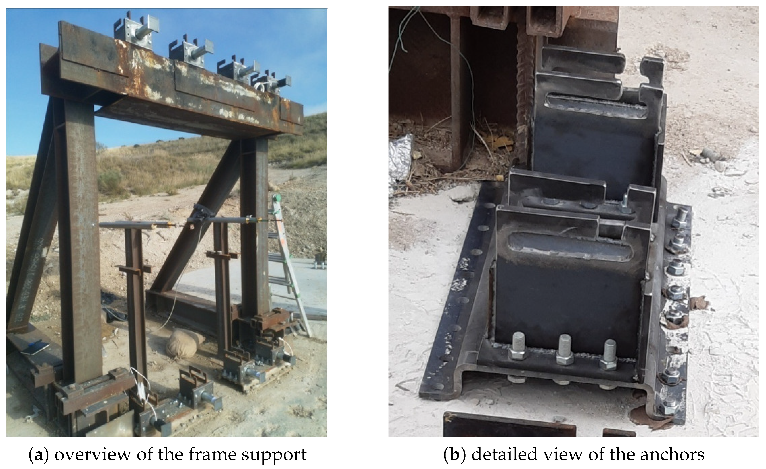
2.1. Blast Test Setup

The test setup replicates a typical service situation in which vertical façade sacrificial panels are connected through EACs to a building (represented here by a steel reaction structure, see Figure 2, Figure 3 and Figure 4. The testing infrastructure was set up at the National Institute of Aerospace Technology/INTA Campus “La Marañosa” Testing Centre (INTA/La Marañosa), located in San Martín de la Vega, Madrid, Spain.
Two reaction structures (setups 2 and 4 in Figure 2) placed face-to-face at 5 m from the explosive charge were used to carry out this research. Each of them supports two identical RC panels ( 2.75 × 1.00 × 0.21 m), which means that four panels with the same size and reinforcement pattern were tested simultaneously. One of the panels is connected to the supporting frame using rigid connectors (the left panel in Figure 4c and Figure 5b), while the others are connected through four EACs (Figure 4a,b and Figure 5a).

2.2. Materials

Eight RC façade panels were produced for this study, made of concrete with an average compressive strength, σ c = 32.9  MPa. Static tests conducted on the 16 mm diameter rebars yielded the following material parameters: E s = 210.6  GPa, f y = 542  MPa and f u = 639  MPa. Table 1 shows the most important mechanical characteristics of the steel tubes as illustrated in Figure 1, the EAC comprises the connector body, fixed to the protected structure, a sliding part attached to the façade panel and a kernel element to absorb energy, exploiting the external inversion mechanism of the steel tubes) used to manufacture the core element of the EACs (inverters), i.e., Young modulus E s , yield stress f y , tensile stress f u , inverter steady force P s , and available stroke δ .
The results of typical compression tests plotted in Figure 6 show the force-shortening history in forming and post forming operations (inversion). Under service condition, the steady forces, P s , of the external inversion mechanism are typically constant and the after-forming force–displacement curve assumes an almost elastic perfectly plastic shape (see the case of the ϕ 42 sample in Figure 6).

2.3. Explosive Charge

Two tests were carried out with an explosive load that represents a typical vehicle-borne improvised explosive device (VBIED) in close range. The explosive charge was RIODIN, a dynamite based in nitroglicerine/nitroglicol produced by MAXAM Company. According to the manufacturer, the main characteristics of RIODIN are density 1.45 g/cm 3 , velocity of detonation (VoD) 6000 m/s for standard density, and heat of explosion 4.1 MJ/kg.
Explosive candles with dimensions of 60 × 570  mm (2300 g) and 50 × 380  mm (1042 g) were grouped to form a 60 kg cylindrical load (540 mm length × 330 mm diameter). The trigger system was electric, and initiation was achieved through two electrical blasting caps, placed in priming holes on the top side, at the center of the charge, in a side-by-side position.
In the first blast test (test #1), the explosive charge was resting on an existing concrete slab at ground level, 5 m away from the panels. The next test (test #2) was performed with the charge resting on a 0.5 m high polyfoam block (high of burst was 0.75–0.80 m at the center of the charge), keeping the same distance from the panels.

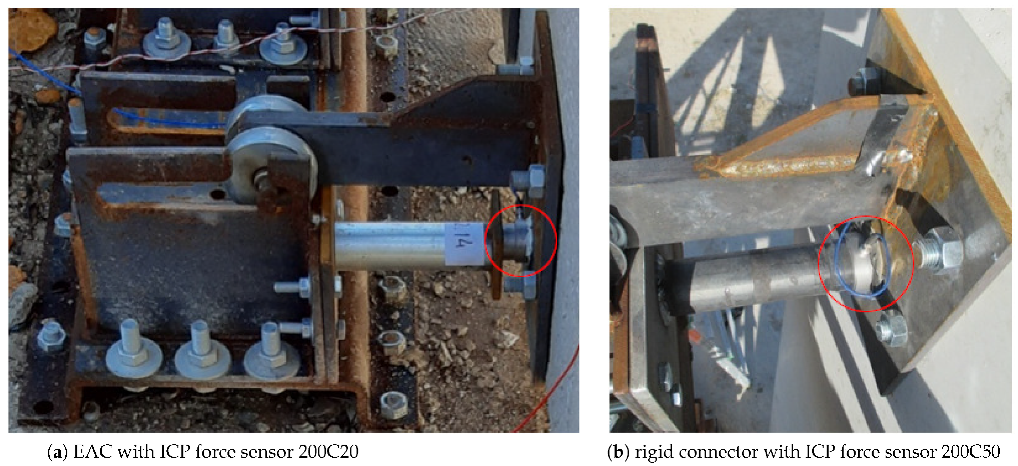
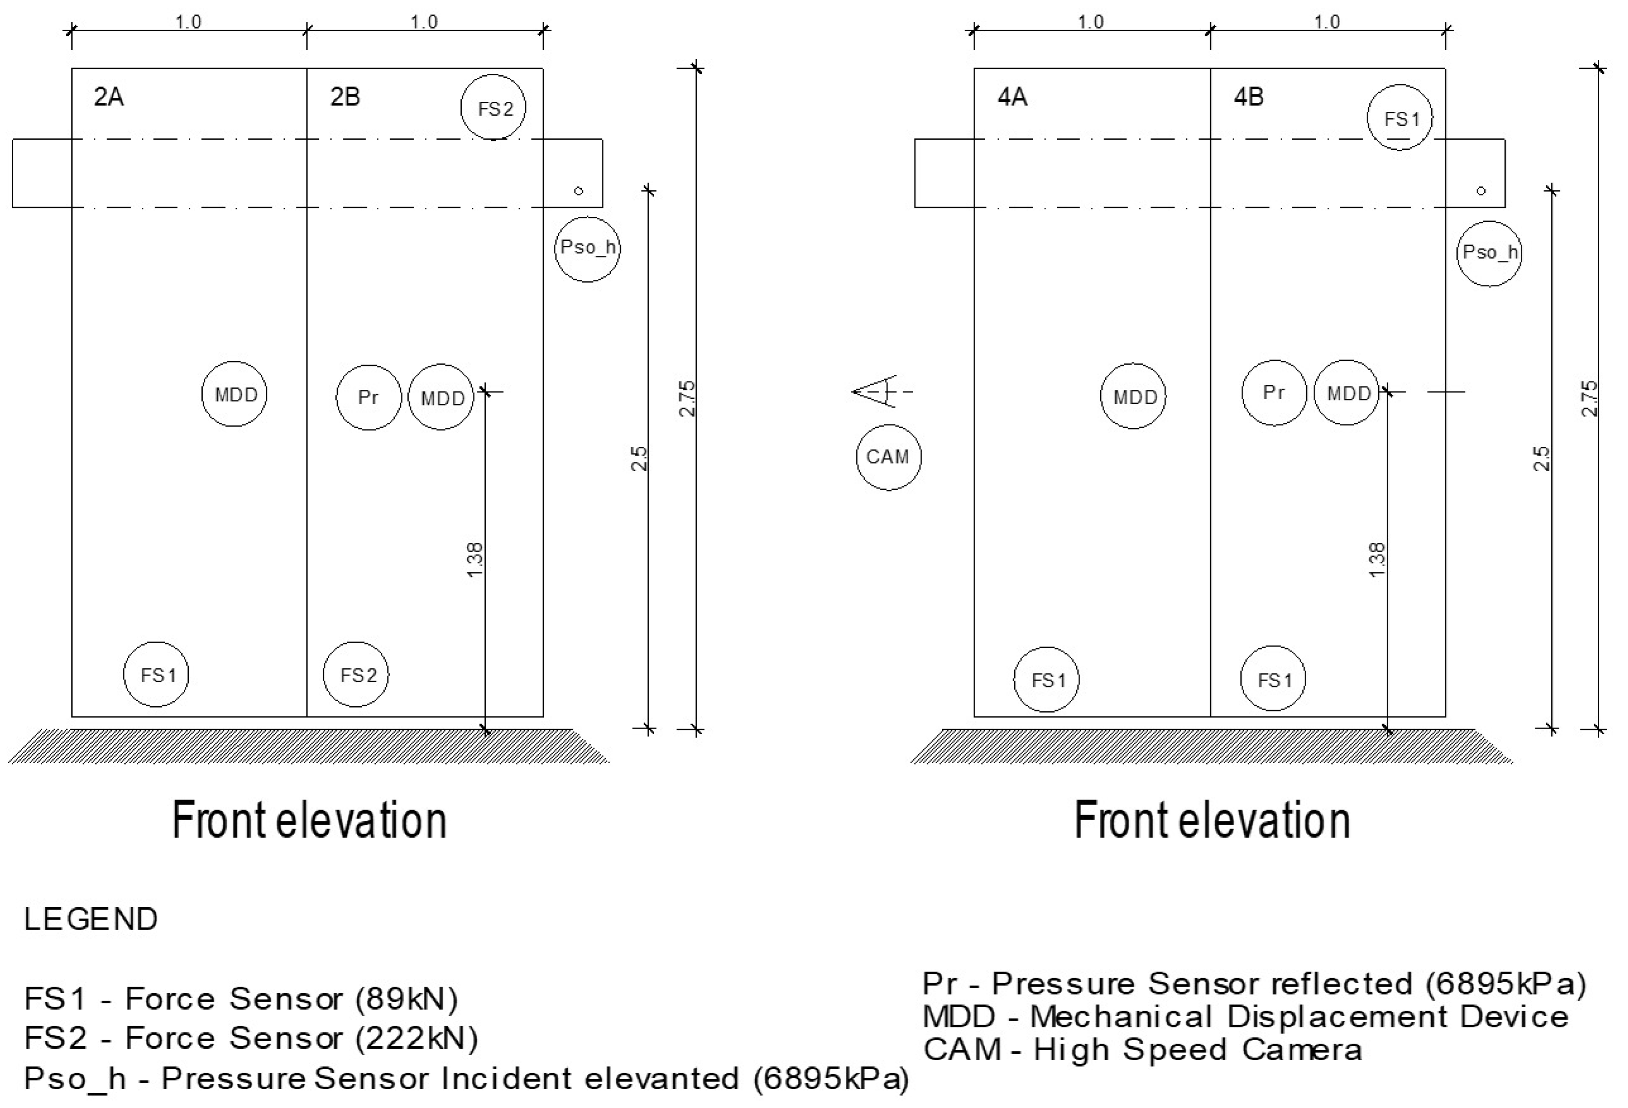
2.4. Instrumentation

The experimental tests were instrumented with a series of piezoelectric and electronic sensors, i.e., pressure gauges, force sensors and accelerometers. In addition to the sensors, high-speed footage allowed to extract complementary data that, together with the sensors recordings, were used to validate numerical models that sought to represent the behavior of the overall system.
The incident overpressures were measured using general purpose 113B24 PCB piezoelectric crystals pressure gauges with a measurement range up to 6895 kPa and a sensitivity of 0.725 mV/kPa, placed respectively on the ground and at 2.5 m high at a distance of 5 m from the center of the charge (Figure 3 and Figure 7). ICP force sensors were placed in strategic locations to assess the forces transmitted to the supports and further evaluate the effectiveness of the EACs: four 200C20 sensors with a sensitivity of 56.2 mV/kN (±15%) and a measurement range up to 88.96 kN to instrument the EACs; and two 200C50 sensors, with a sensitivity of 22.48 mV/kN (±15%) and a measurement range up to 222.4 kN to record the dynamic reactions at the rigid supports. Blast test footage was recorded with a Photrom Fastcam SA4 ISO 4000 color high-speed camera, providing 3600 fps at 1024 × 1024 pixels resolution and up to 500,000 fps at a reduced resolution of 128 × 16 pixels. The specific locations of all sensors are shown in Figure 7.

2.5. Recorded Data

Despite the extreme high dynamic nature of the full-scale blast and the inherent challenges in controlling all the parameters involved in the field test, a significant amount of useful data was recorded with a sampling rate up to 10 MHz, allowing for a proper understanding and characterization of the dynamic behavior of the system.

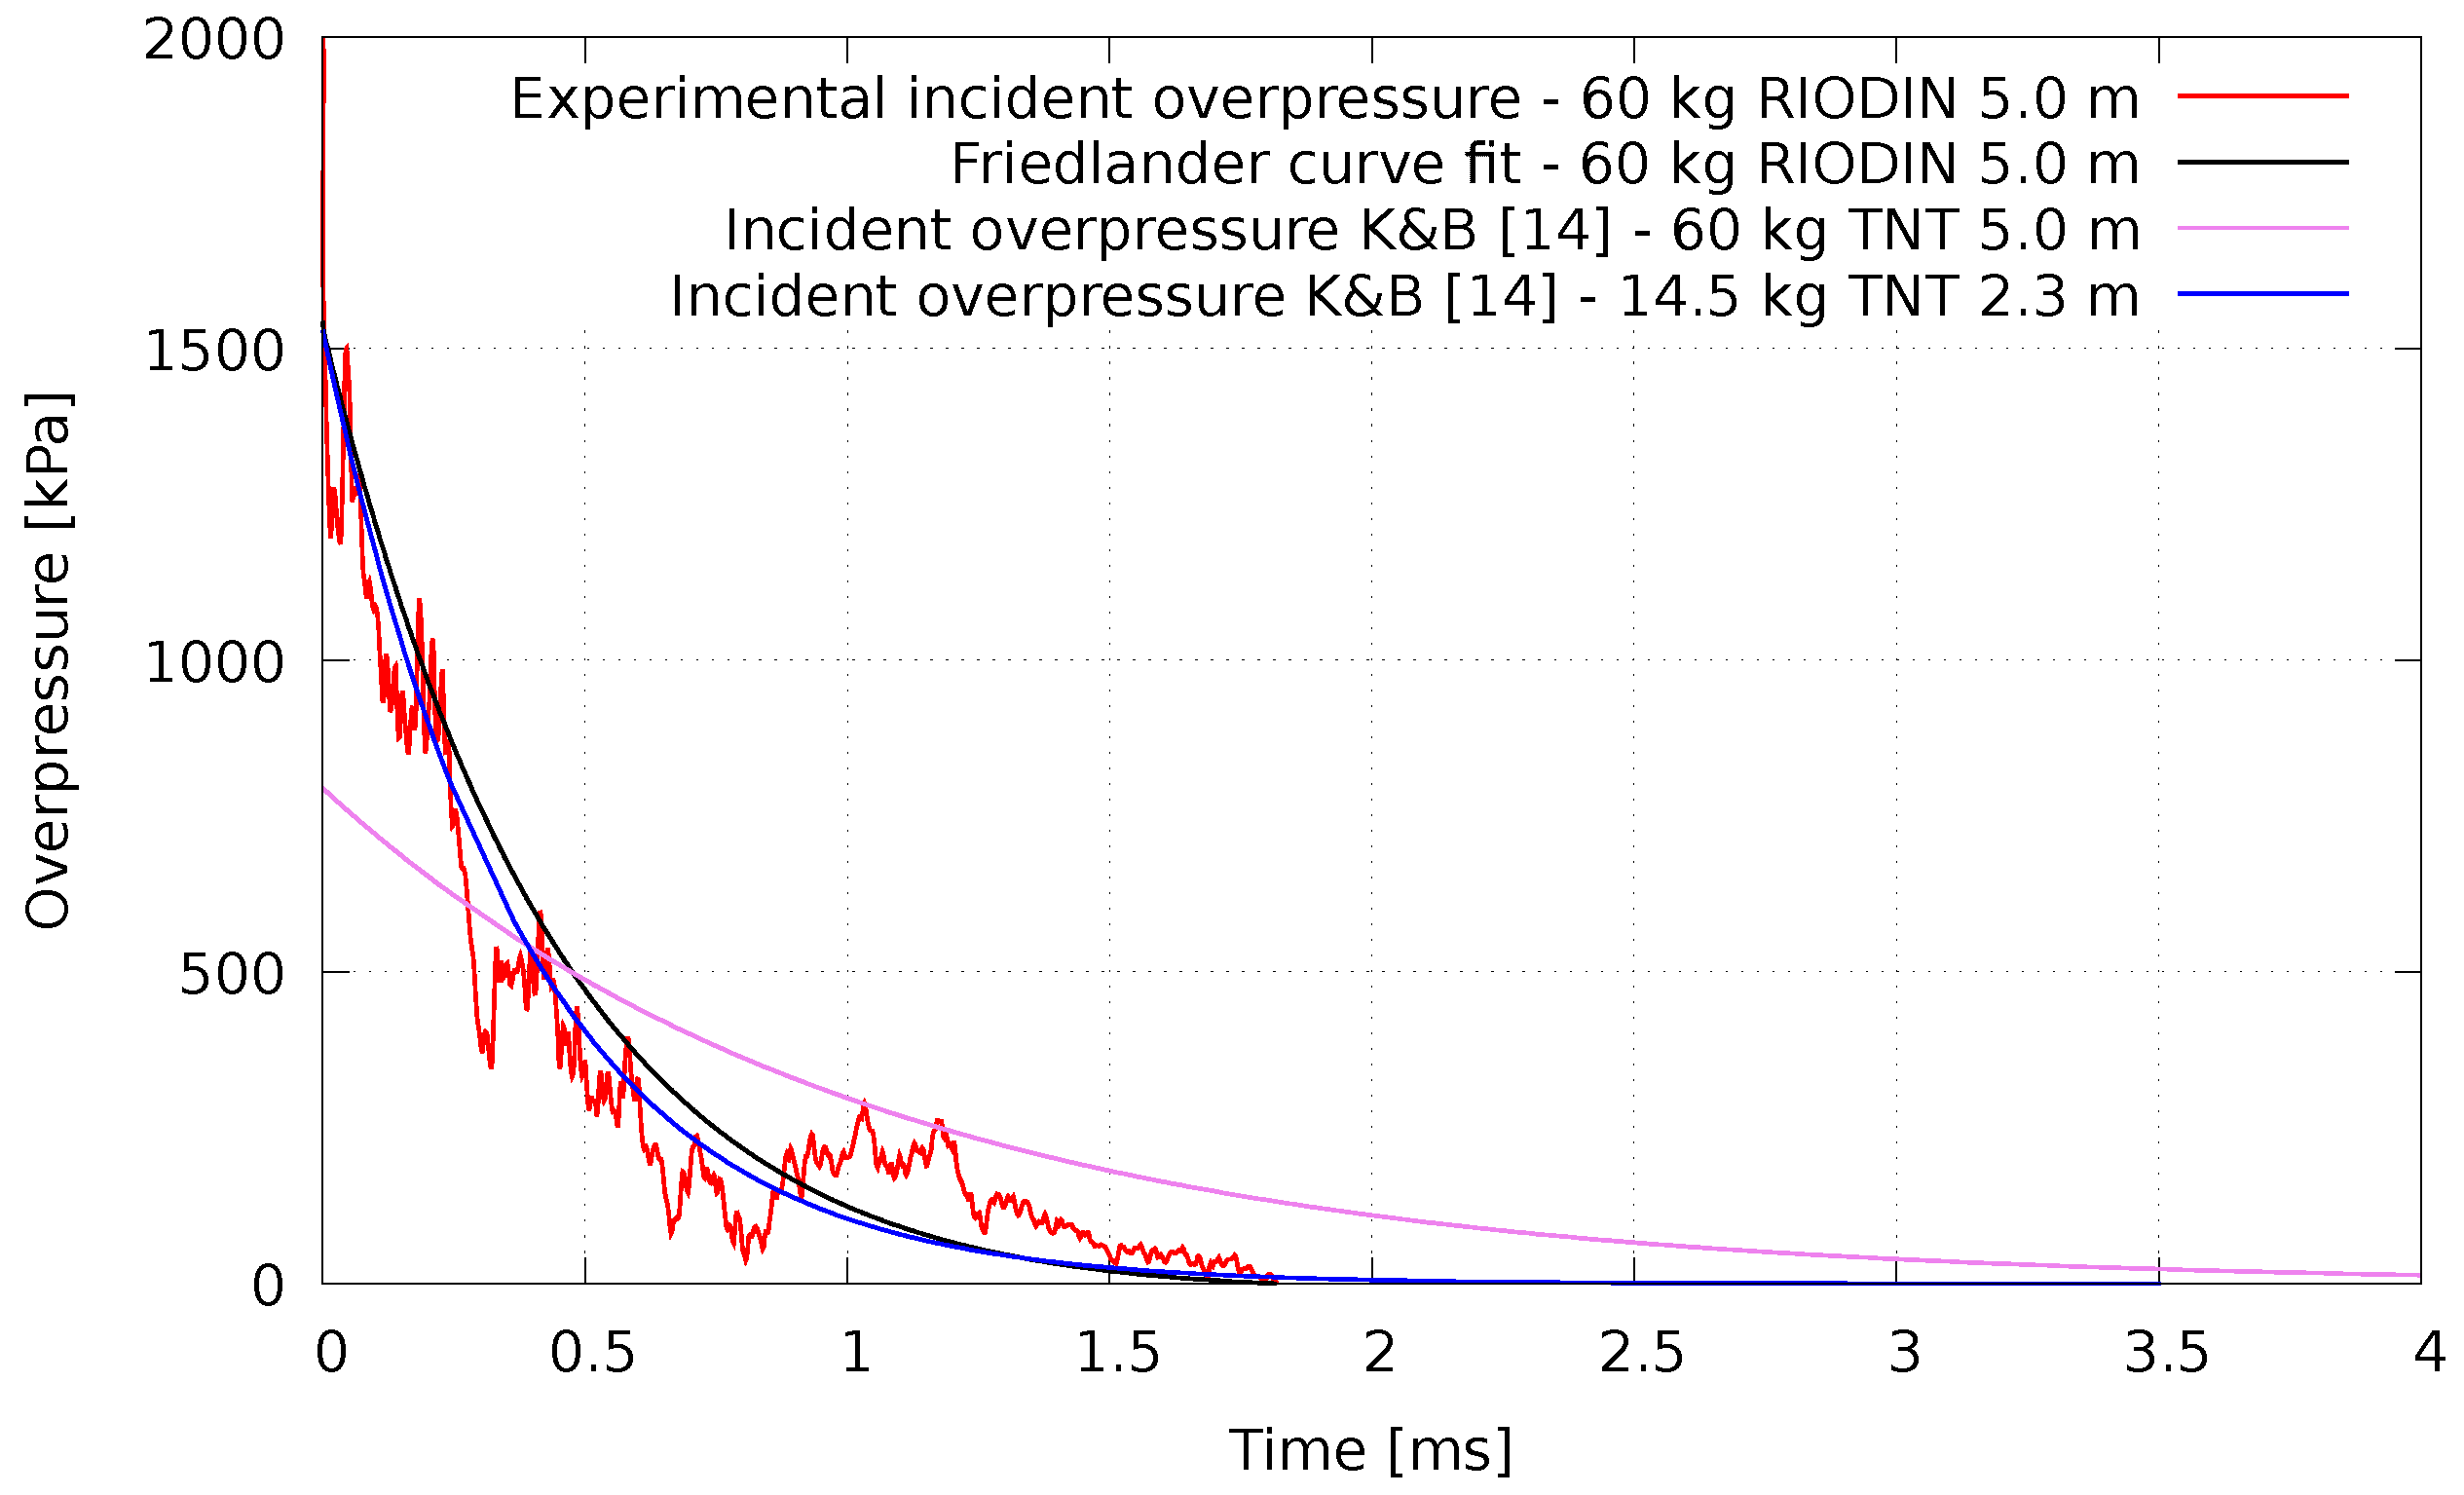
2.5.1. Blast Wave Overpressures

Some records produced invalid data due to either noise from spurious reflections or because some sensors and/or cables did not survive the test. Figure 8 plots an example of overpressures recorded at ground level (5 m distance from the charge) during the serial test #1 (60 kg RIODIN@5m), and Table 2 collects the relevant overpressure characteristics from both tests. The raw records were adjusted using the Friedlander curve fit for the positive phase.
Although specific reflected pressure gauges were not available, in serial test #2, an attempt was made to measure the reflected pressures using general purpose gauges, by placing two pressure sensors facing the blast and attached at midspan of the panels. However, during the test, one of the sensors was broken and the other recorded the pressure with significant noise due to spurious reflections. Therefore, these results were not considered valid.
As expected, the first observation is that the overpressures measured by the elevated sensor (2.5 m height) in test #1 (load at ground level) were lower than the ones recorded by the ground sensor due to the increased relative distance (5.59 m instead of 5 m) and impact angle (22 ).
The footages from the high-speed camera (recorded at a rate of 30,000 frames per second) presented in Figure 9 illustrate the propagation of the blast wave and clearly show the non-planar shape of the pressure wave starting to impinge the wall from the bottom to the top. This creates a differential (and decreasing) pressure profile along the height of the panels that influences the overall behavior of the system, being expected a higher response at the bottom connectors. Another finding is that for the same weight of TNT (60 kg) the Kingery and Bulmash predictions [14] are quite different from the experimental records. Peak overpressures are significantly higher than expected, but the duration of the positive phase is significantly lower.
Furthermore, as only the incident overpressure time history was recorded, the reflected pressures were estimated using an equivalent TNT blast load obtained by trial and error. For example, as illustrated in Figure 8, the amount of TNT exploding at ground level that produces an equivalent pressure profile to the 60 kg RIODIN explosive is 14.5 kg at 2.3 m standoff distance. This equivalent curve allows to identify the complete set of parameters that are used in the Kingery and Bulmash polynomial expressions adopted by UFC-3-340-02 [14] to characterize the reflected pressures.

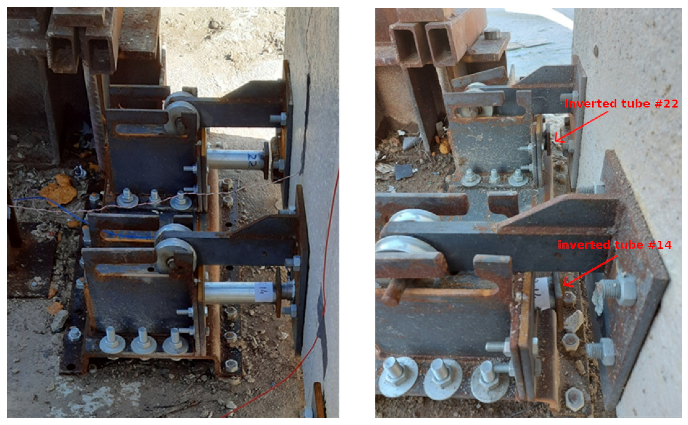
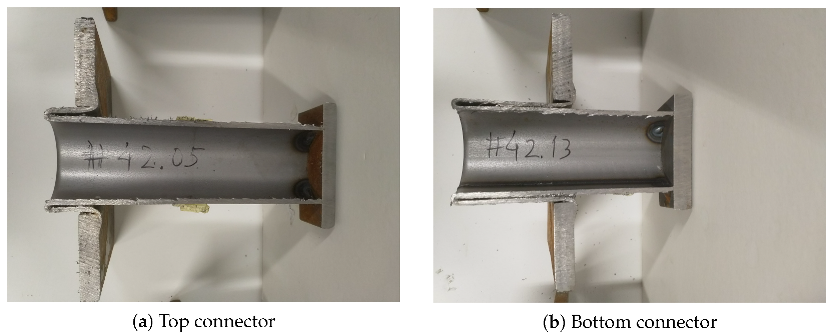
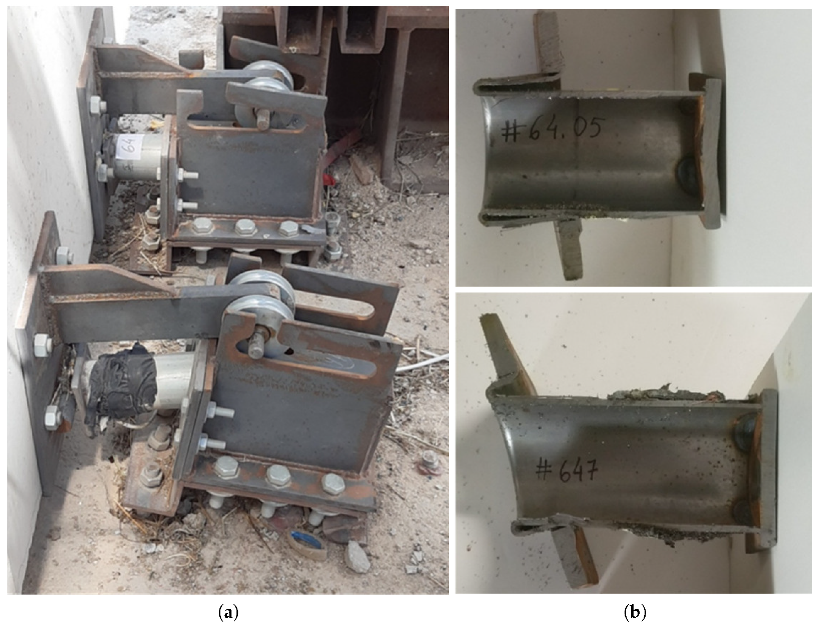
2.5.2. Shortening of the Inversion Tubes

Analyzing the inversion tubes after the blast event, one can see that bottom connectors exhibited larger deformation than expected and top connectors in some cases were not demanded enough to trigger the inversion process (especially during serial test #1 in the case of the ϕ 64 inverter). Table 3 collects the relevant data related to the shortening of the inverting tubes for all tests.
Figure 10 and Figure 11 illustrate, respectively, the state of one sample tube before and after the blast, and the differential inversion of the top and bottom tubes.
It was also noticed in test #1 that one of the supports was improperly anchored to the concrete slab. Upon the blast, the support was pulled off, distorting the position, and preventing inverter #647 (see Table 3) from working as planned, and simultaneously forcing the #64.05 specimen to withstand major forces. The imparted energy was absorbed by the bending mechanism of the anchor angles and/or by the pulling of the screws from the concrete base. Despite this occurrence, it should be highlighted that, although the tube core was forced to a rotation of 17 , the buckling of the tube walls did not occur (see Figure 12).
Nevertheless, one must mention that significant imperfection in the tube body or extreme eccentric loading will hinder the dissipative capacity of tube inversion-based EACs. This observation matches a numerical analysis of the eccentric impact on ϕ 64 × 2  mm inverting tubes reported in the literature [15] that reports a reduction in the dynamic inversion force of 16.9% in the case of impacts occurring at maximum eccentricity (32 mm) of the tube (see Figure 13). One notes that, even in this case, a complete inversion of the tube was verified.
Pires’ [15] findings are somehow more conservative than other experimental results reported in the literature concerning the dynamic testing of a crash barrier [16]. In this study, recorded results for the impact of a 1.4 tons moving mass equipped with inverted tubes at 16 km/h showed that for an eccentric impact of 20 , the performance was reduced by 10%.
This response to eccentric loading represents very promising performance in terms of effectiveness and reliability of the protective system. However, to avoid further errors, the ground anchors were improved by adding a set of rigid steel plates (see Figure 14).

2.5.3. Panel’s Midspan Displacements and Cracking

Plans were made to monitor the panels with accelerometers so as to record the acceleration history and calculate the associated velocities and displacements by successive integration of the recorded data. However, even the records of those accelerometers, whose cables survived the explosion, were totally unreasonable after being processed (double integration to obtain the displacement curve), presenting, in the best of cases, a displacement of order of 0.20 m for the reference panel (rigid supports), which is seven times higher than the actual displacement. According to the INTA/La Marañosa Testing Center, errors found in the recorded values could be, essentially, due to the additional noise/vibrations induced in the system by the detonation event. Due to this reason, all accelerometer data were discarded, and no displacement results are available for the panels from the first test.
For the following blast test #2, the maximum displacements at the midspan of the panels were measured using a mechanical system that consists in a metal rod sliding inside a tube filled with expandable polyurethane foam, allowing to obtain a relatively accurate assessment of the displacements. Maximum deflections measured in test #2 ( ϕ 42 mm) for all panels are collected in Table 4.
The values in Table 4 show that the introduction of EAC causes a remarkable reduction in the maximum deformations in the panel. Comparing with the deflection of the reference panel comprising rigid supports (29 mm), the reductions stand up to 70%.
All the panels exhibited very thin cracks, between 0.1 and 0.2 mm thick. In the case of the reference panel, the average crack spacing was approximately 100 mm. The remaining panels presented even thinner cracks with an average spacing between 200 and 250 mm.

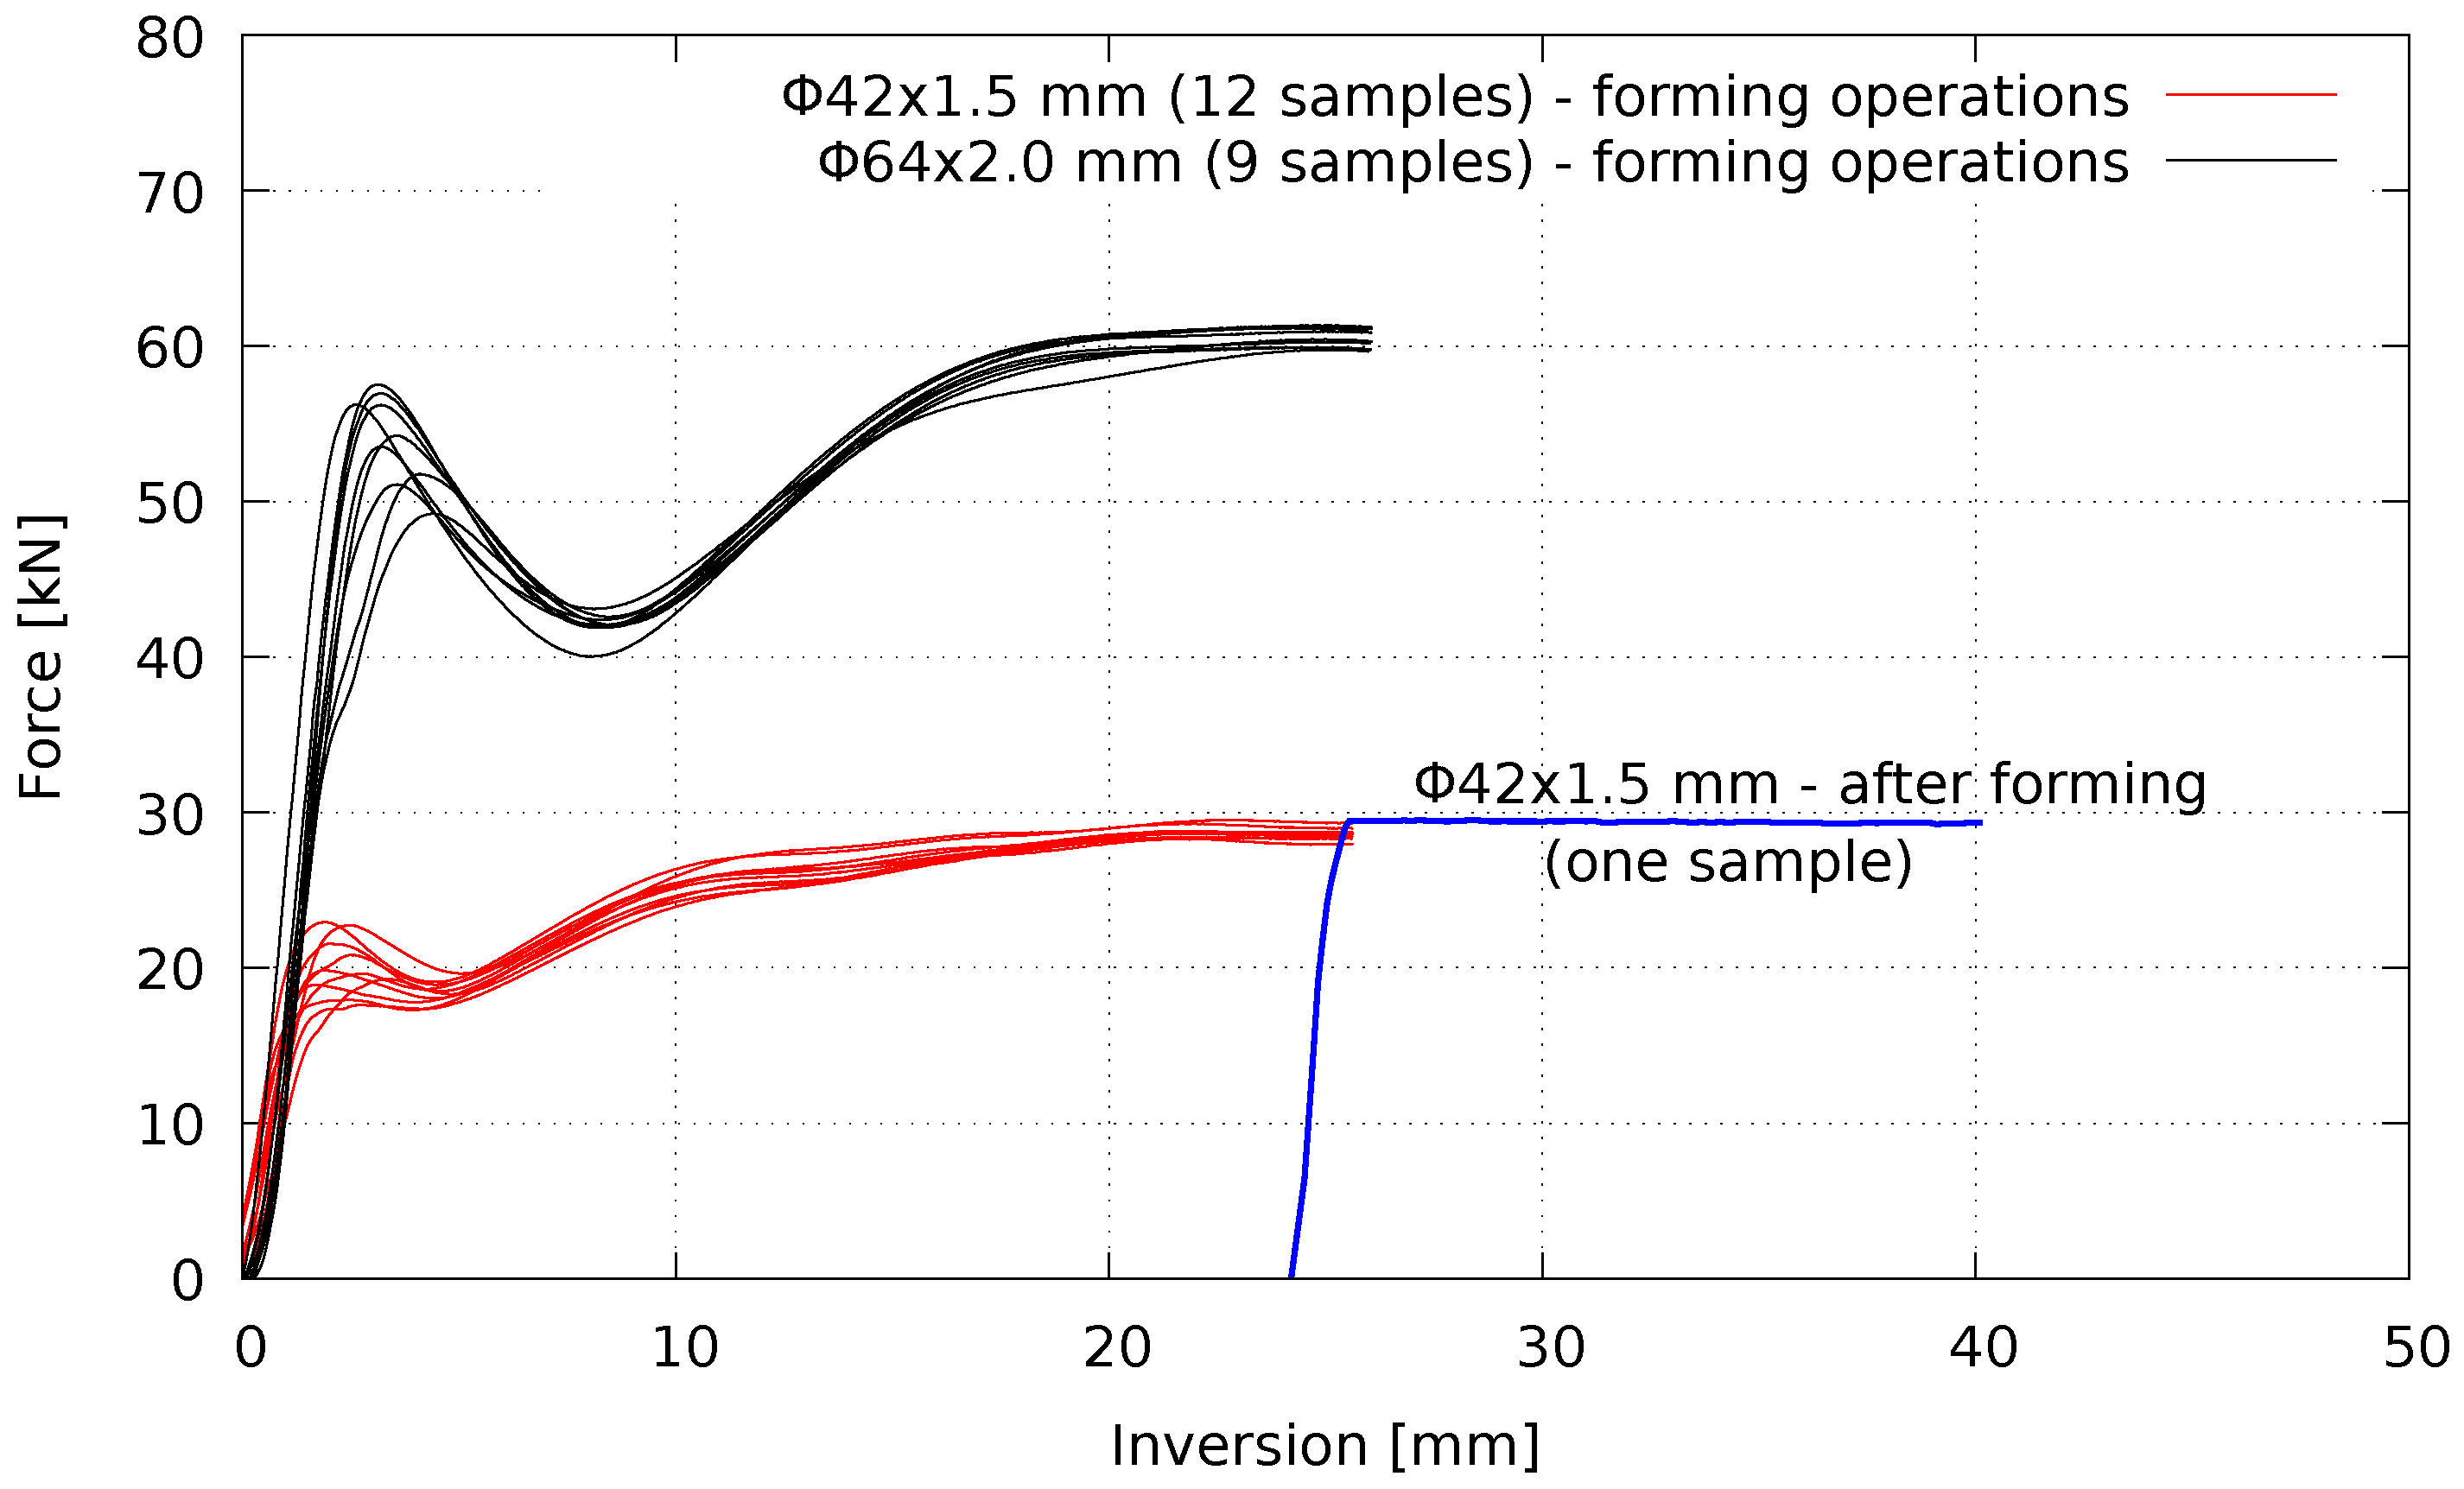
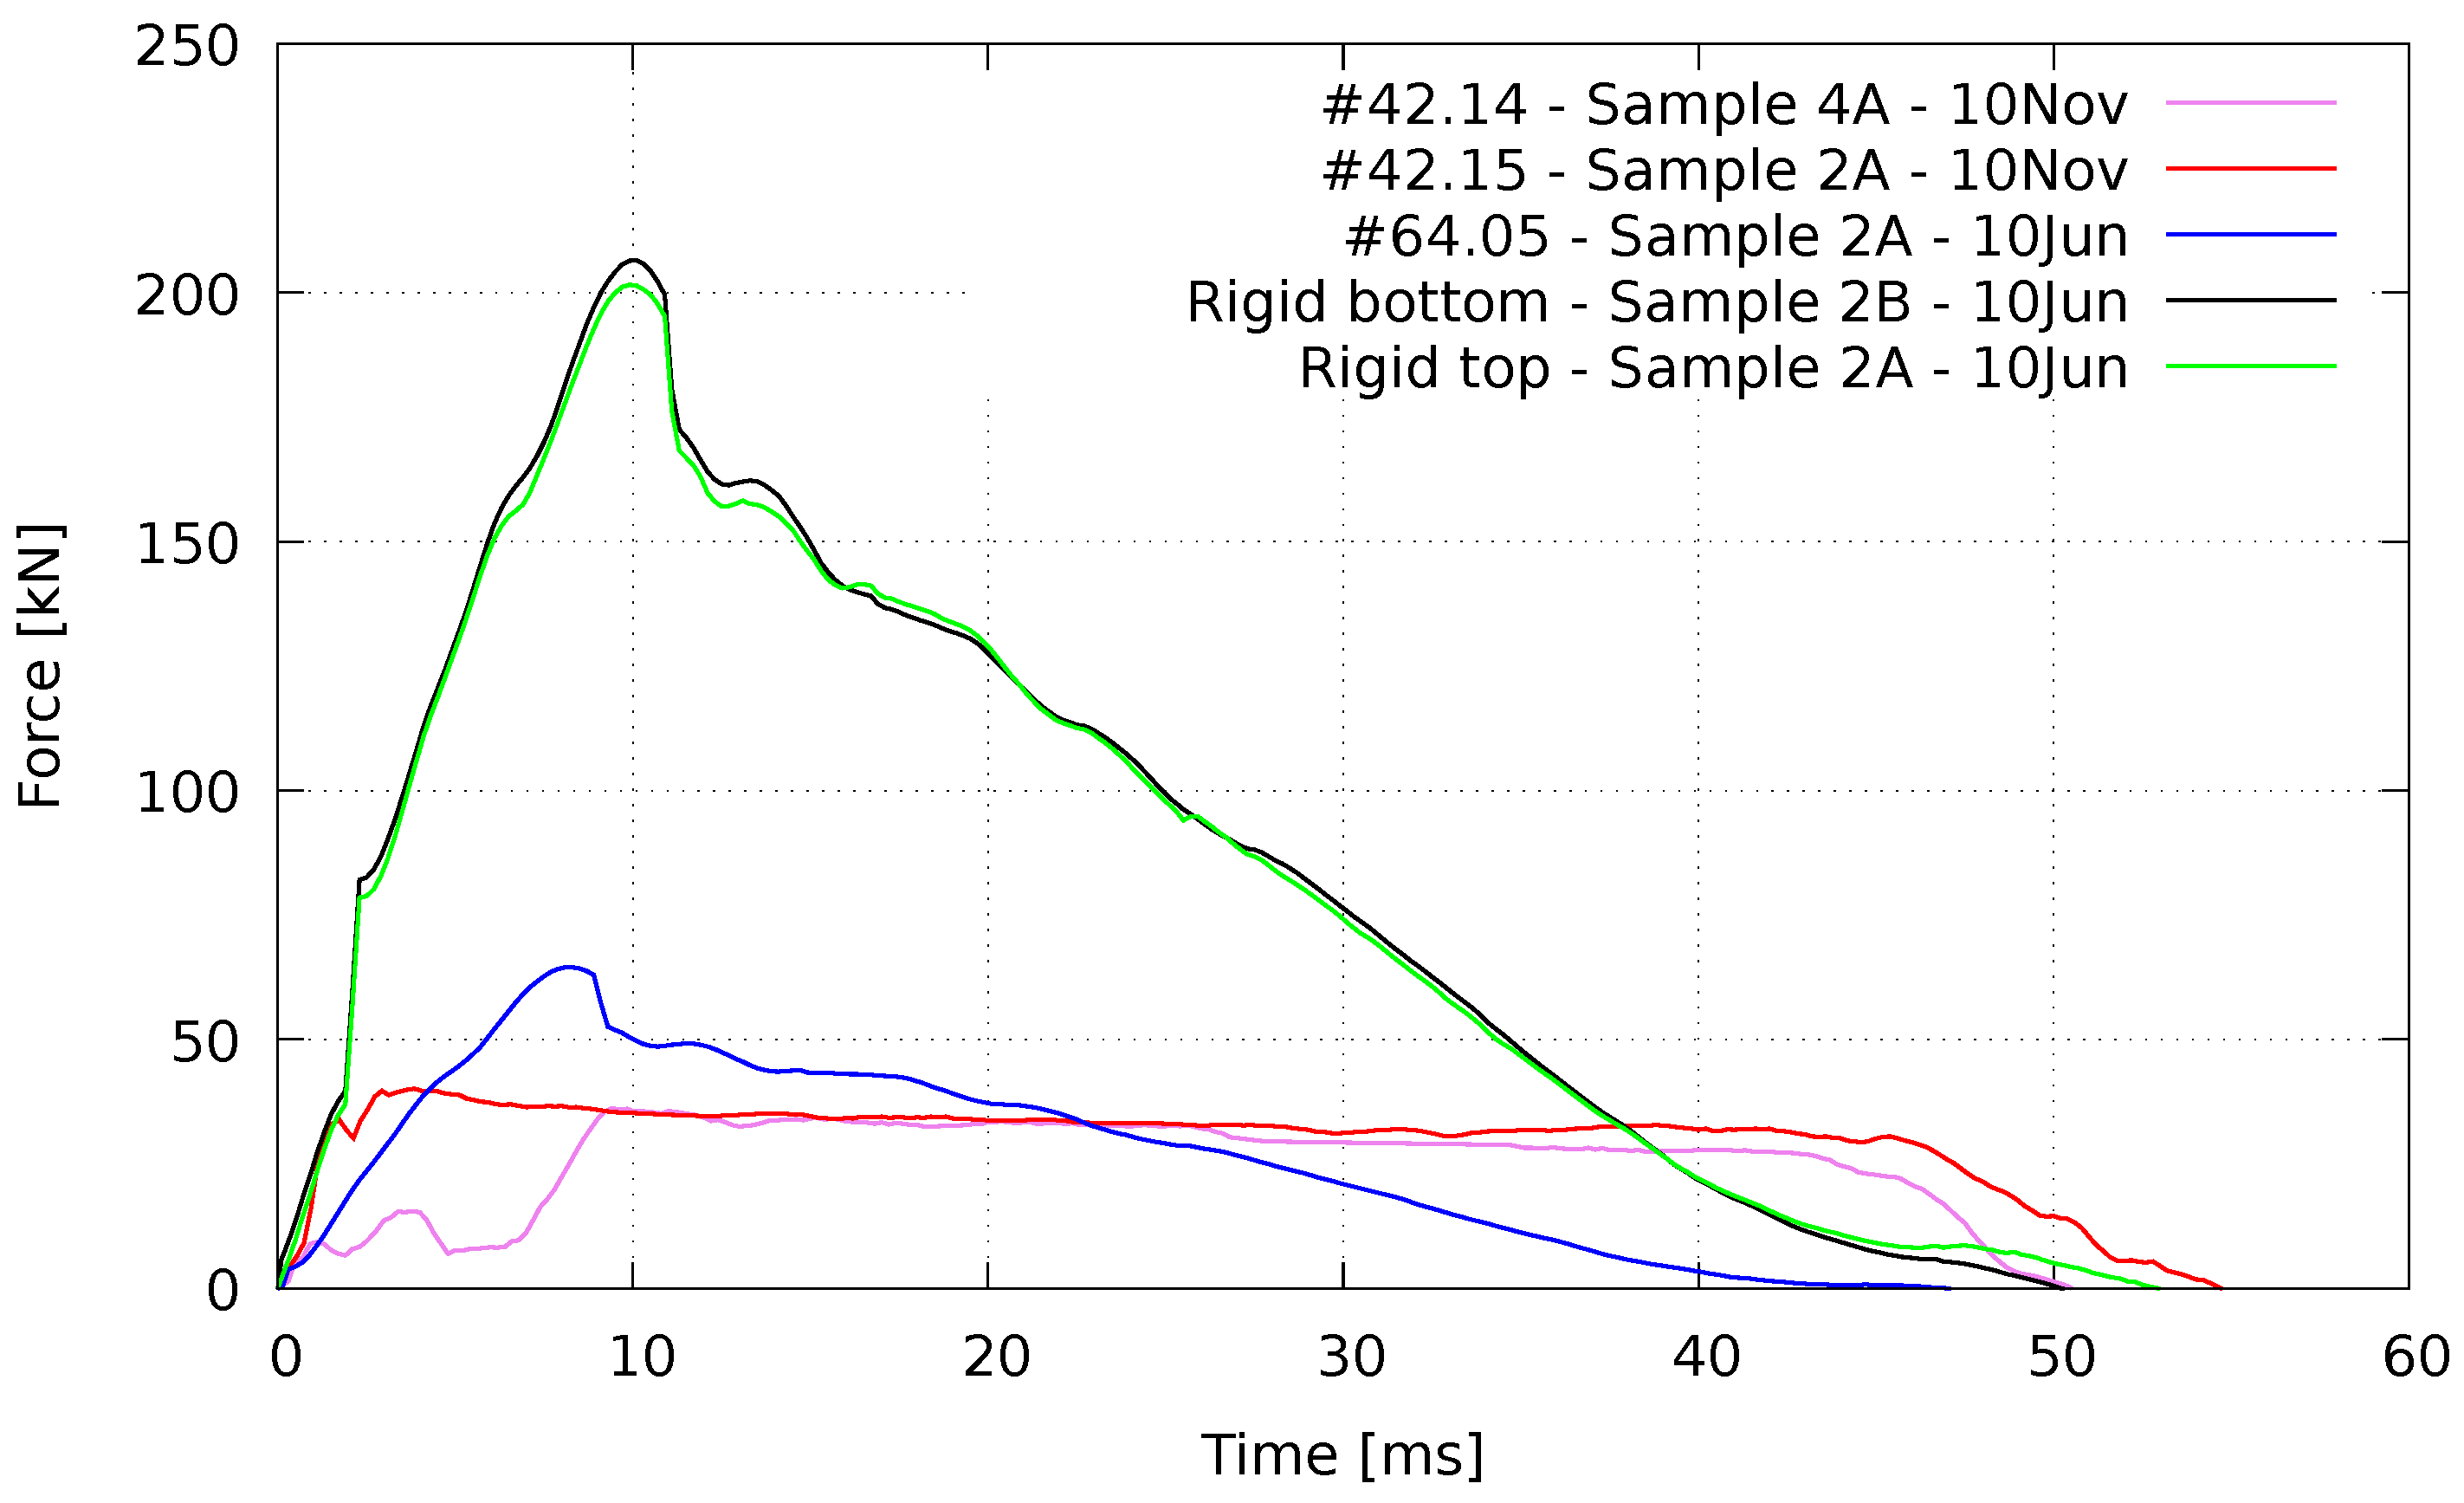
2.5.4. Transmitted Forces

As mentioned before, several force sensors were placed in strategic locations to monitor the forces transmitted to the supports. At least one measurement per EAC type was achieved. These records, plotted in Figure 15, clearly show a reduction in the forces transmitted to the protected structure due to the introduction of the energy absorbing devices.
To face the potential destructive effects of the overpressures over the sensors and cables, due to the load–distance relationships and physical limitations of the blast test facility, a strong redundancy was adopted. Indeed, the very high pressures caused the rupture or disengagement of some connecting cables during the test, and spurious rotations of several EAC invalidate some collected data (e.g., Wheatstone bridge type sensors manufactured at NOVA School of Science and Technology). Table 5 collects the main parameters of the curves plotted in Figure 15.

3. FE Simulation

The response of the energy absorbing system to blast waves was modeled in the FE software LS-DYNA [13]. The results of the experimental campaign were used to calibrate the FE model, which was then used to extrapolate the response of an idealized structure and to evaluate the performance of the protective system in what concerns the damage mitigation on the protected structure, under close and far range blast loading.

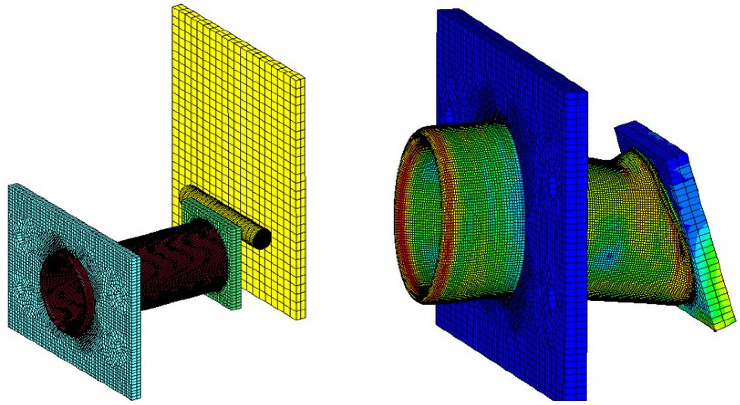
3.1. FE Numerical Model

The façade cladding panel is a RC element of 2.75 × 1.0 × 0.21  m. The panel is connected to the main structure through four EACs located at the corners, resulting in a free span of 2.45 m. Mesh sensitivity and material constitutive models were optimized and selected as described in [12]. The mesh size was selected based on a sensitivity analysis, performed for a blast load of 10 kg TNT at 5 m, and using parallelepiped elements as recommended in [17] for similar analysis. The difference in the simulated maximum displacements at the midspan between the two finest grids was less than 3%, which, according to [18], is a guarantee of good mesh refinement. Balancing the requested computational effort and the accuracy of the estimates, the numerical simulations were performed using 19,016 solid elements with a size of 25 × 25 × 50  mm (see Figure 16).
To ensure a reasonable computational time during the numerical simulations, the inverter tubes were simulated using 140 mm length discrete elements (MAT_SPRING_INELASTIC material model) comprising the experimental loading data recorded upon static tests, as collected in Table 1. The reinforced concrete panel was modeled with solid (concrete) and beam (reinforcing steel bars) elements, using, respectively, the MAT_CSCM_CONCRETE and PLASTIC_KINEMATIC material models. Proper boundary conditions guarantee that the FE model correctly simulates the physical constraints of the connector design (vertical and lateral movement restricted).

3.2. Strain Rates

The material models chosen for concrete, steel rebars and inverters, include strain-rate effects. For the case of the PLASTIC_KINEMATIC material model, the parameters of the Cowper–Symonds [19] constitutive relation should be assigned. In the context of the present study, the parameters proposed in [20] were adopted, as recommended in [12].

3.3. TNT Equivalent Curves

To capture the non-planar distribution of the blast wave generated pressures over the surface of the panel upon calculations, the TNT equivalent charge was determined, and the numerical analysis was performed using the load blast enhanced (LBE) option of the LS-DYNA FE software. When analyzing the structural response to impulsive loading [14], the maximum response depends mainly on the area under the pressure–time curve. In this case, it is possible to determine, by successive iterations, the equivalent TNT blast loading curves fitting the experimental curves. For the sake of simplicity, equivalent curves at ground level were considered (see Table 6 and examples in Figure 8) and used for further numerical simulations.

3.4. Validation of the FE Model

The numerical estimates are presented in Table 7. Based on the available data, the validation was performed for both FE models of the tested panels. Although the experimental data for the ϕ 64 × 2 mm inverter were recorded at the sample panel, which had one of the supports pulled off (see Figure 12), the force threshold is not expected to be affected, as it depends upon the impulse imparted to the system. Furthermore, analysis of the post blast condition of the inverted tube (sample #64.05 in Figure 12) shows that the element exhibited normal behavior, allowing to accept the recorded dynamic forces. The numerical model captures well the inversion demand of the complete system (see Table 7), although some differences in the top and bottom relative inversion lengths were observed. Deviations between the numerical and average experimental results range between 7% for the ϕ 42 × 1.5 mm and 6% for the ϕ 64 × 2 mm inverters. Regarding deflections of the panel comprising rigid connectors, the only experimental measurement available stands for 29 mm, which compares with a numerical prediction of 26 mm (blast test #2). The good agreement between the experimental data and the numerical simulated results allows to confirm the model as validated and suitable for extrapolation.

3.5. Prediction of the Blast Response of an Idealized RC Building Structure
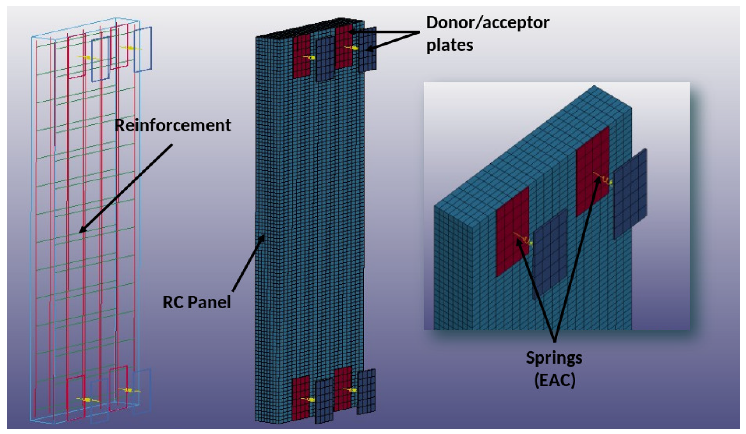
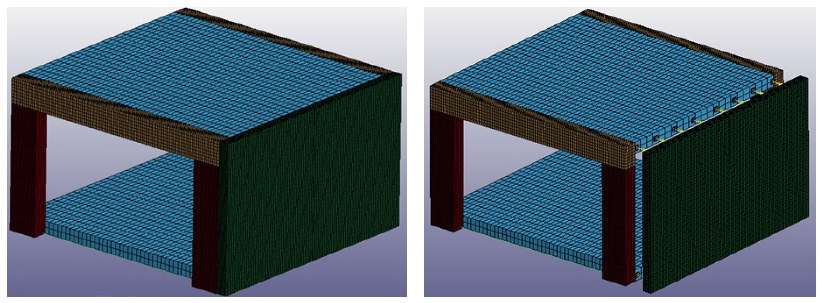
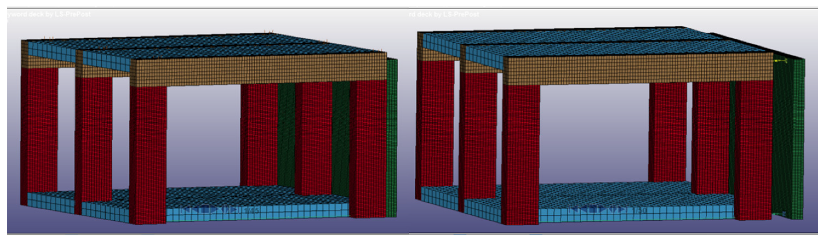
To assess the performance of the proposed system, an idealized RC building structure with and without EACs and three blast loading scenarios are defined: two scenarios producing approximately the same impulse but significantly different in terms of load duration, representing (i) a far-field (1600 kg TNT at 20 m) and (ii) a near-field (150 kg TNT at 5 m) scenario; the third case (iii) is a high demanding scenario that consists in the same charge load as in (ii), but with the half of standoff distance (150 kg TNT at 2.5 m).

3.5.1. FE Model

The idealized RC structure for the analysis of the first two scenarios is considered to be built using the same material properties as the ones used in the experimental campaign.
As shown in Figure 17, the structure envelope has 5.0 × 5.0 × 3.0 m and comprises four 0.30 × 0.60 m columns (main reinforcement 12 × ϕ 20 and two legs shear links ϕ 8 @ 0.25 ), two 0.30×0.50 m beams (main reinforcement 3 ϕ 16 on top and 3 ϕ 16 on bottom, and shear reinforcement ϕ 8 @ 0.20 ) and two 0.25 m thick slabs with a bottom reinforcement of ϕ 16 @ 0.20 in both orthogonal directions. Two independent 2.98 × 2.5 × 0.21 m façade panels were considered. Their free span in the vertical direction is 2.5 m or 2.75 m, depending if it was attached conventionally (rigid connections) or through EACs, respectively. Columns are fully clamped to the foundation. The bottom slab is laterally connected to the columns, and no additional restrictions are imposed. The conventional panel without EACs is in contact with the supporting structure (slabs and columns) on its contour. When EACs are introduced, the connections are made exclusively at the top and bottom slabs. In this case, a buffer zone is kept between the façade panels and supporting elements. The numerical simulations were conducted using eight ϕ 64 × 2.0 mm with EAC spacing of 0.60 m at floor levels. Dynamic load effects may activate the buckling of the tubes. To avoid it, the tube lengths should be kept below the onset buckling threshold L d [21], expressed in Equation (1) as a function of the axial wave propagation speed in the material, c 0 = E s / ρ , where E s is the Young modulus and ρ the specific mass of steel, the radius of gyration, i x = I x / A , where I x stands for the moment of inertia and A for the cross section area of the steel tube, and the initial velocity, v 0 :
L d = π i x c 0 v 0
Equation (1) shows that with the increase of the impact speed, the buckling length is reduced. Calculations made at a velocity of 9.9 m/s resulted in a bucking threshold of 394 mm for the ϕ 64 × 2 mm tubes. Therefore, in the numerical simulation, the lengths of the inverters were set to 350 mm.
The numerical analysis focuses essentially on the integrity of the supporting columns as critical elements for the stability of the overall structure. The FE mesh consists in solid elements of 25 × 50 × 25 mm for the columns and the façade panels, 50 × 50 × 60 mm for the girders, and 125 × 200 × 125 mm for the slabs, as the less demanded structural elements. The complete model comprises 174,116 solid elements, 476,354 nodes and 6 DOFs per node. The analyses were run for 120 to 140 ms, so as to allow to capture the maximum structural response. Each simulation, on an Intel Core i7 CPU 8th generation, 16 GB of RAM, took about 4 h and 30 min to complete.
The third scenario is meant to study one of the main issues that structures face under near-field blast loading, which is to avoid or reduce the outer sacrificial panel transmitting energy to the supporting elements by contact. An analysis on the performance of the system under extreme loading is performed, comparing the response of the structure with and without a protective system. For that purpose, a new bay of columns is inserted between the existing two, as illustrated in Figure 18. This model comprises 207,756 elements and 269,767 nodes and takes about 5 h and 20 min to complete the simulation for 120 ms. A blast load of 150 kg TNT equivalent at ground level is located at 2.5 m of the structure and aligned with the central column.

3.5.2. Analysis of the Results

The displacements and strain energies are collected in Table 8. Figure 19 and Figure 20 illustrate the expected damage (based on effective plastic strains). Interesting observations can be drawn from the numerical results.
(a)
For a similar impulse magnitude, the longer duration of the loading tends to significantly worsen the damage to the structure (i.e., energy absorbed), in both structural systems (i.e., panel with rigid connectors and panel with EACs). From scenarios (i) to (ii), the maximum lateral displacement of the structure measured at the girder reduces 27% (rigid connection) and 31% ( 8 × ϕ 64 × 2.0 );
(b)
Introduction of 8 × ϕ 64 × 2 EACs reduces the structure maximum displacement in 46% (scenario (i)) or 49% (scenario (ii));
(c)
In scenario (i) the introduction of EACs causes a reduction of 67% ( ϕ 64 × 2 ) of the energy absorbed by the building structure. The plots in Figure 19 illustrate the observations. On the other hand, the total internal energy of the overall system increases significantly (between 2.08 and 1.45 times), which means that the energy was mostly absorbed by the protective system (EACs and façade panel). In scenario (ii), reduction of the energy absorbed is 72% ( ϕ 64 × 2 );
(d)
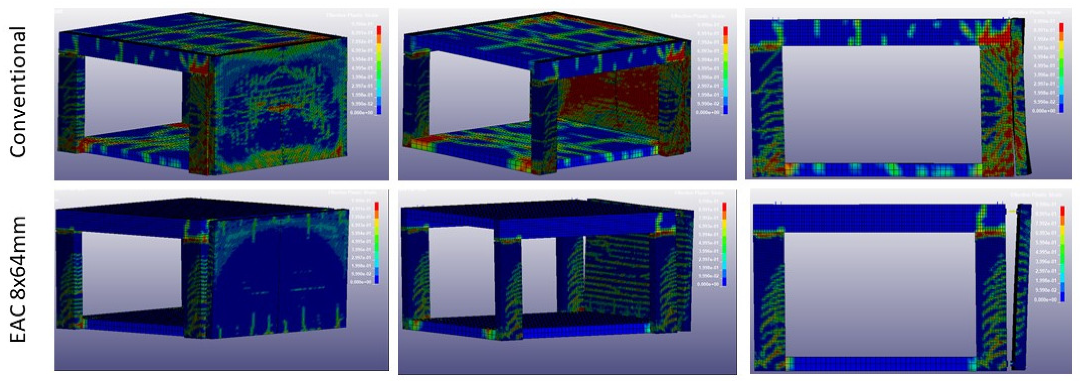
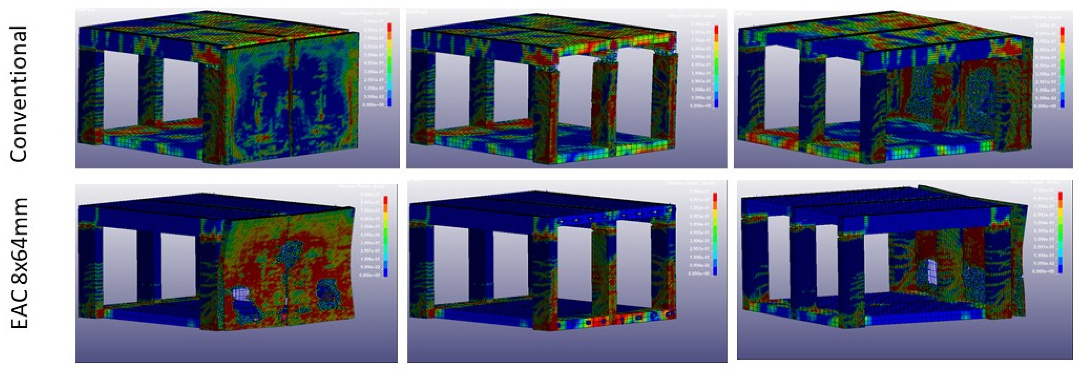
The introduction of EACs also allows a significant reduction of the sacrificial façade panel damage and deflections, as observed in scenarios (i) and (ii). This fact is relevant, especially in very stiff structures where the deflections will concentrate in the façade elements.
(e)
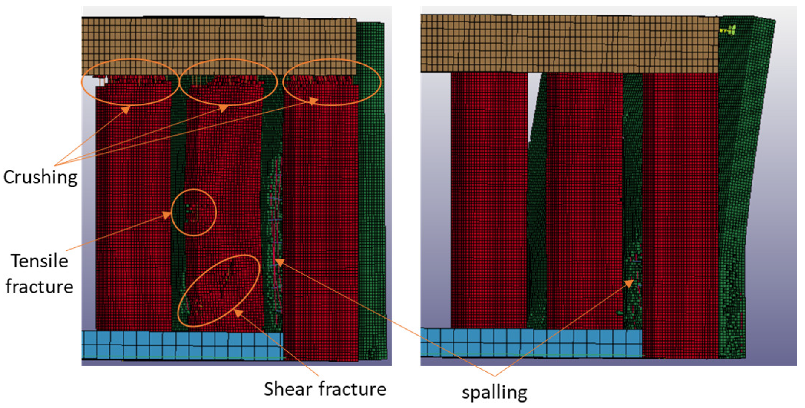
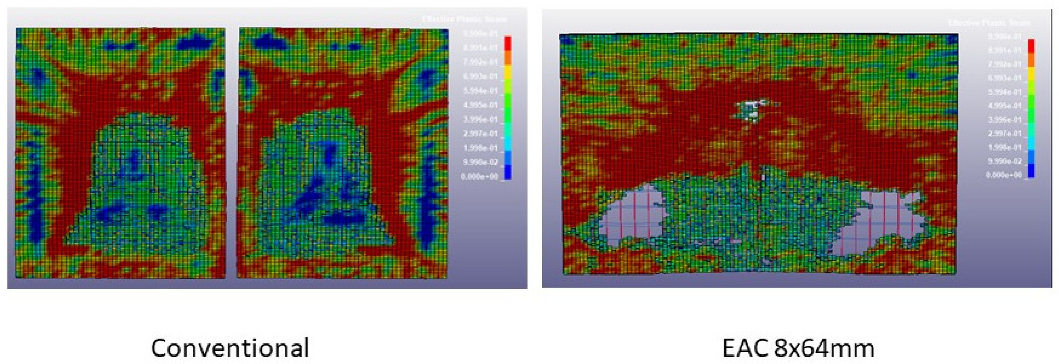
Introduction of EACs reduces the damage in the supporting columns. This can be observed qualitatively by the amount and pattern of cracking lines and fully plasticized regions in the columns (see Figure 20).
(f)
In the conventional structure, the shear failure occurs by concrete crushing at the connection between the columns and the beams. This phenomenon is strongly reduced with the introduction of EACs. The lower the inversion force (i.e., the lateral force transmitted to the structure), the higher the reduction in energy absorbed by the structure.
The third blast scenario (150 kg TNT at 2.5 m) allows, as well, interesting insights. As illustrated in Figure 20, in the case of the conventional structure, heavy damages are visible with a shear failure caused by concrete crushing in the central column facing the explosion, which means that it has totally lost its load-carrying capacity. Deflection of 58 mm was measured at the central column at 1.28 m high. Concrete crushing occurs as well at the beams facing the explosion (Figure 21 and Figure 22). For a building structure with several floors, the risk of progressive collapse due to the loss of a supporting element would increase significantly. The introduction of the EACs reduces the energy absorbed by the protected structure up to 68% as in case of ϕ 64 × 2 EACs (see Table 8).
Apparently, the most significant drawback of the EACs is the increase in the spalling effects at the back face of the façade panel (opposite to explosion). Although occurring in all cases, the boundary conditions play an important role. When the façade panel is supported on all edges, scabbing and spalling effects are less extensive than when the façade panel is supported in discrete points on only two edges (see Figure 22). The issue is that spalling might hit inhabitants of the infrastructure, producing serious injuries. A solution for this problem is out of the scope of this research, but could be easily achieved in all cases by introducing a thin metal layer [4] on the internal face of the panel or, eventually, an elastomeric material [6].

4. Conclusions

An energy absorbing system based on external inversion mechanism of metal tubes is validated experimentally at full-scale blast testing. Blast tests allow to understand the interaction between the inverter tubes and the sacrificial panel, namely its effect of reducing the deflection of the panel as the inversion force of the connectors reduces. The tests also show a reduction in the lateral force in the structure to be protected. The system proves to be very resilient, in the sense that the eccentricity of the load does not greatly affect the global performance.
A validated numerical model is then used to study more demanding scenarios and protective performance of an idealized reinforced concrete building structure. Major findings are achieved:
(i)
Introduction of EACs strongly limits forces imparted to the protected structure, reducing drastically the energy absorbed;
(ii)
The comparison of the energies absorbed with and without a protective system demonstrates that the reductions can reach 72% in near-field explosions (when using 8 × ϕ 64 × 2 connectors);
(iii)
In the case of far-field explosions, this reduction can reach 67%;
(iv)
In the explosions at the very near field, the reduction in energy absorbed was of the order of 68%, avoiding the loss or collapse of one main supporting element of the structure.
These results demonstrate that the system is very suitable for implementation in the protection of infrastructures that need to be used for important or critical activities when the space to guarantee proper standoff distance does not exist.

Author Contributions

Methodology, V.J.d.G.L.; Software, G.d.J.G. and C.C.; Validation, V.J.d.G.L. and C.C.; Investigation, G.d.J.G.; Resources, J.L.M.; Data curation, C.C.; Writing—original draft, G.d.J.G.; Writing—review & editing, V.J.d.G.L. and C.C.; Project administration, V.J.d.G.L. and J.L.M.; Funding acquisition, J.L.M. All authors have read and agreed to the published version of the manuscript.

Funding

This research has been funded by NATO Counter Improvised Explosive Device Centre of Excellence under the project Blast Protective Walls Design Optimization (BLADE) and also supported by contract PTDC/ECI-EST/31046/2017 with the Portuguese funding institution FCT - Fundação para a Ciência e Tecnologia.

Data Availability Statement

The data presented in this study are available on request from the corresponding author.

Conflicts of Interest

The authors declare that they have no known competing financial interest or personal relationships that could have appeared to influence the work reported in this paper.

References

  1. Barnett, S.; Millard, S.; Schleyer, G.; Soutsos, M.; Tyas, A. Explosion and Impact Resistance of Ultra High Performance Fibre Reinforced Concrete. Concrete 2007, 2, 32–33. [Google Scholar]
  2. Xu, J.; Wu, C.; Xiang, H.; Su, Y.; Li, Z.X.; Fang, Q.; Hao, H.; Liu, Z.; Zhang, Y.; Li, J. Behaviour of ultra high performance fibre reinforced concrete columns subjected to blast loading. Eng. Struct. 2016, 118, 97–107. [Google Scholar] [CrossRef]
  3. Bazan, M.; Oswald, C.J. Blast Design of Reinforced Concrete and Masonry Components Retrofitted with FRP; Protection Engineering Consultants LLC: San Antonio, TX, USA, 2010. [Google Scholar]
  4. ASCE. Design of Blast-Resistant Buildings in Petrochemical Facilities, 2nd ed.; American Society of Civil Engineers: Reston, VA, USA, 2010. [Google Scholar]
  5. Naito, C.; Dinan, R.; Bewick, B. Use of Precast Concrete Walls for Blast Protection of Steel Stud Construction. J. Perform. Constr. Facil. 2011, 25, 454–463. [Google Scholar] [CrossRef] [Green Version]
  6. Johnson, C.F. Concrete Masonry Wall Retrofit Systems for Blast Protection. Ph.D. Thesis, Texas A&M University, Corpus Christi, TX, USA, 2013. [Google Scholar]
  7. Nesterenko, V.F. Shock (Blast) Mitigation by “Soft” Condensed Matter. MRS Online Proc. Libr. 2003, 759, 43. [Google Scholar] [CrossRef] [Green Version]
  8. Alberdi, R.; Przywara, J.; Khandelwal, K. Performance evaluation of sandwich panel systems for blast mitigation. Eng. Struct. 2013, 56, 2119–2130. [Google Scholar] [CrossRef]
  9. Thompson, S.C.; Muchnick, H.; Choi, H.J.; McDowell, D.L.; Allen, J.K.; Mistree, F. Robust Materials Design of Blast Resistant Panels. In Proceedings of the 11th AIAA/ISSMO Multidisciplinary Analysis and Optimization Conference, Portsmouth, VA, USA, 6–8 September 2006. [Google Scholar]
  10. Zhu, F.; Zhao, L.; Lu, G.; Wang, Z. Deformation and failure of blast-loaded metallic sandwich panels—Experimental investigations. Int. J. Impact Eng. 2008, 35, 937–951. [Google Scholar] [CrossRef]
  11. Rebelo, H.; Lecompte, D.; Cismasiu, C.; Jonet, A.; Belkassem, B.; Maazoun, A. Experimental and numerical investigation on 3D printed PLA sacrificial honeycomb cladding. Int. J. Impact Eng. 2019, 131, 162–173. [Google Scholar] [CrossRef]
  12. Gomes, G.; Lúcio, V.J.G.; Cismasiu, C. Development of a high-performance blast energy-absorbing system for building structures. Int. J. Prot. Struct. 2022. submitted. [Google Scholar]
  13. Livermore Software Technology Corporation. LS-DYNA User Manual: Volume I (Version R10.1); Livermore Software Technology Corporation: Livermore, CA, USA, 2018. [Google Scholar]
  14. U.S. Department of Defense. UFC 3-340-02: Structures to Resist the Effects of Accidental Explosions; U.S. Department of Defense: Washington, DC, USA, 2014.
  15. Pires, L. Numerical Analysis of an Innovatiotive Blast Protective System for Buildings. Master’s Thesis, Instituto Superior Técnico, Lisbon University, Lisbon, Portugal, 2021. [Google Scholar]
  16. Cha, J.G.; Bae, C.H.; Han, B.K. Experimental Study of the Possibility of Using of External Inversion Crash Box on Sloped Crash Barrier. In Proceedings of the 23rd International Technical Conference on the Enhanced Safety of Vehicles (ESV), Seoul, Republic of Korea, 27–30 May 2013; pp. 69–79. [Google Scholar]
  17. Alañón, A.; Cerro-Prada, E.; Vázquez-Gallo, M.J.; Santos, A.P. Mesh size effect on finite-element modeling of blast-loaded reinforced concrete slab. Eng. Comput. 2018, 34, 649–658. [Google Scholar] [CrossRef]
  18. Schwer, L.E. Is Your Mesh Refined Enough? Estimating Discretization Error using GCI. In Proceedings of the LS-DYNA Anwenderforum, Bamberg, Germany, 30 September–1 October 2008. [Google Scholar]
  19. Symonds, P.; Jones, N. Impulsive loading of fully clamped beams with finite plastic deflections and strain-rate sensitivity. Int. J. Mech. Sci. 1972, 14, 49–69. [Google Scholar] [CrossRef]
  20. Marais, S.T.; Tait, R.B.; Cloete, T.J.; Nurick, G.N. Material testing at high strain rate using the split Hopkinson pressure bar. Lat. Am. J. Solids Struct. 2004, 1, 319–339. [Google Scholar]
  21. Szuladzinski, G. Formulas for Mechanical and Structural Shock and Impact, 1st ed.; CRC Press: Boca Raton, FL, USA, 2010. [Google Scholar]
Figure 1. Energy absorbing connector.
Buildings 13 00601 g001
Figure 2. Blast testing infrastructure (setups 1 and 3 are not included in the current research).
Buildings 13 00601 g002
Figure 3. Blast test setup scheme.
Buildings 13 00601 g003
Figure 4. Views of the setup: two samples-rigid supports and EACs.
Buildings 13 00601 g004
Figure 5. Detailed views of connectors on the blast testing site.
Buildings 13 00601 g005
Figure 6. Force-shortening curves of the core element.
Buildings 13 00601 g006
Figure 7. Sensors placement.
Buildings 13 00601 g007
Figure 8. Plots of incident pressures for 60 kg of RIODIN at 5 m (test #1 ground sensor).
Buildings 13 00601 g008
Figure 9. Footage of the blast wave of 60 kg RIODIN Dynamite at 5 m (test #3).
Buildings 13 00601 g009
Figure 10. Sample panel 4A— ϕ 42 × 1.5 mm tubes: before blast (left) and after blast test (right).
Buildings 13 00601 g010
Figure 11. Sample panel 4B—Longitudinal section: final state of the inversion of ϕ 42 × 1.5 mm tubes.
Buildings 13 00601 g011
Figure 12. Sample panel 2B.(a) General view of anchor deformation after blast for connectors #64.05 and #647. (b) Longitudinal section: final state of the inversion of ϕ 64 × 2.0 mm tubes.
Buildings 13 00601 g012
Figure 13. Eccentric loading of the EAC at the edge ( e = 32 mm). Adapted with permission from [15], IST, 2021.
Buildings 13 00601 g013
Figure 14. Rigid anchors for bottom connectors.
Buildings 13 00601 g014
Figure 15. Dynamic reactions during the blast events.
Buildings 13 00601 g015
Figure 16. FE numerical model of the energy absorbing system.
Buildings 13 00601 g016
Figure 17. Idealized building structure: façade panel in contact with the protected structure (left); façade panel equipped with EACs (right).
Buildings 13 00601 g017
Figure 18. Building structure with central column used to simulate an almost contact explosive charge.
Buildings 13 00601 g018
Figure 19. Effective plastic strain scenario (i): 150 kg TNT at 5 m standoff.
Buildings 13 00601 g019
Figure 20. Post-blast effective plastic strain scenario (iii): 150 kg TNT at 2.5 m standoff.
Buildings 13 00601 g020
Figure 21. Post-blast concrete crushing at the supports scenario (iii): rigid supports (left) and 8 × ϕ 64 mm EACs (right).
Buildings 13 00601 g021
Figure 22. Post-blast spalling on the internal side of the façade panel.
Buildings 13 00601 g022
Table 1. Mechanical characteristics, steady force and stroke of the steel tubes.
Nominal Diameter and Thickness E s f y f u P s δ
mmGPaMPaMPakNmm
ϕ 42 × 1.5 210.437940128.65140
ϕ 64 × 2.0 210.637142360.45140
Table 2. Overpressures measured during the blast tests and adjusted decay parameter.
TestSensorDateIncident PressurePositive PhaseIncident ImpulseDecay Parameter
SerialHeight2021 P S 0 t 0 i s β
-m-kPamskPa·ms-
#10.010 Jun1543.01.9576.183.18
#12.510 Jun765.71.6410.051.34
#20.010 Nov1133.91.7658.51.24
Table 3. Experimental shortening lengths and rotations.
BlastSamplePositionConnectorShorteningRotationTotal Shortening
TestPanel mm mm
#1#2ABL
BR
TL
TR
#64.05
#647
#64.06
#648
63.8
6.0
5.0
0.0
6.0
17.0
3.0
0.0
75
#1#4BBL
BR
TL
TR
#64.09
#646
#64.11
#64.10
42.0
40.0
2.0
0.0
3.0
3.0
3.0
3.0
84
#1#4ABL
BR
TL
TR
#64.04
#645
#64.08
#64.07
39.0
45.0
4.0
2.0
2.0
3.5
3.0
2.0
90
#2#2ABL
BR
TL
TR
#42.23
#42.15
#42.07
#42.21
74.5
86.9
21.8
26.7
0.0
0.0
4.5
1.5
209.9
#2#4BBL
BR
TL
TR
#42.13
#42.18
#42.10
#42.05
82.9
72.2
16.4
19.7
3.0
1.5
1.0
0.0
191.2
#2#4ABL
BR
TL
TR
#42.22
#42.14
#42.08
#42.09
107.9
102.4
36.1
28.3
0.0
0.0
0.0
0.0
274.7
BL—bottom left; BR—bottom right; TL—top left; TR—top right.
Table 4. Maximum deflections of the panels for serial test #2.
Average DisplacementPanel Deflection
Sample PanelBottomTopMidspan
mmmmmm
#2B *
#2A
#4B
#4A
0.0
80.7
77.5
105.2
0.0
24.3
18.1
32.2
29.0
14.8
13.3
9.5
* Reference panel comprising rigid supports.
Table 5. Parameters of the experimental force–time curves.
EACPanelPositionPeak Force/PlateauDuration
Id kNms
Rigid2BBL206.651
Rigid2BTR201.753
#64.052ABL64.642
#42.152ABL33.555
#42.144ABL31.952
BL—bottom left; TR—top right.
Table 6. Experimental load versus TNT hemispherical equivalent load parameters.
Experimental LoadEquivalent TNT Load
SampleLoad P SO i S Load P SO i S P r i r t 0 β
kg@mkPakPa·mskg@mkPakPa·mskPakPa·msms-
ϕ 6460@5154357614.5 @ 2.3 1529573947823353.513.17
ϕ 4260@5113365821.0 @ 3.0 1132629646121825.615.54
PSO—incident (side-on) overpressure; is—incident specific impulse; P′SO—equivalent incident overpressure; i′s—equivalent incident specific impulse; P′r—equivalent reflected overpressure; i′r—equivalent reflected specificimpulse; t0—positive phase duration; β—decay parameter of the overpressure curve.
Table 7. Validation of the FE models.
Equivalent t m Panel Midspan DeflectionEAC DeformationTotal EAC Deformation
SampleLoad Rigid ConnectorsEACTopBottomNumericalExperimental
kg@mmsmmmmmmmmmmmm
ϕ 6414.3@2.52017812277883
ϕ 4221.0@3.0452644265214200 *
tm—duration of the loading phase. *—excluding the abnormal reading of sample #4A in blast test #2 (see Table 3).
Table 8. Displacements and energies for several blast scenarios: (i) 1600 kg at 20 m; (ii) 150 kg at 5 m; (iii) 150 kg at 2.5 m.
Max. DisplacementMax. InversionInternal Energy
Case—ScenarioTop GirderPanel MidspanTopBottomStructurePanelInverter
mmmmmmmmkJkJkJ
Rigid attachment—(i)89135NANA48.1103.2NA
8 × EAC ϕ 64 × 2.0 —(i)485929530015.817.3282.0
Rigid attachment—(ii)65139NANA36.3111.0NA
8 × EAC ϕ 64 × 2.0 —(ii)335716529310.39.7200.0
Rigid attachment—(iii)64195NANA120.0199.8NA
8 × EAC ϕ 64 × 2.0 —(iii)5923215233038.6241.0175.3
Disclaimer/Publisher’s Note: The statements, opinions and data contained in all publications are solely those of the individual author(s) and contributor(s) and not of MDPI and/or the editor(s). MDPI and/or the editor(s) disclaim responsibility for any injury to people or property resulting from any ideas, methods, instructions or products referred to in the content.

