Article

Study of the Axial Compressive Behaviour of Cross-Shaped CFST and ST Columns with Inner Changes

1
Civil Engineering and Architecture Faculty, Kunming University of Science and Technology, Kunming 650500, China
2
Yunnan Earthquake Engineering Research Institute, Kunming 650000, China
*
Authors to whom correspondence should be addressed.
Buildings 2023, 13(2), 423; https://doi.org/10.3390/buildings13020423
Submission received: 24 November 2022 / Revised: 20 January 2023 / Accepted: 22 January 2023 / Published: 3 February 2023
(This article belongs to the Special Issue Sustainability and Resiliency of Building Materials and Structures)

Abstract

:
In this study, novel cross-shaped concrete-filled steel tube (CFST) and steel tube (ST) columns were developed. CFST columns have a high load-carrying capacity and excellent performance under seismic conditions, and the construction process is fast. In order to investigate the axial load bearings and failure mechanisms, six specimens of CFST and ST columns were tested under the axial load. Three different forms of CFST were employed in this study; one was an ordinary cross-shaped CFST (OC-CFST), while the other two were executed with significant inner changes; namely, stiffeners cross-shaped CFST (SC-CFST), and multi-cell cross-shaped CFST (MC-CFST) filled with concrete. The other group has the same OC-ST, SC-ST, and MC-ST, but these test subjects were without filled concrete. Through discussion of the failure mechanism, load displacement and load strain correlations are determined. The effects of parameters on ultimate resistance, failure pattern, and ductility index were studied. The axial load-carrying performance of the cross-shaped CFST columns was 75–80% better than that of ST columns; and each ST column displayed cooperative behavior. The finite element model (FEM) was simulated, and the outcomes of the experiments were used to validate it. The load–displacement relationships were established using parametric analysis. Existing design standards were used to calculate CFST column loading capacity. Finally, mathematical formulas were improvised to determine the ultimate load of the cross-shaped CFST column.

1. Introduction

Applying specially shaped CFSTs, as the columns that protrude from walls, can increase the amount of floor space accessible in structures. Special-shaped CFST columns are widely used in industrial sites, tall buildings, bridges, substantial transmission towers, and other structures due to their high load-bearing capacity, outstanding ductility, compatible construction, better construction technique and economic advantages [1]. They are currently being used in several buildings in China, including the Fukang Home, the Guangzhou new China Mansion, the Guangzhou Mingsheng Plaza, and the residences in Yuzixi village [2,3]. CFST columns are currently primarily classified into groups possessing square, rectangular, circular, and special-shaped cross-sections. Implementing specially shaped CFST columns can improve the internal usage area of a high-rise structure significantly [4,5,6]. A proper theoretical and specification system for CFSTs was created as a result of significant laboratory experiments and theoretical study that revealed the mechanical characteristics of square and circular CFST columns [7,8,9,10,11,12,13]. Commonly, a square, rectangular, or circular cross-section is used for the steel column in a typical residential building. In these situations, the column can protrude out from the wall and affect the building structure [14,15]. There are several conventional section forms. Corner columns for architectural construction frequently use cross-sections which are T-shaped, L-shaped, and cross-shaped.
Researchers have previously examined the achievement of multi-cell, L-shaped CFST columns that have been stiffened while loaded in either pure bending or axial compression conditions [3,14,16,17,18,19], and the currently available design methodologies have been suggested. Qiguang et al. [20] presented a calculation method for CFST columns with cross-shaped sections; it investigated how factors such as cross-section dimensions, width-to-thickness ratio, and yield stress affected loading capacity, displacement form, and stress formation for the steel tube. According to experimental findings, lowering the tube’s width-to-thickness ratio decreased the overall out-of-plane displacement at the corner. As the steel grade was raised, the ductility increased while the bearing load and deformation decreased inversely. Increased premature load buckling and overall outward extrusion were seen when the tube’s length-to-width ratio was increased. A CFST column that has been exposed to axial compression can have its ultimate load-bearing capacity and lateral displacement impact of a wide range of factors, however, it has been discovered that one of the more effective factors, in this case, is the concrete confinement [21,22,23,24,25,26]. Multi-cell CFST columns with axial loading were introduced by Song et al. [27]; these researchers carried out both experimental and FEM research. The strength of the concrete and specimen width–thickness ratio were the experiment criteria. A parametric investigation was carried out using ABAQUS once the experimental and numerical data had been validated. China and European standards were the most accurate in calculating the specimen’s loading capacity according to a comparison of experimental data with those produced using various standard methodologies.
In order to create a multi-cell T-shaped CFST column, Cao et al. [28] and Xu et al. [29] invented welding techniques for rectangular tubes. The proposed method improved confinement in infilled concrete by increasing load carrying capacity and recommending design strategies based on parametric analysis. Liu et al. [2] established a numerical model for ordinary, stiffened, multi-cell T and L-shaped CFST columns with concentric and eccentric loads. According to the investigation, multi-cell special-shaped CFST excelled over other types of special-shaped CFST columns in mechanical behaviour. Earlier studies have shown that adding longitudinal stiffeners or implementing a multi-cell cross-section can improve the mechanical behaviour of the special-shaped CFST columns.
In comparison to previous studies’ findings on the behavior of peculiar cross-shaped CFST and ST columns, the number of research investigations is limited and insufficient. This research is an experimental, numerical, and analytical study of six cross-shaped CFST and ST columns subjected to concentric axial compression. The main goal of the test system is to concentrate on the behavior of the columns with internal changes, like MC-CFST, MC-ST, SC-CFST, SC-ST, OC-CFST, and OC-ST. Additionally, parametric analysis is carried out by the FEM approach using the ABAQUS software while considering different geometric cross-sections and material properties. A mathematical formula for structural engineering practice in the future has also been proposed, along with a discussion of the best way to estimate how much resistance particular cross-shaped CFST columns will exprerience.

2. Experimental Research

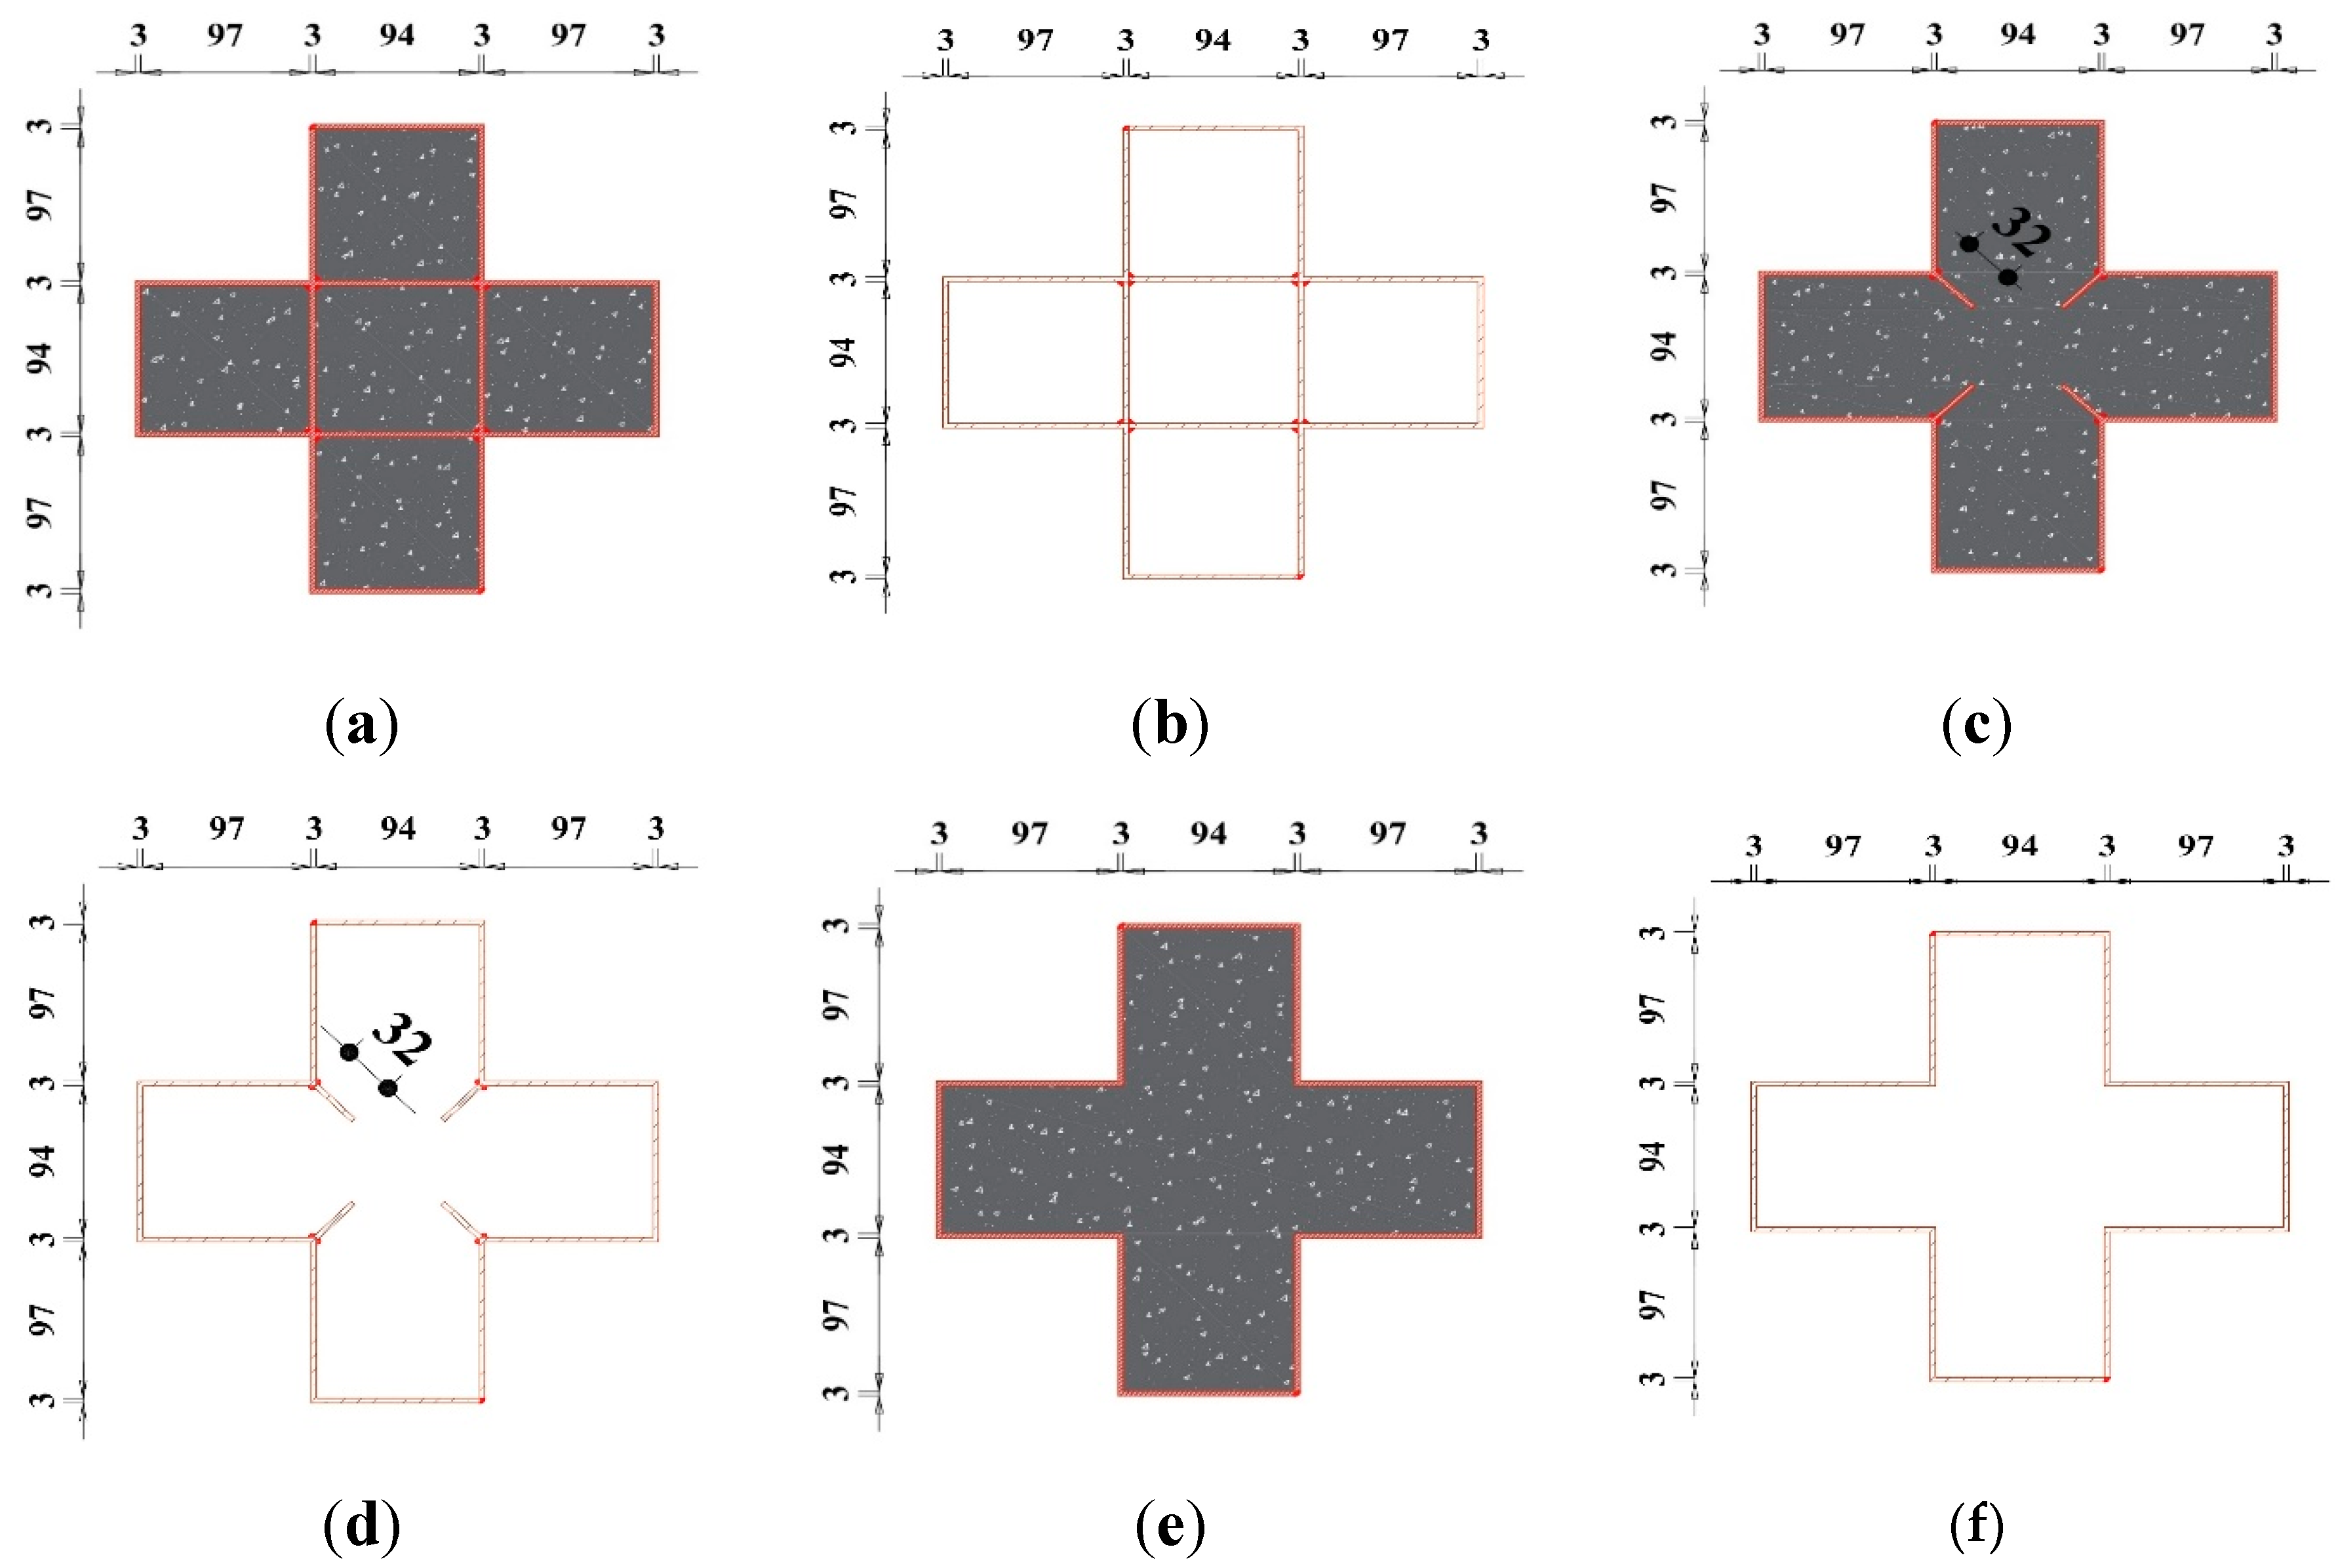
2.1. Specimens Details

Three types of special-shaped CFST and ST columns cross-sections are made up of steel tubes with 300 mm × 300 mm dimensions. All the study specimens had identical overall cross sections with internal changes. In Figure 1 and Table 1, the cross-sectional information of all specimens is presented. The six specimens were identified as MC-CFST, SC-CFST, OC-CFST, MC-ST, SC-ST, and OC-ST by symbol codes. Concentric axial loading was performed on all specimens. Respectively, l and b represent the length and width of the column, t represents the thickness of the steel tube, and ξ is the confinement factor. Montuori et al. [30] analyze the finding of a study, looking at several fundamental laws for the confinement factor. Among them, the square section constitutive laws are shown in Table 2.
Here, fy and fck are the steel and concrete strengths. As and Ac represent steel and concrete cross-sectional area. The length–width ratio (l/b) is maintained at 3 mm for all cross-shaped columns to avoid the general buckling reaction and boundary condition, culminating in a physical column length of 900 mm.

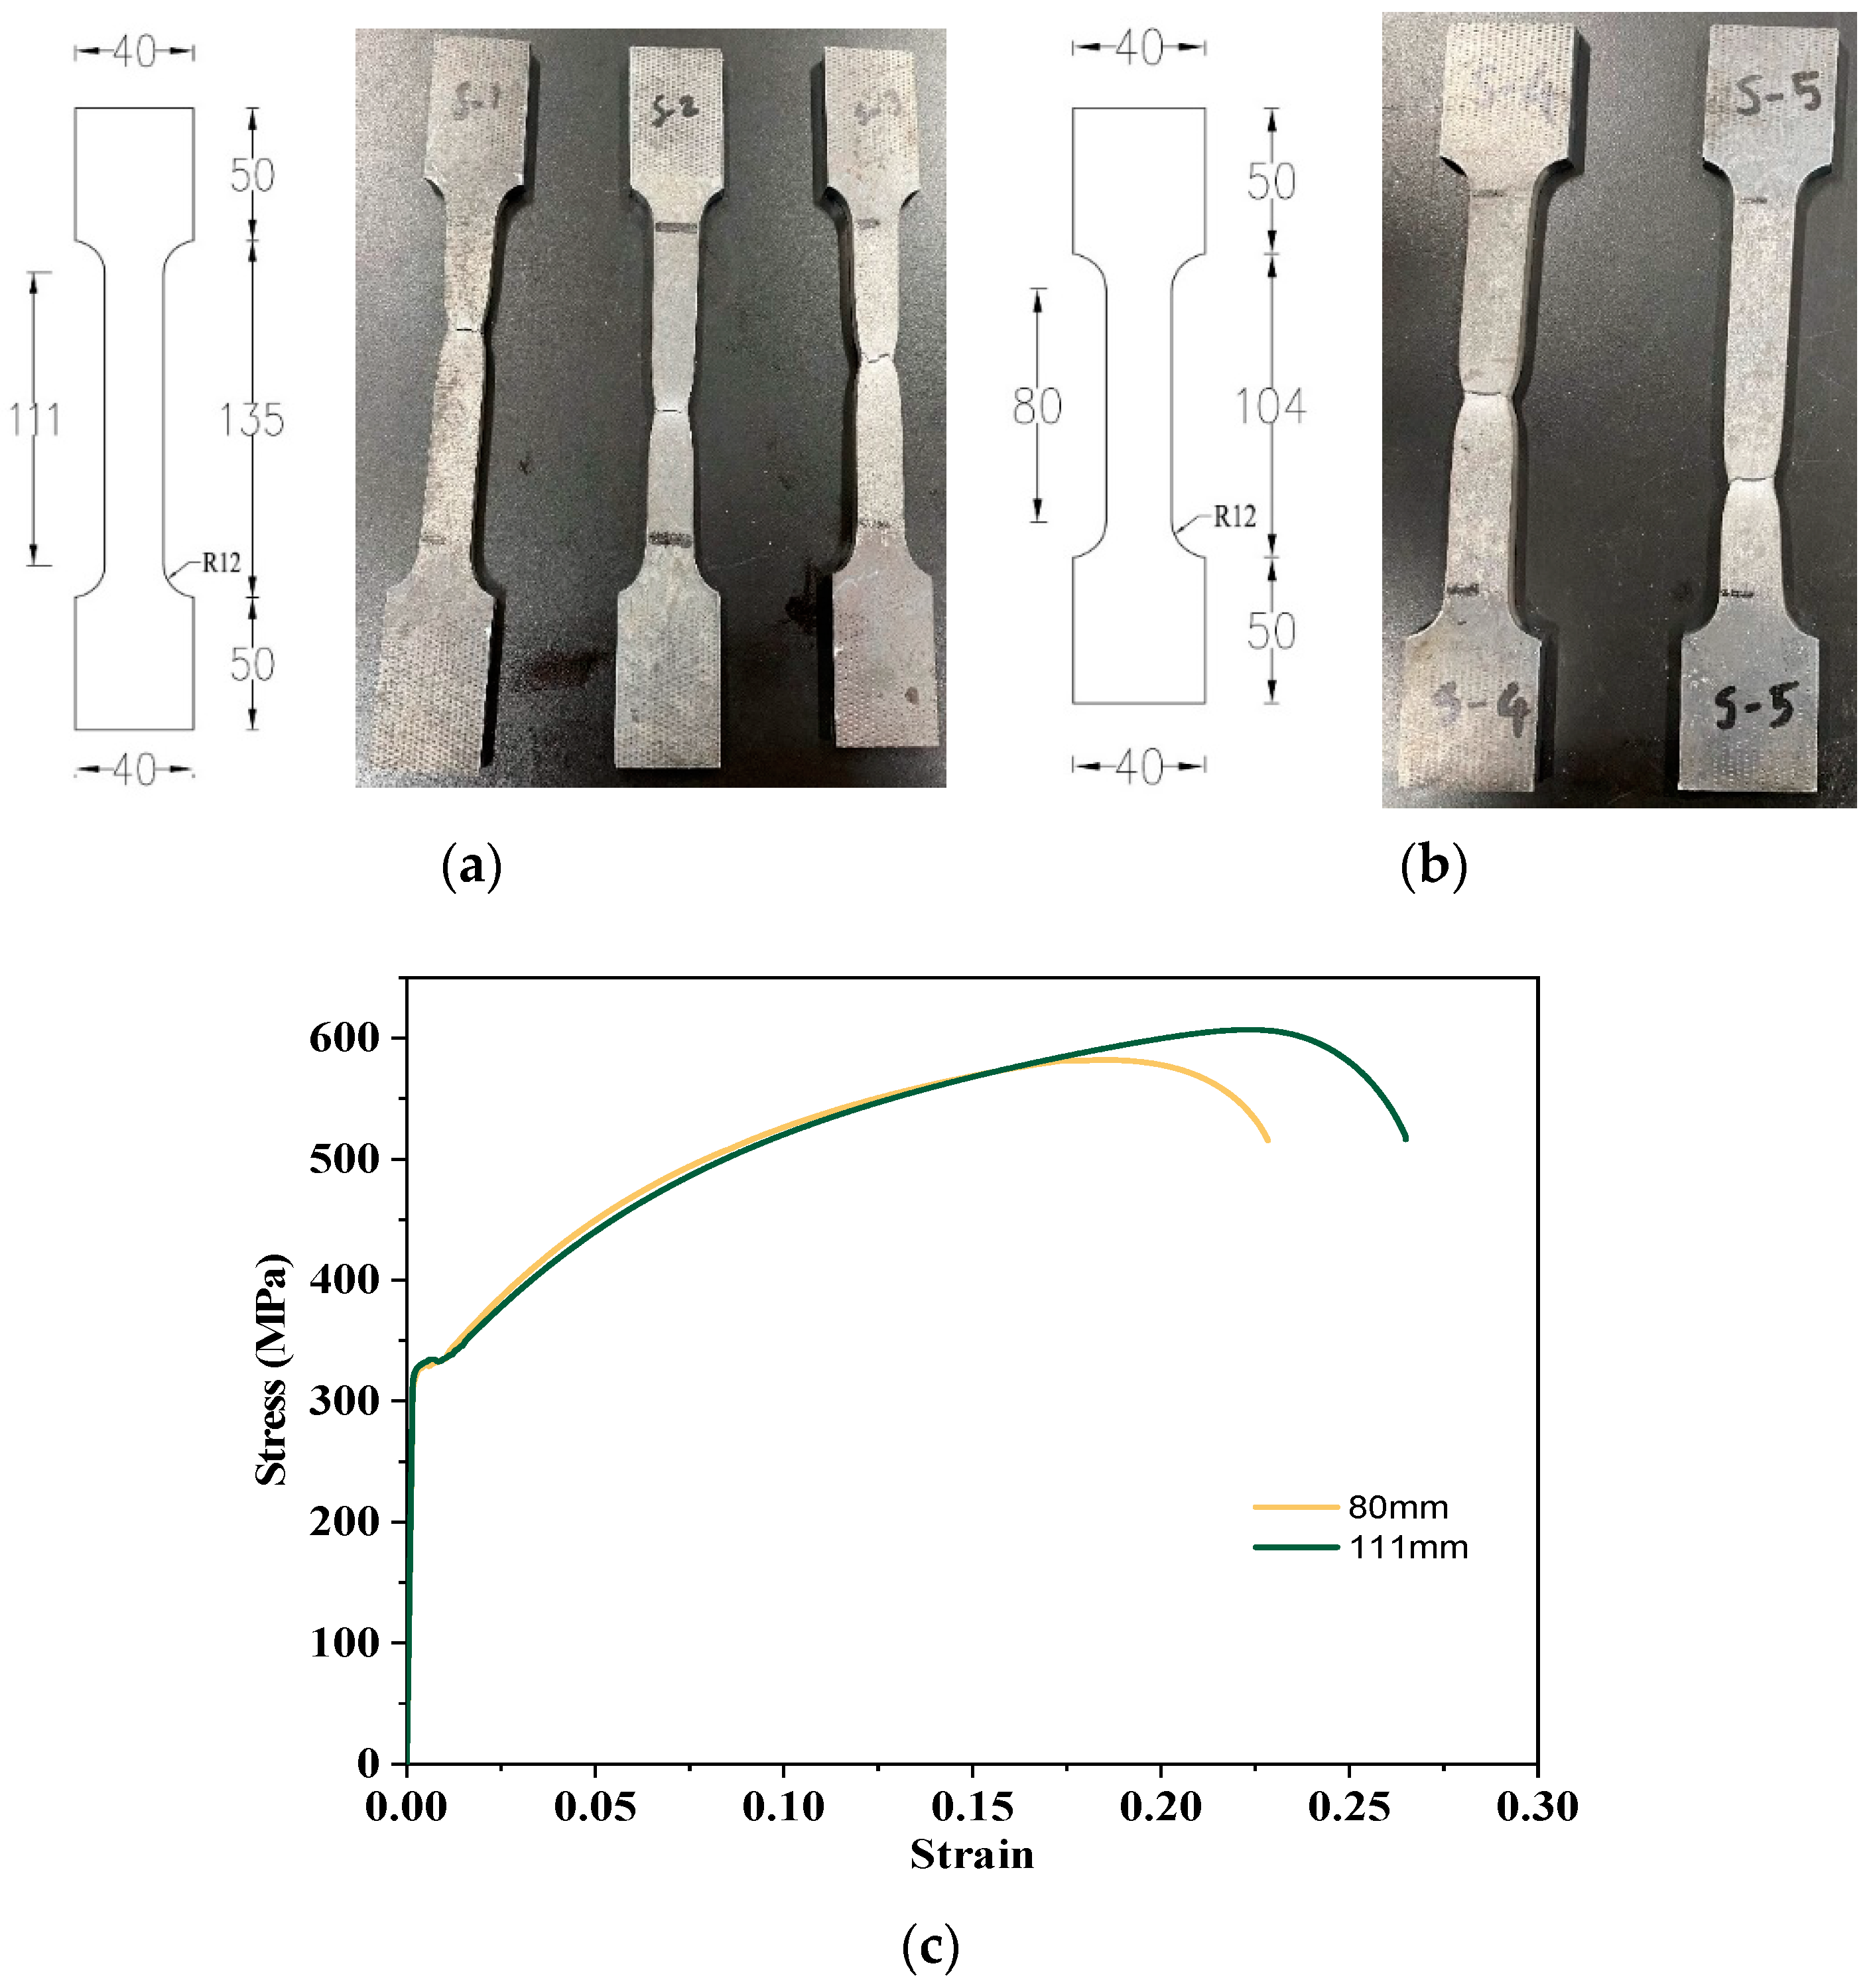
2.2. Material Properties

During the experiment, a Q235-grade steel sheet was used. Five tensile test samples were taken and inspected to look at the mechanical properties of a steel sheet with a thickness of 7.43 mm inner lengths of 111 mm and 80 mm. An electronic universal testing machine based on (GBT228.1-2010) [33] was used to conduct the tensile test.
Figure 2 displays the typical stress–strain curve and tensile coupon sample. Table 3 shows the average results for the inspected yield strength, ultimate strength, elastic modulus, and Poisson’s ratio, denoted as fy, fu, Es, and µs, respectively.
There, concrete cube samples of 150 × 150 × 150 mm were manufactured, self-made core concrete was utilized for the concrete material property test, and the concrete was poured into the steel tube columns. The proportions of the concrete mixtures were Cement:Sand:Stone:Water (1:1.11:2.25:0.4). To optimize the curing state of the concrete core in the steel tube, the concrete cubes were first covered in aluminum foil and subsequently in translucent protective plastic. According to the standard concrete cube tests, the average cubic compressive strength (fcu) was 45.28 MPa, and the elastic modulus of concrete (Ec) was 28023 MPa.

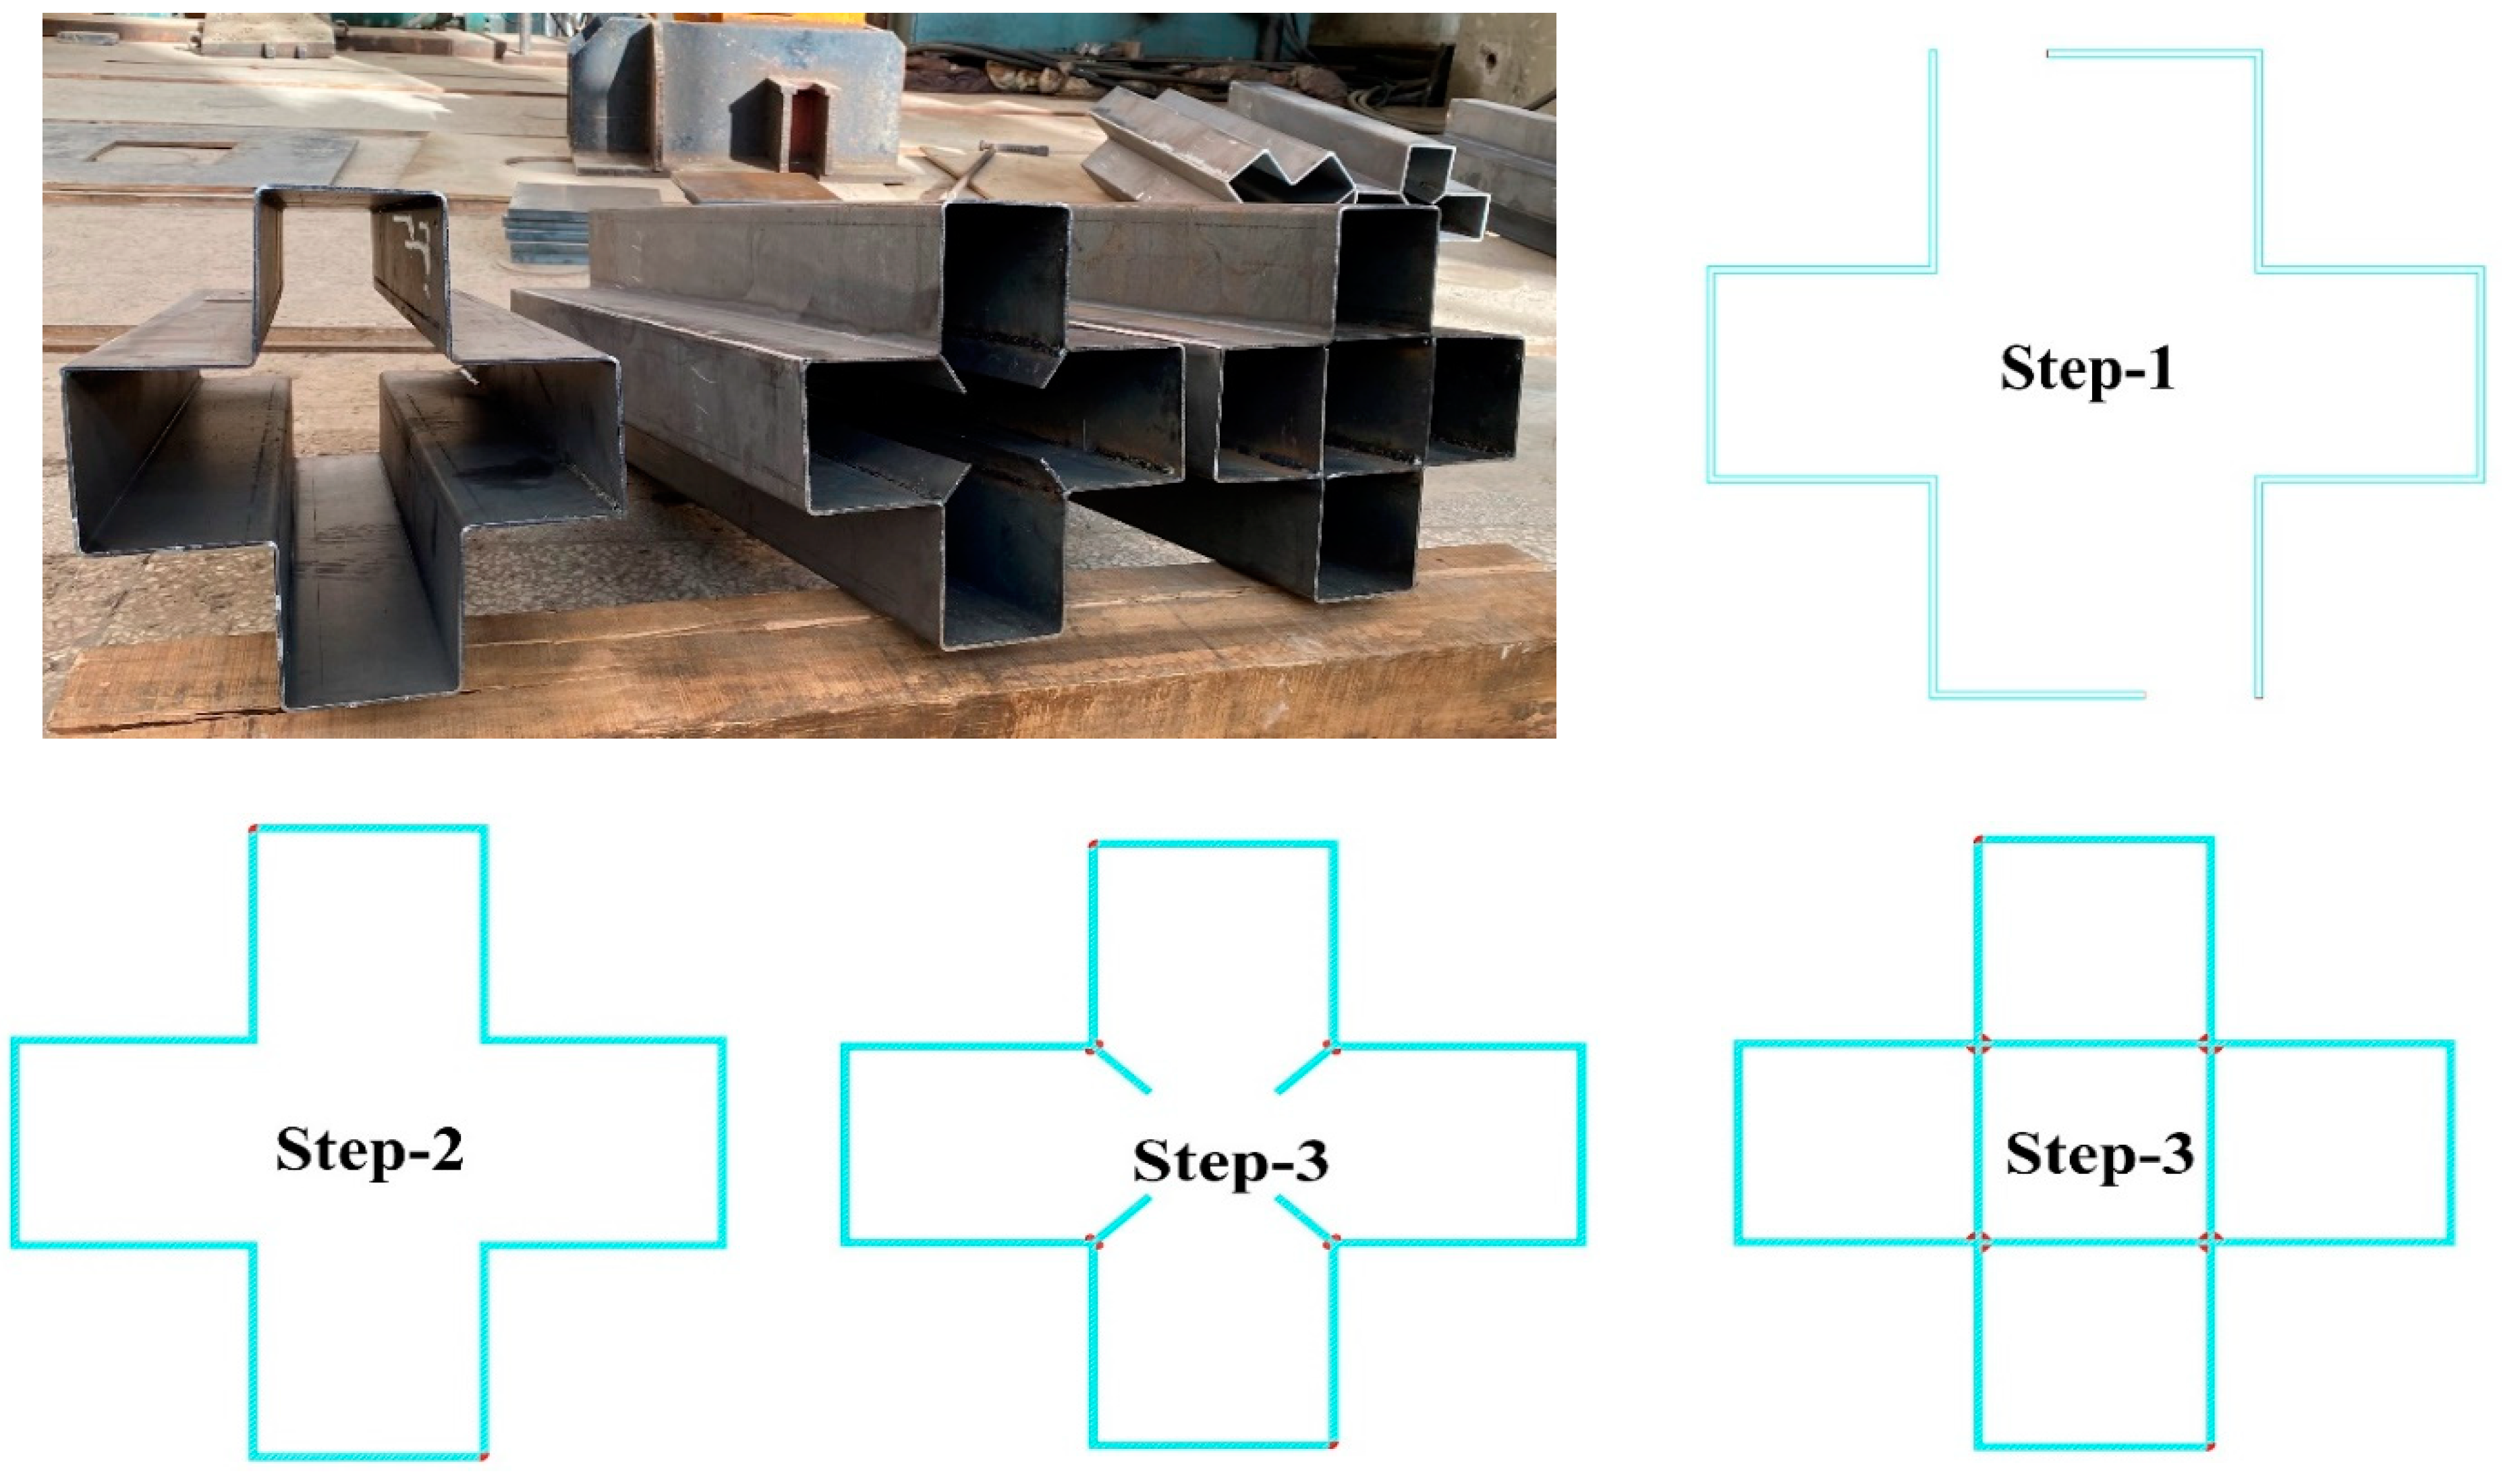
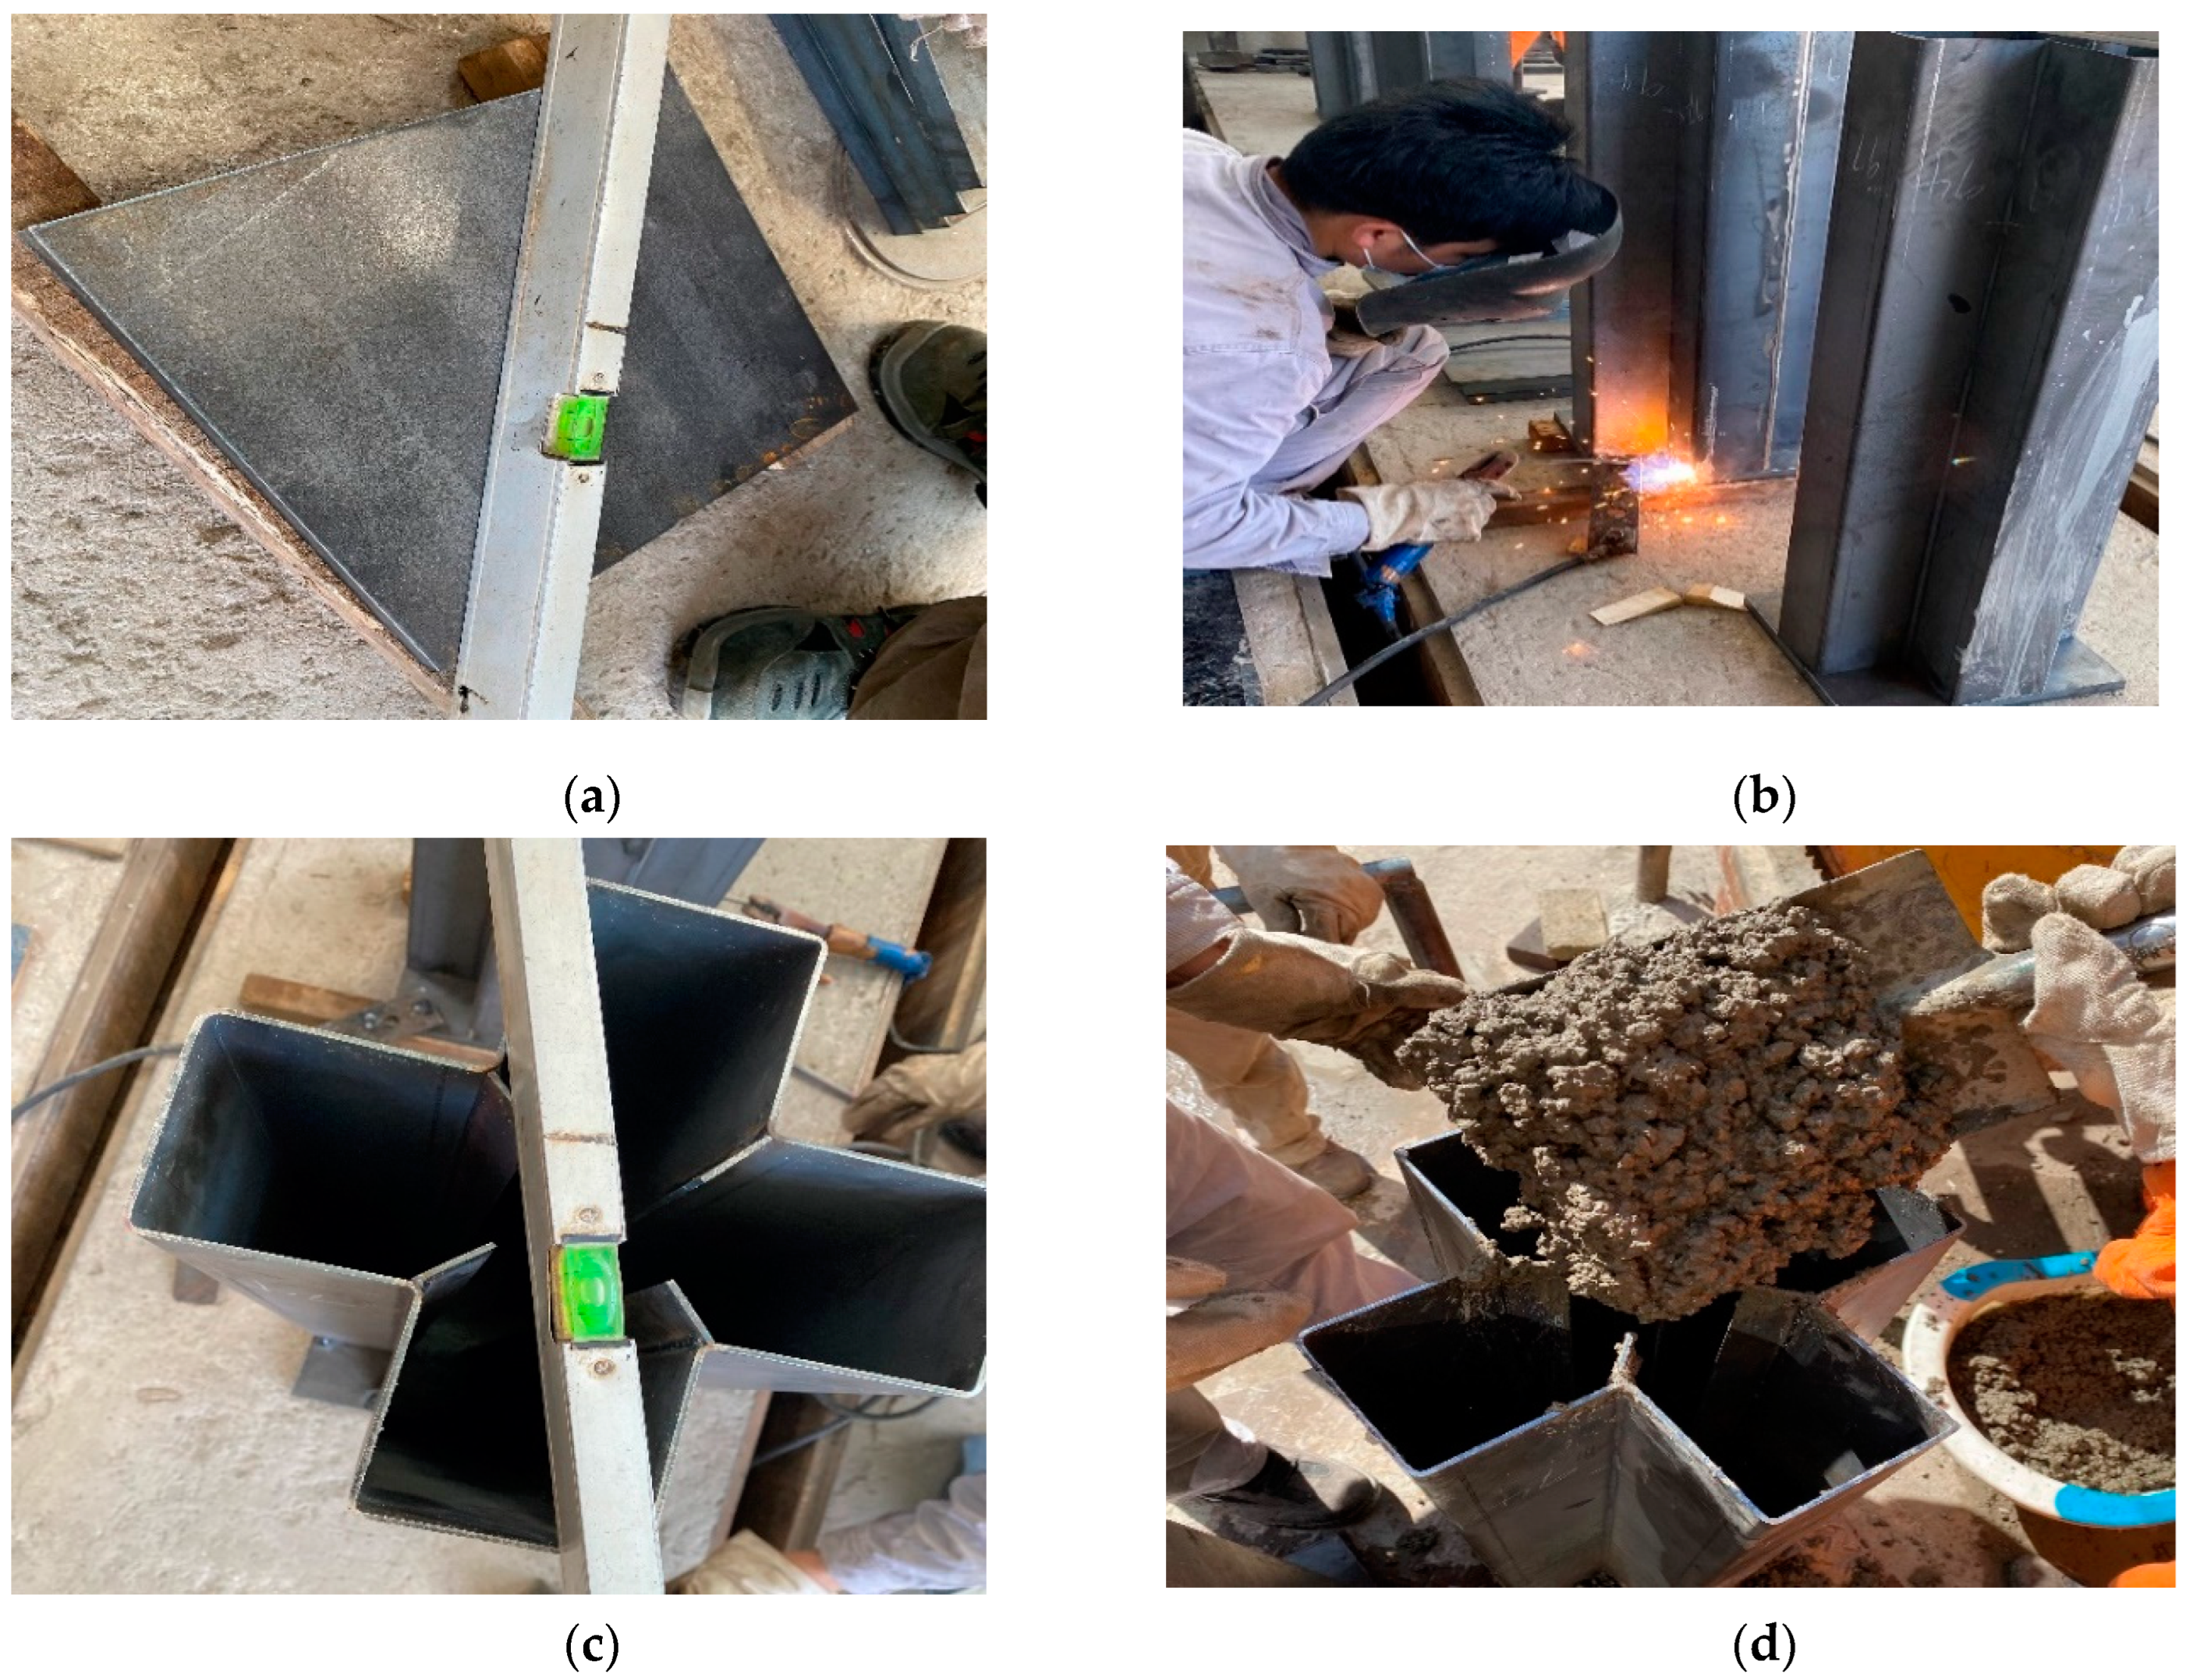
2.3. Specimens’ Construction

The experiment specimen may sustain damage or develop flaws throughout the manufacturing and processing of steel tubes due to welding and other procedures. As a result, logically planning the manufacture and processing method, shortening the welding method, and optimizing welding accuracy can raise the experiment specimen performance. Cold-formed empty tubes made from the same steel sheet were created to preserve the comparable qualities of all specimens. Two bent-over steel sheets were used to construct each OC-CFST, OC-ST specimen, for MC-CFST, SC-CFST, MS-ST, and SC-CFST specimens welded with the extra steel sheet in mid-portion, and they were linked by vertical welding, as illustrated in Figure 3.
At the bottom of the steel tube, a loading cover plate with a 20 mm thickness and measurements of 300 × 300 mm was welded, providing the framework for pouring concrete. Before welding the loading plate, we checked the leveling to ensure that the load was distributed accurately on the specimens, as illustrated in Figure 4. Following vertical filling, concrete was compacted, utilizing a poker vibrator on the outside of the steel tubes and a vibrating rod on the inside. After pouring, the top portion of the concrete in steel tubes was covered with aluminum foil and a thin plastic sheet to prevent drying shrinkage. After that, all specimens were left in the room for 28 days. To ensure that the concrete core and steel tube could bear loads combinedly, another steel loading plate with a thickness (of 20 mm) was welded at the top of the specimen. Figure 3 demonstrates several crucial steps that must be taken before and during the concrete pouring.

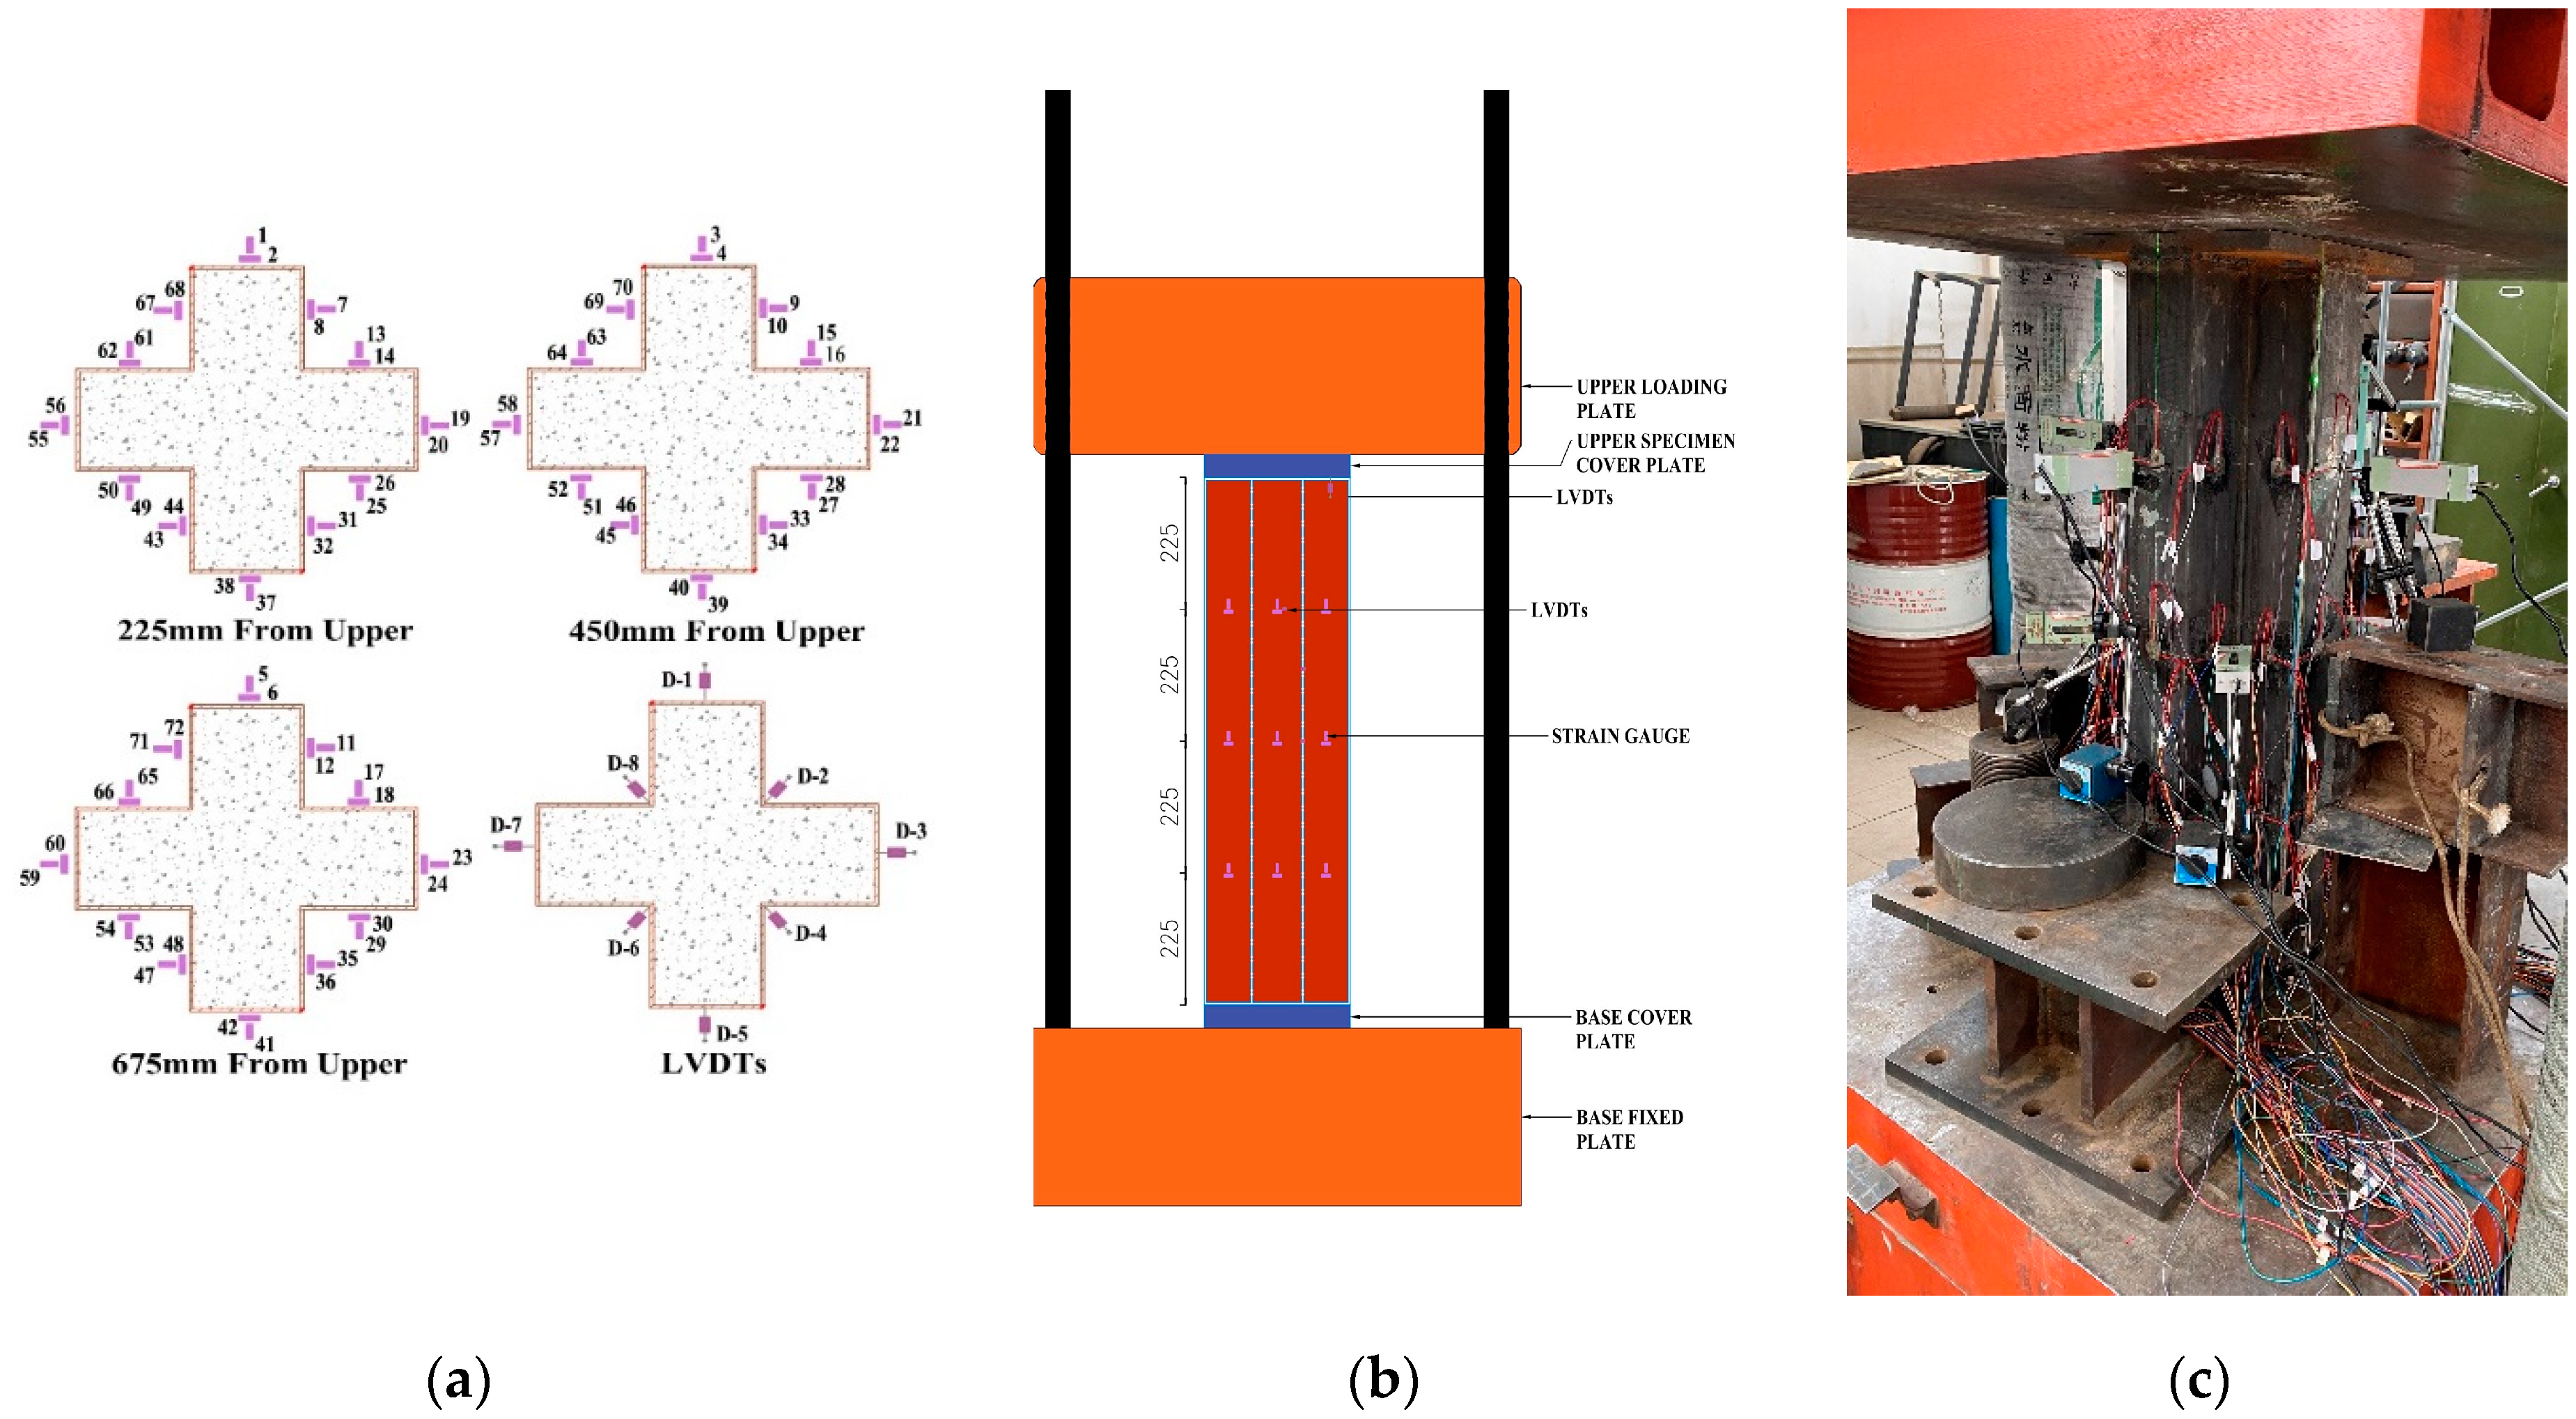
2.4. Measuring Instrument and Timeline for Loading

Using 72 resistance strain gauges, 36 strain gauges were installed longitudinally, and the other 36 were installed horizontally. All the strain gauges were glued to the column’s middle, upper-middle, and lower-middle 225 mm surface to acquire the axial load. Figure 5 illustrates the experimental configuration and the arrangement of the measuring instruments. The CFST and ST columns were placed up in a similar manner.
Nine displacement transducers (LVSTs) were placed at different places to obtain the vertical and lateral deformation of the specimen. The compression-controlling device and the computer automatically measure and record axial load and vertical deformation. Besides this, we installed LVDTs vertically under the loading plate to get the exact vertical deformation. Each specimen had eight lateral deformation LVSTs installed on every outer face and corner face. For OC-CFST, all lateral LVSTs were in the center, but after seeing the actual effect on the OC-CFST column, the rest of all columns, D-2, 4, 6, and 8, were installed from the upper-inner part to the 225 mm center.
A hydraulic machine with a 10,000 kN capacity was used to evaluate the cross-shaped CFST and ST columns under axial compression. The compressive axial load was imposed at the cross-shaped CFST and ST column centers. The information from the strain gauges and LVDTs was recorded by an automatic data recorder system that was connected to a computer.
The load was first discharged to zero and then reloaded for formal loading after the specimen had completed its preliminary work. The formal load application stage implements the rule of applying the load in stages regulated by force and establishes the size of the load applied in stages.
The force-controlled load was applied at this phase loading at a speed of 120 kN/min. This loading motion continued until the maximum load was reached. Once the maximum load has been attained, the force load is maintained to assure the experiment’s safety.
Now the experiment loading stage has entered the failure stage. The experiment is considered to have failed when the load falls below 75% of the observed limit load, or if the experiment specimen deforms excessively. The local buckling’s location was identified, and the associated load data were recorded. The specimen failed due to the concrete crashing and steel tubes’ outward expansion, which ended the loading procedure.

3. Discussion and Analysis

3.1. Failure Occurrence

Effective ductile behavior was displayed in every cross-shaped CFST column. The failure system of the specimens is illustrated in Figure 6 and Figure 7. There was no welding failure at the initial loading stage, and the welded seams held up well while loading. During the failure phase, most specimens made the sound. Each type was carefully inspected due to the various failure occurrences and specimen-related modes.

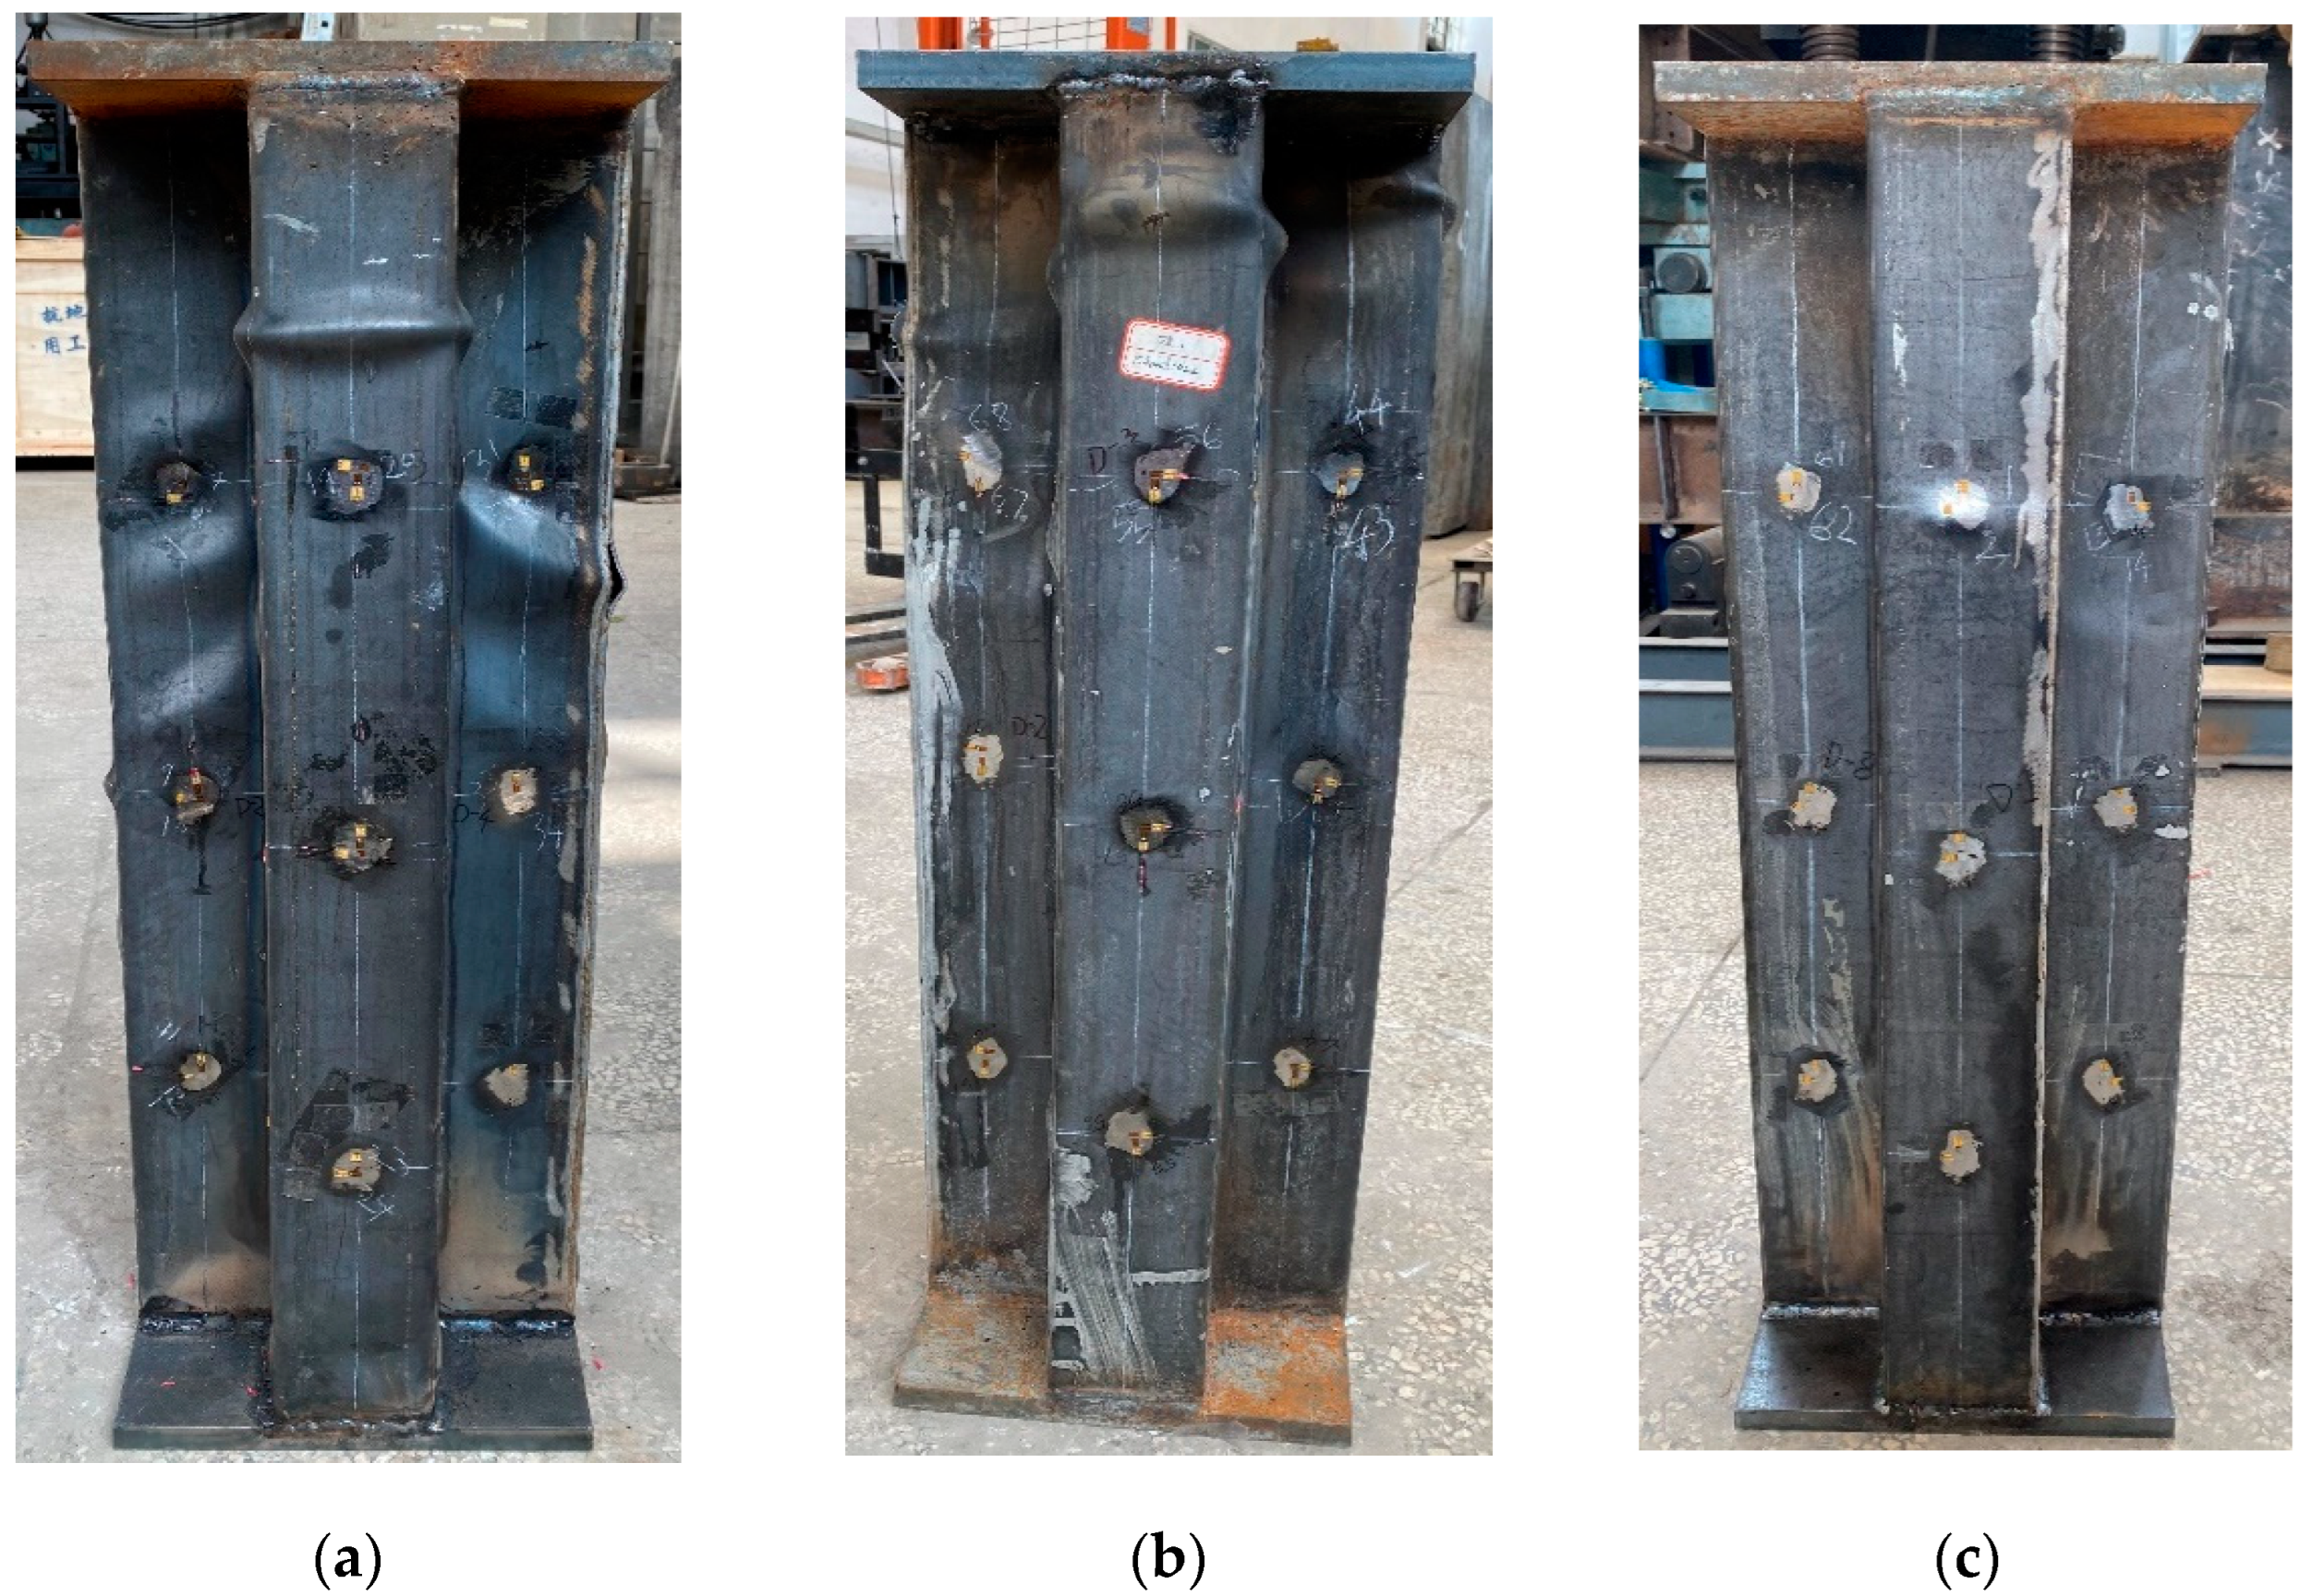
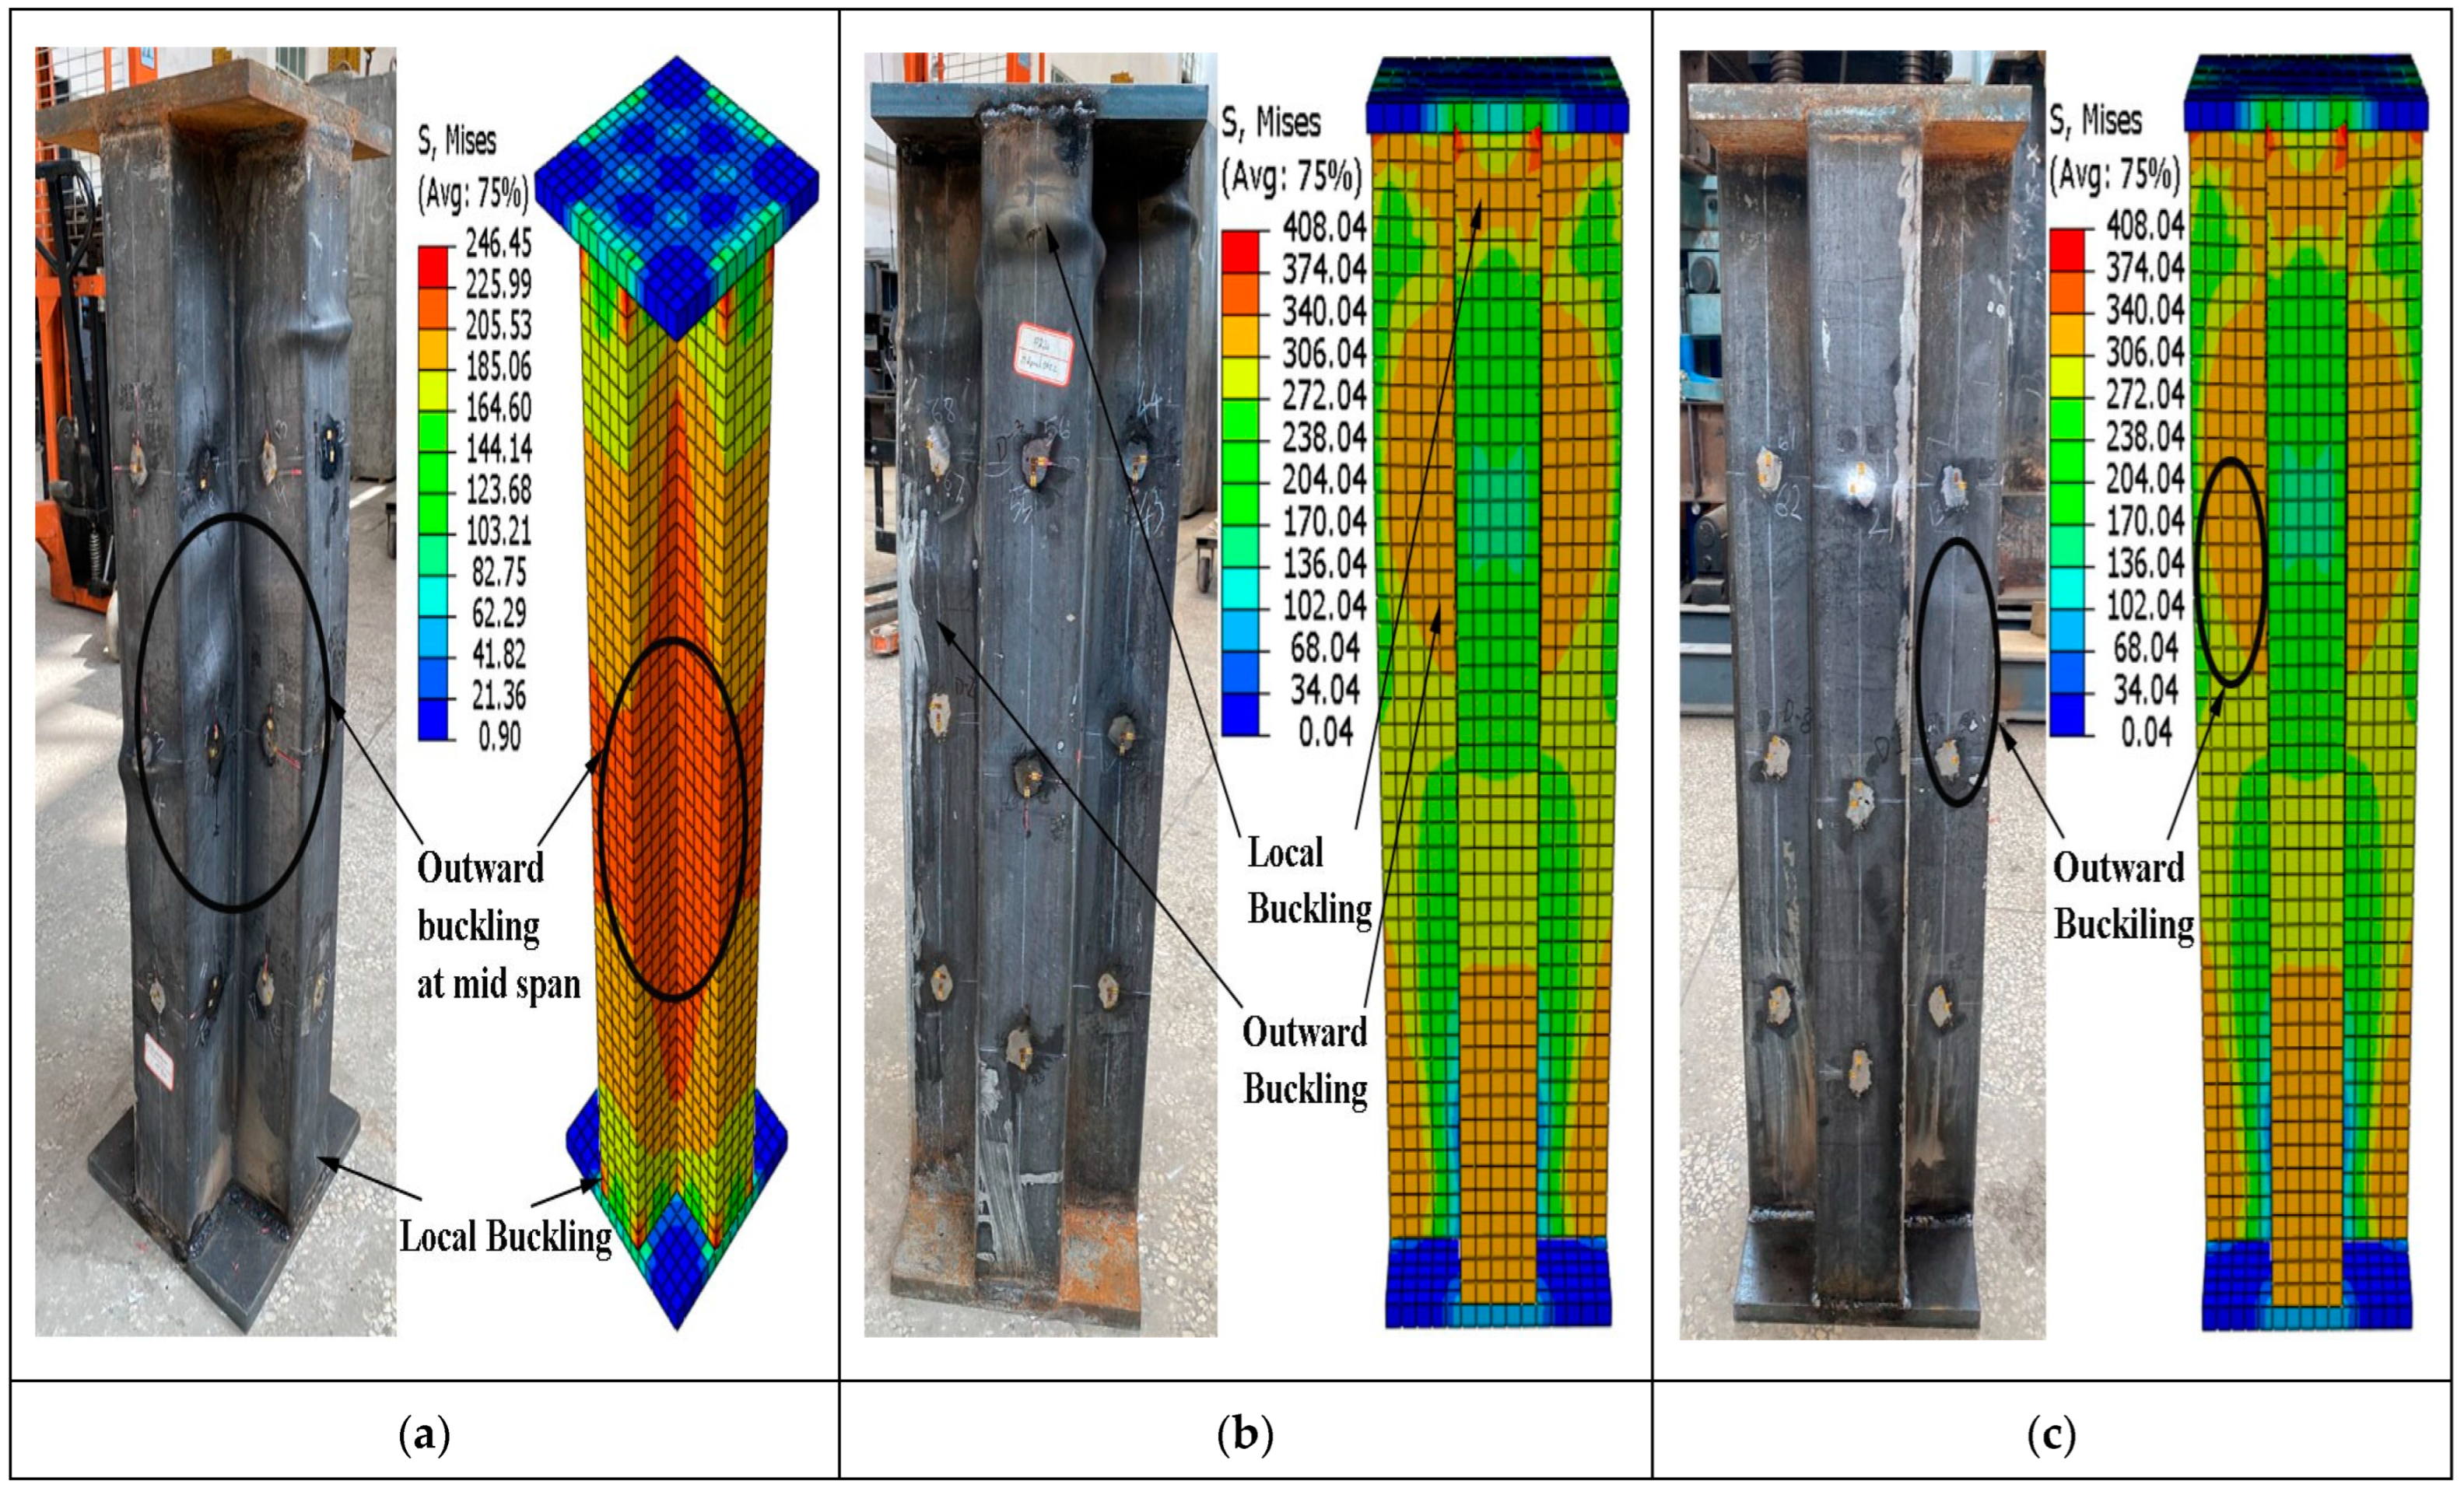
3.1.1. Cross-Shaped CFST Specimen’s Failure Modes

Similar failure processes were displayed by the specimens MC-CFST, SC-CFST, and OC-CFST when loaded concentrically. No obvious occurrence was seen during the initial loading process on the specimen’s face. For specimen MC-CFST, the load–displacement graph increased linearly until 3082 kN and then became nonlinear as the load increased. Local buckling started on two faces when specimen MC-CFST’s average load declined to 3652 kN from an ultimate load of 3805 kN. When the MC-CFST specimen reached its maximum load, there was a crack in the joint, as seen in Figure 6a. After that, during the load-dropping phase, significant local buckling happened randomly at adjusted faces.
However, significantly less local buckling can be detected in specimen SC-CFST, demonstrating the cooperation and development between the core concrete and steel tube and also the different cross sections. A reduced steel ratio is to blame for this, which enhances the restraining effect of the infilled core concrete and the control of local buckling. There was no bulging on the specimen’s MC-CFST and SC-CFST concave portions.
The specimen OC-CFST was in the initial stage during the first loading, and no deformation was visible before the specimen reached its ultimate load. In specimen OC-CFST, local buckling started as the load decreased from its ultimate load of 2824 kN to roughly 2767 kN, as shown in Figure 6b. There was no sign of local buckling waves on the faces in the zone, in contrast to the MC-CFST and SC-CFST specimens. Figure 6c shows that subsequent local buckling in specimens OC-CFST was less pronounced than in specimens MC-CFST and SC-CFST due to changes in the steel confinement value and cross section following the failure load.

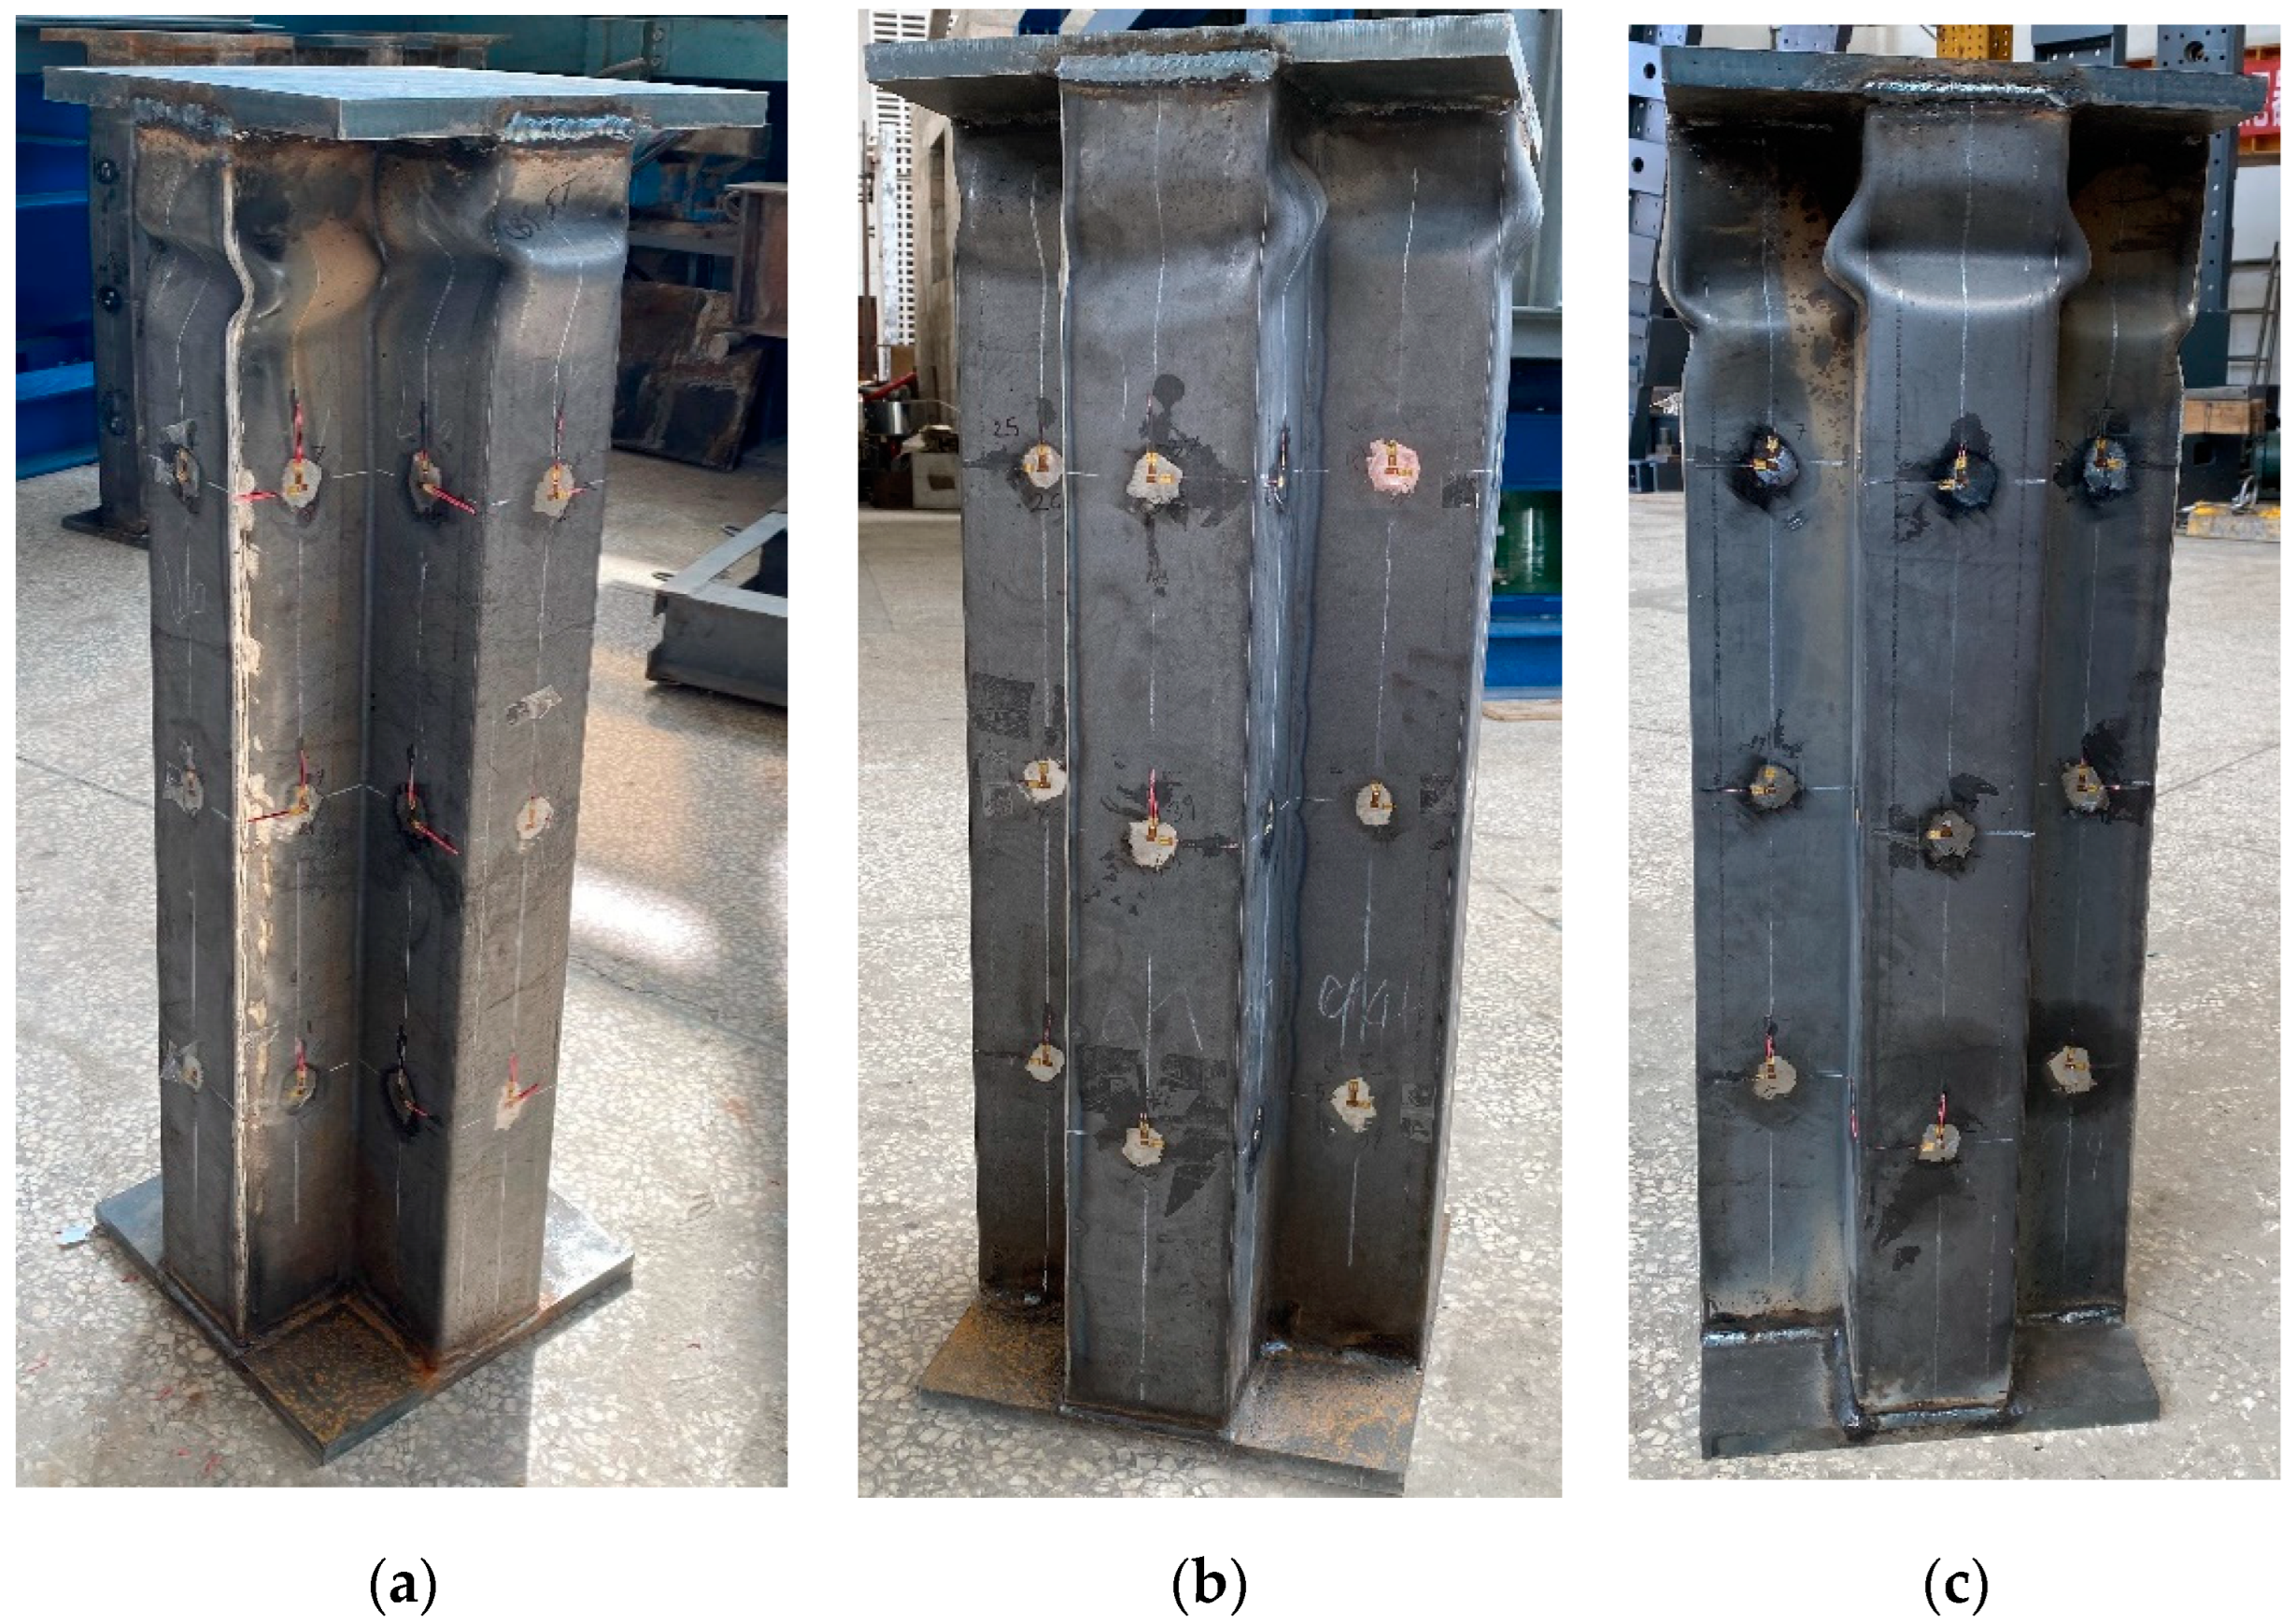
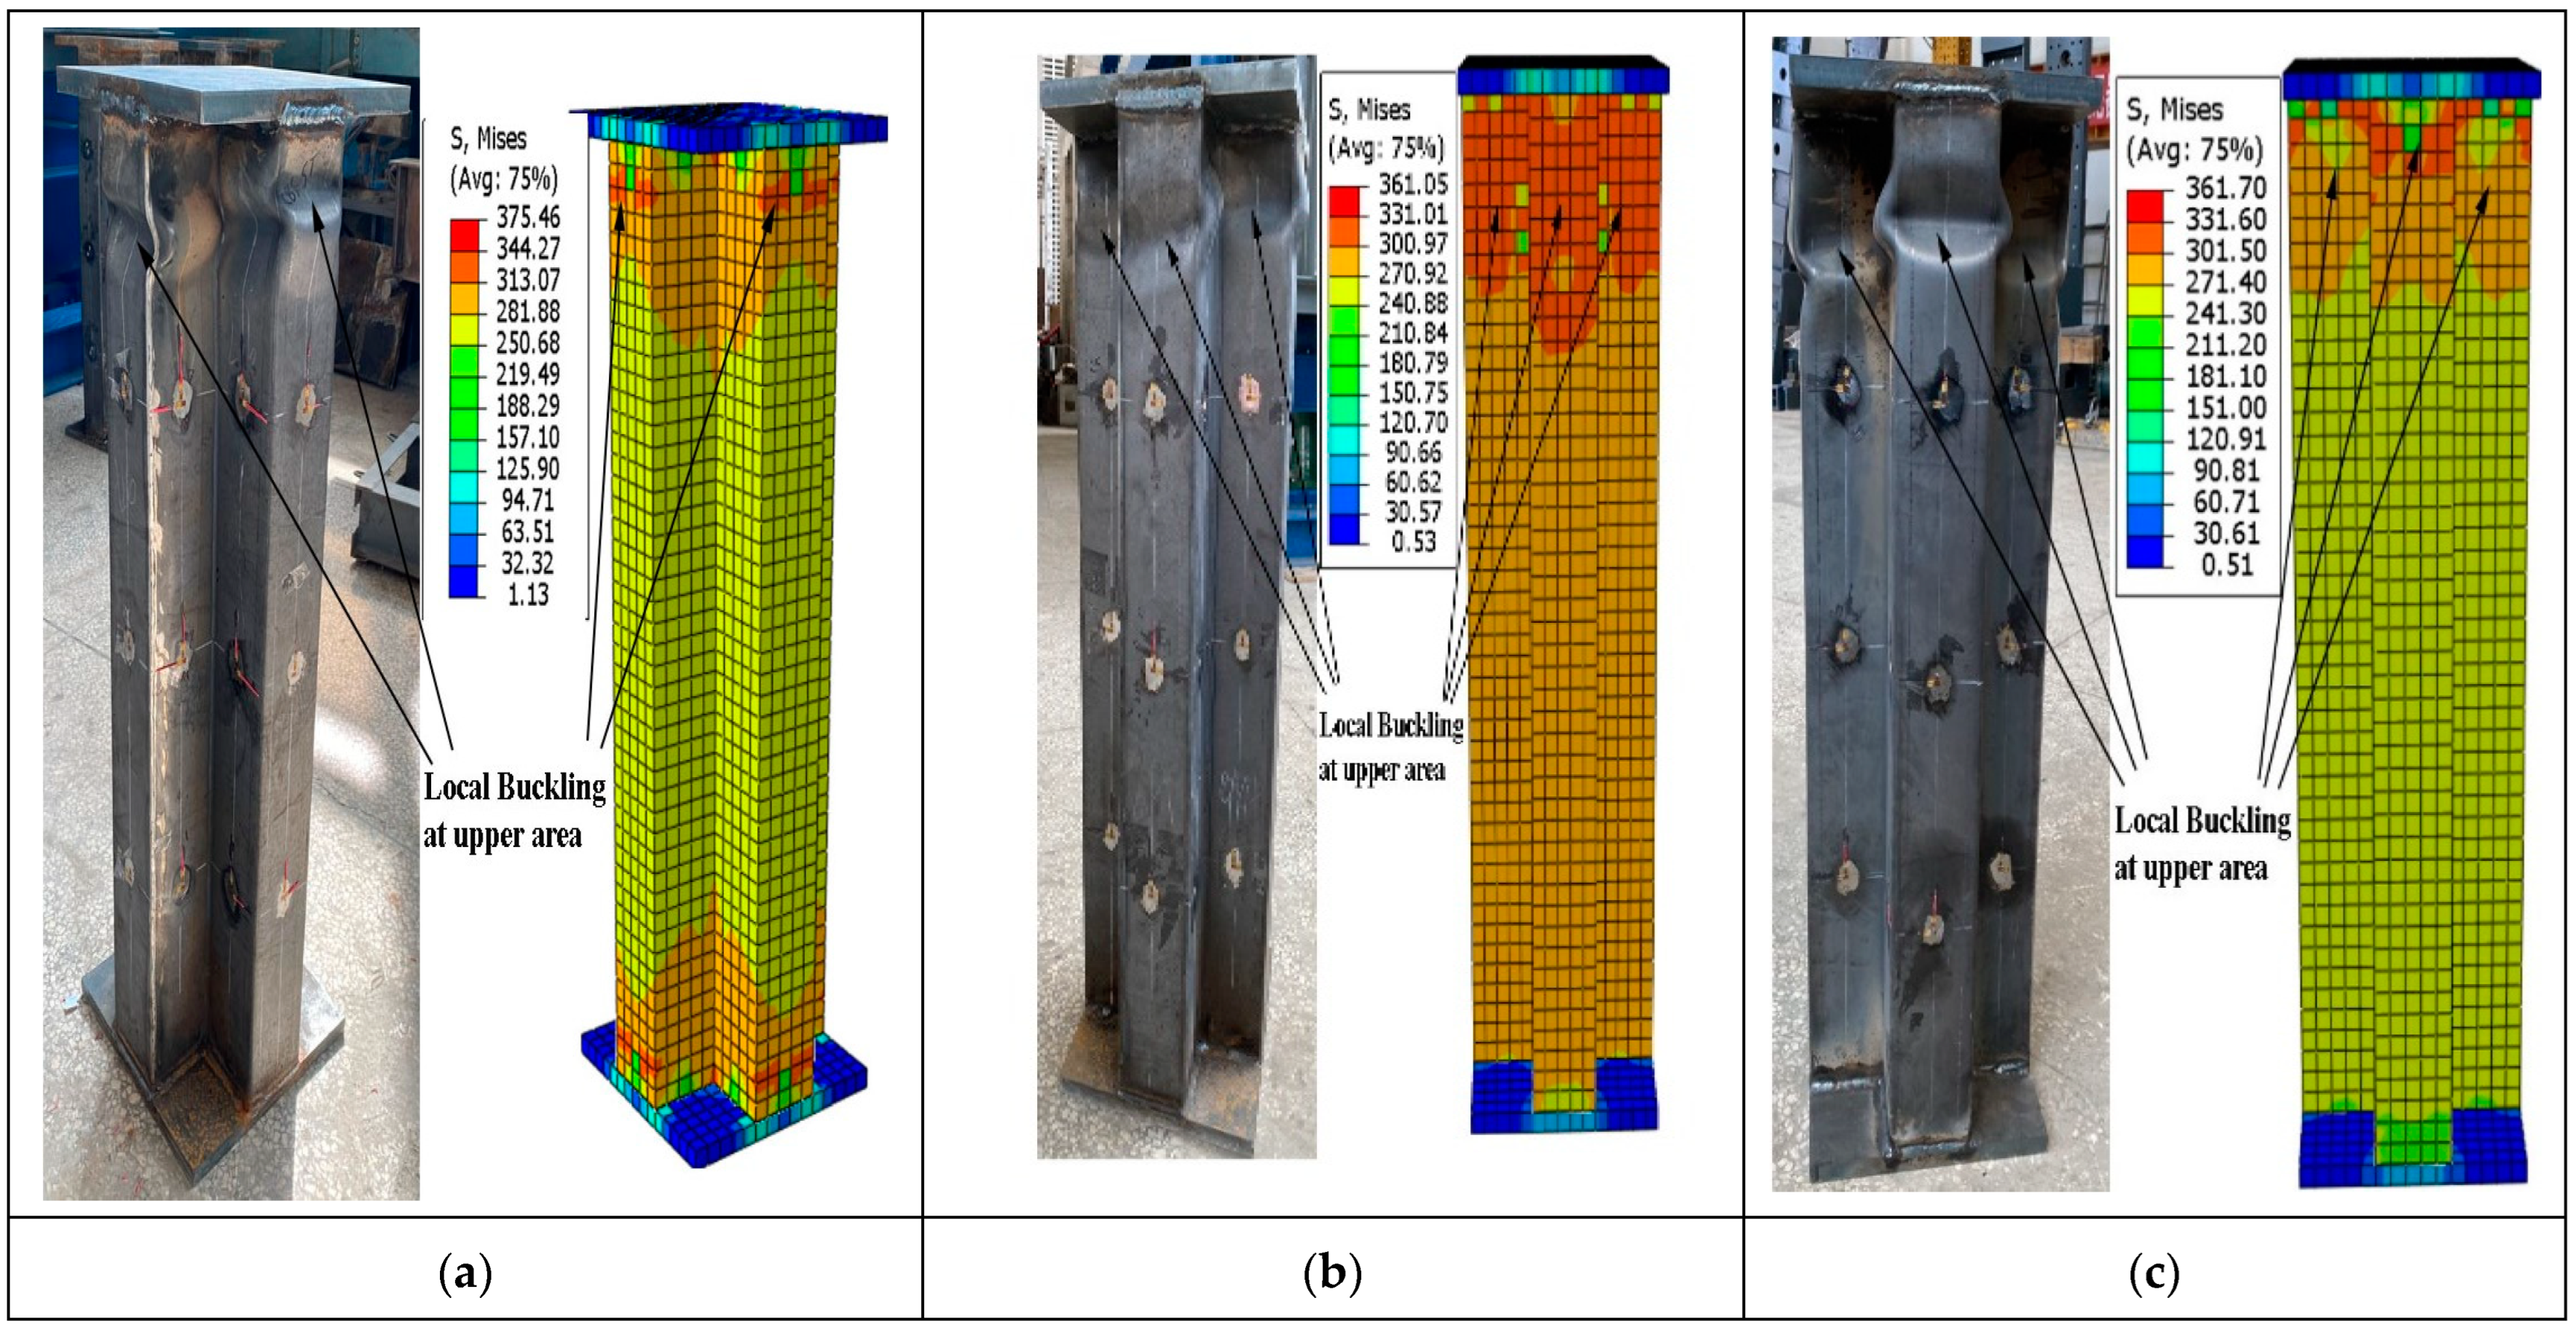
3.1.2. Cross-Shaped ST Specimen’s Failure Modes

During the initial stage of the experiments, the performance of the specimen’s MC-ST, SC-ST, and OC-ST, loaded concentrically, was consistent. Before the ultimate load, lateral deformation did not immediately enter the failure stage. In specimen MC-ST, the first wave of local buckling was seen when the load decreased from an ultimate load of 1195 kN to roughly 1183 kN. In the compression area, there was noticeable buckling. After that, the displacement quickly dropped. While there was no noticeable buckling on the bottom of the specimen, the steel surface displayed significant buckling close to the top, as illustrated in Figure 7. It is possible that this occurred because the inner part of the steel tube lacked a sufficient solid area, preventing the load from properly transferring to the lower portion of the column. Although the local buckling shape was perfect, it undoubtedly became deformed, possibly due to an empty steel tube.

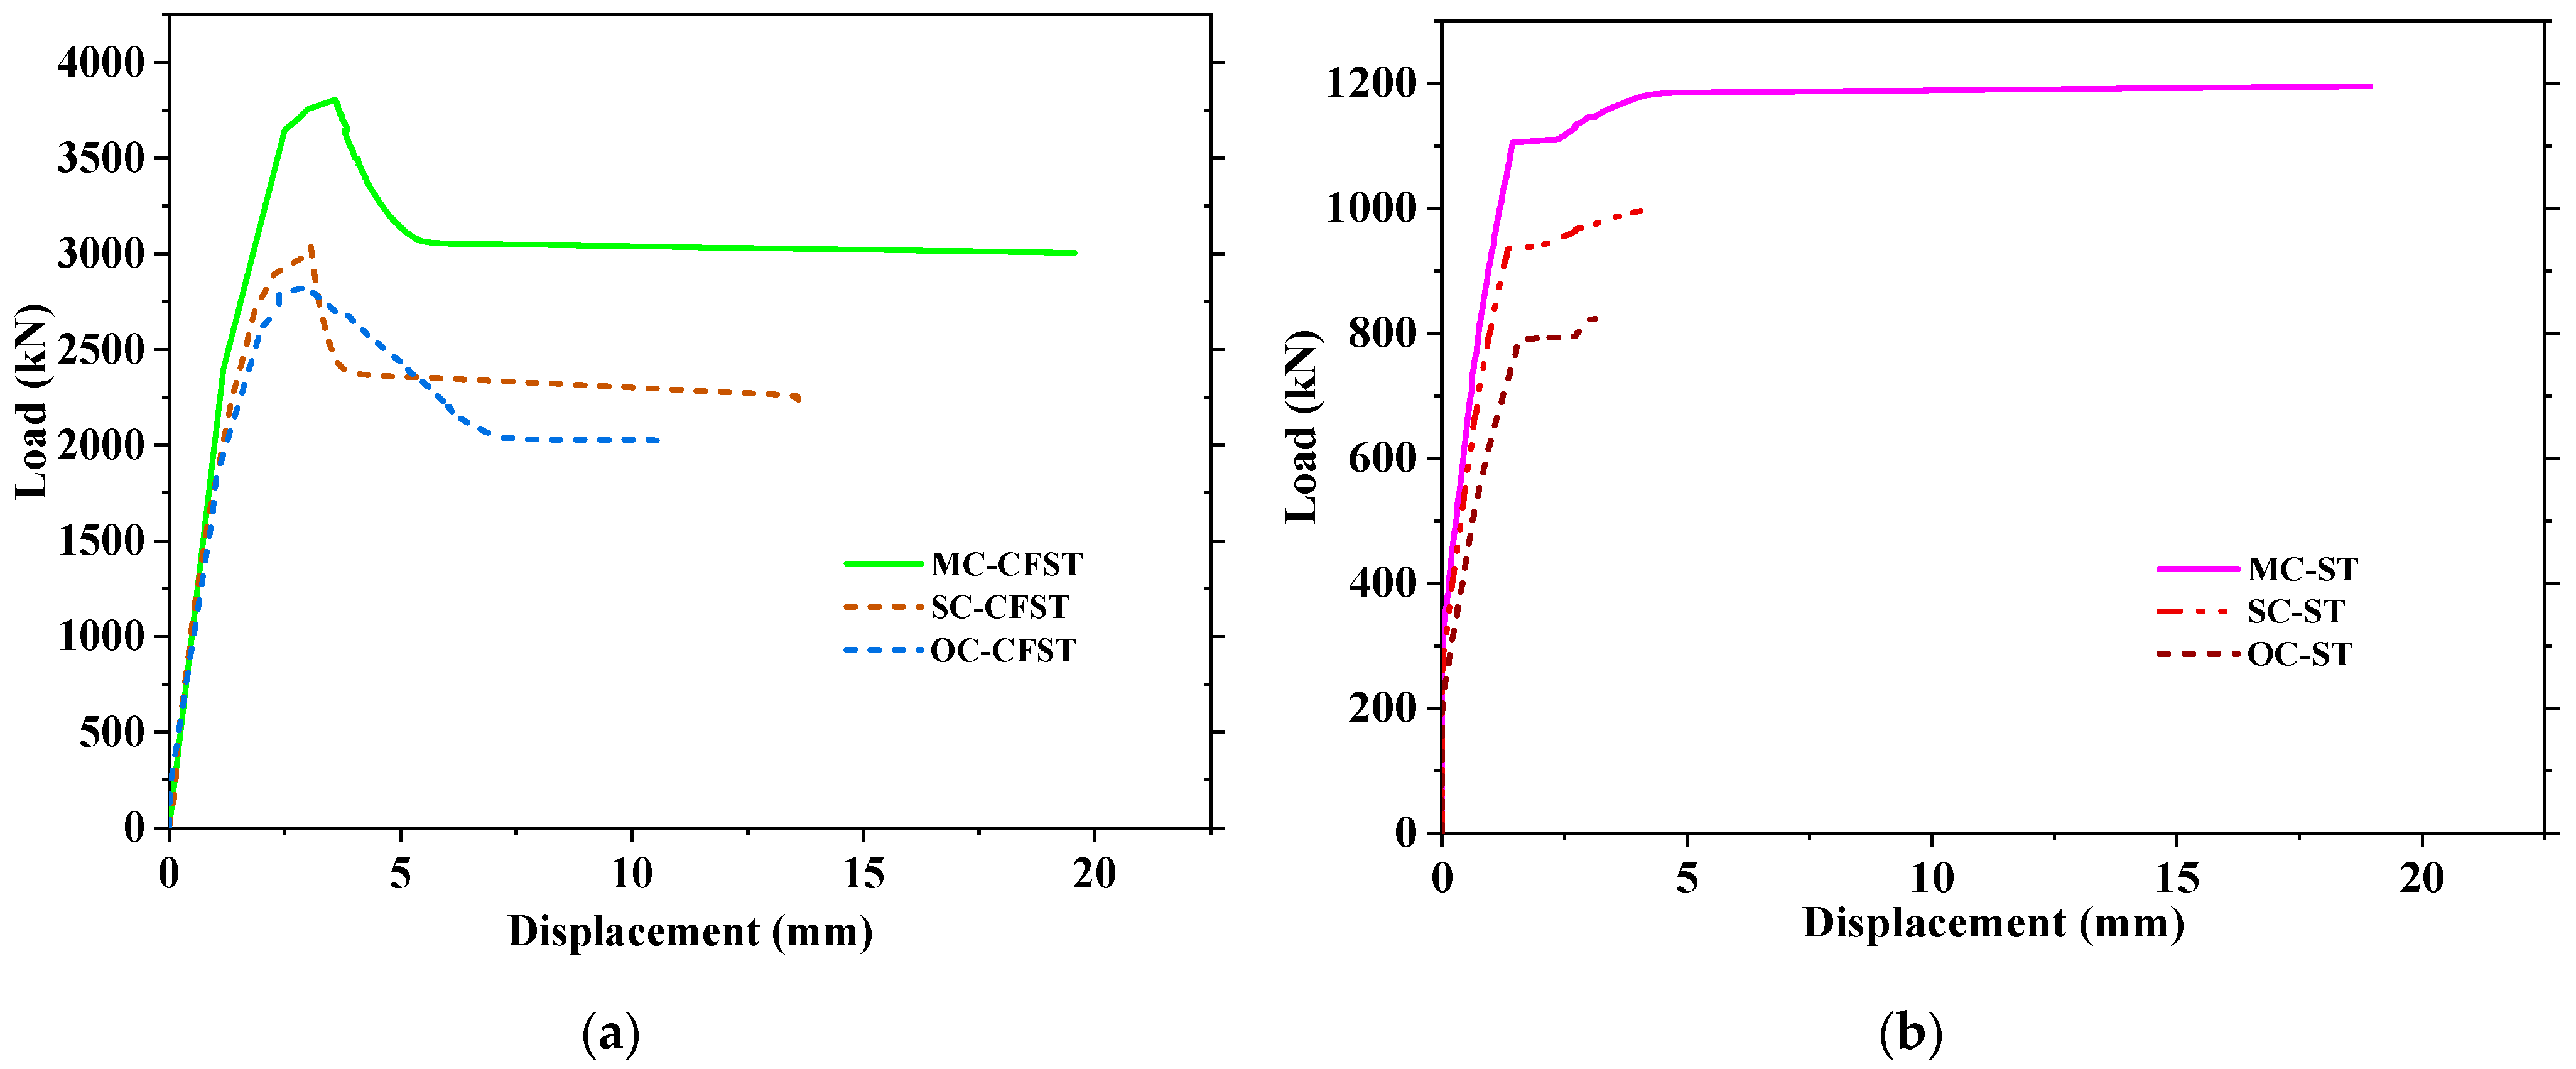
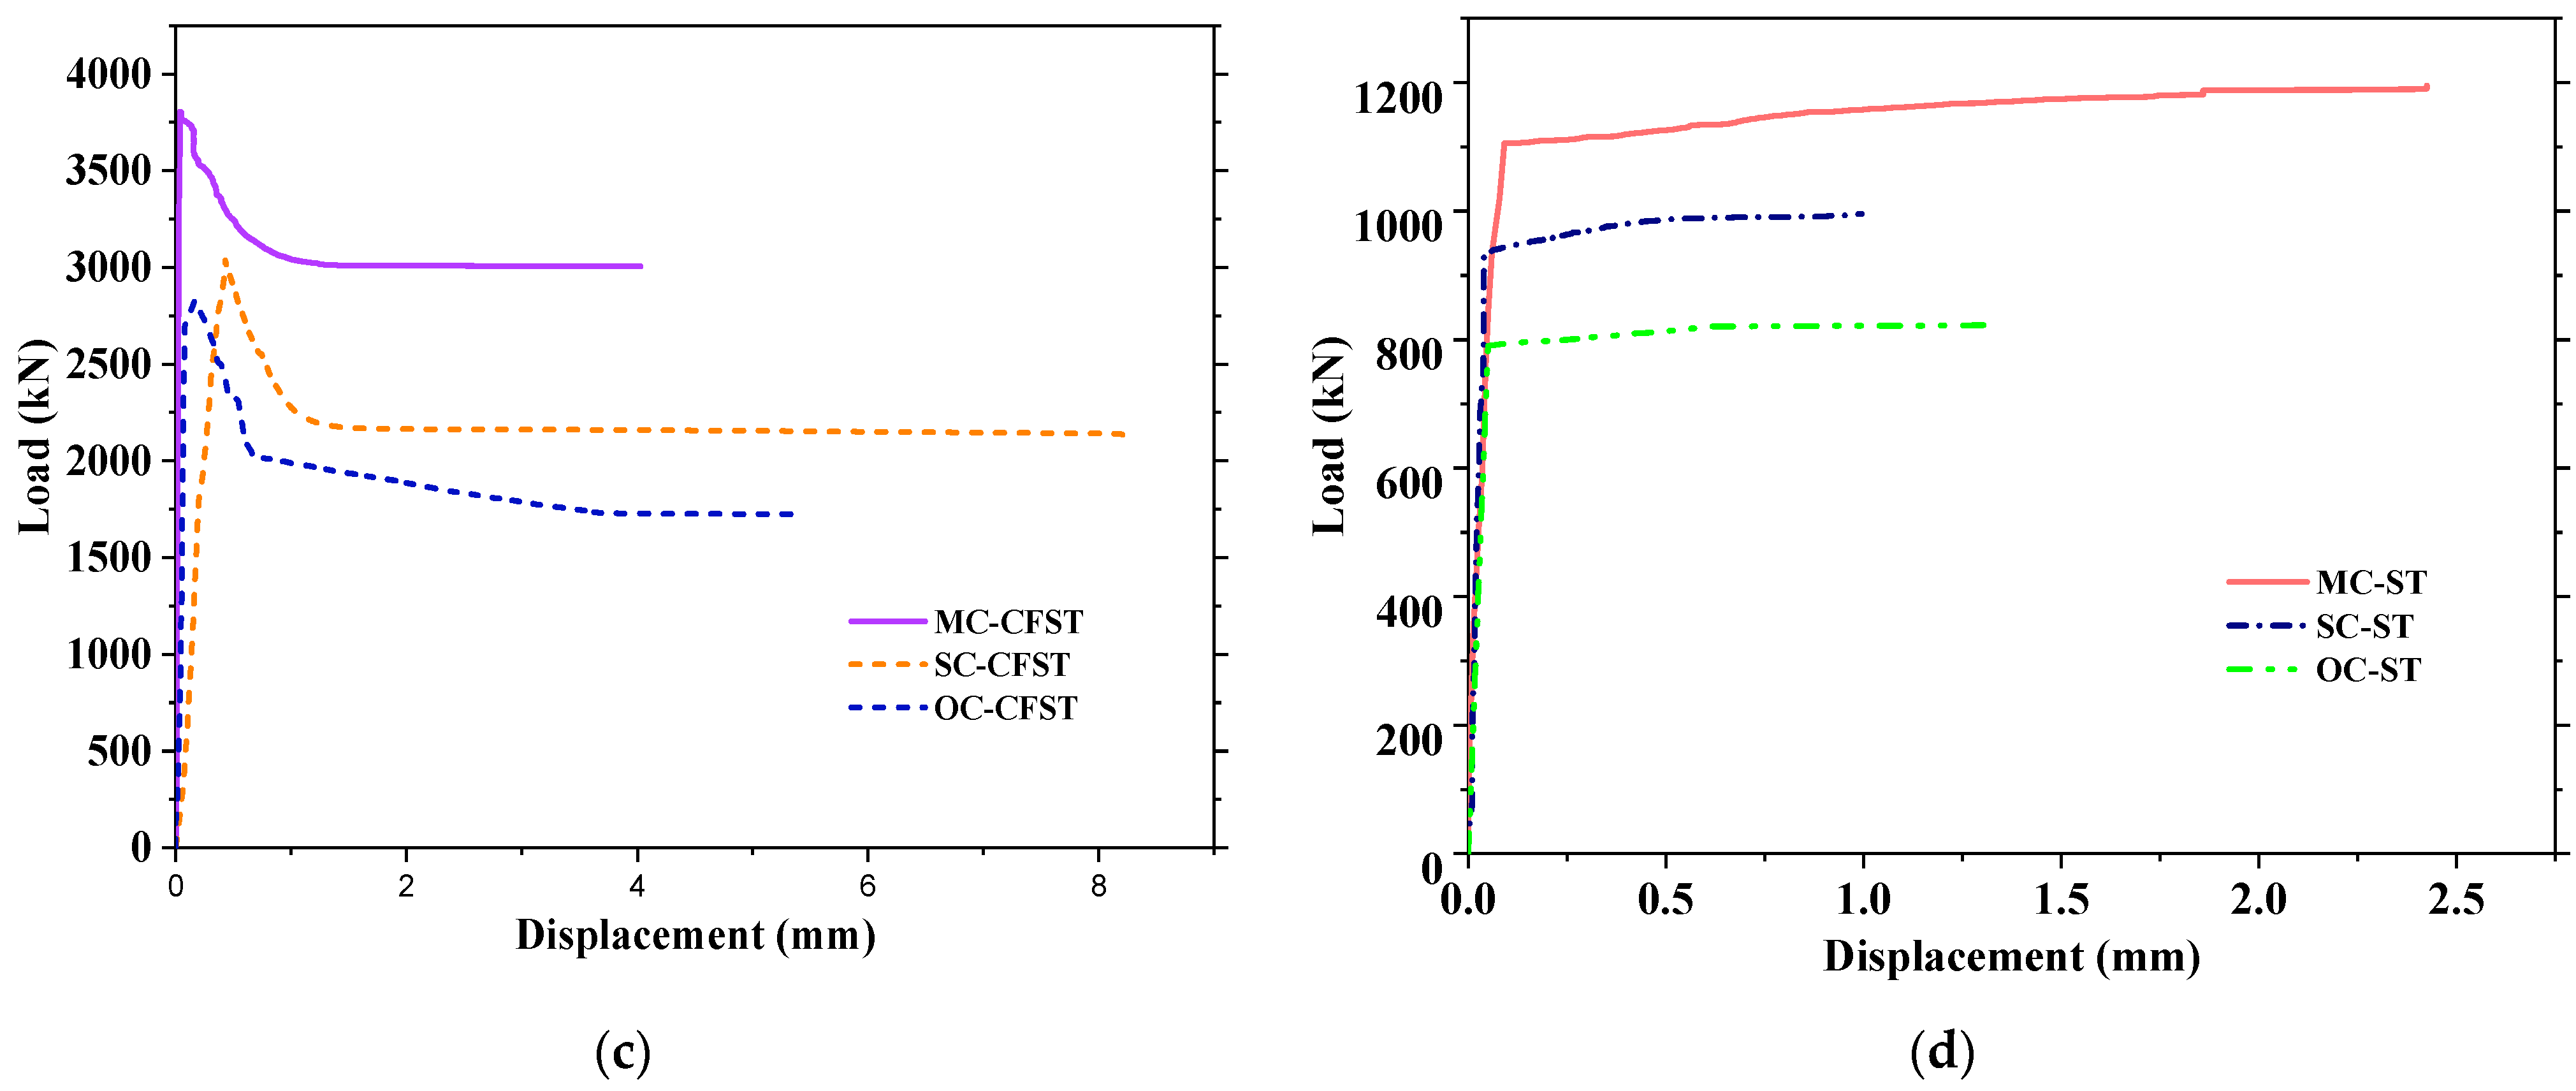
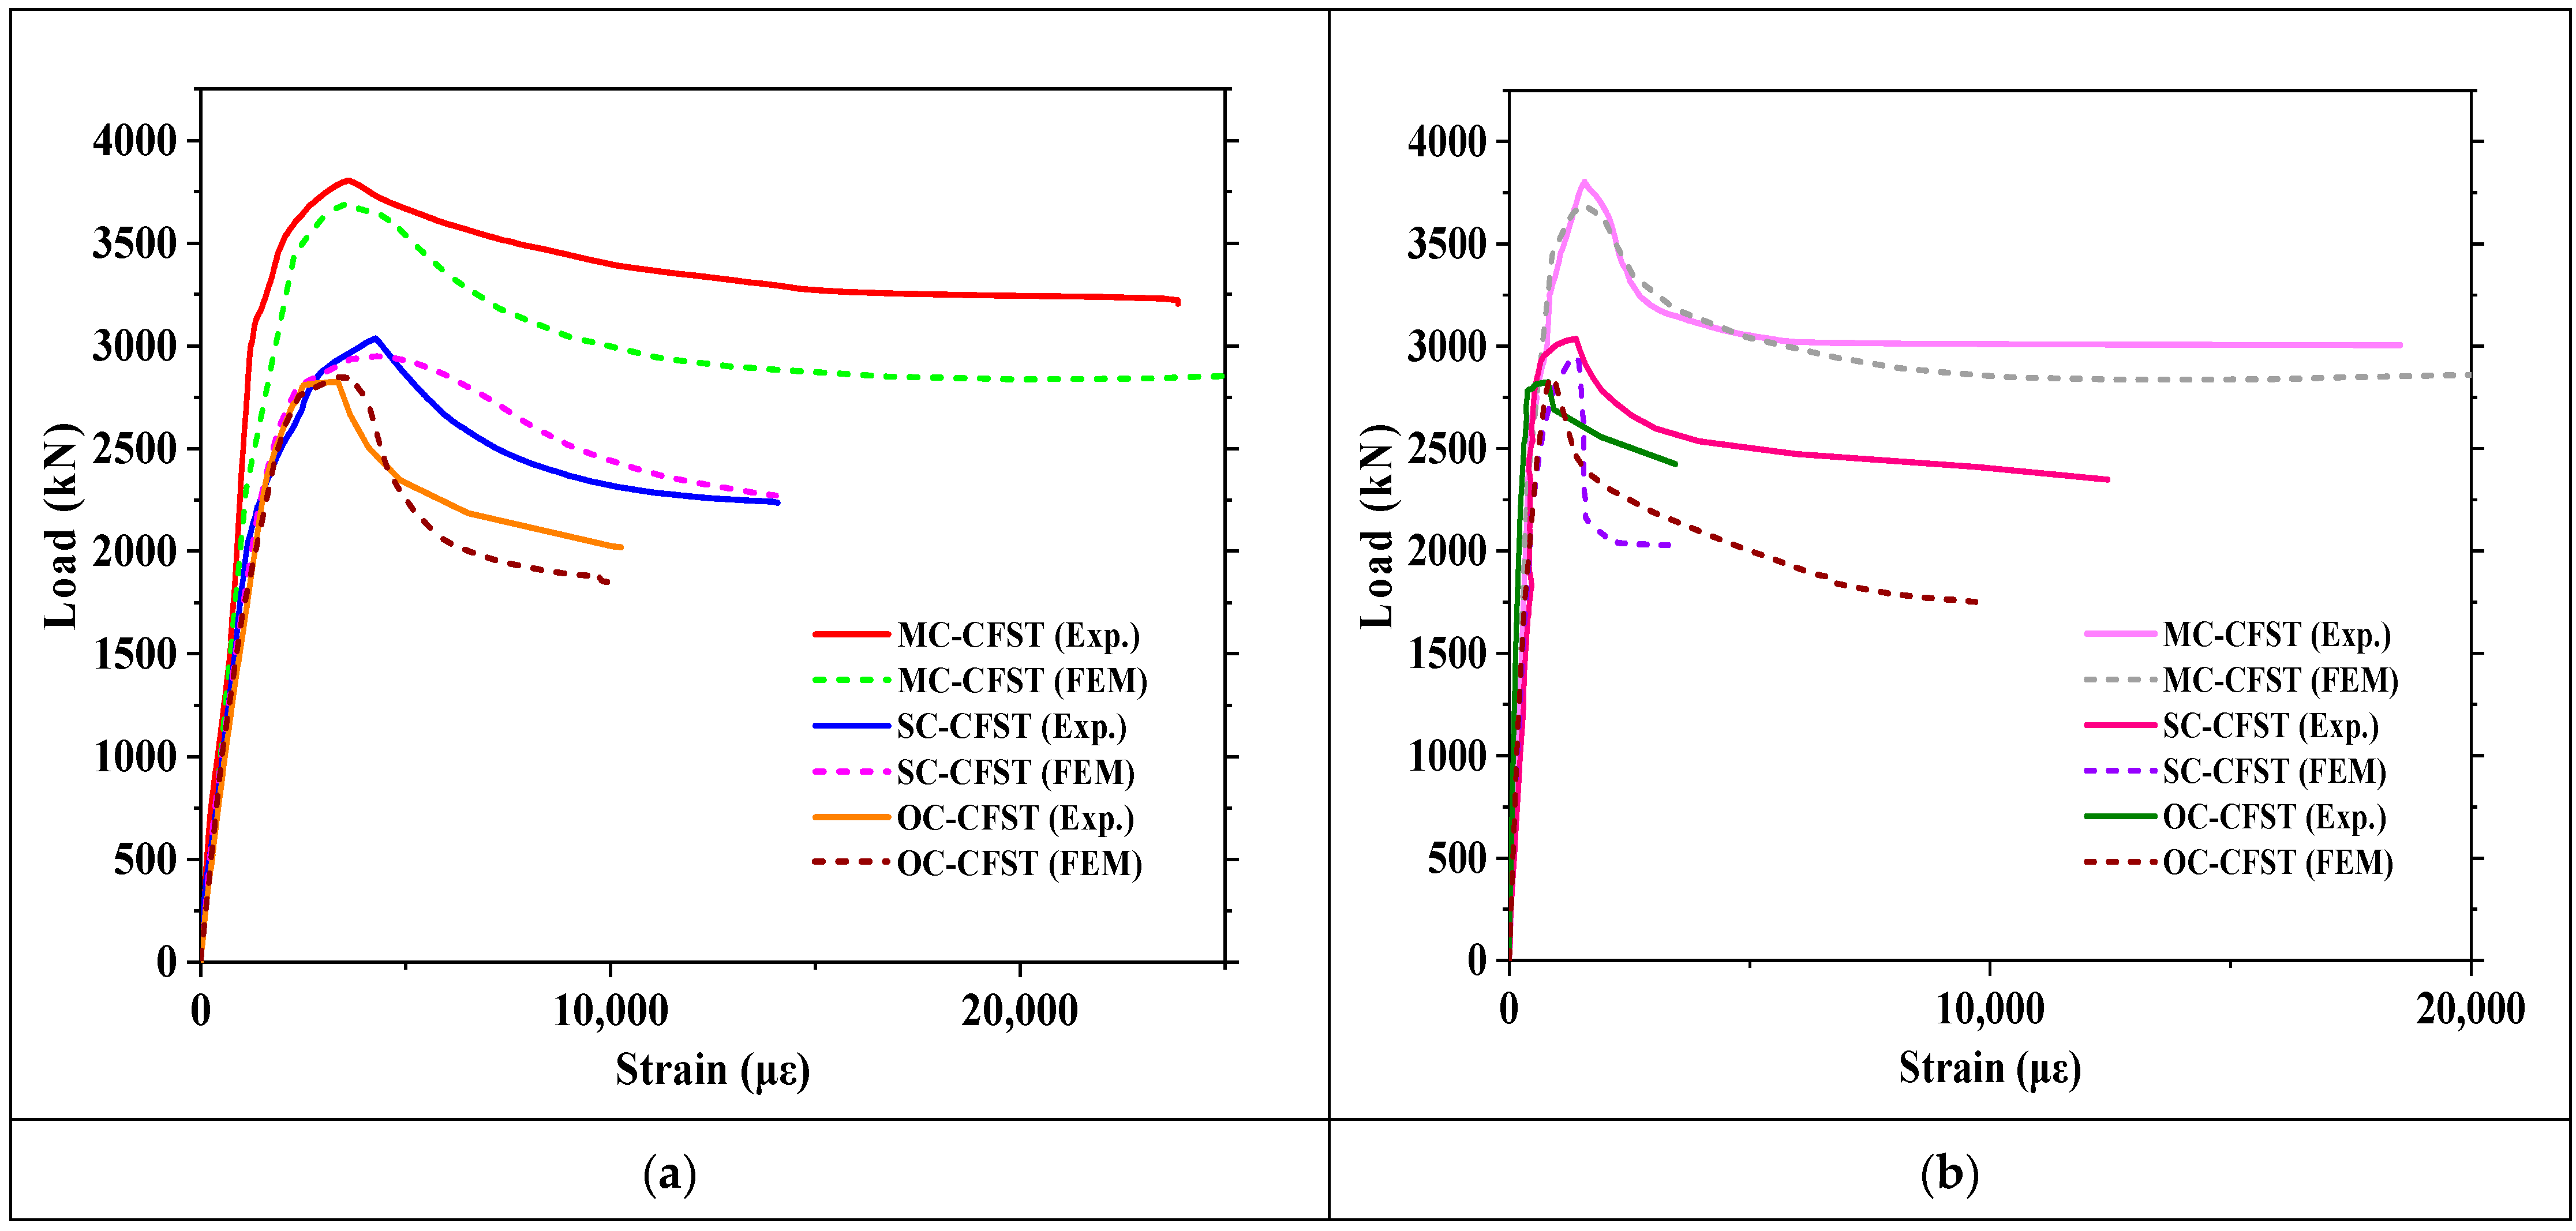
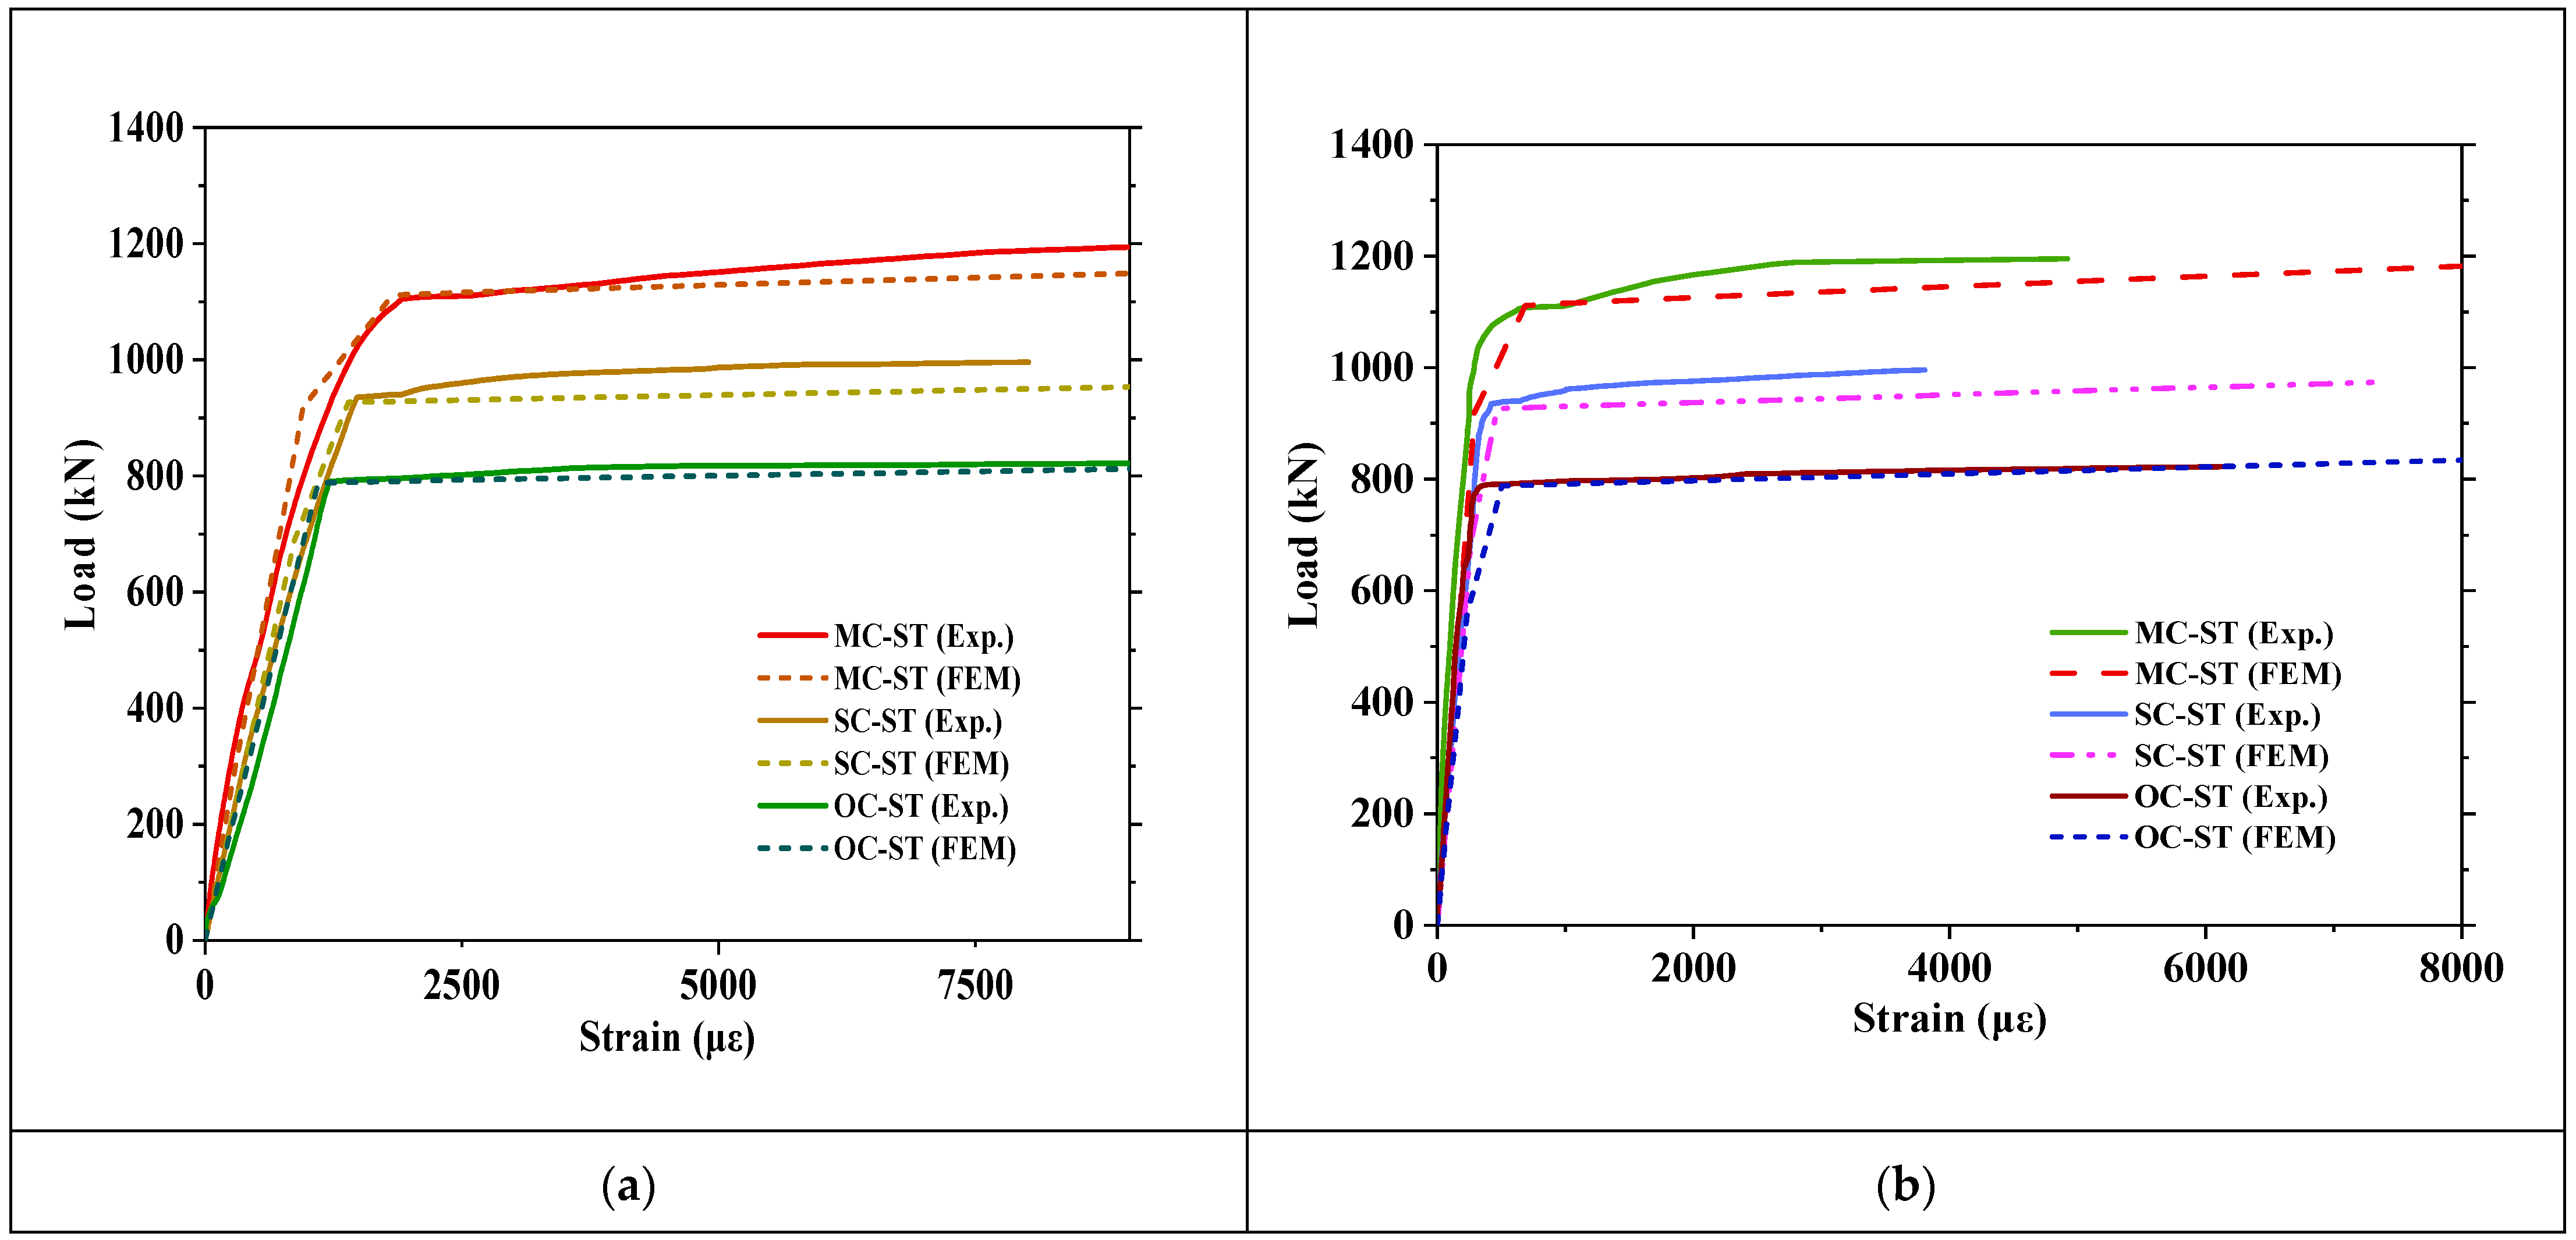
3.2. Axial Load–Displacement Relationship

To examine the specimens MC-CFST, SC-CFST, and OC-CFTS, the ultimate load-bearing capacity and ductility were improved in specimen MC-CFST compared to SC-CFST and OC-CFST. On the other hand, SC-CFST’s ultimate loading capacity is better than ha of OC-CFST, as illustrated in Figure 8a,c.
Table 3 shows the ultimate loading capacities (NEmax) of cross-shaped CFST and ST group columns that are compressed axially. As shown in Figure 8b,d, when comparing the specimens MC-ST, SC-ST, and OC-ST, the specimen MC-ST had enhanced load-carrying capacity. Due to the inner cross-sectional difference, the SC-ST and OC-ST specimens’ loading capacities were lower than those of the MC-ST specimen. Compared to cross-sectional changes, MC-CFST and MC-ST specimen capacity improved by 22.48% and 18.26% more than SC-CFST and SC-ST specimens, respectively. On the other side, SC-CFST and SC-ST specimens improved by 7.23%, and 19.04% more than OC-CFST and OC-ST specimens. The confinement factor benefit for infilled concrete, provided by the steel tubes, prevented potential local buckling of the steel tube and raised ductility. Due to the cross-sectional changes and increased steel ratio in the MC-CFST and MC-ST specimens, the steel tubes played a significant role in the ultimate loading capacity and the outside swelling of the steel surface. The confinement effect for infilled concrete provided by the steel tubes prevents potential local buckling of the tube and improves ductility. All CFST columns perform better than ST columns; CFST columns have shown an almost three times batter performance.

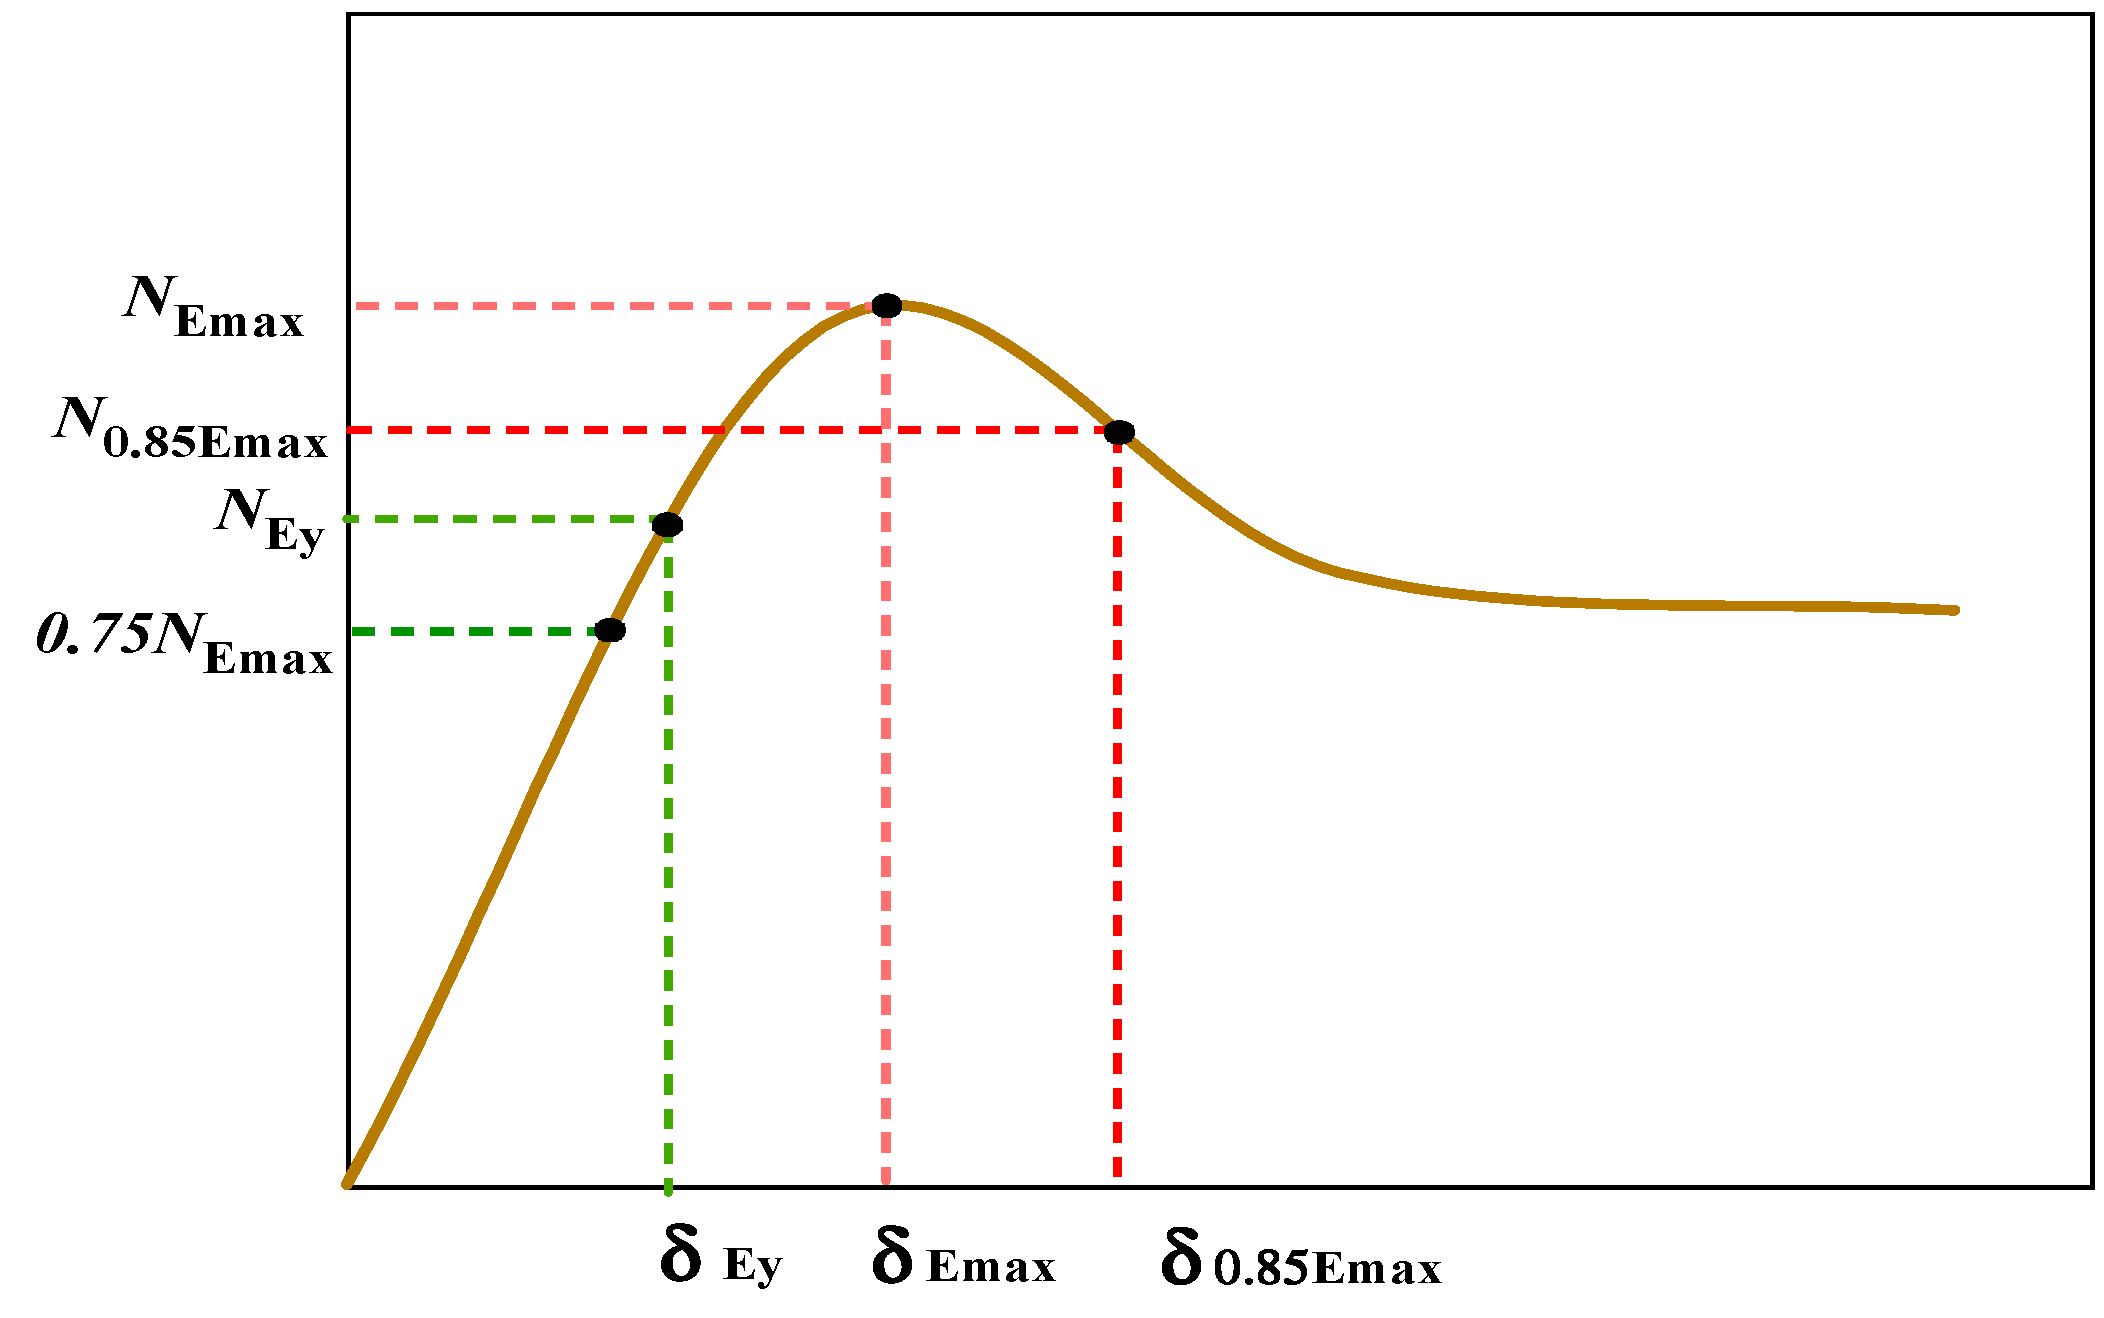
3.3. Ductility Index

According to the geometric graphic approach, as illustrated in Figure 9, some loading and Vertical displacement highlighted position, such as the yielding experimental location (NEy, δEy), ultimate experimental place (NEmax, δEmax), 0.85% dropped location (N0.85Emax, δ0.85Emax) [34,35,36]. A member’s ability to resist significant plastic deformation without a noticeable loss of strength is referred to as mechanical ductility. In order to create the ductility index (η), the ratio of the compressive strain must be equal to the residual load-bearing capacity (average 0.85NEmax) of the strain, equivalent to NEmax, used,
η = ɛ 0.85 N Emax ɛ N Ey
There is a list of the determined ductility index (η) values in Table 4 as well. Although the increase was relatively small, η improved when the confinement increased; due to the decrease in confinement, OC-CFST had a lower value.

4. Numerical Model Analysis

4.1. Type of Elements

A three-dimensional (3D) FEM model was created in the ABAQUS application to more closely research the impact of different parameters on the axial bearing capacity of the cross-shaped CFST and ST column specimens. Both steel tube and core concrete were modeled by solid 8-node model variant (C3DR), and the loading cover plate had a stiff body.

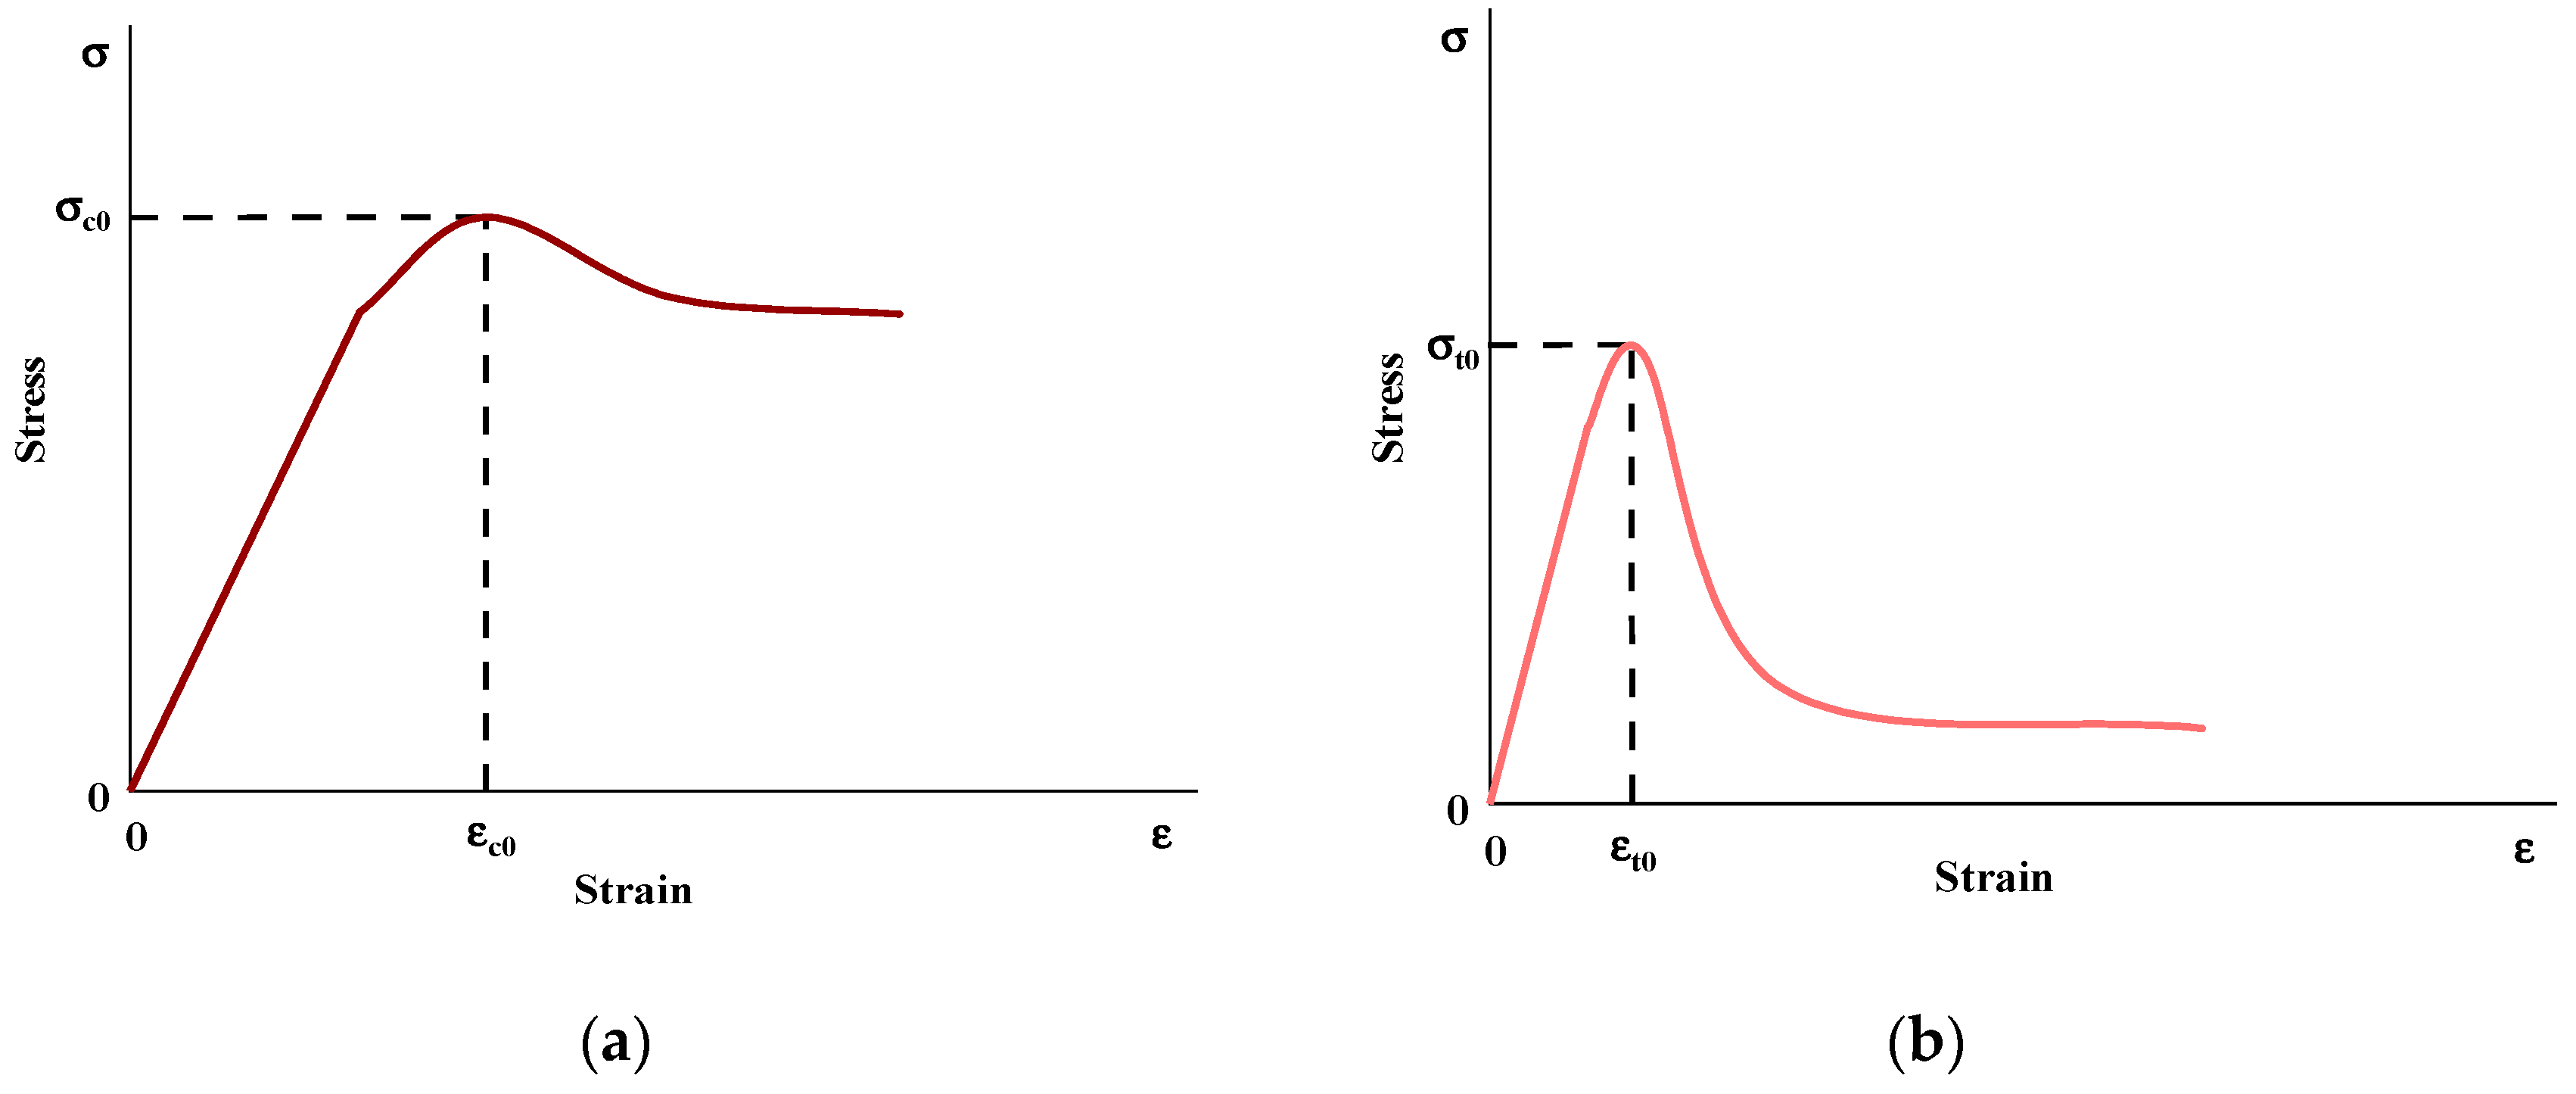
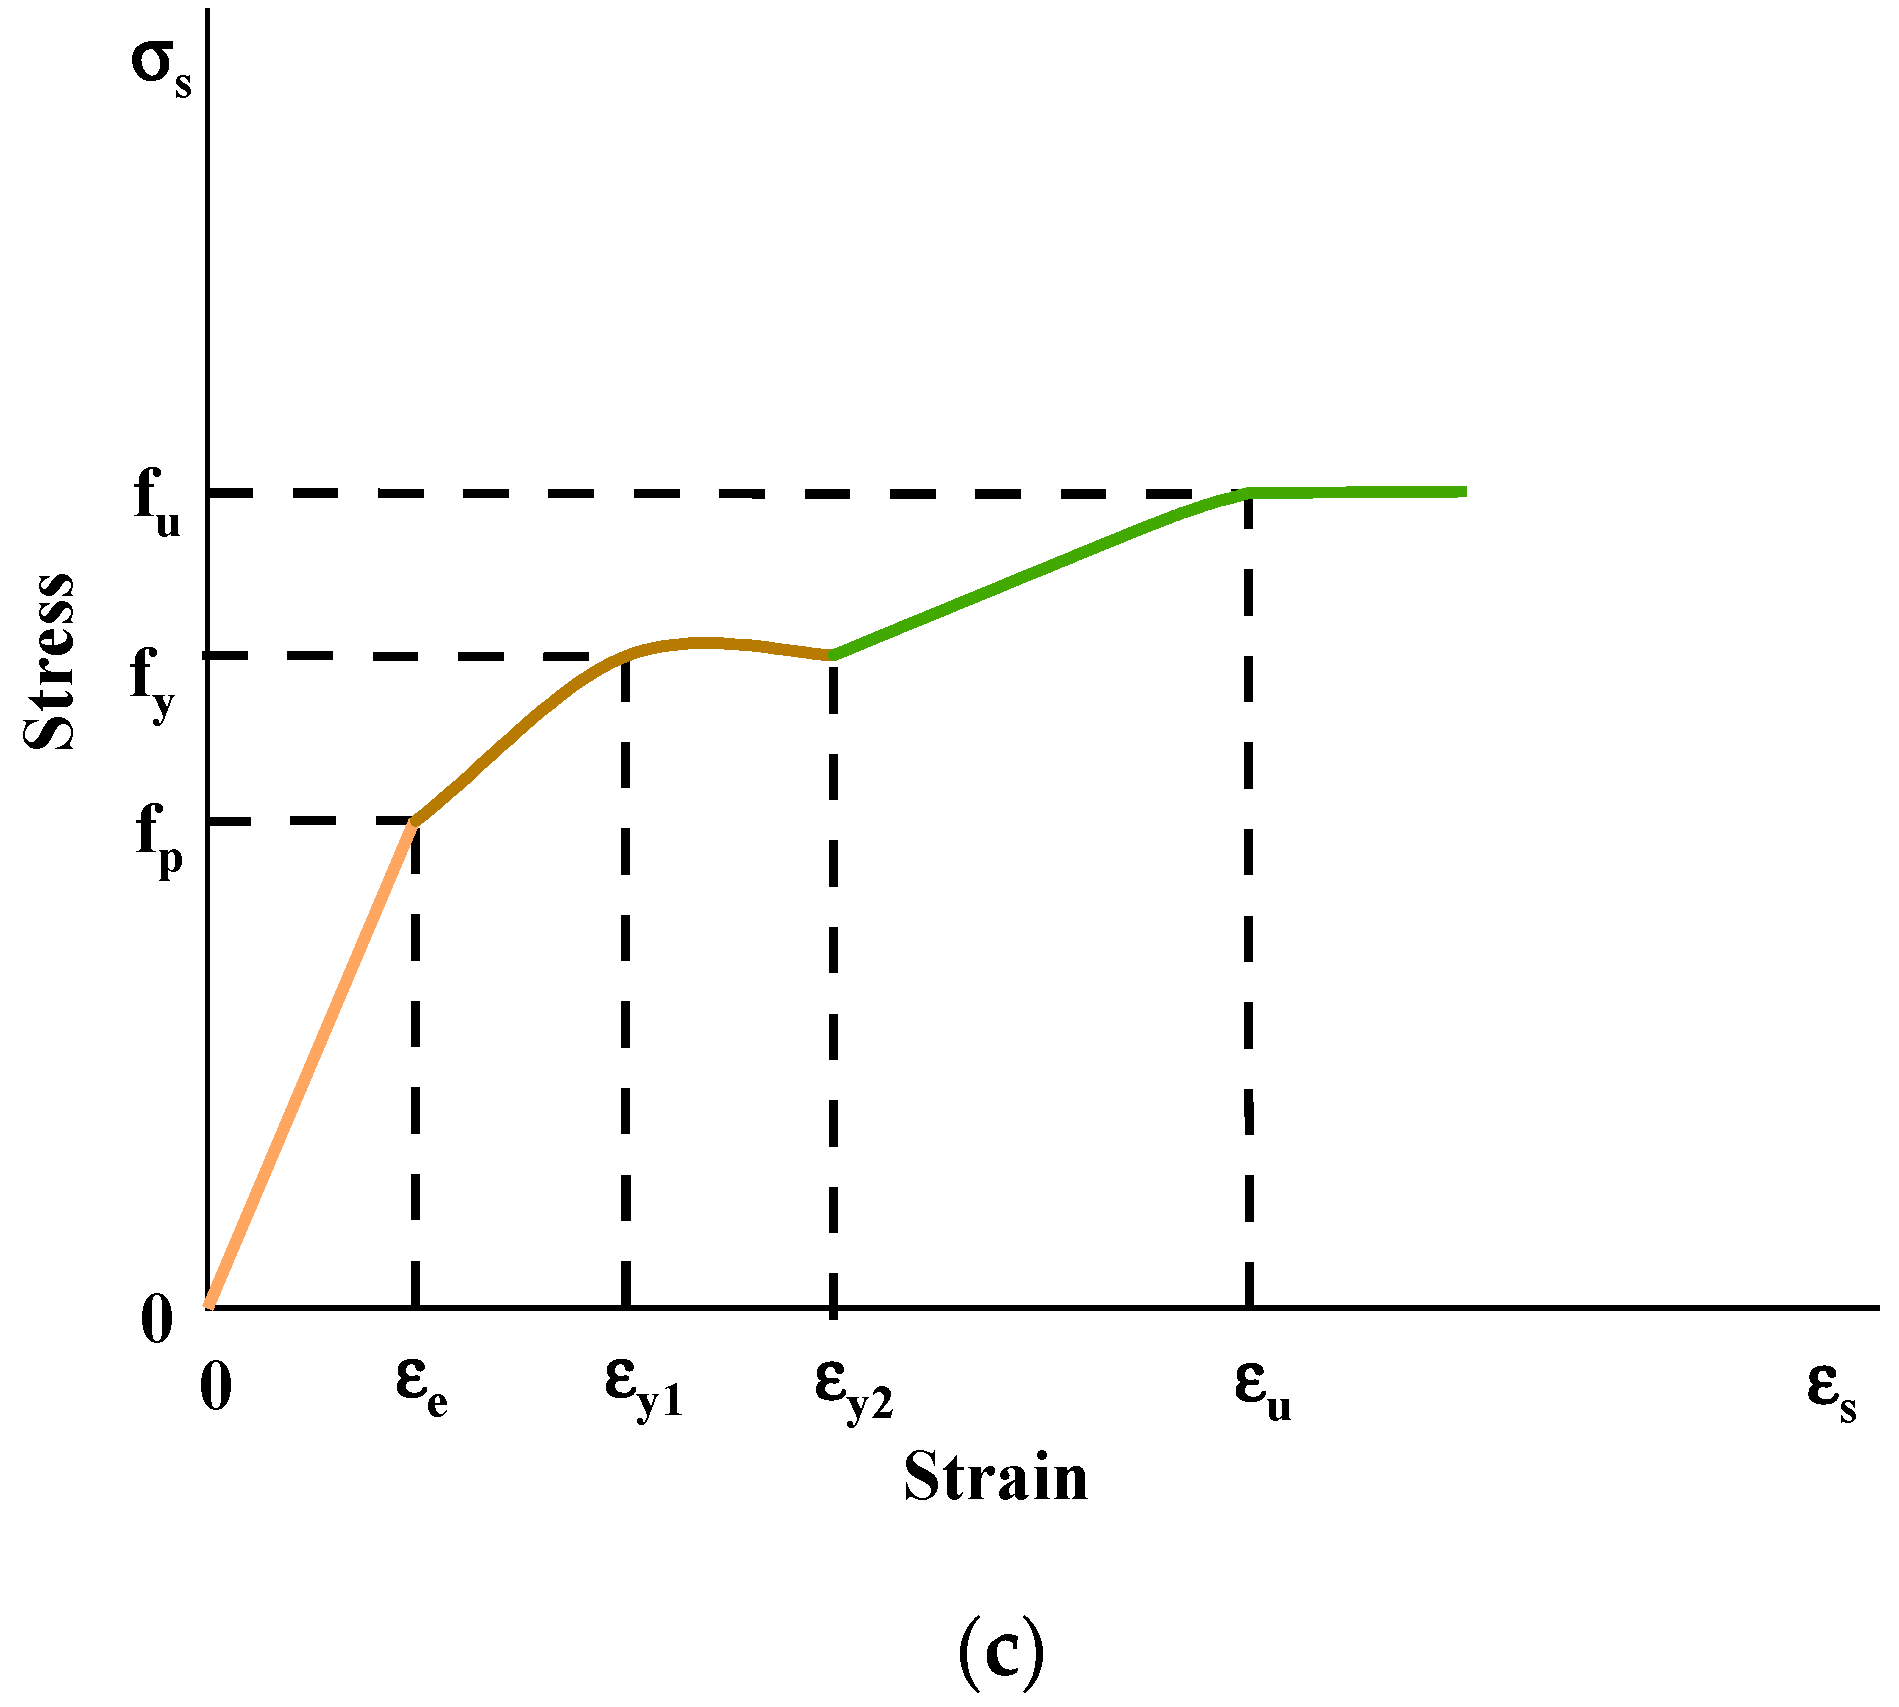
4.2. Materials, Interaction, Boundary Condition, and Meshing

In the steel stress–strain relationship graph, that graph separated into five stages: the elastic stage; the elastic–plastic step; the plastic stage; the strengthening stage; and the second plastic flow stage, as illustrated in Figure 10c, and the equation that describe the related theoretical expression is presented below [37].
σ s = E s ε s   ε s ε e A ε s 2 + B s ε s + C   ε e < ε s ε y 1 f y 1 + 0.6 ε s ε y 2 ε u ε y 2   ε y 2 < ε s ε u 1.6 f y   ε s > ε u
Here,
ε c = 0.8 f y E s ,   ε y 1 = 1.5 ε e ,   ε y 2 = 10 ε y 1 ,   ε u = 10 ε y 2 ,   A = 0.2 f y ε y 1 ε e 2 ,   B = 2 A ε y 1 ,   C = 0.8 f y + A ε e 2 B ε e
where σs, εs represent the Steel stress and strain, respectively, Figure 10a,b demonstrate the model suggested in the standard for the design of concrete structures [37,38]. The theoretical statement is as follows:
y = 2 x x 2   ,   x 1 x β 0 x 1 η + x   ,   x > 1
x = ε ε 0   ,   y = σ σ c 0 ,   σ co = f c ,   f c = 0.76 f cu ,   ε co = ε c + 800 ξ 0.2 × 10 6
ε c = 1300 + 12.5 f c × 10 6 ,   η = 1.6 + 1.5 x ,   β 0 = f c 0.1 0.2 1 + ξ ,   ξ = f y A s f ck A c
Here,
  • σ c 0   —Compressive stress and strain relationship of the ultimate stress;
  • ε c 0   —The ultimate strain of the compressive stress and strain relationship;
  • f c   ,   f ck   ,   f cu   —Compressive strength of concrete cylinders, and cube;
  • A s   ,   A c   —The cross-sectional area of the steel tube and the concrete in the core area;
y = 1.2 x 0.2 x 6   ,   x 1 x α t x 1 1.7 + x   ,   x > 1
x = ε ε t 0   ,   y = σ σ t 0 ,   σ to = 0.26 f cu 2 / 3 ,   ε to = 65 × 10 6 × σ t 0 0.54 ,   ε to = 65 × 10 6 × σ t 0 0.54
Here
  • σ t 0   —The ultimate stress of the tensile stress and strain relationship;
  • ε t 0   —The ultimate strain of the tensile stress and strain relationship;
The material plasticity parameter was chosen, as illustrated in Table 5. Surface-to-surface contact establishes the interface between the concrete and the steel tube. The slave and enslaver surface, respectively, correspond to the interior side of the steel plant and the outer faces of the core concrete plan. The definitions of hard contact and penalty friction were used to characterize normal and tangential contact, respectively. Based on earlier studies, the friction coefficient was expected to be 0.3 [39].
The two end sides of the cross-shaped CFST and ST columns were given two reference points: the top and bottom. The boundary conditions were implemented using the experiment circumstances as a guide. The top was subjected to loading by using displacement control models. The tie function applied rigid constraints between the top and bottom surfaces and corresponding reference points. End plates were not used in the studies since the end faces were uniform due to strict constraints. The element sizes used for meshing were all 20 mm through the cross-section.

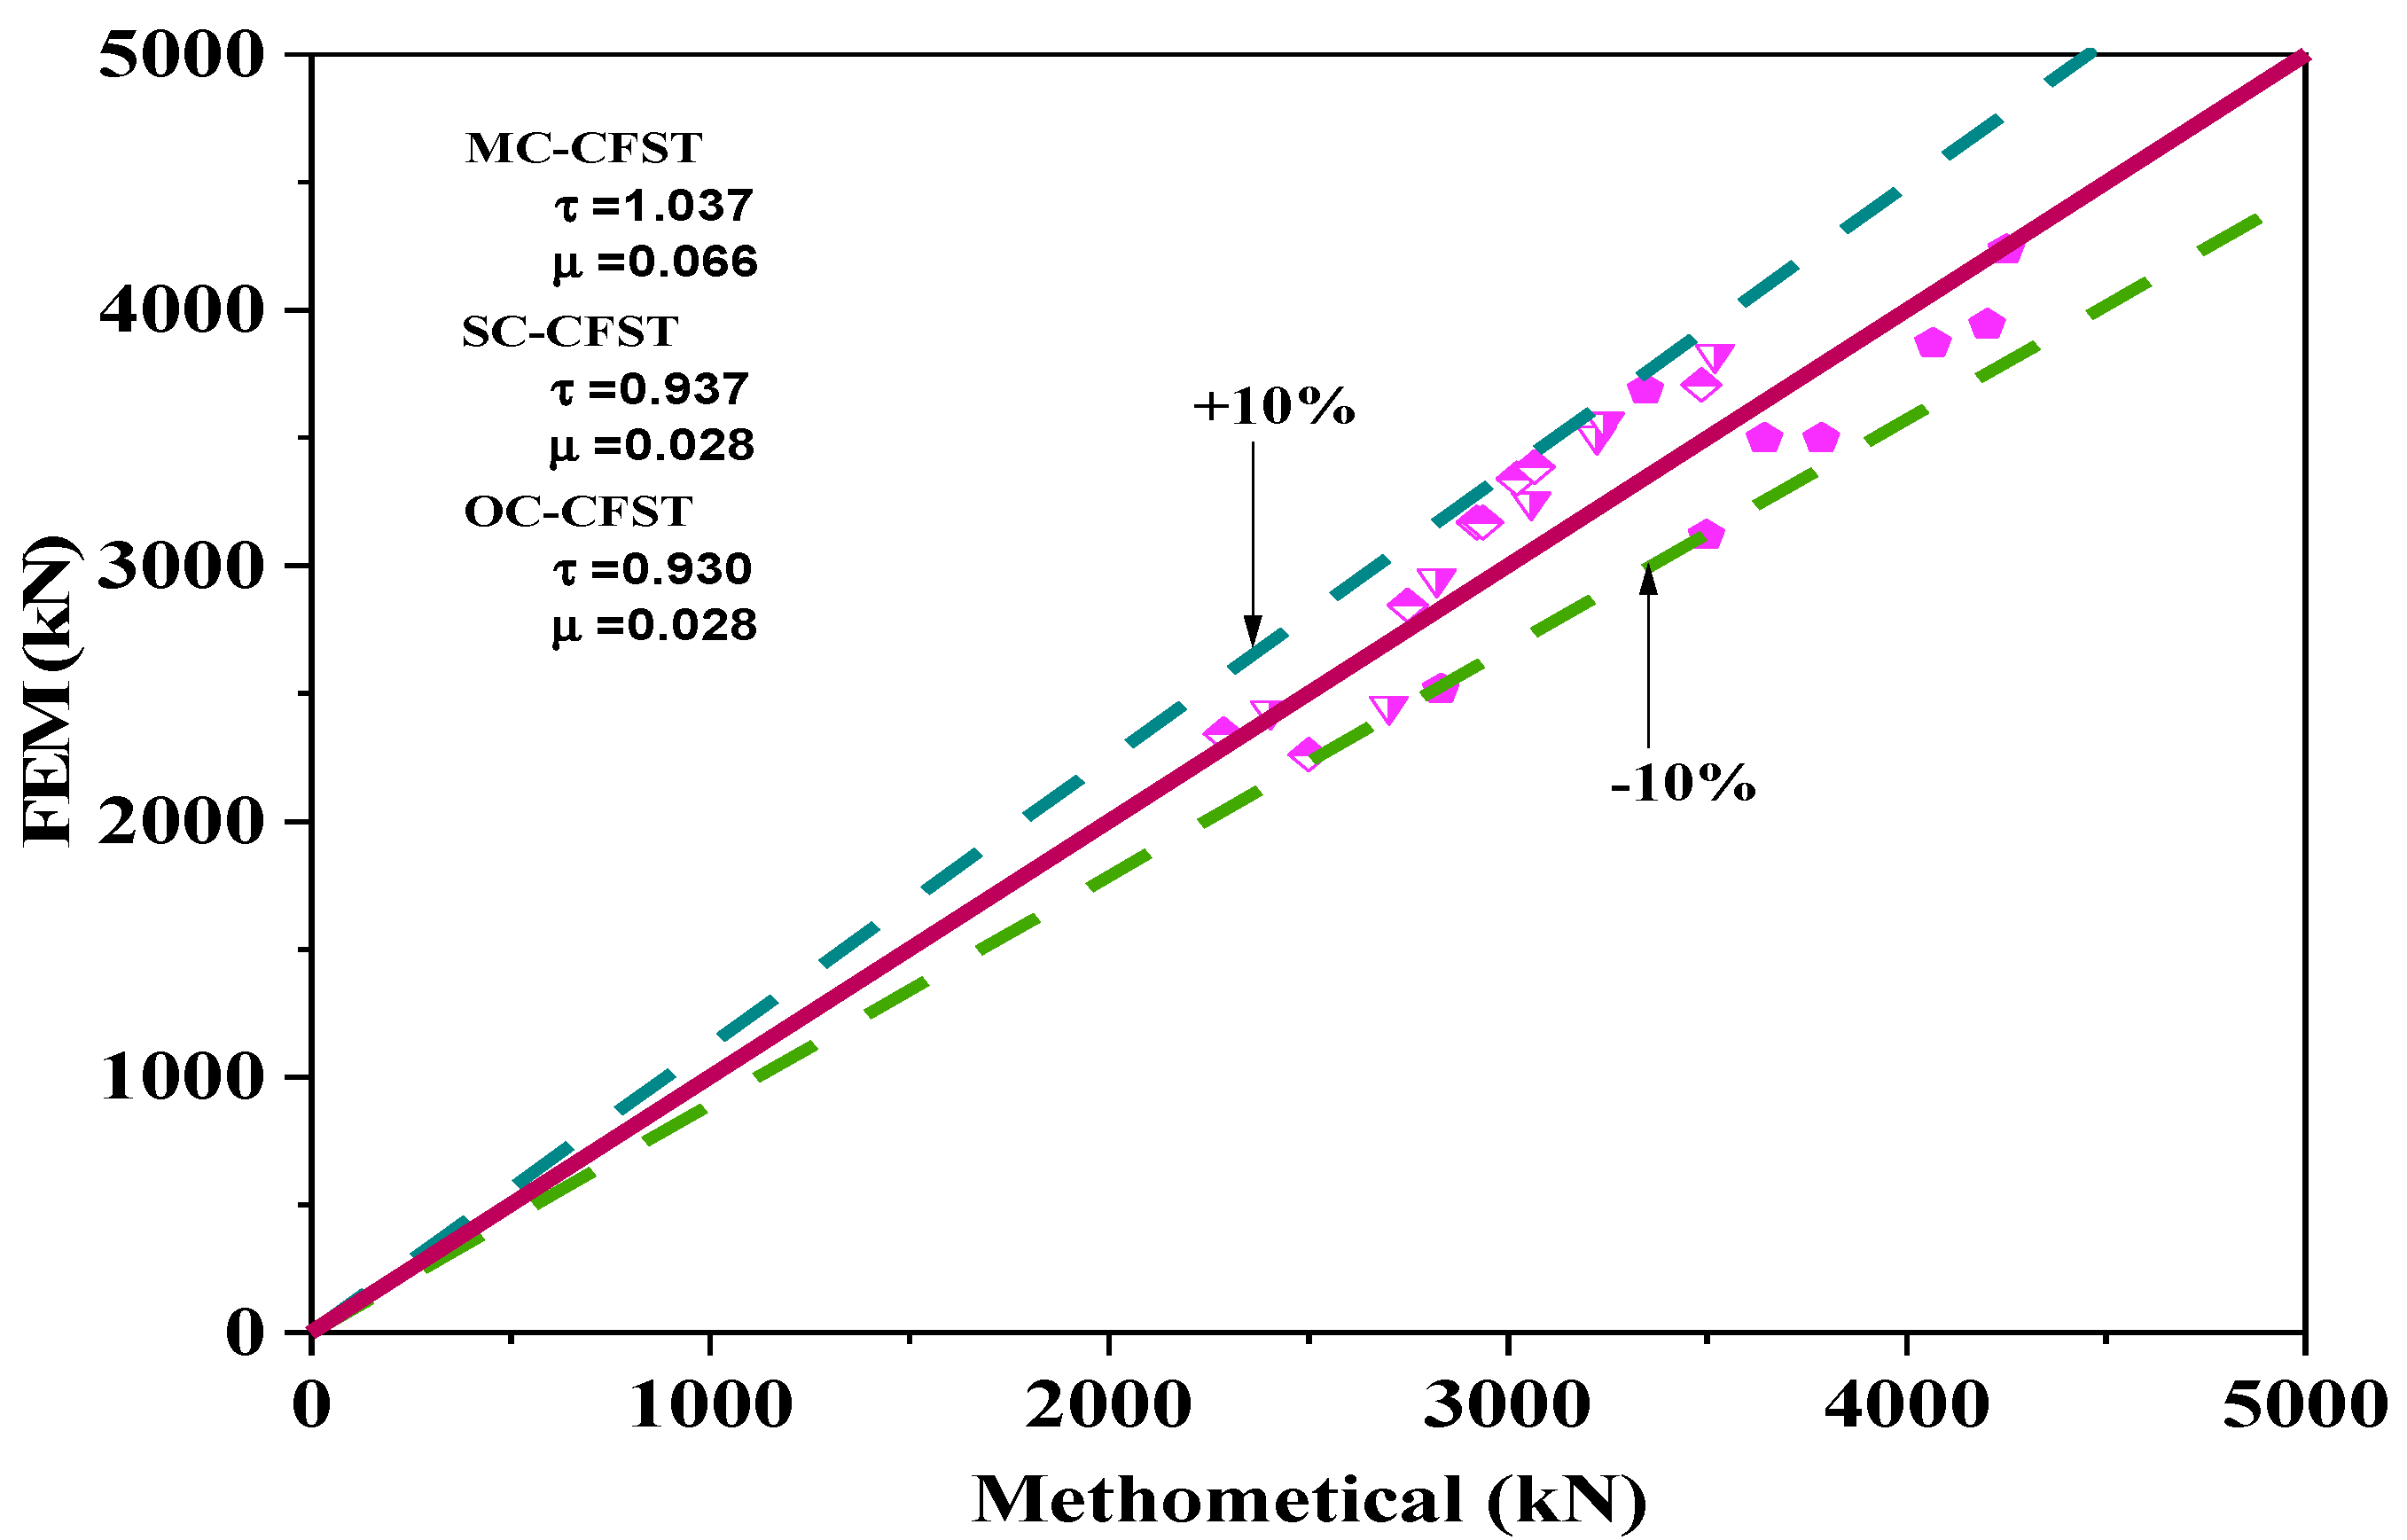
4.3. FEM Model Verification

In Table 4, the ultimate load NEmax from the experiment is compared with the maximum load NFEM from the FEM. The two groups of results are harmonious, and NFEM has an average percentage (AVP) value of 0.99; this average error percentage (AVE) is 0.01. Figure 11 and Figure 12 display a comparison between the experimental and FEM simulation results of the failure characteristics of the MC-CFST, SC-CFST, OC-CFST, MC-ST, SC-ST, and OC-ST specimens. Figure 11 shows that the two kinds of buckling for MC-CFST and SC-CFST specimen include outward and local buckling, but OC-CFST just has outward buckling. In the ST specimen all local buckling in the upper area of the specimen as illustrated Figure 12. As can be observed, the FEM simulation failure pattern was essentially consistent with the experimental pattern. In the experiments on cross-shaped CFST and cross-shaped ST specimens, the axial load–vertical and –lateral strain graphs generated from the FEM were compared in Figure 13 and Figure 14.
It can be seen that the FEM strains match the experiment results in the elastic stage; the load–strain graphs are almost identical. The FEM and experiment load–strain graphs are not entirely as accurate for all specimens but are still close in the elastic–plastic and failure stages. This comparison further confirms the accuracy of the FEM. It is possible to say that the axial compression properties of the cross-shaped CFST and cross-shaped ST column specimens can be accurately reflected by the FEM simulation model developed in this research.

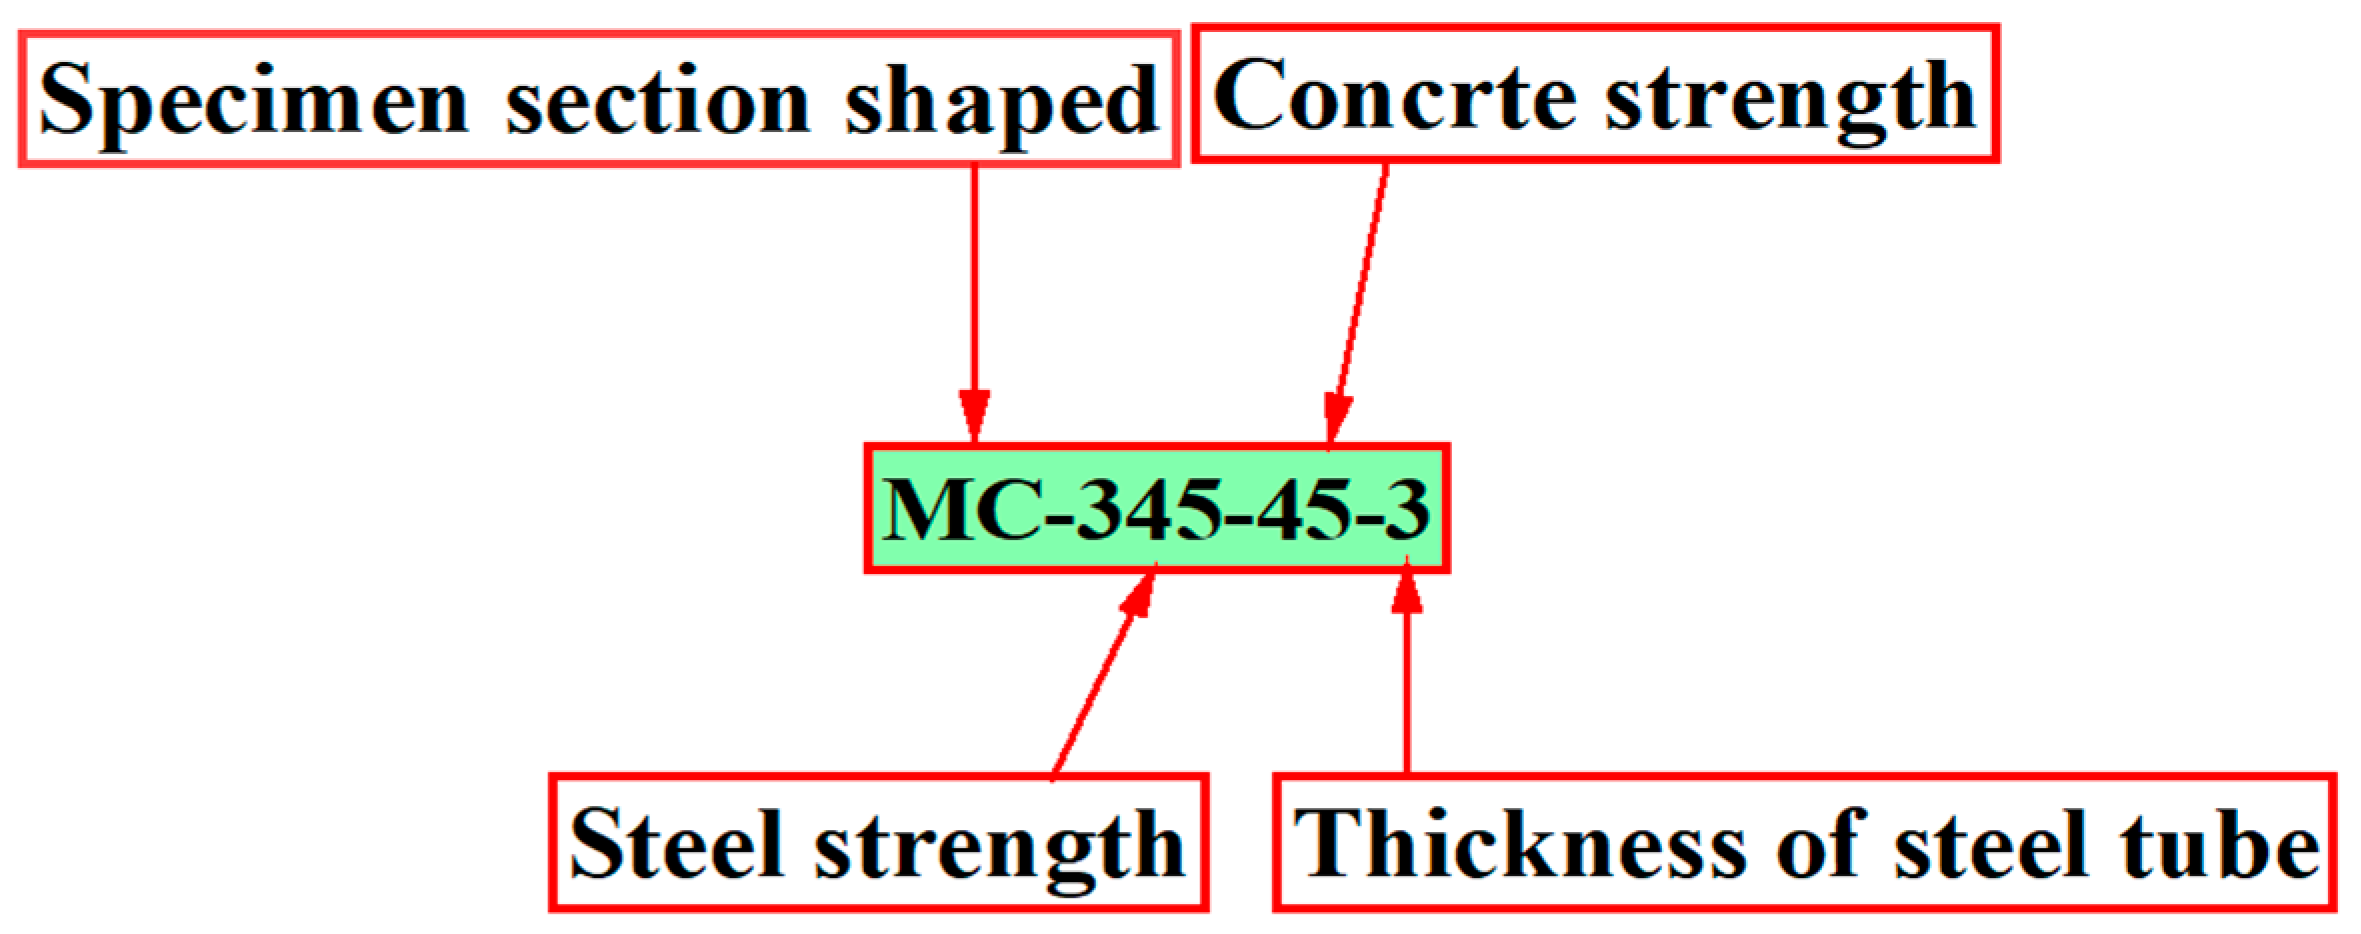
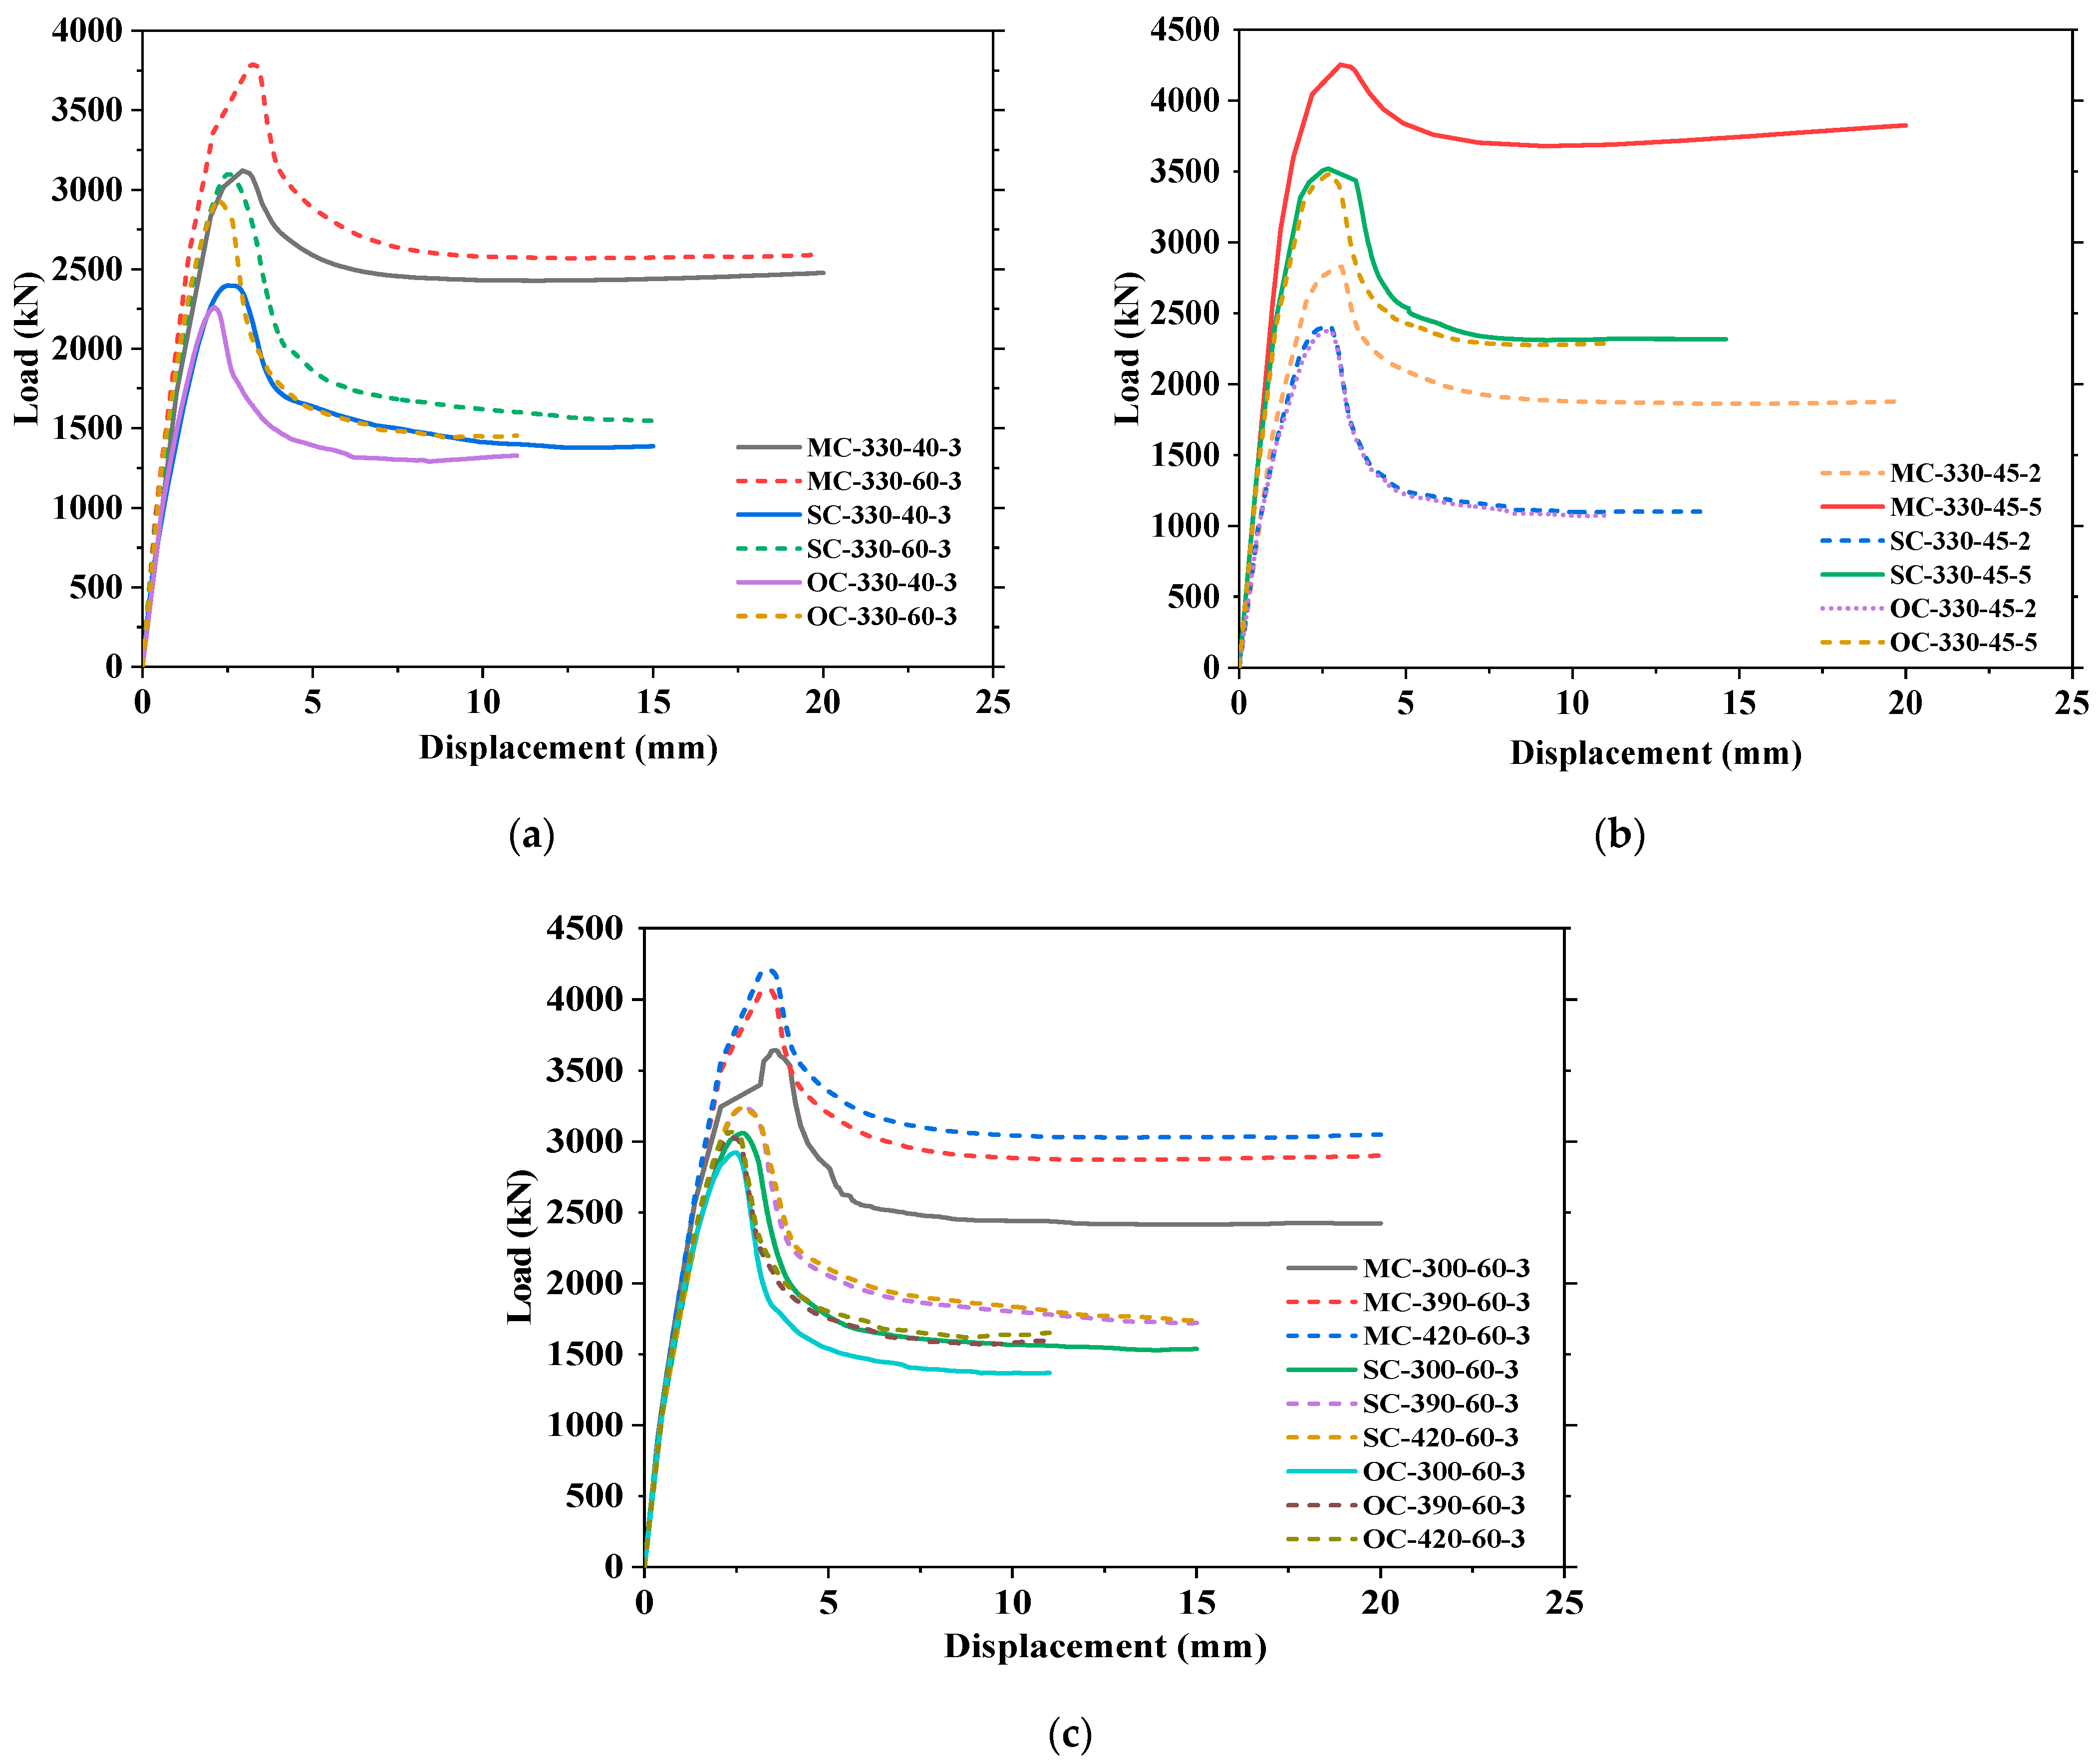
4.4. Parametric Analysis of CFST Columns

The parametric analysis investigates the impact of the steel tube thickness (t), steel yield strength (fy), and concrete strength (fcu), on the mechanical performance of cross-shaped CFST column specimens. Table 6 shows the chosen mechanical performance for parametric analysis. Figure 15 illustrates the specimen numbering guidelines for the parameter analysis.

4.4.1. Impact of Concrete Strength

As illustrated in Figure 16a, the impacts of concrete strength on the axial load–vertical displacement graphs for MC-CFST, SC-CFST, and OC-CFST columns were evaluated. The chart matches up during the initial phase, showing that altering the concrete’s strength minimizes the initial compression flexibility. The load-bearing capacity seems to rise as concrete strength rises until it reaches the ultimate stage. High-strength concrete displays a faster reduction in load-bearing capacity during the failure stage, and low-strength concrete, compared to high-strength concrete, displays a slight decrease in load-bearing capacity. This is due to the steel tube’s fundamental role in supporting the load placed on the core of the crushed concrete.

4.4.2. Impact of Steel Thickness

The axial load–displacement graph of the MC-CFST, SC-CFST, and OC-CFST columns is shown as a function of steel tube thickness in Figure 16b. Based on thickness, the SC-CFST and OC-CFST column’s ultimate load is almost the same, but the MC-CFST column shows a very high maximum loading capacity. However, in initial loading, all columns show the same growth. Based on steel tube thickness in the failure phase, MC-CFST loading capacity decreases slowly compared to SC-CFST and OC-CFST. This happened because of the steel confinement factor. Better confinement factors showed better performance, but to reach the ultimate loading capacity, all CFST columns follow almost the same slope with the same thickness.

4.4.3. Impact of Steel Strength

Figure 16c illustrates the axial load—displacement graph for MC-CFST, SC-CFST, and OC-CFST columns of various steel strengths. The axial compression flexibility of all CFST specimens appears to be unaffected by changes in steel strength with the same cross-section. A more substantial restriction of the steel tube to the core concrete is suggested by higher steel strength. As all CFST specimens’ ultimate load-bearing capacity rises, the axial load–vertical displacement graph grows softer and softly reaches a point of failure.

5. Cross-Shaped CFST Column Calculation Method

A particular design standard cannot be used to directly calculate the axial ultimate load-bearing capacity of cross-shaped CFST columns. The CFST column’s load-bearing capacity is determined in Table 7, using the different standards, AIJ [40], GB50936-2014 [41], ACI and AS [42], EC-4 [43], and CECS-2004 [44], made for square and rectangular CFST columns. Table 7 shows Nus standards ultimate loading capacity of cross-shaped CFST columns and Ꞷ = NEmax/Nus.
Different standards have few errors to get accurate results, as shown in Table 7. In this research developed GB50936-2014 [41] formula to obtain the more precise ultimate loading capacity of cross-shaped CFST columns,
N u =   φ N 0
N0 is the CFST column design value under axial strength load that is calculated by
N 0 =   f sc A sc
f sc = 1.212 + θ B s + θ 2 C c f c
θ =   α sc f y f c
α sc = A s A c
B s = 0.131 × f y 213 + 0.723
C c = 0.070 × f c 14.4 + 0.026
φ is dependent on the confinement factor value, that is,
ξ 1.5 ,   φ = 0.95
ξ = 1.2 , ;   φ = 0.90 ;
ξ = 1 ,   φ = 0.85 ;
ξ 0.75 ;   φ = 0.80 ;
The section capacities were calculated using the developed mathematical Equation (5), applying representative models from the different parametric analyses. As demonstrated in Figure 17, there is a logical correlation between parametric and mathematical results and the mean (τ) and standard deviation (μ), which shows a better relationship between them.

6. Conclusions

An in-depth analysis of the structural behavior of MC-CFST, SC-CFST, OC-CFST, MC-ST, SC-ST, and OC-ST columns under axial compression is discussed in this study. The following is a list of the main findings from the research that is being presented:
  • The cross-shaped CFST showed more significant load-carrying capacity than cross-shaped ST columns. The cross-shaped columns’ load-bearing capacity can be increased by increased CFST column confinement factor. A decrease the in the confinement factor ratio will decrease the local buckling. Additionally, there was a crack indication in the corner area on the MC-CFST and MC-ST specimens.
  • The results of the experiments were used to establish and validate the FEM model. The load-bearing capacity and stiffness of the specimen might all be accurately simulated by the FEM model. The FEM model has been used to analyze the steel tube’s local buckling and the concrete’s stress concentration.
  • The MC-CFST column loading capacity under compression is underestimated by the design code GB50936-2014, ACI & AS, EC-4, and CECS-159:2004. The SC-CFST and OC-CFST columns’ capacity was underestimated by AIJ and EC-4 design codes. However, the cross-shaped CFST column is unsafe in those cases.
  • Improved calculation procedures were proposed for estimating the ultimate load-bearing capacity of cross-shaped CFST columns under axial compression. The calculation technique for the factor coefficient, φ, has been provided by introducing the influence of the confinement factor, ξ, for the axial compressive load. With the conclusion of experimental and FEM data, the mathematical calculation values are in better agreement.

Author Contributions

M.M.H., Methodology, Supervision, Writing—review and editing, Software, Validation. Z.T., Conceptualization, Investigation, Funding acquisition. D.H., and Q.Q. Project administration & supervision, W.A.G., review and editing. All authors have read and agreed to the published version of the manuscript.

Funding

This research was funded by Key Research and Development programs (Key R&D programs) department of science and technology of Yunnan province, the Faculty of Civil Engineering and Architecture, Kunming University of Science and Technology, and the Yunnan Earthquake Engineering Research Institute (YEERI) grant number 202003AC100001.

Institutional Review Board Statement

Not applicable.

Informed Consent Statement

Not applicable.

Data Availability Statement

The data presented in this research are available on request from the corresponding authors.

Acknowledgments

Authors delightfully acknowledge the Key Research and Development programs (Key R&D programs) department of science and technology of Yunnan province, the Faculty of Civil Engineering and Architecture, Kunming University of Science and Technology, and the Yunnan Earthquake Engineering Research Institute (YEERI).

Conflicts of Interest

This manuscript, based on independent research, has been conceptually prepared and written by the authors. The authors report no declarations of interest and the views expressed in this manuscript are solely those of the authors.

References

  1. Han, L.-H. Concrete Filled Steel Tubular Structures-Theory and Practice; Science Press: Beijing, China, 2007. [Google Scholar]
  2. Liu, X.J.L.; Yang, Y.; Cheng, G.; Lanning, J. Resistance of special-shaped concrete-filled steel tube columns under compression and bending. J. Constr. Steel Res. 2020, 169, 106038. [Google Scholar] [CrossRef]
  3. Yongqian, Z.S.Z. Design of L-shaped and T-shaped concrete-filled steel tubular stub columns under axial compression. Eng. Struct. 2020, 207, 110262. [Google Scholar] [CrossRef]
  4. Ahmeda, M.; Liang, Q.Q.; Patelb, V.I.; Hadi, M.N.S. Experimental and numerical studies of square concrete-filled double steel tubular short columns under eccentric loading. Eng. Struct. 2019, 197, 109419. [Google Scholar] [CrossRef]
  5. Anatoly Leonidovich Krishan, M.A.A.; Chernyshova, E.P. Strength Calculation of Short Concrete-filled Steel Tube Columns. Int. J. Concr. Struct. Mater. 2018, 12, 84. [Google Scholar] [CrossRef]
  6. Liang, Q.Q. Numerical simulation of high strength circular double-skin concrete-filled steel tubular slender columns. Eng. Struct. 2018, 168, 205–217. [Google Scholar] [CrossRef]
  7. Farid Abed, M.A.; Abdalla, S. Experimental and numerical investigations of the compressive behavior of concrete filled steel tubes (CFSTs). J. Constr. Steel Res. 2012, 80, 429–439. [Google Scholar] [CrossRef]
  8. Ren, Q.X.; Lam, D.; Hou, C. Experiments on special-shaped CFST stub columns under axial compression. J. Constr. Steel Res. 2014, 98, 123–133. [Google Scholar] [CrossRef]
  9. Bin, Z.; Wang, Z.T.; Han, L.-H.; Uy, B.; Lam, D.; Kang, W.-H. Strength, stiffness and ductility of concrete-filled steel columns under axial compression. Eng. Struct. 2017, 135, 209–221. [Google Scholar] [CrossRef]
  10. Deren, L.Y.G.; Ding, F.; Wang, L.; Deng, C.; Yuan, T.; Clae, R. Experimental Study of Square CFST Stub Columns With a Low Steel Ratio Under Axial Loading. Struct. Mater. A Sect. J. Front. Mater. 2021, 8, 629819. [Google Scholar] [CrossRef]
  11. Wen, X.J.C.; Xie, F.; Ye, C.; Liu, C. Behavior of Corroded Thin-Walled Concrete-Filled Steel Tubular Stub Columns. Buildings 2022, 12, 481. [Google Scholar] [CrossRef]
  12. Jiang, L.; Ji, J.; Ren, H.; Wang, Q.; Sun, R.; Yu, C.; Zhang, H.; Luo, G. Bearing behavior of high-performance concrete-filled high-strength steel tube composite columns subjected to eccentrical load. Struct. Mater. A Sect. J. Front. Mater. 2022, 9, 972811. [Google Scholar] [CrossRef]
  13. Payam, S.; Asteris, P.G.; Formisano, A.; Armaghani, D.J. Iterative Finite Element Analysis of Concrete-Filled Steel Tube Columns Subjected to Axial Compression. Buildings 2022, 12, 2071. [Google Scholar] [CrossRef]
  14. Liu, X.; Liu, J.; Yang, Y. Research on special-shaped concrete-filled steel tubular columns under axial compression. J. Constr. Steel Res. 2018, 147, 203–223. [Google Scholar] [CrossRef]
  15. Wang, Z.; Wei, F.; Li, M. Performance of Special-Shaped Concrete-Filled Square Steel Tube Column under Axial Compression. Adv. Civ. Eng. 2020, 2020, 1763142. [Google Scholar] [CrossRef]
  16. Zheng, Y. Flexural behaviour of stiffened and multi-cell L-shaped CFSTs considering different loading angles. J. Constr. Steel Res. 2021, 178, 106520. [Google Scholar] [CrossRef]
  17. Zhu, Y. Behavior of Concrete Filled L-Shaped Stiffened Steel Tubes under Axial Compression. Master’s Thesis, East China Jiaotong University, Jiangxi, China, 2017. [Google Scholar]
  18. Song, H. Research on Mechanical Behavior of Multi-Cell Special-Shaped Concrete-Filled Steel Tubular Stub Columns Under Axial Compression. Master’s Thesis, Chongqing University, Chongqing, China, 2017. [Google Scholar]
  19. Zhang, W.; Xiong, Q. Performance of L-shaped columns comprising concrete-filled steel tubes under axial compression. J. Constr. Steel Res. 2018, 145, 573–590. [Google Scholar] [CrossRef]
  20. Qiguang, C.; Liang, Z.Z.; Jinxuan, H.; Jieying, W. Study on Cross-shaped Concrete Filled Steel Tubular Stub Columns Subjected to Axial Compression: Experiments and Design Method. Open Civil Eng. J. 2017, 11, 1–13. [Google Scholar] [CrossRef]
  21. Hossain, K.M.A. Axial load behaviour of thin walled composite columns. Compos. Part B 2003, 34, 715–725. [Google Scholar] [CrossRef]
  22. Vrcelj, Z.B.U. Strength of slender concrete-filled steel box columns incorporating local buckling. J. Constr. Steel Res. 2002, 58, 275–300. [Google Scholar] [CrossRef]
  23. Roeder, C.W.; Lehman, D.E.; Bishop, E. Strength and Stiffness of Circular Concrete-Filled Tubes. J. Struct. Eng. 2010, 136, 1545–1553. [Google Scholar] [CrossRef]
  24. de Oliveira, W.L.A.; de Cresce El Debs, A.L.H.; Debs, M.K.E. Influence of concrete strength and length/diameter on the axial capacity of CFT columns. J. Constr. Steel Res. 2009, 65, 2103–2110. [Google Scholar] [CrossRef]
  25. Zeghichea, K.C. An experimental behaviour of concrete-filled steel tubular columns. J. Constr. Steel Res. 2005, 61, 53–66. [Google Scholar] [CrossRef]
  26. Lyu, H.M.; Zhou, A.; Yang, J. Perspectives for flood risk assessment and management for mega-city metro system. Tunn. Undergr. Space Technol. 2019, 84, 31–44. [Google Scholar] [CrossRef]
  27. Song, H.; Yang, Y.; Chen, Y.F. Study on Mechanical Behavior of Integrated Multi-cell Concrete-filled Steel Tubular Stub Columns Under Concentric Compression. Int. J. Civ. Eng. 2019, 17, 361–376. [Google Scholar] [CrossRef]
  28. Bing, C.X.Z.; Liang, N.; Yang, Y.; Shen, D.; Huang, B.; Du, Y.-H. Bearing capacity of welded composite T-shaped concrete-filled steel tubular columns under axial compression. Adv. Mech. Eng. 2020, 12, 3102. [Google Scholar] [CrossRef]
  29. Xu, L.; Du, G.; Wen, F.; Xu, H. Experimental study on normal section compression bearing capacity of composite T-shaped concrete-filled steel tubular columns. China Civ. Eng. J. 2009, 42, 14–21. [Google Scholar]
  30. Montuori, R.; Tisi, A. Comparative analysis and critical issues of the main constitutive laws for concrete elements confined with FRP. Compos. Part B 2012, 43, 3219–3230. [Google Scholar] [CrossRef]
  31. Richart, F.E.; Brandtzaeg, A.; Brown, A. The Failure of Concrete of Plain and Spirally Reinforced Concrete in Compression. Univ. III. Eng. Exp. Stn. Bull. 1929, 190. [Google Scholar]
  32. Karabinis, A.I.; Rousakis, T.C. FRP Confining Effects on Steel Reinforced Concrete Square Sections Subjected to Axial Load. In Proceedings of the 2nd International fib Congress, Naples, Italy, 5–8 June 2006. [Google Scholar]
  33. General Administration of Quality Supervision. Tensile Test of Metal Materials-Part 1: Test Method at Room Temperature; China Construction Industry Press: Beijing, China, 2010. [Google Scholar]
  34. Park, R. Ductility Evaluation from Laboratory and Analytical Testing. In Proceedings of the Ninth World Conference on Earthquake Engineering, Tokyo-Kyoto, Japan, 2–9 August 1988. [Google Scholar]
  35. Huang, Z.; Li, D.; Wang, J. Behaviour and design of ultra-high-strength CFST members subjected to compression and bending. J. Constr. Steel Res. 2020, 175, 6351. [Google Scholar] [CrossRef]
  36. Li, W.; Han, L.-H. Seismic performance of concrete-filled double-skin steel tubes after exposure to fire: Experiments. J. Constr. Steel Res. 2018, 154, 209–223. [Google Scholar] [CrossRef]
  37. Hassam, M.; Jia, C. Concentric and eccentric compression performance of multiple-cell cruciform CFSTs. J. Constr. Steel Res. 2022, 192, 7205. [Google Scholar] [CrossRef]
  38. Hana, L.-H.; Zhao, X.-L. Tests and calculations for hollow structural steel (HSS) stub columns filled with self-consolidating concrete (SCC). J. Constr. Steel Res. 2005, 61, 1241–1269. [Google Scholar] [CrossRef]
  39. Chen, S.; Zhang, H. Numerical analysis of the axially loaded concrete filled steel tube columns with debonding separation at the steel-concrete interface. Steel Compos. Struct. 2012, 13, 277–293. [Google Scholar] [CrossRef]
  40. Japan, A.I. Recommendations for Design and Construction of Concrete Filled Steel Tubular Structures; Architectural Institute of Tokyo: Tokyo, Japan, 1997. (In Japanese) [Google Scholar]
  41. GB 50936-2014; Technical Code for Concrete Filled Steel Tubular Structures. MOHURD: Beijing, China, 2014.
  42. Güneyisi, E.M.; Mermerdaş, K. Ultimate Capacity Prediction of Axially Loaded CFST Short Columns. Int. J. Steel Struct. 2016, 16, 99–114. [Google Scholar] [CrossRef]
  43. EN 1994-1-1 E.C.f. Eurocode 4 (EC4); Design of Composite Steel and Concrete Structures, in Part 1-1: General Rules and Rules for Buildings. European Council: Brussels, Belgium, 2005.
  44. CECS 159: 2004; Technical Specifications for Structures with Concrete-Filled Rectangular Steel Tube Members. ICECS Association: Glasgow, UK, 2004.
Figure 1. Typical specimen cross-section: (a) MC-CFST; (b) MC-ST; (c) SC-CFST; (d) SC-ST; (e) OC-CFST; (f) OC-ST.
Buildings 13 00423 g001
Figure 2. Tensile test results of the Steel: (a) 111 mm length sample; (b) 80 mm length sample; (c) Steel tensile in tested properties graph.
Buildings 13 00423 g002
Figure 3. Steel tube preparation of the specimen.
Buildings 13 00423 g003
Figure 4. Specimen before and during concrete pouring: (a) Loading plate leveling; (b) Loading plate welding with the specimen; (c) Levelling the specimen; (d) Concrete pouring.
Buildings 13 00423 g004
Figure 5. Test setup of cross-shaped CFST and ST columns: (a) Measuring instrument setting; (b) Loading simple diagram; (c) Loading machine setup.
Buildings 13 00423 g005
Figure 6. Cross-shaped CFST specimen’s failure modes: (a) MC-CFST specimen; (b) SC-CFST specimen; (c) OC-CFST specimen.
Buildings 13 00423 g006
Figure 7. Cross-shaped ST specimen’s failure modes: (a) MC-ST specimen; (b) SC-ST specimen; (c) OC-ST specimen.
Buildings 13 00423 g007
Figure 8. Load–displacement graph, cross-shaped CFST, and ST specimens: (a) load–vertical displacement; (b) load–vertical displacement; (c) load–lateral displacement; (d) load–lateral displacement.
Buildings 13 00423 g008aBuildings 13 00423 g008b
Figure 9. Graphical geometric method.
Buildings 13 00423 g009
Figure 10. Concrete and steel, simplified structural relationship: (a) Compressive stress–strain of concrete; (b) Tension stress–strain of concrete; (c) Steel stress–strain.
Buildings 13 00423 g010aBuildings 13 00423 g010b
Figure 11. FEM and experiment comparison of the cross-shaped CFST columns: (a) MC-CFST; (b) SC-CFST; (c) OC-CFST.
Buildings 13 00423 g011
Figure 12. FEM and experiment comparison of the cross-shaped ST columns: (a) MC-ST; (b) SC-ST; (c) OC-ST.
Buildings 13 00423 g012
Figure 13. Axial load–strain graph FEM and experimental CFST Specimen: (a) Axial load–vertical strain; (b) Axial load–lateral strain.
Buildings 13 00423 g013
Figure 14. Axial load–strain graph FEM and experimental ST Specimen: (a) Axial load–vertical strain; (b) Axial load–lateral strain.
Buildings 13 00423 g014
Figure 15. Parameter specimen numbering procedure.
Buildings 13 00423 g015
Figure 16. Axial load–displacement graph of CFST specimen: (a) different concrete strength; (b) different steel tube thickness; (c) different steel strength.
Buildings 13 00423 g016
Figure 17. FEM and mathematical results for axial load results comparison.
Buildings 13 00423 g017
Table 1. The specimen’s parameters.
No.Specimensl (mm)b (mm)t (mm)Concrete Strength (MPa)Steel Strength (MPa)l/bξ
1MC-CFST900300345.2833031.136
2SC-CFST900300345.2833030.936
3OC-CFST900300345.2833030.842
4MC-ST9003003-3303-
5SC-ST9003003-3303-
6OC-ST9003003-3303-
Table 2. Constitutive laws of Confinement.
MethodFormulaReference
01 f c c = f c 0 × 2 × ρ f · E f f c 0 × 0.4142 · E f · 10 7 + 0.0248 × 2 r d + 1 [30,31]
02 f c c = f c c , s + f c c , c [30,32]
03 (Used method) ξ = A s A c × f y f ck [15]
Table 3. Steel inspected properties.
Inner Lengthfu (MPa)fy (MPa)Es (MPa)νs
111 mm587328201,0590.30
80 mm607333201,4260.30
Table 4. Summary of the experimental and FEM results.
SpecimenN0.85E
(kN)
NEy
(kN)
δEy
(mm)
NEmax
(kN)
δEmax
(mm)
NFEMNFEM/NEmaxη
MC-CFST3234.2433062.13838053.58136880.970.93
SC-CFST2580.627352.06730363.06329480.970.862
OC-CFST2400.426272.04528242.93628451.0070.810
MC-ST939.2511051.44511951.44512101.012-
SC-ST794.759351.2249951.2249740.979-
OC-ST698.77911.18538221.1858431.026-
AVP 0.99
AVE 0.01
Table 5. Concrete plasticity parameter.
Dilation AngleEccentricityfb0/fc0Shape Factor, KViscosity Parameter
30o0.11.160.6670.0001
Table 6. The values of analysis parameters.
Parametert (mm)fy (MPa)fcu (MPa)
Concrete strength333040
333060
Steel strength330060
339060
342060
Steel thickness233045
533045
Table 7. Cross-shaped CFST column load-bearing capacity with different standards.
SpecimenAIJGB50936-2014ACI & ASEC-4CECS-159:2004
Nus
(kN)
Nus
(kN)
Nus (kN)Nus (kN)Nus
(kN)
MC-CFST3699.451.033321.961.153281.401.162766.841.383340.451.14
SC-CFST3410.400.893126.670.973059.950.9922561.911.183143.610.67
OC-CFST3269.850.863033.110.932952.300.9572462.281.153051.200.93
Disclaimer/Publisher’s Note: The statements, opinions and data contained in all publications are solely those of the individual author(s) and contributor(s) and not of MDPI and/or the editor(s). MDPI and/or the editor(s) disclaim responsibility for any injury to people or property resulting from any ideas, methods, instructions or products referred to in the content.

