Article

Numerical Investigations of Progressive Collapse Behaviour of Multi-Storey Reinforced Concrete Frames

1
Chongqing Water Resources and Electric Engineering College, Chongqing 402160, China
2
China Nerin Engineering Co., Ltd., Nanchang 330103, China
3
School of Civil Engineering, Chongqing University, Chongqing 400045, China
*
Author to whom correspondence should be addressed.
Buildings 2023, 13(2), 533; https://doi.org/10.3390/buildings13020533
Submission received: 6 January 2023 / Revised: 8 February 2023 / Accepted: 13 February 2023 / Published: 15 February 2023
(This article belongs to the Special Issue Sustainability and Resiliency of Building Materials and Structures)

Abstract

:
This paper presents numerical simulations of multi-storey reinforced concrete frames under progressive collapse scenarios. Reinforced concrete frames with different storeys are modelled using DIANA. The load resistance and failure mode of frames are obtained from the numerical simulation. Variations in axial force and bending moment at the beam end are also determined and analysed to shed light on the force transfer mechanism. Numerical results show that the single-storey frame can develop compressive arch action at the initial loading stage and subsequent catenary action at large deformations. However, in multi-storey frames, only the first-storey beam develops compressive arch action and catenary action, whereas beams in other storeys show rather limited axial compression force. Based on numerical results, a design method is proposed for multi-storey frames to resist progressive collapse. Comparisons between numerical results and design methods suggest that the design method can evaluate the progressive collapse resistance of multi-storey frames with good accuracy.

1. Introduction

Since the disastrous failure of the World Trade Center in 2001, progressive collapse has become an important concern in the design of building structures. Different design methods have been proposed and incorporated in relevant guidelines [1,2].
In recent years, different types of experimental tests have been conducted by researchers from different countries [3,4,5,6,7,8], and the force transfer mechanism in beam–column sub-assemblages has been identified as compressive arch action and catenary action in beams with axial restraints. Numerical models were also developed for beam–column connections subjected to progressive collapse [9,10]. Parameters affecting the progressive collapse resistance of structures have been intensively investigated through experimental tests and numerical simulations [11,12]. Strengthening techniques have also been developed to mitigate the risk of progressive collapse [13]. This experimental study mainly focuses on the behaviour of beam–column sub-assemblages or single-storey frames. As for multi-storey frames, limited data are available due to the difficulties in conducting relevant tests and measuring resistance of different storeys [14,15,16,17,18]. Even though experimental tests were also conducted on whole structures [19] and design methods have been developed and incorporated in different codes [20], there is still a lack of quantitative methods for direct calculation of load capacity of structures against progressive collapse.
This paper describes numerical modelling of progressive collapse behaviour of multi-storey frames. In the numerical study, different frames are simulated using DIANA, and the force transfer mechanism at different storeys of multi-storey frames is identified. The contribution of each storey to total resistance of frames is also quantified using the numerical model, and finally, a design method is proposed based on the numerical results. The method fills the research gap in design methods for progressive collapse of multi-storey frames and can be directly used in the calculation of the load capacity under compressive arch action.

2. Numerical Modelling of Reinforced Concrete Frames

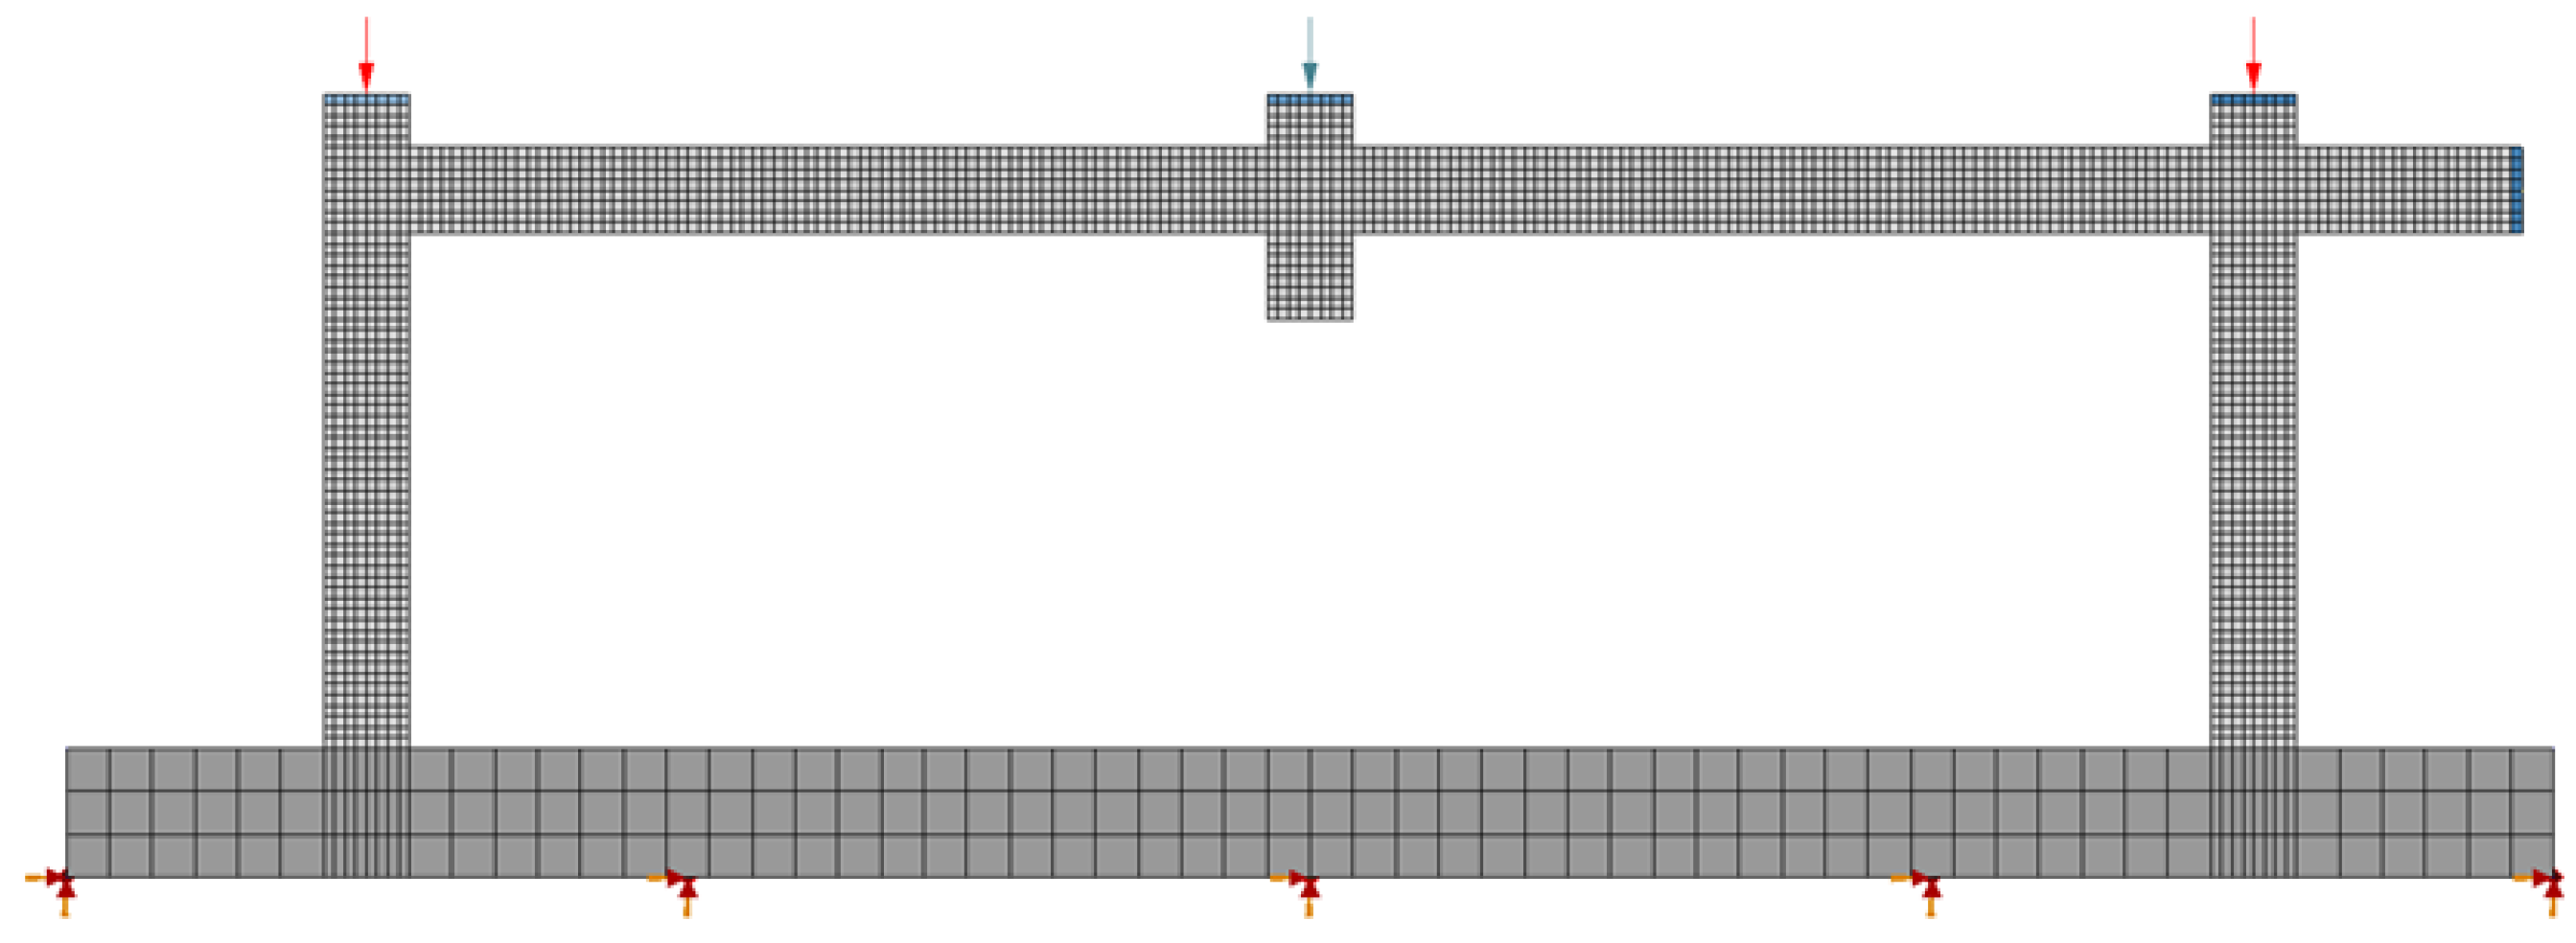
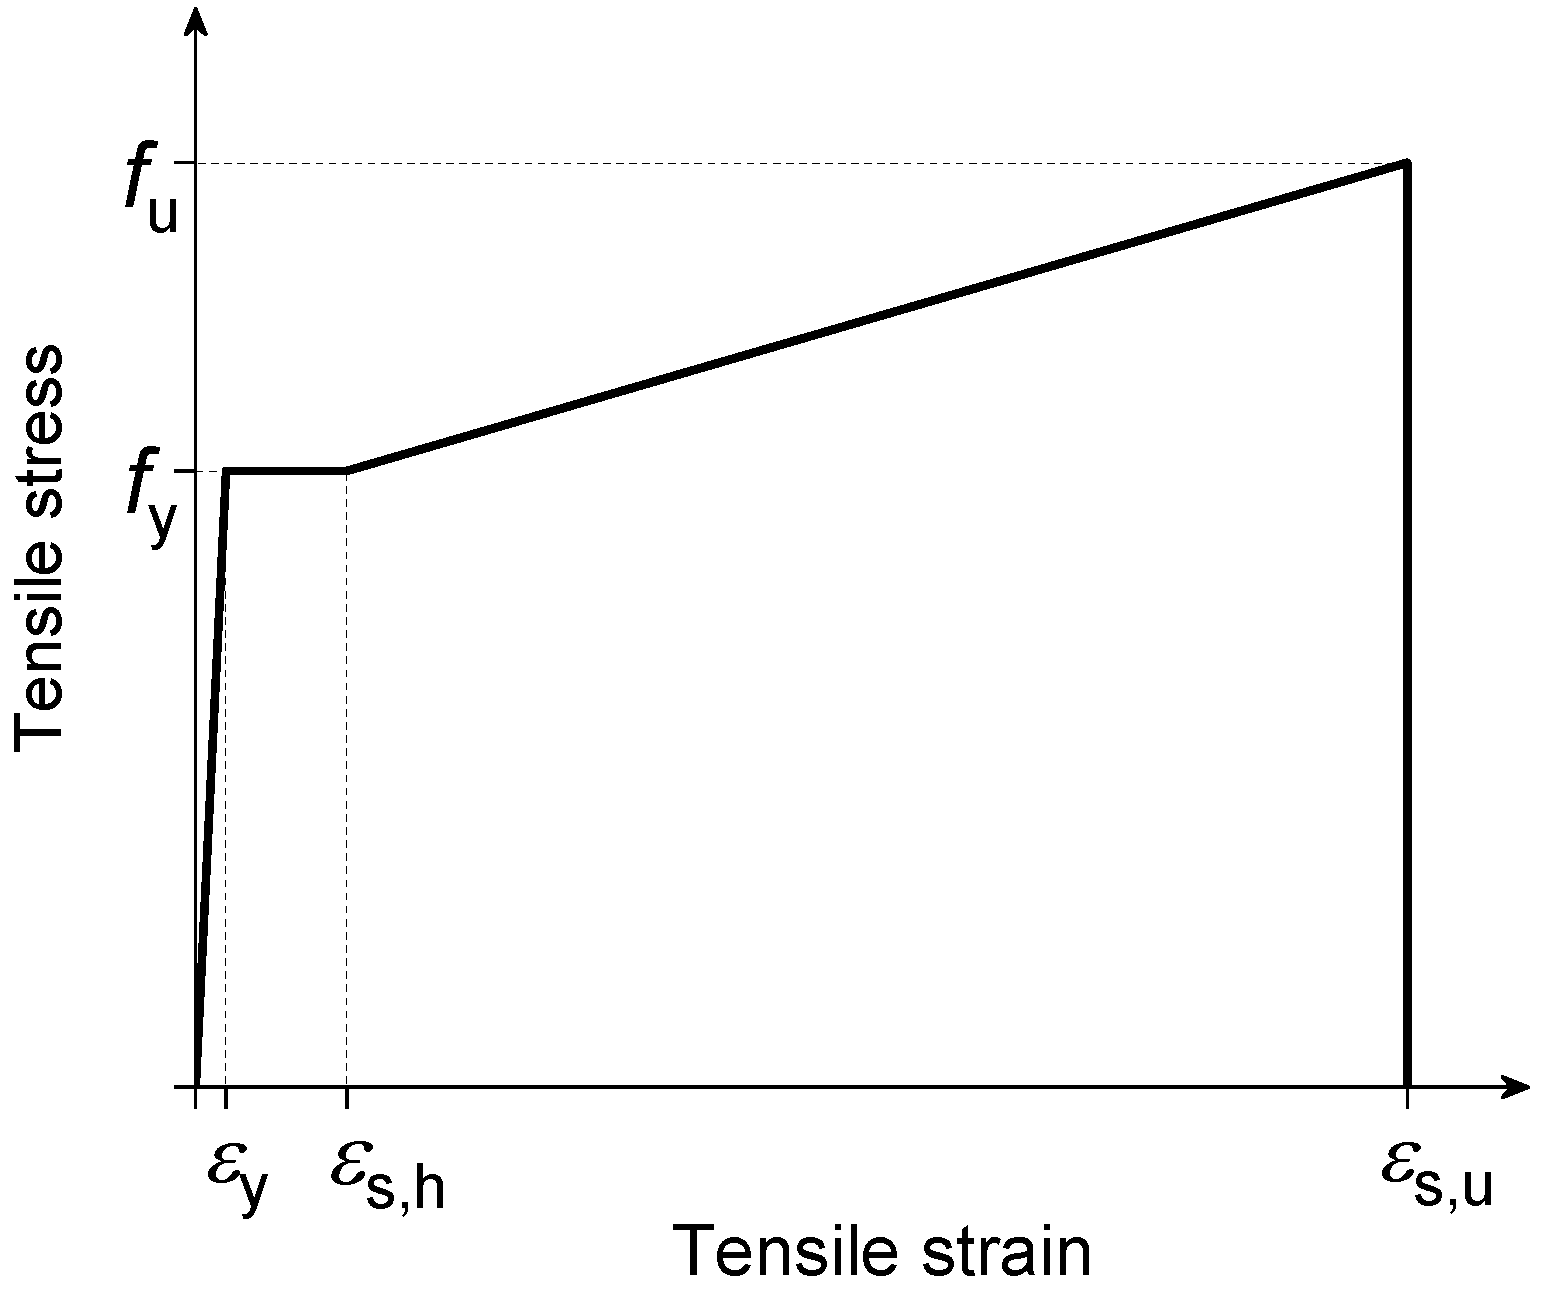
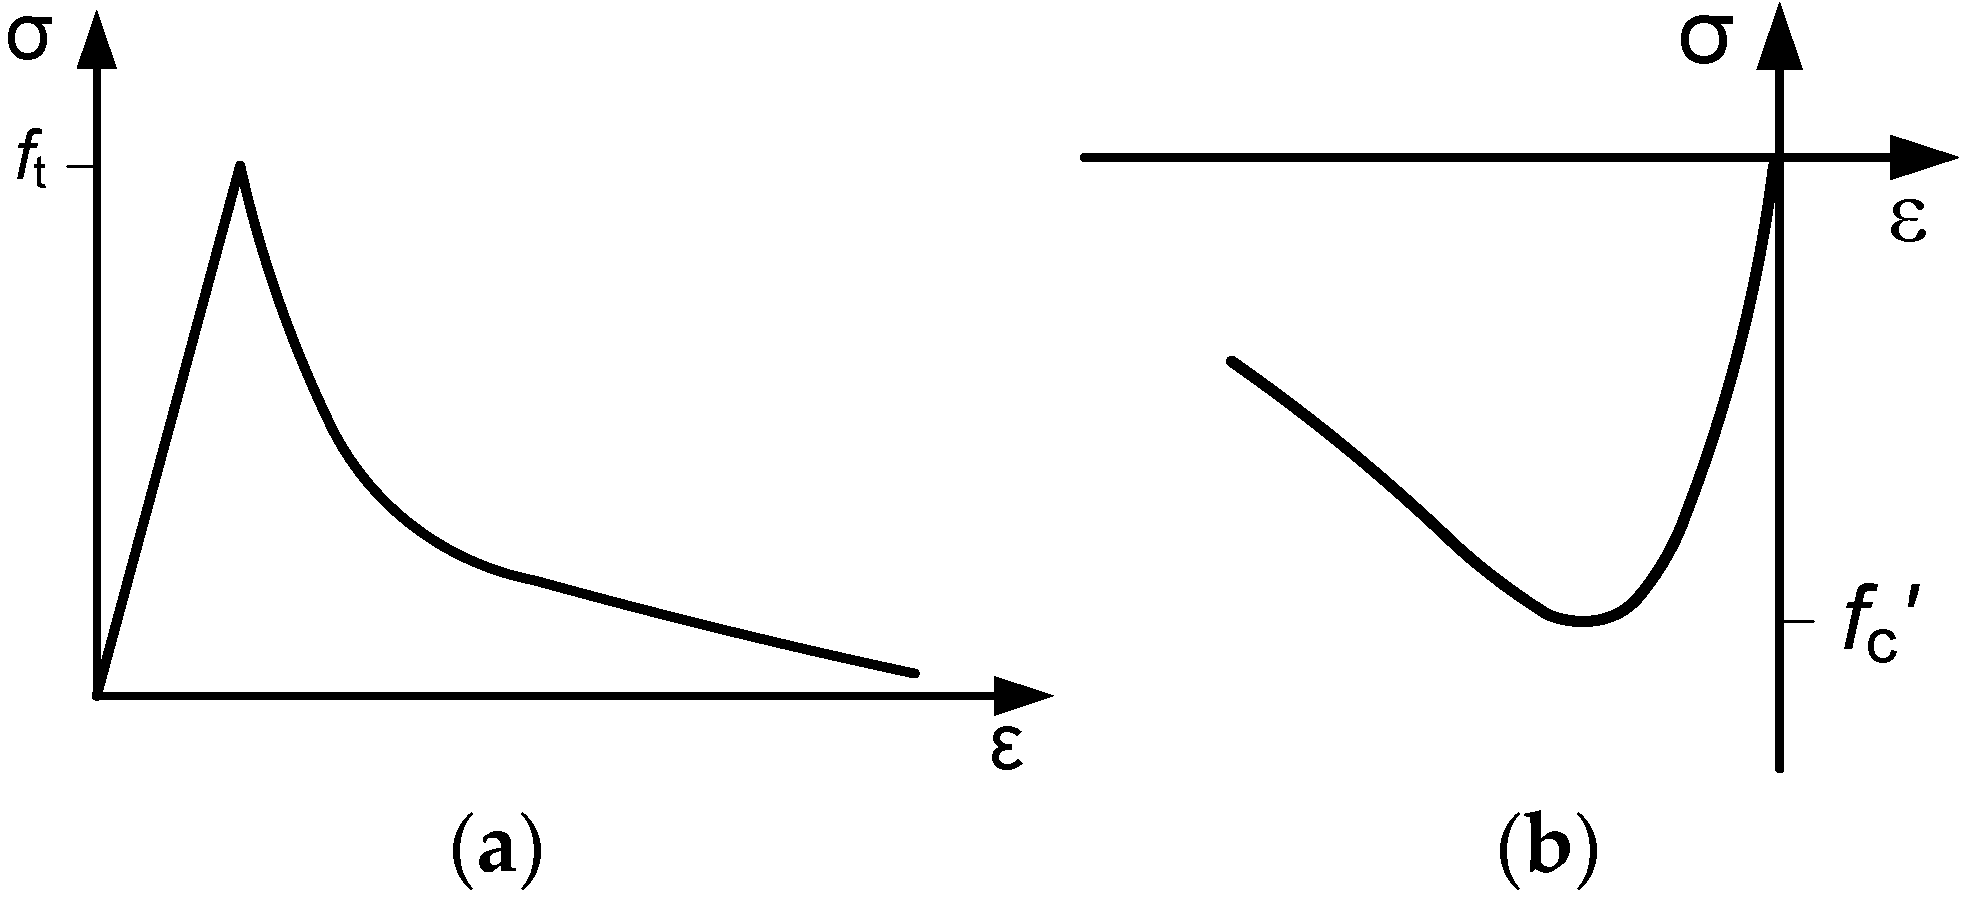
2.1. Development of Numerical Model

In this study, reinforced concrete frames with one supporting column removed are simplified as plane-stress models using DIANA [21], as shown in Figure 1. In the model, the plane-stress element CQ16M is used to define concrete beams, columns and footing, and the truss element is used for steel reinforcement. The stress–strain relationship of steel reinforcement is defined as piece-wise linear, as shown in Figure 2. In the constitutive model, hardening of reinforcement is considered, as it might affect the load capacity of reinforced concrete frames when fracture of reinforcement occurs. The specific mechanical properties of reinforcement are determined from tensile tests on reinforcement. As for concrete, the tension-softening stress–strain model developed by Hordijk is used for concrete in tension, and the compressive stress–strain model proposed by Maekawa is employed to model the behaviour of concrete in compression, as shown in Figure 3. In the concrete model, the confinement effect provided by stirrups in beams is not considered, as in general the spacing of stirrups is large and the confinement effect is weak.

2.2. Simulation of Bond

In addition to the mechanical properties of steel reinforcement and concrete, the bond between reinforcement and concrete should also be defined in the numerical model. Previous studies show that the progressive collapse behaviour of reinforcement concrete frames can be affected by the bond–slip behaviour between steel reinforcement and concrete. DIANA provides two options to define the bond–slip behaviour of reinforcement, either by embedding reinforcement in concrete or by defining bond–slip damage models for reinforcement. When steel reinforcement is embedded in concrete, the normal and tangent stiffness moduli can be taken as 2000 N/mm3 and 0.002 N/mm3, respectively. In defining bond–slip models, the multi-linear bond–slip curve and cubic function by Dörr can be used. The bond stress in the models depends on the compressive or tensile strength of concrete.
Figure 4 shows the effect of bond models on the load–displacement curve of the single-storey frame tested by Tan [22]. It can be observed from the figure that by varying the bond–slip model between steel reinforcement and surrounding concrete, the peak load at the initial stage is insignificantly affected, whereas the ultimate load and associated displacement of the frame at the fracture of reinforcement is sensitive to the bond–slip model. The numerical result is in good agreement with the experimental result when the reinforcement is embedded in concrete. By contrast, the ultimate load and associated displacement of the frame are significantly overestimated when the multi-linear model or Dörr cubic function is defined in the numerical model. Therefore, embedded reinforcement is used in the subsequent numerical modelling.

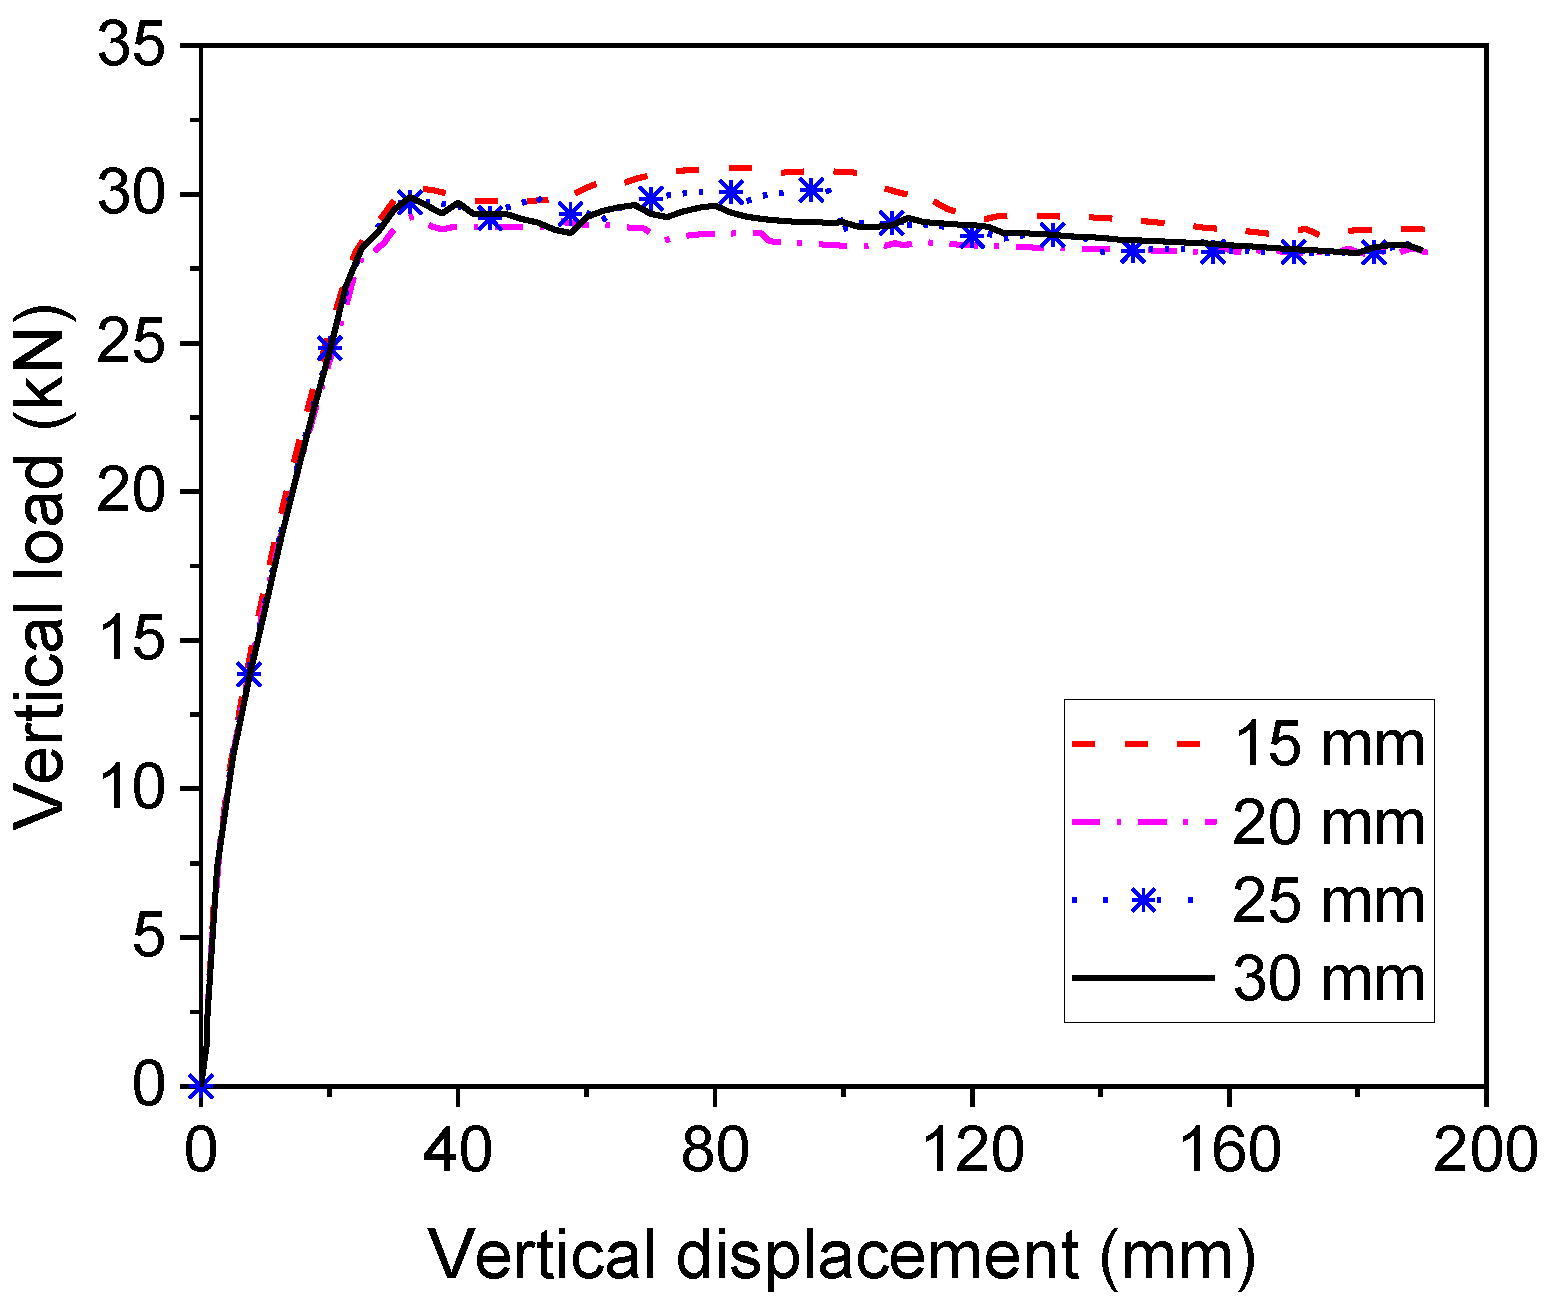
2.3. Mesh Sensitivity Analysis

Mesh size in numerical models might affect the accuracy of the numerical result. To adopt the appropriate mesh size in the present study, a mesh sensitivity study is performed using numerical simulations, in which the single-storey reinforced concrete frame tested by Tan [22] is used. Figure 5 shows the effect of mesh size on the load–displacement curve of the frame. It can be observed that when the mesh size is smaller than 30 mm, the overall load–displacement curve is not significantly affected in the numerical model, and the difference in the load capacity is within 1 kN. Therefore, the mesh size in the present study is selected as 30 mm to save the computational cost.

3. Behaviour of Single-Storey Frame

In this section, the behaviour of a single-storey frame tested by Tan [22] is simulated under progressive collapse scenarios by using the proposed numerical model, as shown in Figure 6. Comparisons are made between experimental and numerical results at different levels to validate the accuracy of the numerical model. Moreover, the force transfer mechanism of the frame under progressive collapse is analysed in depth. More details of experimental tests can be found in [22].

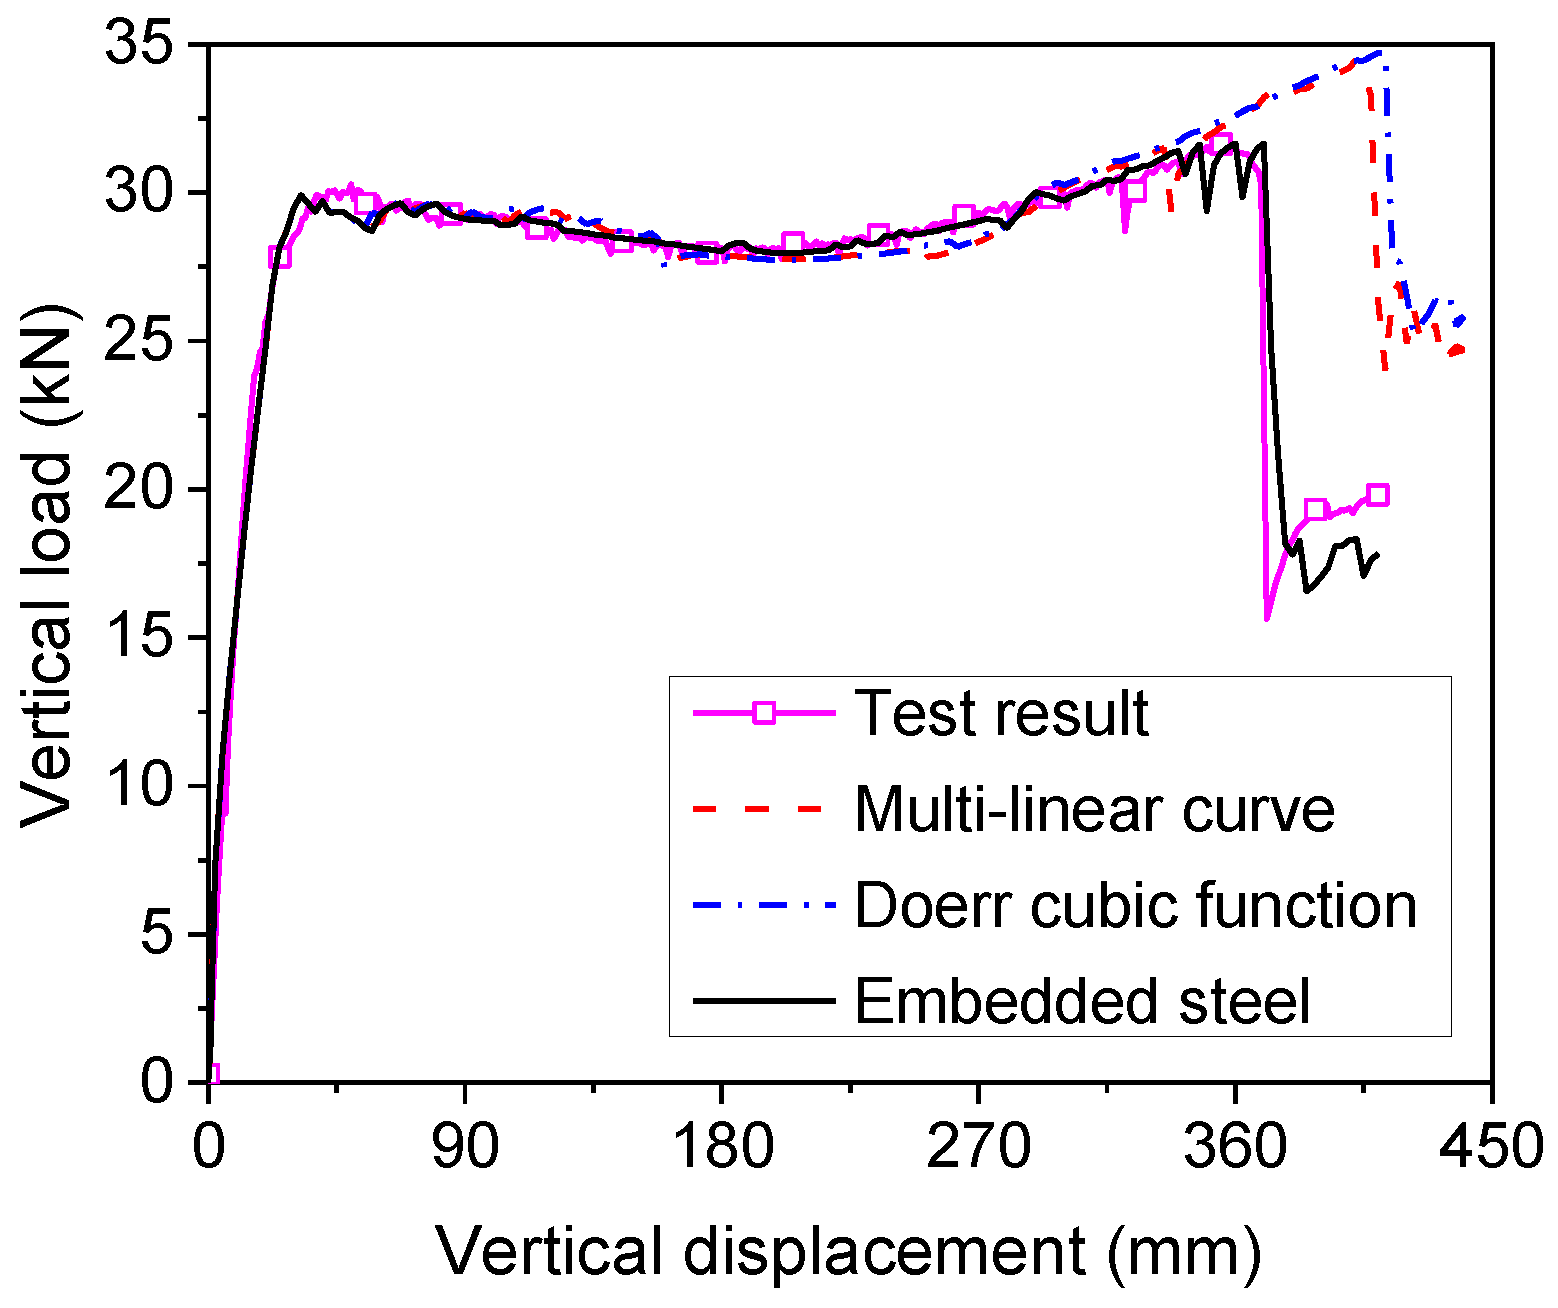
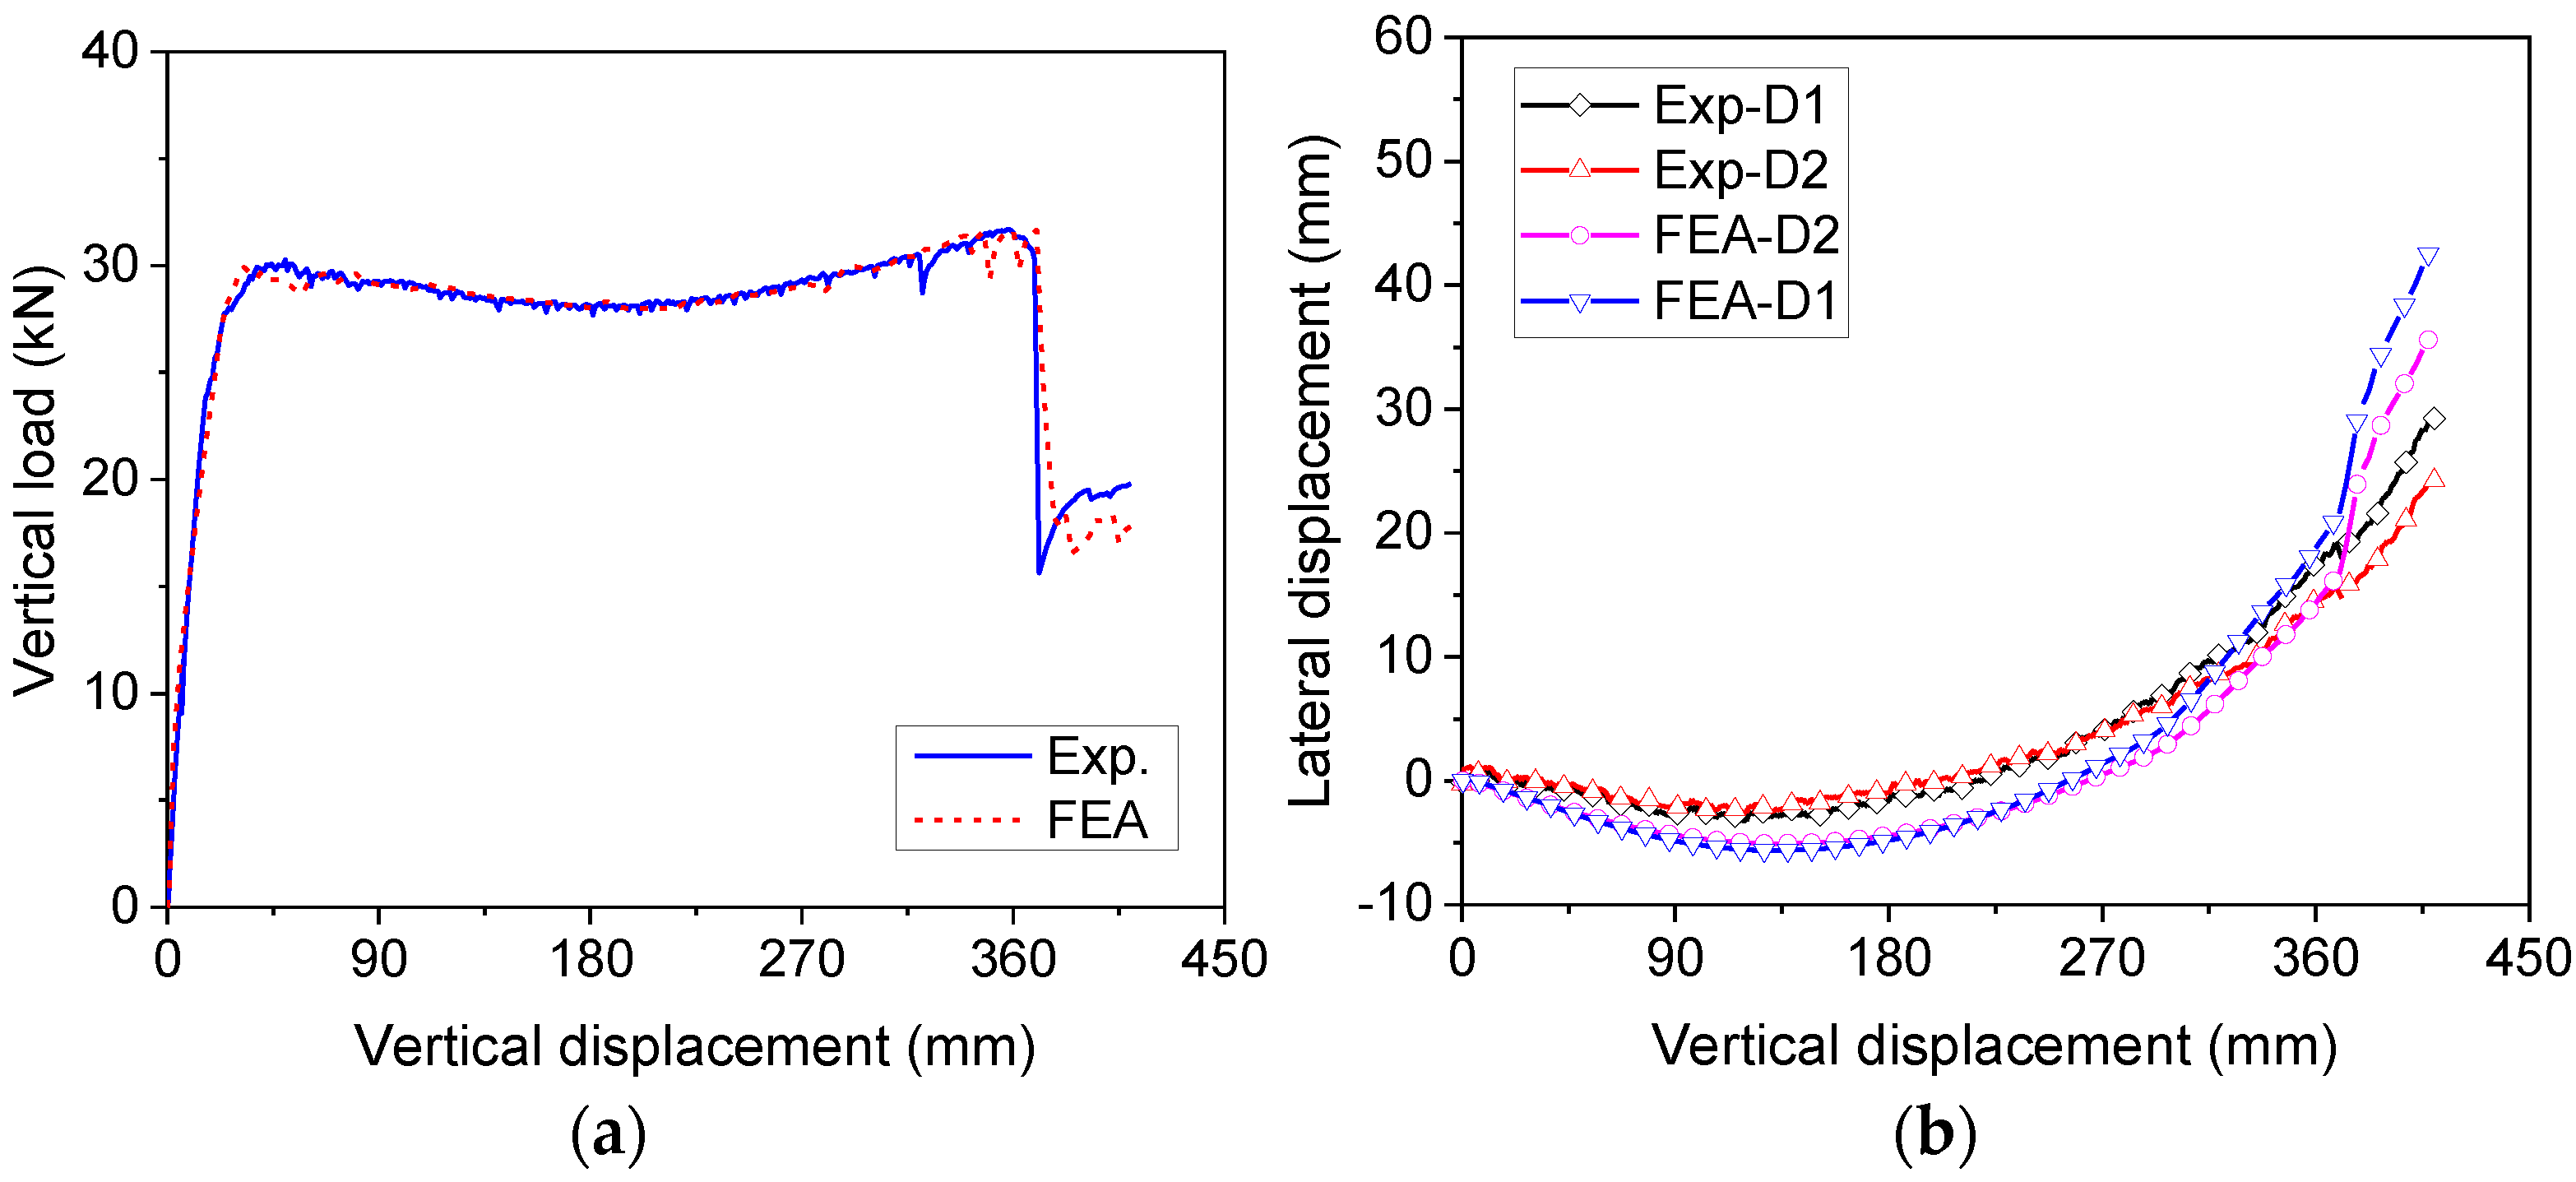
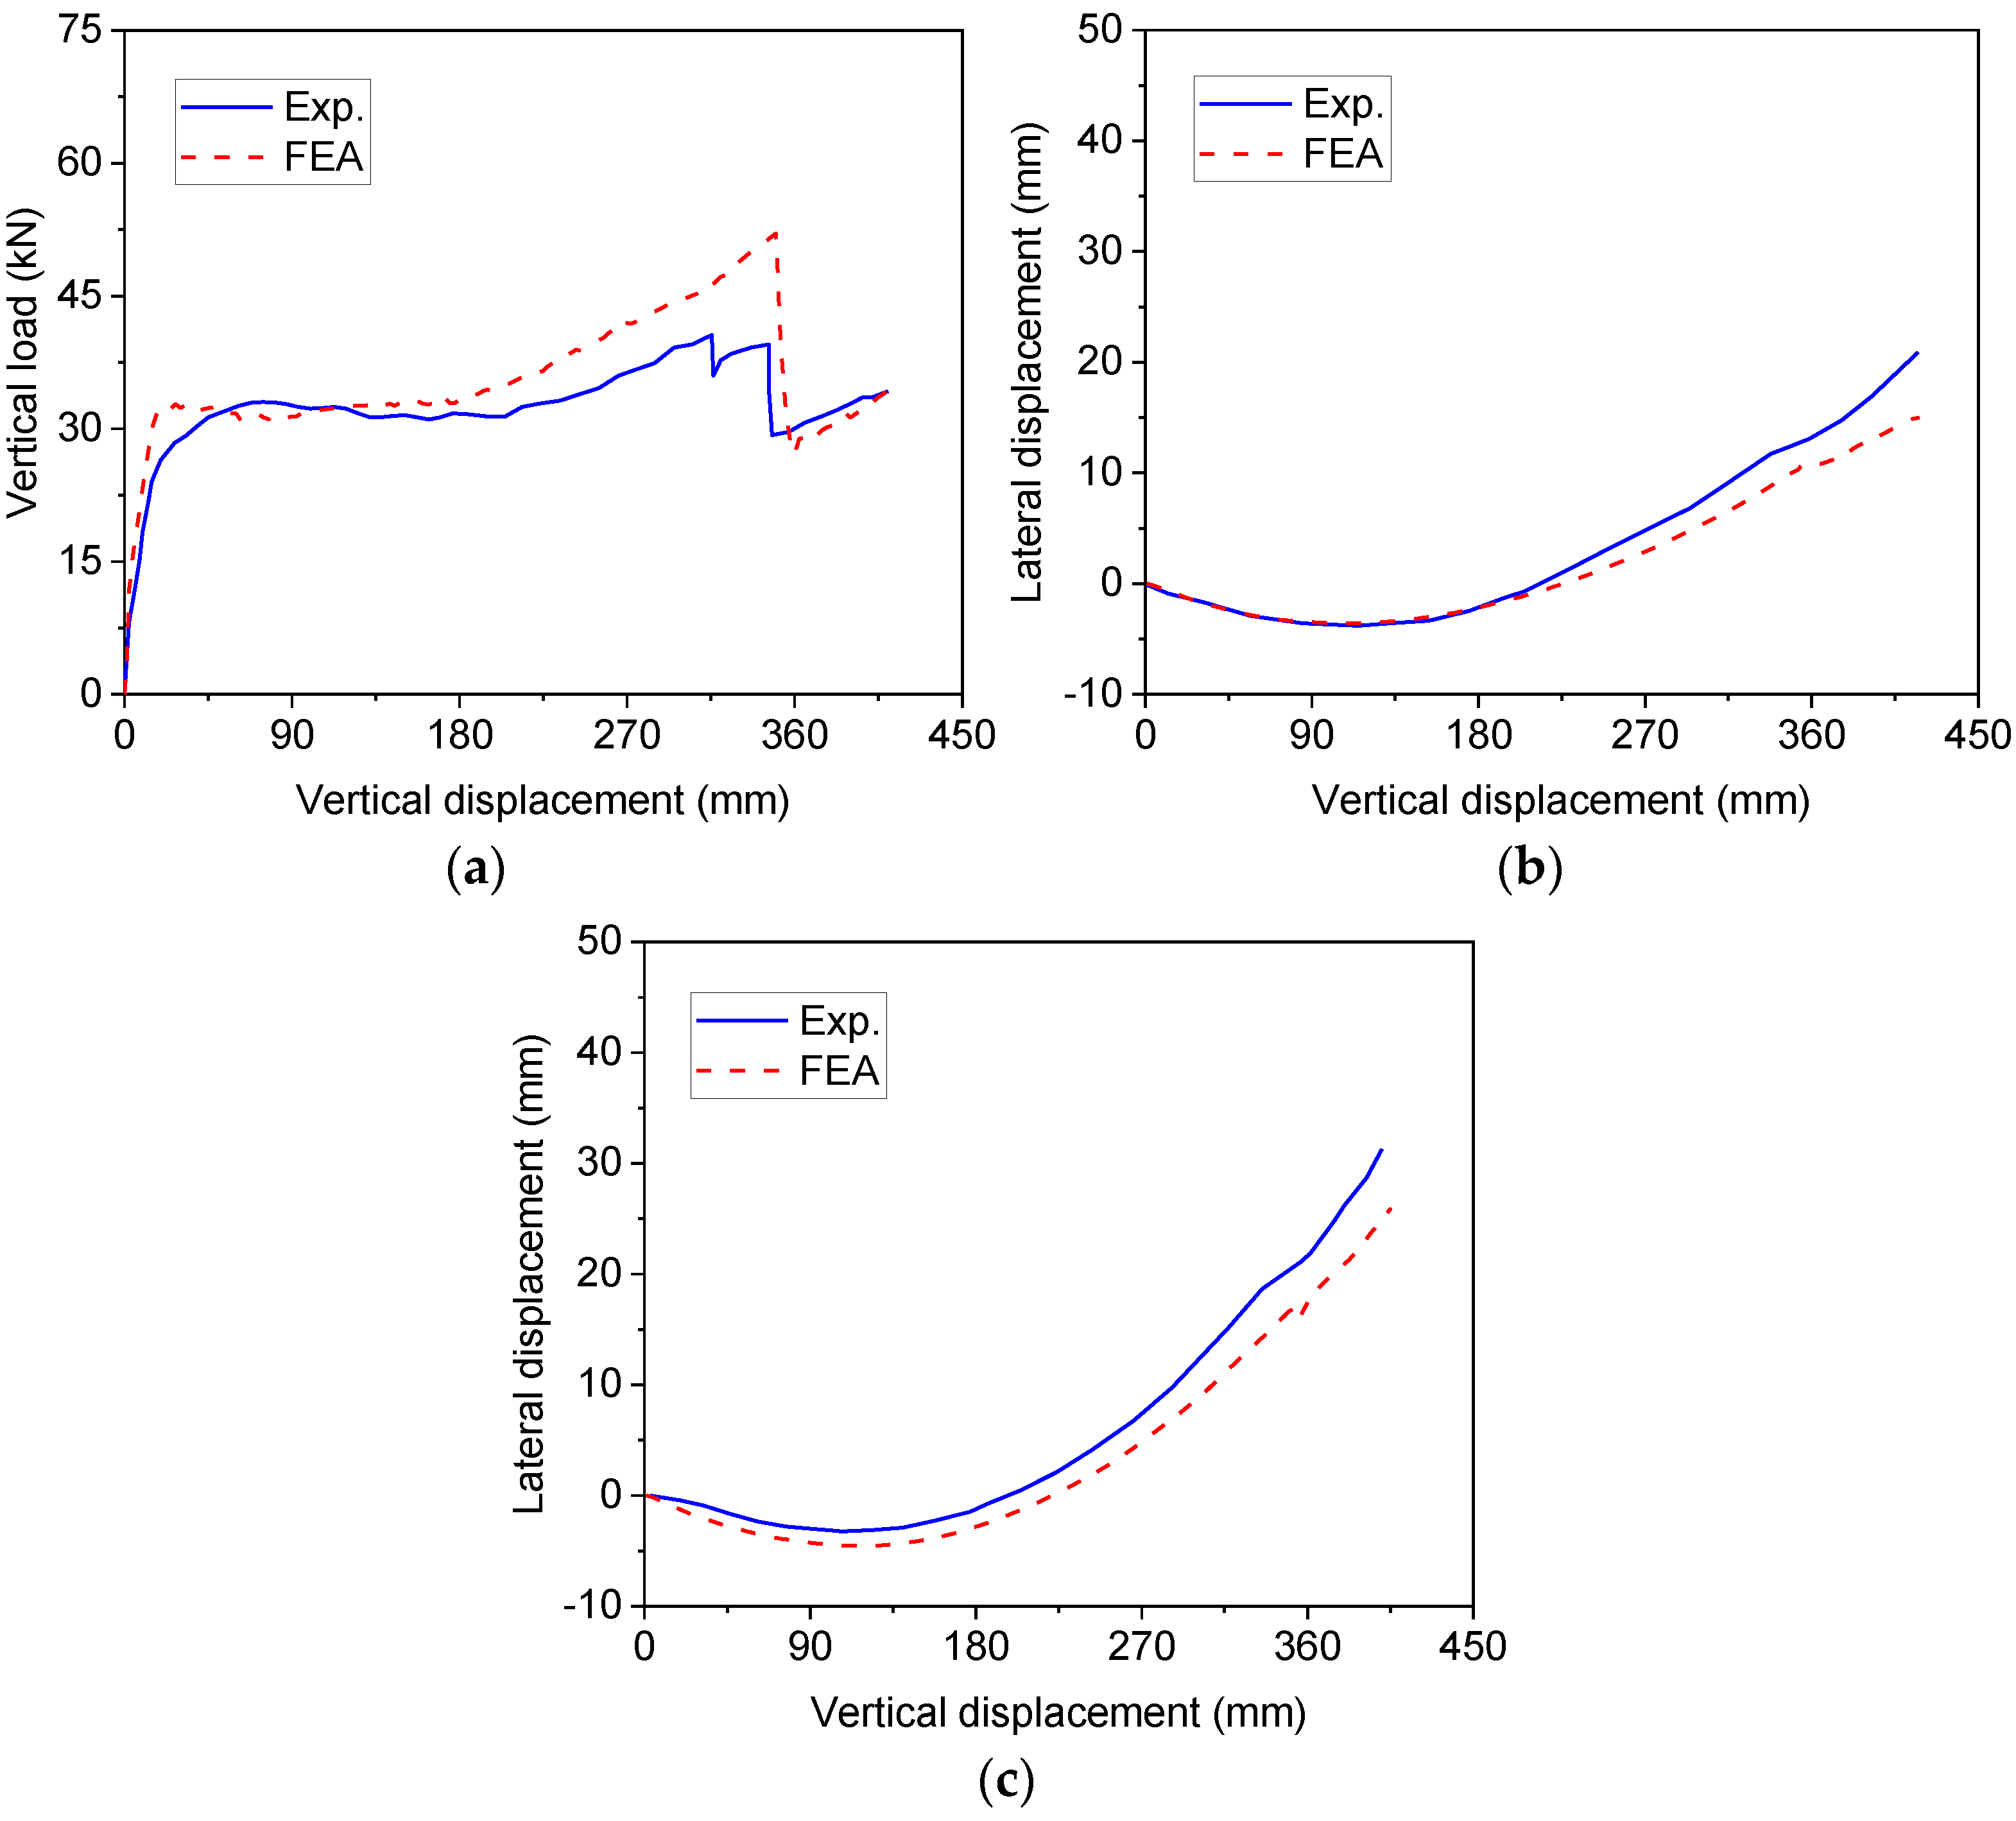
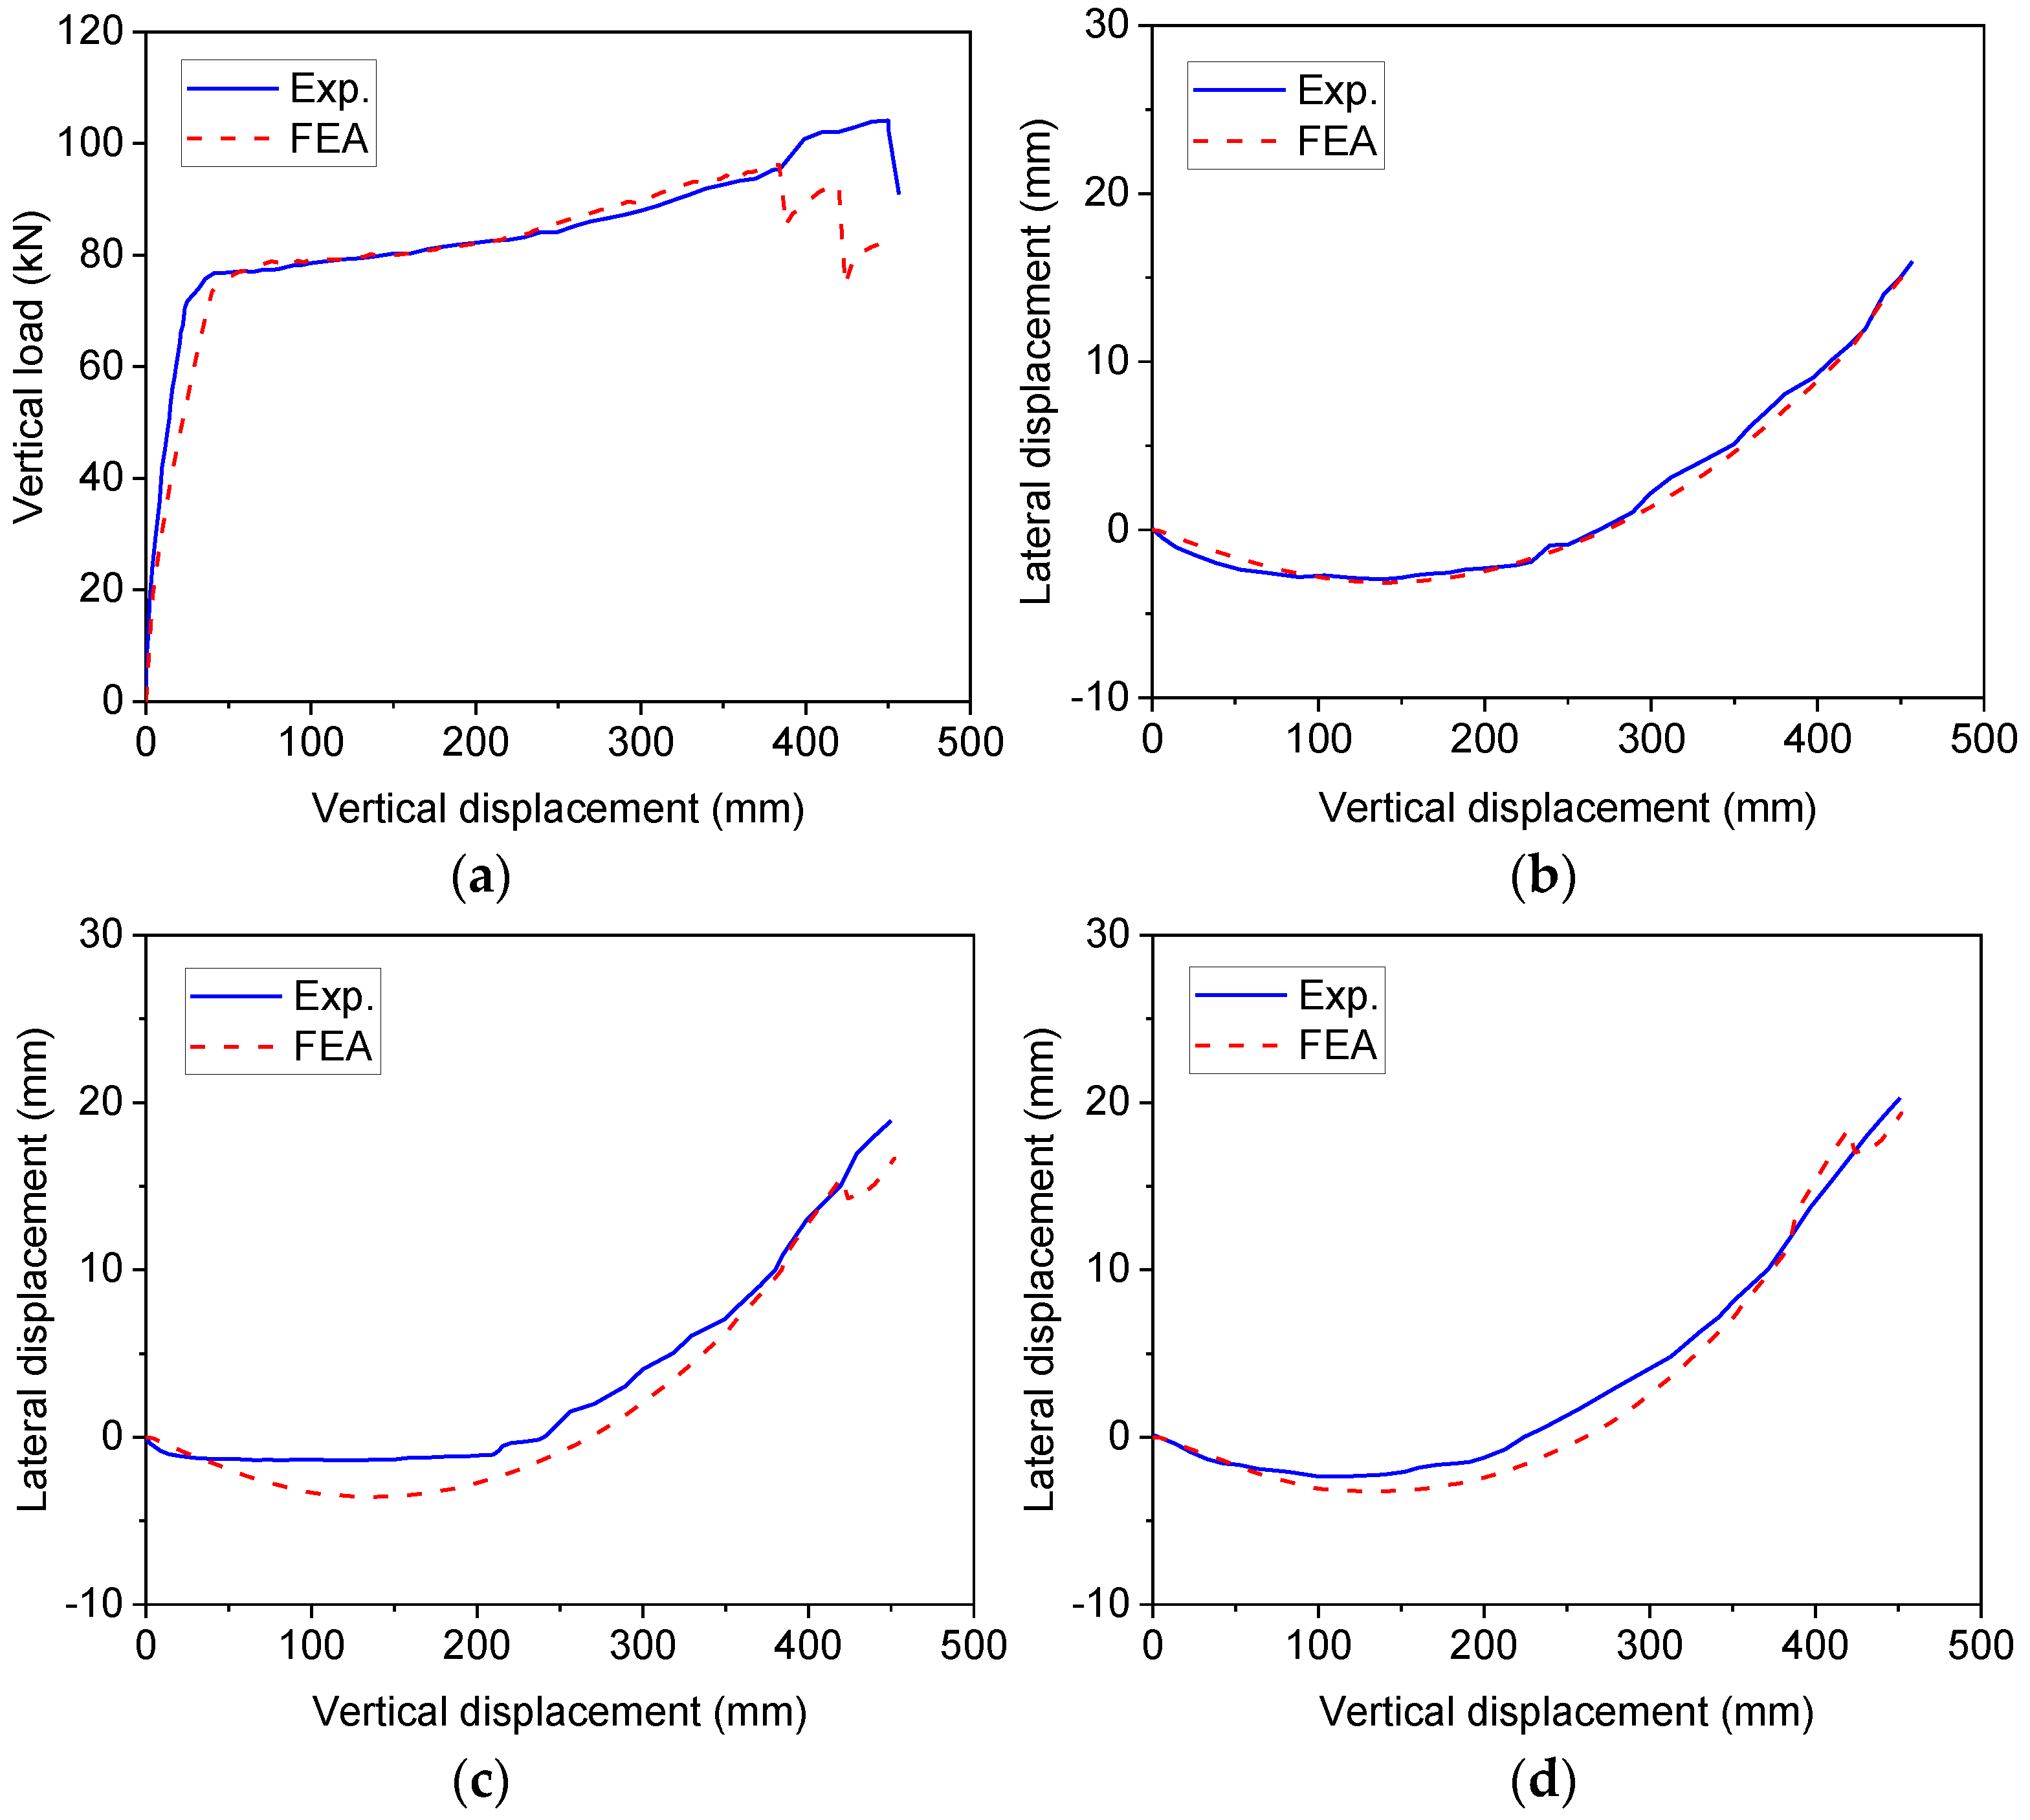
3.1. Load–Displacement Relationship

Figure 7 shows the comparisons of experimental and numerical results of the frame. In the figure, EXP represents experimental results and FEA denotes numerical results. It can be observed from Figure 7a that in general the experimental load–displacement curve is in good agreement with the numerical result from the initial loading to final failure. The vertical load can increase slowly as a result of the mobilisation of catenary action in beams. Besides the load–displacement curve, comparisons are also made among the variations of lateral displacement measured at the column top, as shown in Figure 7b. Note that D1 was the lateral displacement of the left column and D2 was the lateral displacement of the right column. It can be observed from the figure that the numerical lateral displacement is slightly larger than the experimental value, but the overall trends are close to each other. The lateral displacement of the left column exceeds that of the right column, indicating the potential failure of the left column.

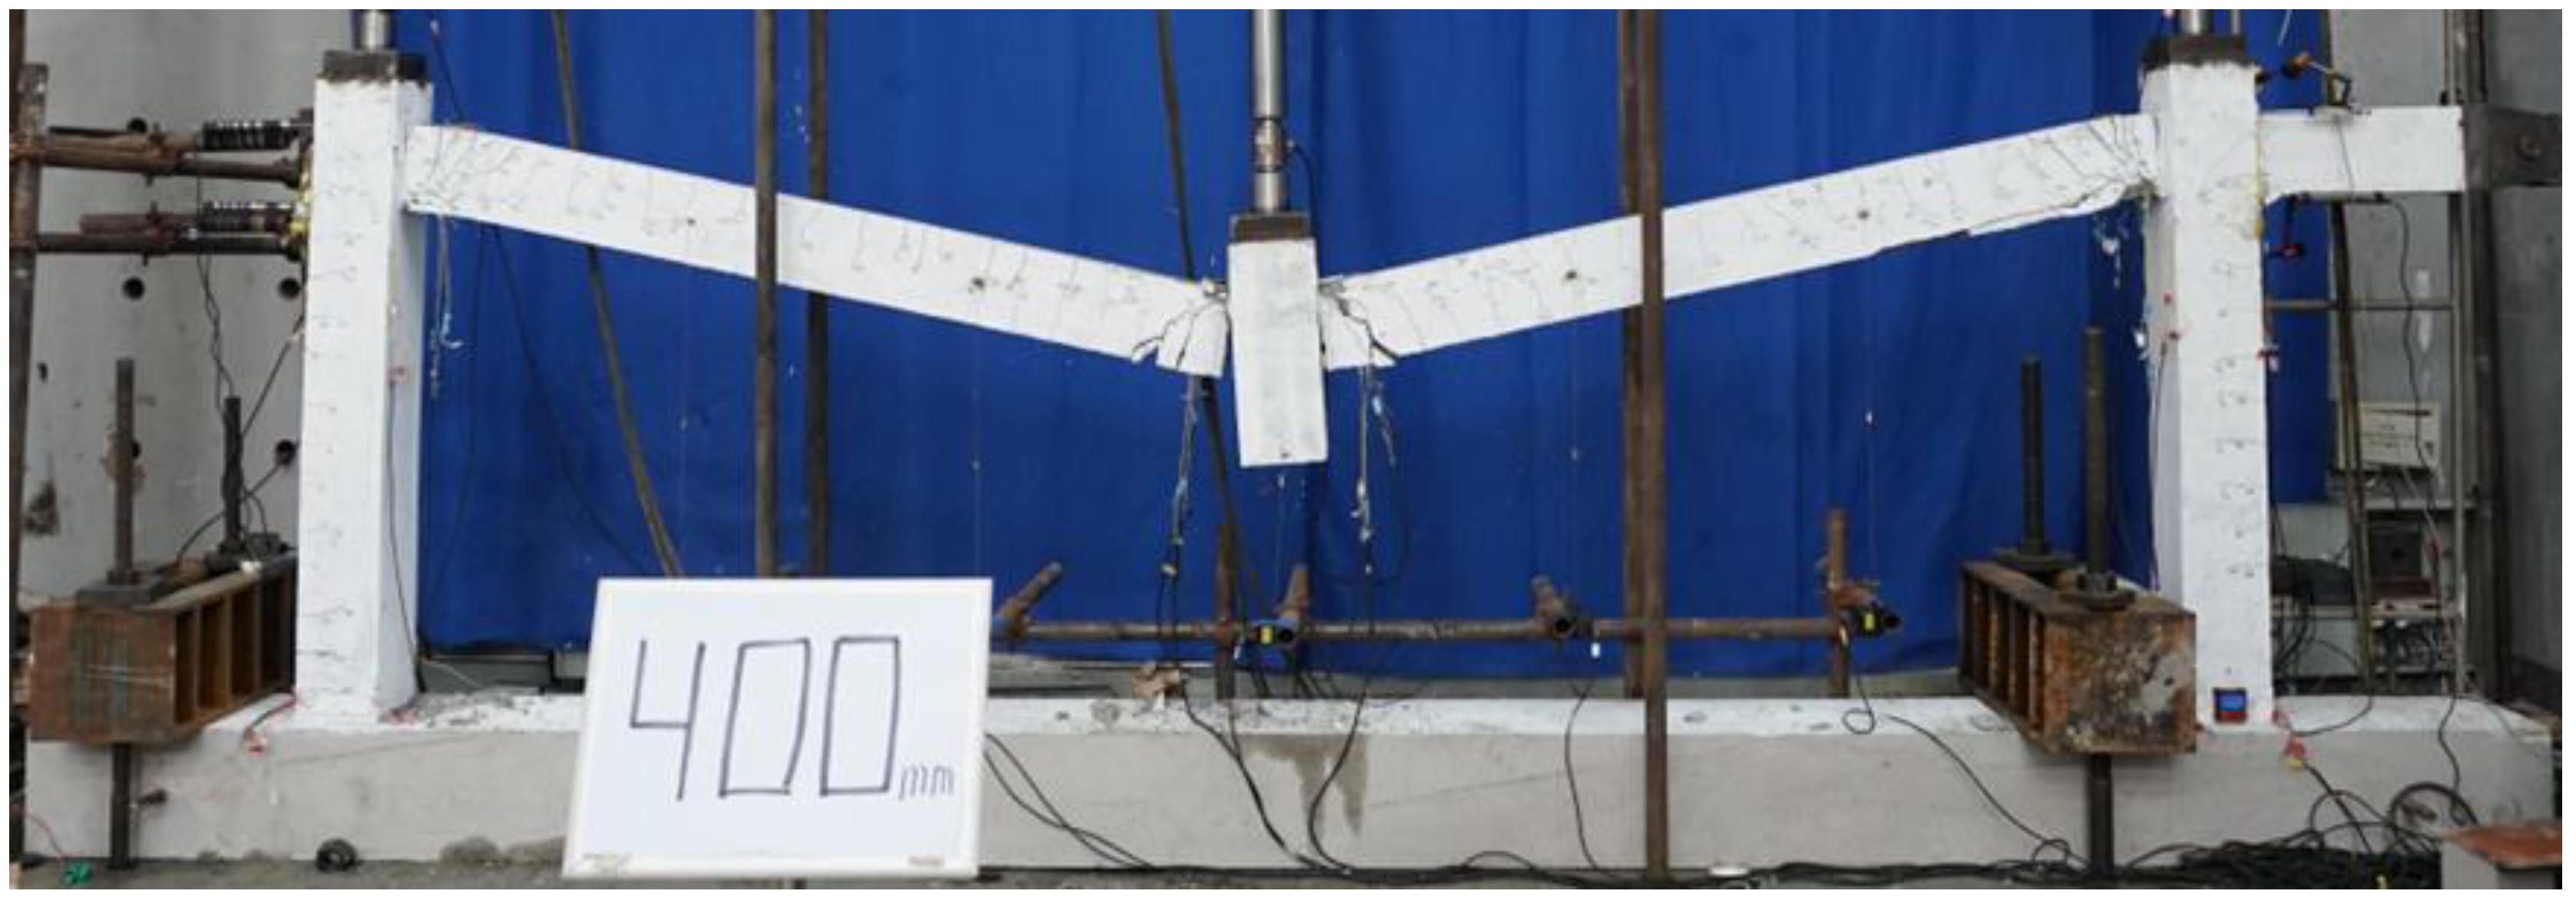
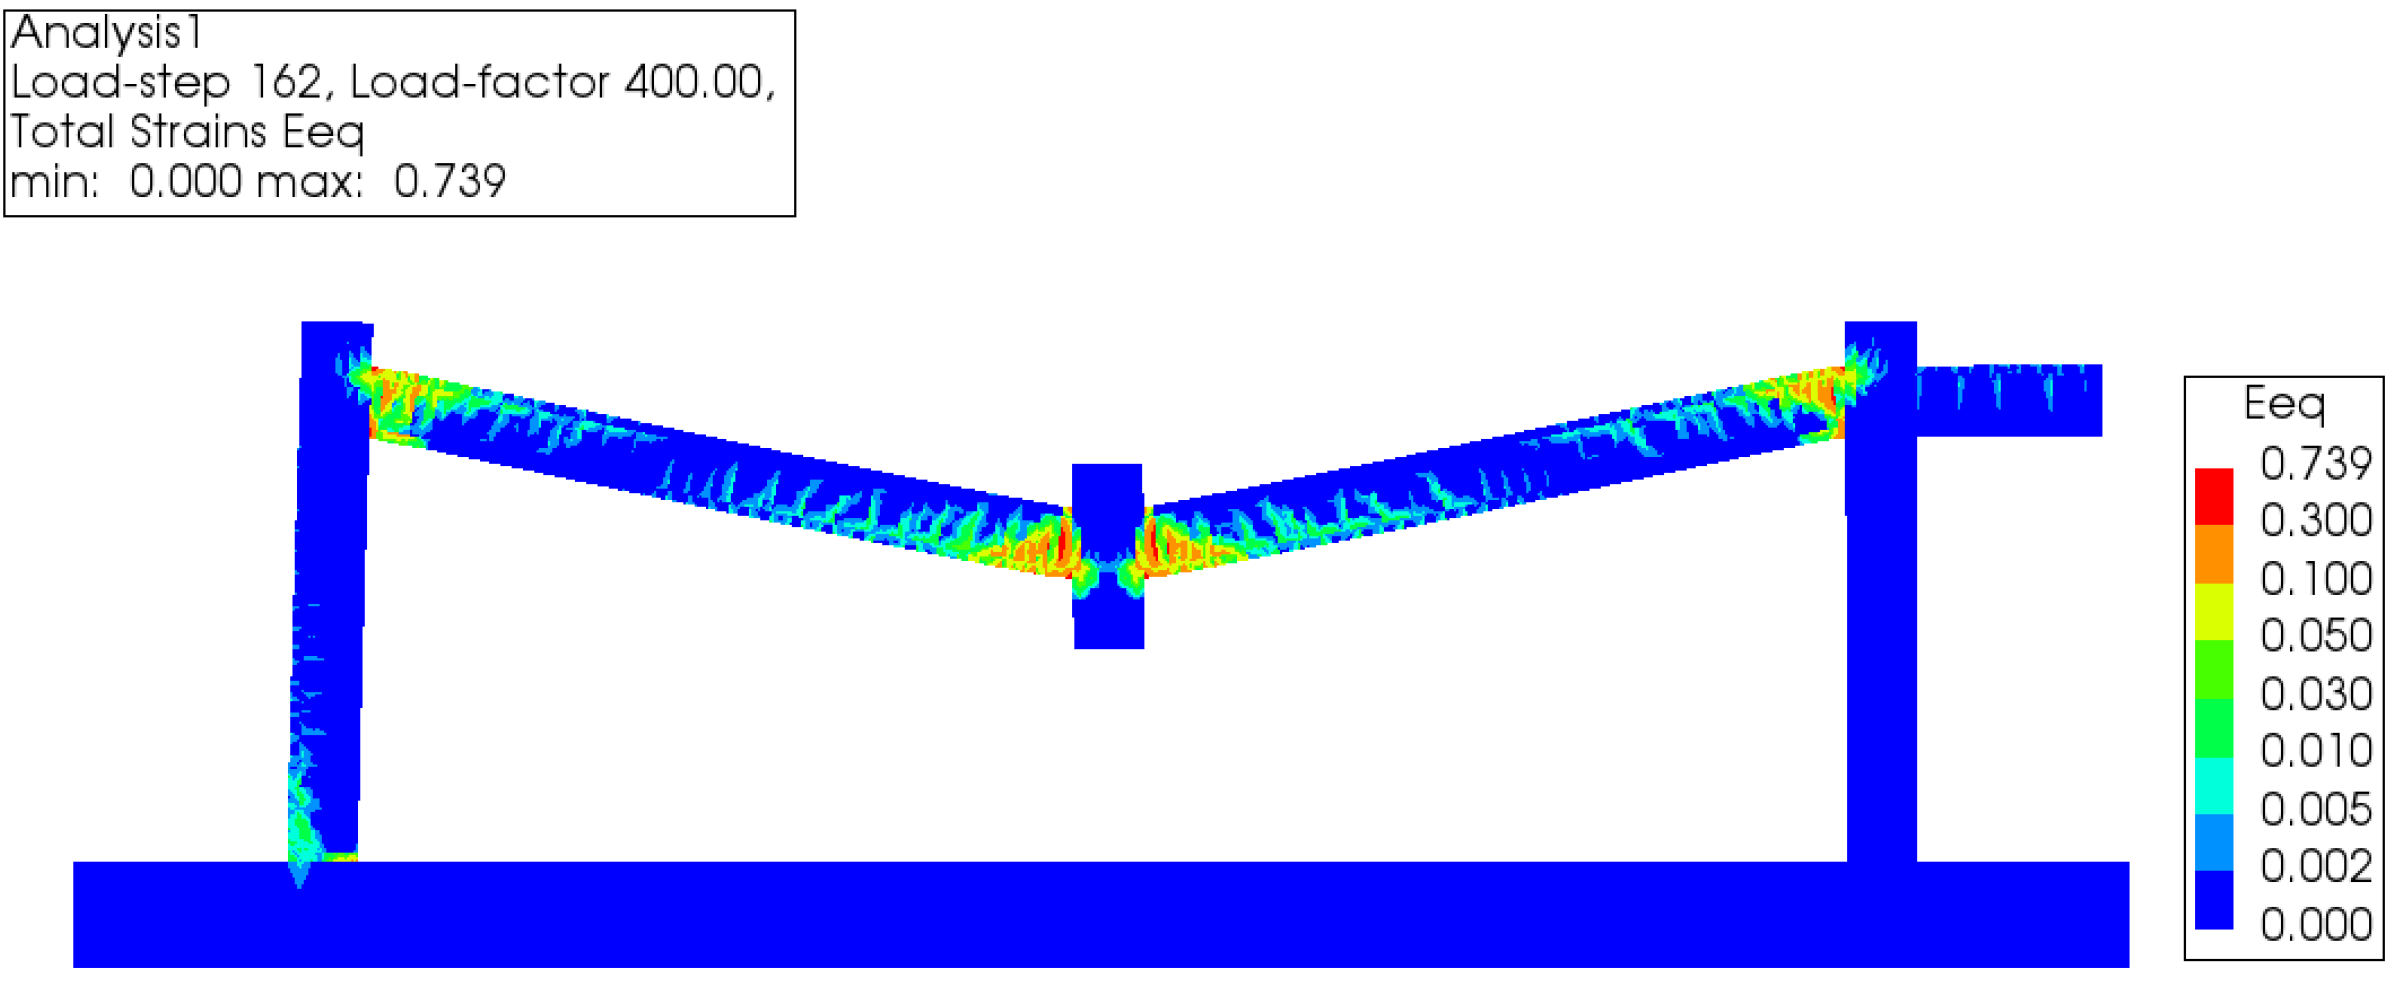
3.2. Failure Mode of Single-Storey Frame

Figure 8 shows the failure mode of the single-storey frame under progressive collapse scenarios. Note that the contour represents the failure mode of the frame at a vertical displacement of 400 mm. It is apparent that plastic hinges have formed at the beam end, and cracks even extend along the beam length at failure due to the combined effect of bending moment and tension force in the beam under catenary action. It is noteworthy that another hinge forms at the bottom end of the left column, indicating flexural failure of the column subjected to catenary action in the beam.

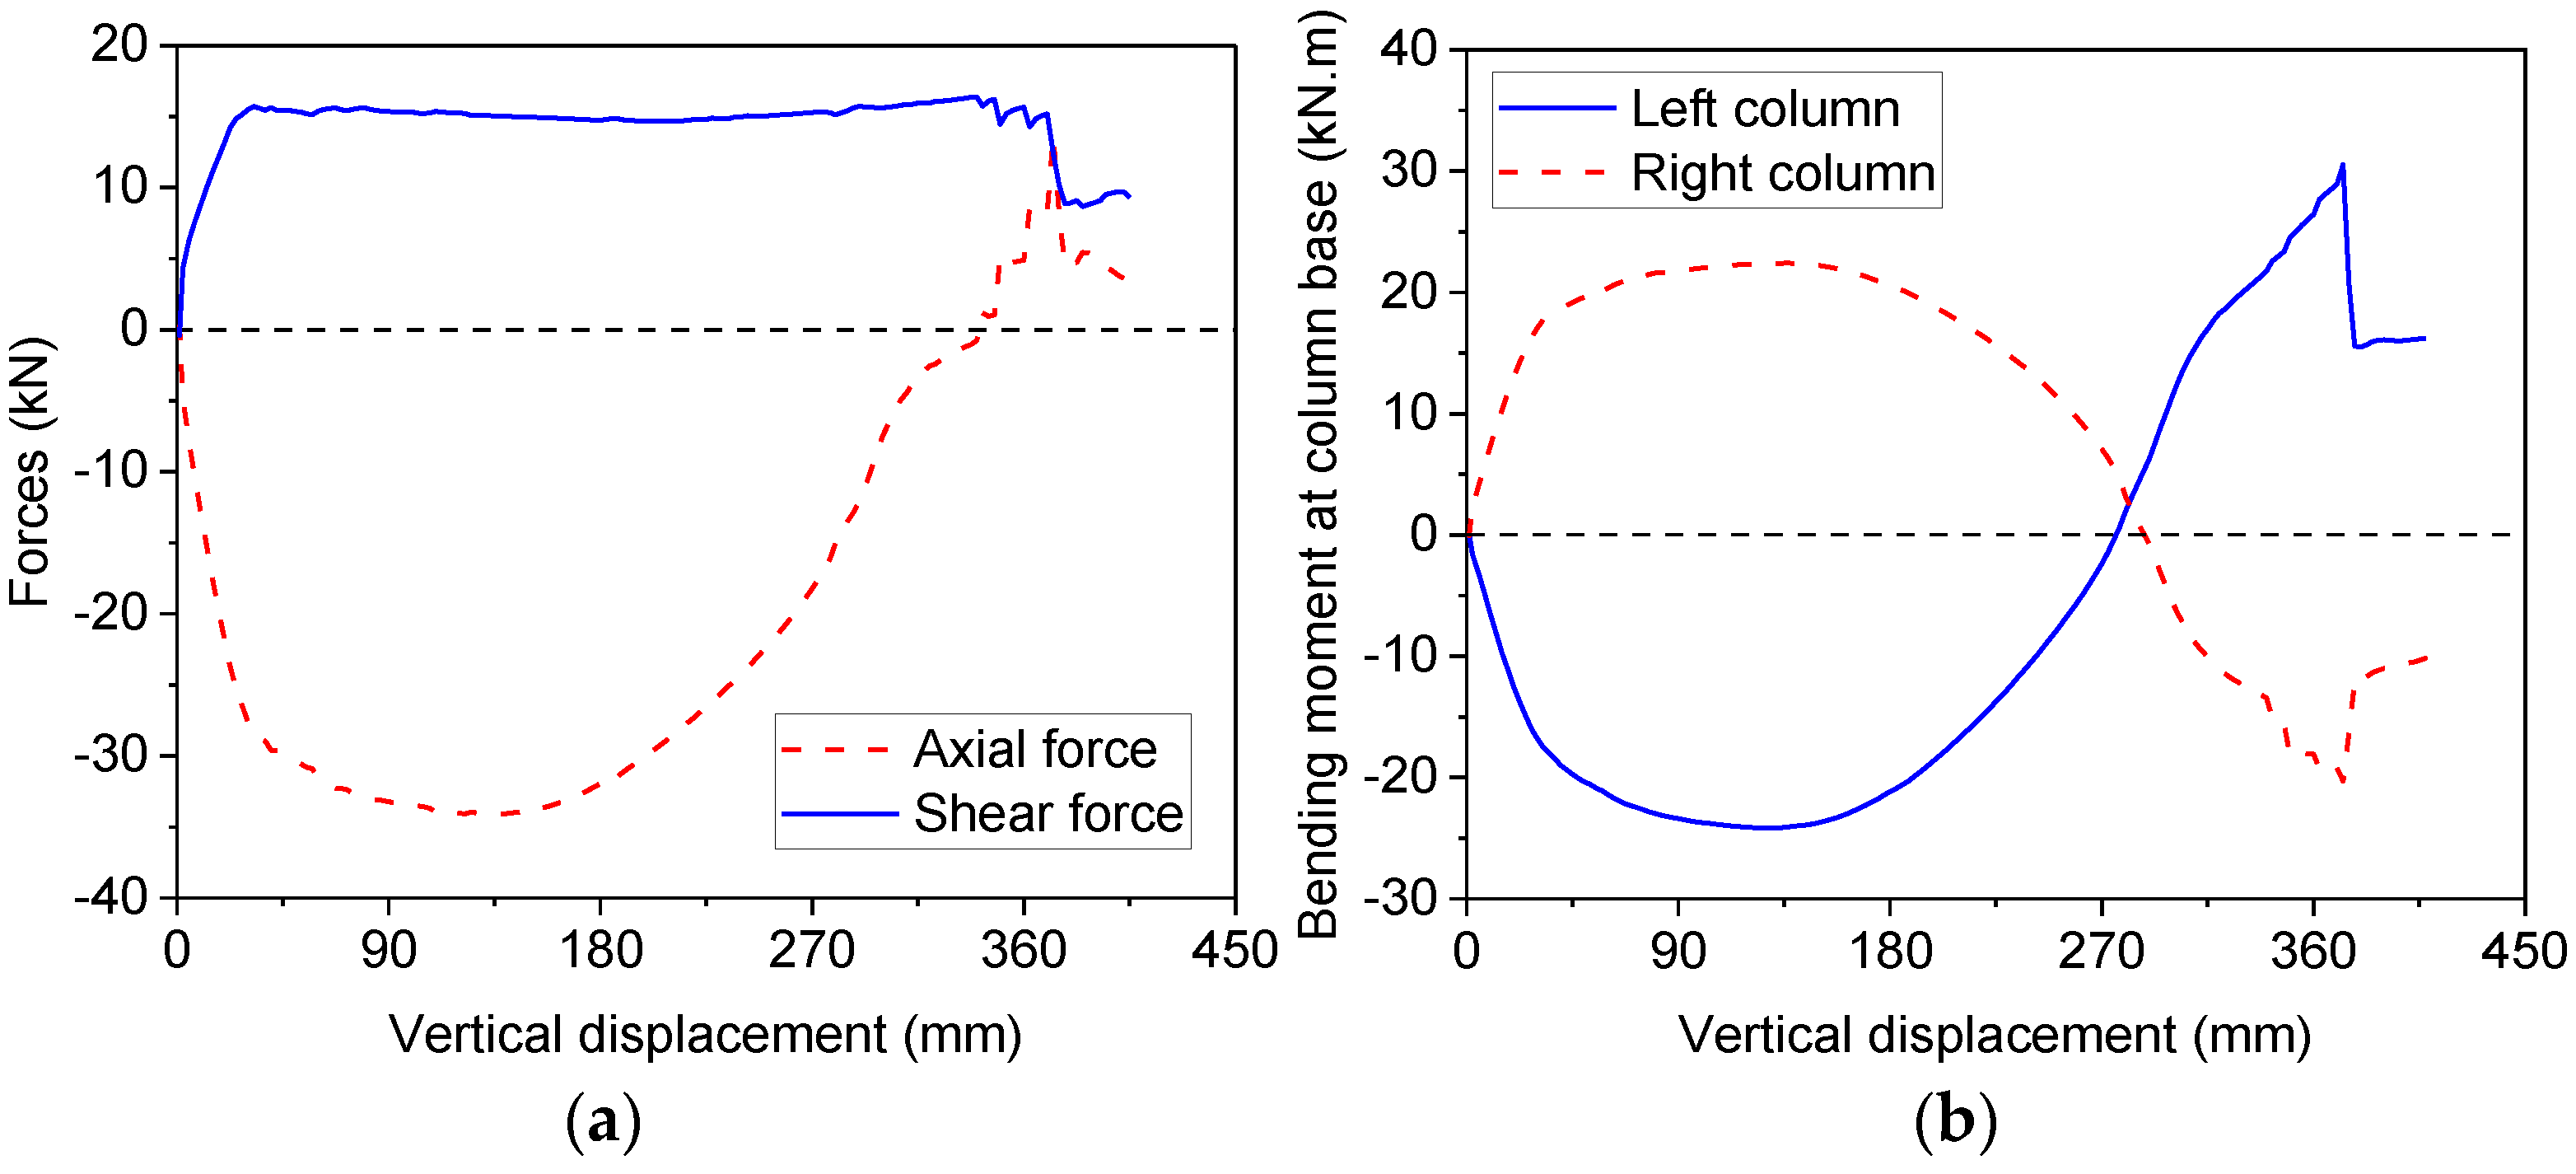
3.3. Force Transfer Mechanism

To investigate the force transfer mechanism of the single-storey frame under progressive collapse scenarios, axial and shear forces acting at the beam end are extracted from the numerical model, as shown in Figure 9a. It can be observed from the figure that the axial force in the beam is compressive when the vertical displacement is less than 340 mm, suggesting the development of compressive arch action in the beam. The peak axial compression is 34 kN, attained at a vertical displacement of 132.5 mm. Once the vertical displacement exceeds 340 mm, axial tension develops in the beam, indicating the mobilisation of catenary action. The peak tension force at the failure of the beam is 13.7 kN. The shear force at the beam end decreases with the increasing axial tension in the beam. In addition to the beam force, the bending moment at the column base is also obtained in the numerical model, as shown in Figure 9b. It can be observed that when the vertical displacement is less than 275 mm, the bending moments at the left and right column bases are close to each other. However, at the failure of the frame, the bending moment at the left column base is roughly 50% greater than that at the right column base, which leads to flexural failure of the left column base (see Figure 6). Therefore, it can be concluded from the numerical simulation that the single-storey reinforced concrete frame can develop compressive arch action and catenary action to resist progressive collapse, even though flexural failure of one column hinders the full development of catenary action capacity.

4. Behaviour of Two-Storey Frame

Under progressive collapse scenarios, two-storey frames may behave differently due to the effect of Vierendeel action. Thus, numerical simulations were also conducted on two-storey frames tested by Shan et al. [23]. The frame consisted of four bays of beams and two storeys of columns. Details of the frame can be found in [23], including the geometric dimension and reinforcement details. During analyses, a displacement-control loading is applied to the middle column, and restraints are provided for the footing.

4.1. Global Behaviour of Frame

Comparisons are made between numerical and experimental results of the two-storey frame in terms of the load–displacement relationship and lateral deflections of columns at different storeys, as shown in Figure 10. It can be observed from Figure 10a that the numerical load–displacement curve agrees well with the experimental one, but the load capacity of the same at final failure is overestimated by the numerical model by roughly 28%. Figure 10b,c shows the comparison of numerical and experimental lateral deflections of columns at the first and second storeys. Note that the lateral displacement in the figure refers to the displacement measured at the left column. It can be observed that the lateral deflection of columns can also be obtained from the numerical model with good accuracy.

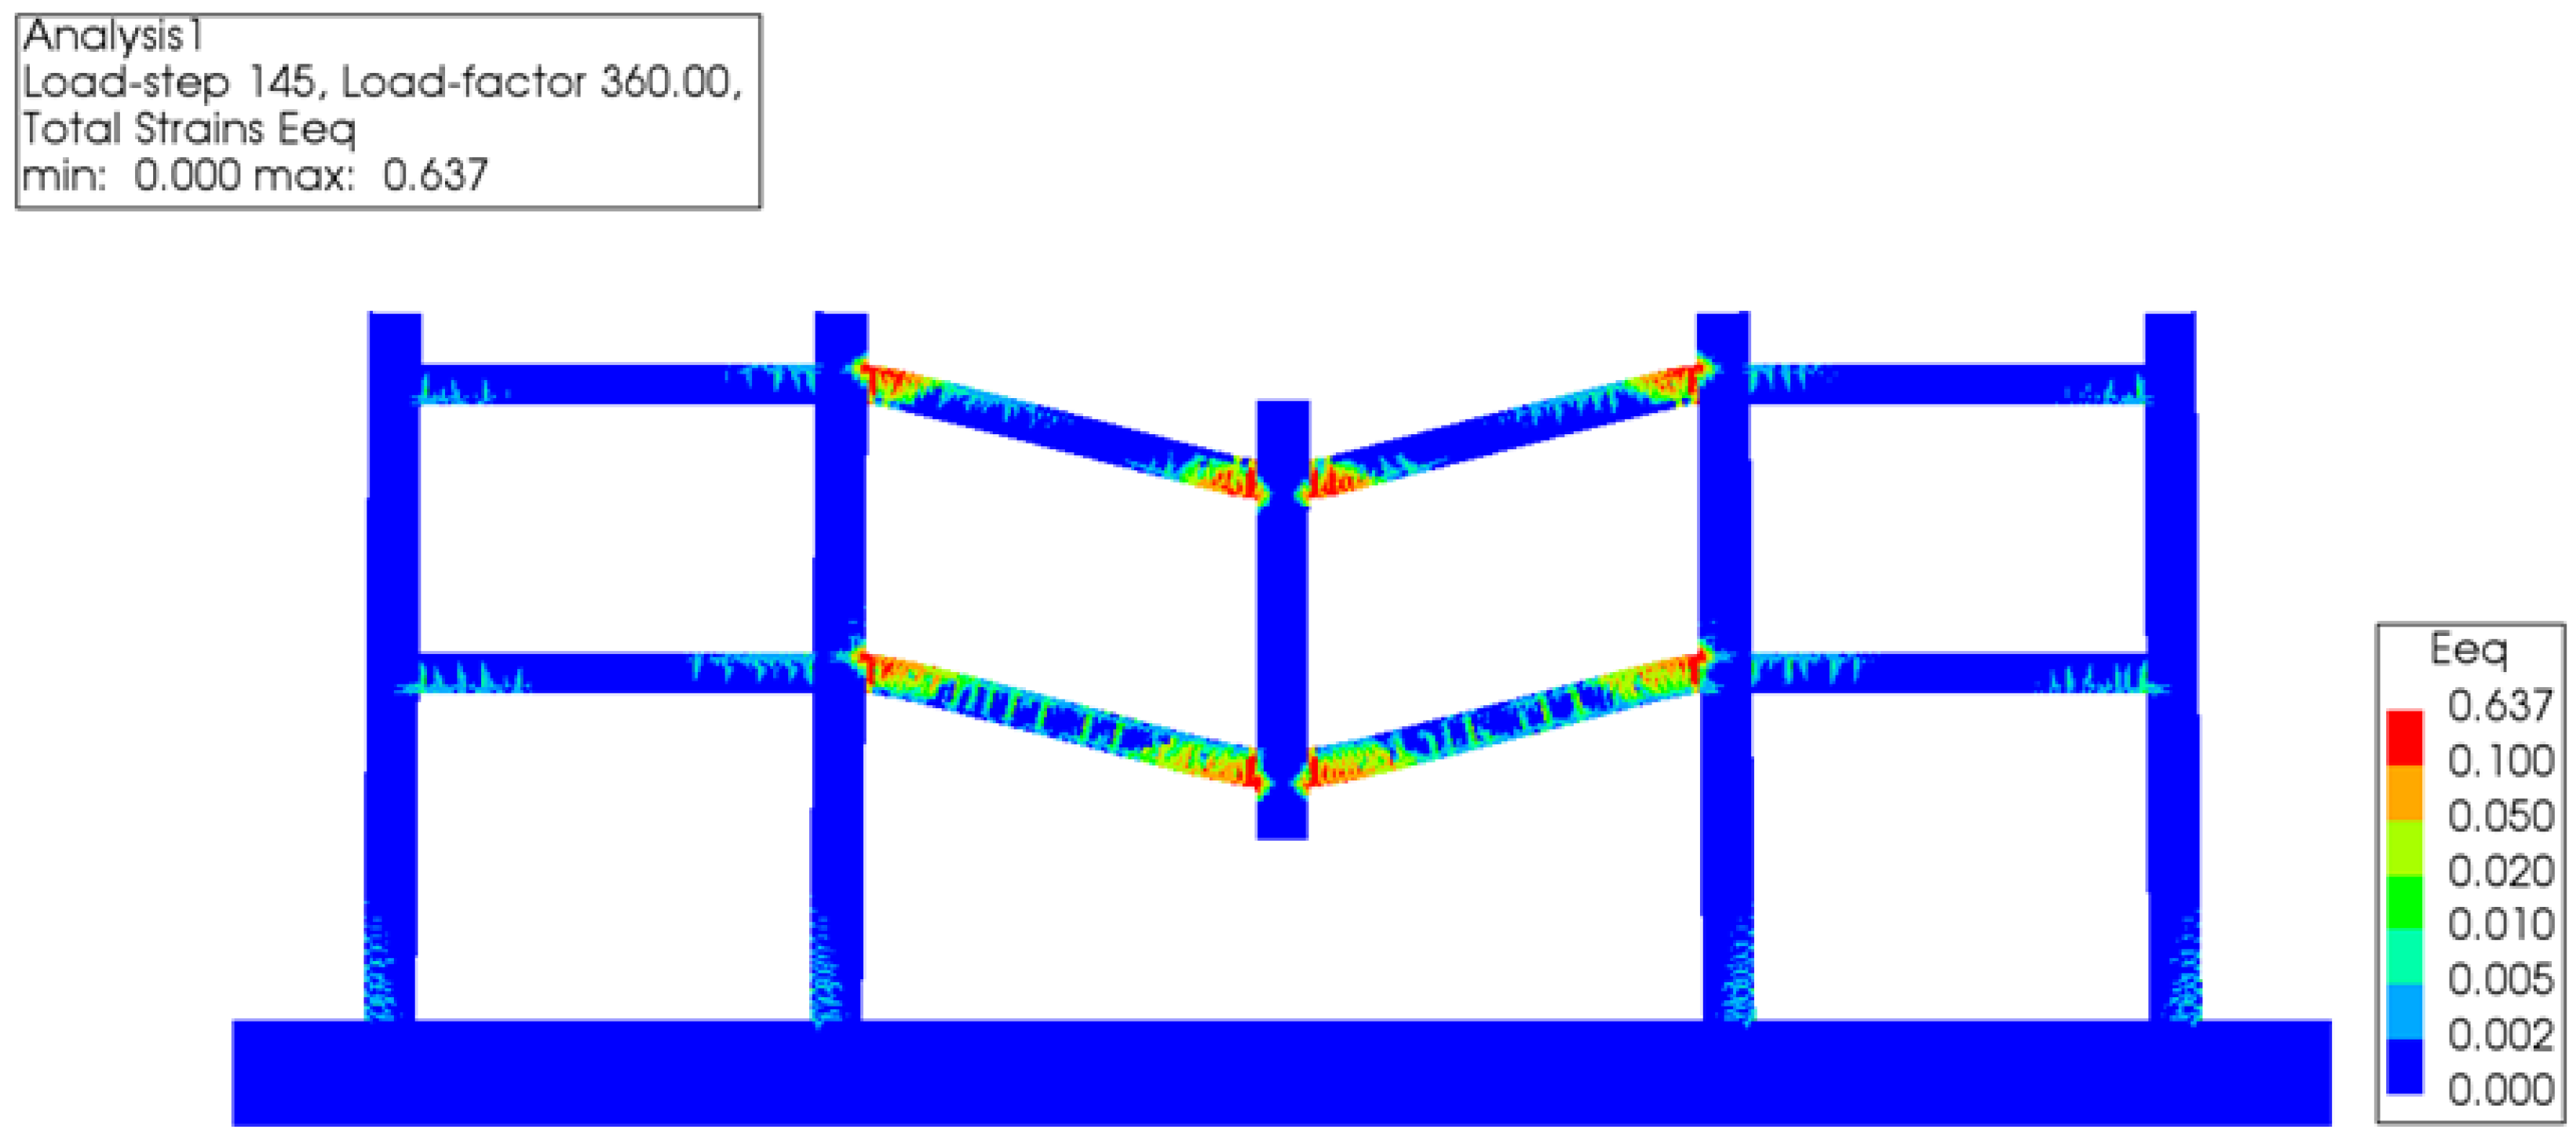
4.2. Failure Mode of Two-Storey Frame

Figure 11 shows the numerical failure mode of the two-storey frame under progressive collapse scenarios. The contour represents the failure mode of the frame at 360 mm vertical displacement. It can be observed that after the failure of a middle column, only the beams directly connecting to the column exhibit significant damage, whereas the beam and column adjacent to the affected spans only show limited cracks. Moreover, due to the presence of two columns on each side of the middle column, flexural failure of columns does not occur, even though catenary action develops in the bridging beam. In general, the crack pattern and failure mode of the frame agree well with experimental observations.

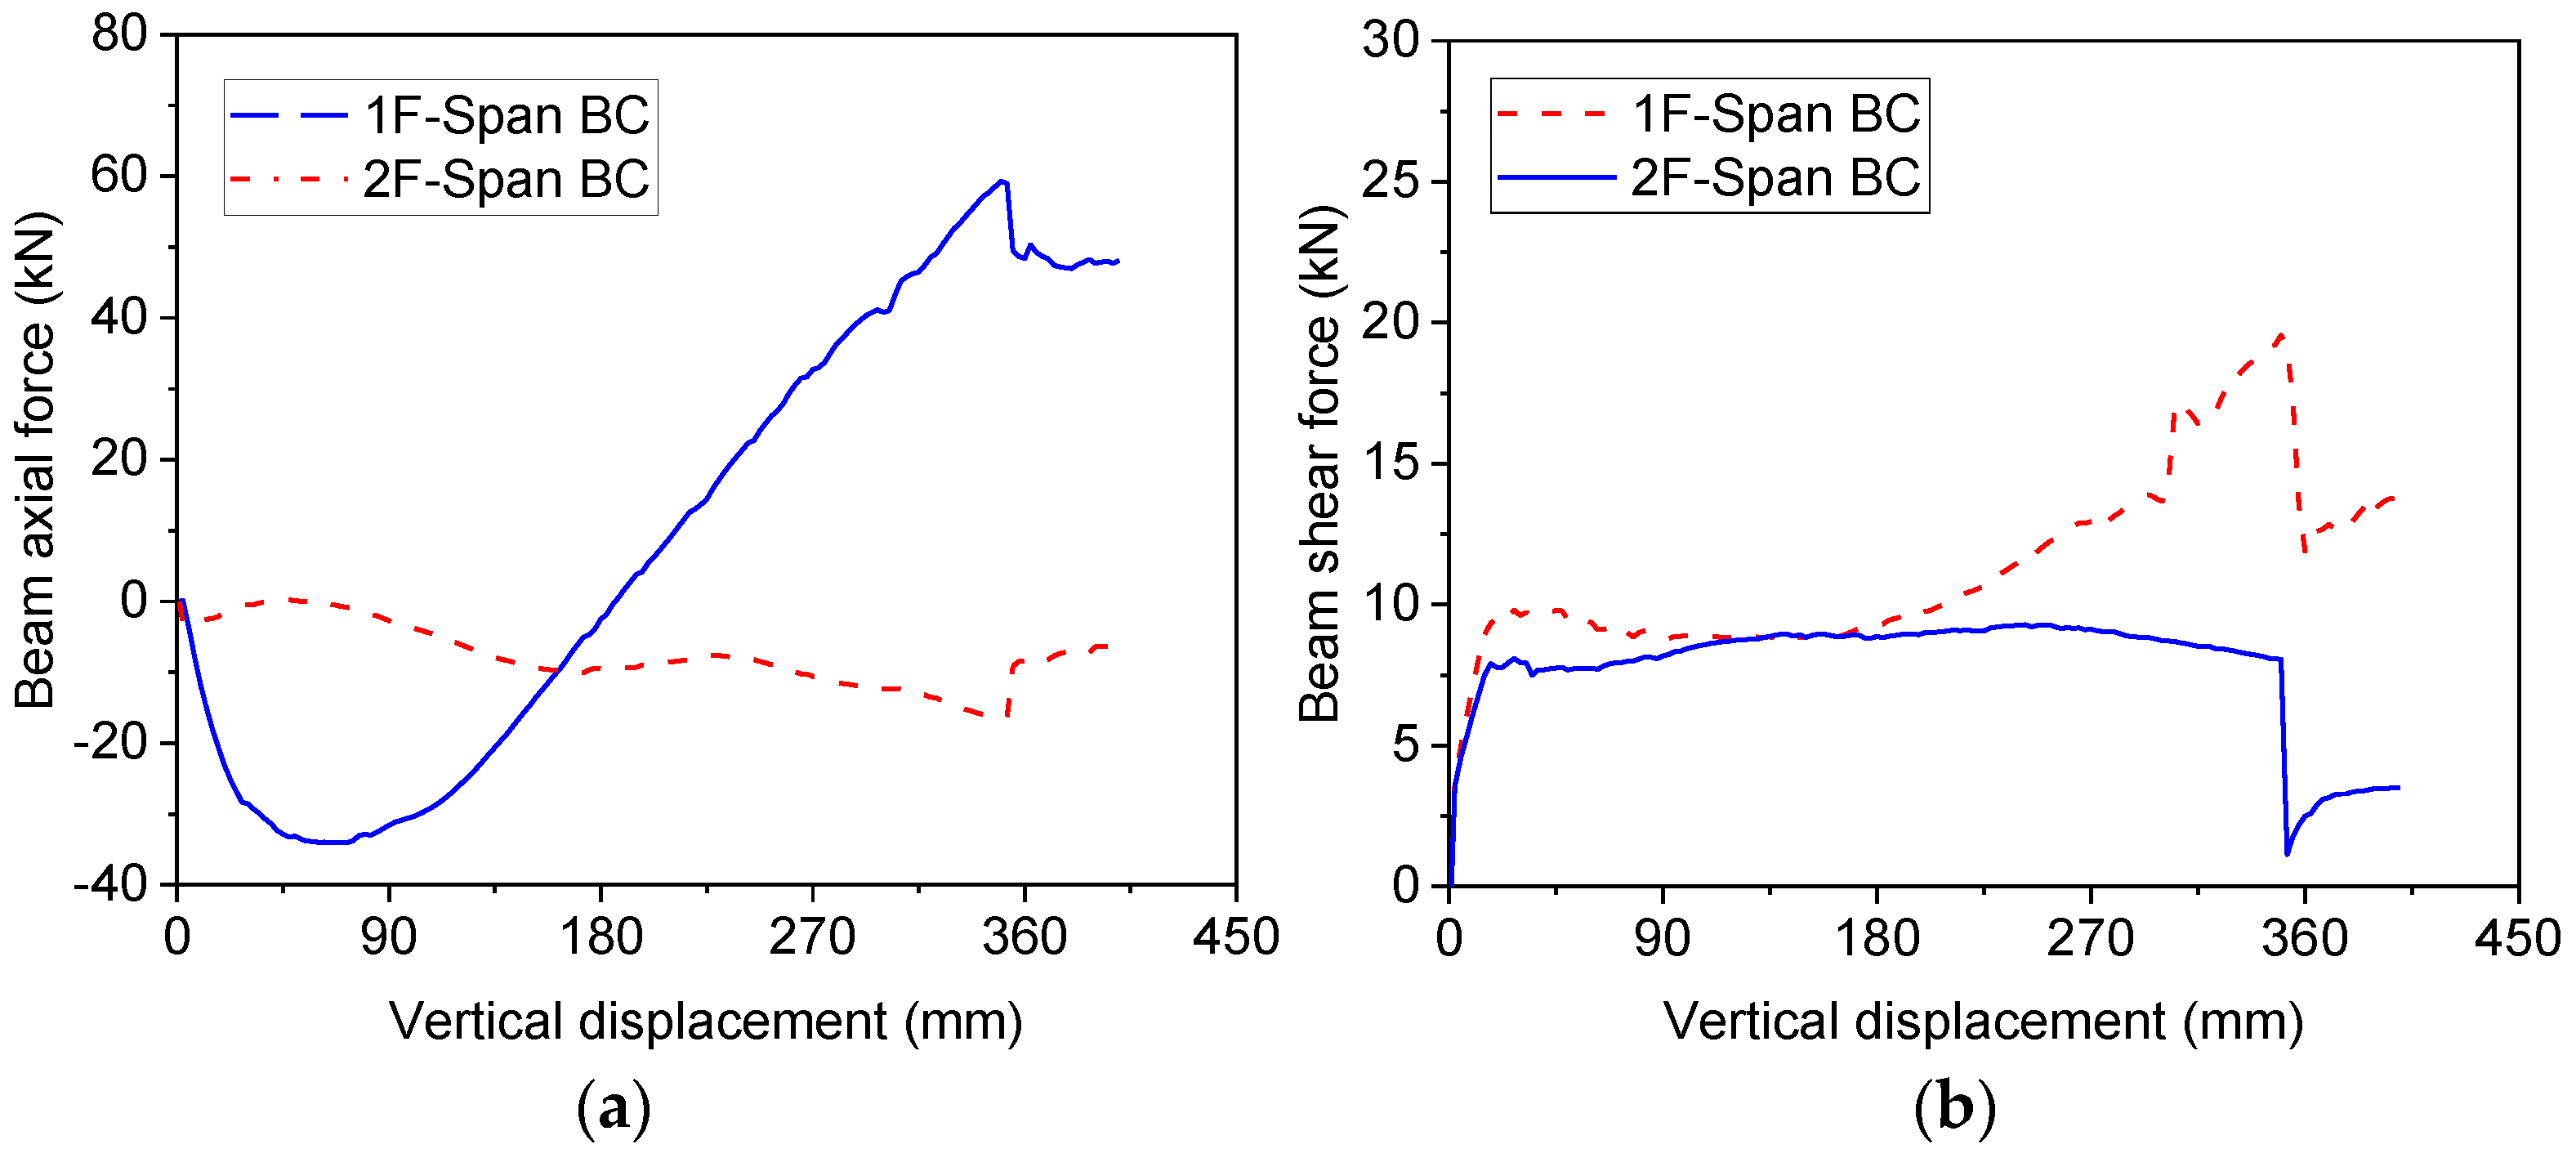
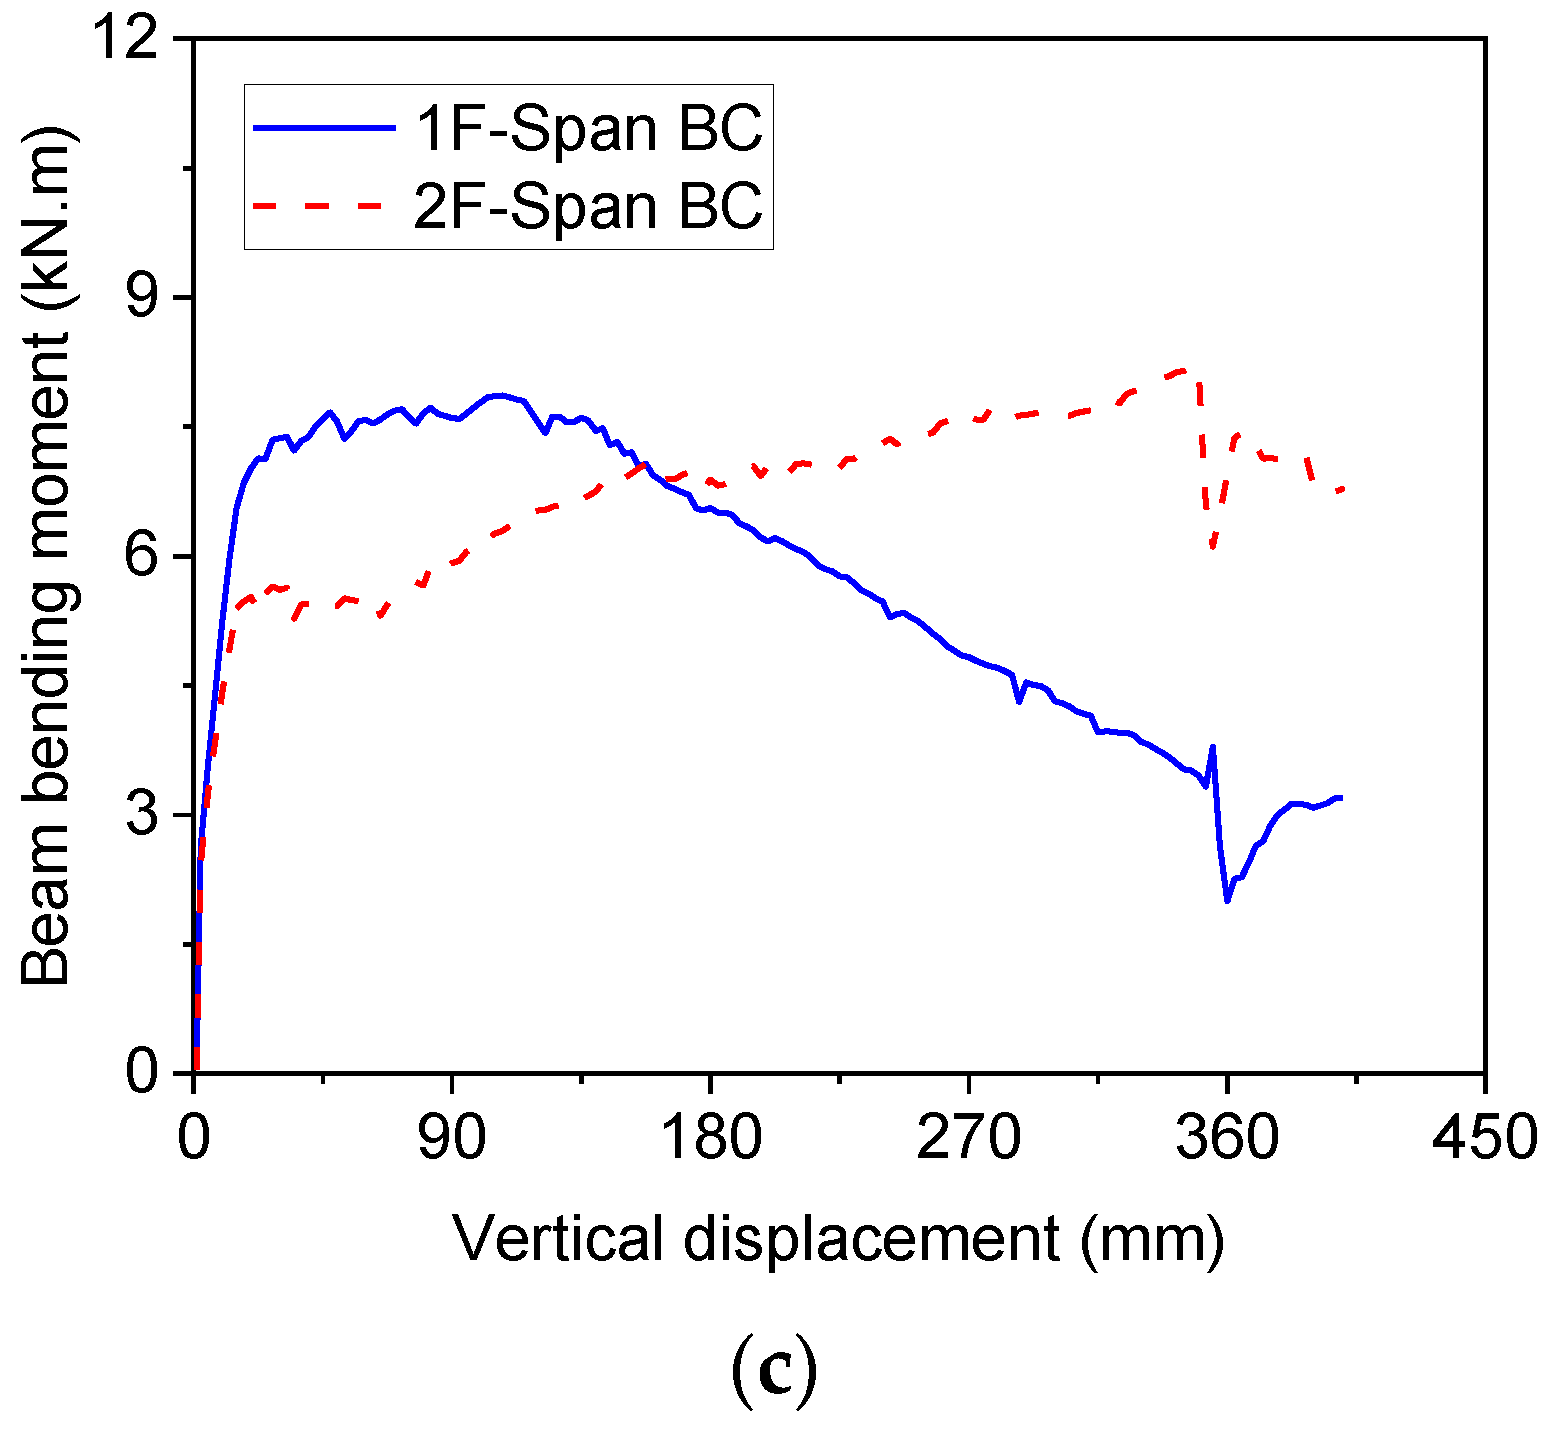
4.3. Force Transfer Mechanisms

Figure 12 shows the variation of beam axial force, shear force and bending moment at different storeys. In the figure, IF and 2F denotes the beam at the first and second floors, respectively, and vertical displacement denotes the displacement of the removed column. Note that span BC refers to the beam on the left side of the damaged column. A similar definition is used in the subsequent section. It can be observed from Figure 12a that at the initial loading stage, only the first floor develops significant axial compression in the bridging beam, whereas the second storey only develops rather limited compression force. Moreover, with increasing vertical displacement, the axial compression in the first-storey beam is gradually shifted to tension, indicating the formation of catenary action in the beam, whereas the compression force in the second-storey beam increases slowly until final failure occurs. With the increase of the axial compression in the second-storey beam, the associated shear force at the beam end is also increased, as shown in Figure 12b. Different variations of bending moment are also obtained at the beam ends of different storeys, as shown in Figure 12c. At the first storey, the development of axial tension in the beam decreases the bending moment at the beam end. However, the beam-end bending moment is slightly increased due to the increasing axial compression in the beam at the second storey. Note that the shear force and bending moment are extracted at the left end of the beam. Therefore, when a two-storey reinforced concrete frame is considered in the progressive collapse design, the difference between beam behaviour at the first and second storey should be taken into account to accurately evaluate the progressive collapse resistance of the frame.

5. Behaviour of Three-Storey Frame

Yi et al. [14] tested a four-bay three-storey frame under progressive collapse scenarios. In the frame, a middle column was assumed to have failed and the remaining structural members were tested to failure to determine the load resistance and failure mode of the frame. Details of the frame can be found in [14].

5.1. Global Behaviour of Frame

Figure 13 shows the behaviour of the three-storey frame subjected to progressive collapse. It can be observed from Figure 13a that the numerical load–displacement curve is in good agreement with the experimental one, with nearly the same load capacity under compressive arch action, but the ultimate load of the frame is slightly underestimated by 9% by the numerical model. The difference between the load–displacement curves mainly lies in the initial stiffness and the displacement at which the beam bottom reinforcement fractures. The difference in the initial stiffness might result from the different mechanical properties of concrete in the experimental tests and numerical simulations, such as the modulus of elasticity. In the numerical model, the bottom reinforcement fractures at a greater displacement that that in the experimental test, and thus the ultimate load capacity of the frame is overestimated. Comparisons are also made between numerical and experimental lateral displacements of columns at different storeys, as shown in Figure 13b–d. Note that the displacement refers to the value at the left side of the frame. It can be observed that the numerical model can also predict the lateral displacement of columns at different storeys. Similarly to single-storey and two-storey frames, the columns in the three-storey frame are pushed away from the middle column at the initial stage, namely, when the vertical displacement is less than one-beam depth. With increasing vertical displacement, the column is pulled towards the middle column, and the maximum lateral displacement can be up to 15 mm.

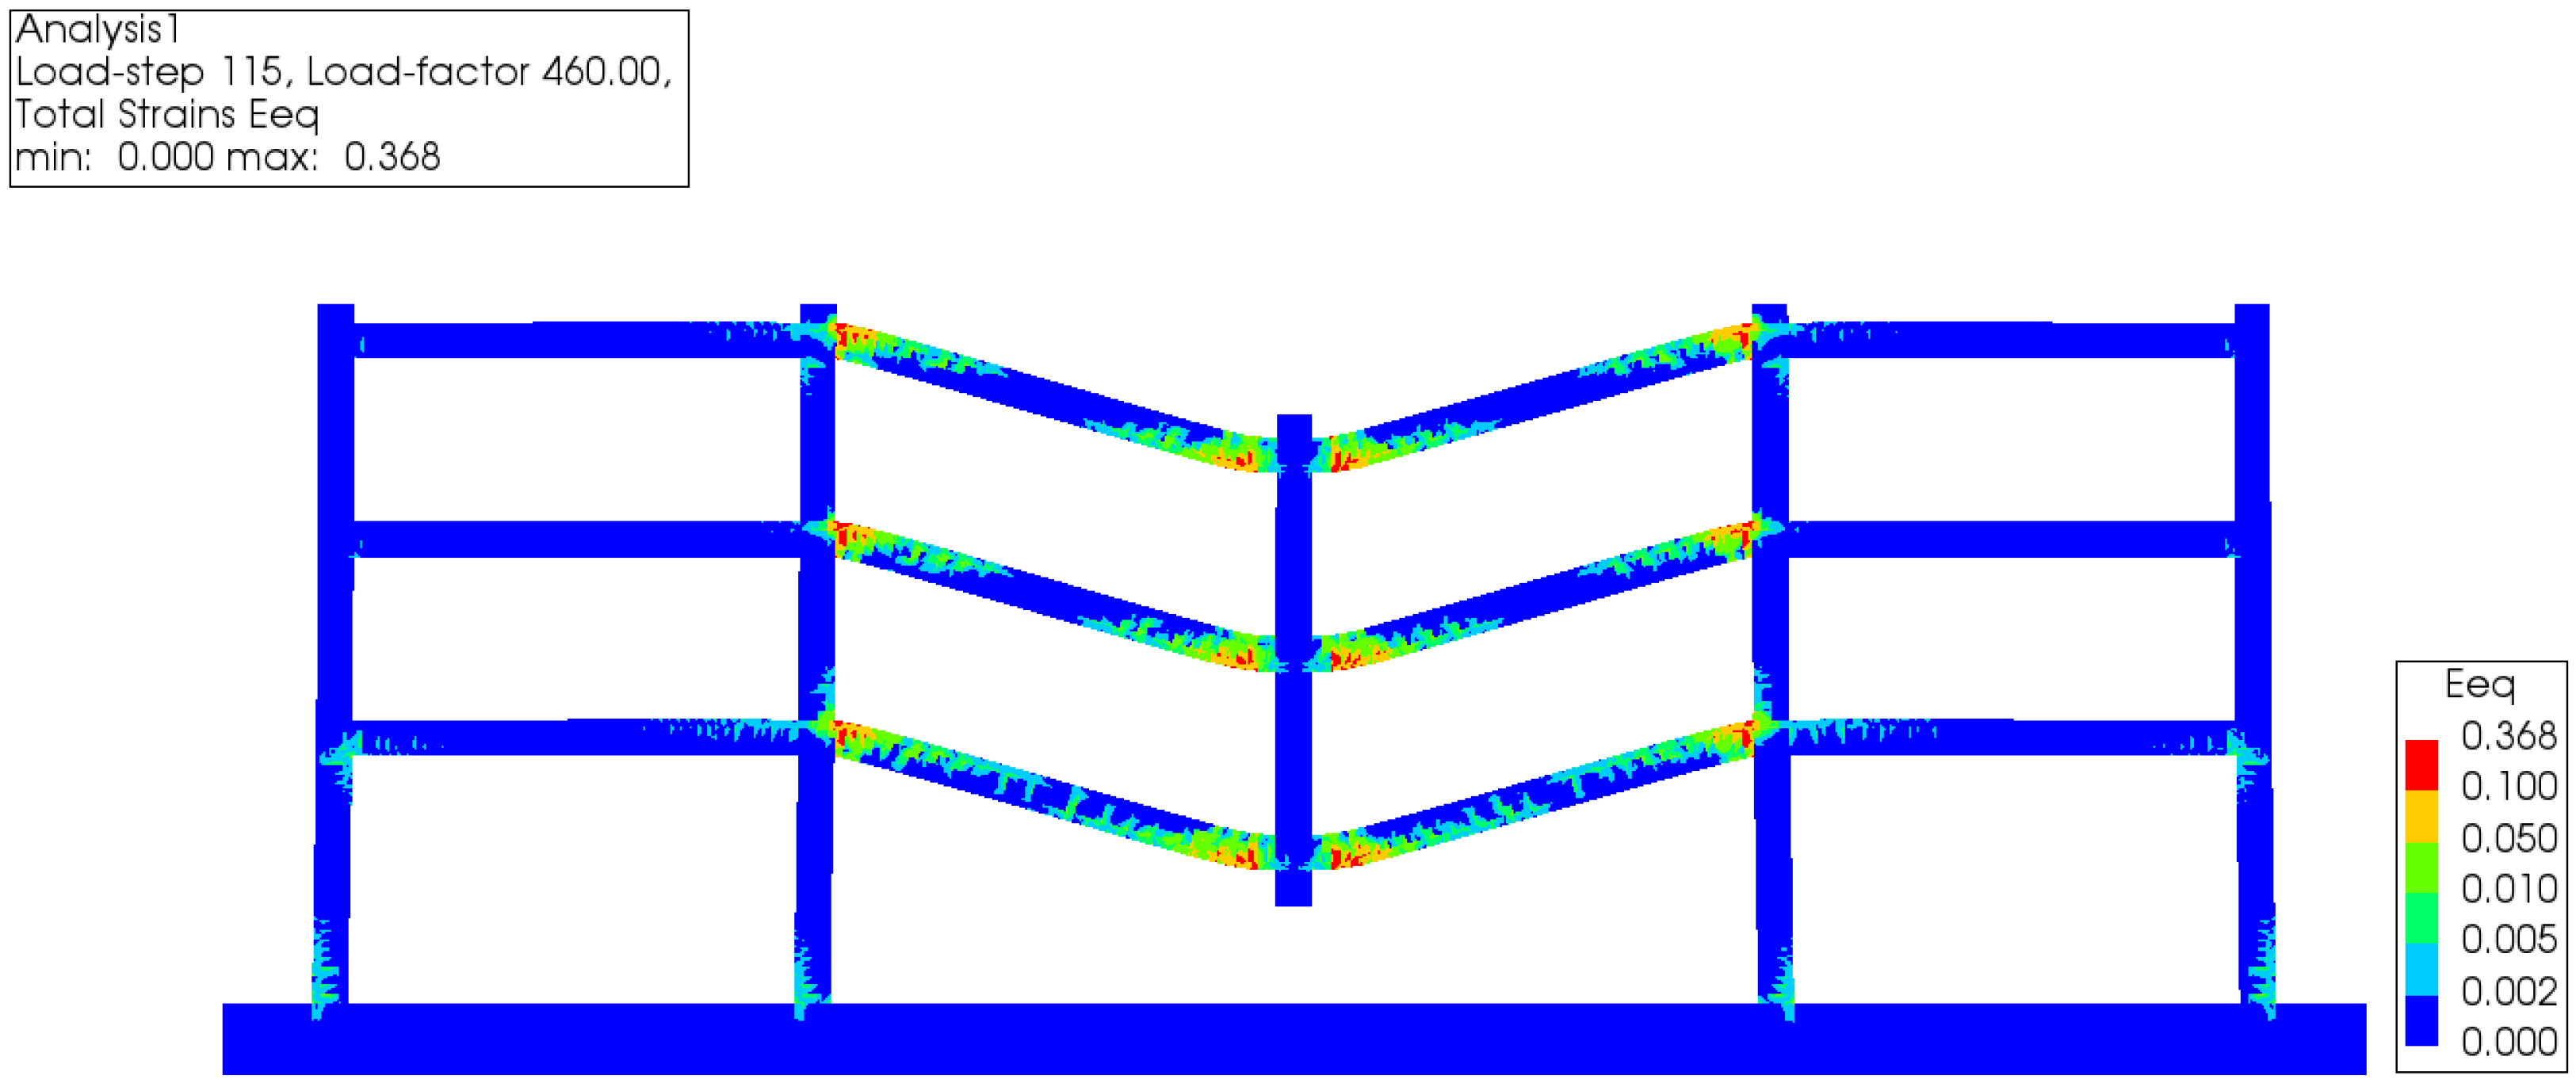
5.2. Failure Mode of Three-Storey Frame

Similarly to the two-storey frame, the three-storey frame develops cracks and flexural failure of beams above the damaged column, as shown in Figure 14. Note that the contour represents the failure mode of the frame at 460 mm vertical displacement. The beam at the first storey shows more severe damage than those at the second and third storeys, indicating that progressive collapse of the frame might occur at the first storey and propagate to the second and the third storey. As for the columns, only those at the first storey exhibit visible damage, whereas the columns at the second and third storeys remain intact. Thus, the numerical failure mode of the frame is in good agreement with the experimental results.

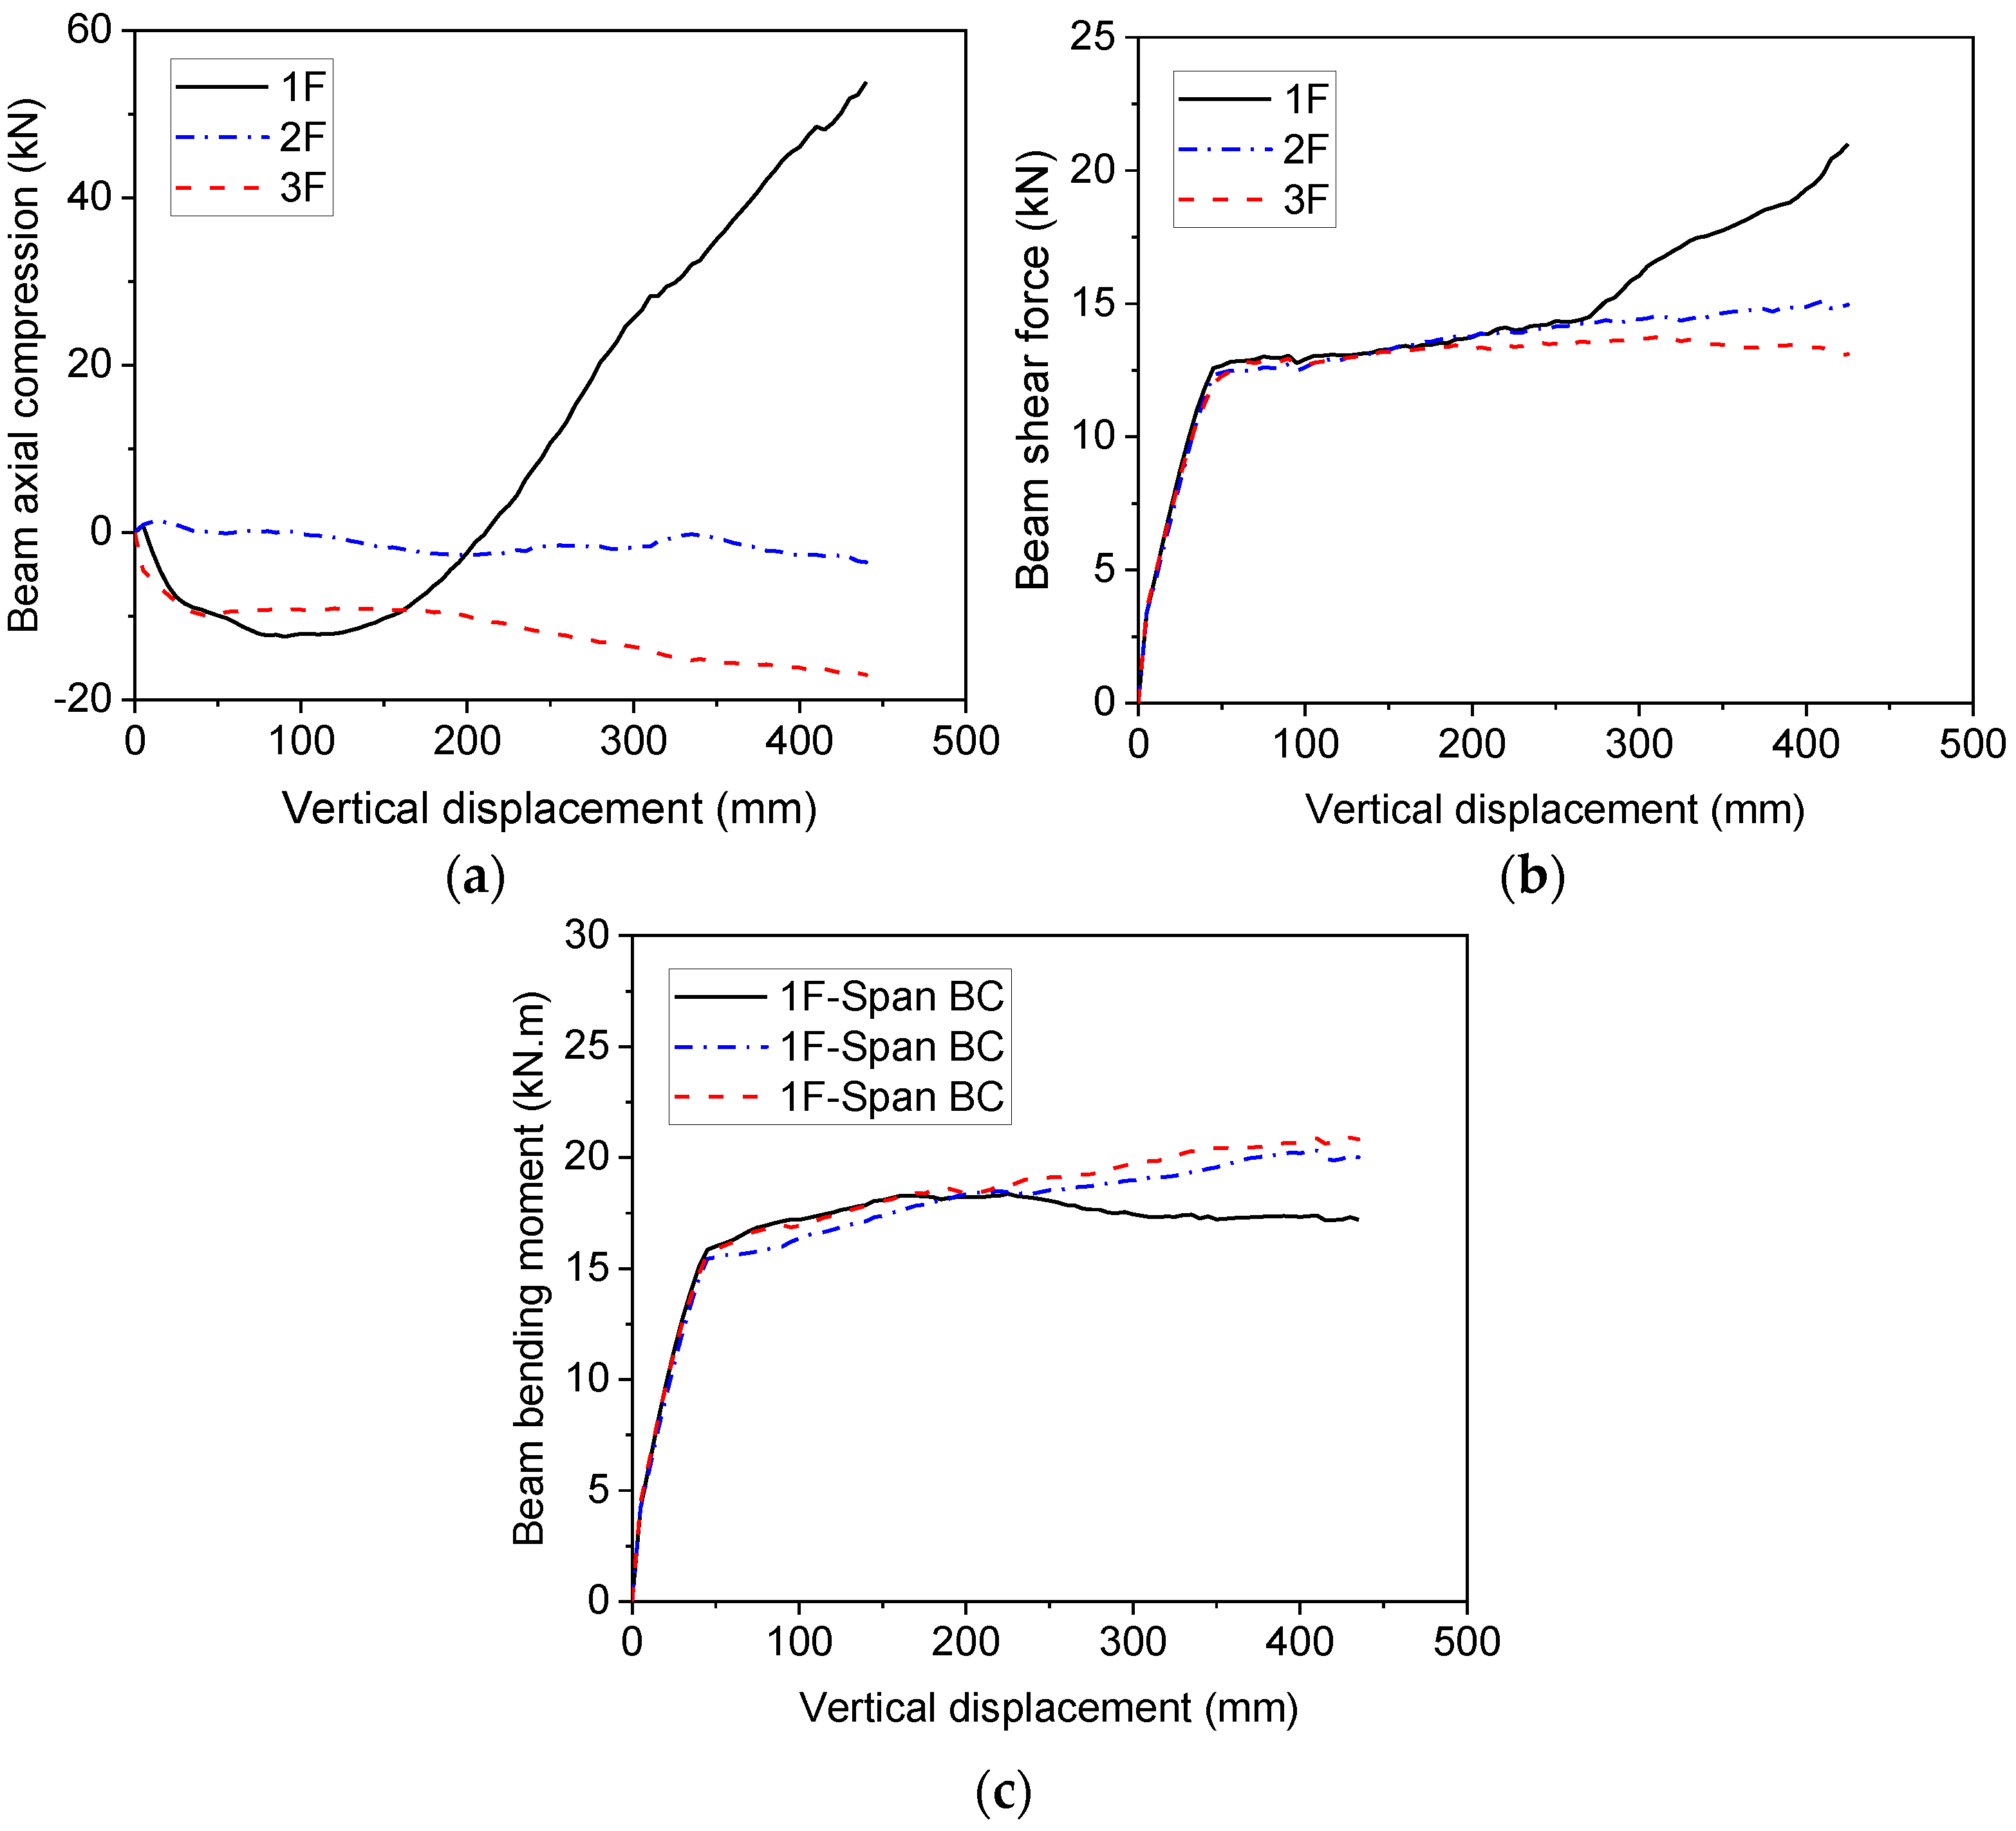
5.3. Force Transfer Mechanisms

Figure 15a shows the variation of axial force of beams at different storeys. It can be observed that the beam at the first storey develops axial compression force when the vertical displacement is less than 200 mm, and then is gradually converted to tension force with increasing vertical displacement. By contrast, the beams at the second and third storeys only develop axial compression force during the whole loading process. Moreover, it should be pointed out that the beam axial compression at the second storey is rather limited and can be neglected. Therefore, it can be conceived that for the three-storey frame, catenary action is only mobilised at the first storey, whereas the beam at the third storey is always subjected to an axial compression force, which forms Vierendeel action along with the tension force at the first storey. For the beam at the second storey, its axial force can be neglected in design, and thus it can be treated as a pure flexural member.
Figure 15b shows the variation in shear force of beams at different storeys. At the initial stage, the shear force of beams at different storeys is close to one another, in spite of the differences in the beam axial force. However, when the vertical displacement exceeds 270 mm, the shear force of beams at the first storey starts increasing, indicating the increasing contribution of the first-storey beam to the global resistance of the frame. Unlike the shear force, the bending moment at the beam end shows a different variation with the vertical displacement, as shown in Figure 15c. Prior to the commencement of catenary action, the bending moment of beams at different storeys is rather close. Nonetheless, the bending moment of beams at the first storey decreases with increasing vertical displacement once catenary action develops in the beam.

6. Parametric Study

To explicitly investigate the influence of the number of storeys on the load resistance of frames under progressive collapse, a prototype planar frame is designed according to Chinese code GB50010-2010 [24], as shown in Figure 16. The frame consists of four spans of 2200 mm. The height of the ground storey is 1400 mm, and for other storeys the height is kept at 1200 mm. The cross-sections of beams and columns are 100 mm × 200 mm and 200 mm × 200 mm, respectively. Reinforcement details in the beam and column remain the same as those in the frame tested by Tan [22]. The number of storeys of the frame varies from one to five to investigate the influence on load resistance of frames by using numerical simulations. In the design of frames, only the vertical load is considered. The mechanical properties of steel reinforcement and concrete are also the same as those used by Tan [22]. More details of the frame can be found in [22].
Figure 17 shows the vertical load–displacement curves of frames with different storeys. In the figure, K1 through K5 represent frames with one through five storeys. It can be observed that by increasing the number of storeys, both the compressive arch action capacity and the catenary action capacity can be increased. Table 1 lists the load capacities of frames under compressive arch action and catenary action. By increasing one storey, the compressive arch action capacity of frames is increased by roughly 26 kN. Note the increase in the compressive arch action capacity is less than the load capacity of frame K1 with only one storey. Likewise, the catenary action capacity of the frame is increased by around 34 kN when it is increased by one more storey. The increase in the catenary action capacity of frames is much smaller than the catenary action capacity of K1. The foregoing behaviour results from the force transfer mechanism of the multi-storey frame. As concluded in the previous section, significant compressive arch action and subsequent catenary action only develop at the first storey of reinforced concrete frames. When the number of storeys is increased in multi-storey frames, the upper storey mainly sustains loads through flexural action, rather than compressive arch action and catenary action. Therefore, the increase in the load capacity of frames is smaller than the load capacity of the first-storey frame. With an increasing number of storeys, the ratio of catenary action capacity to compressive arch action capacity decreases.
Figure 18 shows the comparisons of beam axial forces at the first and top storeys. It can be observed from Figure 18a that at the initial loading stage, the beam axial force at the first storey of frames is rather close, whereas differences in the beam axial force of single-storey and multi-storey frames becomes increasingly significant when the vertical displacement is greater than 150 mm. In general, multi-storey frames can develop catenary action at a smaller vertical displacement than the single-storey frame. Moreover, the peak axial tension under catenary action is also larger in the multi-storey frame than that in the single-storey frame. Nevertheless, the beam axial force at the top storey remains compressive and limited differences exist in the axial force at the top storey, as shown in Figure 18b. Note that the axial force in beams of other storeys is rather limited during the whole loading process, and thus it is not included in the figure.

7. Development of Design Method

In design of building structures, most standards only allow the use of compressive arch action capacity out of conservatism. Therefore, in accordance with the numerical results, a design equation is proposed to quantify the load capacity of multi-storey frames against progressive collapse, as expressed in Equation (1).
P t o t a l = P C A 1 + i = 2 n P F A i
where P C A 1 is the load capacity of the first-storey beam under compressive arch action and P F A i is the flexural capacity of beams at the upper storeys.
In the equation, the load capacity of beams under compressive arch action can be determined from Equation (2).
P C A 1 = 2 M 1 + M 2 N δ L
where M 1 and M 2 are the positive and negative bending moments at beam ends, N is the axial compression of beams under compressive arch action, δ is the vertical deflection of beams at the compressive arch action capacity and can be determined in accordance with Lu’s equation [25], and L is the clear span of beams.
In the calculation of M 1 and M 2 , the axial compression in the beam should be considered, and thus the bending moments can be determined from the axial force-bending moment interaction diagram of beams. To simplify the calculation, the interaction diagram of axial force and bending moment can be assumed to be linear at the compressive arch action stage, and the bending moment at the beam end can be calculated from Equation (3).
M 1 = M 0 + N N c r M c r M 0
where M 0 is the moment capacity of beam sections in pure bending, N c r is the axial compression of beams at balanced failure, and M c r is the bending moment of beam sections at balanced failure.
In Equation (3), the axial compression force of beams can be calculated from the method derived by Kang and Wang [26]. A similar equation can also be used to calculated M 2 .
The load capacity of beams at other storeys can be quantified from Equation (4). Note that in calculating the bending moment at beam ends, the axial force in the beam is neglected and the bending moment can be computed from pure flexural theory.
P F A i = 2 M 1 + M 2 L
Table 1 shows the calculated load capacity using Equation (1). Comparisons between P t o t a l and P C A suggest that the equation yields reasonably conservative estimations of the load capacity of multi-storey frames under compressive arch action. With the increasing number of storeys, the ratio of calculated to numerical results decreases slightly, as the axial compression force in the upper storey is neglected in the proposed equation.

8. Conclusions

This paper addresses the progressive collapse behaviour of multi-storey reinforced concrete frames. Numerical models are developed for different types of frames against progressive collapse, and the model is validated against test data. The variation in beam axial force, shear force and bending moment are extracted from the numerical model and analysed to gain insight into the force transfer mechanism of multi-storey frames under progressive collapse scenarios. The following conclusions can be drawn from the numerical study.
(1)
A single-storey frame can develop compressive arch action and subsequent catenary action under progressive collapse scenarios, with axial compression force in the beam at the compressive arch action stage and axial tension force at the catenary action stage.
(2)
Multi-storey reinforced concrete frames only develop compressive arch action and catenary action in the beam at the first storey, whereas beams at other storeys can develop limited axial compression force in the whole loading process.
(3)
By increasing the number of storeys, the progressive collapse resistance of frames can be increased. The increase in the load resistance depends mainly on the flexural resistance of beams at upper storeys due to the limited axial compression in the beam, in particular the beams at the storeys between the first and top storeys.
(4)
A design method is proposed based on numerical results of progressive collapse resistance of multi-storey frames. In the design method, only the compressive arch action capacity in the first-storey beam is considered, whereas flexural resistance of beams at other storeys is incorporated. Comparisons with numerical results suggest that the design method can evaluate the load resistance of multi-storey frames with reasonably good accuracy.

Author Contributions

Conceptualization, S.-B.K. and Q.-L.F.; methodology, L.T.; software, Q.-L.F. and L.T.; validation, L.T. and S.-B.K.; formal analysis, Q.-L.F. and S.-B.K.; investigation, Q.-L.F.; writing—original draft preparation, Q.-L.F. and L.T.; writing—review and editing, B.L. and S.-B.K.; supervision, S.-B.K.; project administration, B.L.; funding acquisition, Q.-L.F. All authors have read and agreed to the published version of the manuscript.

Funding

This research was funded by the Chongqing Commission of Education (KJQN202103802) and the Chongqing Water Resources and Electric Engineering College (K202214).

Data Availability Statement

The data presented in this study are available on request from the corresponding author.

Conflicts of Interest

The authors declare no conflict of interest.

References

  1. DoD. Design of Buildings to Resist Progressive Collapse; Unified Facilities Criteria (UFC) 4-023-03; Department of Defence: Washington, DC, USA, 2013.
  2. GSA. General Services Administration Alternate Path Analysis & Design Guidelines for Progressive Collapse Resistance; General Services Administration: Washington, DC, USA, 2013.
  3. Su, Y.; Tian, Y.; Song, X. Progressive collapse resistance of axially-restrained frame beams. ACI Struct. J. 2009, 106, 600–607. [Google Scholar]
  4. Yu, J.; Tan, K.H. Special Detailing Techniques to Improve Structural Resistance against Progressive Collapse. J. Struct. Eng. 2014, 140, 04013077. [Google Scholar] [CrossRef]
  5. Yu, J.; Tan, K.H. Structural Behavior of Reinforced Concrete Frames Subjected to Progressive Collapse. ACI Struct. J. 2017, 114, 63–74. [Google Scholar] [CrossRef]
  6. Kang, S.-B.; Tan, K.H. Behaviour of Precast Concrete Beam-Column Sub-assemblages Subject to Column Removal. Eng. Struct. 2015, 93, 85–96. [Google Scholar] [CrossRef]
  7. Kang, S.-B.; Tan, K.H. Robustness Assessment of Exterior Precast Concrete Frames under Column Removal Scenarios. J. Struct. Eng. 2016, 142, 04016131. [Google Scholar] [CrossRef]
  8. Alshaikh, I.M.H.; Bakar, B.H.A.; Alwesabi, E.A.H.; Akil, H.M. Experimental investigation of the progressive collapse of reinforced concrete structures: An overview. Structures 2020, 25, 881–900. [Google Scholar] [CrossRef]
  9. Yu, J.; Tan, K.H. Structural Behavior of RC Beam-Column Subassemblages under a Middle Column Removal Scenario. J. Struct. Eng. 2013, 139, 233–250. [Google Scholar] [CrossRef]
  10. Long, X.; Lee, C.K. Improved strut-and-tie method for 2D RC beam-column joints under monotonic loading. Comput. Concr. 2015, 15, 807–831. [Google Scholar] [CrossRef]
  11. Long, X.; Lee, C.K. Modelling of two-dimensional reinforced concrete beam-column joints subjected to monotonic loading. Adv. Struct. Eng. 2015, 18, 1461–1474. [Google Scholar] [CrossRef]
  12. Yu, J.; Tan, K.H. Experimental and Numerical Investigation on Progressive Collapse Resistance of Reinforced Concrete Beam-Column Sub-assemblages. Eng. Struct. 2013, 55, 90–106. [Google Scholar] [CrossRef]
  13. Kiakojouri, F.; De Biagi, V.; Chiaia, B.; Sherdaii, M.R. Strengthening and retrofitting techniques to mitigate progressive collapse: A critical review and future research agenda. Eng. Struct. 2022, 262, 114274. [Google Scholar] [CrossRef]
  14. Yi, W.J.; He, Q.F.; Xiao, Y.; Kunnath, S.K. Experimental study on progressive collapse-resistant behavior of reinforced concrete frame structures. ACI Struct. J. 2008, 105, 433–439. [Google Scholar]
  15. Sagiroglu, S. Analytical and Experimental Evaluation of Progressive Collapse Resistance of Reinforced Concrete Structures; Northeastern University: Boston, MA, USA, 2012. [Google Scholar]
  16. Qian, K.; Weng, Y.-H.; Fu, F.; Deng, X.-F. Numerical evaluation of the reliability of using single-story substructures to study progressive collapse behaviour of multi-story RC frames. J. Build. Eng. 2021, 33, 101636. [Google Scholar] [CrossRef]
  17. Sagiroglu, S.; Sasani, M. Progressive Collapse-Resisting Mechanisms of Reinforced Concrete Structures and Effects of Initial Damage Locations. J. Struct. Eng. 2014, 14, 04013073. [Google Scholar] [CrossRef]
  18. Yu, J.; Tian, J.-W. Is the Load Transfer Mechanism of Each Story in a Multi-Story Building the Same Subjected to Progressive Collapse. In Proceedings of the Structural Congress, Denver, CO, USA, 6–8 April 2017. [Google Scholar]
  19. Xiao, Y.; Kunnath, S.K.; Li, F.W.; Zhao, Y.B.; Lew, H.S.; Bao, Y. Collapse Test of Three-Story Half-Scale Reinforced Concrete Frame Building. ACI Struct. J. 2015, 112, 429–438. [Google Scholar] [CrossRef]
  20. Russell, J.M.; Sagaseta, J.; Cormie, D.; Jones, A.E.K. Historical review of prescriptive design rules for robustness after the collapse of Ronan Point. Structures 2019, 20, 365–373. [Google Scholar] [CrossRef]
  21. DIANA. DIANA Users’ Manual Release 10.2: DIANA FEA bv; DIANA: Memphis, TN, USA, 2017. [Google Scholar]
  22. Tan, L. Experimental Tests and Numerical Analysis on Progressive Collapse Behavior of Planar Reinforced Concrete Frames; Chongqing University: Chongqing, China, 2022. [Google Scholar]
  23. Shan, S.; Li, S.; Xu, S.; Xie, L. Experimental study on the progressive collapse performance of RC frames with infill walls. Eng. Struct. 2016, 111, 80–92. [Google Scholar] [CrossRef]
  24. GB50010-2010; Ministry of Construction. Code for Design of Concrete Structures. China Architecture & Building Press: Beijing, China, 2010.
  25. Lu, X.; Lin, K.; Li, C.; Li, Y. New analytical calculation models for compressive arch action in reinforced concrete structures. Eng. Struct. 2018, 168, 721–735. [Google Scholar] [CrossRef] [Green Version]
  26. Kang, S.B.; Wang, S. Design Approach for Compressive Arch Action in Reinforced Concrete Beams. ACI Struct. J. 2020, 117, 197–206. [Google Scholar] [CrossRef]
Figure 1. Numerical model for reinforced concrete frames. The arrows on top of the frame denote vertical loads, and those at the bottom represent vertical and horizontal restraints.
Buildings 13 00533 g001
Figure 2. Constitutive models for steel reinforcement.
Buildings 13 00533 g002
Figure 3. Constitutive models for concrete in tension and compression: (a) Hordijk model in tension; (b) Maekawa model in compression.
Buildings 13 00533 g003
Figure 4. Effect of different bond models on load–displacement curve of frames.
Buildings 13 00533 g004
Figure 5. Effect of mesh size on load–displacement curve of frames.
Buildings 13 00533 g005
Figure 6. A single-storey reinforced concrete frame under progressive collapse.
Buildings 13 00533 g006
Figure 7. Comparisons between experimental and numerical results of single-storey frame: (a) load–displacement curve; (b) lateral displacement of side columns.
Buildings 13 00533 g007
Figure 8. Numerical failure mode of single-storey frame.
Buildings 13 00533 g008
Figure 9. Comparisons between experimental and numerical results of single-storey frame: (a) axial and shear force; (b) bending moment.
Buildings 13 00533 g009
Figure 10. Comparisons between experimental and numerical results of two-storey frames: (a) load–displacement curve; (b) lateral displacement of first-storey column; (c) lateral displacement of second-storey column.
Buildings 13 00533 g010
Figure 11. Numerical failure mode of two-storey frame.
Buildings 13 00533 g011
Figure 12. Behaviour of beams at different storeys of two-storey frame: (a) axial forces in beams; (b) shear forces in beams; (c) bending moments in beams.
Buildings 13 00533 g012aBuildings 13 00533 g012b
Figure 13. Comparisons between experimental and numerical results of three-storey frames: (a) load–displacement curve; (b) lateral displacement of first-storey column; (c) lateral displacement of second-storey column; (d) lateral displacement of third-storey column.
Buildings 13 00533 g013
Figure 14. Numerical failure mode of three-storey frame.
Buildings 13 00533 g014
Figure 15. Behaviour of beams at different storeys of three-storey frame: (a) axial forces in beams; (b) shear forces in beams; (c) bending moments in beams.
Buildings 13 00533 g015
Figure 16. Multi-storey reinforced concrete frames under progressive collapse scenarios.
Buildings 13 00533 g016
Figure 17. Load resistance of frames with different storeys.
Buildings 13 00533 g017
Figure 18. Variations in beam axial force at the first and top storeys: (a) beam axial force at the first storey; (b) beam axial force at the top storey.
Buildings 13 00533 g018
Table 1. Load capacity of frames under progressive collapse.
SpecimenCompressive
Arch Action
Capacity
P C A
(kN)
Compressive
Action
Capacity
P C T
(kN)
Δ P = P C T P C A
(kN)
Δ P P C A Calculated
Value
P t o t a l
(kN)
K130.046.516.50.5530.01.00
K256.581.925.40.4554.60.97
K383.1116.233.10.4079.20.95
K4109.2148.539.30.36103.80.95
K5136.3182.045.70.34128.40.94
Disclaimer/Publisher’s Note: The statements, opinions and data contained in all publications are solely those of the individual author(s) and contributor(s) and not of MDPI and/or the editor(s). MDPI and/or the editor(s) disclaim responsibility for any injury to people or property resulting from any ideas, methods, instructions or products referred to in the content.

