Article

Failure Analysis of Damaged High-Strength Bolts under Seismic Action Based on Finite Element Method

1
School of Urban Planning and Municipal Engineering, Xi’an Polytechnic University, Xi’an 710048, China
2
State Key Laboratory of Green Building in Western China, Xi’an University of Architecture & Technology, Xi’an 710055, China
3
The Key Laboratory of Well Stability and Fluid & Rock Mechanics in Oil and Gas Reservoir of Shanxi Province, Xi’an Shiyou University, Xi’an 710065, China
4
Department of Civil and Environmental Engineering, University of Michigan, Ann Arbor, MI 48109, USA
5
China Northwest Building Design Research Institute Co., Ltd., Xi’an 710018, China
*
Author to whom correspondence should be addressed.
Buildings 2023, 13(3), 776; https://doi.org/10.3390/buildings13030776
Submission received: 20 February 2023 / Revised: 10 March 2023 / Accepted: 13 March 2023 / Published: 15 March 2023
(This article belongs to the Special Issue Sustainability and Resiliency of Building Materials and Structures)

Abstract

:
Damage of high-strength bolt (DHSB) is inevitable during long-term use. Such damage is irreversible that may not be replaced in time, and the potential danger is proven by the changes of the mechanical properties of DHSB. To investigate the mechanical properties of DHSB, this paper uses the software ABAQUS to simulate the stress of various types of DHSB under earthquake, and compares with undamaged high-strength bolts (UDHSB). The results show that the most unfavorable position of the crack is at the bottom of the second ring thread. The model with shorter crack length will have greater stress concentration and displacement deformation. The more the number of cracks, the greater the concentrated stress value. The concentrated stress generated by the tooth deformation is at the top of the thread tooth, and the concentrated stress generated by the crack is at the bottom of the thread tooth. Changing the tooth shape in the appropriate position is beneficial to reduce the degree of bolt damage. Bolt damage will double the harm, and timely replacement of damaged bolts is very time-sensitive and necessary.

Graphical Abstract

1. Introduction

Bolted connection is the most widely used connection in engineering structures, such as mechanical, civil and aviation [1]. With long-term use, the bolts will inevitably suffer from damage that may develop further. There are many engineering accidents caused by the failure to replace the bolts in time such as: the connecting bolt threads of the main hub of the aircraft are scratched, which increases the fatigue area, leading to the flight accident of bolt failure and fracture [2]; Pedestrian accident of Guangdong Shenzhen Metro caused by loosening of the fixing bolts of the failed escalator host after long-term damage [3]; The steel structure mast at the top of the radio and television tower is broken due to the failure of high-strength bolts [4]; High cycle fatigue fracture accident of connector bolt of reciprocating roller coaster vehicle due to alternating load [5]; Fault shutdown of wind turbine generator due to failure and fracture of tower bolt [6]. From the above accidents, it can be seen that if the bolt damage not timely addressed, great damage will follow up.
For damaged bolts, the most damaged area is the thread. As early as the twentieth century, some scholars have studied the thread, such as the famous Sopwith theory [7], Yamamoto theory [8], stress freezing photoelastic method [9,10], finite element method [11]. After that, more and more scholars began to pay attention to the thread and its failure form and mechanism. Chen et al. [12] analyzed the influence of screw effect and friction on thread load distribution. Toribio et al. [13] analyzed the fatigue performance of commercial bolt tensile joints, and found that in the case of short cracks, the fatigue fracture was crescent-shaped, and in the case of long cracks, this shape evolved to the straight crack front. Stéphan et al. [14] studied the forming process of thread and the problem of thread stripping. Ham et al. [15] studied the crack distribution of 10.9 and 12.9 grade high strength bolts by tensile test. Wang Wei et al. [16] studied the self-relaxation mechanism of bolted connections under vibration conditions by using ANSYS. Wang et al. [17] observed the crack damage and found that most of the copper coating had been peeled off, with obvious longitudinal growth cracks. Liu M et al. [18] studied the failure mode and corresponding tensile strength of T-shaped short column with thread fixed single-sided bolt. Yang et al. [19] conducted systematic constant amplitude fatigue tests on M20 high-strength bolts and simulated the tensile behavior of high-strength bolts in grid structures. Qu et al. [20] proposed a method to identify bolt looseness damage by extracting subharmonic components in the response spectrum. Zhang et al. [21] found that increasing the clamping force, friction coefficient of thread surface, bolt diameter and thread angle, reducing the bolt clamping length and thread angle can increase the critical loosening load and improve the bolt’s resistance to loosening. Guo et al. [22] studied Q690D high strength steel bolt and found that stress concentration would accelerate the initiation of cracks, and bolt preload could alleviate the degree of stress concentration and indirectly improve the fatigue life. Zhang et al. [23] studied the influence of bolt pretension, bolt diameter, bolt tensile strength and concrete compressive strength on the failure mode, load sliding characteristics and ultimate strength of bolted connectors. Kraemer et al. [24] studied the load distribution in the meshing thread area and analyzed the highest notch stress area. You et al. [25] studied the influence of looseness of high-strength bolts at the lower flange of the steel beam on the structure and compared the corresponding displacement and strain. Song et al. [26] conducted a performance test procedure and numerical study of austenitic stainless-steel bolts under combined tensile and shear loads. Beland et al. [27] observed the force effect of bolts by applying static, dynamic monotonic loads and cyclic loads. Wu et al. [28] established the finite element model of the bolt ball joint with threaded parts and studied the influence of the screw in error on the bending performance of the joint. Zheng et al. [29] studied high-strength stainless steel bolts and found that lubricant can make the tightening process smoother, and significantly reduce the friction coefficient, thus reducing the possibility of thread damage. Ge et al. [30] established a finite element model using Hashin criterion and modified Camanho degradation law to predict bearing load and simulate failure behavior and analyzed bolt load distribution of multi bolt joints before and after damage. Cumbicus et al. [31] studied and analyzed the influence of geometric shape of self-tapping screws in the forming process of several industrial polymer threads. Figure 1 shows the possible occurrence of cracks and thread tooth deformation in the actual case [13,15]. In the figure, ha represents the crack depth and hb represents the crack length.
In this paper, M20 high-strength bolts (HSB) are selected, and the mechanical model of bolt connection is established, and then simulated with ABAQUS software. The stress distribution and stress concentration area of bolt force are analyzed under static load and dynamic load respectively. According to the relevant literature, referring to the above damage cases, the damage is applied in the simulated model. The damage can be evaluated by number, location, depth of the crack and the shape of the tooth as variables, and then compare the effects of these different variables on the performance of the bolt with the undamaged bolt.

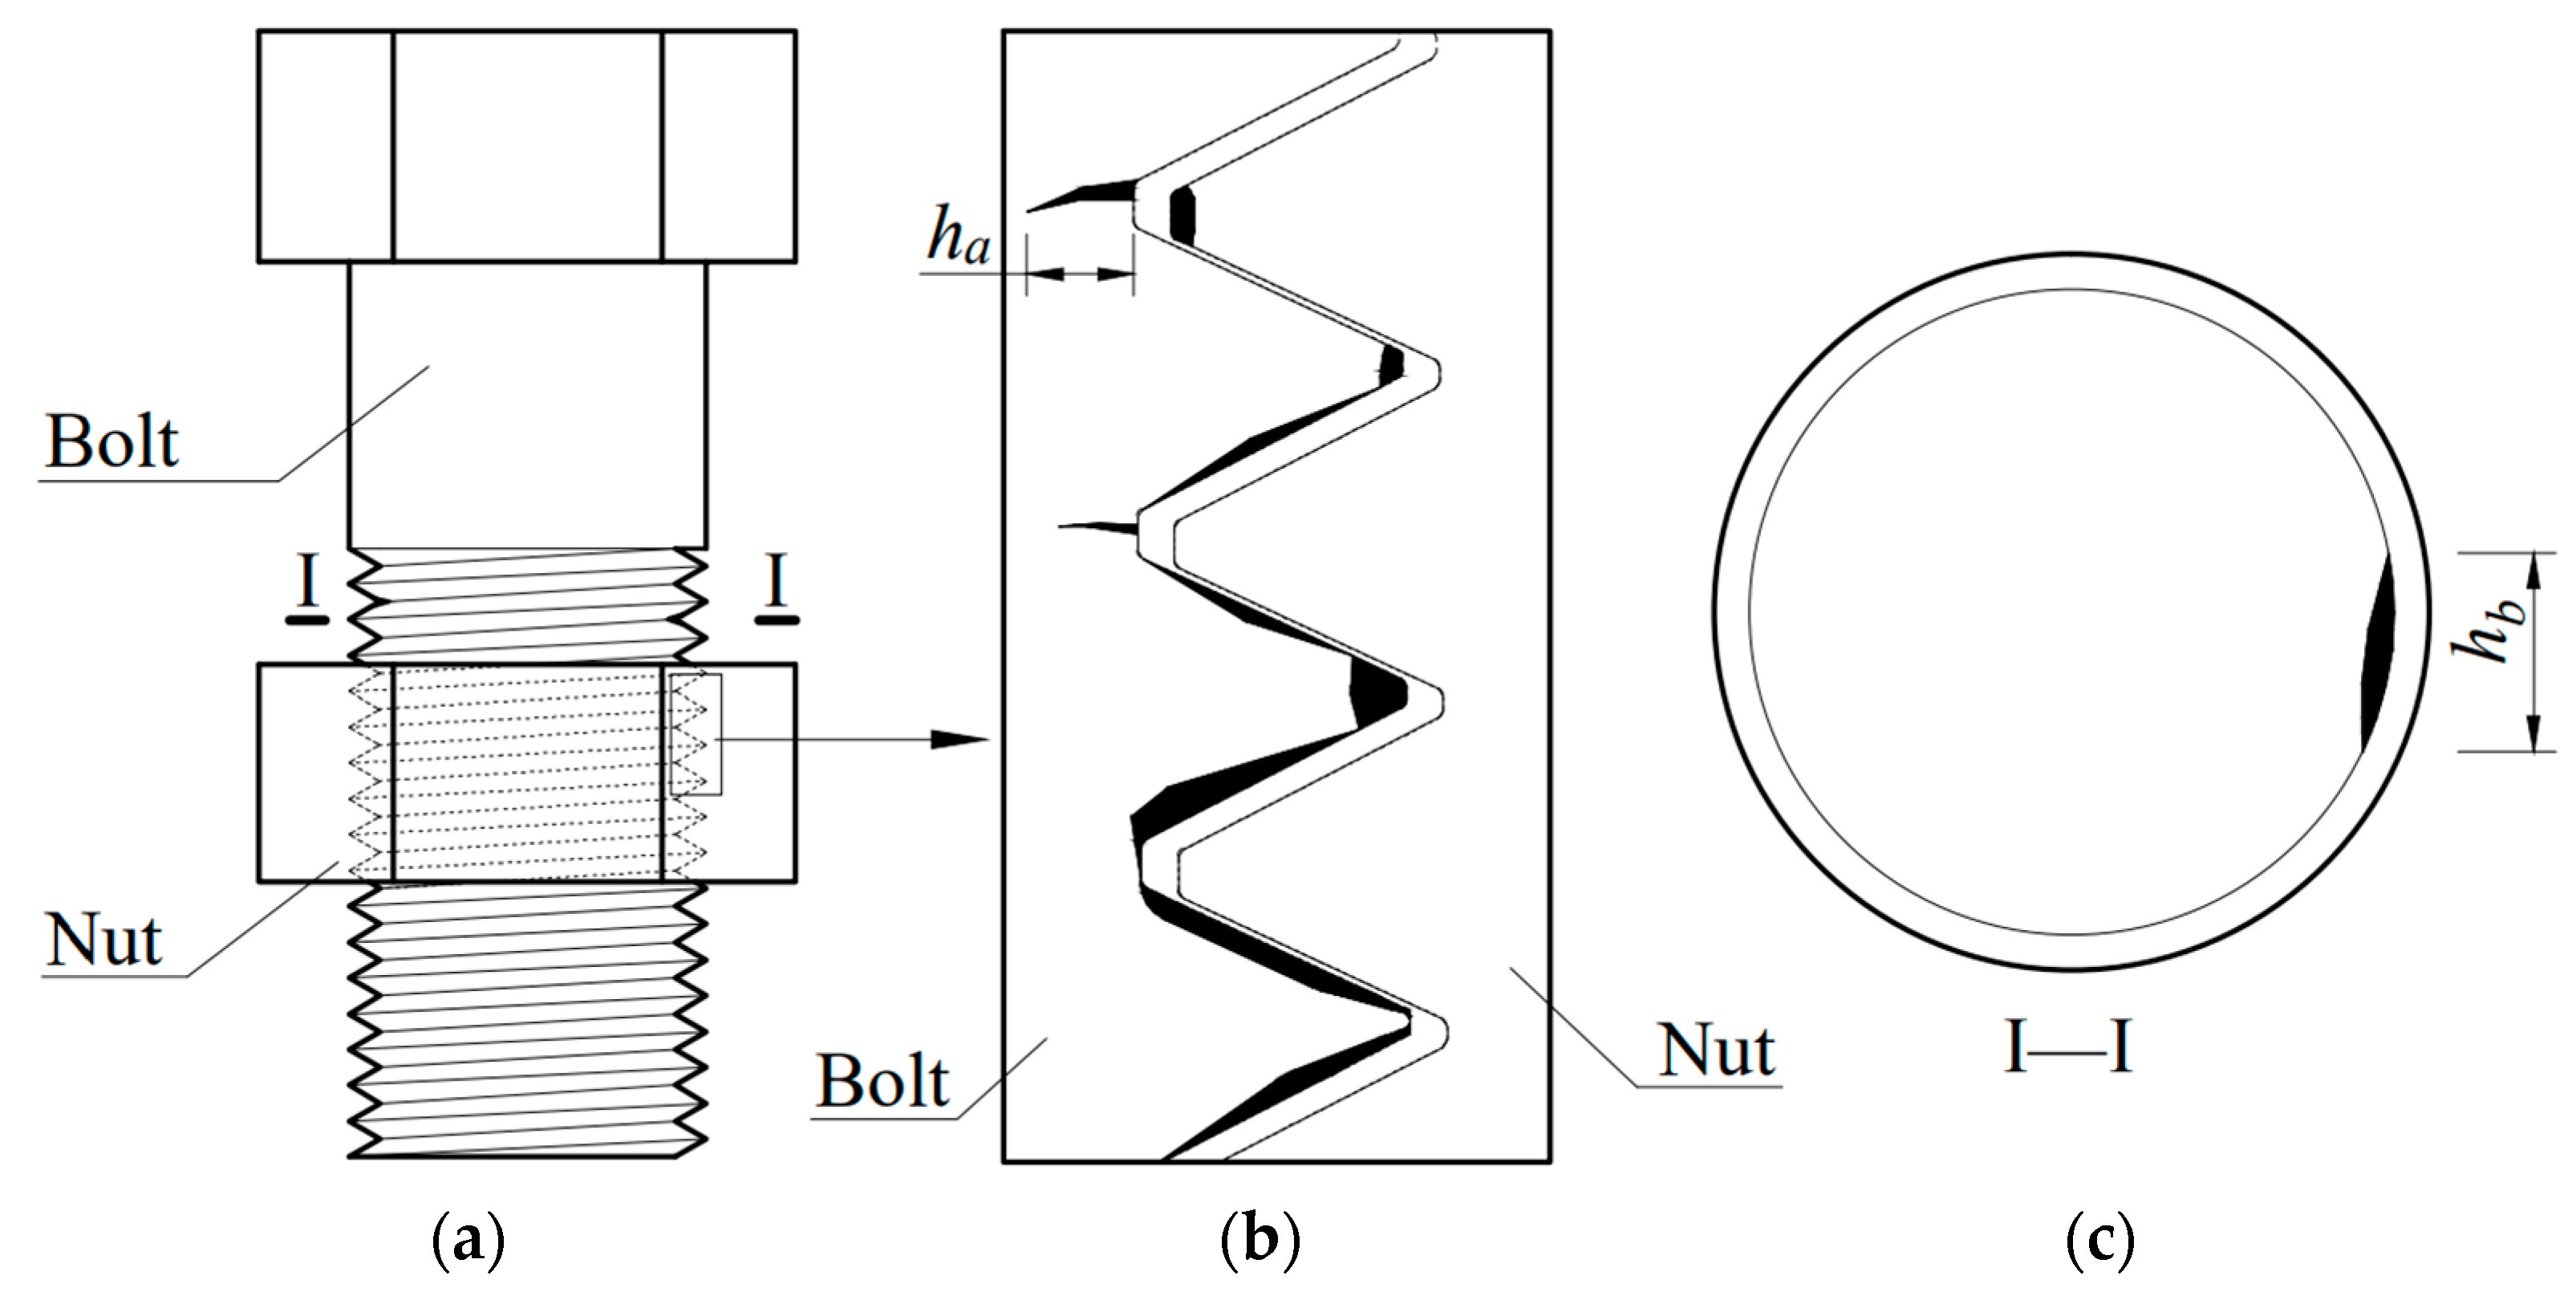
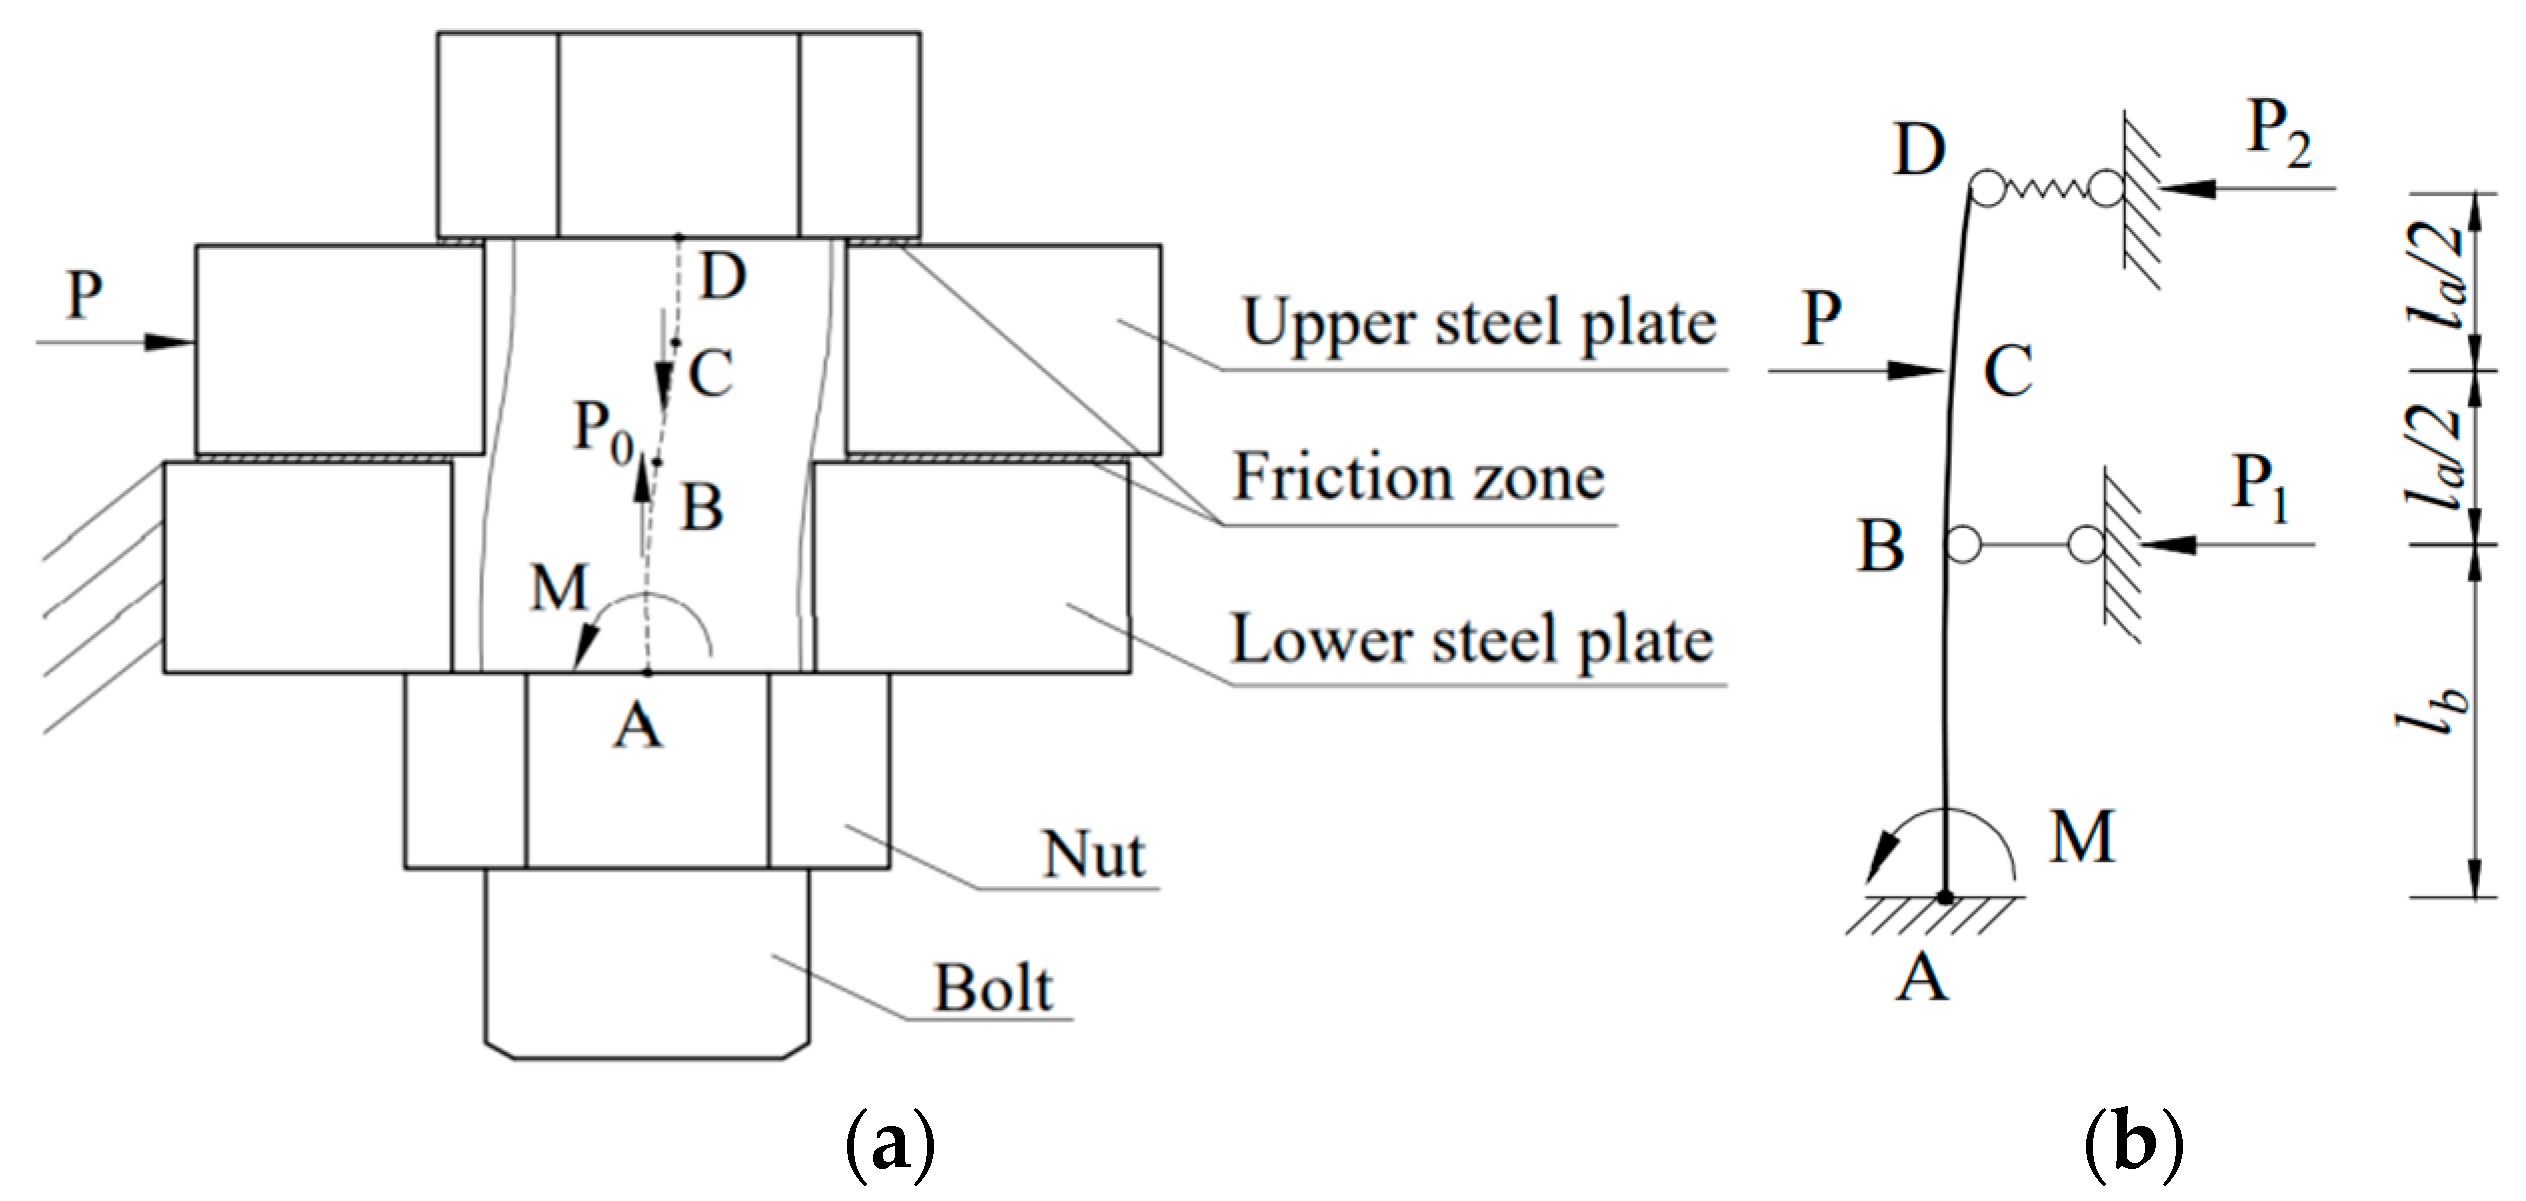
2. Mechanical Model of HSB

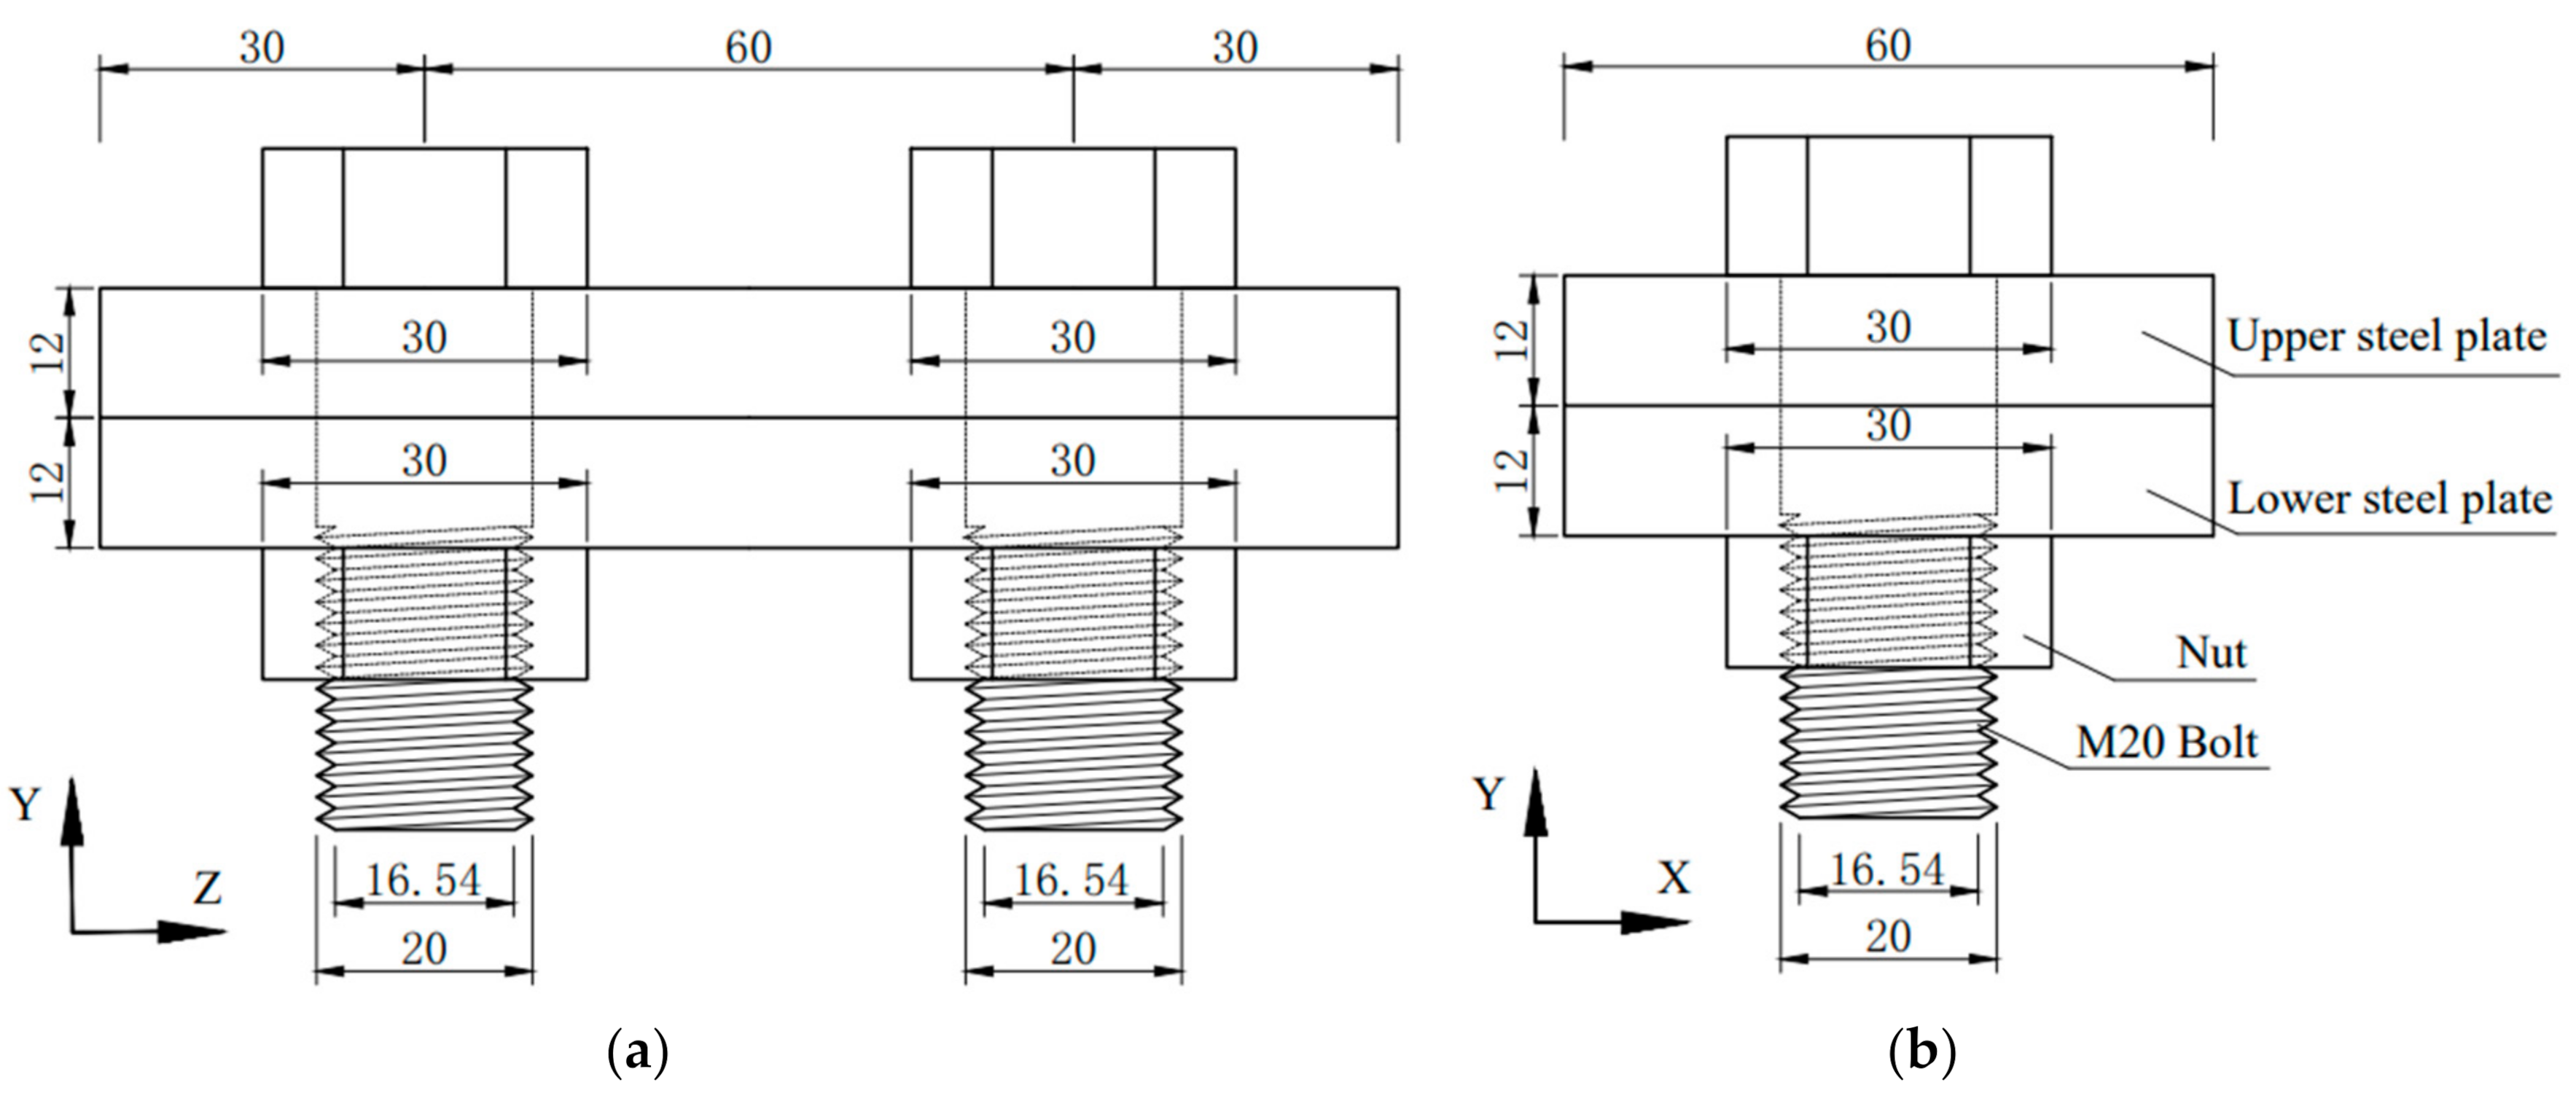
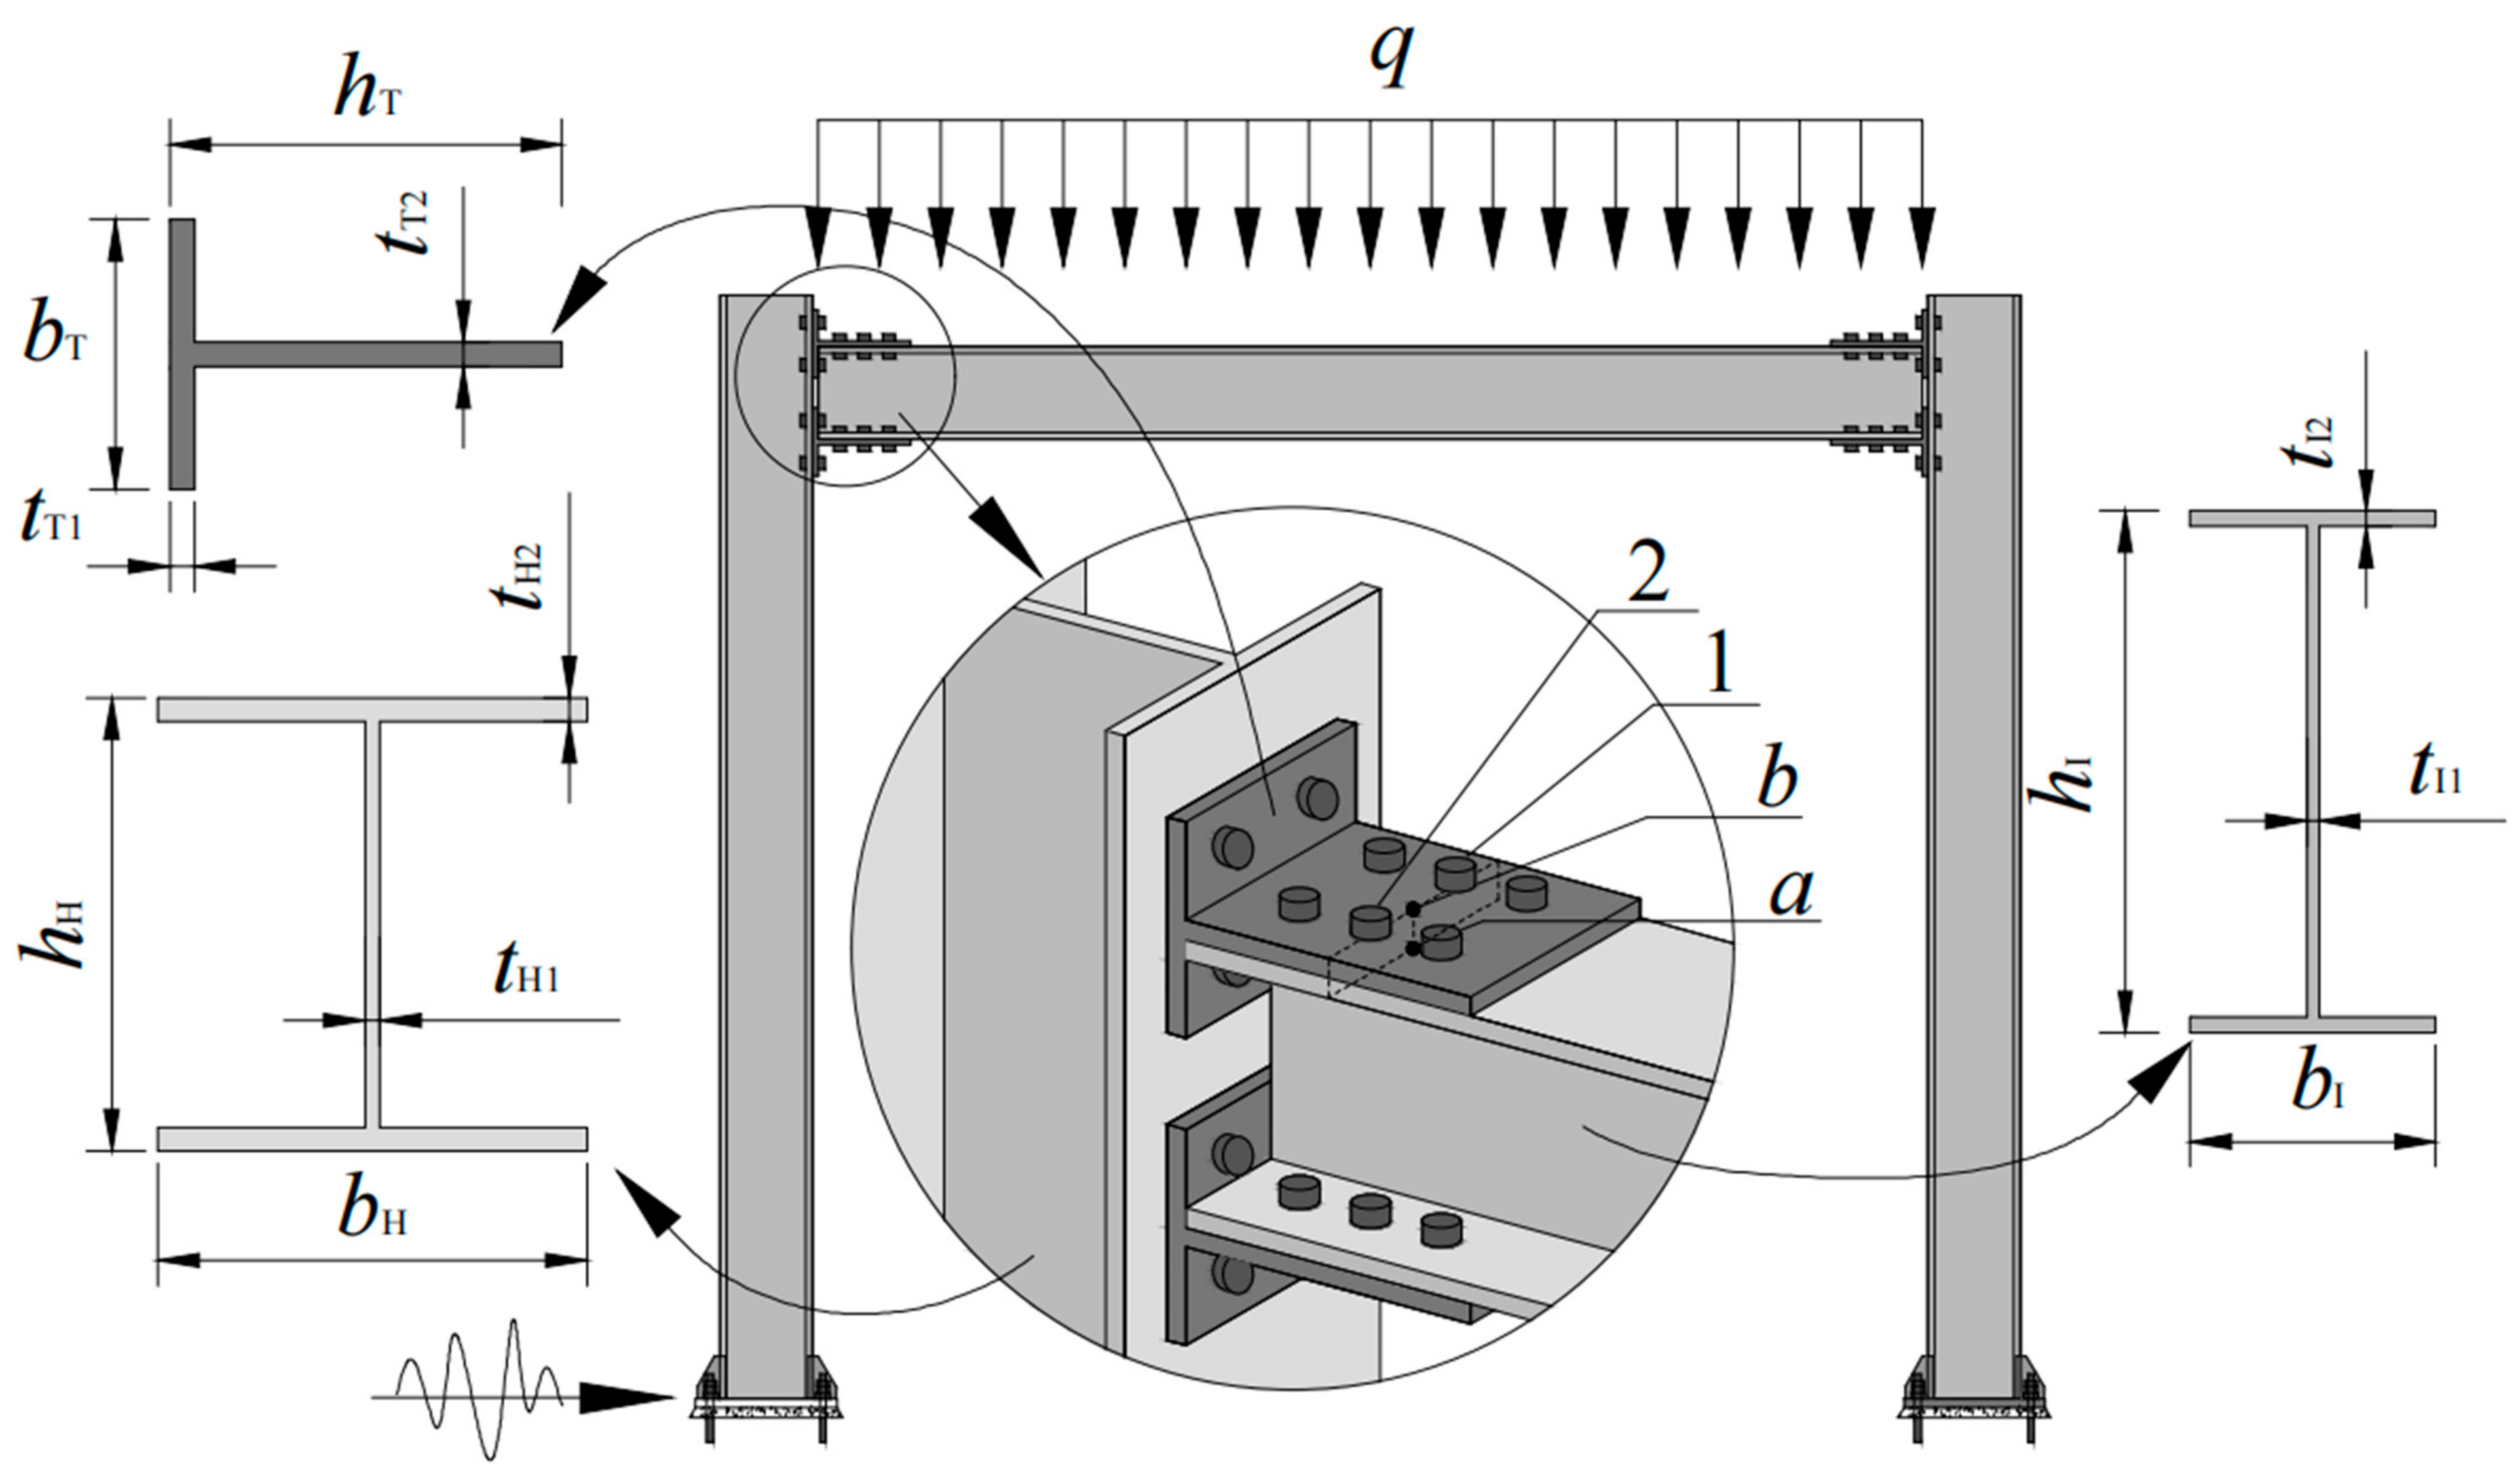
2.1. Mechanical Model

Figure 2a shows the lateral vibration loading [32] diagram of bolt connection. HSB is subjected to preload P0 and lateral load P during operation. Assuming that one side of the lower steel plate is fixed, the contact interval between the steel plates is the friction interval, and there is also a friction zone between the nut and the upper steel plate, with friction f. When the friction coefficient is very small, the apparent friction is neglectable. In the case of mutual restraint of bolts and nut threads, due to the action of transverse load P, the upper and lower steel plates are staggered, and the screw is bent and deformed, resulting in bending moment M. In order to simplify the calculation of bolt forces and bending moments, the bolts located in the steel plate are extracted separately. The contact position between the nut bottom and the steel plate is set as point D, project the center of the upper plate thickness onto the screw to point C, the contact position between the upper plane of the lower steel plate and the screw is set as point B, and the fixed place between the nut and the screw is set as point A, the simplified diagram shown in Figure 2b.

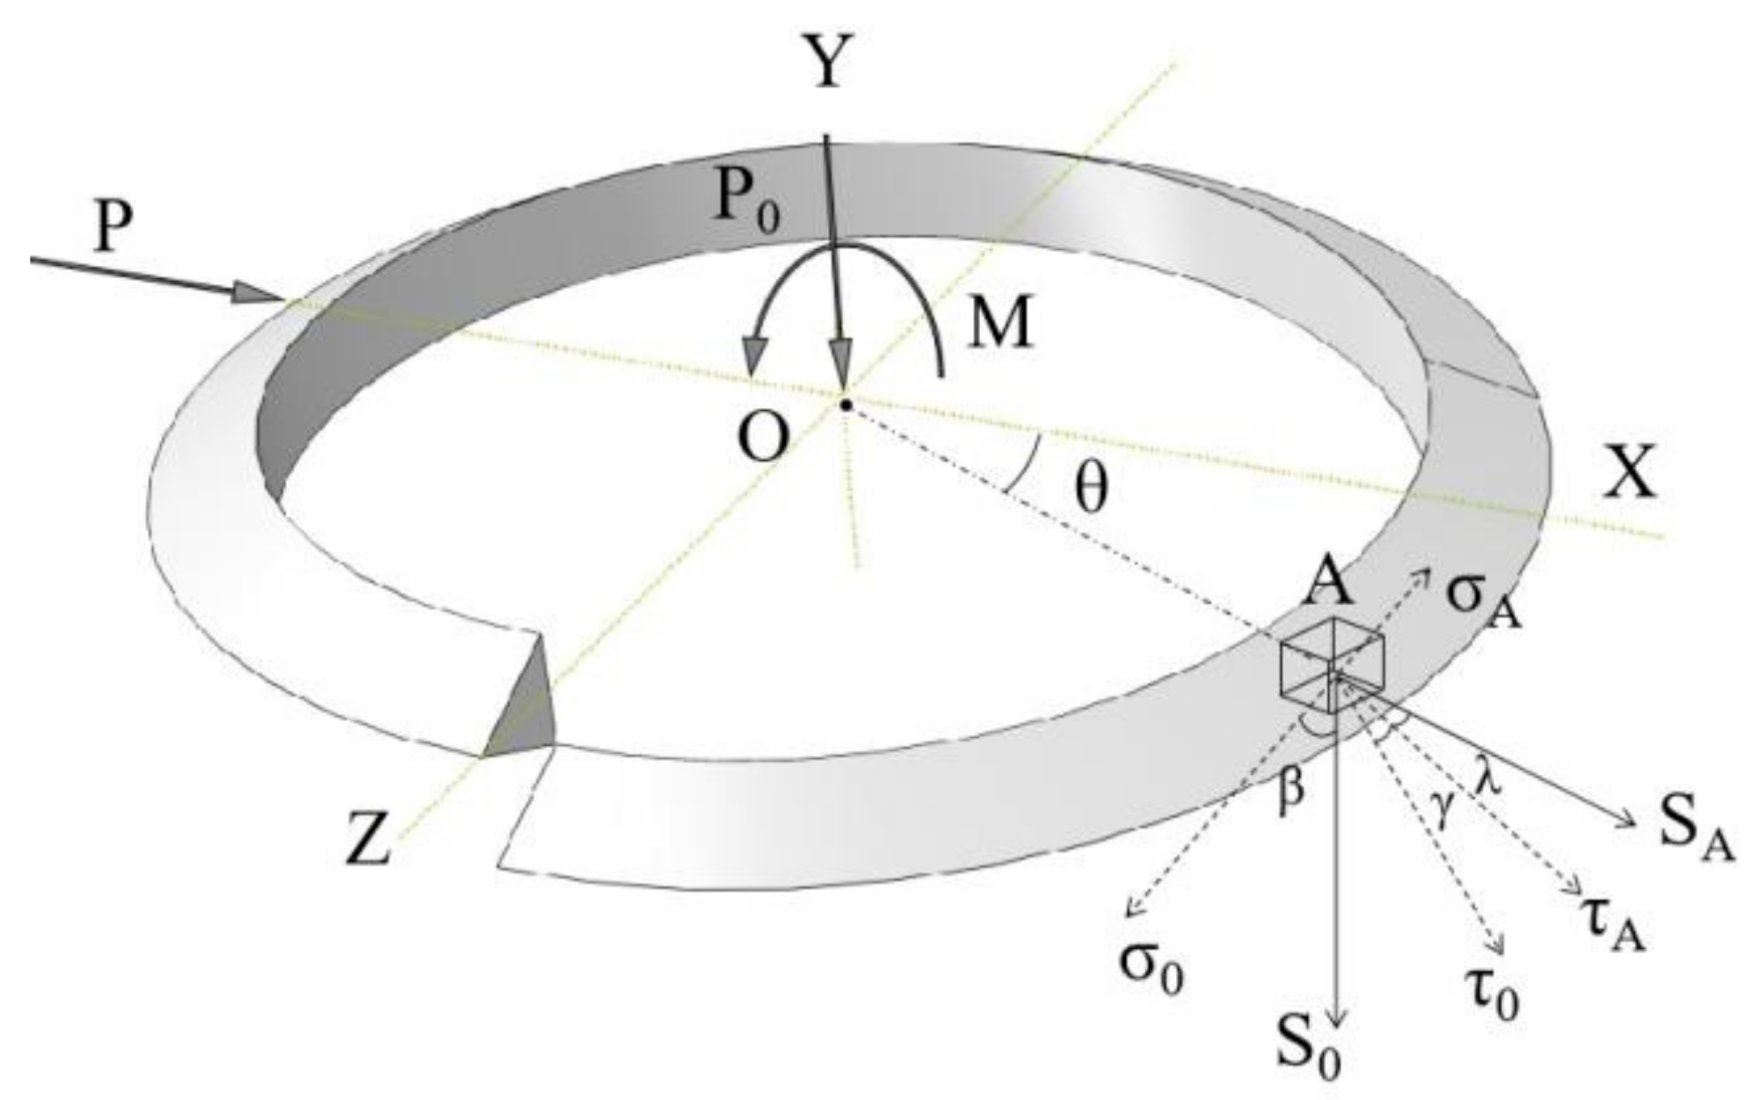
2.2. Mechanical Analysis

This paper draws on the mechanical model of thread fastening under vibration shear load studied in Reference [33] and simplifies the mechanical model into an equivalent deformation model as shown in Figure 2b. In Figure 2b, la is the thickness of the upper steel plate, lb is the thickness of the lower steel plate, P1 is the pressure on the contact surface between the screw and the lower steel plate after the bending deformation of the screw, P2 is the friction resistance between the bottom end of the nut and the upper steel plate, which can be similar to the spring resistance of a spring support, and M is the bending moment generated by the bending deformation of the screw.
According to the equivalent model in Figure 2b, it can be seen that the structure is a statically indeterminate structure with two more degrees of freedom, which is equivalent to a quadratic indeterminate problem. Through the deflection formula of material mechanics, it can be seen that the deflection of point B is unchanged, then it is assumed that the deflection of point B is ωB1 under the action of only P, and the deflection of point B is ωB2 under the action of P1 and P2, so as to obtain the following equation:
ω B 1 = P l b 2 6 EI 3 l a 2 + 2 l b ω B 2 = P 1 l b 3 3 EI + P 2 l b 2 6 EI 3 l a + 2 l b M + P 1 l b + P 2 l a + l b P l a / 2 + l b = 0
In the formula, P2 = μsP0, μs denotes the friction coefficient.
The bending moment M produced by the screw and the support reaction P1 can be solved from the above equation:
P 1 = P 3 l a + 4 l b μ s P 0 6 l a + 4 l b 4 l b M = μ s P 0 l a / 2 P l a / 4
Under transverse vibration load, the specific force of thread surface is shown in Figure 3. The load P is located along the X-axis direction, the preload P0 is located along the Y-axis negative direction, the center dot is represented by the symbol O. The symbol θ represents the angle between a position on the thread surface that needs to be analyzed separately and the X-axis, and the value range of θ is [0°, 360°]. Since the radial dimension of the thread surface is small, it is assumed that the radial force is uniformly distributed on the thread surface.
When the angular position of the thread surface corresponding to the central shaft is different, the force will be different. For the purpose of force analysis, this paper refers to the analysis method of Reference [21]. A point A is randomly selected on the thread surface, and the area where point A is located is approximately regarded as a hexahedron, analyze the force on this hexahedron. Among them, SA and S0 are the acting stress of transverse load and axial load in the micro-region respectively.
S A = P A 0
S 0 = P A 0 M × d 2 cos θ 2 I y
A 0 = d 2 d 1 2 × π / 4
In the formula, A0 is the contact area of a single screw thread surface; d, d1 and d2 are the large diameter, small diameter and middle diameter of the thread respectively; Iy is the transverse section moment of inertia of the screw.
SA produces normal stress σA and tangential stress τA on the thread surface, and the angle between SA and τA is λ. S0 generates normal stress σ0 and tangential stress τ0 on the thread surface. The angle between S0 and σ0 is β, and the angle between τ0 and τA is γ. According to the geometric relationship, the following equations can be obtained:
σ A = S A sin λ τ A = S A cos λ σ 0 = S 0 cos β τ 0 = S 0 sin β
It is found that the angle λ is related to β and θ [34]:
sin λ = sin β × sin θ
Because the angle between the axial stress projection τ0 on the thread surface and the transverse stress projection τA on the thread surface is γ, the relationship between γ and θ can be deduced:
cos γ = ( sin θ ) 2
The total shear stress and friction stress on the thread surface are:
τ = τ A 2 + τ 0 2 + 2 τ A τ 0 cos γ
f = σ 0 σ A μ s
The simultaneous Equations (3)~(8) are substituted into Equations (9) and (10) respectively λ and β. Since the angle is small, we take sin β ≈ β, cos β ≈ 1, and make τ ≥ f:
1 β 2 μ s 2 ( sin θ ) 2 G 2 + 2 β sin θ sin θ + μ s 2 G + β 2 μ s 2 0
where, G is the coefficient set when solving:
G = 2 I y P 2 I y P 0 M d 2 A 0 cos θ
By simultaneous Equations (2) and (12), it can be concluded that the lateral load satisfying the slip condition at different positions is:
P θ = 32 I y 2 μ s l a d 2 d 2 d 1 2 π cos θ P 0 G 32 I y G l a d 2 d 2 d 1 2 π cos θ
In the formula, the value range of θ is [0°, 180°].
When the value range of θ is [180°, 360°], the direction of action of P is just the opposite to that in Figure 3, so the solution is somewhat different. The ≥ symbol in (11) should be replaced by > symbol, and then the coefficient G is obtained, so as to obtain the value of θ in the range of [180°, 360°].

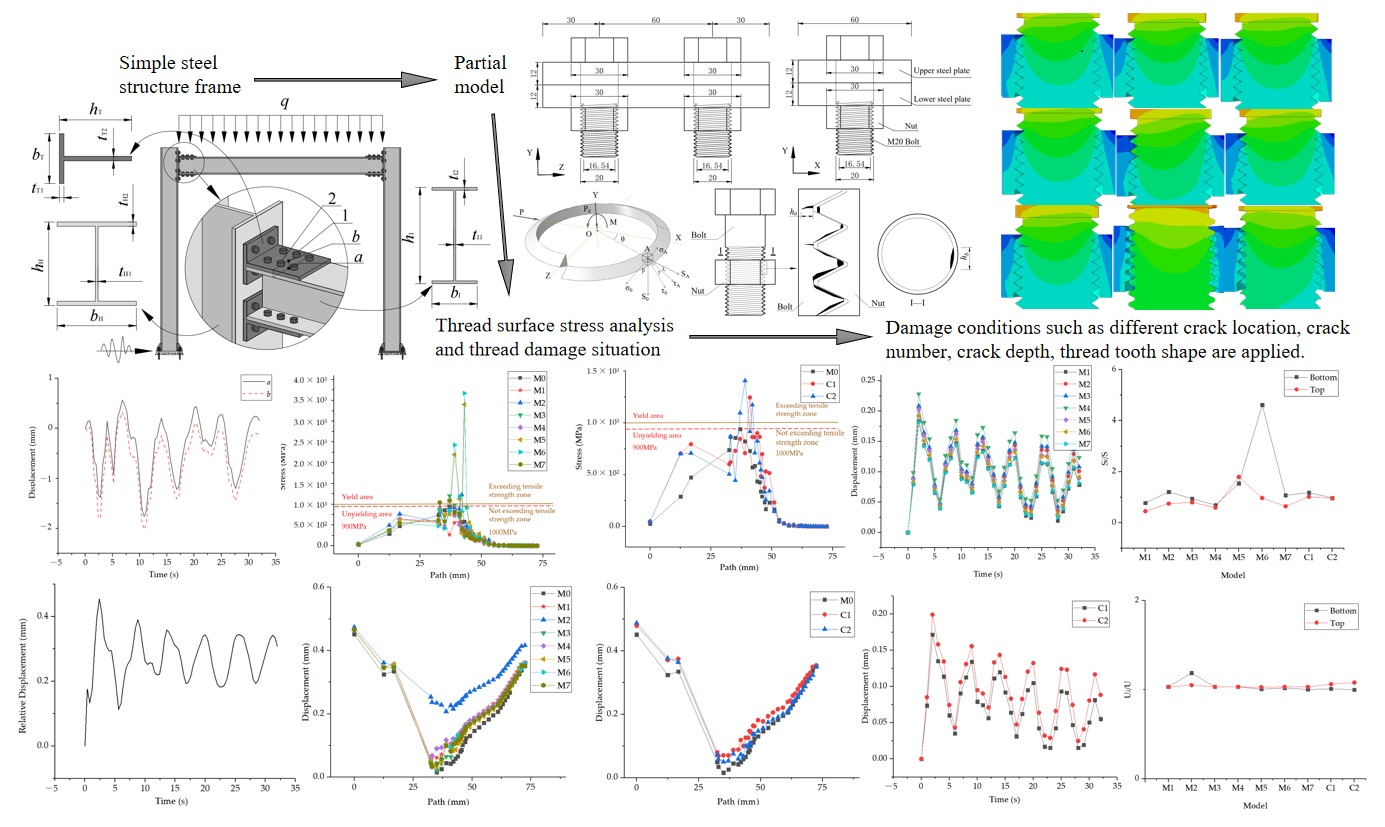
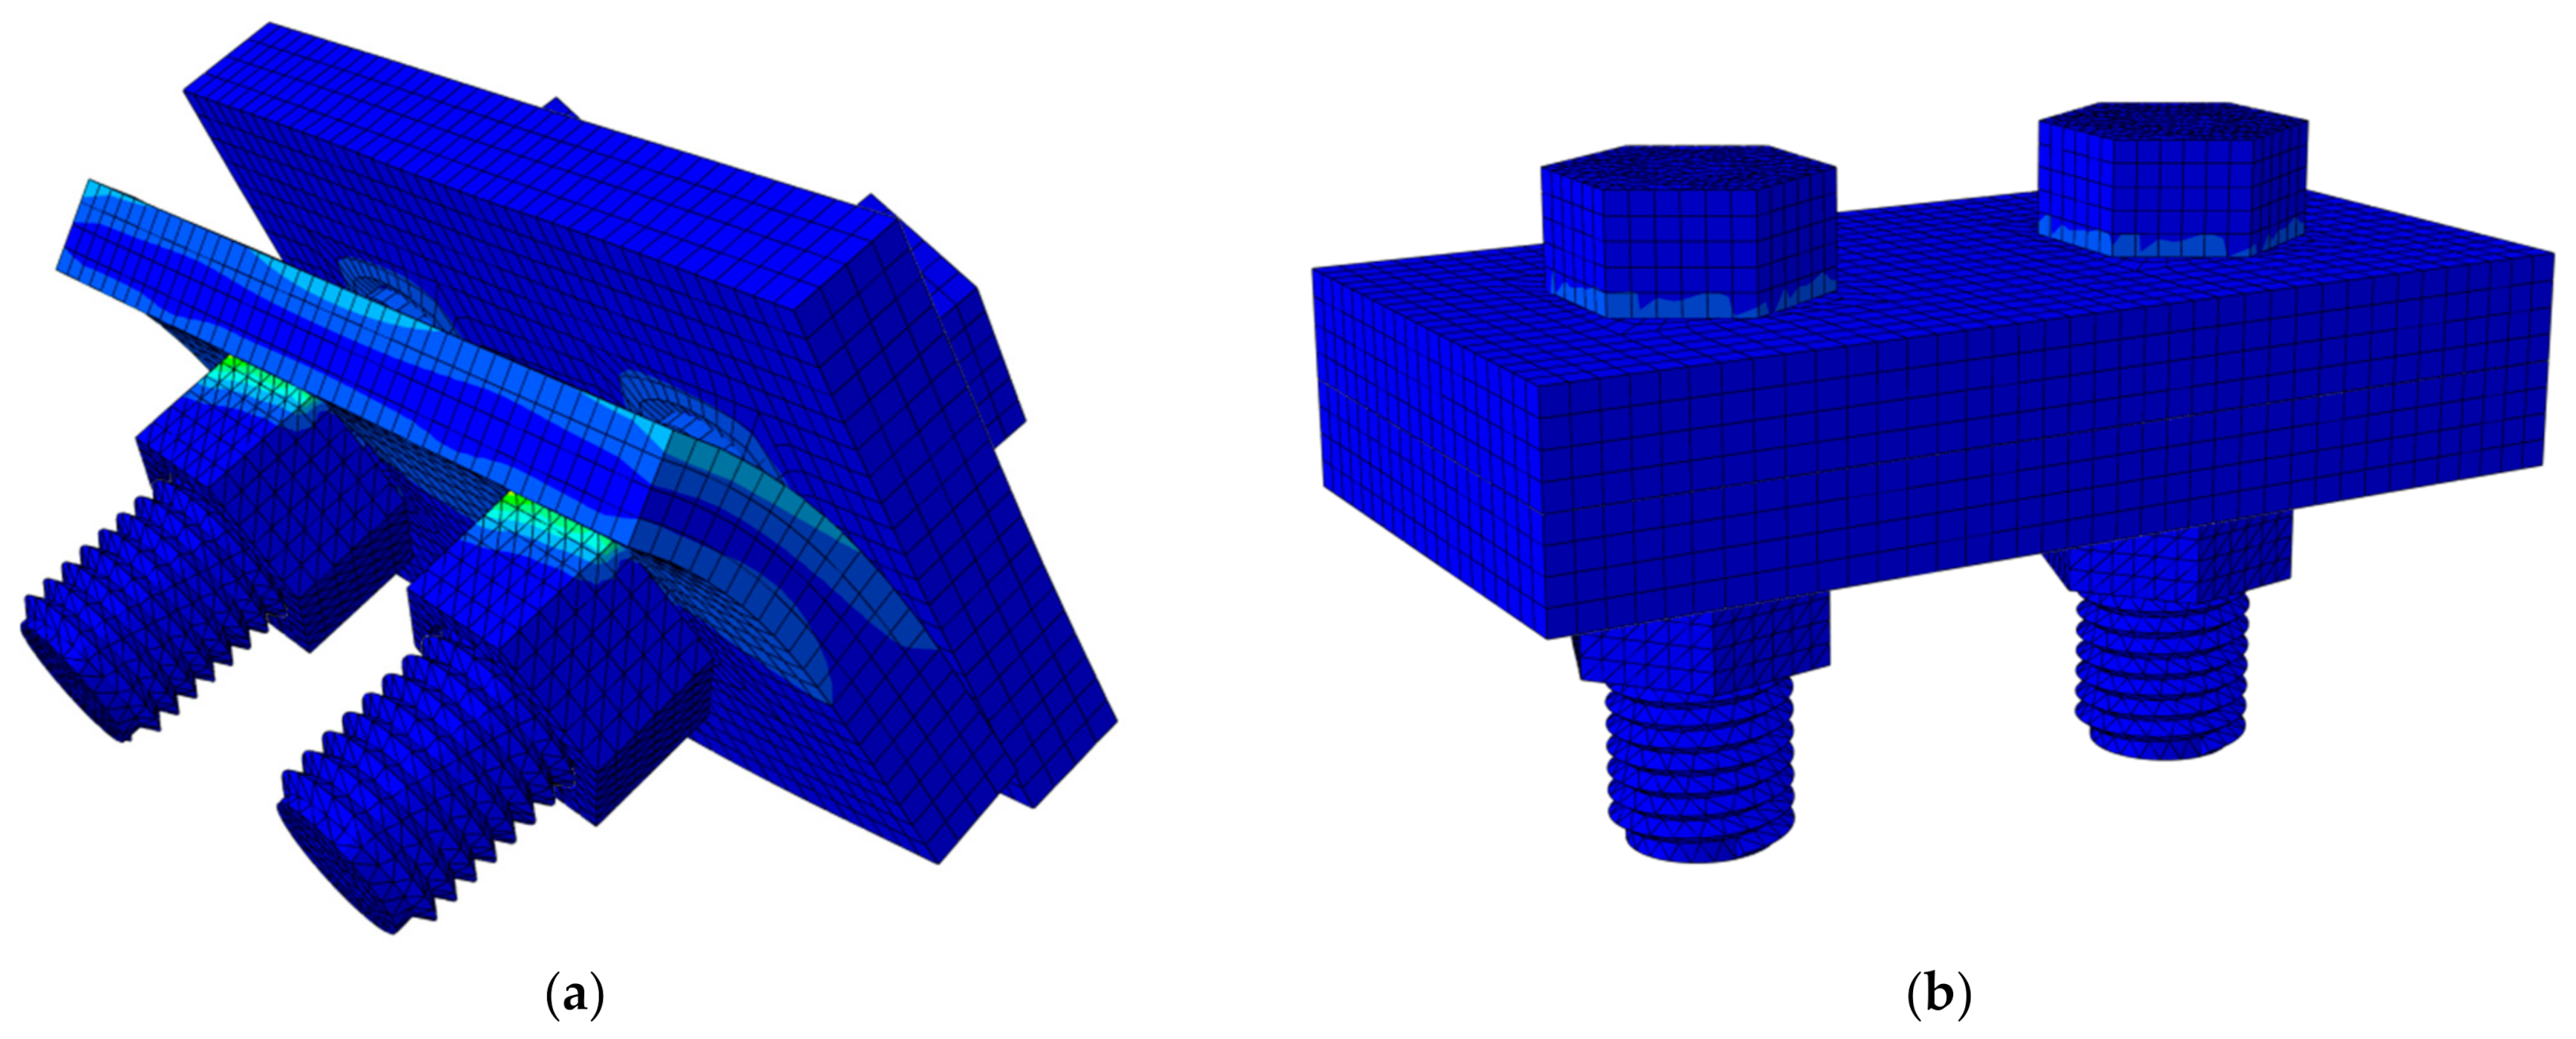
3. Numerical Simulation Analysis

3.1. Model Scheme Design

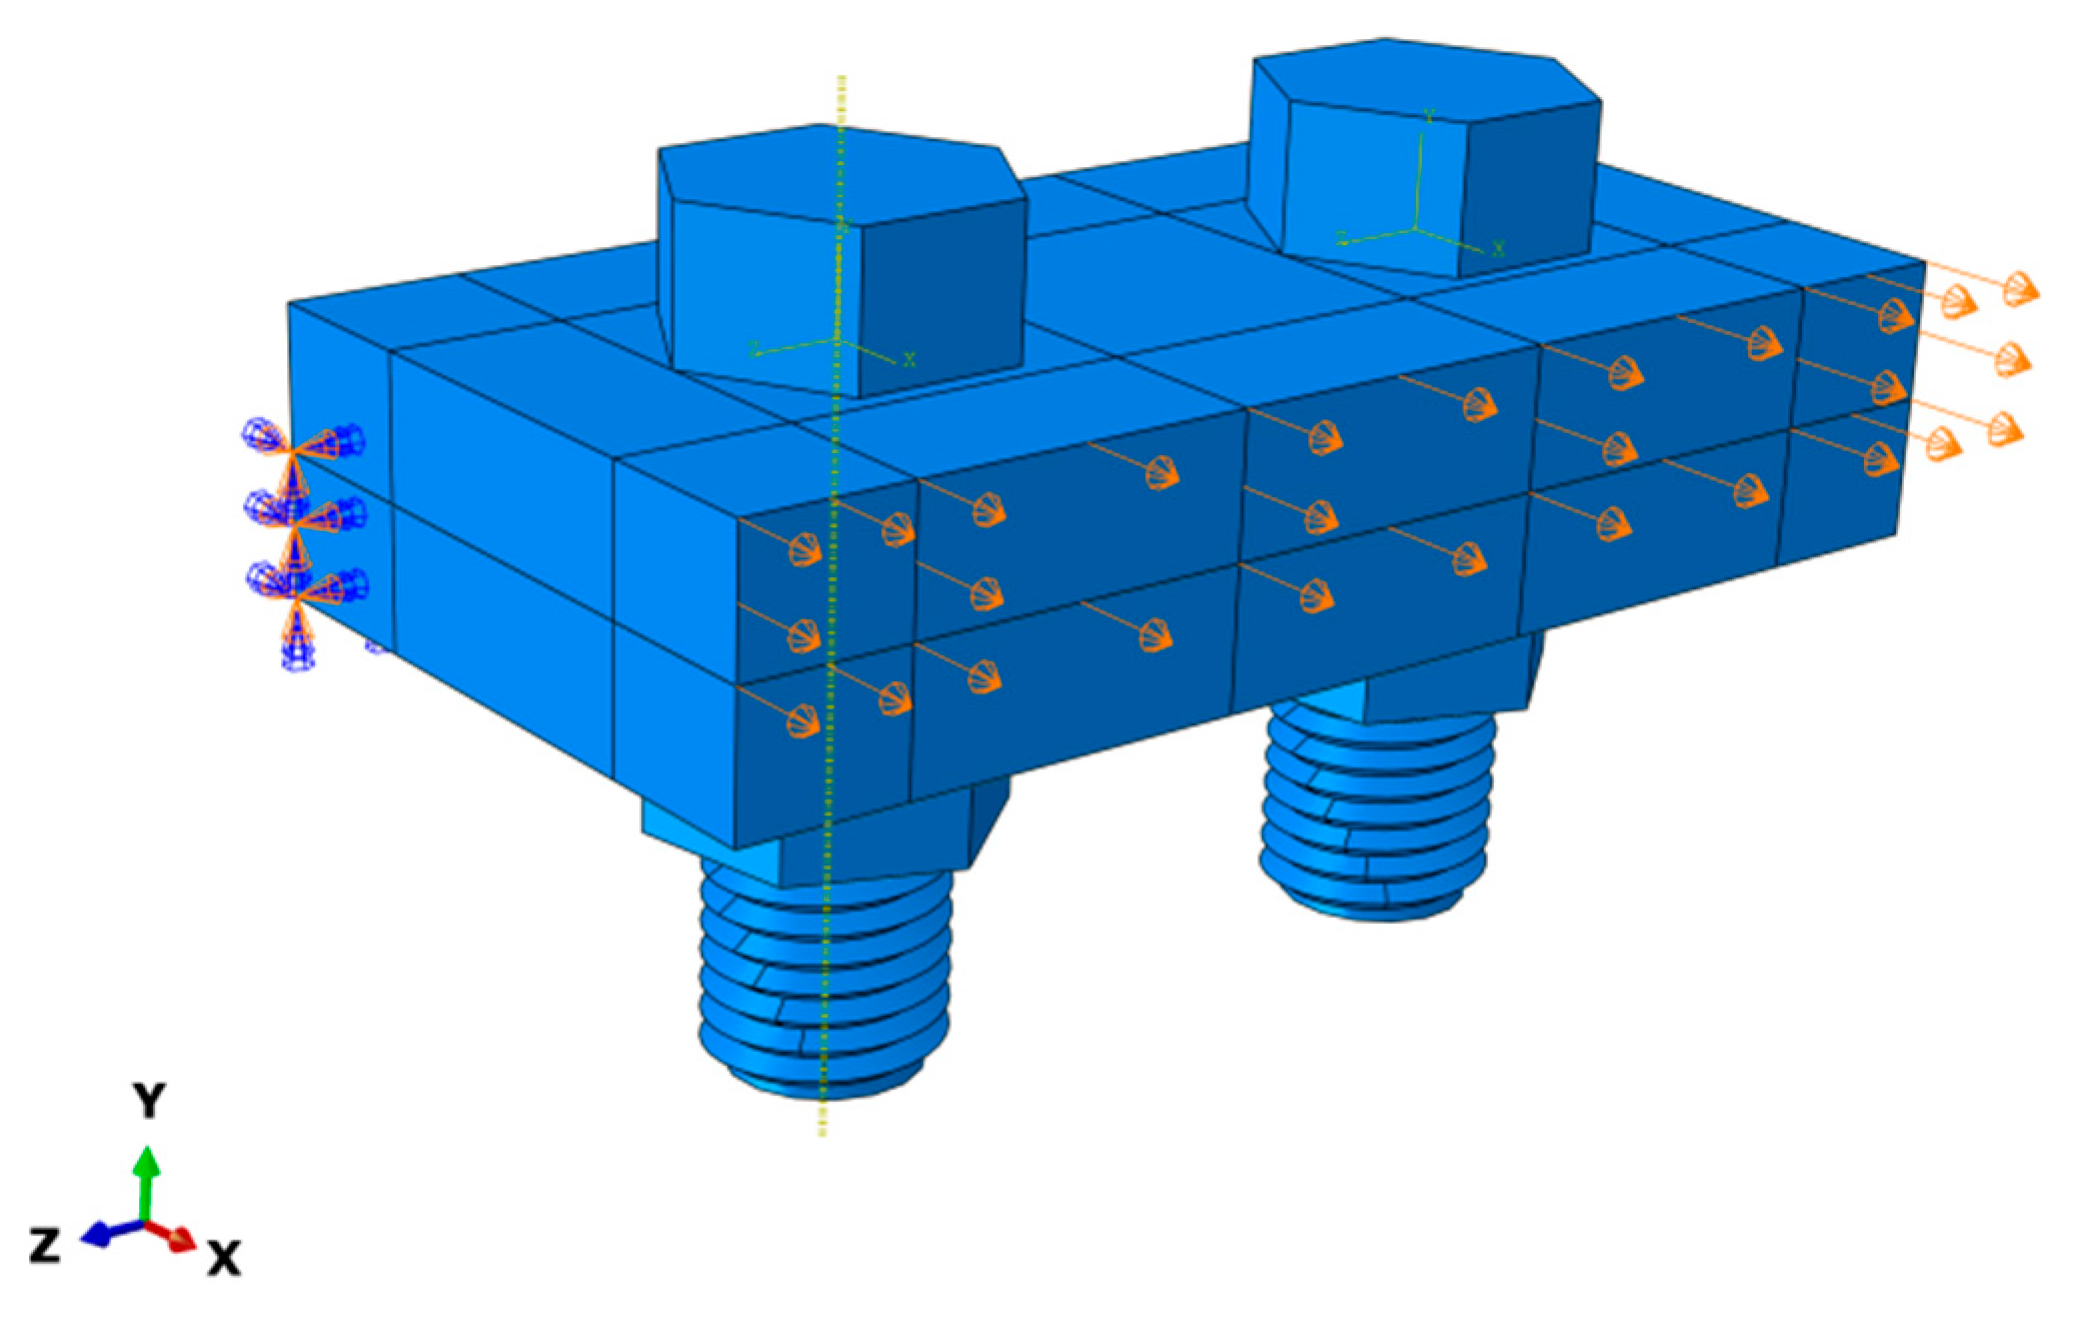
3.1.1. Model Settings

Based on the analysis and research of the mechanical model, the bolt nut connection pattern shown in Figure 4 is set in this experiment. In order to better distinguish the orientation, the model is set to have the Z axis along the long side of the steel plate, the X axis along the short side of the steel plate, and the Y axis along the thickness of the steel plate. The selected bolt is 10.9 grade M20 fine-tooth HSB, the pitch is 2.5 mm, the difference between the screw hole and the screw is 0.4 mm, and the two plates between the bolts are steel Q390B quiet steel sample plates. Our research refers to the Chinese code Technical specification for high strength bolt connections of steel structures (JGJ 82-2011), selects 10.9 s high-strength bolts, corresponding to the preload value of 155 kN. Young ‘s modulus E = 210 GPa, Poisson ‘s ratio μ = 0.3, friction coefficient μs = 0.15, density ρ = 7850 kg/m3, the Young ‘s modulus E = 198 GPa, Poisson ‘s ratio μ = 0.3, friction coefficient μs = 0.15, density ρ = 7850 kg/m3 are set for bolts and nuts. The setting of material properties refers to Reference [35].

3.1.2. Working Condition Design

First, a framework model is designed as shown in Figure 5. The column adopts H-type steel, and the section size is H350 350 × 12 × 19 mm 3 . The beam adopts I-type steel, and the section size is I400 200 × 4 × 12 mm 3 . The connecting plate adopts T-shaped steel, and the section size is T350 300 × 12 × 24 mm 3 . Referring to the time and acceleration data of the El Centro earthquake [36] measured by the United States Coast and Geodetic Bureau, the seismic load is applied to the bottom of the frame model in case of a large earthquake of 0.5 g, and the analysis step length of the frame model simulation is 32 s.
The time displacement data of the point a of the flange plate on the beam and the point b of the T-shaped connecting plate in Figure 5 are extracted respectively, and the relative displacement change between the two points is obtained. The relevant data are shown in Figure 6. The relative displacement data obtained can be regarded as the actual displacement change at the local bolt in the actual earthquake, and then the data will be applied to the designed model as the seismic load. The selected parts of the local model of the interception analysis are No. 1 and No. 2 bolts, and the corresponding model and its loading method are shown in Figure 7. In order to better simulate the shear state of the bolt at the interception position, it is necessary to limit the movement of the steel plate in the Y and Z directions. Apply the load P along the X direction, and the load P is applied linearly from 0 MPa to 1000 MPa for 1 s.

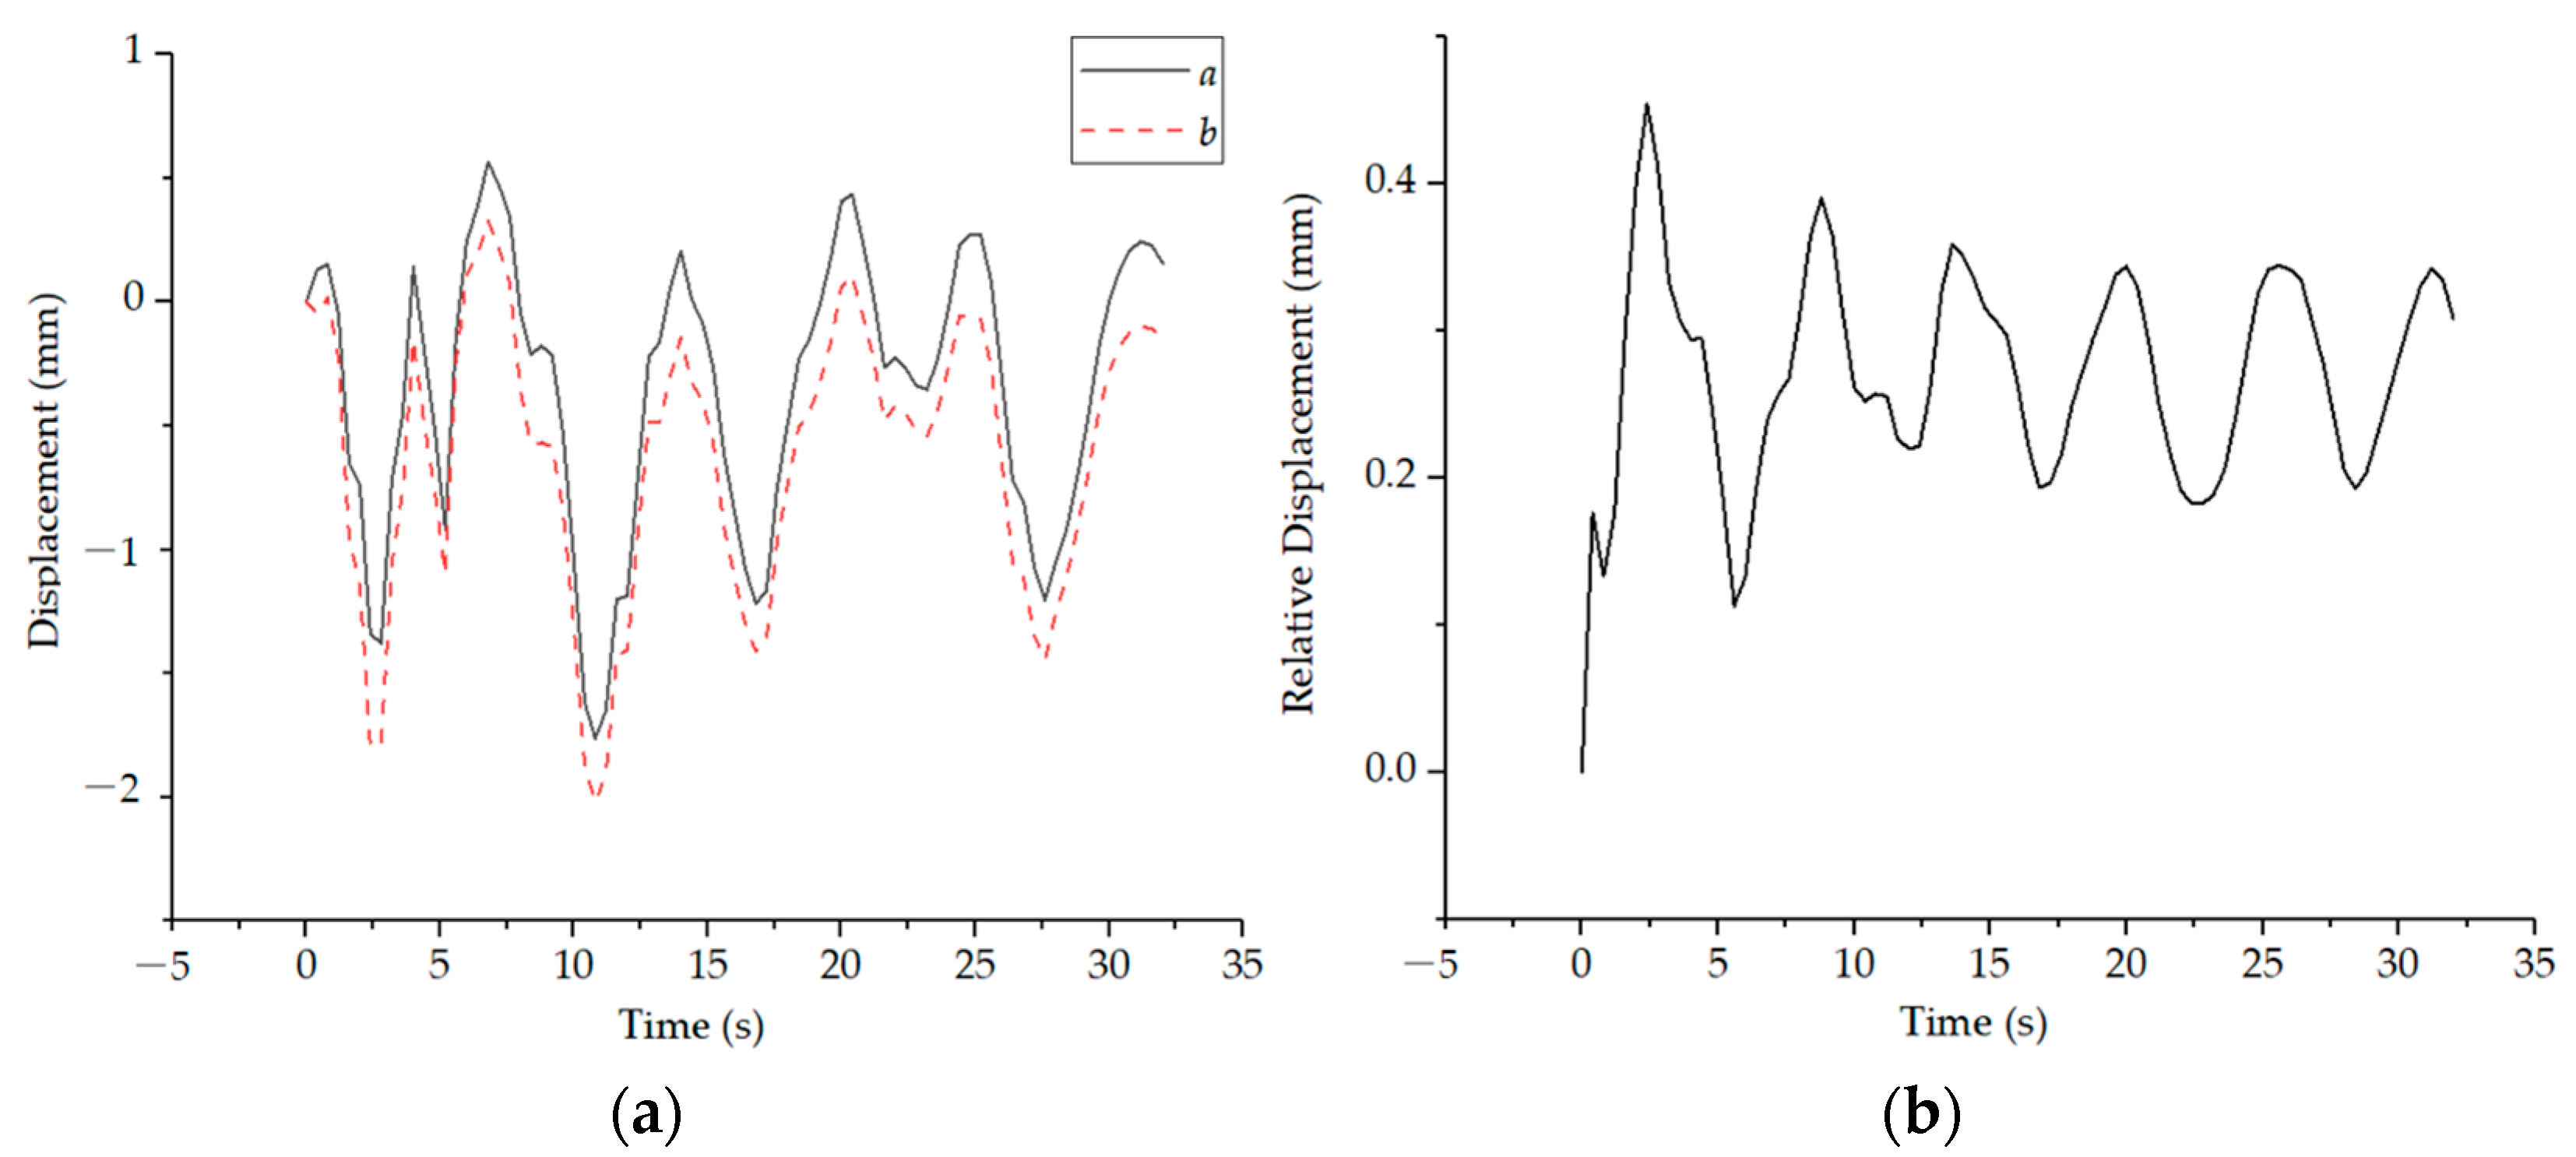
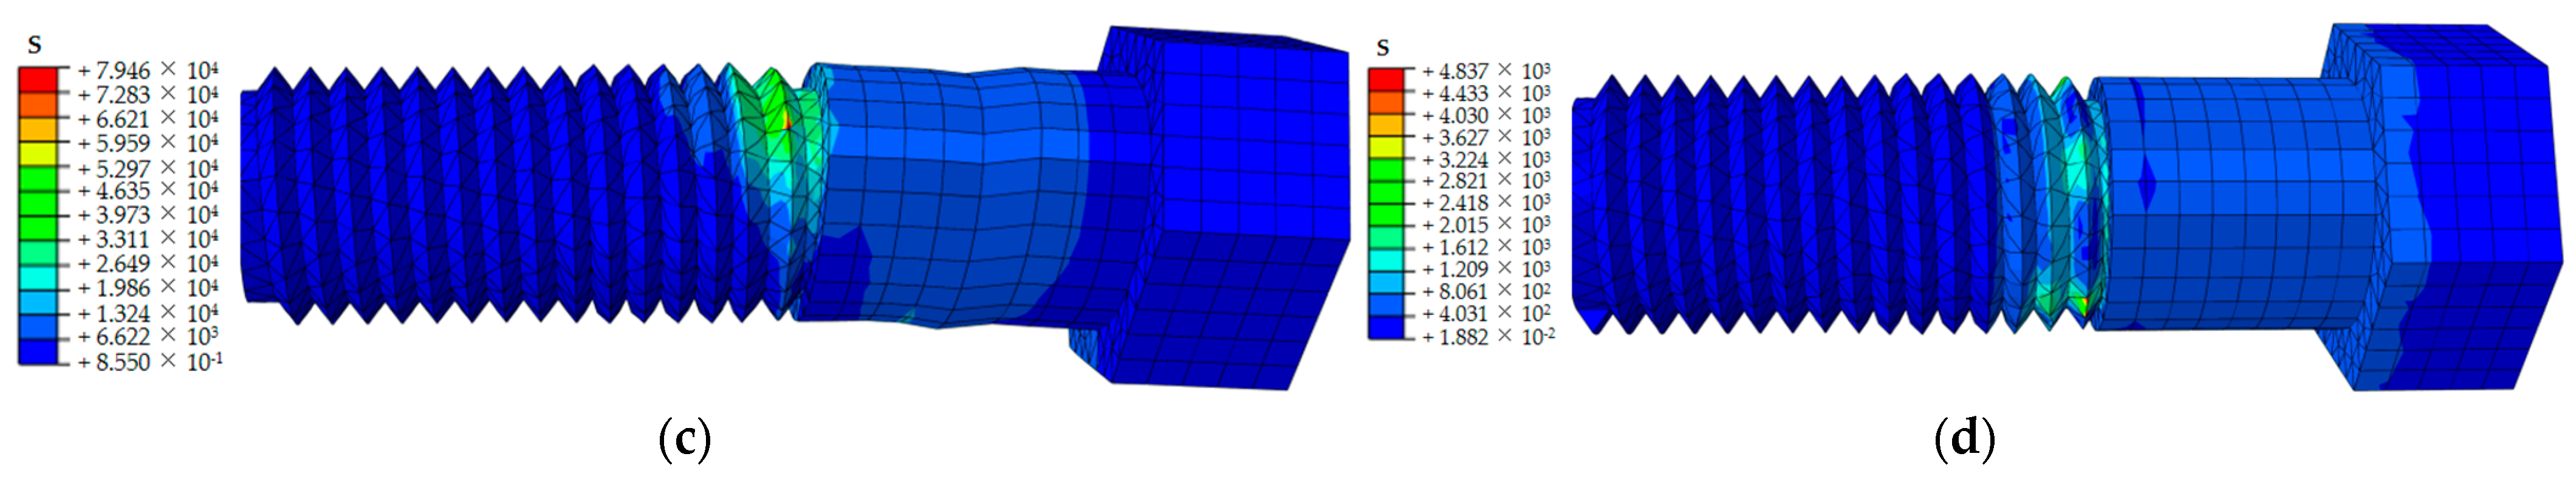
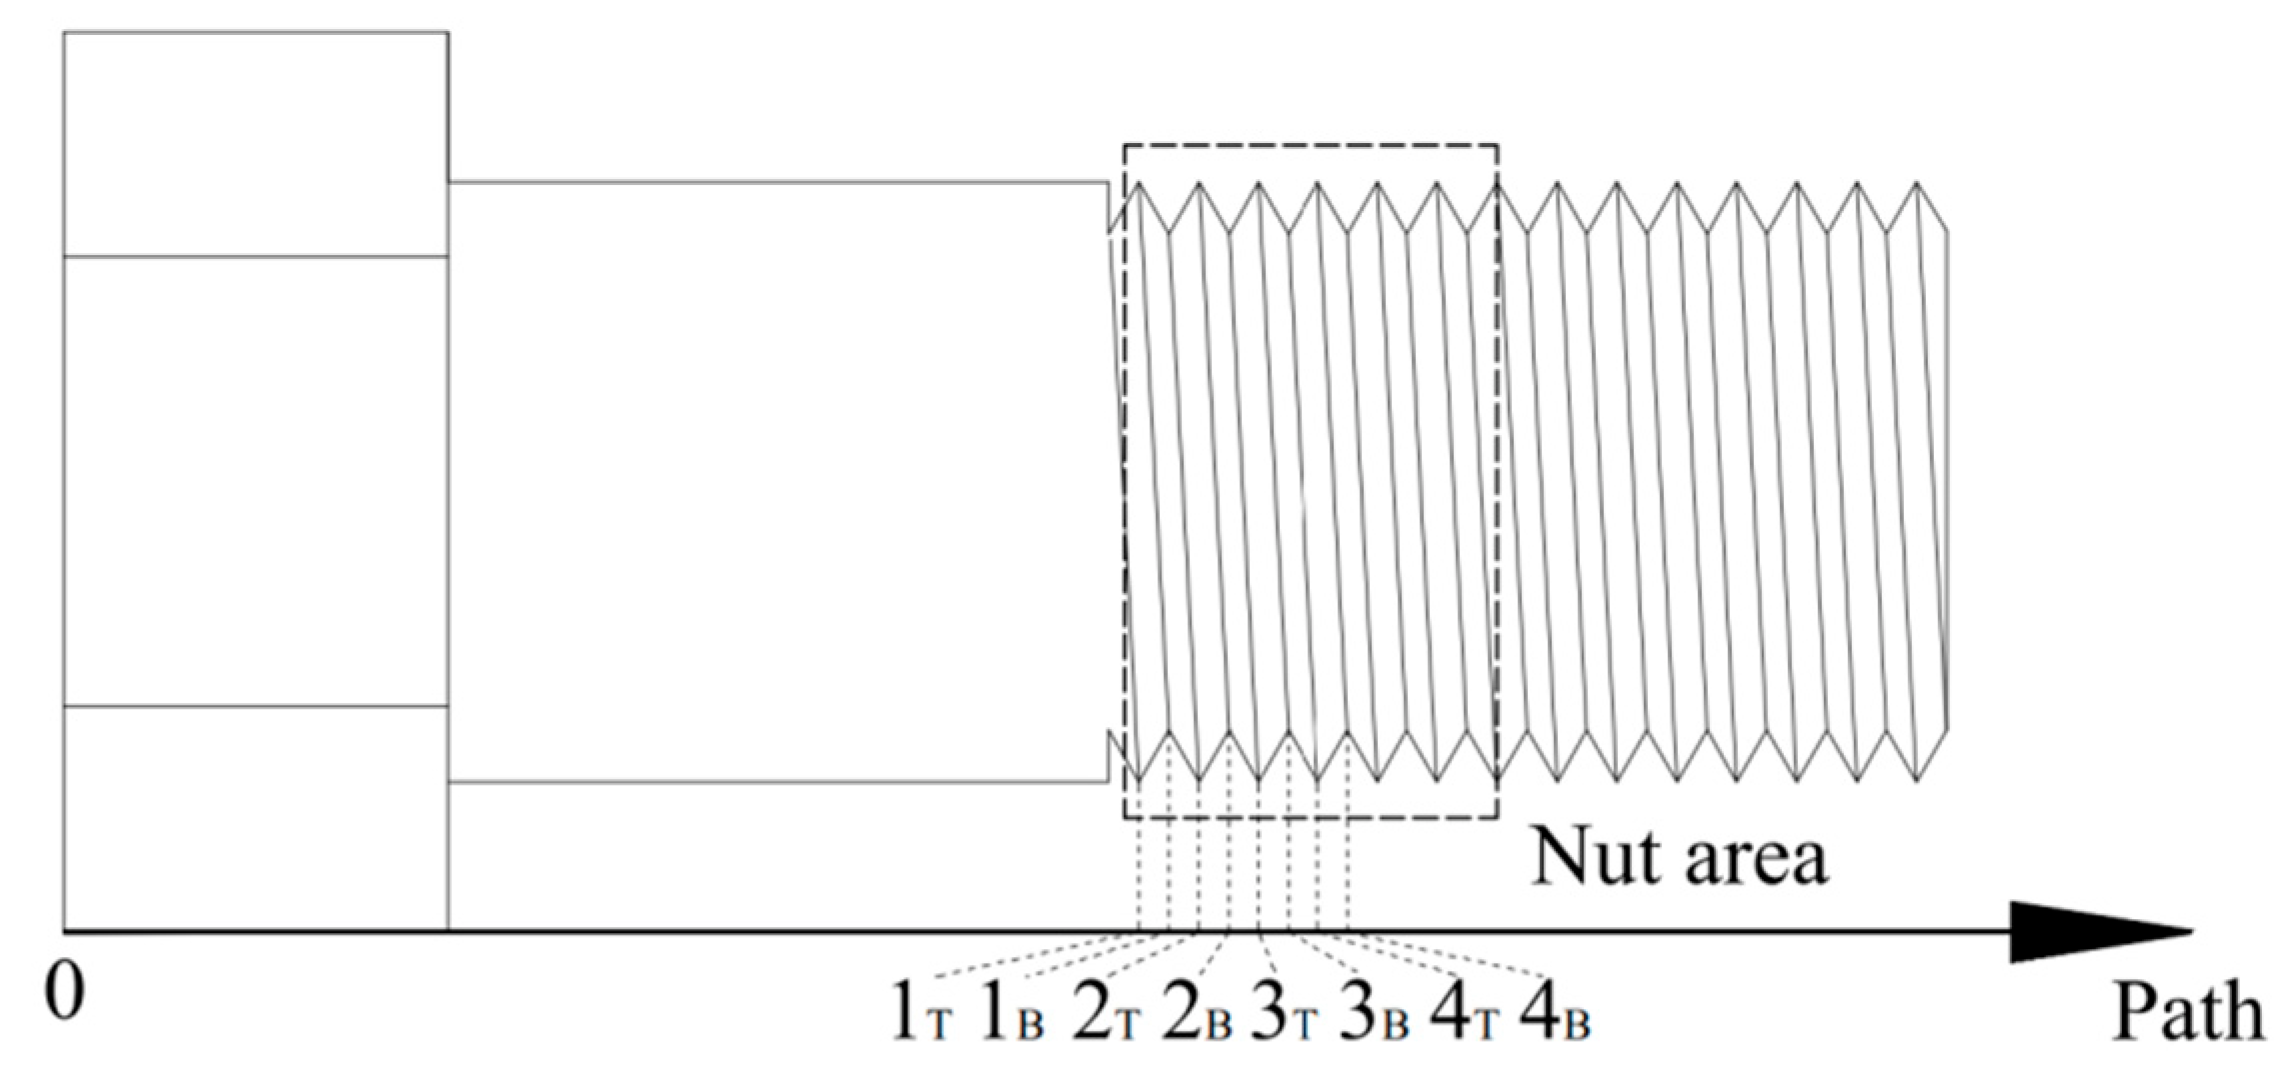
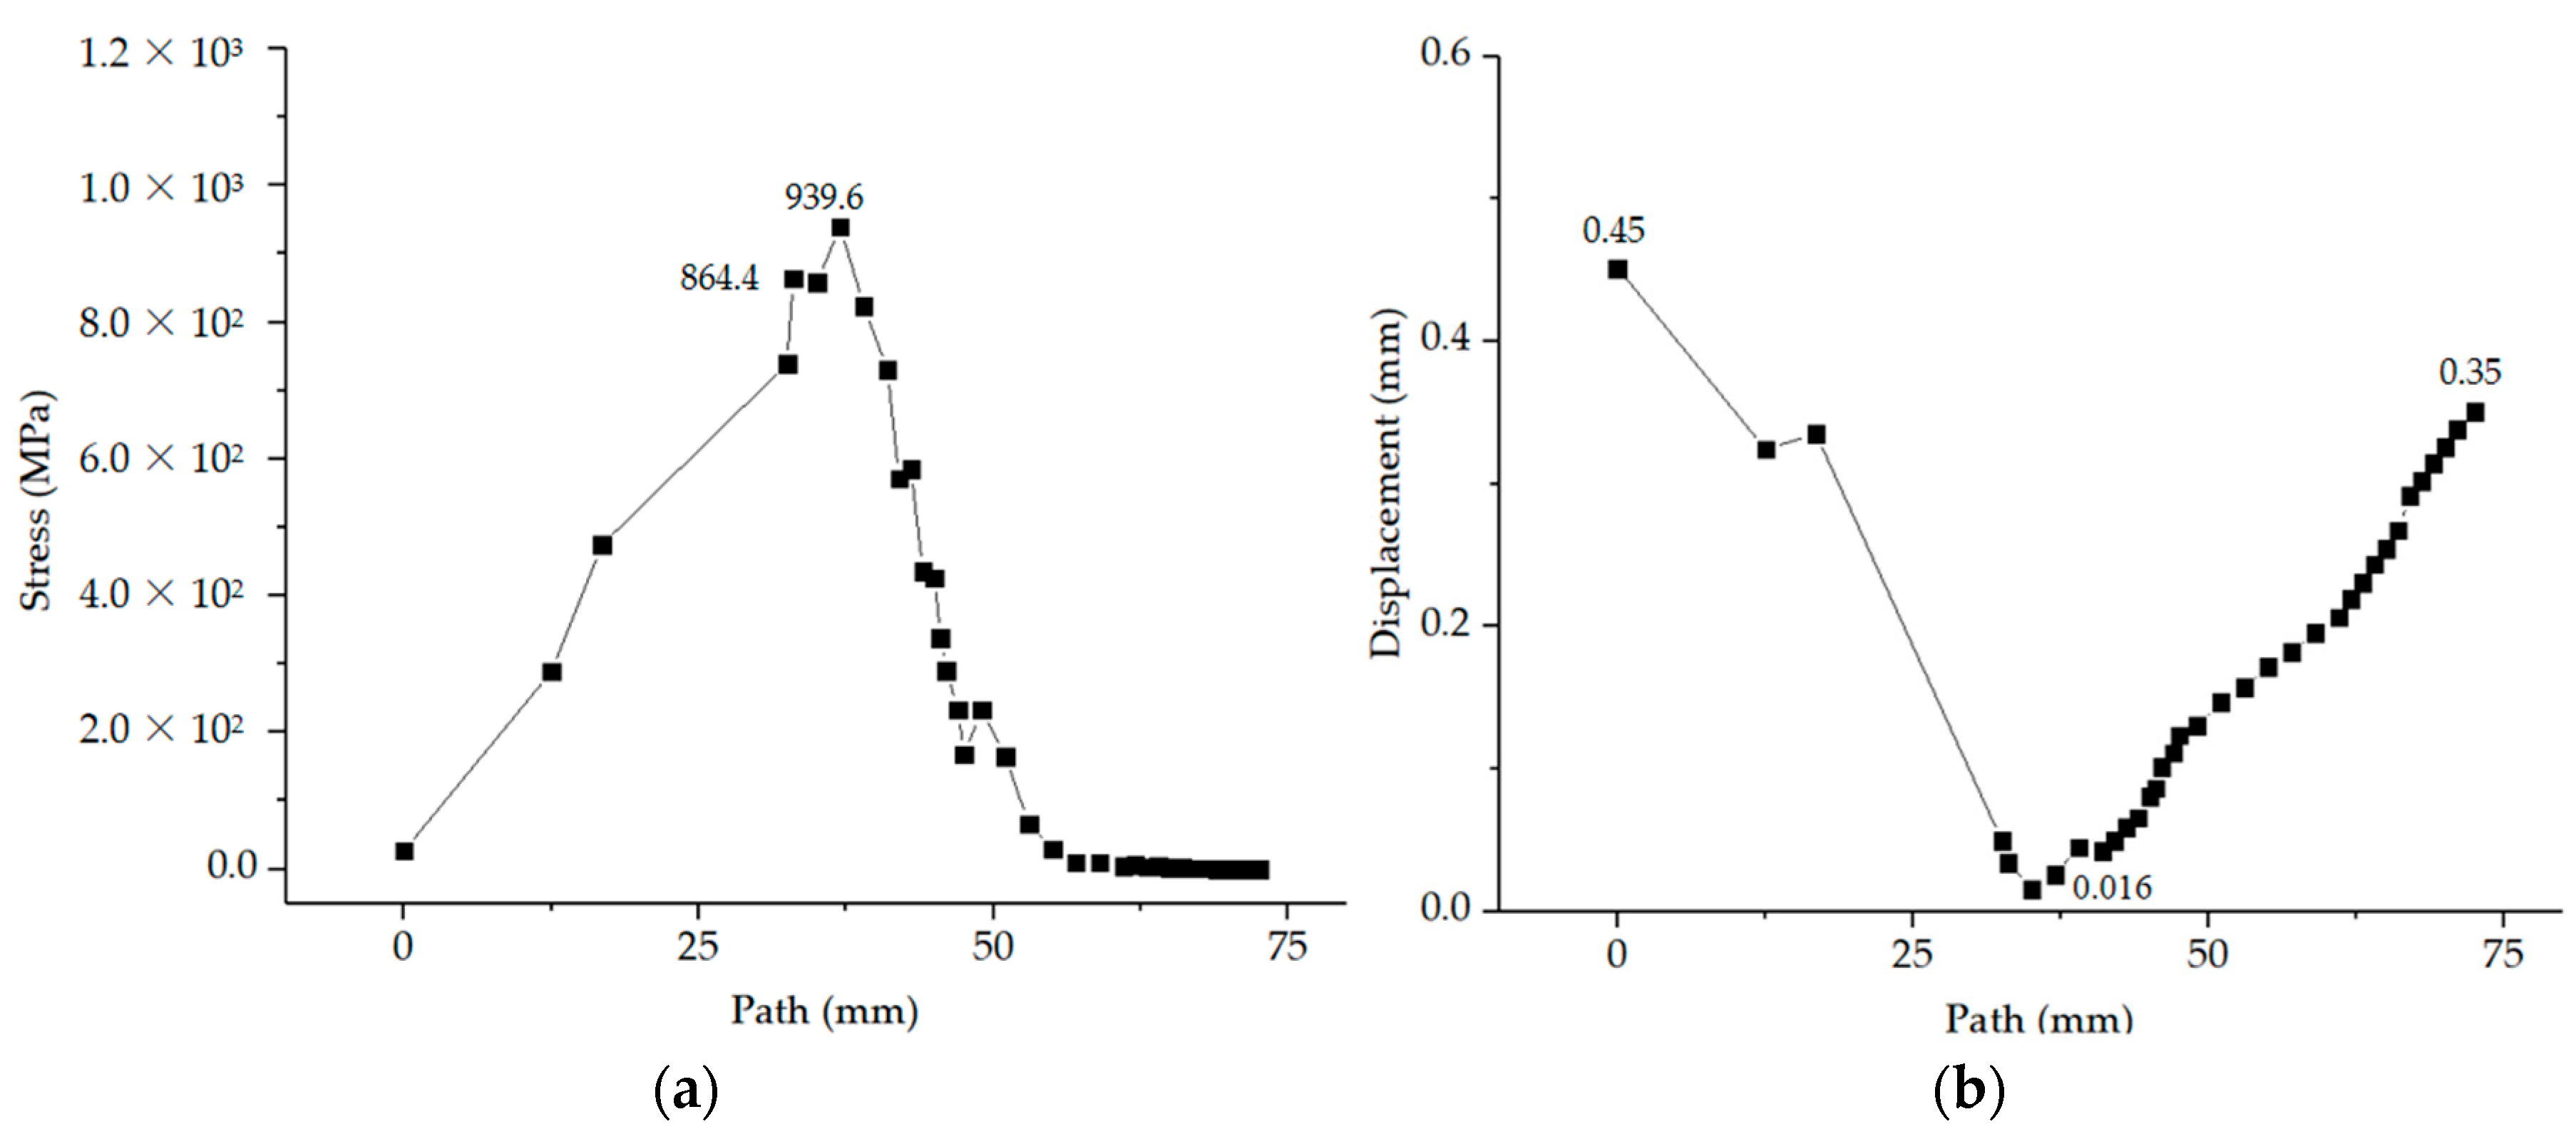
3.2. Analysis of Finite Element Results

Based on the previous scheme setting, linear load and seismic displacement is applied to obtain data by using ABAQUS software. Figure 8 shows the three-dimensional stress model of UDHSB under linear load and seismic load respectively. From Figure 8a,c, it can be found that the bolt has great deformation under linear load, and there is obvious dislocation distortion in the smooth area of the bolt without thread. There is obvious stress concentration in the transition position between the smooth area and the thread area, and there is dislocation deformation in the contact steel plate area. It can be found that from Figure 8b,d, the bolt does not have excessive deformation under seismic load, but obvious stress concentration at the transition position between the smooth zone and the thread zone. It can be inferred that the closer to the transition position of the thread damage, the more likely it is to make the bolt fail.
In order to analyze the stress of the bolt, the displacement and stress along the path as shown in Figure 9 are extracted. Figure 10 shows the stress and displacement diagram along the bolt path. The starting position of the abscissa is the top of the nut, and the end of the abscissa is the bottom of the thread. According to Figure 10, it can be found that the maximum stress position generated under seismic load is at the first and second turns of the bolt thread, and the maximum displacement is at both ends of the bolt. The stress curve generally rises first and then falls, while the displacement curve generally does the opposite. The maximum stress of stress concentration point under seismic load is 940 MPa, the maximum displacement of bolt cap top under seismic load is 0.45 mm.
Through the simulation analysis of UDHSB, it can be seen that the most vulnerable position to damage is in the first few turns of the thread. The mechanical properties of the damaged bolts are analyzed in the following chapters.

4. Analysis of Simulation Results of DHSB
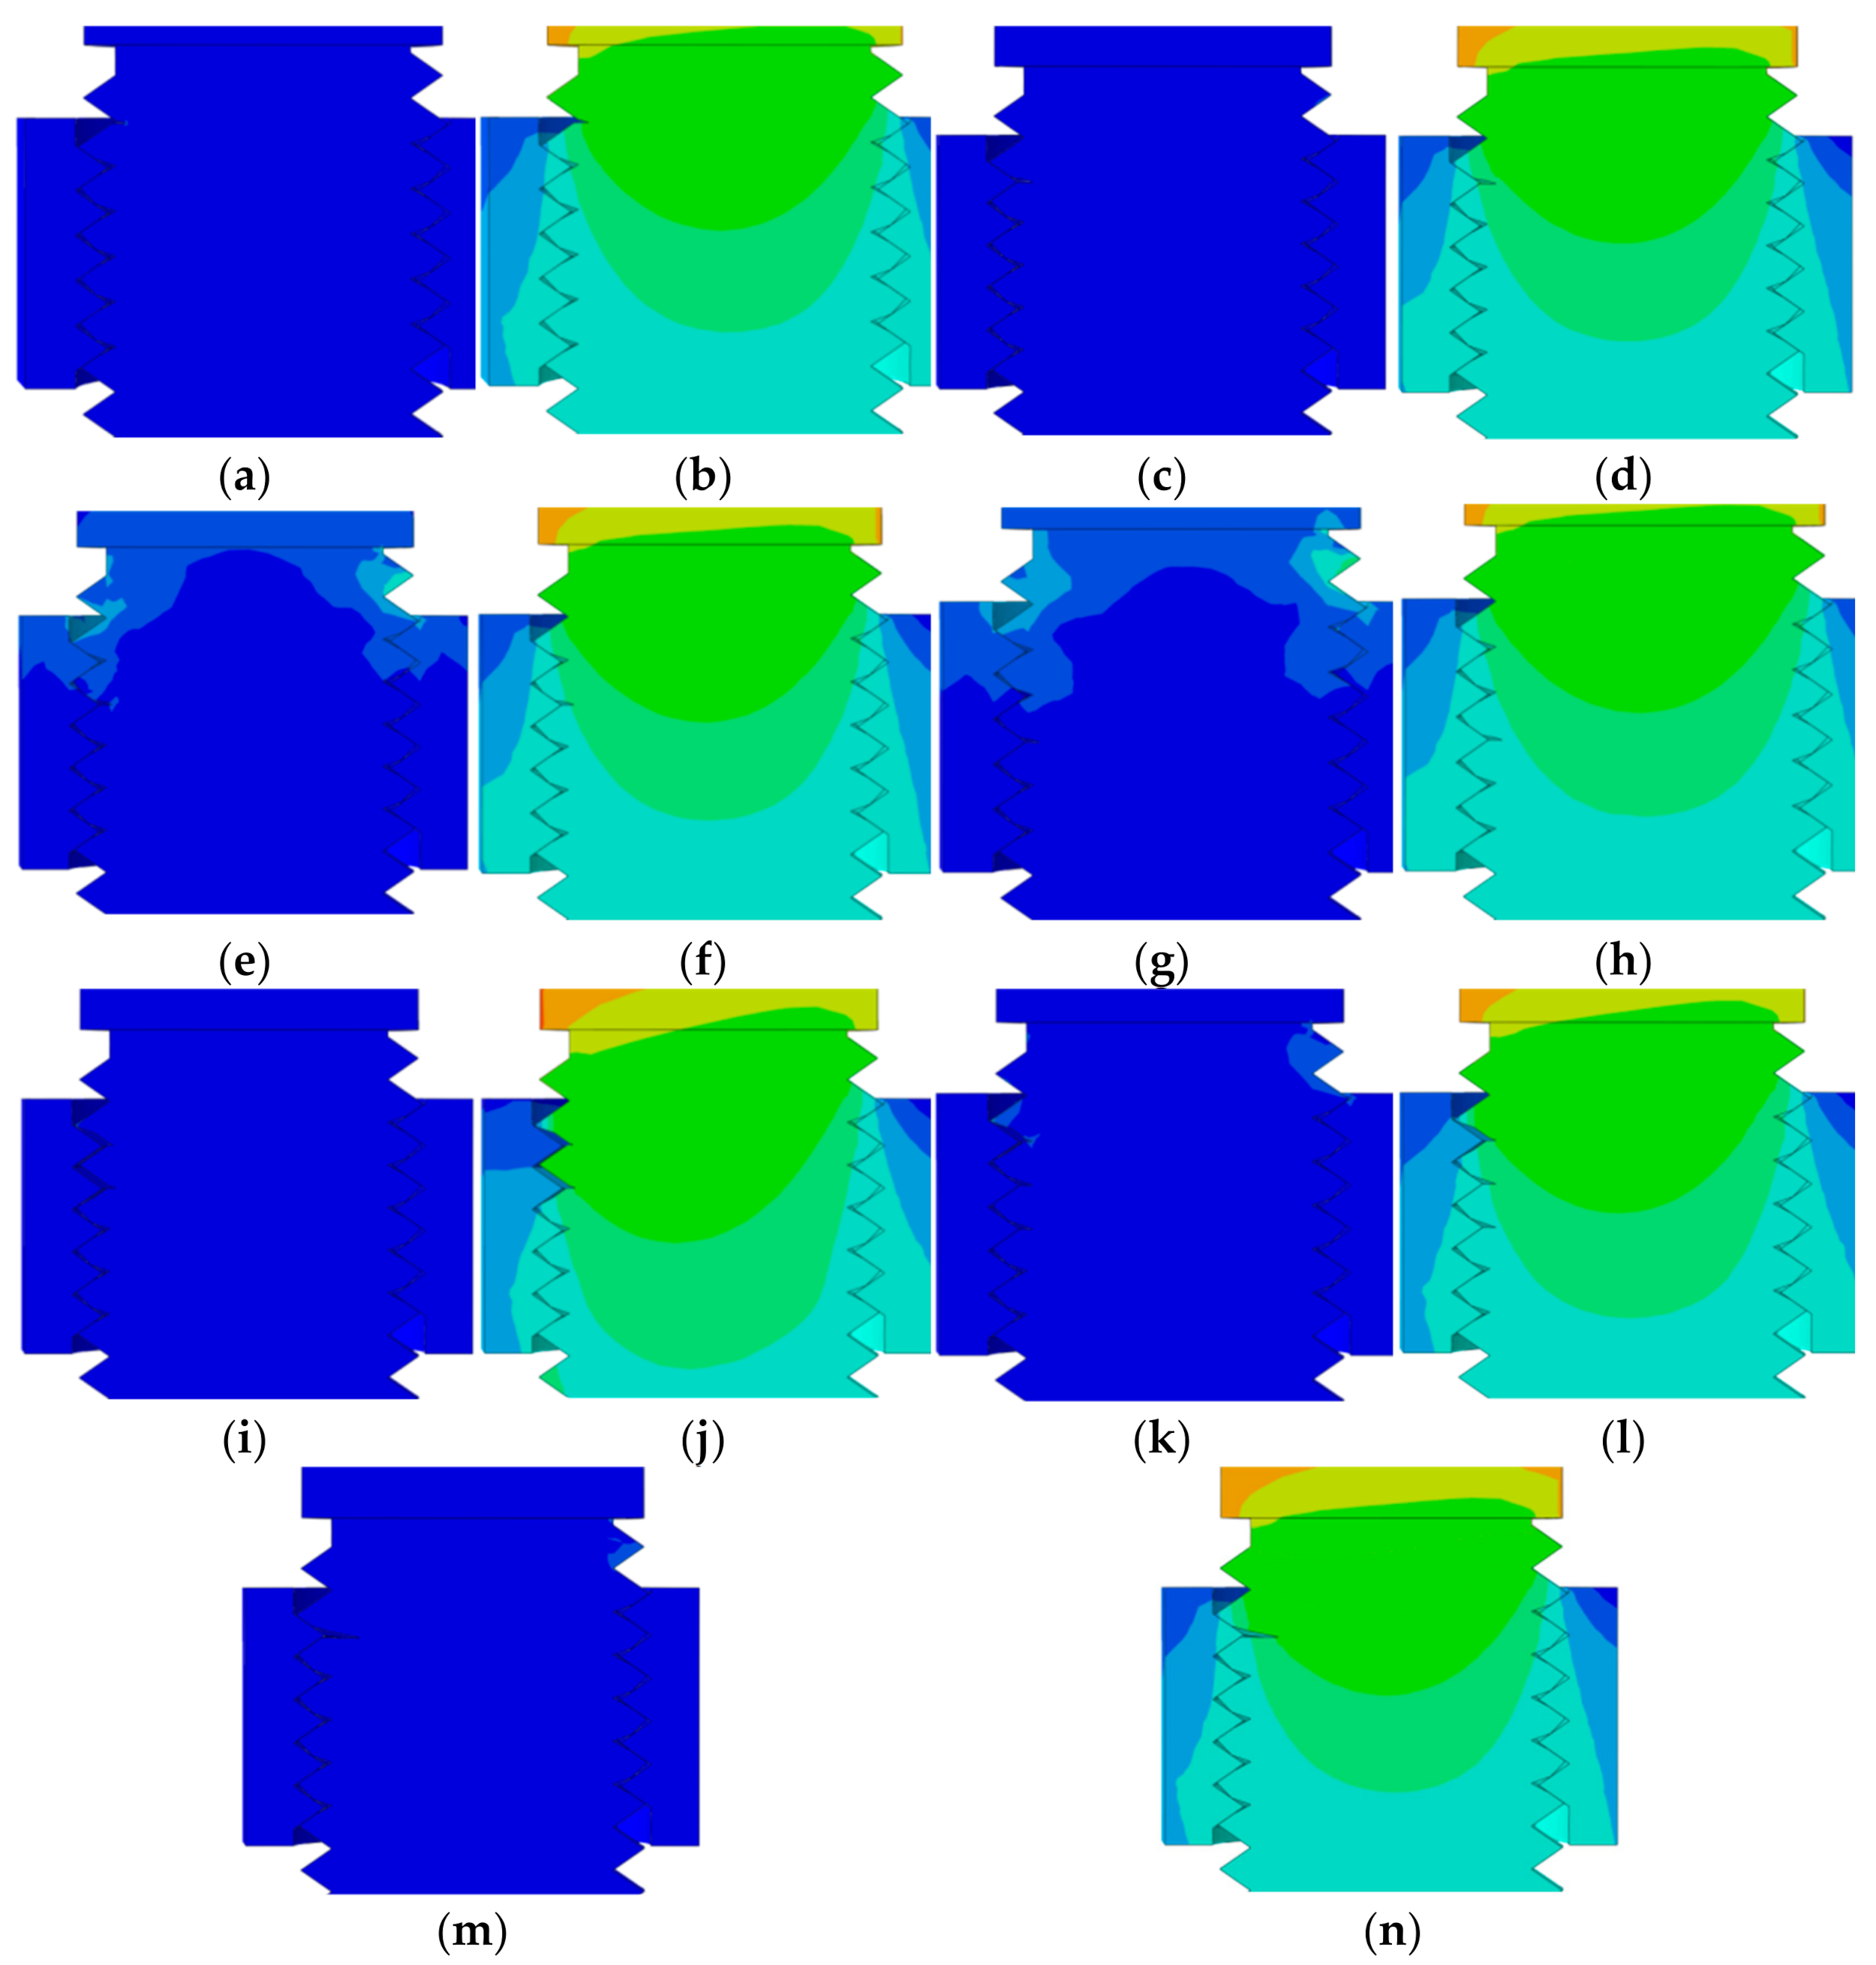
4.1. Cracked HSB

When the bolt is shaken violently or under frequent vibration, the thread that is tightly engaged will produce tiny gaps or even deformation. Crack is a common damage. The position, number and depth of crack distribution will have a certain influence on the mechanical properties of HSB. From the previous chapter, it can be found that the position of the first few circles of the thread is prone to stress concentration. Therefore, this chapter formulates different working conditions according to the position, number and depth of the crack. The specific working conditions are shown in Table 1, where the crack is applied along the path in the previous chapter.
Under different working conditions, the model of M1 to M7 is established and the seismic load is applied. M0 represents the model of UDHSB. The specific crack distribution position can be seen in Figure 11. Figure 12 shows the stress and displacement distribution along the length path of the cracked bolt. It can be seen from Figure 12a that the stress gradually increases along the path, and the stress value rises sharply when it transitions to the thread area. The maximum stress of the M1 model is 641 MPa, the maximum stress of the M2 model is 1229 MPa, and the maximum stress of the M3 model is 1206 MPa. The maximum stress of the M4 model is 896 MPa, the maximum stress of the M5 model is 3401 MPa, the maximum stress of the M6 model is 3670 MPa, and the maximum stress of the M7 model is 1007 MPa. After that, the stress value along the path generally decreases, and it will rise abruptly at the crack, but it is not as high as the value at the first rise. After the fourth ring of the thread, the stress value begins to tend to zero. From Figure 12b, it can be found that the displacement value along the path shows a downward trend as a whole, and the displacement reaches the minimum value when it transitions to the position of the thread area, and then the displacement value along the path shows an overall upward trend.
When comparing the M1, M2, M3 and M4 models, in other words, it’s comparing the location of the crack. The four models all have the maximum stress value at the bottom of the second ring thread along the path, and the displacement changes of the four models are almost the same. According to the division of the yield area, the unyielding area, the division of the exceeding the tensile strength zone, and the division not exceeding the tensile strength zone, it can be found that the stress values of M1 and M4 with cracks are close to the yield critical value, while the stress values of M2 and M3 with cracks are all above 1000 MPa. Therefore, it can be judged that when the crack appears in the second and third rings of the thread bottom, the bolt is very likely to be damaged, and it needs to be replaced in time for safety concerns.
Comparing the M2 and M7 models, it is found that the maximum stress at the crack in M2 is 1229 MPa, and the maximum stress at the crack in M7 is 1007 MPa. The ratio of the maximum stress value of the two is close to 1.22. The maximum displacement of the M2 model is 0.47 mm, and the maximum displacement of the M7 model is 0.28 mm. The ratio of the maximum displacement value of the two is close to 1.7. As can be seen from these data, it is not inferred that the longer the crack, the greater the stress concentration and displacement deformation. On the contrary, the shorter the crack length, the greater the stress concentration and displacement deformation.
When comparing M2, M5 and M6 models, that is, comparing the number of cracks, the more the number of cracks, the greater the stress generated by the bottom of the second ring thread of the model. The M6 model has the maximum stress value, but the displacement change is the smallest among the three. The displacement changes of M2 and M5 are almost the same. From the stress diagram, it can be seen that M5 and M6 have a stress value far exceeding the tensile strength. The highest stress value of M5 reaches 3401 MPa, and the highest stress value of M6 reaches 3670 MPa, which is more than three times the tensile strength. It can be seen that increase in the number of cracks has a very serious impact on the failure of the bearing capacity of the bolt. When there is more than one crack, the bolt must be replaced in time, otherwise there will be a great safety hazard.
Figure 13 shows the curve of time and displacement derived from the position of the second thread base. Comparing the M1 to M7 models, it can be found that the displacement values of these models are not different, and they all present ripple curves within 0.25 mm. Among the seven models, the displacement generated by M4 is relatively larger, and the displacement generated by M1 is relatively smaller, while the displacement value of other models is in between. From the perspective of changing the crack location, the larger the number of circles where the crack location is located, the larger the displacement will be. The change of crack number has little effect on displacement. The greater the crack depth, the smaller the displacement.
By controlling the crack position, length, number and other single variables to compare the relevant models, the following conclusions can be drawn: the most unfavorable position of the crack is at the bottom of the second screw thread, the shorter the crack length, the greater the stress concentration and displacement deformation; the more the number of cracks, the greater the concentrated stress value.

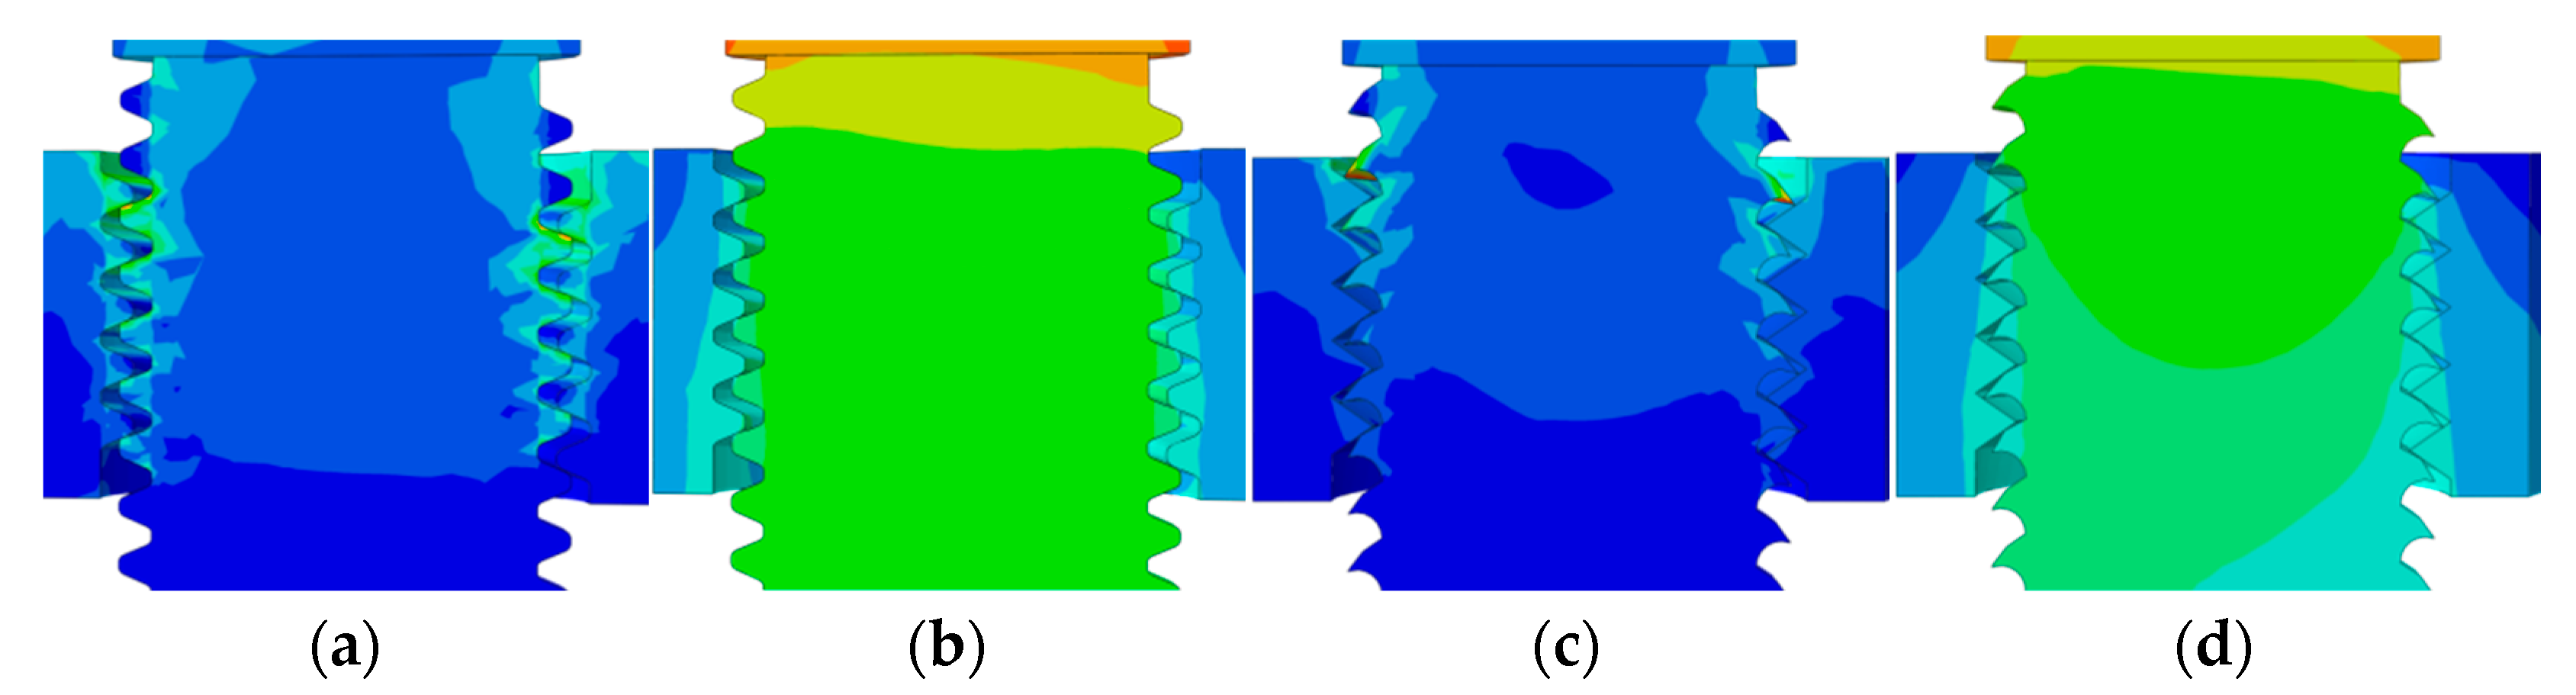
4.2. HSB with Deformed Thread Teeth

With the change of time, the thread of the bolt will have some damage, which may be caused by the collision and wear between the thread teeth, or the relative dislocation of the bolt and the nut to make the thread teeth bend. In order to better study the influence of threaded tooth deformation on HSB, a working condition shown in the table below (Table 2) is developed.
According to the working conditions, the model of C1 and C2 are established in this paper, and applied the seismic load. The specific thread tooth deformation can be seen in Figure 14. Figure 15 shows the stress and displacement distribution along the length path of the deformed bolt. It can be found from Figure 15a that the stress increases gradually along the path, and the stress value rises sharply when it transits to the thread area. The maximum stress of C1 model is 1245 MPa, which is located at the top of the third ring thread. The maximum stress of C2 model is 3308 MPa, which is located at the top of the second ring thread. After changing the nut position along the path, the stress value begins to approach zero.
From Figure 15b, it can be found that the displacement value along the path shows a downward trend as a whole, the displacement reaches the minimum value when it transitions to the position of the thread area, and then the displacement value along the path shows an overall upward trend.
Figure 16 shows the curve of time and displacement derived from the position of the second thread base of C1 and C2. The displacement values of C1 and C2 fluctuated within 0.2 mm with time. It can be seen that the destructiveness of the two damage modes of C1 and C2 under earthquake action is still within normal range, and it can be persisted for a period of time for continuous use.

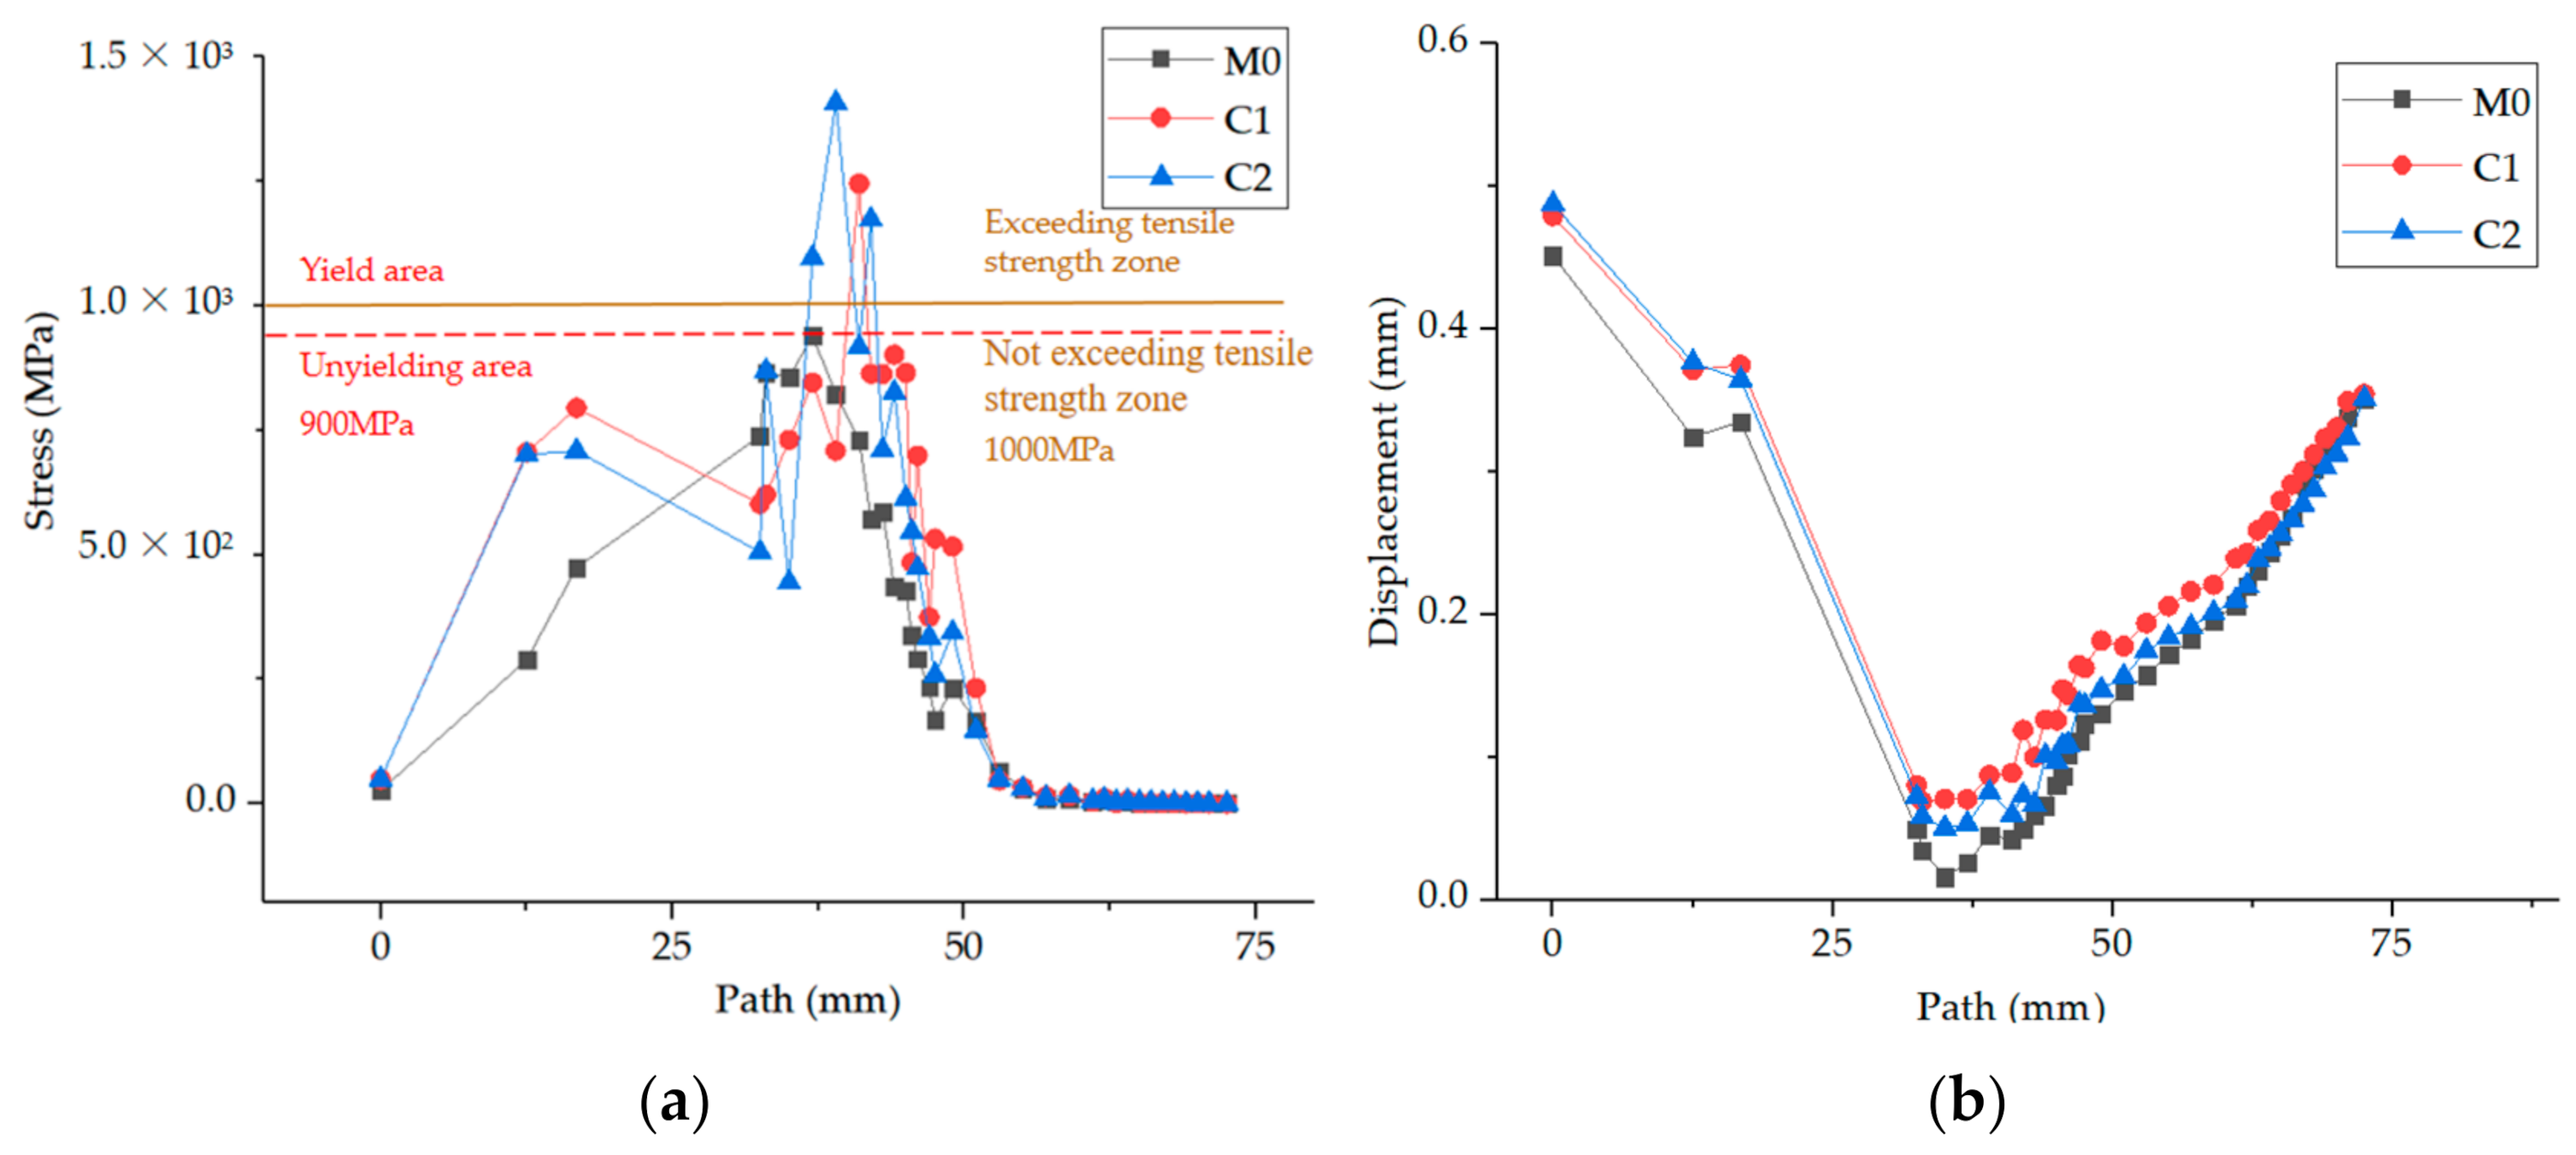
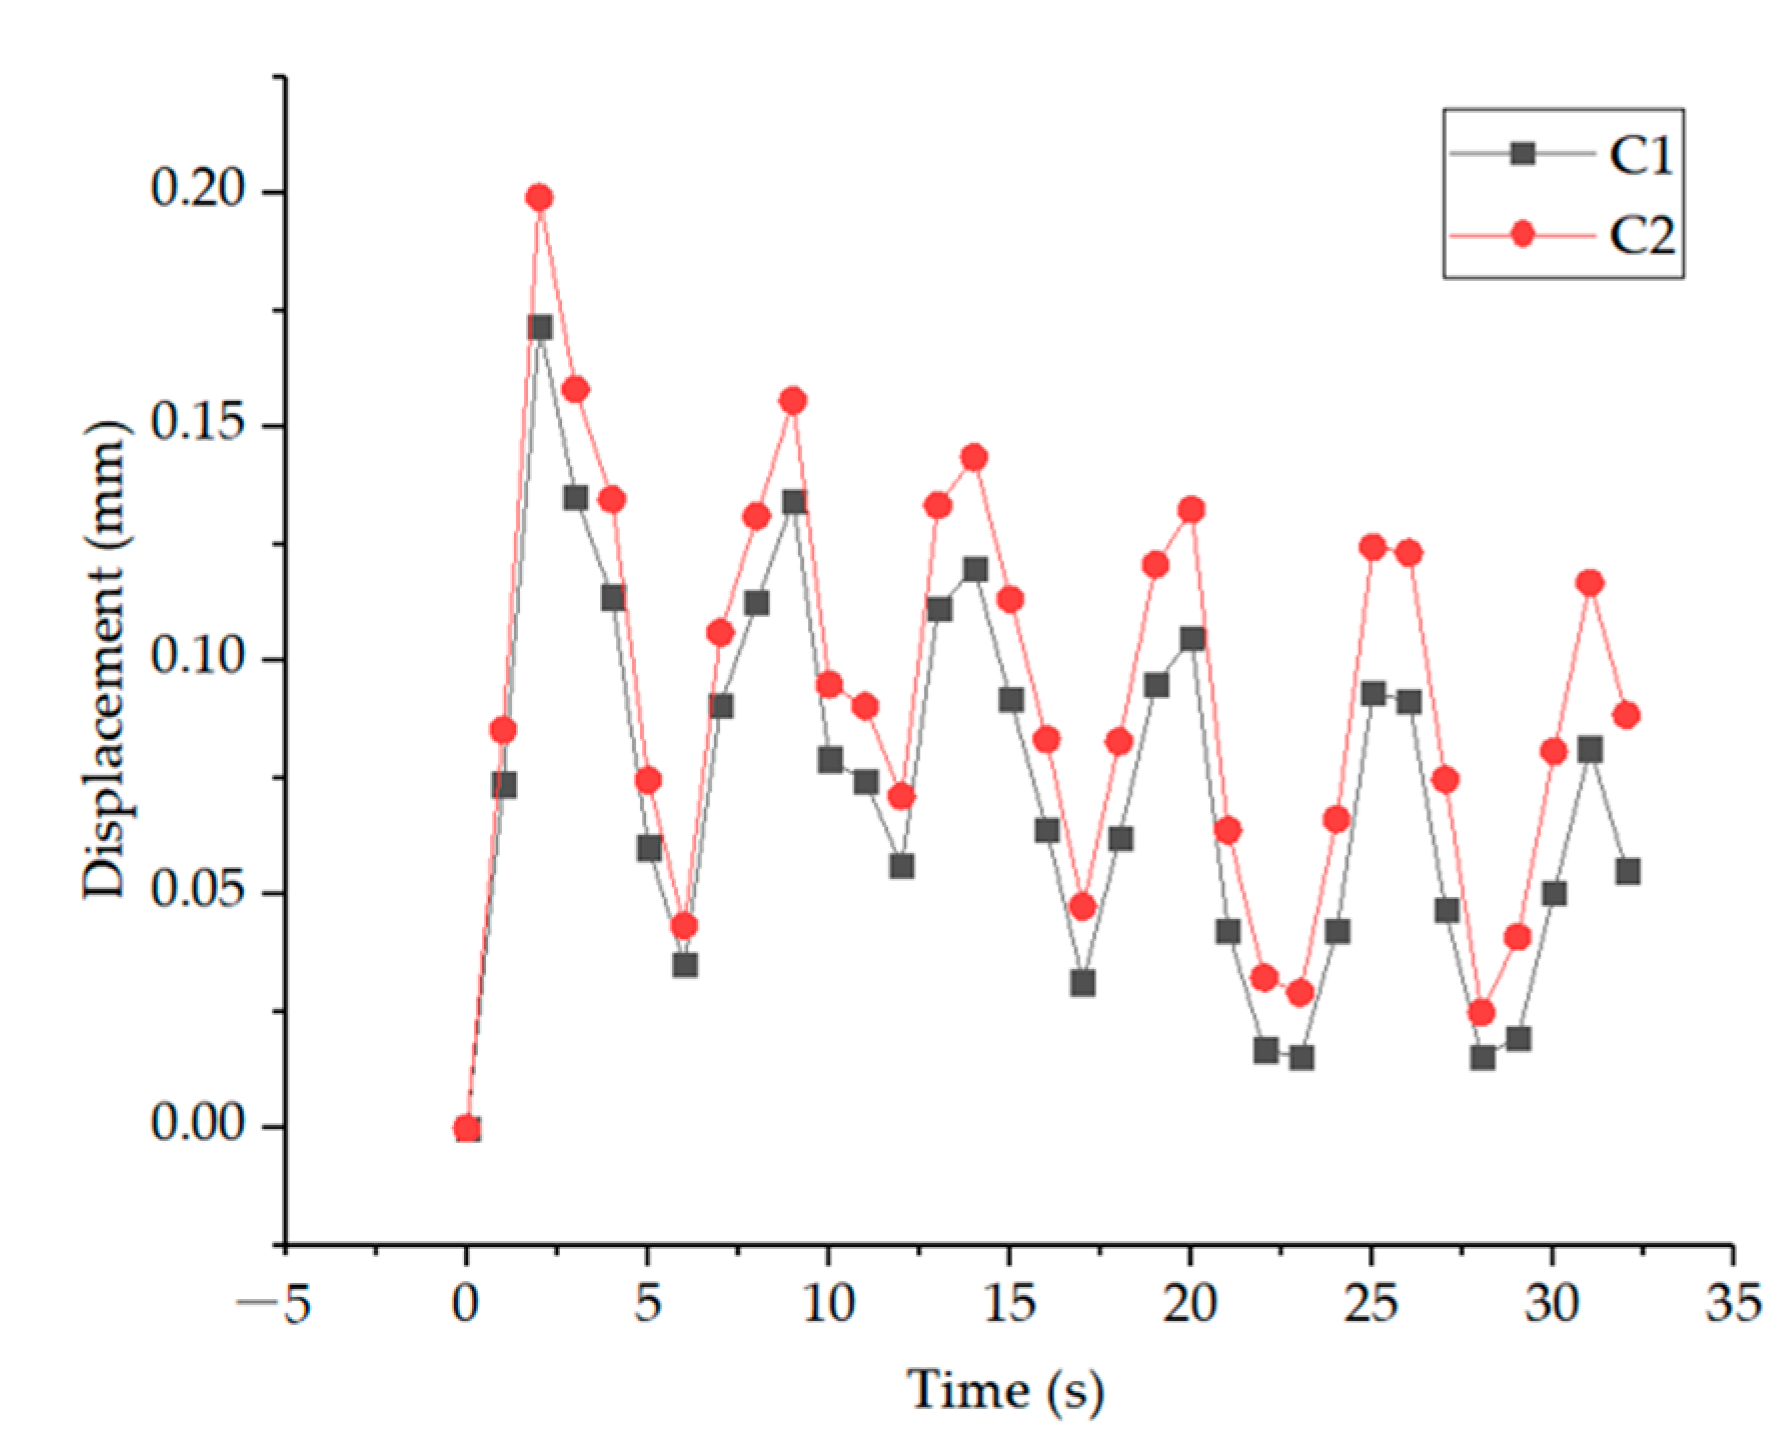
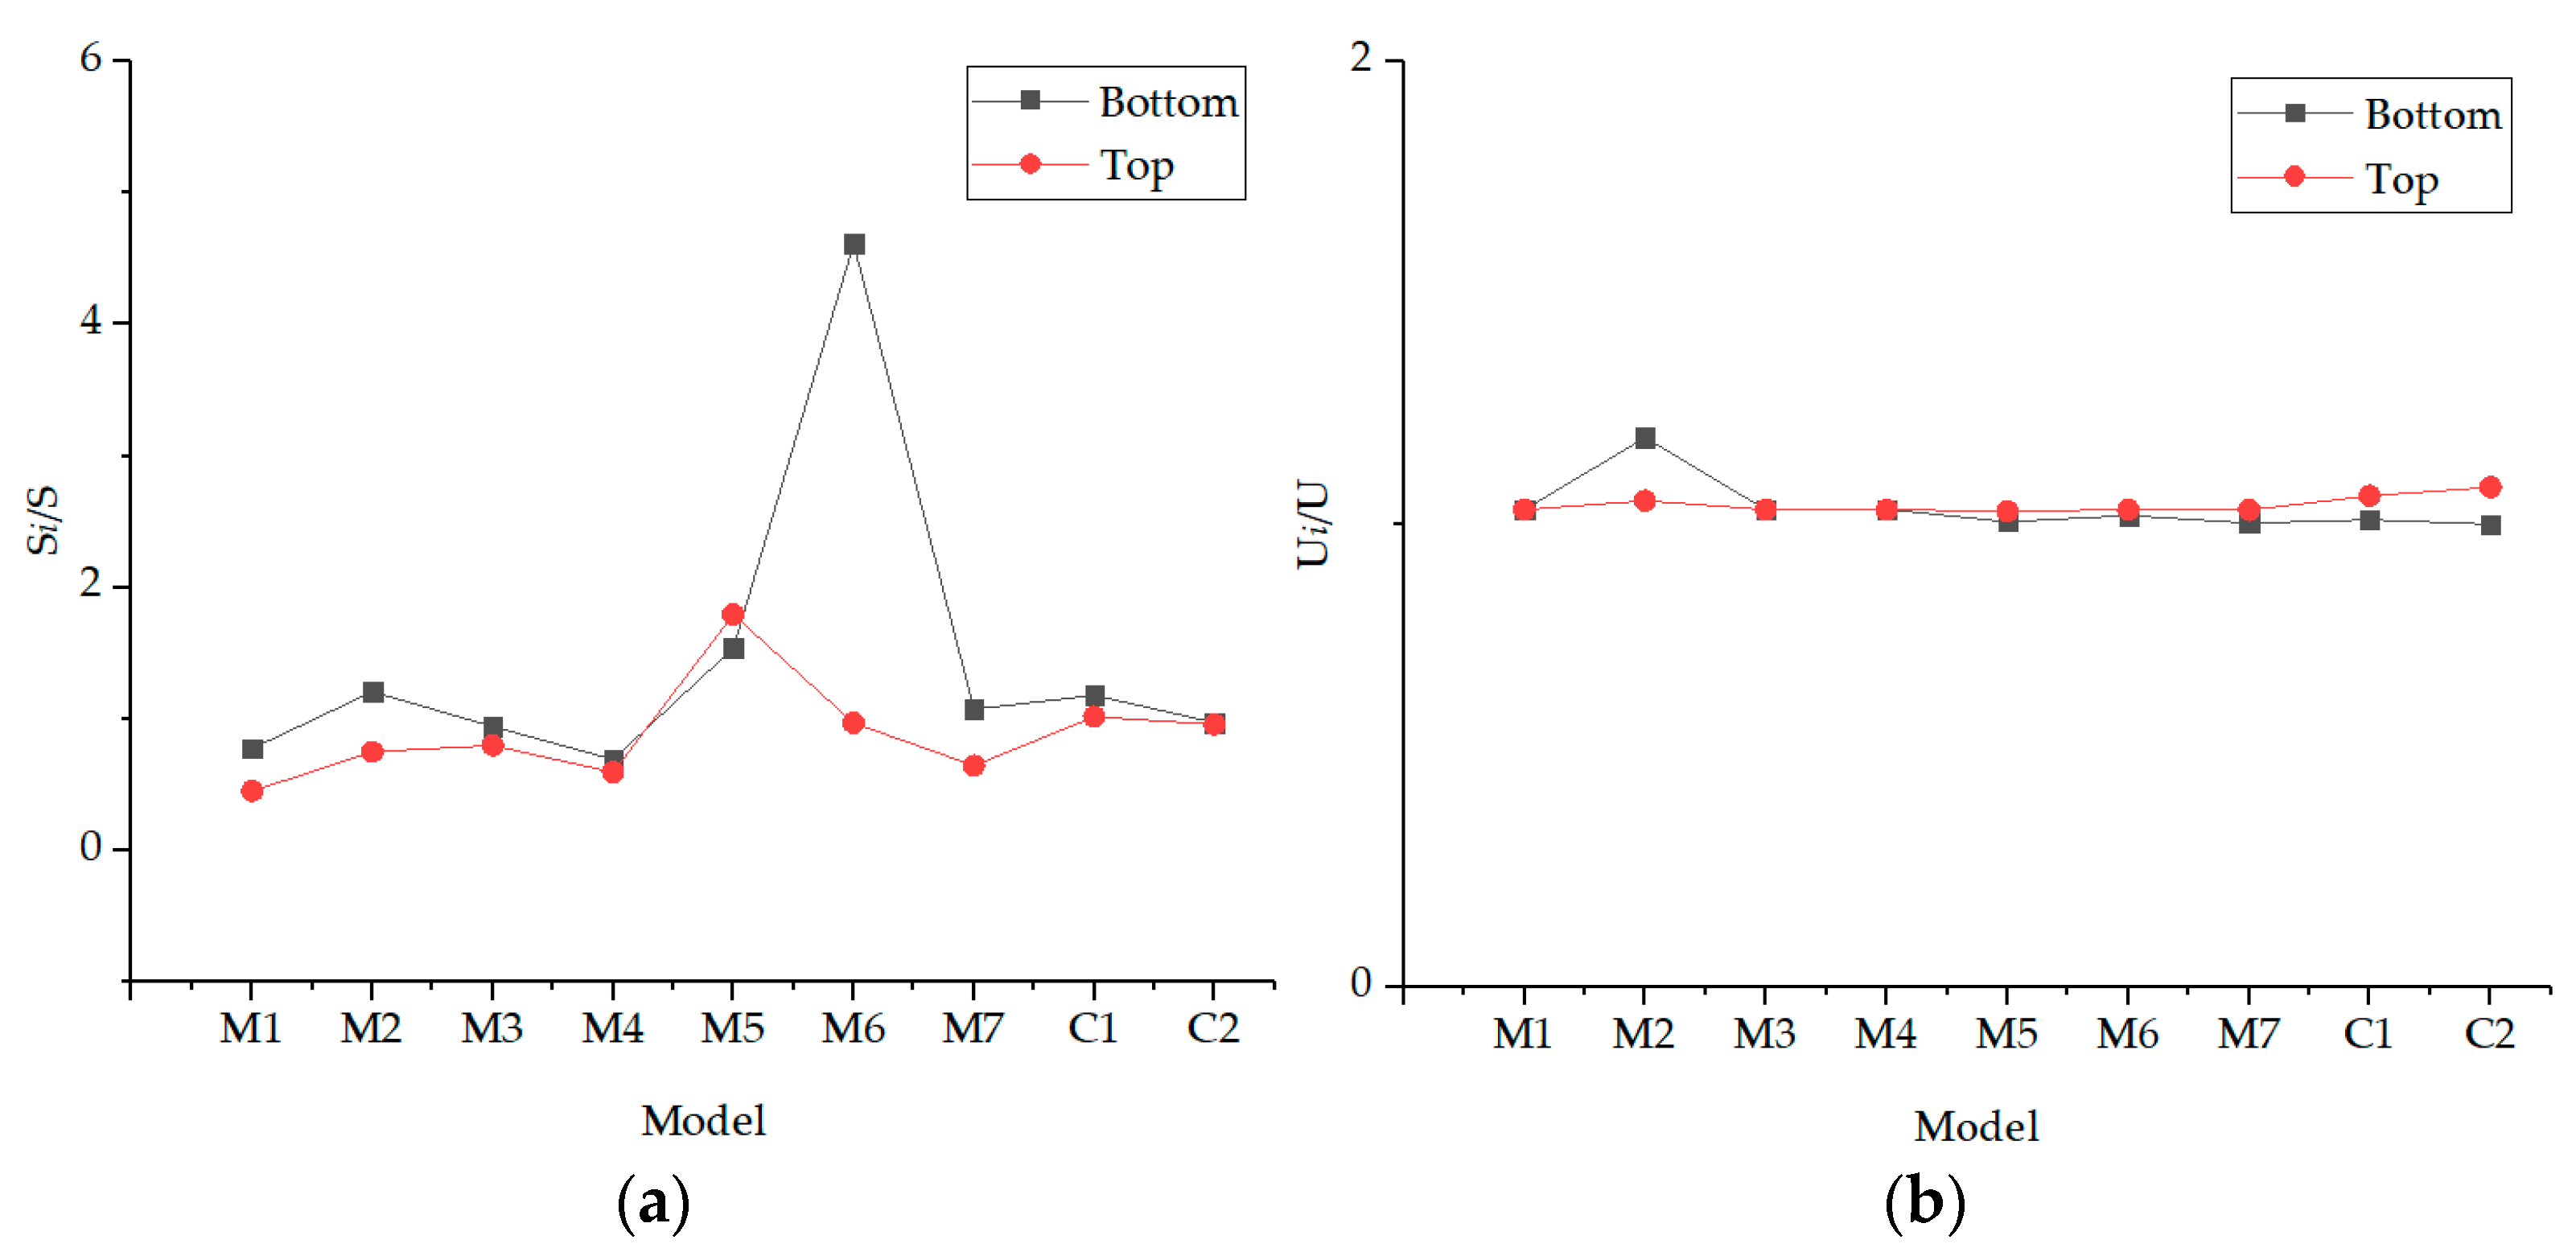
4.3. Comparison of DHSB and UDHSB

The bolts selected in this paper are 10.9 grade M20 fine-tooth HSB. The yield strength is 900 MPa, that is, the selected bolts will deform when the force exceeds 900 MPa. The tensile strength is 1000 MPa, that is, the selected bolts will be damaged when the force exceeds 1000 MPa. In order to understand the difference between the stress of different degrees of damaged bolts, the data of more than 900 MPa and 1000 MPa along the path were extracted for analysis. From Figure 12a and Figure 15a, it can be found that only M1 and M4 in the damage high-strength bolt simulation model do not exceed the limit value, while the other models have exceeded the limit value.
Take the second round of thread as the main research point, extract the stress value of the second round of thread bottom and top, compare the multiple of DHSB and UDHSB, and obtain the curve as shown in Figure 17a. It can be seen from the contents of the previous section that the maximum displacement of the bolt occurs at the top nut and the bottom of the bolt, so the displacement data of the two positions are extracted to compare the difference between the damaged high-strength bolt and the undamaged high-strength bolt, which is shown in Figure 17b.
When it comes to difference of stress and displacement between DHSB and UDHSB, it can be seen that the model with the largest deviation is M6, that is to say, tooth thinning is very vulnerable to damage. The stress multiple of M6 is mainly reflected in the thread top, reaching 4.7 times, and the displacement multiple is mainly reflected in the bottom of the bolt, reaching 0.9 times.
For DHSB and UDHSB comparison, one crack bolt stress is about 0.8–1.2 times the non-destructive bolts, two cracks will reach 1.5 times, three cracks reached 4.6 times. The stress generated by the bolts with grind and bent teeth is about 0.9–1.1 times that of the UDHSB. It can be seen that the DHSB have quite serious hidden dangers and must be replaced in time.

5. Conclusions

In this paper, the finite element simulation of 10.9 grade M20 fine-tooth HSB is carried out. The differences of bolts before and after artificial damage are studied. The effects of different factors on the performance of HSB under different damage degrees are analyzed. The following conclusions are drawn:
The most unfavorable position for the crack is the bottom of the second thread with a concentrated stress value up to 1229 MPa appearing in the test. The model with shorter crack length has larger stress concentration and displacement deformation. The larger the number of cracks, the greater the concentrated stress value.
The concentrated stress value generated by the deformation of the thread tooth is higher than that generated by the crack. The concentrated stress generated by the deformation of the thread tooth is at the top of the thread tooth, and the concentrated stress generated by the crack is at the bottom of the thread tooth. If the tooth shape is changed at an appropriate position, it benefits to reduce the bolt damage.
Compared with the thread tooth becoming thinner, the influence of thread tooth grinding or thread tooth bending on HSB is less, but still can increase the concentrated stress value and relative displacement. The influence of thread tooth grinding on HSB is greater than that of thread tooth bending.
Compared with UDHSB, the stress produced by bolts with one crack is about 0.8–1.2 times that of UDHSB, 1.5 times for two cracks and 4.6 times for three cracks. The stress generated by bolts with grind teeth and bent teeth is about 0.9–1.1 times that of UDHSB. It is concluded that DHSB has serious hidden dangers, especially DHSB with more than one crack, which must be replaced in time.

Author Contributions

Validation, Y.G.; formal analysis, W.W.; data curation, L.F.; writing—original draft preparation, L.F.; writing—review and editing, Y.L.; visualization, J.H.; supervision, Y.L. All authors have read and agreed to the published version of the manuscript.

Funding

This work is supported by the Key Research and Development Program of Shaanxi (Program No. 2022SF-085), the Opening Fund of State Key Laboratory of Green Building in Western China (LSKF202116), Science and Technology Plan Project of Yulin (CXY-2020-053), and Key Laboratory of Well Stability and Fluid & Rock Mechanics in Oil and Gas Reservoir of Shaanxi Province (No. WSFRM 20200102001).

Data Availability Statement

All data involved in this article can be found in the text. The data that support the findings of this study are available on request from the corresponding author, upon reasonable request.

Conflicts of Interest

The authors declare that they have no known competing financial interests or personal relationships that could have appeared to influence the work reported in this paper.

Nomenclature

SymbolConnotation
PLateral load
P0Preload
P1Pressure on contact surface between screw and lower steel plate after bending deformation of screw
P2Friction resistance between nut bottom and upper steel plate
laThickness of upper steel plate
lbThickness of lower steel plate
MBending moment generated after screw bending deformation
θThe angle between the position of the thread surface that needs to be analyzed separately and the X-axis
μsFriction coefficient
fFriction
w Deflection
SAApplied stress of transverse load in micro area
S0Applied stress of axial load in micro region
A0Contact area of single thread surface
d, d1, d2Major diameter, minor diameter and pitch diameter of thread
IyMoment of inertia of screw cross section
σANormal stress generated by SA on the thread surface
τATangential stress generated by SA on the thread surface
λAngle between SA and τA
σ0Normal stress generated by S0 on the thread surface
τ0Tangential stress generated by S0 on the thread surface
βAngle between S0 and τ0
γAngle between τA and τ0
GAssumed coefficient

References

  1. Chakhari, J.; Daidié, A.; Chaib, Z.; Guillot, J. Numerical model for two-bolted joints subjected to compressive loading. Finite Elem. Anal. Des. 2008, 44, 162–173. [Google Scholar] [CrossRef]
  2. Wang, W.; Tang, N.; Yan, Q.; Bai, F. Failure Analysis of Connecting Bolts for Main Hub of Civil Aircraft. Mater. Bull. 2008, 22, 163–165. [Google Scholar]
  3. Liu, L.; Long, W. Research on the causes and prevention of passenger injury accidents in subway escalators. China Railw. 2011, 5, 70–73. [Google Scholar]
  4. Cao, H.; Tang, Q.; Zhou, Y. Failure analysis of high strength bolt fracture of a TV tower steel mast. Sichuan Constr. 2016, 36, 145–148. [Google Scholar]
  5. Song, W.; Zhang, K. Failure analysis of bolt fracture of reciprocating roller coaster vehicle connector. J. Saf. Environ. 2021, 21, 1106–1110. [Google Scholar]
  6. Ma, X.; Li, Y.; Sun, L. Research on the cause analysis and solution of tower bolt fracture. Wind. Energy 2022, 2, 68–71. [Google Scholar]
  7. Sopwith, D.G. The Distribution of Load in Screw Threads. Proc. Inst. Mech. Eng. 1948, 159, 373–383. [Google Scholar] [CrossRef]
  8. Yamatoto, A. The Theory and Computation of Threads Connection; Yokendo: Tokyo, Japan, 1980. [Google Scholar]
  9. Hetényi, M. A Photoelastic Study of Bolt and Nut Fastenings. J. Appl. Mech. 1943, 10, A93–A100. [Google Scholar] [CrossRef]
  10. Kenny, B.; Patterson, E.A. Load and stress distribution in screw threads. Exp. Mech. 1985, 25, 208–213. [Google Scholar] [CrossRef]
  11. Bretl, J.L.; Cook, R.D. Modeling the load transfer in threaded connections by the finite element method. Int. J. Numer. Methods Eng. 1979, 14, 1359–1377. [Google Scholar] [CrossRef]
  12. Chen, J.; Shih, Y. A study of the helical effect on the thread connection by three dimensional finite element analysis. Nucl. Eng. Des. 1999, 191, 109–116. [Google Scholar] [CrossRef]
  13. Toribio, J.; González, B.; Matos, J.-C.; Ayaso, F.-J. Fatigue behaviour of bolted joints. Met. Mater. Int. 2012, 18, 553–558. [Google Scholar] [CrossRef]
  14. Stéphan, P.; Mathurin, F.; Guillot, J. Experimental study of forming and tightening processes with thread forming screws. J. Mater. Process. Technol. 2012, 212, 766–775. [Google Scholar] [CrossRef]
  15. Ham, J.-O.; Jang, Y.-H.; Lee, G.-P.; Kim, B.-G.; Rhee, K.-H.; Cho, C.-K. Evaluation method of sensitivity of hydrogen embrittlement for high strength bolts. Mater. Sci. Eng. A 2013, 581, 83–89. [Google Scholar] [CrossRef]
  16. Wang, W.; Xu, H.; Ma, Y.; Liu, H. Research on self-relaxation mechanism of bolt connection under vibration condition. Vib. Impact 2014, 22, 198–202. [Google Scholar]
  17. Wang, Y.; Gao, L.; Yuan, P. Cause analysis of longitudinal cracking of internal thread joint of double shoulder drill pipe. Mach. Tool Hydraul. 2015, 43, 183–186. [Google Scholar]
  18. Liu, M.; Zhu, X.; Wang, P.; Tuoya, W.; Hu, S. Tension strength and design method for thread-fixed one-side bolted T-stub. Eng. Struct. 2017, 150, 918–933. [Google Scholar] [CrossRef]
  19. Yang, X.; Lei, H.; Chen, Y. Constant amplitude fatigue test research on M20 high-strength bolts in grid structure with bolt–sphere joints. Adv. Struct. Eng. 2017, 20, 1466–1475. [Google Scholar] [CrossRef]
  20. Qu, W.; Zhang, M.; Zhou, J.; Xiao, L. Subharmonic resonance identification method for bolt loosening damage. Vib. Test Diagn. 2017, 403, 279–283. [Google Scholar]
  21. Zhang, M.; Lu, L.; Tang, M.; Zeng, D. Numerical method for calculating critical loosing load of bolts under lateral load. Chin. J. Mech. Eng. 2018, 54, 173–178. [Google Scholar]
  22. Guo, H.; Wan, J.; Liu, Y.; Wang, D.; Li, Y. Experimental study on fatigue performance of bolted joints of Q690D high strength steel. J. Civ. Eng. 2018, 51, 20–26. [Google Scholar]
  23. Zhang, Y.; Chen, B.; Liu, A.; Pi, Y.; Zhang, J.; Wang, Y.; Zhong, L. Experimental study on shear behavior of high strength bolt connection in prefabricated steel-concrete composite beam. Compos. Part B-Eng. 2019, 159, 481–489. [Google Scholar] [CrossRef]
  24. Kraemer, F.; Klein, M.; Oechsner, M. Fatigue properties of bolted joints with cut and formed threads. Mater. Werkst. 2019, 50, 204–224. [Google Scholar] [CrossRef]
  25. You, J.; Hong, Y.; Jeon, S.; Huh, J.; Ahn, J.-H. Behavior of bolt-connected steel plate girder attributable to bolt loosening failure in the lower flange. Eng. Fail. Anal. 2020, 107, 104208. [Google Scholar] [CrossRef]
  26. Song, Y.; Wang, J.; Uy, B.; Li, D. Experimental behaviour and fracture prediction of austenitic stainless steel bolts under combined tension and shear. J. Constr. Steel Res. 2020, 166, 105916. [Google Scholar] [CrossRef]
  27. Beland, T.; Bradley, C.R.; Nelson, J.; Sizemore, J.G.; Davaran, A.; Tremblay, R.; Hines, E.M.; Fahnestock, L.A. Experimental Parametric Characterization of Bolted Angle Connection Behavior. J. Struct. Eng. 2020, 146, 04020160. [Google Scholar] [CrossRef]
  28. Wu, Q.; Wang, H.; Qian, H.; Han, K.; Fan, F. Effect of insufficient screwing depth of bolt on mechanical behavior of bolt-ball joint and stability of single-layer reticulated shell. Eng. Struct. 2020, 213, 110590. [Google Scholar] [CrossRef]
  29. Zheng, B.; Wang, J.; Gu, Y.; Shu, G.; Xie, J.; Jiang, Q. Experimental study on stainless steel high-strength bolted slip-resistant connections. Eng. Struct. 2021, 231, 111778. [Google Scholar] [CrossRef]
  30. Ge, M.; Cheng, X.; Huang, W.; Hu, R.; Cheng, Y. Damage mode and load distribution of countersunk bolted composite joints. J. Compos. Mater. 2021, 55, 1717–1732. [Google Scholar] [CrossRef]
  31. Cumbicus, W.E.; Estrems, M.; Arizmendi, M.; Jiménez, A. Joining polymer parts with self-tapping screws: An improvement of the screw thread geometry. Int. J. Mater. Form. 2021, 14, 777–798. [Google Scholar] [CrossRef]
  32. Gao, S.; Xu, Y.; Zhang, S.; Derlatka, A. Performance of square concrete-filled steel tubular columns under repeated lateral impact. Eng. Struct. 2023, 280, 115719. [Google Scholar] [CrossRef]
  33. Pai, N.G.; Hess, D.P. Experimental study of loosening of threaded fasteners due to dynamic shear loads. J. Sound Vib. 2002, 253, 585–602. [Google Scholar] [CrossRef]
  34. Eccles, W.; Sherrington, I.; Arnell, R.D. Towards an understanding of the loosening characteristics of prevailing torque nuts. Proc. Inst. Mech. Eng. Part C J. Mech. Eng. Sci. 2010, 224, 483–495. [Google Scholar] [CrossRef]
  35. Li, D. Study on Mechanical Properties of Concrete Filled Steel Tubular Column—Steel Beam Unilateral Bolted Joint; Fuzhou University: Fuzhou, China, 2016. [Google Scholar]
  36. Liu, Y.; Yang, T.; Li, B.; Liu, B.; Wang, W.; Wang, S. Seismic Performance of Ni-Ti SMA Wires Equipped in the Spatial Skeletal Structure. Front. Mater. 2021, 8, 704207. [Google Scholar] [CrossRef]
Figure 1. Schematic Diagram of Thread Damage: (a) Bolt and nut; (b) Thread tooth damage amplification diagram; (c) Ⅰ-Ⅰ cross-section.
Buildings 13 00776 g001
Figure 2. Mechanical model and mechanism diagram of bolt: (a) Load loading diagram; (b) Bolt deformation equivalent model diagram.
Buildings 13 00776 g002
Figure 3. Specific force diagram of thread surface of bolt under transverse vibration load.
Buildings 13 00776 g003
Figure 4. Schematic Diagram of Design Model: (a) Front view of design model; (b) Side view of design model.
Buildings 13 00776 g004
Figure 5. Seismic load application diagram of frame model.
Buildings 13 00776 g005
Figure 6. Output data curve of time and displacement: (a) Displacement change of point a and point b; (b) Relative displacement of point a and point b.
Buildings 13 00776 g006
Figure 7. Local model loading diagram.
Buildings 13 00776 g007
Figure 8. Bolt Stress Results: (a) Model stress nephogram under linear load; (b) Model displacement nephogram under seismic load; (c) Stress simulation diagram of UDHSB under linear load; (d) Stress simulation diagram of UDHSB under seismic load.
Buildings 13 00776 g008aBuildings 13 00776 g008b
Figure 9. Schematic diagram of the extracted bolt path.
Buildings 13 00776 g009
Figure 10. Stress and Displacement Line Chart along Bolt Path under Different Loads: (a) Fracture line diagram of UDHSB path stress under seismic load; (b) Line diagram of path displacement of UDHSB under seismic load.
Buildings 13 00776 g010
Figure 11. Simulated stress and displacement diagram of bolts with cracks. (a) M1-S; (b) M1-U; (c) M2-S; (d) M2-U; (e) M3-S; (f) M3-U; (g) M4-S; (h) M4-U; (i) M5-S; (j) M5-U; (k) M6-S; (l) M6-U; (m) M7-S; (n) M7-U.
Buildings 13 00776 g011
Figure 12. Distribution of stress S and displacement U of cracked bolt along path: (a) Path stress distribution of cracked bolt under seismic load; (b) Path displacement distribution of cracked bolt under seismic load.
Buildings 13 00776 g012
Figure 13. Curve of time and displacement.
Buildings 13 00776 g013
Figure 14. The bolt simulation stress S and displacement U of thread tooth deformation. (a) C1-S; (b) C1-U; (c) C2-S; (d) C2-U.
Buildings 13 00776 g014
Figure 15. Distribution of stress S and displacement U along the path of thread tooth deformed bolt: (a) Stress distribution diagram of C1 and C2 along the path under seismic load; (b) Displacement distribution diagram of C1 and C2 along the path under seismic load.
Buildings 13 00776 g015
Figure 16. Curve of time and displacement.
Buildings 13 00776 g016
Figure 17. Comparison of stress and displacement between DHSB and UDHSB: (a) Stress multiple comparison diagram; (b) Displacement multiple comparison diagram.
Buildings 13 00776 g017
Table 1. Working Condition of Crack Simulation.
ModelCrack LocationNumber of CracksCrack Depth (mm)Pitch (mm)Preload (kN)Friction
Coefficient
M11B112.5155 (M20)0.15
M22B112.5155 (M20)0.15
M33B112.5155 (M20)0.15
M44B112.5155 (M20)0.15
M52B, 3B212.5155 (M20)0.15
M62B, 3B and 4B312.5155 (M20)0.15
M72B132.5155 (M20)0.15
Table 2. Screw tooth deformation simulation table.
ModelScrew Tooth Damage TypeFriction CoefficientPitch (mm)Preload (kN)
C1Thread tooth grinding0.152.5155 (M20)
C2Screw tooth bending0.152.5155 (M20)
Disclaimer/Publisher’s Note: The statements, opinions and data contained in all publications are solely those of the individual author(s) and contributor(s) and not of MDPI and/or the editor(s). MDPI and/or the editor(s) disclaim responsibility for any injury to people or property resulting from any ideas, methods, instructions or products referred to in the content.

