Article

The Impact of Citizens’ Participation Level on Smart Sustainable Cities Outcomes: Evidence from Saudi Arabia

by
Abood Khaled Alamoudi
1,*,
Rotimi Boluwatife Abidoye
2 and
Terence Y. M. Lam
3
1
Department of Architecture, College of Architecture and Planning, Imam Abdulrahman bin Faisal University, Dammam 31451, Saudi Arabia
2
School of Built Environment, University of New South Wales, Kensington, Sydney, NSW 2052, Australia
3
Department of Architecture and Built Environment, Northumbria University, Newcastle NE1 8ST, UK
*
Author to whom correspondence should be addressed.
Buildings 2023, 13(2), 343; https://doi.org/10.3390/buildings13020343
Submission received: 22 December 2022 / Revised: 10 January 2023 / Accepted: 19 January 2023 / Published: 26 January 2023
(This article belongs to the Special Issue Advances in Sustainable and Smart Cities)

Abstract

:
It is imperative to expand the concept of smart cities beyond merely focusing on technology to include human, social, and environmental capital investing to develop smart sustainable cities (SSC). In recognition of smart cities’ advantages, several cities have adopted smart city labels. Although citizens’ engagement in public urban development and decision-making has been acknowledged globally in many countries, evaluating the outcomes that allow citizens to contribute does not measure and compare with other factors. This study examines the impact between the citizens’ participation level (CPL) and the smart sustainable cities outcome (SSCO). Four factors were extracted from the literature review and interviews were conducted with 12 decision and policymakers to establish the importance of these factors and to suggest any other additional factors. In addition, a questionnaire survey was utilised to assess and validate the result by experts in the field of the built environment. The mean score (MS) ranking was used to confirm the importance of these predicted correlations with SSCO. Endogeneity tests and multivariate regression analysis were adopted to validate the causality between CLP and SSCO. The results suggest that a positive significant correlation exists between the CPL and SSCO. A higher CPL leads to a higher level of SSCO, but this does not apply the other way around. The four significant factors of CPL to engage and empower citizens are accountability and responsibility, transparency, participation, and inclusion. This paper contributes to knowledge by identifying the measures of CPL and SSCO that can support the implementation of SSC by understanding what can be expected from the government and decision-makers and what can be expected from the citizens.

1. Introduction

The power of information communication technology (ICT) to support urban challenges and planning strategies is limitless [1]. However, understanding urban governance is a key to success or failure in transitioning towards smart sustainable cities (SSC) [2]. There are two types of urban governance: one characterised by centralisation, limited, or no public participation and private partnership “traditional government”, and the other one is characterised by decentralisation, public participation, partnerships, and consensus-building “modern governance” [3]. Additionally, governance and urban planning are interrelated and involve multiple stakeholders [4]. Almughairy [5] suggested that success in regional development relies on the coordination between the planning process, governance, and implementation. To successfully achieve urban sustainability, the link between urban planning and its governance must exist by involving all stakeholders [4]. Almughairy [5] believed that the successful collaboration between planning governance and implementation will lead to a prosperous future for any community which utilises the uniqueness of any region. Another scholar, Al-Hathloul [6], argued that the management system in Saudi Arabia is centralised at the national level and is restricted in its implementation at the local level.
According to Shaw, Sturzaker, Brodie, Sykes, Dembski, and Sahar [7], the idea of incorporating citizens’ participation (CP) into decision-making has generated much debate around the world. There is increased literature on the importance of having them participate in public decision-making [8,9]. Empowerment was highlighted by the international organisation for reducing poverty [10]. The role of CP was discussed widely, yet the evaluation of the outcomes that allow the contribution of empowerment to be measured and compared with other influences does not exist [11,12,13]. Empowerment is defined by Narayan [14] as participation, negotiating with, controlling, and holding accountable institutions that affect the lives of poor people, as well as the development of their assets and capabilities. For example, it has been found in the literature that countries which are empowering their citizens significantly performed better in urban projects than other countries that do otherwise [15,16,17]. Narayan [14] argued that understanding the effect of the relationship between CPL and SSCO could improve SSC projects.
In 2016, the Future Saudi Cities Program (FSCP) was introduced by the Minister of Municipal and Rural Affairs (MoMRA) in collaboration with the UN-Habitat to overcome the urban challenges in Saudi Arabia [18]. Saudi Arabia consists of 13 administrative regions, and FSCP will be applied initially in 17 cities across the country, which represent all the administrative regions. The selected cities are Riyadh, Makkah, Jeddah, Taief, Madian, Tabouk, Dammam, Al-Hassa, Qatif, Abha-Khami Msheet, Najran, Jizan, Haiel, Arar, Al-Baha, Buraidah, and Sakakah. The 17 cities chosen for this programme were based on the location, area, population size, economic opportunities, and achieving a balance in the territorial development between cities [19].
FSCP is a relatively new programme and it aims to reduce urban sprawl, promote spatially balanced urbanisation, and develop a decentralised planning framework for a sustainable urban city in Saudi Arabia. The business objectives of FSCP are a balance between quality of life, environmental protection, and economic competitiveness. The goal is to boost Saudi cities in terms of their productivity and equitability as well as socially and environmentally. The Urban Sustainability Theory supports sustainable urbanisation as seen in FSCP with focusses on three-primary areas as business objectives: ‘quality of life’, ‘economic competitiveness’, and ‘environmental protection’ [19]. Table 1 shows the areas described in UN-Habitat [19] as follows: social sustainability in terms of quality of life by promoting high-quality urban design to have prosperous cities that are productive, equitable, socially inclusive and environmentally sustainable, and with adequate and efficient infrastructure. Environmental protection refers to reducing urban sprawl, promoting spatially balanced development, and protecting the environment. Economic competitiveness involves generating better financing, a higher level of well-being, and better employment opportunities. Although the UN-Habitat in collaboration with government agencies have defined urban sustainability from a very narrow perspective, achieving urban sustainability in Saudi Arabia requires a holistic view to understand the phenomena and find the right solutions. The proposed objectives presented by UN-Habitat [19] leave CP regarding SSCO undiscussed, which creates gaps between ICT and CP as a promoter of urban sustainability and the involvement of citizens to contribute to this development as a stakeholder in urban development. These gaps need to be addressed and studied to achieve the goal of implementing this theory.
This study fills the gap by identifying CP measures and SSCO. In addition, it investigates the relationships and the correlation between CPL and SSCO. More specifically, we raise the research question of to what extent does CPL associate with SSCO within the context of Saudi Arabia? This study makes a significant contribution to the literature on SSC by identifying CPL and SSCO measures and examining the correlation between CPL and SSCO. The empirical implication is to support the decision makers with the most suitable measures to implement SSC in different cities and to understand the expectations of stakeholders. In other words, it aims to understand what the government and decision makers expect from the citizens and vice versa in achieving SSCO.
Five sections are presented in this paper. The first section presents an introduction to the current research problem in determining CPL to implement SSC in Saudi Arabia. The second section discusses the literature review on CPL regarding SSCO. The third section presents the research methodology adopted to address the research issues, while the result and discussions are presented in the fourth section. The last section concludes the paper by presenting the study’s findings, implications, limitations, and areas for further study.

2. Literature Review

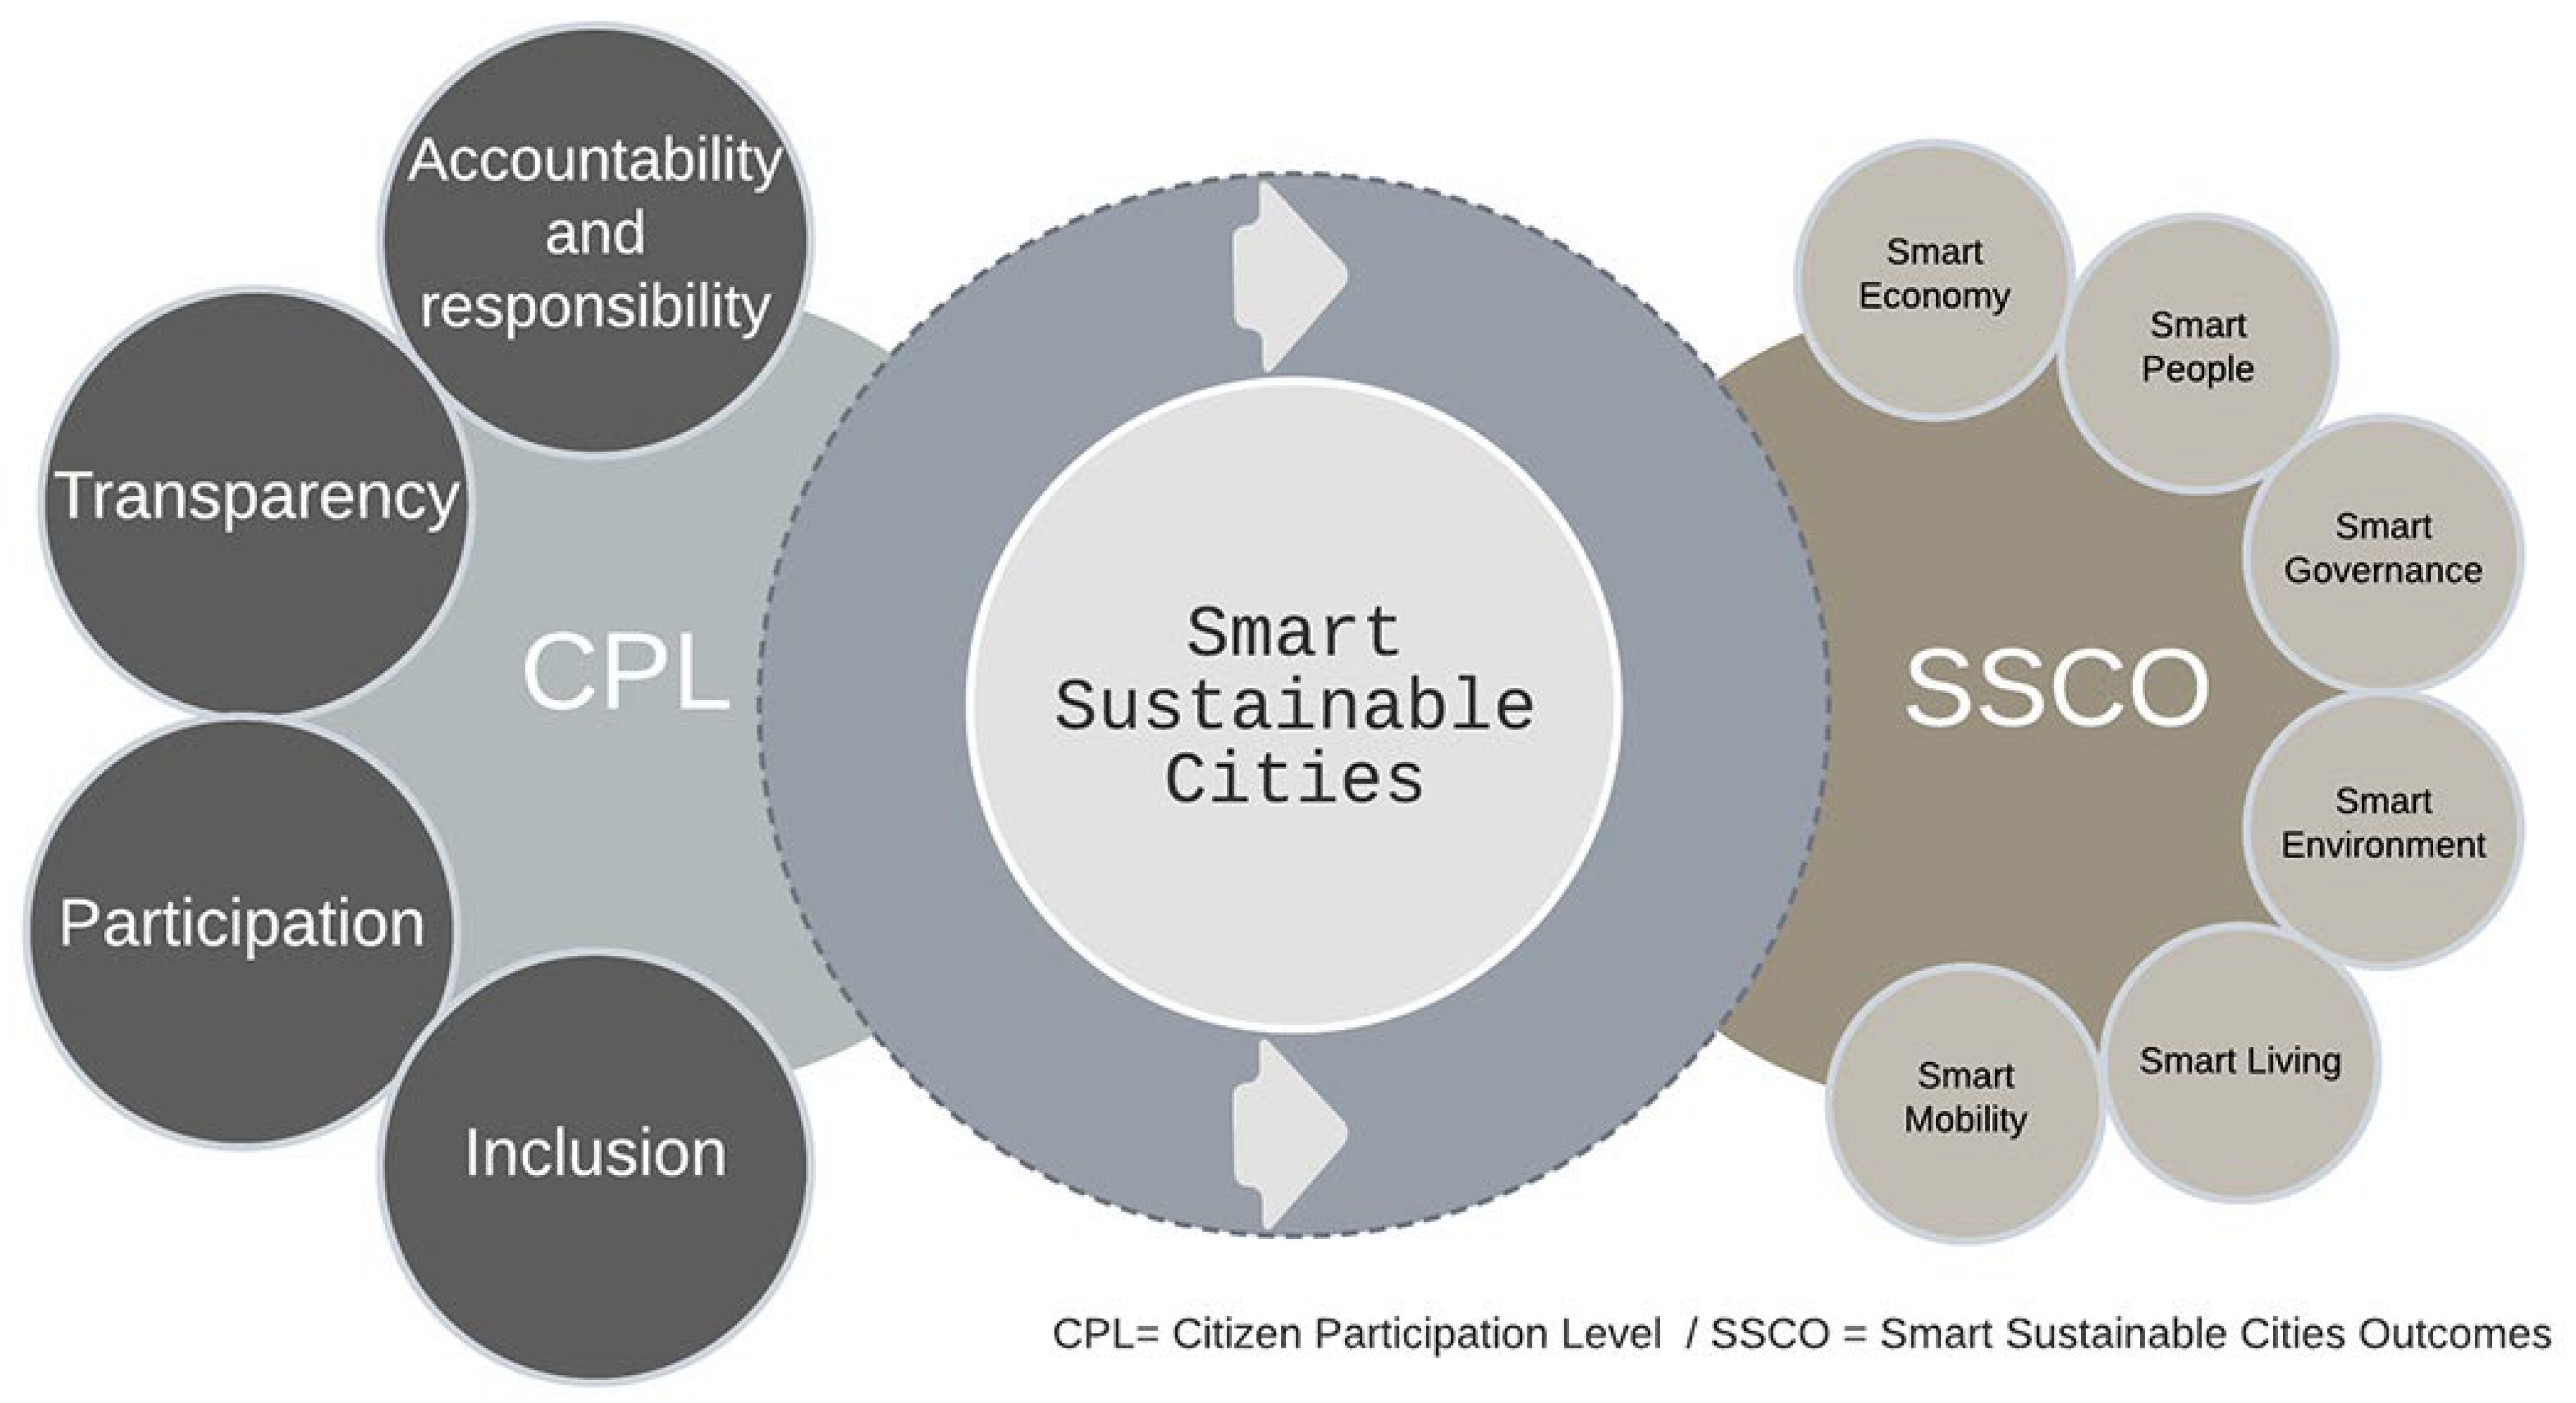
2.1. Citizens’ Participation Measures

Petesch, Smulovitz, and Walton [8] argued that there is no globally acceptable measure of CP. Civil society is sometimes defined as the space in society where collective citizen action takes place [21]. According to Narayan [14], promoting participation, increasing transparency, building capacity among poor groups, and strengthening accountability and socio-cultural aspects are mechanisms and indicators to measure public participation (see Table 2). Accountability and responsibility governing agents are more likely to be responsible for their conduct toward society in general which will monitor their behaviour and impose sanctions upon them. However, Knight, Chigudu, and Tandon [21] argued that an effective oversight requires openness to adopt rapidly changing orders. Public accountability ensures that officials are openly answerable for the decisions they are making on behalf of the public. The second way in which context needs to be considered in the measures of CP is transparency between stakeholders. According to Lee [22], when government agencies open their data to the public, it reduces the information gaps between the government and citizens, which enhances the level of participation. Third, the governance of participation consists of mechanisms of participation and dialogue that enable the public to have an input in the policy process, correct mistakes in a policy’s design and implementation, and promote social inclusion [8]. This will support women, youths, and minorities to have their input into government decisions which will protect policies and actions that harm their interests. The extreme opposite of participation is fear. According to Petesch, Smulovitz, and Walton [8], actions are frozen by fear. Lastly, the sociocultural factor is a major aspect in measuring CP, yet it is the most difficult aspect since there are no universal measures, such as freedom from domestic abuse. For instance, in a Muslim society such as Bangladesh, a woman’s movement beyond her home may be an indication of increasing freedom, whereas in Jamaica, women’s movements are not culturally restricted [8]. Paulussen, Heinonen, Domingo, and Quandt [23] claimed that citizens are more interested in social practices rather than political participation. Therefore, adopting the social-cultural aspects will be a major factor that changes CPL.
In addition, CPL can positively affect SSCO. According to Lim, Malek, Hussain, and Tahir [24], CP is the engine for smart cities for three reasons: 1—citizens are the source of data that decision makers need to support their decision; 2—they are the beneficiaries who appreciate the outcomes of smart cities; and 3—they are responsible, hence, their contributions will be genuine. Researchers such as Batty, Axhausen, Giannotti, Pozdnoukhov, Bazzani, Wachowicz, Ouzounis and Portugali [25], Harrison and Donnelly [26], Lazaroiu and Roscia [27], and Odendaal [28] argued that many studies on smart cities have deeply focused on technology part and did not emphasise the important roles of CP. Willems et al. (2017) applied Arnstein’s model to 26 smart London projects which focused on the primary stakeholders (direct or indirect involvement) and their various types of engagement. The result shows that placation will indirectly allow CP to occur to a great extent in smart city project, while manipulation, therapy, consultation, and the informing levels are more directly focused on the individual citizen. Castelnovo, Misuraca, and Savoldelli [29] also applied Arnstein’s ladder to examine the basis for the discussion of the importance of CP in the initiatives of smart cities; it showed an increase in the correlation between the levels of CP and the improvement of the smart cities’ outcomes. Cardullo and Kitchin [30] argued that any smart city initiatives which are technological-centric instead of citizen-centric emerge with difficulty in engaging citizens in the development of smart cities. They outlined four active roles of CP in any smart sustainable city initiatives, which are (1) the proposer (to report or advise), (2) the co-creator (to negotiate or produce), (3) the decision-maker (to decide), and (4) the leader (to create).

2.2. Smart Sustainable Cities Outcomes

In the last two decades, cities have embraced the smart city concept as a solution for their urban challenges [31]. However, a large variety of smart city definitions do not reflect their relationship with sustainability [32]. There are too many definitions and conceptualisations in the literature that separate a smart city’s aspects, drivers, and characters from urban sustainability due to the nature of the discipline, poor conceptualisations, and/or the infancy of the concept [33]. The smart cities concept is still vague and inadequate. Therefore, there is a need to better understand the relationship and the interconnection between smart and sustainability concepts [34]. As shown in Table 3, the majority of the theoretical and practical contradictions were from a technological background, yet the smart city concept has no unified definition [32,33,35,36,37]. Its definition, character, and dimension depend on the background of the scholar and how it is employed accordingly [33,38]. The concept of SSC was recently introduced to the academic discourse as an attempt to promote urban sustainability through smart cities concept, yet the empirical work in this area is still in the nascent stage [31]. Previous studies have indicated that three major domains are used to identify the scope of SSCO. In addition, each of these domains consists of a set of indicators and sub-indicators that are used to measure those domains. On the other hand, six major domains determine the scope of smart cities, which are Smart Economics, Smart Environment, Smart Governance, Smart People, Smart Living, and Smart Mobility (see Table 3) [39]. This study has examined three sets of measures for SSCO. First are the primary areas of urban sustainability proposed by FSCP (see Table 1). Second, the urban indicators are utilised by FSCP. Last, a literature review was undertaken to assess for measuring urban sustainability (Table 3). This study will focus on Table 3 as a basis for summarising the measures of SSCO.

2.3. Objectives and Hypotheses

This study establishes hypotheses to test for each of these objectives. The ultimate aim of the research is to examine the impact of CPL on SSCO. Within the context of this aim, the present research has two objectives. The first objective is to identify CPL and SSCO measures, and the second objective is to investigate the causality between CPL and SSCO.
In line with the aims of the study and the content of the literature on this topic, the first objective has a single hypothesis associated with this study:
H1: 
The CPL and SSCO measures have a significant correlation.
The second objective has two hypotheses associated with this study:
H2.1: 
A higher CPL leads to higher SSCOs.
H2.2: 
A lower CPL could lead to lower SSCOs.
The new knowledge developed by testing these two hypotheses by regression analysis will determine the relationships between CPL and SSCO. Such relationships will be explained by the literature findings to establish the causality, which will provide a novel contribution to the theoretical body of knowledge in this field (Figure 1).

3. Research Methodology

Mixed methods research was adopted to support the investigation of SSCO and its relationship with CPL. As suggested by Creswell [43], a mixture of quantitative and qualitative approaches will provide more promising outcomes and a better understanding of the research problem. This study combines a comprehensive literature review, a structured online questionnaire, and a semi-structured interview to examine the correlation between CPL and SSCO. A variety of search engines, including Scopus, Google Scholar, Elsevier, and the University of New South Wales Library, were used to extract the performance predictors and performance outcomes from the literature. A semi-structured interview was developed and used to capture the views and perspectives of decision makers involved in different phases of the implementation of FSCP. It also creates opportunities to discuss relevant issues from the stakeholders’ point of view [44]. The goal of the interview was to identify SSCO and investigate the relationship with CPL within the context of Saudi Arabia. Moreover, this study adopted an online questionnaire survey to collect the opinions of stakeholders of FSCP from professionals (urban planners, architectural designers, and real estate developers), government representatives (FSCP officers from MOMRA UN-habitat and policymakers), and academics. The analytical techniques adopted include a content analysis, mean score ranking (MS), and regression analysis which were employed to generalise the relationship to fulfil the aim of this study.

3.1. Data Collection for Interview

The interview questions were structured into three sections. The selection criteria of the interviewees were based on the participant’s contribution and involvement in any phase in the development of smart cities and FSCP. The interviewees were classified into three groups: (A) professionals working on FSCP project, (B) policymakers, and (C) professionals in the commercial industry (see Table 4). Each group had at least three participants. For planners and policymakers, they must be at least of a senior level to understand the (high-level) point of view and how decisions are being made. Industry participants must have a background in the implementation of a smart city. The rationale for the three groups is to ensure there are people of different backgrounds, knowledge, and expertise who understand smart city development and their willingness to involve the citizens in urban development. Each participant has been given a code for anonymity and the participants’ privacy protection.
Table 5 shows preliminary themes that highlight the systematic procedures through which the generated qualitative data were analysed and subsequently present the key findings/themes extracted as part of this study.
Step 1: a total of 12 respondents were surveyed and consequently their information was gathered on the overview of a smart city, CP, the factors influencing the adoption of smart cities, and stakeholder management measures that affect CPL. Step 2: the qualitative data collected through the interviews were imported into and coded using ATLAS ti qualitative analysis software; similar and related quotations were categorized in a code and the codes were further categorized into group codes. Step 3: the codebook and the interview transcripts were analysed to capture the themes relevant to this study. The theme’s similitude to the code group serves as the main concepts that contain similar codes and related ideas/quotations. Step 4: regarding each theme, a thematic analysis was conducted to examine some pieces of information on the sustainability of SSCO, government-oriented programmes, and citizens’ empowerment through technology to improve the adoption of a smart city in the context of Saudi Arabia. Therefore, three themes were identified: (1) the adoption of smart city projects among the citizens, (2) the measures/drivers of CPL, and (3) the relationship between CPL and SSCO. These themes serve as the main concepts that contain similar codes and they are represented in Table 5.

3.2. Data Collection for Questionnaire

An online questionnaire survey was conducted to establish a robust point of view of the stakeholders [45]. It also helps to identify the SSCO and investigate their relationships with CPL within the context of Saudi Arabia [46]. A mixture of local professionals and academic participants in Saudi Arabia eliminates any misunderstanding, lack of knowledge, and a lack of observational evidence [47]. Therefore, this study was conducted by using the online questionnaire to collect the opinions of the stakeholders of FSCP, from professionals (urban planners, architectural designers, and real estate developers), governments representatives (FSCP officers from MOMRA UN-habitat and policymakers), and academics. A five-point Likert scale was utilised to assess the importance of the selected performance predictors and the performance outcomes [48].
The questionnaire was divided into three sections as follows: the first section was designed to obtain the background of the expert participants. The second section presented the important variables for CPL and SSCO. The third section was designed to elicit the respondents’ opinions, comments, and feedback on the proposed list of variables shown in Table 1, Table 2 and Table 3. Section 2 and Section 3 utilised a five-point Likert scale for the ranking of the importance of each indicator and the sub-indicators [48]. The participants were asked to choose from one of the five options which represent “Least Important (1)”, “Fairly Important”, “Important”, “Very Important”, and “Extremely Important (5)”, respectively [49].
Expert sampling was adopted to determine the population size [50,51]. However, Yager, Kunkle, Fochtmann, Reid, Plovnick, Nininger, Silverman, and Vergare [52] pointed out that the word “Expert” does not always mean being skilled in the field; as a result, it can be interpreted in many ways. The targeted participants must meet the selection criteria. First, the nominated participants must have at least 10 years of cognitive experience in urban development and at least three years of experience in smart cities. Second, those who represent FSCP must be involved directly in FSCP in the implementation process and in a senior position or above. Third, the participants from academia must have a PhD in urban planning or any related discipline. Fourth, the participants from the industry must be involved in urban planning or smart city implementation. To determine the sample size, the number of predicted variables must be determined first [53]. For social science studies, it is recommended by Stevens [54] that for each variable, about 15 participants are needed. Coakes and Steed [55] suggested that a total of 15 participants per predictor variable is valid. Based on the selection criteria mentioned earlier, a total of 265 responses were collected; however, 245 valid responses were received and analysed. The duration of the data collection was three months, and three reminders were sent to the participants to complete the survey. The participants were reached via the Saudi Council of Engineers (SCE), the employers’ webpage, and LinkedIn, which contains their position, experiences, and their involvement in the industry.
As presented in Table 6, the statistics for the demographic variable show the frequency and percentage distribution of the demographic variables contained in the survey. The majority of the participants are male (n = 201, 82.0%), 43 (17.6%) of them are female, while 0.4 people indicated another gender. According to [56], most urban professions in Saudi Arabia are dominated by males, which explains why the female representation is low. Limited access, a lack of awareness, and cultural and social barriers discourage women from participating in urban design communities and prevent people from knowing how to embrace and empower women in executive positions. Previous studies provide evidence regarding the low representation of female professionals in Saudi Arabia [57,58]. This limitation will be addressed by a future study when the gender diversity becomes more evenly distributed. Ninety-six (39.2%) of the participants were between the ages of 40 and 49, 75 (30.6%) were between 30 and 39 years, 63 (25.7%) were age 50 years and above, while 11 (4.3%) were aged between 18 and 29 years. Close to half of the participants have a bachelor’s degree (n = 117, 47.18%), 108 (44.1%) are postgraduate holders, 14 (5.7%) have other levels of education, and 6 (2.4%) have a diploma. Hence, out of 108 participants, 67 hold a PhD degree. Thus, the participants are well educated, which helps to achieve the aim of this study. It is crucial to capture the point of view of experts who have more experience than young people. About 108 (44.1%) of the participants stated in urban planning as their field of profession, 42 (17.1%) indicated management as their field of profession, and 39 (15.9%) indicated IT and architecture, respectively, as their profession. Eleven (4.3%) participants indicated other professions, while 11 (4.5%) indicated civil engineering as their profession. The variety of the disciplines of the participants will enrich the output of this study. About 138 (56.3%) of the participants work in the public sector, including 41 (30%) who are involved in the FSCP, 78 (31.8%) work in the private sector, 26 (10.6%) work in the academic sector, and 3 (1.2%) are freelancers. It is worth mentioning that all participants from the academic sector hold PhD degrees. When it comes to regulation and collaboration, it is important to obtain the higher voice of the public sector. In terms of work experience, 118 (48.2%) have relevant experience in architecture, urban planning, management, engineering, or ICT for a period of between 15 and 20 years, 55 (22.4%) have 20 and above years of experience, 48 (19.6%) have 10 to 15 years of experience, 15 (6.1%) have between 5 and 10 years of experience, while 9 (3.5%) have between 0 and 5 years of experience. In this sense, participants with more experience are more likely to be considered for their efficiency, uniqueness, and legitimacy.

3.3. Data Analysis Techniques

To determine whether there is a relationship between the categorical variables, MS ranking and regression analysis were adopted to analyse the collected data. However, the content focused on the investigation of the correlation between CPL and SSCO. The Statistical Package for the Social Sciences version 26.0 software (SPSS) was utilised to examine any relationships in terms of a ranking or grouping that arose from the collected data.
The MS technique was used to evaluate the importance of the set of independent and dependent variables [59]. The collected data were analysed to examine the relationship between CPL and SSCO. MS is extensively used in built environment studies to evaluate the importance of a set of variables [60,61,62]. Equation (1) was utilised to calculate MS ranking [61]. SPSS software was used to analyse any cross-tabulations, relationships, or groupings that exist in the collected data.
M = s n
where M represents the mean score for each predictor (CPL), s is the participants’ score based on a Likert scale from one to five, and n is the total number of participants.
Regression analysis is a powerful statistical approach to examine the relationship between two or more variables (dependent and independent) of interest [63]. It is one of the techniques commonly used in the academic field which builds upon outcome variables by predicting values [49]. If the variables are single, that is simple regression analysis, but if more variables are involved, that is referred to as multiple regression analysis. Osei-Kyei and Chan [64] provided an equation for multiple regression analysis which is presented in Equation (2).
Y p = α + β 1 X i + β 2 X i i + + β k X k + ϵ i
where α is the intercept/constant, β 1 , β 2 ,…., β k are the regression coefficients, X i X i i ,…., X k are the predictors (CPL), ϵ i represents the predictive error or residual, X i X i i ,…., X k are the predictors, and Y p is the dependent variable (SSCO).
Some basic assumptions must be met to ascertain the adequacy and fitness of the predictive model. The technique was used to regress each performance outcome of CPL against the influencing factors (accountability and responsibility, transparency, participation, and social inclusion). The relationship between the performance outcome and the influencing factors was validated and in this hierarchical regression model, each block’s relative contribution to the performance was identified as well as significant performance predictors. In this study, the normality test and heteroscedasticity test were conducted, where the former test is an important test to measure the distribution among the variables, and the latter test reveals the error of any normality test.

3.4. Data Reliability

Cronbach’s alpha value ranges between 0 and 1.0. When Cronbach’s alpha is greater than 0.7, the participants’ opinions about the influence of criteria on each other are said to be highly consistent [65]. A scale with Cronbach’s alpha coefficient greater than 0.5 is considered to be reliable [66]. All of the variables have a higher reliability value, indicating that they all are reliable in measuring the CP measure and indicators of SSCO. Table 7 shows the average response regarding the citizens’ participation measures. On average, the respondents were neutral about the following variables: accountability and responsibility (M = 2.62, SD = 0.54), transparency (M = 2.83, SD = 0.67), and inclusion (M = 2.58, SD = 0.79), while the respondents, on average, indicated that the variable ‘participation’ was important (M = 2.39, SD = 0.74).
In addition, Table 7 shows the average response regarding the indicators of SSC. On average, the respondents indicated that the following variables were extremely important: smart economy (M = 4.52, SD = 1.02), smart environment (M = 4.57, SD = 1.03), smart governance (M = 4.54, SD = 1.06), smart living (M = 4.49, SD = 1.06), and smart mobility (M = 4.58, SD = 1.04), while the respondents, on average, indicated the variable ‘smart people’ was important (M = 4.56, SD = 1.03).
Table 8. Ranking of Performance Predictors.
Mean ScoreSD *Rank
Accountability and responsibility
Improving existing services3.95130.880571
Analysing the level of satisfaction with service3.47351.120202
Priority of city’s projects2.19910.923863
Improving policy development2.13720.823944
Developing urban planning2.00440.708665
Budgeting and implementation1.95580.722836
Transparency
Citizens can request public information from authorities3.48230.989791
Citizens can request sensitive information from authorities3.48011.012242
Ongoing monitoring projects3.47351.112243
Authorities specify the response to shared information2.63721.162854
Making demands to enforce legal standards1.73010.967325
Participation
Achieving better customer satisfaction levels3.09291.304781
Access and receive information that is easily understood and useful to users2.64161.185032
Identify what citizens want and what they can offer2.16811.102753
Fostering citizen influence in decision making1.66370.948554
Inclusion
Improving the image of the local government3.49561.144061
Informing citizens about what is going on in the local government2.69911.264102
Holding demonstrations to protest against poor service quality2.24781.487913
Complying with legal requirements1.85841.023004
* Standard deviation.

4. Results and Discussion

This study presents the results of the qualitative and quantitative data collected from interviews and questionnaires, selected through convenience and expert sampling, in which each participant reported data and an understanding of SSC and the different factors that affects CPL among the citizens. The study examines the correlation between CPL and SSCO to improve the adoption of SSC in the context of Saudi Arabia. The data were collected according to the emerging context and subsequently classified under different themes. Twelve interviews were conducted using a template with 10 questions.

4.1. Theme 1: Adoption of Smart City Project among Citizens

SSC are regarded as being all-inclusive and a process which is carried out to improve the general quality of life and welfare of the people. It also involves the employment of modern technologies to better the various sectors of the cities and ensure proper delegations in adopting SSC projects among the citizens. It is imperative to consider not only the projects to be adopted but also how these projects can achieve a better standard of living among the citizens. According to the interviewees I-A-4 and 1-B-2, one of the best ways to adopt an SSC project among the citizens is to consider or learn from similar countries what projects have been carried out and how these projects have positively impacted the lives of the citizens. Further, a consistent data collection will help to identify the needs and wants of the citizens and ensure that the right projects are adopted. For instance, interviewee I-C-2 emphasizes the need to leverage the power of using data, which will go a long way in ensuring an active rule. Moreover, interviewee 1-A-1 stated that adopting SSC is very important, but there is a need to ensure a proper evaluation of the proposed smart projects and consider how long the projects will last, given the prevailing rates of social, economic, and cultural benefits. This will assist in enlightening the citizens and other stakeholders on the necessary precautions to take in adopting a smart city and focus attention on possible and promising projects that will improve the well-being of the people and, as well, can be sustained for long periods [67]. In addition to the all-inclusiveness of the SSC projects, there is a need to keep the citizens informed concerning the adoption of SSC projects. An informed state will ensure the proper monitoring and implementation of adopted projects and also ensure that some rules guide the behaviour of citizens in the cities, as noted by respondent I-B-3.

4.2. Theme 2: The Drivers of CPL and SSCO

One of the major ways of implementing SSC is by adopting the drivers that influence CPL and SSCO. According to I-A-1, improving the existing services and analysing the level of satisfaction with a service supports the predictors of accountability and responsibility, which allows for citizens to take part in the adoption and implementation process, as stated by I-A-3 and I-A-2. City projects and improving policy development should be a priority. This is because the citizens are the beneficiaries, and the effects of these projects are evident through their living standards [68]. Additionally, citizens can request public information from the authorities, citizens can request sensitive information from the authorities, as well as information regarding ongoing monitoring projects, authorities specify the response to the shared information, and citizens can make demands to enforce legal standards; all of these are drivers that contribute to the predictor’s transparency, which was suggested by the interviewees I-A-2, I-A-3, I-B-2, and I-B-3. Transparency is seen as another important predictor by the stakeholders to achieve their interests, especially for political reasons. One of the respondents I-B-2 stated that a smart city whose aim is to become one of the most developed cities in the world will have the full participation of its citizenry. Therefore, the proper communication of goals and the provision of adequate information by the stakeholders will go far in influencing the CPL. Interviewee I-C-1 claimed not to have enough information about the smart city projects, which obviously could influence CPL. Moreover, it is imperative to consider the participation of these citizens in the projects. According to interviewee I-C-1, evidence from the data has shown that the decisions taken by stakeholders invariably affect CPL. When the citizens feel that the stakeholder’s measures are majorly for the government’s interests and not to foster development and improve citizens’ quality of life, they tend to withdraw themselves from participating, thereby reducing CPL. As stated by interviewee I-C-3, achieving better customer satisfaction levels, and accessing and receiving information that is easily understood and useful to users, are factors that support the predictor of participation. Another interviewee believed that identifying what citizens want and what they can offer is an important driver for participation; similarly, interviewee I-B-3 believed that fostering citizens’ influence in decision-making is an important driver for participation. Lastly, improving the image of the local government, informing citizens about what is going on in the local government, holding demonstrations to protest against a poor service quality, and complying with legal requirements are drivers proposed by the interviewees I-A-1, I-C-1, and I-C-3. The zeal to develop the city a citizen belongs to can serve as a motivational factor to improve the city, thereby boosting the participation level. This measure has proven to be significant as one of the respondents, interviewee I-C-2, mentioned that high competition would occur when the cities are developed for attractions.
In addition, the drivers for the SSCO are smart economics, smart environment, smart governance, smart people, smart living, and smart mobility [39]. A lack of opportunities for citizens to be a part of the decision-making process can influence their participation level. When citizens are left out of the decision-making process, the decision is most likely not all-inclusive, the decisions might not consider the citizens, and/or the adoptive projects might not be beneficial.

4.3. Theme 3: Causal Relationship between CPL and SSCO

SSC are achievable with the continuous and active participation of the citizens through the adoption and implementation of smart projects [69]. A good way to ensure successful SSC is by involving citizens’ inclusiveness in the decision-making process, which tends to provide room for a swift response to evolving problems. I-A-3 stated that the role of CP in SSC cannot be overlooked as they happen to be major users of these infrastructure. A major observation in regard to SSC is that stakeholders (government entities) are very unlikely to achieve SSC without active CP. This implies that stakeholder managements need to ensure that CPL is high, at least to an extent, for them to obtain the desired SSCO. It was observed from the dataset that citizens are major contributors as well as users of SSC. They form the basis on which SSC are achieved. For instance, one of the respondents, interviewee I-B-1, explained the role citizens play in attaining SSC. Aside from being major contributors and users of SSC, citizens are invariably the best set of people to receive ideas and opinions from. This is because they know what type of project is likely to improve living standards; they also know how well these projects can be implemented by carrying along the members of the public, as stated by I-A-3. Therefore, the decision-making process as regarding SSC needs to incorporate the citizens and stakeholder management to achieve a desirable city.
Furthermore, an observed relationship between CPL and SSCO is the indispensability of human factors in the development process. This means that in the adoption and implementation of SSC projects, the human factor will always be involved one way or the other (interviewee I-B-2). The invention of technologies will still require the use of human elements either in the execution of the projects or in benefiting from the projects. Therefore, human participation at various stages of the developmental process cannot be dispensed. It is very crucial to point out the fact that not all members of a society can be involved in the decision-making process regarding SSC. This will sabotage the goals and aims of the intended projects. In place, a representative involving experts can be formed and made to participate in the decision-making process alongside the stakeholder management, as suggested by interviewee I-B-3. CPL regarding SSCO can be affected by various factors to which socio-cultural factors belong to. interviewee I-A-1 stated that a smart project that is aimed at promoting the culture and tradition of the people would have a higher rate of CP than the ones that discourage or even eradicate the culture. This is because people tend to have an interest in what promotes their culture, particularly older people. Interviewee I-C-3 noted that smart projects that promote culture would bring about the social sustainability of the culture as well as the projects too. According to Malek, Lim, and Yigitcanlar [70], inclusion analyses clarifies the shortcomings and contradictions of a citizen-centric initiative, which leads to fulfilling the SSC implementation.
Gohari, Baer, Nielsen, Gilcher, and Situmorang [71] envisioned citizens as learners who can attain an education and develop their behaviour, aligning with sustainable development. Encouraging CP in providing their feedback for sustainable development will prove to be instrumental in learning those behaviours and obtaining awareness. It will give them the choice to adopt a smart lifestyle and enhance their standard of living by adopting technologies. However, all planning is carried out by professionals and the citizens’ opportunity to configure their choice is reduced. The citizens do not have the freedom to express their opinions in regulations and urban planning; they are steered by the authority to provide an opinion [72]. Therefore, including citizens in the decision-making process in a true sense will enhance the implementation of the ICT and will truly contribute to the process [69].
Causal analysis is used to determine the magnitude of the relation between two factors in the sense of a causal effect [73]. One of the most frequent ways to conduct causal analysis using primary data is through experiments. First, there is a temporal sequence (TS), where the consequence cannot occur before the cause [74,75]. Second, there is a nonspurious association (NA), where the correlation between the causal relationship and the covariation must be real and not the result of an unaccounted for or intervening variable [76,77]. Third, there is a concomitant variation (CV), where two variables must be systematic in order for them to change or occur simultaneously [78,79]. The main difference between causal relationships and correlation relationships is that it is important to understand that a correlation does not imply causation, even though causality and correlation might coexist. While causality also requires a particular form of relationship, known as a cause-and-effect relationship, correlation solely denotes the presence of a statistical association or pattern between two variables [80]. This indicates that altering one variable will result in altering the other. We have two principal reasons: (1) a directionality problem: although there may be a cause-and-effect relationship between two variables occasionally, it is often impossible to identify which variable is the cause (predictor variable) and which is the consequence (performance outcomes variable) [81]. (2) The existence of a confounding factor: a third variable known as a confounding variable influences both of the other variables, providing the impression that they are causally related even when they are not. Instead of being the result of a cause-and-effect relationship, the statistical association in this situation is caused by the third variable [82,83]. A significant correlation between CPL and SSCO does imply that a higher CPL leads to a higher level of SSCO. To test the endogeneity, we have used the Pearson correlation method to determine the correlation between the different factors.

4.4. Validating the Correlation between CPL and SSCO

Table 8 shows that the variable improving existing services is ranked as the highest variable that affects the performance predictor of accountability and responsibility, with an MS value of 3.951. In addition, analysing the level of satisfaction with a service and the priority of a city’s projects are ranked as second and third, respectively. Moreover, the variable citizens can request public information from authorities, and citizens can request sensitive information from authorities, which explains why the performance predictor transparency has MS values of 3.482 and 3.480, respectively. In addition, achieving better customer satisfaction levels is ranked as the highest variable, which explains why the performance predictor participation has an MS value of 3.092. Lastly, improving the image of the local government has an MS value of 3.495, while complying with legal requirements has an MS value of 1.858, and it is ranked as the lowest variable, which explains the performance predictor inclusion.
To test the research hypothesis, which is that CPL has a positive association with SSCO, regression analysis is utilised. Before conducting the regression analysis, it is important to conduct the residual analysis to examine the normality and heteroscedasticity of the collected data. As suggested by Steger, Mair, Kofler, Pittore, Zebisch, and Schneiderbauer [84], the observed unstandardised residuals are normally distributed and accepted where minor deviations from normality are not a cause or effect. Table 9 shows the bivariate correlation value between SSCO and CPL. These preliminary results show that there exists a strong significant positive correlation between SSCO and accountability and responsibility (r = 0.690), transparency (r = 0.856), participation (r = 0.909), and a significant moderate positive correlation between CPL and inclusion (r = 0.490).
A multiple regression analysis was conducted to predict SSCO from CPL. Table 10, Table 11, Table 12, Table 13, Table 14 and Table 15 has confirmed the six-performance outcomes and regressed against the performance predictors. As shown in Table 10, Table 11, Table 12, Table 13, Table 14 and Table 15, which also show the results of the multiple hierarchical regression analysis. As recommended by Ahadzie, Proverbs and Olomolaiye [85], and Lam [86], Adj. R2 >0.5 is considered as a moderate and acceptable effect size, where all the predictors exceeded the target The following presents the result form the analysis shown in Table 10, Table 11, Table 12, Table 13, Table 14 and Table 15. The regression equation is summarised in Equation (3) as follows:
Y p = α + β 1 X i + β 2 X i i + + β k X k + ϵ i
where α is the intercept/constant, β 1 , β 2 ,…., β k are the regression coefficients, X i X i i ,…., X k are the predictors (CPL), ϵ i represents the predictive error or residual, X i X i i ,…., X k are the predictors, and Y p is the dependent variable (SSCO).
  • Table 10 shows that smart economy was predicted by all of the four CPLs F(13.526) = 1.868, R2 = 0.647, Adj. R2 = 0.615.
  • Table 11 shows that smart people was predicted by all of the four CPLs F(12.672) = 1.868, R2 = 0.717, Adj. R2 = 0.685.
  • Table 12 shows that smart governance was predicted by all of the four CPLs F(13.583) = 1.868, R2 = 0.817, Adj. R2 = 0.705.
  • Table 13 shows that smart mobility was predicted by all of the four CPLs F(13.349) = 1.868, R2 = 0.644, Adj. R2 = 0.545.
  • Table 14 shows that smart environment was predicted by all of the four CPLs F(14.073) = 1.868, R2 = 0.796, Adj. R2 = 0.71.
  • Table 15 shows that smart living was predicted by all of the four CPLs F(14.011) = 1.868, R2 = 0.760, Adj. R2 = 0.660.
  • All these Adj R2 values are above 0.5, indicating a significant correlation between each SCCO and the CPL.

4.5. Endogeneity Testing of the Effect of SSCO on CLP

Table 10, Table 11, Table 12, Table 13, Table 14 and Table 15 show the evidence that SSCO is statistically highly correlated to CPL predictors, including accountability and responsibility, transparency, inclusion, and participation. To demonstrate that there was no other way around these relationships, an endogeneity test was conducted to show that CPL (all four components were combined as one dependent variable) was not affected by the six SSCO variables in the first place. The regression analysis results of this test are given in Table 16 and summarised as follows:
  • The CLP predicted by the six SSCO variables F= (−1.435), R2 = 0.24, Adj. R2 = 0.29.
The regression test showed that the adjusted R2 for CPL is 0.29. Although the CPL is significantly correlated with SSCO, the results infer that there is no significant causal relationship between SSCO and CPL, so the relationship does not apply the other way around. This suggests that SSCO does not lead to a higher CPL.

4.6. Multivariate Regression Analysis between CPL and SSCO

In simple linear regression analysis, we have only one response variable, called the univariate response variable [87]. In univariate regression analysis, we have only one response variable and one or more predictors in the model, but the nature of the predictors should be the ratio, interval, and ordinal, nominal scale type, respectively [88]. Although, in some situations, we have more than one response variable which will be predicted by the same predictors using regression models [89,90]. Then, we will move to multivariate regression analysis.
Modelling multiple outputs, or dependent variables, with a single set of predictor variables is known as multivariate multiple regression. For instance, we would want to simulate the relationship between gender, colour, parent income, and other factors and the SAT math and reading results. Table 10, Table 11, Table 12, Table 13, Table 14 and Table 15 present the results of individual regressions for each dependent variable, while Table 17 shows the results of the multivariate regression analysis. The performance outcomes were combined as one dependent variable which was regressed against the predictors. The four predictors are accountability and responsibility, transparency, participation, and inclusion, respectively (Table 17). This study has six performance outcomes which are smart economy, smart people, smart governance, smart mobility, smart environment, and smart living. These six performance outcomes were combined as one dependent variable of the SSCO. Therefore, the multivariate regression analysis is the most suitable test [90,91]. The following Equation (4) represents the multivariate regression model [87].
Y = X β + ϵ
where Y is the matrix of the dependent variable (CPL), X is the predictors (SSCO), ϵ is the predictive error or residual, and β is the matrix of the regression parameters.
The regression analysis test shows that adjusted R2 for SSCO regressed against CPL variables is 0.71. This suggests that the overall level of SSCO is significantly correlated with all CPL predictors. Thus, the causal relationship between CPL and SSCO is confirmed and an increase in CPL leads to a higher level of the SSCO.

4.7. Accountability and Responsibility

The predictor accountability and responsibility is one of the CPLs that contributes to SSCO. Jaakson [92] argued that a health authority requires its members, which include CP, to be accountable and reasonable in decision-making. This study shows that accountability and responsibility have a significant positive impact on all the performance outcomes, as shown in Table 10, Table 11, Table 12, Table 13, Table 14 and Table 15. The analysis shows a positive correlation with p-values of <0.05 (between 0.001 and 0.023) against most of the CPL. This confirms that accountability and responsibility are significantly important to achieve SSC. This is consistent with the argument of interviewee I-A-2 “I believe that people, the community we live in, and most cities have adopted new technologies, having smart houses, a sustainable building is a demand. So, people, I think they will accept this concept. They will participate, and they will be part of it.” McGrath and Whitty [93] urged that the definition between accountability and responsibility could cause some misunderstanding in efficiency and effectiveness in undertaking decisions. As suggested by interviewees I-A-1, I-C2, and I-C-3, to measure accountability and responsibility, the following factors need to be taken into consideration: the level of satisfaction with a service, the priority of a city’s projects, improving policy development, developing urban planning, and budgeting and implementation.

4.8. Transparency

The transparency predictor was found to be a significant predictor of the SSCO. According to Zaazou [94], transparency is an important pillar that builds trust between citizens and authority. However, the disclosure of information from the government increases CPL. For instance, the interviewee I-C-2 emphasizes the need to leverage the power of using data which will go a long way in ensuring active governance: “It can make it possible if we as a population have the power of using these data, share, and analyse them. Competently, at this stage in all over the city the rule of it will be active”. On the other hand, interviewee I-B-2 claimed not to have enough information about the smart city projects, which obviously could influence CPL: “but in fact, I did not have enough information about it to benefit you. Surely, this programme is about dealing with 17 various cities in Saudi Arabia and the goal behind this is to achieve the three levels in each city in our kingdom. The first level is the quality of life, the second is the solid economy, and the third is environment maintenance”. Another Interviewee, I-C-1, mentioned that: “I have heard about this, but I did not have any details about this subject so I can interact towards this issue”. Table 10, Table 11, Table 12, Table 13, Table 14 and Table 15 show that transparency has p-values of <0.05 (between 0.0005 and 0.042). Therefore, the performance outcomes are significantly correlated to the predictor of transparency.

4.9. Participation

Participation means engaging in decision-making along with authorities. Arnstein [95] categorised CP into eight levels, from manipulation to citizen power, where the former represents the lowest level of CP and the latter represents the highest level of CP [72]. The predictor participation was tested and was found to be a significant positive predictor, as shown in Table 10, Table 11, Table 12, Table 13, Table 14, Table 15 and Table 17. The analysis shows a significant positive correlation with p-values of <0.05 (between 0.0005 and 0.039). In other words, the predictor participation supports CPL. According to Fitzgerald, McCarthy, Carton, Connor, Lynch, and Adam [96], participation plays an important role in building reliable and accurate big data. For instance, one of the respondents explained the role citizens play in achieving SSC. The Interviewee I-B-3 said: “without citizens, you cannot have data, you cannot have an opinion, you cannot have thoughts, you cannot analyse what they need. So, you need them, and you need their opinion, you need their thoughts, you need their ideas, you need their behaviour to translate and to help you and to help these decisions- makers”. Others see that eliminating participation in smart city projects leads to being labelled and failing to create dynamic and resilient cities. Therefore, it would be very difficult to follow the rapid development. Interviewee I-B-1 suggested that “I have a critical view of the term “Smart Cities”. Smart cities term is very judgmental. Smart cities are when you talk about a city that becomes a smart phone. It has applications and platforms. I call these cities digitization”. Other participants believe that they also know how well these projects can be implemented by integrating the members of the public. I-A-3 stated that: “It is possible to have such if there was a platform in which the citizens can say their opinion and develop a clear vision, through it we can have a direct interaction among all: the responsible, the merchant, the experts, and the decision’s owner.” Therefore, CP at various stages of the developmental process cannot be dispensed. An example of the responses of Interviewee I-B-2 and I-C-2 as regards to the human element in development is: “I think that human act as the major focus in the development process. In my opinion, cars will fill the city to the extent that there is usage for a human factory. This brings out what we called by greedy capitalism to serve capitalization and drive away mankind.”

4.10. Inclusion

As seen in Table 10, Table 11, Table 12, Table 13, Table 14 and Table 15, inclusion has p-values of <0.05 (between 0.001 and 0.014). The performance outcomes are significantly correlated to the predictor inclusion. Inclusion was found to be the most significant predictor for smart economy, smart people, smart governance, smart mobility, and smart living, apart from smart environment. Ref. [97] urges that CP is all-inclusive. Interviewee I-B-3 stated that “As smart cities of course it will be as a big connection for gaining such matter, but this will be done they had been built correctly and had a goal behind this not just to finish the building and that is all, in other way, they have to stay as long as their good materials that are used in building such cities, for example: I have to bring a battery that has a good quality, an advantage of staying with me for a long period and not only thinking of it if whether it works or damages.” Inclusion led to high competition, which will occur when the cities are developed for the purpose of attractions. Interviewee I-C-1 urges that “to emerge basically from each city instance there will be a high competition atmosphere between these Saudi cities for the purpose of attractions to all groups who are existing in these cities: visitors to go and come, habitants, and investors”. In addition, Interviewee I-A-1 reported how citizens can be excluded and do not have the opportunity to share decisions: “Actually in this area where the citizen does not have the opportunity to take decision, they will be considered excluded from that community”. Padrón Nápoles, Gachet Páez, Esteban Penelas, García Pérez, Martín de Pablos, and Muñoz Gil [98] reported that inclusion can be strengthened by adopting ICT to improve social communication and engagement. In addition, it promotes personal growth, offers stimulating activities, uses age-friendly technologies, and enhances the well-being of individuals.

5. Conclusions

SSCO is envisioned to have the potential to foster the development process of smart cities in Saudi Arabia. Most people in Saudi Arabia see smart cities as competition between various cities of Saudi and they believe that SSC can be attained when the citizens are actively involved in the developmental process. Therefore, this study sought to establish the relationship between CPL and SSCO within Saudi Arabia. A mixed method approach revealed the influencing factors on CPL and SSCO. An interview was utilised to consolidate the extracted variables from the literature and add other variables that may affect SSCO. An online questionnaire was utilised to collect data from practitioners (urban planners, architectural designers, and real estate developers), government representatives (FSCP officers from MOMRA UN-habitat and policymakers), and academics in the built environment to validate these variables and their relationships using MS ranking; multiple regression analysis and multivariate regression analysis were adopted to validate the causality between CLP and SSCO. The identified performing outcomes for SSCO are smart economics, smart environment, smart governance, smart people, smart living and smart mobility. The four significant factors of CPL to engage and empower citizens are accountability and responsibility, transparency, participation, and inclusion, as identified from the literature review. The regression analysis results suggest that a positive significant correlation exists between CPL and SSCO. This implies that a higher CPL leads to a higher level of SSCO, but the other way around do not apply, as established through the endogeneity test results. The predictor accountability and responsibility has a significant impact on SSCO and should be measured considering service satisfaction, urban planning, policy development, and the implementation and finances of a smart city project. There is a need for data transparency and information sharing with the public, which will enhance the active participation of the citizens. A lack of information regarding the projects and their impacts on the citizens’ quality of life will limit the contribution of the community. CP will allow the gathering of data that will assist the government and urban planners in decision-making and planning for future developments. A platform that allows the active interaction of the citizens with all stakeholders would help in developing a clear vision for SSC. The lack of opportunities for citizens to be part of the decision-making process can influence their participation level.
The findings show that adopting SSC in Saudi Arabia needs to be more all-inclusive rather than inducing the segmentation of the citizens. It was found that citizens play a key role in implementing and ensuring SSC. Notably, it is imperative for a proper evaluation of the proposed projects and the adequate communication of information on these projects to the citizens, which will ensure that SSC are achieved. Further, the participants, on average, tended to agree that the performance outcomes of SSCO were influenced by CPL, with a diverse need to be for the benefit of all members of the public rather than solo and political reasons. The evidence from both qualitative and quantitative surveys indicates that most measures of SSCO taken in regard to SSC can be influenced by the performance predictors of CPL. As revealed in the analysis, it is allowing citizens to be a member of the decision-making process and the proper dissemination of information on the type of projects to be carried out which is the way to enlighten and educate citizens.
This article contributes to the existing literature by identifying and ranking the citizens’ participation measures influencing SSCO. In addition, it investigates the relationships and the correlation between CPL and SSCO by understanding the influencing factor to achieve SSC. From the significant and positive relationship found, the implication to practice is to adopt CP and raise CPL. The causation can be explained by the fact that when the four CP measures are adopted, the members of the society are well informed about the project and the project is geared towards promoting the culture and values of the people. Therefore, to escalate CPL in SSC, a major approach is to promote an all-inclusiveness strategy of implementing these projects whereby the citizens also have a sense of belonging in the construction of these projects. This study recommends that SSCO and CP measures should become part of the regulations so that citizens are engaged in all critical phases of strategic management in developing SSC.
This study also has a theoretical significance as the results generalise that SSCO is significantly related to the participation of Saudi Arabia citizens, thereby contributing to the existing body of knowledge about the development of SCC.
The FSCP is currently implemented in 17 pilot cities in Saudi Arabia; therefore, further research should be conducted on a nationwide basis when this programme is fully rolled out so that the overall generalisation can be improved. Hence, the findings from this study should be generalised with caution. Moreover, the data collection was limited to participants in Saudi Arabia only and there was a lack of gender diversity due to the social settings of the case study area and the eligibility criteria, which has eliminated unexperienced females from participation. To address this limitation, further research will be conducted to include more female participation when the gender diversity in the built environment industry becomes more evenly distributed in the future. It is envisioned that women’s participation in SSC projects and surveys will increase in the future [58,99,100]. It is recommended that future research should extend research to other countries with similar characteristics as Saudi Arabia. This would provide an in-depth insight and understanding of how SSCOs success could be achieved by increasing CPL in developing countries.

Author Contributions

Conceptualisation, A.K.A., R.B.A. and T.Y.M.L.; methodology, A.K.A., R.B.A. and T.Y.M.L.; software, A.K.A.; validation, A.K.A., R.B.A. and T.Y.M.L.; formal analysis, A.K.A.; investigation, R.B.A. and T.Y.M.L.; resources, A.K.A.; data curation, A.K.A.; writing—original draft preparation, A.K.A.; writing—review and editing, R.B.A. and T.Y.M.L.; visualisation, A.K.A., R.B.A. and T.Y.M.L.; supervision, R.B.A. and T.Y.M.L.; project administration, A.K.A., R.B.A. and T.Y.M.L. All authors have read and agreed to the published version of the manuscript.

Funding

This research received no external funding.

Data Availability Statement

Not applicable.

Acknowledgments

This paper forms part of a larger research project which focuses on citizens’ participation to support the implementation of smart sustainable cities from which other papers will be produced with a different objective/scope but sharing the same background and methodology. The Saudi Arabia government, represented by Imam Abdulrahman Bin Faisal University (IAU), is appreciated for their internal financial sponsorship and other support for this PhD study.

Conflicts of Interest

The authors declare that there is no conflict of interest.

Abbreviations

CPCitizens’ participation
CPLCitizens’ participation level
FSCPFuture Saudi Cities Program
ICTInformation communication technology
MoMRAMinister of Municipal and Rural Affairs
MSMean score
SSCSmart sustainable cities
SSCOSmart sustainable cities outcome
TSTemporal sequence
NANonspurious association
CAConcomitant variation

Notations

NotationMeaning
M mean score for eat predictor
s the participants’ score based on a Likert scale
n is the total number of participants
α intercept/constant
β 1 , β 2 ,.., β k regression coefficients
X i ,   X i i , .. ,   X k predictors
ϵ i predictive error or residual
Y p is the dependent variable
Y Where is the matrix of the dependent variable
XIs the predictors,
ϵ Is the error factor
β Is the matrix of the regression parameters

References

  1. Andone, D.; Holotescu, C.; Grosseck, G. Learning Communities in Smart Cities. Case Studies. In Proceedings of the 2014 International Conference on Web and Open Access to Learning (ICWOAL), Dubai, United Arab Emirates, 25–27 November 2014; pp. 1–4. [Google Scholar] [CrossRef]
  2. Romero-Lankao, P.; Frantzeskaki, N.; Griffith, C. Sustainability transformation emerging from better governance. In Urban Planet. Knowledge towards Sustainable Cities; Cambridge University Press: Cambridge, UK, 2018; pp. 263–280. [Google Scholar] [CrossRef]
  3. Evans, B.; Joas, M.; Sundback, S.; Theobald, K. Governing local sustainability. J. Environ. Plan. Manag. 2006, 49, 849–867. [Google Scholar] [CrossRef]
  4. Allmendinger, P.; Tewdwr-Jones, M. New Labour, new planning? The trajectory of planning in Blair’s Britain. Urban Stud. 2000, 37, 1379–1402. [Google Scholar] [CrossRef]
  5. Almughairy, A.M. Rethinking Regional Development Strategies in Saudi Arabia: Planning Processes, Governance, and Implementation. J. Sustain. Dev. 2019, 12, 131. [Google Scholar] [CrossRef] [Green Version]
  6. Al-Hathloul, S. Riyadh development plans in the past fifty years (1967–2016). Curr. Urban Stud. 2017, 5, 97. [Google Scholar] [CrossRef] [Green Version]
  7. Shaw, D.; Sturzaker, J.; Brodie, K.; Sykes, O.; Dembski, S.; Sahar, A. Urban Planning Reviews: Governance of Planning, Local Planning and Urban Management; University of Liverpool: Liverpool, UK, 2016; Volume 2, Available online: https://livrepository.liverpool.ac.uk/3028230/1/Urban-Planning-Reviews_Output-1_Governance.pdf (accessed on 10 January 2023).
  8. Petesch, P.; Smulovitz, C.; Walton, M. Evaluating empowerment: A framework with cases from Latin America. In Measuring Empowerment: Cross-Disciplinary Perspectives; Narayan-Parker, D., Ed.; World Bank Press: Washington, DC, USA, 2005; pp. 39–68. [Google Scholar]
  9. Groom, Q.; Strubbe, D.; Adriaens, T.; Davis, A.J.; Desmet, P.; Oldoni, D.; Reyserhove, L.; Roy, H.E.; Vanderhoeven, S. Empowering citizens to inform decision-making as a way forward to support invasive alien species policy. Citiz. Sci. Theory Pract. 2019, 4, 33. [Google Scholar] [CrossRef] [Green Version]
  10. World Development Report, Making Services Work for Poor People. 2004. Available online: https://openknowledge.worldbank.org/bitstream/handle/10986/5986/WDR%202004%20-%20English.pdf?sequence=1&isAllowed=y (accessed on 10 January 2023).
  11. Erete, S.; Burrell, J.O. Empowered Participation: How Citizens Use Technology in Local Governance. In Proceedings of the Proceedings of the 2017 CHI Conference on Human Factors in Computing Systems, Denver, CO, USA, 6–11 May 2017; pp. 2307–2319. [Google Scholar] [CrossRef]
  12. Gaber, J. Building “A Ladder of Citizen Participation”: Sherry Arnstein, Citizen Participation, and Model Cities. J. Am. Plan. Assoc. 2019, 85, 188–201. [Google Scholar] [CrossRef]
  13. Sigwejo, A.; Pather, S. A citizen-centric framework for assessing e-government effectiveness. Electron. J. Inf. Syst. Dev. Ctries. 2016, 74, 1–27. [Google Scholar] [CrossRef] [Green Version]
  14. Narayan, D. Bonds and bridges: Social capital and poverty. In Social Capital and Economic Development: Well-Being in Developing Countries; Edward Elgar Publishing: Cheltenham, UK, 2002; pp. 58–81. [Google Scholar] [CrossRef] [Green Version]
  15. Sartori, G. The Theory of Democracy Revisited; Chatham House: London, UK, 1987; Volume 1. [Google Scholar]
  16. Dahl, R.A. Democracy and Its Critics; Yale University Press: New Haven, CT, USA, 2008. [Google Scholar]
  17. Schumpeter, J.A. Capitalism, socialism and democracy (1942). J. Econ. Lit. 1976, 20, 1463. [Google Scholar] [CrossRef]
  18. UN-Habitat. Jeddah CPI Profile 2018. 2018. Available online: https://unhabitat.org/cpi-profile-jeddah (accessed on 15 January 2023).
  19. UN-Habitat. Saudi Cities Report 2019. 2018. Available online: https://unhabitat.org/saudi-cities-report-2019 (accessed on 15 January 2023).
  20. Ministry of Municipal and Rural Affairs. Future Saudi Cities Program. 2018. Available online: https://unhabitat.org/sites/default/files/2020/05/saudi_city_report.english.pdf (accessed on 15 January 2023).
  21. Knight, B.; Chigudu, H.; Tandon, R. Reviving Democracy: Citizens at the Heart of Government; CRC Press: Boca Raton, FL, USA, 2002. [Google Scholar] [CrossRef]
  22. Lee, J. Citizen Participation, Process, and Transparency in Local Government: An Exploratory Study. Policy Stud. J. 2019, 47, 1020–1041. [Google Scholar] [CrossRef]
  23. Paulussen, S.; Heinonen, A.; Domingo, D.; Quandt, T. Doing it together: Citizen participation in the professional news making process. OBSERVATORIO 2007, 1, 131–154. [Google Scholar] [CrossRef]
  24. Lim, A.; Malek, J.A.; Hussain, M.Y.; Tahir, Z. Citizen participation in building citizen-centric smart cities. Malays. J. Soc. Space 2018, 14, 42–53. [Google Scholar] [CrossRef] [Green Version]
  25. Batty, M.; Axhausen, K.W.; Giannotti, F.; Pozdnoukhov, A.; Bazzani, A.; Wachowicz, M.; Ouzounis, G.; Portugali, Y. Smart cities of the future. Eur. Phys. J. Spec. Top. 2012, 214, 481–518. [Google Scholar] [CrossRef] [Green Version]
  26. Harrison, C.; Donnelly, I.A. A theory of smart cities. In Proceedings of the 55th Annual Meeting of the ISSS—2011, Hull, UK, 17–22 July 2011. [Google Scholar]
  27. Lazaroiu, G.C.; Roscia, M. Definition methodology for the smart cities model. Energy 2012, 47, 326–332. [Google Scholar] [CrossRef]
  28. Odendaal, N. Information and communication technology and local governance: Understanding the difference between cities in developed and emerging economies. Comput. Environ. Urban Syst. 2003, 27, 585–607. [Google Scholar] [CrossRef]
  29. Castelnovo, W.; Misuraca, G.; Savoldelli, A. Smart cities governance: The need for a holistic approach to assessing urban participatory policy making. Soc. Sci. Comput. Rev. 2016, 34, 724–739. [Google Scholar] [CrossRef]
  30. Cardullo, P.; Kitchin, R. Being a ‘citizen’ in the smart city: Up and down the scaffold of smart citizen participation in Dublin, Ireland. GeoJournal 2019, 84, 1–13. [Google Scholar] [CrossRef]
  31. Martina, C.; Evansa, J.; Karvonenb, A.; Krassimira, P.; Yangd, D.; Linjordete, T. Smart-sustainability: A new urban fix? Sustain. Cities Soc. 2019, 45, 640–648. [Google Scholar] [CrossRef]
  32. Ahvenniemi, H.; Huovila, A.; Pinto-Seppä, I.; Airaksinen, M. What are the differences between sustainable and smart cities? Cities 2017, 60, 234–245. [Google Scholar] [CrossRef]
  33. Yigitcanlar, T.; Kamruzzaman, M.; Foth, M.; Marques, J.; da Costa, E.; Ioppolo, G. Can cities become smart without being sustainable? a systematic review of the literature. Sustain. Cities Soc. 2018, 45, 348–365. [Google Scholar] [CrossRef]
  34. Albino, V.; Berardi, U.; Dangelico, R.M. Smart cities: Definitions, dimensions, performance, and initiatives. J. Urban Technol. 2015, 22, 3–21. [Google Scholar] [CrossRef]
  35. Mahesa, R.; Yudoko, G.; Anggoro, Y. Dataset on the sustainable smart city development in Indonesia. Data Brief 2019, 25, 104098. [Google Scholar] [CrossRef] [PubMed]
  36. Rajput, S.; Sharma, P. Sustainable Smart Cities in India: Challenges and Future Perspectives; Springer: Cham, Switzerland, 2017. [Google Scholar] [CrossRef]
  37. Ringenson, T.; Eriksson, E.; Börjesson Rivera, M.; Wangel, J. The Limits of the Smart Sustainable City. In Proceedings of the 2017 Workshop on Computing Within Limits, Santa Barbara, CA, USA, 22–24 June 2017; pp. 3–9. [Google Scholar] [CrossRef]
  38. Yigitcanlar, T.; Kamruzzaman, M. Planning, development and management of sustainable cities: A commentary from the guest editors. Sustainability 2015, 7, 14677–14688. [Google Scholar] [CrossRef] [Green Version]
  39. Alamoudi, A.K.; Abidoye, R.B.; Lam, T.Y. Critical Review of Citizens’ Participation in Achieving Smart Sustainable Cities: The Case of Saudi Arabia. In International Summit Smart City 360°; Paiva, S., Li, X., Lopes, S.I., Gupta, N., Rawat, D.B., Patel, A., Karimi, H.R., Eds.; Springer: Cham, Switzerland, 2022; Volume 442, pp. 434–454. [Google Scholar] [CrossRef]
  40. De Mello Torres, J.G.; De Andrade, N.; Neto, P.L.d.O.C. Analysis of the European and Brazilian Rankings of Smart Cities: A Case Study of São José dos Campos and Toulouse. Int. J. Adv. Eng. Res. Sci. 2019, 6, 91–115. [Google Scholar] [CrossRef] [Green Version]
  41. Lombardi, P.; Giordano, S.; Farouh, H.; Yousef, W. Modelling the Smart City Performance. Innov. Eur. J. Soc. Sci. Res. 2012, 25, 137–149. [Google Scholar] [CrossRef]
  42. Hanafizadeh, P.; Hanafizadeh, M.R.; Khodabakhshi, M. Extracting Core ICT Indicators Using Entropy Method. Inf. Soc. 2009, 25, 236–247. [Google Scholar] [CrossRef]
  43. Creswell, J. Research Design: Qualitative, Quantitative, and Mixed Method Approaches; University of Nebraska: Los Angeles, CA, USA, 2009. [Google Scholar]
  44. Babbie, E.R. The Basics of Social Research, 7th ed.; Cengage Learning: Boston, MA, USA, 2017; p. 310. [Google Scholar]
  45. Pratama, A.; Imawan, S. A Scale for Measuring Perceived Bureaucratic Readiness for Smart Cities. Public Adm. Policy Asia-Pac. J. 2019, 22, 25–39. [Google Scholar] [CrossRef] [Green Version]
  46. Granier, B.; Kudo, H. How are citizens involved in smart cities? analysing citizen participation in Japanese “Smart Communities”. Inf. Polity 2016, 21, 61–76. [Google Scholar] [CrossRef]
  47. Niezabitowska, E.D. Research Methods and Techniques in Architecture; Routledge: Oxfordshire, UK, 2018; pp. P138–P260. [Google Scholar]
  48. Akins, R.; Tolson, H.; Cole, B. Stability of response characteristics of a Delphi panel: Application of bootstrap data expansion. BMC Med. Res. Methodol. 2005, 5, 37. [Google Scholar] [CrossRef] [Green Version]
  49. Osei-Kyei, R. A Best Practice Framework for Public Private Partnership Implementation For Infrastructure Development in Chana; The Hong Kong Polytechnic University: Hong Kong, 2018. [Google Scholar]
  50. Patton, M.Q. Qualitative Research. Encycl. Stat. Behav. Sci. 2005. [Google Scholar] [CrossRef]
  51. Etikan, I.; Musa, S.A.; Alkassim, R.S. Comparison of convenience sampling and purposive sampling. Am. J. Theor. Appl. Stat. 2016, 5, 1–4. [Google Scholar] [CrossRef] [Green Version]
  52. Yager, J.; Kunkle, R.; Fochtmann, L.J.; Reid, S.M.; Plovnick, R.; Nininger, J.E.; Silverman, J.J.; Vergare, M.J. Who’s your expert? use of an expert opinion survey to inform the development of American psychiatric Association practice guidelines. Acad. Psychiatry 2014, 38, 376–382. [Google Scholar] [CrossRef] [PubMed]
  53. Pallant, J. A Step by Step Guide to Data Analysis Using SPSS Survival Manual, 6th ed.; McGraw-Hill Education: London, UK, 2016. [Google Scholar]
  54. Stevens, R. Understanding the Self; SAGE in Association with the Open University: London, UK, 1996. [Google Scholar]
  55. Coakes, S.J.; Steed, L.G. SPSS: Analysis without Anguish; John Wiley & Sons: Milton, QLD, Australia, 2003. [Google Scholar]
  56. The Work Bank. Labor Force, Female (% of Total Labor Force)—Saudi Arabia. Available online: https://data.worldbank.org/indicator/SL.TLF.TOTL.FE.ZS?locations=SA (accessed on 22 November 2022).
  57. Al-Hazzaa, H.M. Physical inactivity in Saudi Arabia revisited: A systematic review of inactivity prevalence and perceived barriers to active living. Int. J. Heal. Sci. 2018, 12, 50–64. [Google Scholar]
  58. Naseem, S.; Dhruva, K. Issues and Challenges of Saudi Female Labor Force and the Role of Vision 2030: A Working Paper. Int. J. Econ. Financ. Issues 2017, 7, 23–27. [Google Scholar]
  59. Ke, F. A qualitative meta-analysis of computer games as learning tools. In Gaming and Simulations: Concepts, Methodologies, Tools and Applications; IGI Global: Hershey, PA, USA, 2011; pp. 1619–1665. [Google Scholar] [CrossRef]
  60. Bangor, A.; Kortum, P.; Miller, J. Determining what individual SUS scores mean: Adding a subjective rating scale. J. Usability Stud. 2009, 4, 114–123. [Google Scholar] [CrossRef]
  61. Cheung, E.; Chan, A.P. Risk factors of public-Private partnership projects in China: Comparison between the water, power, and transportation sectors. J. Urban Plan. Dev. 2011, 137, 409–415. [Google Scholar] [CrossRef] [Green Version]
  62. Gliem, J.A.; Gliem, R.R. Calculating, Interpreting, and Reporting Cronbach’s Alpha Reliability Coefficient for Likert-type Scales. 2003 Midwest Research-to-Practice Conference in Adult, Continuing, and Community Education, Columbus. pp. 82–88. Available online: https://hdl.handle.net/1805/344 (accessed on 5 January 2023).
  63. Draper, N.R.; Smith, H. Applied Regression Analysis; John Wiley & Sons: Hoboken, NJ, USA, 1998; Volume 326. [Google Scholar]
  64. Osei-Kyei, R.; Chan, A.P. Model for predicting the success of public–private partnership infrastructure projects in developing countries: A case of Ghana. Archit. Eng. Des. Manag. 2019, 15, 213–232. [Google Scholar] [CrossRef] [Green Version]
  65. Zhu, W.; Yan, R.; Song, Y. Analysing the impact of smart city service quality on citizen engagement in a public emergency. Cities 2022, 120, 103439. [Google Scholar] [CrossRef] [PubMed]
  66. Hayu, R.; Surachman, S.; Rofiq, A.; Rahayu, M. The effect of website quality and government regulations on online impulse buying behaviour. Manag. Sci. Lett. 2020, 10, 961–968. [Google Scholar] [CrossRef]
  67. Alamoudi, A.K.; Abidoye, R.B.; Lam, T.Y.M. An evaluation of stakeholders’ participation process in developing smart sustainable cities in Saudi Arabia. Smart Sustain. Built Environ. 2022; ahead of print. [Google Scholar] [CrossRef]
  68. Saguin, K. Cultivating beneficiary citizenship in urban community gardens in Metro Manila. Urban Stud. 2020, 57, 3315–3330. [Google Scholar] [CrossRef]
  69. Bibri, S.E.; Krogstie, J. A novel model for data-driven smart sustainable cities of the future: A strategic roadmap to transformational change in the era of big data. Future Cities Environ. Plan. A Econ. Space 2021, 7, 3. [Google Scholar] [CrossRef]
  70. Malek, J.A.; Lim, S.B.; Yigitcanlar, T. Social Inclusion Indicators for Building Citizen-Centric Smart Cities: A Systematic Literature Review. Sustainability 2021, 13, 376. [Google Scholar] [CrossRef]
  71. Gohari, S.; Baer, D.; Nielsen, B.F.; Gilcher, E.; Situmorang, W.Z. Prevailing Approaches and Practices of Citizen Participation in Smart City Projects: Lessons from Trondheim, Norway. Infrastructures 2020, 5, 36. [Google Scholar] [CrossRef]
  72. Alamoudi, A.K.; Abidoye, R.B.; Lam, T.Y.M. The Impact of Stakeholders’ Management Measures on Citizen’ Participation Level in Implementing Smart Sustainable Cities. Sustainability 2022, 14, 16617. [Google Scholar] [CrossRef]
  73. Granger, C.W. Some aspects of causal relationships. J. Econom. 2003, 112, 69. [Google Scholar] [CrossRef]
  74. Wörgötter, F.; Porr, B. Temporal sequence learning, prediction, and control: A review of different models and their relation to biological mechanisms. Neural Comput. 2005, 17, 245–319. [Google Scholar] [CrossRef] [Green Version]
  75. Shin, J.C.; Ivry, R.B. Spatial and temporal sequence learning in patients with Parkinson’s disease or cerebellar lesions. J. Cogn. Neurosci. 2003, 15, 1232–1243. [Google Scholar] [CrossRef]
  76. Spivakov, M. Spurious transcription factor binding: Non-functional or genetically redundant? Bioessays 2014, 36, 798–806. [Google Scholar] [CrossRef] [PubMed] [Green Version]
  77. Sorjonen, K.; Nilsonne, G.; Ingre, M.; Melin, B. Spurious correlations in research on ability tilt. Personal. Individ. Differ. 2022, 185, 111268. [Google Scholar] [CrossRef]
  78. Lennerstrand, G.; Thoden, U. Muscle Spindle Responses to Concomitant Variations in Length and in Fusimotor Activation 1. Acta Physiol. Scand. 1968, 74, 153–165. [Google Scholar] [CrossRef]
  79. Sinnott-Armstrong, W. How strong is this obligation? An argument for consequentialism from concomitant variation. Analysis 2009, 69, 438–442. [Google Scholar] [CrossRef]
  80. Simon, H.A. On the definition of the causal relation. J. Philos. 1952, 49, 517–528. [Google Scholar] [CrossRef]
  81. Christensen, L.A. Directionality: Problems Identified & Solved. Demogr. Res. 2001. Available online: https://www.audiologypractices.org/directionality-problems-identified-solved (accessed on 5 January 2023).
  82. Wunsch, G. Confounding and control. Demogr. Res. 2007, 16, 97–120. [Google Scholar] [CrossRef] [Green Version]
  83. Law, M.; Wald, N. Risk factor thresholds: Their existence under scrutiny. BMJ 2007, 324, 1570–1576. [Google Scholar] [CrossRef] [PubMed] [Green Version]
  84. Steger, S.; Mair, V.; Kofler, C.; Pittore, M.; Zebisch, M.; Schneiderbauer, S. Correlation does not imply geomorphic causation in data-driven landslide susceptibility modelling–Benefits of exploring landslide data collection effects. Sci. Total Environ. 2021, 776, 145935. [Google Scholar] [CrossRef]
  85. Ahadzie, D.; Proverbs, D.; Olomolaiye, P. Critical success criteria for mass house building projects in developing countries. Int. J. Proj. Manag. 2008, 26, 675–687. [Google Scholar] [CrossRef]
  86. Lam, T.Y.M. A performance outcome framework for appraising construction consultants in the university sector. J. Facil. Manag. 2016, 14, 249–265. [Google Scholar] [CrossRef]
  87. Finn, J.D. A General Model for Multivariate Analysis; Holt, Rinehart & Winston: New York, NY, USA, 1974. [Google Scholar]
  88. Prentice, R.L.; Williams, B.J.; Peterson, A.V. On the regression analysis of multivariate failure time data. Biometrika 1981, 68, 373–379. [Google Scholar] [CrossRef]
  89. Alexopoulos, E.C. Introduction to multivariate regression analysis. Hippokratia 2010, 14 (Suppl. 1), 23–28. [Google Scholar]
  90. Imai, K. Multivariate regression analysis for the item count technique. J. Am. Stat. Assoc. 2011, 106, 407–416. [Google Scholar] [CrossRef]
  91. Van Der Merwe, A.; Zidek James, V. Multivariate regression analysis and canonical variates. Can. J. Stat. 1980, 8, 27–39. [Google Scholar] [CrossRef]
  92. Jaakson, R. Decentralized administration and citizen participation in community planning. Long Range Plan. 1972, 5, 16–22. [Google Scholar] [CrossRef]
  93. McGrath, S.K.; Whitty, S.J. Accountability and responsibility defined. Int. J. Manag. Proj. Bus. 2018, 11, 687–707. [Google Scholar] [CrossRef]
  94. Zaazou, Z.A. Citizens’ participation in financing national projects (an applied study on the enlargement of the Suez Canal of Egypt). Rev. Econ. Political Sci. 2020; ahead of print. [Google Scholar] [CrossRef]
  95. Arnstein, S.R. A ladder of citizen participation. J. Am. Inst. Plan. 1969, 35, 216–224. [Google Scholar] [CrossRef] [Green Version]
  96. Fitzgerald, C.; McCarthy, S.; Carton, F.; Connor, Y.O.; Lynch, L.; Adam, F. Citizen participation in decision-making: Can one make a difference? J. Decis. Syst. 2016, 25, 248–260. [Google Scholar] [CrossRef] [Green Version]
  97. Roy, S. The Smart City Paradigm in India: Issues and Challenges of Sustainability and Inclusiveness. Soc. Sci. 2016, 44, 29–48. [Google Scholar]
  98. Padrón Nápoles, V.M.; Gachet Páez, D.; Esteban Penelas, J.L.; García Pérez, O.; Martín de Pablos, F.; Muñoz Gil, R. Social inclusion in smart cities. In Handbook of Smart Cities; Springer: Berlin/Heidelberg, Germany, 2021; pp. 469–514. [Google Scholar] [CrossRef]
  99. Abdelmoaty, A. Gender Mainstreaming and Women’s Involvement in Urban Planning Strategies. In Proceedings of the Second Arab Land Conference, Cairo, Egypt, 22–24 February 2021. [Google Scholar]
  100. VISION2030. An Ambitious Nation. Available online: https://www.vision2030.gov.sa/v2030/overview/an-ambitious-nation/ (accessed on 5 October 2022).
Figure 1. The impact of CPL on SSCO.
Buildings 13 00343 g001
Table 1. Primary Areas of Urban Sustainability proposed by FSCP.
Area of Urban Sustainability (Primary Objectives of FSCP)Related Sustainability Measures
Quality of lifeSocial sustainability: affordable housing, safety, transportation (road and rail network), electrical energy, drainage, telecommunication and quality public services, open spaces.
Economic competitivenessEconomic sustainability: GDP, income per capita, homes to households ratio.
Environmental protectionEnvironmental sustainability: water scarcity and management, pollution, solid waste management, green space, and biodiversity.
Adapted from: Ministry of Municipal and Rural Affairs [20] and UN-Habitat [19].
Table 2. Citizen’s Participation Measures.
Independent VariablesMeasures Variables
Accountability and responsibilityThe truthiness between government and citizen
TransparencyThe powerfulness of open data
ParticipationThe willingness to participate
Social inclusionThe ability to participate
Adapted from: Narayan [14], Paulussen, Heinonen, Domingo, and Quandt [23].
Table 3. Common Indicators and Sub-Indicators Considered for Measuring Smart Cities.
Indicators
(Dependant Variables)
Sub-IndicatorsSource
A—Smart EconomicA1—Innovative spiritDe Mello Torres, De Andrade and Neto [40], Lombardi, Giordano, Farouh and Yousef [41]
A2—EntrepreneurshipDe Mello Torres, De Andrade and Neto [40], Lombardi, Giordano, Farouh and Yousef [41]
A3—Economic image and trademarksDe Mello Torres, De Andrade and Neto [40]
A5—Flexibility of labour marketDe Mello Torres, De Andrade and Neto [40]
A7—E-Business Hanafizadeh, Hanafizadeh and Khodabakhshi [42]
B—Smart PeopleB1—Level of qualificationDe Mello Torres, De Andrade and Neto [40]
B2—Affinity to lifelong learningHanafizadeh, Hanafizadeh and Khodabakhshi [42]
B3—Social and ethnic pluralityDe Mello Torres, De Andrade and Neto [40], Lombardi, Giordano, Farouh and Yousef [41]
B4—FlexibilityDe Mello Torres, De Andrade and Neto [40], Lombardi, Giordano, Farouh and Yousef [41]
B5—CreativityDe Mello Torres, De Andrade and Neto [40]
B6—Cosmopolitanism/open-mindednessDe Mello Torres, De Andrade and Neto [40]
B7—Participation in public lifeDe Mello Torres, De Andrade and Neto [40]
C—Smart GovernanceC1—Participation in decision-makingDe Mello Torres, De Andrade and Neto [40], Hanafizadeh, Hanafizadeh and Khodabakhshi [42]
C2—Public and social services Hanafizadeh, Hanafizadeh and Khodabakhshi [42]
C3—Transparent governanceLombardi, Giordano, Farouh and Yousef [41]
C4—E-government Hanafizadeh, Hanafizadeh and Khodabakhshi [42]
D—Smart MobilityD1—Local accessibilityDe Mello Torres, De Andrade and Neto [40]
D2—International accessibility and availability of ICT infrastructureHanafizadeh, Hanafizadeh and Khodabakhshi [42]
D3—Sustainable, innovative and safe transport SystemsHanafizadeh, Hanafizadeh and Khodabakhshi [42]
E—Smart Environment E1—Attractivity of natural conditionsHanafizadeh, Hanafizadeh and Khodabakhshi [42]
E2—PollutionDe Mello Torres, De Andrade and Neto [40]
E3—Environmental protectionLombardi, Giordano, Farouh and Yousef [41]
E4—Sustainable resource managementDe Mello Torres, De Andrade and Neto [40]
F—Smart LivingF1—Cultural facilitiesDe Mello Torres, De Andrade and Neto [40]
F2—Health conditionsDe Mello Torres, De Andrade and Neto [40]
F3—Individual safetyDe Mello Torres, De Andrade and Neto [40]
F4—Housing qualityDe Mello Torres, De Andrade and Neto [40]
F5—Education facilitiesDe Mello Torres, De Andrade and Neto [40]; Hanafizadeh, Hanafizadeh and Khodabakhshi [42]
F6—Touristic attractivityDe Mello Torres, De Andrade and Neto [40]
F7—Social cohesionDe Mello Torres, De Andrade and Neto [40]
Table 4. List of Participants.
CodePositionYear of
Experience
Group
I-C-1Expert in creative cities15Commercial industry
I-B-1Architect and practitioner25Academics
I-C-2Expert in computer sciences14Commercial industry
I-A-1Mayor of AlAhssa30Government implementation programme/policy makers
I-B-2Professor at Imam Abdulrahman bin Faisal University25Academics
I-C-3CEO of Sakan21Commercial industry
I-A-2GM of Alshargia Authority25Government implementation programme/policy makers
I-C-4Chairman of Urban Planning at KFUPM18Academics
I-B-3Expert in humanising cities16Commercial industry
I-B-4CEO of Imam Abdulaziz bin Mohammed Royal Reserve45Academics
I-A-3Digital transformation authority28Government implementation programme/policy makers
I-A-4Former Mayor of Riyadh50Government implementation programme/policy makers
Table 5. Preliminary Themes Generated from the Interviews.
ThemesCodes
Adoption of smart city projects among the citizensAdoption of global best practices, smart city and urban sustainability, smart sustainable, smart cities, and cultural sustainability.
Factors influence the drivers of CPL and SSCODecentralized citizen, citizens’ participation and smart cities, materials for decision making, difficulties.
Relationship between CPL and SSCOFuture Saudi Cities Program, human resources in performance of smart city, expectations from the programme, socio-cultural impact on citizens’ participation.
Table 6. Statistics for the Demographic Variable.
VariablesFrequency (n = 245)Percentage
GenderMale20182.0
Female4317.6
Others10.4
Age18–29114.5
30–397530.6
40–499639.2
50 and above6325.7
Level of EducationBachelor’s degree11747.8
Diploma62.4
Masters4116.8
PhD6727.3
Others145.7
Field of ProfessionArchitecture3915.9
Urban planning10844.1
Business management4217.1
Civil engineering62.5
IT3915.9
Others114.5
Sector of PracticePublic sector13856.3
Private sector7831.8
Academia2610.6
Freelance31.3
Years of Experience0–593.7
6–10156.1
11–154819.6
16–2011848.2
21 and above5522.4
Table 7. Descriptive Statistics of Citizens’ Participation Measures and SSCOs (See Table 3 and Table 8).
Number of ItemsCronbach’s
Alpha
MSD
Accountability and responsibility 60.6832.62020.54404
Transparency40.5092.83080.67483
Participation40.542.39160.74078
Inclusion40.5082.57520.78908
Variable of smart economy70.7824.52661.01993
Variables of smart people70.6794.56501.03472
Variables of smart governance40.784.54041.05563
Variables of smart mobility30.5834.58211.04167
Variables of smart environment40.6784.57251.06430
Variables of smart living50.8684.49461.06073
Table 9. Correlation for Smart Sustainable Cities Outcomes.
Smart Sustainable
Cities Outcomes
Accountability and ResponsibilityTransparencyParticipationInclusion
Smart sustainable cities outcomes1
Accountability and responsibility0.690 **1
Transparency0.8560.805 **1
Participation0.9090.709 **0.799 **1
Inclusion0.4900.474 **0.329 **0.609 **1
** Correlation is significant at the 0.01 level (2-tailed).
Table 10. Multiple Regression for Smart Economy.
Model/PredictorUnstandardized
Coefficients
Standardized
Coefficients
p-ValuetSig.
BStd. ErrorBeta
(Constant)5.2720.39
Accountability and responsibility−0.2240.119−0.1390.061−1.8770.062
Transparency0.050.1070.0350.0090.4650.642
Participation−0.0990.094−0.0770.043−1.0530.294
Inclusion−0.0030.089−0.0020.002−0.0340.0973
Dependent variable: smart economy. F(13.526) = 1.868, R2 = 0.647, Adj. R2 = 0.615
Table 11. Multiple Regression for Smart People.
Model/PredictorUnstandardized
Coefficients
Standardized Coefficientsp-ValuetSig.
BStd. ErrorBeta
1(Constant)5.1150.404 0.404
Accountability and responsibility−0.1510.124−0.0910.023−1.2180.124
Transparency0.0410.1110.0280.0340.3720.111
Participation−0.1580.098−0.1190.012−1.6190.098
Inclusion0.0350.0920.0270.0110.3800.092
Dependent variable: smart people. F(12.672) = 1.868, R2 = 0.717, Adj. R2 = 0.685
Table 12. Multiple Regression for Smart Governance.
Model/PredictorUnstandardized CoefficientsStandardized Coefficientsp-ValuetSig.
BStd. ErrorBeta
1(Constant)5.3320.393
Accountability and responsibility−0.2650.120−0.1630.011−2.2000.029
Transparency0.0010.1080.0010.0120.0080.994
Participation−0.0950.095−0.0730.002−1.0000.319
Inclusion0.0690.0900.0540.0010.7690.443
Dependent variable: smart governance. F(13.583) = 1.868, R2 = 0.817, Adj. R2 = 0.705
Table 13. Multiple Regression for Smart Mobility.
Model/PredictorUnstandardized
Coefficients
Standardized Coefficientsp-ValuetSig.
BStd. ErrorBeta
1(Constant)5.3590.401
Accountability and responsibility−0.2430.123−0.1460.014−1.9780.049
Transparency−0.0250.110−0.0170.042−0.2260.822
Participation−0.1030.097−0.0770.023−1.0580.291
Inclusion0.0850.0920.0650.0010.9230.357
Dependent variable: smart mobility. F(13.349) = 1.868, R2 = 0.644, Adj. R2 = 0.545
Table 14. Multiple Regression for Smart Environment.
Model/PredictorUnstandardized
Coefficients
Standardized Coefficientsp-ValuetSig.
BStd. ErrorBeta
1(Constant)5.4350.386 0.000
Accountability and responsibility−0.2880.118−0.1790.001−2.4360.016
Transparency−0.0220.106−0.0150.000−0.2050.837
Participation−0.1010.093−0.0780.000−1.0770.283
Inclusion0.0980.0880.0780.0011.1080.269
Dependent variable: smart environment. F(14.073) = 1.868, R2 = 0.796, Adj. R2 = 0.710
Table 15. Multiple Regression for Smart Living.
Model/PredictorUnstandardized
Coefficients
Standardized Coefficientsp-ValuetSig.
BStd. ErrorBeta
1(Constant)5.4820.391 0.000
Accountability and responsibility−0.2930.120−0.1800.022−2.4440.015
Transparency−0.0050.108−0.0040.031−0.0500.960
Participation−0.0910.095−0.0700.039−0.9670.335
Inclusion0.0640.0890.0500.0140.7180.473
Dependent variable: smart living. F(14.011) = 1.868, R2 = 0.760, Adj. R2 = 0.660
Table 16. Endogeneity Testing of the Effect of SSCO on CPL.
Predictor of CPLUnstandardized
Coefficients
Standardized
Coefficients
p-ValuetSig.
BStd. ErrorBeta
(Constant)5.4821.391
Smart economics1.9301.1200.8000.542−5.65512.100
Smart environment3.3052.1080.0340.663−3.22410.435
Smart governance 2.9301.0950.0700.784−4.1503.200
Smart living1.5301.0890.0500.543−5.8773.153
Smart mobility2.2301.4320.5300.564−4.5453.455
Smart people2.9302.0190.0900.601−5.6586.051
Dependent variable: CLP. F= (−1.435), R2 = 0.24, Adj. R2 = 0.29
Table 17. Multivariate Regression Model Between CPL and SSCO.
Unstandardized
Coefficients
Standardized
Coefficients
p-ValuetSig.
BStd. ErrorBeta
(Constant)5.8450.186 0.000
Transparency−0.1330.190−0.0800.0023.2240.235
Participation−0.0550.148−0.0240.0012.1500.000
Inclusion−0.1010.105−0.0500.0191.8770.153
Accessibility and
responsibility
0.0550.1090.0900.0042.6580.051
Dependent variable: SSCO. F= 16.489, R2 = 0.76, Adj. R2 = 0.71
Disclaimer/Publisher’s Note: The statements, opinions and data contained in all publications are solely those of the individual author(s) and contributor(s) and not of MDPI and/or the editor(s). MDPI and/or the editor(s) disclaim responsibility for any injury to people or property resulting from any ideas, methods, instructions or products referred to in the content.

