Article

Adriseismic Methodology for Expeditious Seismic Assessment of Unreinforced Masonry Buildings

1
Department of Architecture, University of Bologna, 40136 Bologna, Italy
2
Faculty of Civil Engineering, University of Belgrade, 11000 Belgrade, Serbia
3
Faculty of Civil Engineering, University of Zagreb, 10000 Zagreb, Croatia
4
Department of Civil Engineering, University of British Columbia, Vancouver, BC V6T 1Z4, Canada
*
Author to whom correspondence should be addressed.
Buildings 2023, 13(2), 344; https://doi.org/10.3390/buildings13020344
Submission received: 23 December 2022 / Revised: 19 January 2023 / Accepted: 23 January 2023 / Published: 26 January 2023

Abstract

:
The paper describes a novel Adriseismic method for expeditious assessment of seismic risk associated with unreinforced masonry buildings. The methodology was developed for the Adriseismic project of the Interreg ADRION programme, with the aim to develop and share tools for increasing cooperation and reducing seismic risk for six participating countries within the region surrounding the Adriatic and the Ionian Seas. The method is applicable to unreinforced masonry buildings characterised by three main seismic failure mechanisms, namely masonry disintegration, out-of-plane failure, and in-plane damage/failure. Depending on the input parameters for a specific structure, the assessment yields a qualitative output that consists of the masonry quality index, the index of structural response, the level of seismic risk, and the most probable collapse mechanism. Both input and output of the method are applied in the spreadsheet form. The method has so far been applied in urban areas of participating countries in the project, including Mirandola, Italy; Kaštela, Croatia; Belgrade, Serbia. In parallel, the methodology has been validated by performing a detailed seismic assessment of more than 25 buildings, and the results have been compared with the results of the proposed expeditious method. The results show a good correlation between the two methods, for example, the structural response index obtained from the expeditious method and the capacity/demand ratio obtained from the conventional assessment method.

1. Introduction

The countries surrounding the Adriatic and Ionian Seas, including Italy, Slovenia, Croatia, Bosnia and Herzegovina, Serbia, Montenegro, Albania, and Greece, have been historically exposed to major seismic events, both in terms of intensity and frequency [1,2]. These countries are characterised by the high seismic exposure and significant stock of vulnerable unreinforced masonry (URM) buildings, which were designed to withstand only gravity loads and were unable to sustain the effects of moderate to strong earthquakes without substantial damage. Historical URM buildings located in urban centres appear to be most vulnerable due to numerous transformations which they have undergone over time, and the challenges encountered while carrying out structural interventions, as demonstrated by the many seismic retrofitting techniques introduced since the 1970s [3]. At the same time, these urban areas are also characterised by the highest population density and the unique identity of a specific place. The combination of high seismic hazard, high vulnerability, and high exposure makes seismic risk reduction an issue of fundamental importance for these urban areas. Recent earthquakes in the region, including Albania [4], Greece [5,6], and Croatia [7,8], once again confirmed the high seismic vulnerability of URM buildings, which experienced substantial damage or collapse due to these seismic events.
It was estimated that URM buildings account for 45% to 61% of the existing building stock within the region surrounding the Adriatic and Ionian Seas [9]. Seismic assessment of URM buildings is often challenging because an in-depth seismic analysis is both time-consuming and expensive. For this reason, methods for expeditious seismic assessment have been considered as an alternative to detailed approaches. They are less time-consuming, but accurate enough to guide informed planning at the urban or regional level.
It is possible to classify seismic vulnerability assessment methods into analytical and empirical ones [10], although hybrid assessment procedures are also available [11]. Empirical methods are mainly based on rapid post-earthquake damage observations, while analytical methods are usually based on performance limit states, mechanical characteristics of construction materials, and include detailed vulnerability assessment algorithms [12]. Hybrid methods are a combination of empirical and analytical ones—they are derived from statistical approaches and consider the actual effects of past earthquakes on different types of structures, as well as the results from analytical methods [13,14].
Probable damage matrices are classic examples of empirical methods, which attempt to predict the effect of an earthquake on structures with known characteristics [15]. Empirical methods of this type have evolved over time. For example, the study by Braga [16] used the macroseismic intensity scale MSK-76 [17] to define damage matrices based on the observed damage after the Irpinia earthquake (Campania, Italy). The same method, implemented by Giovinazzi and Lagomarsino [18], proved particularly effective for application to large urban areas, such as the cities of Faro, Portugal [19], Barcelona, Spain [20], and Lisbon, Portugal [21]. Another widespread empirical method is the Rapid Visual Screening Method, presented in FEMA154 [22], which assigns a score for the building on the basis of visual sidewalk screening, providing results to the user in about 30 min. Approaches based on general considerations, inspired by field experience, have been developed in several countries, including Japan [23], Turkey [24], and Canada [25].
Analytical methods can generally rely on more accurate results but are more time-consuming. They may include the use of collapse multipliers, e.g., the Vulnus System, developed in Italy [26], or the FaMIVE method [27]. Calvi [28] proposed a displacement-based vulnerability assessment approach applicable to both reinforced concrete and URM buildings, and served as the basis for other methods for URM buildings [29,30,31].
The expeditious method presented in this paper was developed for application in several countries within the region surrounding the Adriatic and Ionian Seas. Similar to the EMS-98 scale [32] which is applicable in Europe, the proposed method aims at performing seismic risk assessment at the international (regional) level. It can be used to expeditiously evaluate individual buildings, and potentially large areas within a short timeframe, without the need to define complex frameworks or acquire empirical data from previous seismic events [33]. Building-specific vulnerabilities depend on regional construction characteristics [9] and are different from seismic risk, which is the product of vulnerability, exposure, and hazard. The procedure yields the following output indicators: (i) index of structural response, defined as an inverse value to the vulnerability; (ii) masonry quality index (MQI) [34,35]; (iii) the most probable collapse mechanism; (iv) seismic risk index. Both input and output values were simplified as much as possible, often using general categories (I, II, III, etc.), with the values that were attributed a priori. The method enables fast data input in the spreadsheet form, easy interpretation of the results, and was designed to be implemented on Geographical Information System (GIS) platforms to facilitate large-scale applications.
During the Adriseismic project [36], three pilot cases were performed to assess the real-life applicability of the procedure. The selected sites were located in Bologna (Italy) [37], Kaštela (Croatia), and Rethymno (Greece). This paper presents instead the results obtained for three urban sites located in the cities of Mirandola (Italy), Kaštela (Croatia), and Belgrade (Serbia), which were considered relevant for the case study purposes, too. These case studies enabled evaluation and testing of the procedure, in terms of its applicability to sites characterised by different seismic hazard levels and masonry buildings constructed using different techniques. Furthermore, the expeditious method was verified on a pilot sample of 25 buildings, for which the results of seismic assessment were previously determined using conventional seismic assessment methods. Some of the buildings were previously assessed using the LV1 expeditious method [38], while others were assessed by means of linear elastic dynamic analysis.
The features such as expeditiousness, applicability at different localities, and qualitative, easily interpretable output distinguish the proposed method from existing approaches and facilitate its large-scale application, thereby increasing knowledge of the state of the existing heritage, therefore targeting more in-depth analyses on the most critical buildings.

2. The Adriseismic Method

2.1. An Overview of the Method

The Adriseismic method was developed based on the following criteria:
  • Input information is easily accessible: to be effective, the method must be applicable on a large scale. For that reason, assessment of an individual building should not require in-depth investigations, such as detailed condition surveys or historical analysis, instead, an assessment should be based on general data, such as cadastral plans and other types of building information.
  • The assessment is performed quickly: ideally, it should take no more than a few minutes to evaluate an individual building once all the information is available.
  • The output can be easily understood by non-experts: a long-term goal of the project is rapid dissemination of the method; hence, it is expected that the results can be incorporated in urban planning tools (through municipal maps), as well as property evaluations in the insurance sector.
  • The method is internationally applicable: it is essential for the procedure to include features unrelated to a specific country or region.
These four criteria guided the method development. On one hand, it was important to maintain the consistency with the initial objectives, while on the other hand it was important to impose certain constraints, such as international applicability and a balance between the accuracy of the results and the speed of processing input data.
From the operational point of view, the method comprises the following four main phases (see Figure 1):
  • Data input: the user needs to enter input data related to specific building.
  • Processing: the input data are processed according to the algorithm.
  • Output: the system provides output (results).
  • Retrofitting: this phase is currently not directly linked to the seismic assessment of a building, but a structure intervention strategy can be suggested for enhancing seismic resistance of a specific building.
The expeditious method can be applied using a Microsoft Excel spreadsheet. Input data are organised into the following sections:
  • General data—this section provides general information related to a specific building and does not affect the assessment results.
  • Construction characteristics—information related to the prevalent construction techniques for foundations, vertical structural elements, floors, and roofs is selected from an existing database via a drop-down menu [9,39]. The provided information does not affect the assessment results.
  • Masonry quality—masonry assessment is performed using the Masonry QualityI method, M.Q.I. [34,35]. The user is requested to input nine masonry characteristics for the building, which strongly influence the seismic vulnerability assessment.
  • Building characteristics—this section requires the user to provide 12 input data related to the intended use of the building and its morphological and structural configuration. Whenever possible, the weights attributed to each parameter were defined using normative values or considerations based on simplified schemes. Input data, such as intended use, irregularities, and expected ductility, were derived using indirect considerations from Eurocode 8 [40,41]. (See Appendix B.) Other parameters were set using equilibrium-based considerations, as explained in the next section. Input data influence the key results, namely the index of structural response, the seismic risk, and the most probable collapse mechanism.
  • Site data—this section consists of three input parameters referring to the seismic zone of the building site according to the Eurocode 8 requirements [40] and is used to determine the seismic hazard level.
Detailed information related to each input section is contained in Appendix A.
The following output indicators are obtained as a result of the assessment:
  • Masonry category—it depends exclusively on the masonry quality. According to the M.Q.I. method, which serves as the basis for determining the masonry category, there are three possible categories (A to C), depending on the capacity of a masonry structure to resist vertical, out-of-plane, and in-plane load actions.
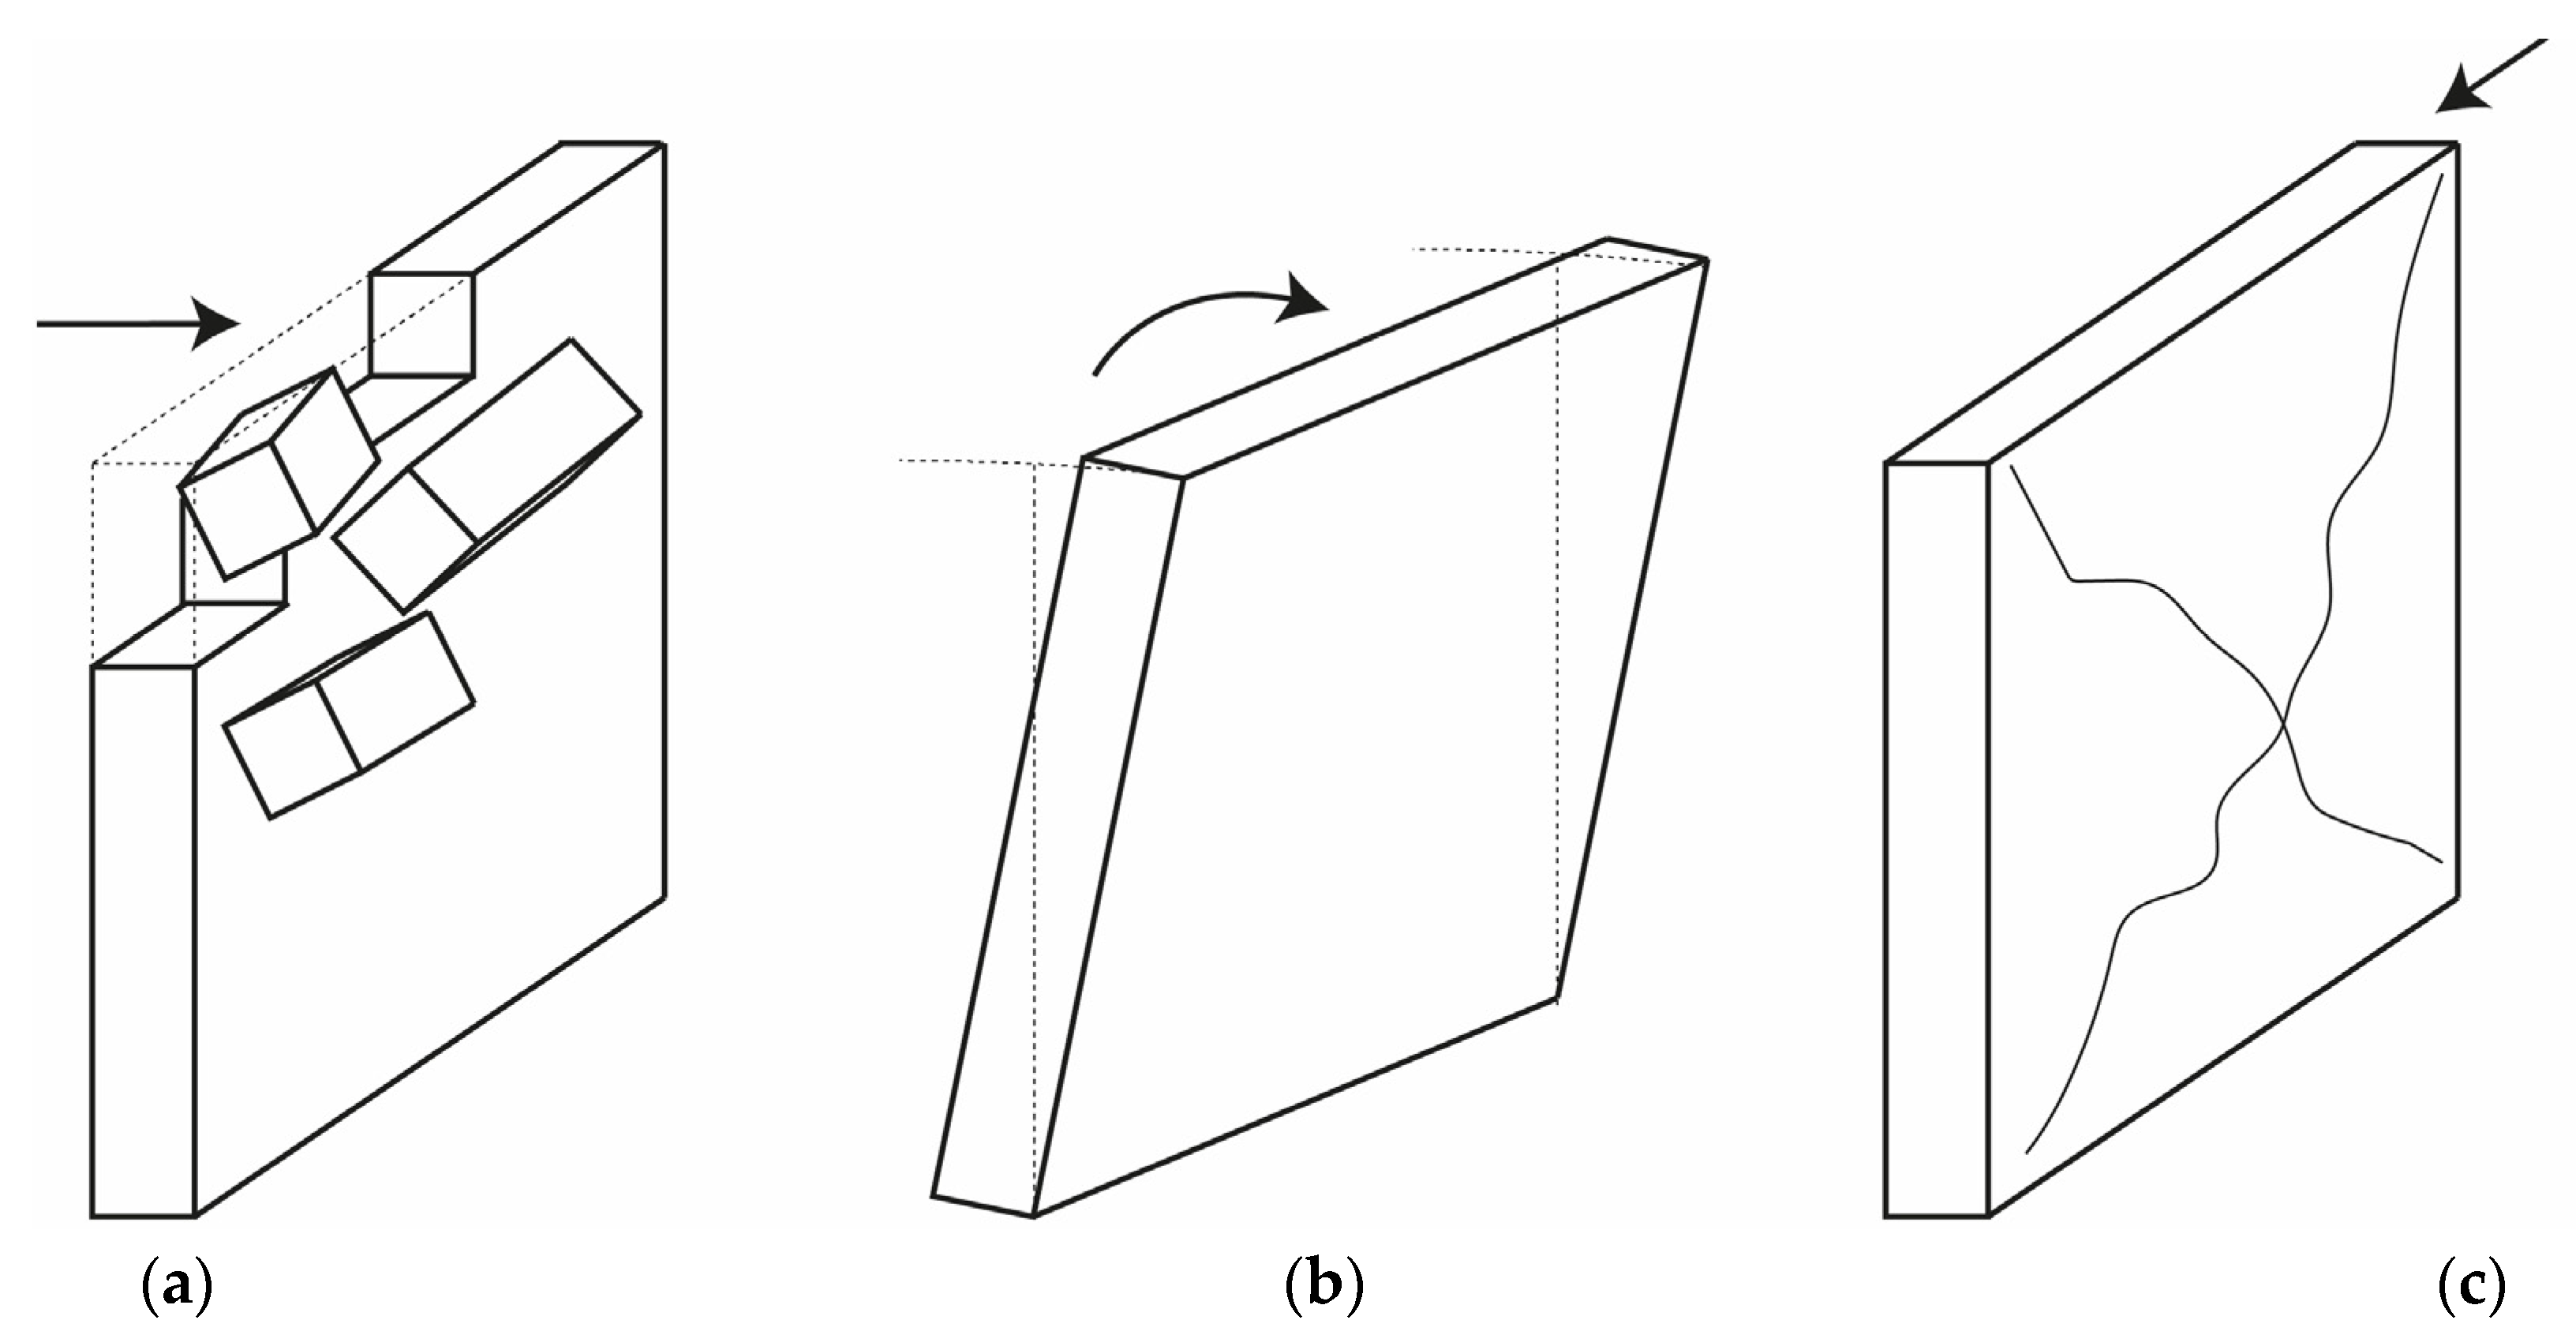
  • Index of structural response—associates the presumed building capacity to a numerical value (in the range from 0 to 1) and the corresponding category (from I to VI). A specific value is determined by analysing the following three main masonry failure mechanisms (in a decreasing extent of impact): wall disintegration, out-of-plane failure, and in-plane failure. The masonry quality and the building characteristics input data also influence the failure mechanism.
  • Probable collapse mechanism—a hypothesis regarding the most probable collapse mechanism (disintegration of masonry, out-of-plane kinematic mechanism, or in-plane failure) is formulated for the building based on the input data;
  • Seismic risk—it is calculated based on the index of structural response and the required site data (the higher the number, the greater the risk); the risk is also presented as a category (ranging from “none” to “very high”).
  • Retrofitting—when specific structural deficiencies are noted, the user may wish to suggest specific actions to mitigate the risk. According to the possible choices in terms of the type of the structural intervention, simple qualitative information is provided to indicate its feasibility for a specific building.
Both input and output were simplified as much as possible. Instead of providing a numerical input to describe the building characteristics, general categories (I, II, and III) were used. The use of qualitative indicators instead of numerical values also appears to be useful since it facilitates the application in different contexts by partially removing a language barrier. For example, “I” indicates a low quantity in an absolute sense, e.g., a regular building is assigned category “I” to indicate the absence of irregularity, “III” indicates a very high amount/abundance (e.g., high energy dissipation capacity), while “II” is used for intermediate values.
Figure 2 compares the assessment form of the Adriseismic method to the general diagram.
Input data related to the masonry quality have been presented as proposed by the M.Q.I. method [34,35]. Each input characteristic is assigned a qualitative indicator, e.g., F. (fulfilled), P.F. (partially fulfilled), or N.F. (not fulfilled), as seen in Table 1. These qualitative input categories (I, II, III, F., P.F., N.F.) are associated with numerical data, which are essential for obtaining the output.
The output (results) was presented using the same quantitative indicators as the input. For example, the parameter “index of structural response” is defined by six different classes (I to VI), where I indicates a highly vulnerable building and VI indicates a building without obvious structural deficiencies. The class of a building was assigned based on the numerical value (ranging from 0 to 1), which describes the structural behaviour and directly depends on the inputs. The ranges shown in Table 2 were assigned considering wider ranges for the lower classes and narrower ranges for the higher ones; this increases the probability of assigning precautionary values.
The use of building class is similar to the decree “Sismabonus” [42], which is used to evaluate the seismic capacity of existing buildings by means of letters (A to F). The use of defined classes and numerical ranges facilitates ease of application and interpretation, and the results can be transferred to urban planning maps or GIS for use by a wider community (non-experts).

2.2. Processing of Input Data

After the input data have been entered in the assessment form, the processing takes place in the background (it is not visible to the user). One of the key aspects of the processing stage is determination of the most critical masonry failure mechanism for a specific building. The Adriseismic method takes into account realistic seismic behaviour and failure mechanisms for URM structures, including (i) masonry disintegration, (ii) out-of-plane kinematic mechanisms, (iii) and in-plane failure. Figure 3 shows a schematic representation of these failure mechanisms.
Disintegration concerns the loss of cohesion of the wall and is typical of loose (poorly cohesive) and weak (low strength) masonry, (Figure 3a). Out-of-plane kinematic mechanism, such as overturning (Figure 3b), can be simulated by a rigid macro-element, which does not depend on material strength characteristics. Collapse due to reaching the ultimate resistance in plane, also known as in-plane failure (Figure 3c), usually requires the greatest seismic energy and can be expected in cohesive masonry which is found in structures with well-connected load-bearing elements [43].
Parameters related to building characteristics directly influence the activation of four out-of-plane kinematic mechanisms, including simple masonry overturning, vertical bending, horizontal bending, and corner overturning, [44] which were considered in this study. Each parameter was assigned a 0 value if it does not influence the activation of a specific out-of-plane mechanism, 0.5 for the case of a small effect, and 1 in the case of a large effect (see Table 3).
The influence of these characteristics was assessed by monitoring the variation in spectral acceleration for the activation of each kinematic mechanism while the other parameters remained unchanged. C.I.N.E. spreadsheets developed in Italy [45] were used for this purpose. The impact was defined as irrelevant when the variation in a parameter changed the original spectral acceleration by less than 25%, moderate when changes in spectral acceleration ranged from 25 to 75%, and large when changes were greater than 75%.
As for the other input parameters, the categories “I”, “II”, and “III” indicate poor or abundant values. For example, in the case of small transversal wall distances, category ‘I’ is used, while for very thick walls the category ‘III’ should be selected. In order to minimise the complexity of survey and data acquisition, the parameters “thrust due to arches and vaults” and “thrusts due to the roof” were set to depend on the floor weight. For example, in case of a construction solution that generates a thrust on the vertical masonry, a higher floor weight corresponds to a higher thrust.

2.3. Results of the Assessment

2.3.1. Masonry Categories

The M.Q.I. method assigns masonry categories ranging from A to C, where A is the least vulnerable, B is intermediate, and C is the most vulnerable. The rating is assigned for all possible load actions, namely vertical actions (gravity) (MQIv), horizontal out-of-plane actions (MQIop), and horizontal in-plane actions (MQIip).
The M.Q.I. ratings are formulated for each load action based on Equations (1)–(3). The symbols in the equations are explained in the nomenclature section. The results are associated with the corresponding masonry category (A, B, or C).
M Q I v = r v · g · m · S s · ( H j + W c + S r + V j + S d + M m )
M Q I o p = r o p · g · m · S s · ( H j + W c + S r + V j + S d + M m )
M Q I i p = r i p · g · m · S s · ( H j + W c + S r + V j + S d + M m )
Table 4 shows the ranges of values associated with each category. The numerical values obtained from equations are divided by a factor of 10 for the sake of convenience.

2.3.2. Index of Structural Response

Index of structural response is the key parameter used for assessing the seismic behaviour of the construction. It is defined considering an M.Q.I. rating and building characteristics. In order to evaluate all masonry damage mechanisms, the following equations have been proposed:
P s d = D u + I p + I h + E d + F n
S m o = S w + W t + I n h + P f w + P a + P r
V b = S w + W t + I n h + P f w + P a + P r
H b = S w + W t + I n h + P f w + P a + P r
C o = S w + W t + I n h + P f w + P a + P r
The equations assign a numerical value to parameters linked to seismic demand Psd (Equation (4)), simple masonry overturning Smo (Equation (5)), vertical bending Vb (Equation (6)), horizontal bending Hb (Equation (7)), and corner overturning Co (Equation (8)). The meaning of the symbols can be found in the Nomenclature section at the end of the paper. The resulting values for these parameters have been normalised using the traditional max–min formulation (Equation (9)) to make them comparable. The maximum value was set equal to 1, and the minimum value was 0 (the same applies to the index of structural response and the M.Q.I.).
n o r m = v i v m i n v m a x v m i n
Once the five values have been defined according to Equations (4)–(8), it is possible to calculate the index of structural response, Isr. Two alternative formulations are used: the first considers the main structural elements disconnected from each other (input n.25 set “off”, see Appendix A, Table A4), and the second assumes them as linked (input n.25 set “on”):
I s r , 1 = P s d , n + min ( S m o , n ; V b , n ; H b , n ; C o , n ; M Q I v ; M Q I o p ; M Q I i p )   2
I s r , 2 = P s d , n + min ( M Q I v ; M Q I o ; M Q I i )   2
Equation (10) offers the index of structural response as the mathematical average of the seismic demand parameters (normalised) and the minimum value for the four kinematic mechanisms and the M.Q.I. results. In this way, the most probable damage mechanism of the analysed structure is evaluated, choosing the one with the lowest numerical value on a 0–1 scale. For example, a building constructed with poor masonry quality but with good construction characteristics will still have a low index of structural response.
Equation (11) is related to the hypothesis of well-connected structural elements. The four out-of-plane kinematic mechanisms are not included in the equation. In this case, the index only depends on the parameters that directly influence the seismic demand (designated use, floors above ground, irregularity in plan, irregularity in height, expected ductility) and the quality of masonry.
A numerical value, ranging from 0 (very vulnerable building) to 1 (building without vulnerability), is used to assign a class (from I to VI), according to the range shown in Table 2. The assigned class allows for comparison with other buildings and can be used for urban planning purposes.

2.3.3. Most Probable Collapse Mechanism

The previously presented Equations (5)–(8), together with the M.Q.I. results and the data provided by the user about the “connections between structural elements”, allow hypotheses to be formulated regarding the most probable collapse mechanism for the building. The output is provided based on the following criteria:
  • When the masonry quality is class C, for one or all three actions, the masonry may disaggregate for very low seismic values.
  • When the masonry quality is average or good class A or B, but the connections between structural elements are good, the evaluation system indicates the out-of-plane kinematic as the most probable collapse mechanism with the lowest value among the four investigated in the method, Equations (5)–(8).
  • When neither of the two conditions presented is verified, the building may develop global behaviour, and collapse may occur due to reaching ultimate strength in vertical plane.

2.3.4. Seismic Risk

The final output is related to seismic risk, S h . Using the same concept as before, a numerical value is assigned to a qualitative risk category for the building. The risk Sh is calculated using the widely used formulation [46]:
S h = I v · E · H
Unlike the index of structural response, the risk is not determined as a numerical value because its magnitude depends on the ground acceleration provided by the user. However, as the number describing the risk increases, the risk category increases, as shown in Table 5.
The ranges in the table were calibrated for different conditions within the entire Adriatic–Ionian Sea region. For example, the risk was differentiated into high and very high for buildings located in areas subject to significant acceleration, but characterised by different exposures.

2.3.5. Retrofitting

Finally, the method provides recommendations related to the possible seismic intervention (retrofitting). The output is intended to be qualitative and identifies the intervention based on deficiencies that may have emerged during the investigation phase and confirmed by the results. The section is also organised into input and output, but there is no intermediate processing phase for the input information and the output. The intervention can be selected from a defined list. As shown in Table 6, it is possible to select the extent of intervention and the main material that should be used. Based on these preferences, compatible interventions are offered by the method.
Currently, 56 possible interventions have been included in the database; out of these, 28 interventions are localised, while the remaining ones are extensive.
Figure 4 shows five main types of materials that can be used for interventions. The blue colour shows the total number of interventions for each material, while a beige bar gives an indication of the extent (extensive or localised). For each intervention, a few qualitative indications are available to help guide the choice. Based on the Adriseismic project deliverable D.T.2.1.2 [9], the cost, technical complexity, and critical issues are indicated, as seen in Table 7. For the Croatian scenario, the retrofitting prices were based on World Bank reports and Croatian methodology [47,48,49,50].

3. Application of the Adriseismic Method on Urban Case Studies

At the end of the development phase, the method was initially applied on real buildings. The aim was to verify the adaptability of the procedure in varied contexts and its compliance with the four guiding criteria illustrated in Section 2 (easily accessible information, quick assessment, outputs easily understandable, and international use). For this purpose, buildings in three different areas within three cities were studied: Mirandola (Italy), Kaštela (Croatia), and Belgrade (Serbia). The areas were selected according to Adriseismic project objectives; hence, URM buildings facing squares and having a historical identity for the place were considered.

3.1. The Mirandola Case Study

The city of Mirandola is a small town (approx. 23,000 inhabitants), located in northern Italy, in the region of Emilia-Romagna. It has an ancient history and dates back to the year 1000. Like many other settlements in the area, it is organised on an initial fortified structure and successive stratifications added over the centuries. The site is highly active from a seismic point of view, although the acceleration (PGA) expected for the area, at the Life Safety limit state, is 0.14 g, which is about half of that actually recorded in the last major earthquake that occurred in 2012. The combination of these two elements (settlement with a long history and high seismic hazard) made the area very relevant for applying the Adriseismic method. Figure 5 shows a satellite view of the case study location.
Three buildings facing the Conciliation Square were selected for the study, as seen in Figure 6. All three buildings have masonry load-bearing structures and are a part of larger aggregates.
The information to assess the seismic response was obtained through cadastral plans and site surveys. In parallel, historical analyses were carried out to reconstruct the main events that affected the buildings over time. Following the project objectives, no specific material investigations were carried out.
Building (a) (Figure 6) has three floors above ground and an attic. The lowest level is intended for commercial use, while the others are for residential use. The original structure dates back to the 16th century and has been modified over time. A central block has undergone numerous extensions until it was connected to the other units, generating a complex aggregate. Building (b) is of the most recent construction, dating back to the 1930s. As in the previous case, the structure is part of a large aggregate, characterised by an internal courtyard and a highly irregular planimetric configuration. The assessment was carried out on the part of the building with homogeneous construction characteristics. The floors are composite, made of hollow bricks and reinforced concrete, while the walls are made of bricks that are not always interlocked well. The use of the building is public.
Building (c) dates back to the 16th century. It is the largest in plan and has probably undergone the largest number of structural interventions over the centuries. The current configuration is certainly different from the original intention and is the result of numerous extensions over time. The roof and floors are made of wood, although, given the many transformations that have taken place, they are made using different construction techniques.
Table 8 shows the main results of the expeditious assessment: index of structural response, masonry category, most probable collapse mechanism, seismic risk, and seismic risk category.

3.2. The Kaštela Case Study

Similar to Italy, Croatia is affected by a high seismic hazard. A few disastrous earthquakes that have occurred in recent years, such as the 2020 one in Petrinja with a magnitude 6.4 on the Richter scale, have raised awareness of the scientific and political community who started to evaluate innovative measures to reduce seismic risk. The chosen area, Podvorje Square, is located in the south of Kaštel Sućurac, the administrative area of the city of Kaštela (Croatia), as seen in Figure 7.
The city, located just north of Split, is a small town (around 40,000 inhabitants), characterised by a very ancient history dating back to prehistoric times, which has resulted in a building heritage rich in dated constructions. The presence of potentially vulnerable buildings and a high seismic hazard, the expected acceleration (PGA) at the site at the Life Safety limit state is equal to 0.22 g, made the square relevant for the application of the Adriseismic method.
The area dates back to the 15th century and was built at the behest of Archbishop Bartul Averaldo, who intended to create fortifications at the centre of the present Archbishop’s palace. The assessment was carried out on five buildings, characterised by different construction techniques, construction periods, and functions; see Figure 8.
The input information was obtained using: (i) historical surveys which were used to find information to demonstrate the building modifications that have occurred over time or the presence of structural interventions; (ii) physical surveys such as on-site measurements and aerial-photogrammetric surveys. The full laser scanning of the area from the ground was conducted to create a 3D cloud of points (Figure 9). The laser scanner was a compact Leica BLK360 3D imaging laser scanner with an integrated spherical imaging system and thermography panorama sensor system. Laser scanning facilitates and speeds up, documenting and reviewing geometry, especially for large and complex buildings [51]. The point cloud was used to create an accurate 3D model of the area (Figure 8). Similarly, full 3D photogrammetry scanning was performed by unmanned aerial devices (drones), which produced several 360° images that were used in the post-analysis stage [52].
The first building (a) is public which dates back to the 15th century (Figure 8). Configuration is irregular both in height and plan, with one side being much longer than the other. The building has stone masonry walls and wooden floors and roof.
The second building (b) has a residential function. The building has brick masonry walls and wooden floors and roof. The construction period is between the 1920s and 1940s.
The third building (c) is very similar to the second, as they share the same construction period and construction features. There are no noticeable irregularities in plan and elevation; it has a wooden load-bearing structure with brick tiles to characterise the floors.
The fourth (d) and fifth buildings (e) are part of the same aggregate and have residential use. The walls were constructed using stone masonry, while the floors and roof are mainly wooden structures. In terms of configuration, no particular irregularities in height were found. The structures probably date back to the early 1900s and may not have been built simultaneously. The aggregate effect was not considered in this study.
Table 9 shows the results obtained by applying the method to these five buildings.

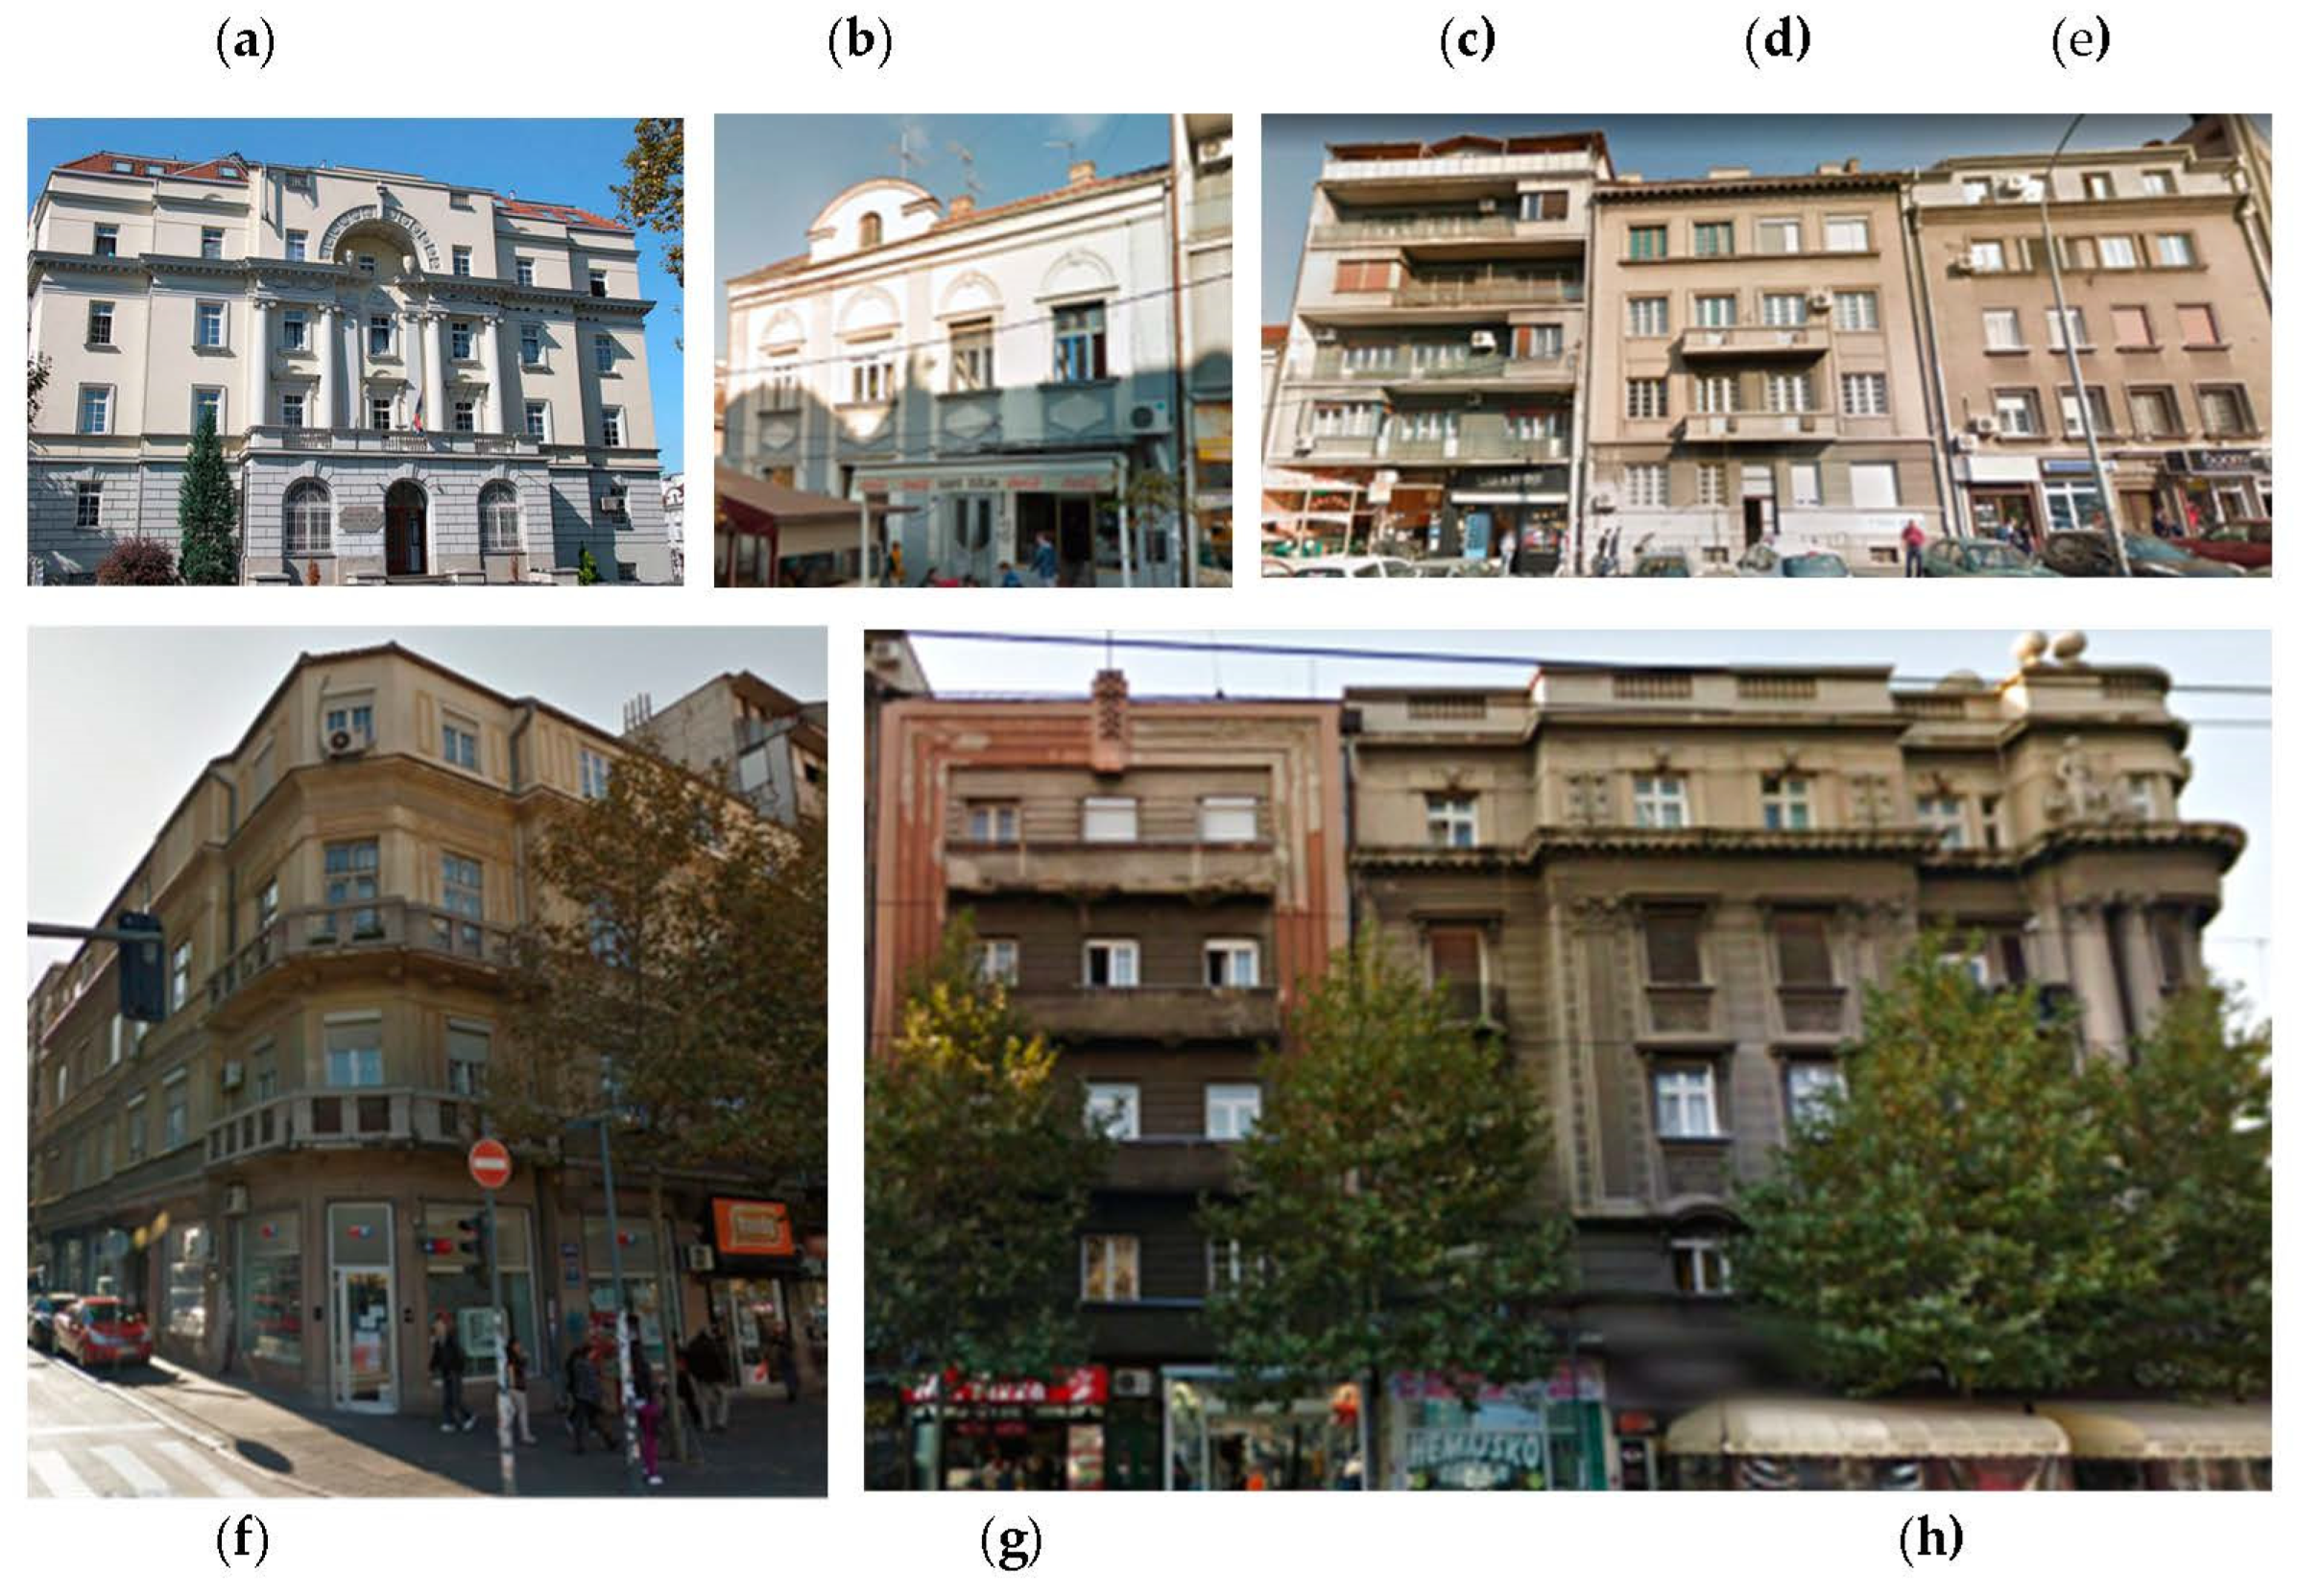
3.3. The Belgrade Case Study

The last case study site is located in Belgrade the capital of Serbia. Belgrade is one of the oldest settlements in Europe, and its considerable size (population 1,400,000) and rich history have resulted in a heterogeneous building heritage in terms of construction techniques. Seismic hazard of the area can be characterised as moderate, the PGA is 0.1 g, the lowest for the three selected case studies. Due to its geographical location [53], the city has not been affected by earthquakes since 1992.
The chosen area is close to the city centre, in immediate proximity to the Cyril and Methodius Park, as shown in Figure 10. It is a very busy area (resulting in a high exposure), surrounded by ancient buildings which were not designed to resist horizontal actions. This fact, together with the historical stratifications that characterise the site, make it the perfect location for applying the method. In this context, eight different load-bearing masonry buildings characterised by varied construction techniques and functions were assessed (Figure 11).
Similar to other case studies, expeditious assessment was initially conducted on the observation of structural elements, and archival material was used to reconstruct the construction history. Structural and architectural plans were also found for all the buildings. No surveys were carried out using advanced techniques.
Building (a) is currently used as the University canteen and dormitory (public building). It was built in 1926 and has a load-bearing structure composed of brickwork. The floors consist of RC cast-in-situ ribbed slabs. The building has a large inner courtyard and is developed as a trapezoid on the four perimeter sides. Building (b) is used for shops on the ground floor and as a residential building on the other levels. It has a highly irregular plan and is characterised by load-bearing brick masonry walls. The investigations carried out did not reveal any recent structural interventions. The other buildings have many common features: they were made of load-bearing masonry, have at least four floors above ground, and were built between 1930 and 1960. The main differences are related to the configuration and the technology used to construct the floors (precast concrete or cast-in-situ reinforced slab). Table 10 shows the results of the Belgrade case study.

3.4. Results and Discussion

In most cases, cadastral plans, storey heights, and an on-site inspection (or photographs) were sufficient to carry out the expeditious assessment. Required documentation is usually readily available and it is not required to use advanced equipment or perform detailed surveys, although, in some cases, obtaining all the necessary information could still be difficult and time-consuming. Some challenges were encountered while surveying buildings with plaster because the correct implementation of the M.Q.I. was difficult. In those situations, or even where little or no material is available, it is possible to assume the building construction period, the most common construction techniques, and the surveyor’s experience. Furthermore, the approach is not accurate in the application on special structures (such as towers, campaniles, and churches), as it is designed to assess ordinary buildings such as residences, shops, etc. This method is particularly suitable for applications on a large scale when it is often not possible to find all the information. The loss of accuracy of the final results obtained in this way is partly compensated by the use of the categories (I to VI) associated with the index of structural response. The six categories are intended to simplify the outcome of verifications and to consider wide ranges of values, making inaccurate information input less significant.
The analysis of the study areas confirmed that the application of the method takes a few minutes per building (provided that the information was previously acquired) and gives sufficient time for the surveyor to derive the outputs and suggest structural intervention. The use of categories (I, II, III) simplifies the procedure, making it more user-friendly for operators with different cultural and educational backgrounds. The analysis of the options contained in the database, both in terms of proposed improvement measures and selected construction techniques, proved extensive enough to cover all the cases that arose in the application phases. In addition, the “notes” box allows the user to specify any details not present in the archive.
Figure 12 summarises the structural response categories recorded in the three case study areas. Analysis of the surveys form showed a good distribution of results, with an exception for the two extreme categories (I–VI). Category IV is the most populated (accounting for 43.8% of the results), followed by categories II and III (25%). Only a single case falls in category V. In general, the results showed that the Kaštela area appears to be the least susceptible to possible seismic actions, having recorded the highest structural behaviours (IV, III). In contrast, the Mirandola area showed generally poor structural responses (II and III).
The analysis of the out-of-plane kinematic mechanisms showed a good distribution of results: “vertical deflection” proved to be the most frequent (43.8%), followed by “horizontal deflection” (31.2%) and “cantonal overturning” (25%); while the kinematic mechanism of simple masonry overturning was not encountered.
The results of the M.Q.I. method highlighted the importance of the masonry quality concerning the outcome offered by the structural response index. In general, high masonry values (majority of categories A and B) were associated with high response categories (as observed in the Kaštela area).
A significant variety of construction techniques, seismic hazards, and seismic exposure of the buildings in the three study areas were encountered in the results of the expeditious method.

4. Validation of the Adriseismic Method

4.1. A Comparison of Traditional Seismic Analysis and Expeditious Method

The procedure was verified using seismic analysis results for a sample of 25 buildings from Italy to understand the method’s accuracy. The analysis results were compared with those obtained for the same constructions using the expeditious method. These buildings have different characteristics in terms of the construction period, the number of floors, plan articulation, the function of use, etc. Although limited in number, the sample covers a broad spectrum of structural types, but Appendix C lists the main characteristics.
The sample of structures, used for the validation, was analysed using two different methods: some buildings were assessed using the LV1 system [38] and others using multi-modal analysis. Multi-modal analysis is prescribed by Eurocode 8 and is one of the widely used methods, while the LV1 method is based on an Italian Directive and allows an expeditious assessment using a limited number of parameters. The validation aims to verify the results of the proposed expeditious method by comparing them with those obtained from a traditional analysis method and those obtained through an established expeditious method.
A result of the LV1 method is a seismic safety index (Is, ls), which is defined as the ratio between the return fundamental period of the seismic action that leads to the generic limit state and the corresponding reference period, which is calculated based on the code requirements. The Is value has a range from 0 (total inadequacy) to 1 (adequate) as a verification condition. This indicator is comparable to the index of structural response which is defined in the proposed Adriseismic method. The results obtained from the LV1 and from a traditional analysis method are based on the structural characteristics, the exposure (usually indicated as class of use), and seismic hazard at the site. On the other hand, the proposed method determines the structural response index based on the structural feature, and then the seismic risk is determined as a product of vulnerability, hazard, and exposure. However, the comparison of these results of the other two methods with the structural response index appears to be mathematically more effective than the estimated seismic risk determined.
The modal analysis applied to a structure produced a capacity/demand ration for each load-bearing element. This value is expressed in the same range as the index Is, ls of the LV1 method (values greater than 1 indicate satisfactory verifications). However, in the case of non-linear static analysis, there is no single parameter that summarises the global behaviour of the structure, but there are parameters for each load-bearing element. Therefore, the weighted average for all load-bearing elements, I m a , is considered comparable to the structural response index and can be determined as follows:
I m a = i = 1 n ( x i · p i ) i = 1 n p i

4.2. Results and Discussion

Table 11 shows the results from the traditional seismic analysis methods in terms of the two indices Ima and Is, which are compared with the structural response index for 25 buildings.
The last column shows the comparison between the values obtained from traditional analysis and the structural response index using the formula:
| 1 I s r I |
Figure 13 shows the same results in a graphical manner. For each building, the results for traditional analysis and the index of structural response obtained from the expeditious methods have been compared.
A comparison of sample buildings analysed using the LV1 method shows a similarity between the structural response index Isr and Is. There is an average variation of about 25% between the results of the traditional and the proposed expeditious method, with a standard deviation of 0.18. Furthermore, in most cases, the expeditious method gives more conservative results compared to the LV1.
These considerations excluded building no. 2 (M002) at this stage because the difference between the two results (expeditious and LV1) is small in terms of absolute value (0.22). At the same time, it is important from a relative point of view, and with such a small sample, that the outlier would have affected the outcome of the collected data.
An average variation of 25% and a standard deviation of (0.15) were obtained for comparison with modal analysis. Out of ten analysed buildings, only once did the expeditious method overestimate the capacity of the building to a very limited extent (6% higher). The aggregation of the two methods (LV1 and modal) gives an average variation of 25% and a standard deviation of 0.167.
There are no substantial differences between the two methods in terms of the variation in results proposed by the expeditious method, which gives good accuracy for a qualitative system. This confirms that the method allows for the identification of the most critical buildings, effectively indicating the ones which require a more in-depth analysis, thereby ensuring a more efficient use of resources. However, a larger building sample will have to be analysed before definitive conclusions can be established.

5. Conclusions

The research study presented in this paper was focused on the development of the Adriseismic method for expeditious seismic assessment of URM buildings. The proposed method was developed to mitigate seismic risk associated with urban heritage buildings in six countries located close to the Adriatic and Ionian Seas and is one of the key deliverables of the Adriseismic project.
The first phase of the study involved the development of the expeditious seismic assessment system, with a choice of input parameters and assigned numerical values. The expected seismic performance of the building was estimated based on the proposed methodology through a Microsoft Excel spreadsheet, and the output included masonry category, index of structural response, most probable collapse mechanism, and seismic risk level.
Subsequently, the method was applied in three heterogeneous urban areas, namely Mirandola (Italy), Kaštela (Croatia), and Belgrade (Serbia). In parallel, the method was validated on 25 sample buildings, which were previously evaluated using the LV1 method (expeditious assessment) and modal analysis (traditional seismic analysis). In this manner, the method was validated both in terms of its applicability and the accuracy of results. The validation showed an average variation of 25% and a standard deviation of 0.167 between the index of structural response and the indices Ima and Is. These encouraging results will need to be confirmed by increasing the number of sample buildings and analysing the results of damage kinematics and pushover analyses in order to assess the accuracy of the method.
The application of the method on selected buildings in three urban areas in different countries proved to be very important for testing the practical applicability of the procedure. The results showed that information required at the preliminary stage was almost always easy to obtain. It was found that in large-scale applications (a large number of buildings and limited input data), the loss of accuracy associated with the output was relatively low, e.g., a category II building tends to remain in the same category for small variations in input data; therefore, the use of categories (e.g., I, II, III, etc.), rather than a range of numerical values, makes it possible to limit the incidence of errors or inaccuracies in data collection. The distribution of the results and their variety, in terms of response classes, collapse mechanism, and seismic risk, seem consistent with the case studies. However, it is necessary to perform similar tests on a larger number of buildings and other urban areas in order to collect data related to the distribution of results and the size of the database, especially regarding the construction characteristics and seismic intervention techniques.
The final aspect of the expeditious method was related to recommended structural improvement measures, which enables the user to identify a deficiency in the building and make a preliminary suggestion for intervention.
In spite of the cultural and technical differences, the development of common seismic assessment procedures is the first step towards increasing cooperation in the partner countries involved in the Adriseismic project, which can lead towards a general mitigation of seismic risk by combining typical earthquake engineering procedures with urban planning systems.

Author Contributions

Conceptualisation, G.P. and L.S.; methodology, L.S. and G.P.; software, L.S. and G.P.; validation, G.P., L.S., M.M. and M.S.; formal analysis, L.S., G.P. and S.B.; investigation, L.S. and G.P.; resources, L.S. and G.P.; data curation, L.S., G.P. and S.B., writing—original draft preparation, L.S. and G.P.; writing—review and editing, S.B. and L.S.; visualisation, G.P.; supervision, G.P. and S.B.; project administration, G.P.; funding acquisition, G.P. All authors have read and agreed to the published version of the manuscript.

Funding

This research was funded by the Adriseismic project, of the programme Interreg ADRION “https://www.adrioninterreg.eu/ (accessed on 20 December 2022)”. INTERREG V-B ADRIATIC-IONIAN ADRION PROGRAMME 2014–2020: ADRISEISMIC 1019.

Data Availability Statement

Data regarding the expeditious method and validation are not available as they concern studies still in progress.

Acknowledgments

The authors would like to thank the Adriseismic project of the Interreg ADRION programme for the financial support.

Conflicts of Interest

The authors declare no conflict of interest.

Nomenclature

C o Corner overturning
C o , n Corner overturning, normalised
D u Designated use
E Exposure
E d Expected ductility
F n Floors number
g Thickness of mortar joints
H Seismic hazard
H b Horizontal bending
H b , n Horizontal bending, normalised
H j Horizontality of mortar bed joints
I Result obtained from traditional analysis (modal or LV1)
I h Irregularity in height
I m a Index derived from modal analysis
I n h Inter-floor height
I p Irregularity in plan
I s r Index of structural response
I v vulnerability index; (1/Is)
mAdditional mortar quality coefficient
M m Quality of mortar
M Q I v Quality masonry index for vertical actions
M Q I o p Quality masonry index for out-of-plane actions
M Q I i p Quality masonry index for in-plane actions
P a Thrusts due to arches and vaults
P f w Permanent floor weight
P i Structural element verification
P r Thrusts due to roofs
P s d Parameters influencing seismic demand
P s d , n Parameters influencing seismic demand, normalised
r Type of masonry units
S d Dimensions of the masonry units
S h Seismic risk
S m Mechanical characteristics and quality of masonry units
S m o Simple masonry overturning
S m o , n Simple masonry overturning, normalised
S s Shape of the masonry units
S w Stiffening wall distance
V b Vertical bending
V j Staggering of vertical mortar joints
V b , n Vertical bending, normalised
W c Level of connection between adjacent wall leaves/header
W t Wall thickness
x i Generic vertical element

Appendix A. Input Data

This section details all the inputs provided in the method divided by category, as seen in Table A1. In the first column is a brief description of the parameter; in the second is the values that can be entered. For the inputs that influence the final assessment results, the weights considered in the system are also shown.
Table A1. General data.
Name and DescriptionPossible Values
1Data
The date of compilation of the evaluation sheet is requested
dd/mm/yy
2Building Address
The address of the building under evaluation is required
Alphanumeric entry
3Presumed year of construction
The user can enter a year of construction of the building, or a period
Alphanumeric entry
4G.P.S. coordinatesCoordinates in WGS84 format
Table A2. Construction characteristics.
Name and DescriptionPossible Values
5Foundation
The prevailing type of foundation detected or assumed must be entered
Stepped foundation, engraved in the rock
Regular stone masonry foundation
Irregular stone masonry foundation
Stone rubble foundation with concrete binder
Brick masonry foundations
Continuous reinforced concrete foundations (strip footings)
Wooden piles
Reinforced concrete piles
Inverted beams foundation
Isolated footing
Slab foundation
6Masonry
The prevailing type of masonry detected or assumed must be entered
Rubble stone masonry
Rubble masonry with regular-sized stones
Rubble masonry with bricks
Cut stone with good bonding
Masonry in rammed earth blocks
Tuff masonry
Dressed rectangular (ashlar) stone masonry
Solid brick masonry with lime mortar
Solid brick masonry with cement mortar
Masonry in brick or cement blocks with cement mortar
Reinforced masonry with distribution reinforcement
Confined masonry with concentrated reinforcement
Timber-reinforced masonry
7Floors
The prevailing type of floor detected or assumed must be entered
Single or double timber floors (beams and joists) with a simple wooden plank
Single or double timber floors (beams and joists) with brick tiles
Floors with metal beams and vaults made with brick tiles
Floors with metal beams and hollow bricks
Brick vaults
Stone vaults
Cast-in-situ reinforced concrete slab
Hollow clay block floor without a reinforced concrete slab
Hollow clay block floor with reinforced concrete slab
Prefabricated reinforced concrete floor
Hollow brick floor with prefabricated joists
8Roof
The prevailing type of roof detected or assumed must be entered
Single or double timber floors (beams and joists) with a simple wooden plank
Single or double timber floors (beams and joists) with brick tiles
Floors with metal beams and vaults made with brick tiles
Floors with metal beams and hollow bricks
Brick vaults
Stone vaults
Cast-in-situ reinforced concrete slab
Hollow clay block floor without a reinforced concrete slab
Hollow clay block floor with reinforced concrete slab
Prefabricated reinforced concrete floor
Hollow brick floor with prefabricated joists
9Notes on input
Space is left to allow for specifications on the building under investigation
Alphanumeric entry
Table A3. Masonry characteristics.
Name and DescriptionPossible ValuesWeight Attributed by the System
Vertical LoadsOut-of-Plane ActionsIn-Plane Actions
10Type of masonry units
The values are assigned according to the choice of quality of mortar (N.F., P.F., F.)
Stone111
BrickN.F.  0.2
P.F.  0.6
F    1
1
1
1
0.1
0.85
1
11Horizontality of mortar bed jointsN.F.000
P.F.110.5
F.221
12Level of connection between adjacent wall leaves/headerN.F.000
P.F.11.51
F.132
13Shape of the masonry unitsN.F.000
P.F.1.511
F.322
14Staggering of vertical mortar jointsN.F.000
P.F.0.50.51
F.112
15Dimensions of the masonry unitsN.F.000
P.F.0.50.51
F.112
16Quality of mortarN.F.000
P.F.0.50.51
F.212
17Mechanical characteristics and quality of masonry unitsN.F.0.30.50.3
P.F.0.70.70.7
F.111
18Thickness of mortar jointsLarge0.70.70.7
Standard111
19Additional mortar quality coefficientPoor0.70.70.7
Standard111
Table A4. Building characteristics.
Name and DescriptionPossible ValuesWeight Attributed by the System
20Designated useResidential0.15
Commercial0.12
Public0.00
21Floors above ground10.11
20.00
30.00
40.01
50.20
22Irregularity in planI0
II1.5
III3
23Irregularity in heightI0.25
II0.12
III0.00
24Expected ductilityI0.00
II0.33
III0.67
25Connections between structural elementsOnThe parameter is not associated with a specific value but directly influences the formula used to define the index of structural response, as will be illustrated in the dedicated section
Off
Table A5. Building characteristics (kinematics).
Name and DescriptionPossible ValuesWeight Attributed by the System
Simple Masonry OverturningVertical BendingHorizontal BendingCorner Overturning
26Transversal wall distanceI0.000.001.000.00
II0.000.000.500.00
III0.000.000.000.00
27Wall thicknessI0.000.000.000.00
II0.500.500.500.50
III1.001.001.001.00
28Floor heightI1.001.001.001.00
II0.500.500.500.50
III0.000.000.000.00
29Permanent floor weightsI0.001.000.000.00
II0.000.500.000.50
III0.000.000.001.00
30Thrusts due to arches and vaultsI1.001.001.000.00
II0.500.500.500.00
III0.000.000.000.00
31Thrusts due to the roofI1.000.000.001.00
II0.500.000.000.50
III0.000.000.000.00
Table A6. Site data.
Name and DescriptionPossible ValuesWeight Attributed by the System
Ag/g
This is the ratio between the design ground acceleration, on type A soil, and the gravity acceleration
Numerical valueThe number entered is replicated
Ground type
The soil type is required according to the guidelines of Eurocode 8 Part 1, chapter 3.2.1. it is possible to enter a category from A to E (type 2 elastic spectrum)
A, B, C, D, EA = 1.0; B = 1.35; C = 1.50; D = 1.80; E = 1.60
Building exposure
The exposure is assessed using the importance classes given in Table 4.3 of Eurocode 8, Part 1
I, II, III, IVI = 0.8; II = 1.0; III = 1.20; IV = 1.40

Appendix B. Building Characteristics

The values are derived from simplified formulations or general schematisation, defined with the specific purpose of evaluating the variation in output parameters due to the variation in input parameters. Sometimes it was analysed how a single parameter could influence the seismic demand and, other times, the structural response. The complexity of studying these variations in virtual situations (e.g., it is unlikely that in reality, one would see an increase in loads, hence greater mass, without an increase in the masonry section, thus an increase in seismic capacity) required a certain flexibility in the interpretation of the results, at the expense of rigorous formulations. General considerations for defining the weights of certain input parameters are summarised next:
  • Designated use: The parameter considers the typical loads assigned by Eurocode 1 [54]. Specifically, residential (200 Kg/sm), commercial (300 Kg/sm), and public (400 Kg/sm) were evaluated. Starting from invariant permanent loads, the mass variation was analysed using the coefficients provided for the seismic combination, Eurocode 8. The values were then correlated to obtain the percentage of variation relative to each other. The worst parameter for structural response (Public) was given a value of 0; the other two were higher than the first (Commercial 0.12 and Residential 0.15).
  • Floors above ground: The analysis of the variation in the structural response as the number of storeys varied imposed several parallel considerations. Firstly, the seismic design action was determined using the formula: S q = S e · W / q .
    Where Se is the spectral acceleration, assumed by imagining the building located in Bologna on ground A (the period is that resulting from the simplified formula in Section 4.3.2.2 of Eurocode 8), the mass depends on the number of floors, with fixed dead and live loads. The behaviour factor varies according to the structure’s greater or lesser dissipative capacity.
Secondly, the response capacity of the building was determined using the simplified Mohr–Coulomb criterion [55], using the quality of the masonry “solid brick and lime mortar” as an unchanging parameter [56] and the thickness of the resisting panels (24 cm, 24 cm, 36 cm, 36 cm, and 48 cm, respectively) as a factor dependent on the number of floors. The values used in the method are the result of the capacity–demand ratio performed for each storey, then correlated with each other to provide, as for the designated use, the percentage of variation in one concerning the other (the worst always have value 0).
It is evident that the weights obtained result from choices made in advance and that different options could have led to slightly different results. Although considerations may be made in the future to make the procedure less dependent on specific decisions, it is nevertheless believed that the values provided can provide a guideline for expeditious analyses.
3.
Irregularity in plan: The values derived from the indications given in paragraph 7.3.1 of Italian NTC [57], regarding determining the behaviour factor as the greater or lesser regularity in the plan of a building varies. Again, the three results obtained were correlated by formulating them as percentage variations (the less regular building has a value of 0; the regular one, 0.26). The Italian standard was used because no specific references were found in the European one.
4.
Irregularity in height: The computation was carried out using Section 9.3 of Eurocode 8, part 1, in which guidance is given on reducing the q-factor by 20% for buildings that are not regular in height. This resulted in: regular buildings = 1.0, partially regular = 0.9, and irregular = 0.8. Using the formula, already used for the other parameters, to correlate the three values: v i = 1 v a l i v a l m i n where vali denotes the generic value and valmin the lowest of the three; the three weights of 0 (worst case), 0.12, and 0.25 were obtained.
5.
Expected ductility: For masonry buildings, it was assumed that the behaviour factor could be numerically equal to: (1.5; 2.0; 2.5). The three weights were obtained using the same procedure as illustrated above (and the same formula for correlating the values), which were then implemented in the expeditious method (0.0; 0.33; 0.67). The value 0 was attributed to the worst category (I) and 0.67 to the best (III).
6.
Connections between structural elements: As already specified, the parameter is not associated with any specific numerical value, and its presence influences the formulae used in calculating the structural response index.

Appendix C. Summary of Building Characteristics

Appendix C shows the main characteristics of the 25 buildings analysed.
Table A7. Main characteristics of the sample buildings.
Building
Code
Period
of Construction
Designed
Use
Height
(Number of Storeys)
Type
of Masonry
Type
of Floor System
M0011930–40Public3Solid brick masonry with lime mortarHollow clay block floor without reinforced concrete slab
M0021900–1910Residential5Solid brick masonry with lime mortarFloors with metal beams and vaults made with brick tiles
M003Before 1900Residential3Rubble stone masonryFloors with metal beams and vaults made with brick tiles
M004Before 1900Residential2Rubble stone masonryFloors with metal beams and vaults made with brick tiles
M0051940Public4Solid brick masonry with lime mortarHollow clay block floor without reinforced concrete slab
M0061940Public4Solid brick masonry with lime mortarHollow brick floor with prefabricated joists
M007Before 1900Public4Solid brick masonry with lime mortarFloors with metal beams and vaults made with brick tiles
M008Before 1900Public4Solid brick masonry with lime mortarCast-in-situ reinforced concrete slab
M009Before 1900Public1Solid brick masonry with lime mortarBrick vaults
M0101920–1930Residential4Solid brick masonry with lime mortarHollow clay block floor without reinforced concrete slab
M011Before 1900Public4Solid brick masonry with lime mortarHollow brick floor with prefabricated joists
M012Before 1900Public3Solid brick masonry with lime mortarSingle or double timber floors (beams and joists) with brick tiles
M013Before 1900Public3Solid brick masonry with lime mortarCast-in-situ reinforced concrete slab
M0141930Public2Solid brick masonry with lime mortarCast-in-situ reinforced concrete slab
M015Before 1900Public3Solid brick masonry with lime mortarFloors with metal beams and vaults made with brick tiles
M016Before 1900Public3Rubble masonry with bricksBrick vaults
M017Before 1900Public3Rubble masonry with bricksBrick vaults
M018Before 1900Public3Rubble masonry with bricksBrick vaults
M019Before 1900Public4Solid brick masonry with lime mortarHollow clay block floor without reinforced concrete slab
M020Before 1900Public3Solid brick masonry with lime mortarBrick vaults
M021Before 1900Public4Solid brick masonry with lime mortarHollow clay block floor without reinforced concrete slab
M022Before 1900Public4Solid brick masonry with lime mortarSingle or double timber floors (beams and joists) with brick tiles
M023Before 1900Public3Solid brick masonry with lime mortarSingle or double timber floors (beams and joists) with brick tiles
M024Before 1900Public2Rubble masonry with bricksHollow clay block floor without reinforced concrete slab
M025Before 1900Public4Solid brick masonry with lime mortarHollow clay block floor without reinforced concrete slab

References

  1. Albini, P. A survey of the past earthquakes in the Eastern Adriatic (14th to early 19th century). Ann. Geophys. 2004, 47, 675–703. [Google Scholar]
  2. D’Agostino, N.; Avallone, A.; Cheloni, D.; D’Anastasio, E.; Mantenuto, S.; Selvaggi, G. Active tectonics of the Adriatic region from GPS and earthquake slip vectors. J. Geophys. Res. Solid Earth 2008, 13, B12413. [Google Scholar] [CrossRef]
  3. Cao, X.Y.; Shen, D.; Feng, D.C.; Wang, C.L.; Qu, Z.; Wu, G. Seismic retrofitting of existing frame buildings through externally attached sub-structures: State of the art review and future perspectives. J. Build. Eng. 2022, 57, 104904. [Google Scholar] [CrossRef]
  4. Bilgin, H.; Shkodrani, N.; Hysenlliu, M.; Ozmen, H.B.; Isik, E.; Harirchian, E. Damage and performance evaluation of masonry buildings constructed in 1970s during the 2019 Albania earthquakes. Eng. Fail. Anal. 2022, 131, 105824. [Google Scholar] [CrossRef]
  5. Papadimitriou, P.; Kapetanidis, V.; Karakonstantis, A.; Spingos, I.; Kassaras, I.; Sakkas, V.; Kouskouna, V.; Karatzetzou, A.; Pavlou, K.; Kaviris, G.; et al. First Results on the Mw=6.9 Samos Earthquake of 30 October 2020. Bull. Geol. Soc. Greece 2020, 56, 251–279. [Google Scholar] [CrossRef]
  6. Vlachakis, G.; Vlachaki, E.; Lourenço, P. Learning from failure: Damage and Failure of Masonry Structures, after the 2017 Lesvos Earthquake (Greece). Eng. Fail. Anal. 2020, 117, 104803. [Google Scholar] [CrossRef]
  7. Stepinac, M.; Lourenço, P.; Atalić, J.; Kišiček, T.; Uroš, M.; Baniček, M.; Novak, M.Š. Damage classification of residential buildings in historical downtown after the ML5.5 earthquake in Zagreb, Croatia in 2020. Int. J. Disaster Risk Reduct. 2021, 56, 102140. [Google Scholar] [CrossRef]
  8. Moretić, A.; Stepinac, M.; Lourenço, P.B. Seismic upgrading of cultural heritage—A case study using an educational building in Croatia from the historicism style. Case Stud. Constr. Mater. 2022, 17, e01183. [Google Scholar] [CrossRef]
  9. D. o. A. University of Bologna. Report on the State of the Art in Adriseismic Partner Countries Regarding Techniques of Interventions for Reducing Seismic Vulnerability-Deliverable D.T.2.1.2; Adriseismic Project; University of Bologna: Bologna, Italy, 2021. [Google Scholar]
  10. Moustafa, M.K.; Fadzli, M.N.; Ehsan, N.F. The seismic vulnerability assessment methodologies: A state-of-the-art review. Ain Shams Eng. J. 2020, 11, 849–864. [Google Scholar]
  11. Calvi, G.; Pinho, R.; Bommer, J.; Restrepo-Véléz, L.; Crowley, H. Development of seismic vulnerability assessment methodologies over the past 30 years. ISET J. Earthq. Technol. 2006, 43, 75–104. [Google Scholar]
  12. De Luca, F.; Verderama, G.M.; Manfredi, G. Analytical versus observational fragilities: The case of Pettino (L’Aquila) damage data database. Bull. Earthq. Eng. 2015, 13, 1161–1181. [Google Scholar] [CrossRef] [Green Version]
  13. D’Altri, A.; Sarhosis, V.; Milani, G.; Rots, J.; Cattari, S.; Lagomarsino, S.; Sacco, E.; Tralli, A.; Castellazzi, G.; De Miranda, S. Modeling Strategies for the Computational Analysis of Unreinforced Masonry Structures: Review and Classification. Arch. Comput. Methods Eng. 2020, 27, 1153–1185. [Google Scholar] [CrossRef]
  14. Rota, M.; Penna, A.; Magenes, G. A methodology for deriving analytical fragility curves for masonry buildings based on stochastic nonlinear analyses. Eng. Struct. 2010, 32, 1312–1323. [Google Scholar] [CrossRef]
  15. Whitman, R.; Reed, J.; Hong, S. Earthquake Damage Probability Matrices. In Proceedings of the Fifth World Conference on Earthquake Engineering, Italy, Rome, 25–29 June 1973. [Google Scholar]
  16. Braga, F.; Dolce, M.; Liberatore, D. A Statistical Study on Damaged Buildings and an Ensuing Review of the MSK-76 Scale. In Proceedings of the Seventh European Conference on Earthquake Engineering, Athens, Greece, 20–25 September 1982. [Google Scholar]
  17. Medvedev, S.V. Seismic intensity scale M.S.K.—76; Publications of the Institute of Geophysics, Polish Academy of Sciences: Warsaw, Poland, 1977; Volume A-6, p. 117. [Google Scholar]
  18. Giovinazzi, S.; Lagomarsino, S. A macroseismic method for the vulnerability assessment of buildings. In Proceedings of the 13th World Conference on Earthquake Engineering, Vancouver, BC, Canada, 1–6 August 2004. [Google Scholar]
  19. Oliveira, C.; Ferreira, M.; de Sá, F.M. Seismic Vulnerability and Impact Analysis: Elements for Mitigation Policies. In Proceedings of the XI Congresso Nazionale on L’ingegneria Sismica in Italia, Genova, Italy, 25–29 January 2004. [Google Scholar]
  20. Lantada, N.; Pujades, L.; Barbat, A. Risk Scenarios for Barcelona, Spain. In Proceedings of the 13th World Conference on Earthquake Engineering, Vancouver, BC, Canada, 1–6 August 2004. [Google Scholar]
  21. Oliveira, C.; de Sá, F.M.; Ferreira, M. Application of Two Different Vulnerability Methodologies to Assess Seismic Scenarios in Lisbon. In Proceedings of the International Conference: 250th Anniversary of the 1755 Lisbon Earthquake, Lisbon, Portugal, 1–4 November 2005. [Google Scholar]
  22. Federal Emergency Management Agency. FEMA, 154: Rapid Visual Screening of Buildings for Potential Seismic Hazards: A Handbook; Applied Technology Council: Redwood City, CA, USA, 2015.
  23. Otani, S. Seismic Vulnerability Assessment Methods for Buildings in Japan. Earthq. Eng. Eng. Seism. 2000, 2, 47–56. [Google Scholar]
  24. Hassan, A.; Sozen, M.A. Seismic vulnerability assessment of low-rise buildings in regions with infrequent earthquakes. ACI Struct. J. 1997, 94, 31–39. [Google Scholar]
  25. Allen, D.E.; Rainer, J.H. Guidelines for the seismic evaluation of existing buildings. Can. J. Civ. Eng. 1995, 22, 500–505. [Google Scholar] [CrossRef]
  26. Bernardini, A.; Gori, R.; Modena, C. Application of Coupled Analytical Models and Experimental Knowledge to Seismic Vulnerability Analyses of Masonry Buildings. In Engineering Damage Evaluation and Vulnerability Analysis of Building Structures; Omega Scientific: Tarzana, CA, USA, 1990. [Google Scholar]
  27. D’Ayala, D.; Speranza, E. An Integrated Procedure for the Assessment of Seismic Vulnerability of Historic Buildings. In Proceedings of the 12th European Conference on Earthquake Engineering, London, UK, 9–13 September 2002. [Google Scholar]
  28. Calvi, G.M. A displacement-based approach for vulnerability evaluation of classes of buildings. J. Earthq. Eng. 1999, 3, 411–438. [Google Scholar] [CrossRef]
  29. Restrepo-Vélez, L.; Magenes, G. Simplified Procedure for the Seismic Risk Assessment of Unreinforced Masonry Buildings. In Proceedings of the 13th World Conference on Earthquake Engineering, Vancuver, BC, Canada, 1–6 August 2004. [Google Scholar]
  30. Restrepo-Vélez, L. A Simplified Mechanics-Based Procedure for the Seismic Risk Assessment of Unreinforced Masonry Buildings. Ph.D. Thesis, European School for Advanced Studies in Reduction of Seismic Risk, Pavia, Italy, 2005. [Google Scholar]
  31. Modena, C.; Lourenço, P.; Roca, P. Structural Analysis of Historical Constructions—Possibilities of Numerical and Experimental Techniques; Taylor and Francis: London, UK, 2005. [Google Scholar]
  32. Grünthal, G. European Macroseismic Scale 1998; Centre Europèen de Géodynamique et de Séismologi: Luxemburg, 1998. [Google Scholar]
  33. Cao, X.Y.; Feng, D.C.; Li, Y. Assessment of various seismic fragility analysis approaches for structures excited by non-stationary stochastic ground motions. Mech. Syst. Signal Process. 2023, 186, 109838. [Google Scholar] [CrossRef]
  34. Borri, A.; De Maria, A. Il metodo IQM per la stima delle caratteristiche meccaniche delle murature: Allineamento alla circolare n. 7/2019. In Proceedings of the XVIII Convegno ANIDIS L’ingegneria sismica in Italia, Ascoli Piceno, Italy, 15–19 September 2019. [Google Scholar]
  35. Borri, A.; Corradi, M.; De Maria, A.; Sisti, R. Calibration of a visual method for the analysis of the mechanical properties of historic masonry. Procedia Struct. Integr. 2018, 11, 418–427. [Google Scholar] [CrossRef]
  36. Adriseismic Project—Interreg ADRION, Interreg ADRION. 2022. Available online: https://adriseismic.adrioninterreg.eu/ (accessed on 20 December 2022).
  37. Predari, G.; Stefanini, L.; Santangelo, A.; Marzani, G. A strategic-multidisciplinary approach to reduce the seismic risk. Ongoing activities within the ADRISEISMIC project. Bologna, 2022; in press. [Google Scholar]
  38. S. G. Consiglio Superiore dei Lavori Pubblici. Linee Guida per la Valutazione e Riduzione del Rischio Sismico del Patrimonio Culturale Allineate Alle Nuove Norme Tecniche per le Costruzioni (d.m. 14 Gennaio 2008); S. G. Consiglio Superiore dei Lavori Pubblici: Roma, Italy, 2011.
  39. Predari, G.; Stefanini, L. The ADRISEISMIC Project: A survey on the building techniques. In Colloqui.At.e 2022—Memoria ed Innovazione; Enrico Dassori and Renata Morbiducci: Genova, Italy, 2022. [Google Scholar]
  40. EN 1998-1; Design of Structures for Earthquake Resistance—Part 1: General Rules, Seismic Actions and Rules for Buildings. The European Committee for Standardization (CEN): Bruxelles, Belgium, 2004.
  41. EN 1998-3; Design of Structures for Earthquake Resistance—Part 3: Assessment and Retrofitting of Buildings. The European Committee for Standardization (CEN): Bruxelles, Belgium, 2005.
  42. Ministero Delle Infrastrutture e della Mobilità. Decreto del Ministero delle Infrastrutture e dei Trasporti n. 58 del 28/02/2017; Consiglio Superiore dei Lavori Pubblici: Roma, Italy, 2017.
  43. Decreto del Commisario Delegato per gli Interventi di Protezione Civile n.28 del 10 Aprile 2002, Repertorio dei Meccanismi di Danno, Delle Tecniche di Intervento e dei Relativi Costi Negli Edifici in Muratura, Regione Marche; ITC-CNR: L’Aquila, Italy, 1997.
  44. D’Ayala, D.F.; Speranza, E. Identificazione dei meccanismi di collasso per la stima della vulnerabilita’sismica di edifici in centri storici. In Proceedings of the Conference L’ingegneria Sisimica in Italia, Torino, Italy, 20–23 September 1999. [Google Scholar]
  45. ReLuis. Applicativo per le Verificazioni Sismiche dei Meccanismi di Colasso Locali Fuori Piano Negli Edifici Esistenti in Muratura Mediante Analisi Cinematica Lineare; ReLuis: Napoli, Italy, 2009. [Google Scholar]
  46. Office of the United Nations Disaster Relief Coordinator (Undro). Natural Disasters and Vulnerability Analysis—Report on Expert Group Meeting; UNDRO: Genova, Italy, 1979. [Google Scholar]
  47. Government of Croatia. World Bank Report: Croatia Earthquake–Rapid Damage and Needs Assessment; Government of Croatia: Zagreb, Croatia, 2020.
  48. Galić, J.; Vukić, H.; Andrić, D.; Stepinac, L. Priručnik za Protupotresnu Obnovu Postojećih Zidanih Zgrada; Arhitektonski Fakultet: Zagreb, Croatia, 2020. [Google Scholar]
  49. Kišiček, T.; Stepinac, M.; Renić, T.; Hafner, I.; Lulić, L. Strengthening of masonry walls with FRP or TRM. Građevinar 2020, 72, 937–953. [Google Scholar]
  50. Tehnički Propis o Izmjeni i Dopunama Tehničkog Propisa za Građevinske Konstrukcijetehnički Propis o Izmjeni i Dopunama Tehničkog Propisa za Građevinske Konstrukcije. 29 June 2021. Available online: https://narodne-novine.nn.hr/clanci/sluzbeni/2020_07_75_1448.html (accessed on 20 December 2022).
  51. Stepinac, M.; Skokandić, D.; Ožić, K.; Zidar, M.; Vajdić, M. Condition Assessment and Seismic Upgrading Strategy of RC Structures—A Case Study of a Public Institution in Croatia. Buildings 2022, 12, 1489. [Google Scholar] [CrossRef]
  52. Kuula. 30 November 2022. Available online: https://kuula.co/share/NPrhh/collection/7ktnT?logo=1&info=1&fs=1&vr=0&zoom=1&autorotate=0.45&autop=30&thumbs=1 (accessed on 20 December 2022).
  53. Marović, M.; Djoković, I.; Pesić, L.; Radovanović, S.; Toljić, M.; Gerzina, N. Neotectonics and seismicity of the southern margin of the Pannonian basin in Serbia. Stephan Mueller Spec. Publ. Ser. 2002, 3, 277–295. [Google Scholar] [CrossRef]
  54. EN 1991-1-1; Actions on Structures—Part 1-1: General Actions—Densities, Self-Weight, Imposed Loads for Buildings. The European Committee for Standardization (CEN): Bruxelles, Belgium, 2002.
  55. EN 1996-1-1; Design of Masonry Structures–Part 1-1: General Rules for Reinforced and Unreinforced Masonry Structures. The European Committee for Standardization (CEN): Bruxelles, Belgium, 2005.
  56. Il Ministero Delle Infratrutture e Dei Trasporti. CIRCOLARE 21 Gennaio 2019, n. 7 C.S.LL.PP—Istruzioni per L’applicazione Dell’«Aggiornamento Delle “Norme Tecniche per le Costruzioni”» di cui al Decreto Ministeriale 17 Gennaio 2018; Il Ministero Delle Infrastrutture e Dei Trasporti: Roma, Italy, 2019.
  57. Il Ministero Delle Infrastrutture e Dei Trasporti. DECRETO 17 Gennaio 2018—Aggiornamento Delle «Norme Tecniche per le Costruzioni»; Il Ministero Delle Infrastrutture e Dei Trasporti: Roma, Italy, 2018.
Figure 1. General structure of the proposed Adriseismic method, showing macro-phases and intermediate steps.
Buildings 13 00344 g001
Figure 2. Adriseismic method: (a) assessment form, generated via a Microsoft Excel spreadsheet, showing input data and output (results), and (b) a diagram showing the main input categories (note that the processing phase is shown in grey).
Buildings 13 00344 g002
Figure 3. Masonry failure mechanisms—(a) masonry disintegration, (b) out-of-plane kinematic mechanism, and (c) in-plane failure.
Buildings 13 00344 g003
Figure 4. Interventions classified based on the main material and type (localised and extensive).
Buildings 13 00344 g004
Figure 5. A view of the Mirandola case study site and the three buildings analysed.
Buildings 13 00344 g005
Figure 6. Selected buildings in Mirandola, Italy: (a) Building 1, (b) Building 2, and (c) Building 3; © Google.
Buildings 13 00344 g006
Figure 7. A view of Kaštela case study site and the five buildings analysed.
Buildings 13 00344 g007
Figure 8. Selected five buildings for the Kaštela study area. Elevations photographed or reconstructed by photogrammetry.
Buildings 13 00344 g008
Figure 9. Plan view of the point cloud showing camera stations.
Buildings 13 00344 g009
Figure 10. Belgrade case study and the eight buildings analysed.
Buildings 13 00344 g010
Figure 11. The buildings assessed for the Belgrade study; © Google.
Buildings 13 00344 g011
Figure 12. The index of structural response for the three study areas.
Buildings 13 00344 g012
Figure 13. Results of the validation—traditional vs. expeditious methods.
Buildings 13 00344 g013
Table 1. Input parameters: main values.
Building Characteristics MQI
ILow ValueN.F.Not fulfilled
IIMedium ValueP.F.Partially fulfilled
IIIHigh ValueF.Fulfilled
Table 2. Index of structural response: categories and values.
ClassMinimum ValueMaximum Value
I0.000.20
II0.210.40
III0.410.55
IV0.560.70
V0.710.85
VI0.861.00
Table 3. Building characteristics related to out-of-plane mechanisms and the corresponding weights attributed.
Name and DescriptionInputWeights Attributed to Kinematic Mechanism
Simple Masonry OverturningVertical BendingHorizontal BendingCorner Overturning
Transversal wall distanceI0.000.001.000.00
II0.000.000.500.00
III0.000.000.000.00
Wall thicknessI0.000.000.000.00
II0.500.500.500.50
III1.001.001.001.00
Floor heightI1.001.001.001.00
II0.500.500.500.50
III0.000.000.000.00
Permanent floor weightsI0.001.000.000.00
II0.000.500.000.50
III0.000.000.001.00
Thrusts due to arches and vaultsI1.001.001.000.00
II0.500.500.500.00
III0.000.000.000.00
Thrusts due to the roofI1.000.000.001.00
II0.500.000.000.50
III0.000.000.000.00
Table 4. Masonry categories and M.Q.I. values.
Load ActionMasonry CategoriesMinMax
MQIv—Vertical actionA0.501.00
B0.250.499
C0.000.249
MQIop—Horizontal out-of-plane actionA0.701.00
B0.400.699
C1.000.399
MQIip—Horizontal in-plane actionA0.501.00
B0.300.499
C0.000.299
Table 5. Seismic risk categories and values.
CategoriesMinMax
Very high1.40
High0.901.39
Medium0.450.89
Low0.100.44
None0.000.09
Table 6. Seismic retrofitting intervention.
Name and DescriptionPossible Values
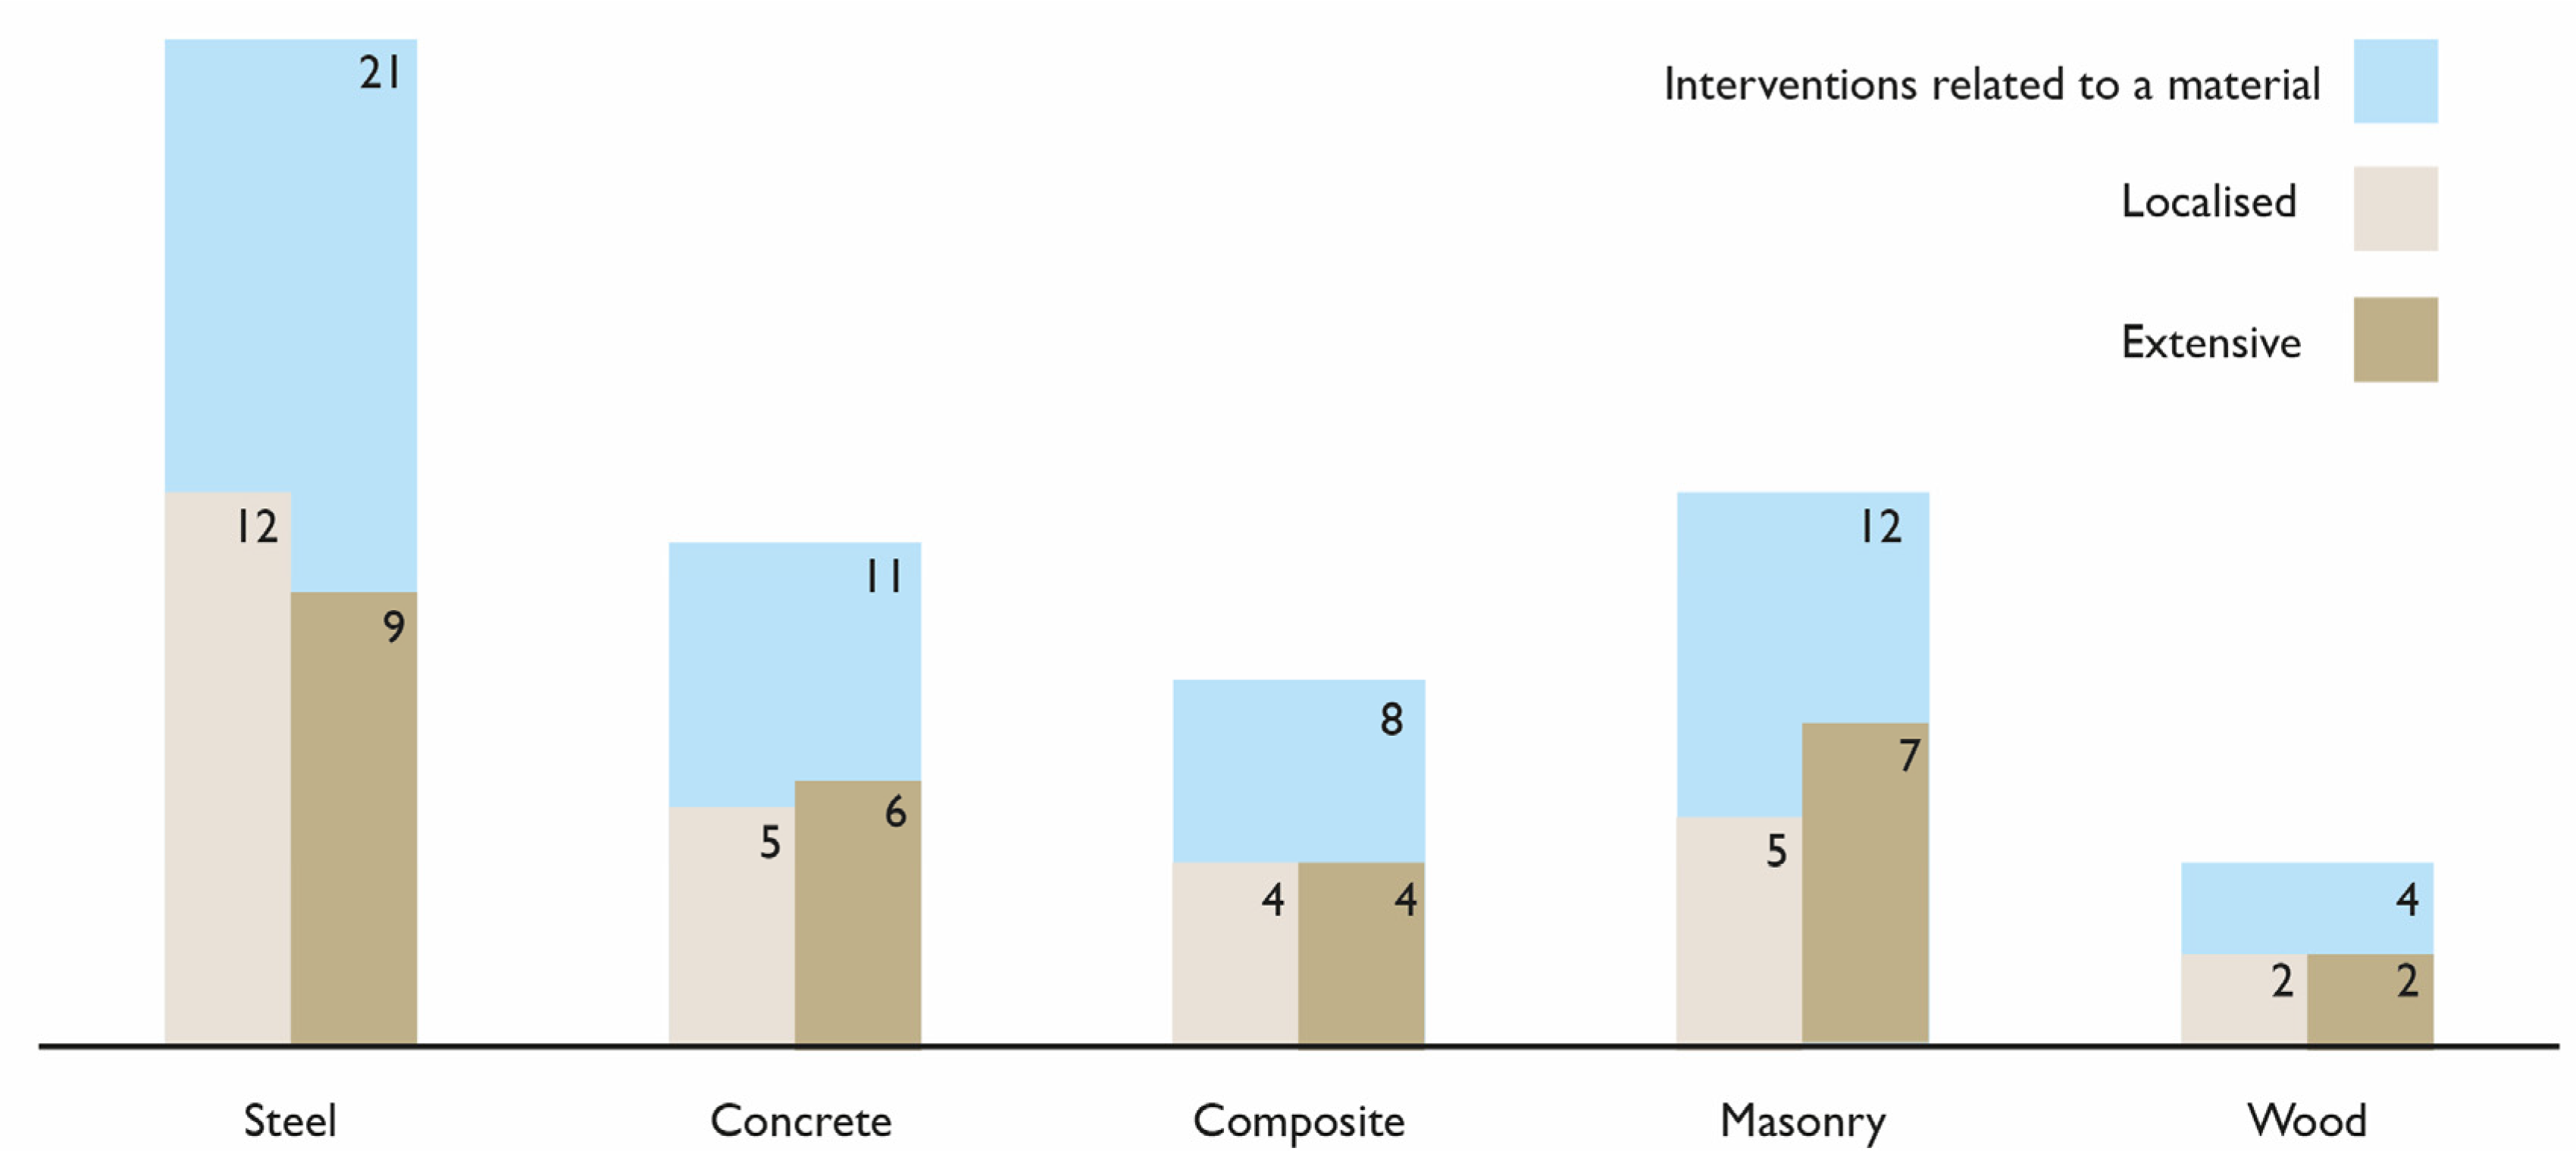
Extent of intervention
(How extensive the intervention is)
Extensive, localised, none
Material preference
(Main material used for the retrofitting)
Concrete, composite (fibre-reinforced polymers), masonry, wood, steel
Table 7. Qualitative indicators for seismic retrofitting.
Indications ProvidedRange of Values
CostLow/medium/high
Technical complexityLow/medium/high
ExplanationA brief summary of seismic deficiencies addressed by the intervention
Table 8. Result of the evaluation of buildings in Mirandola.
Building CodeIndex of Structural ResponseMasonry CategoriesMost Probable Collapse MechanismSeismic RiskSeismic Risk Category
Building aII (0.35)B, B, ACantonal Overturning0.60Medium
Building bIII (0.54)A, A, CDisintegration0.39Low
Building cII (0.32)A, A, AHorizontal deflection0.66Medium
Table 9. Results of evaluation of building around the Podvorje square.
Building IDIndex of Structural ResponseMasonry CategoriesMost Probable Collapse MechanismSeismic RiskSeismic Risk Category
Building aIII (0.43)A, B, AHorizontal deflection0.59Low
Building bIV (0.68)A, A, AHorizontal deflection0.37Low
Building cIV (0.56)A, B, AVertical deflection0.45Low
Building dIII (0.45)A, B, BHorizontal deflection0.56Low
Building eIV (0.65)A, A, AHorizontal deflection0.39Low
Table 10. Result of the evaluation of buildings in Belgrade, Serbia.
Building IDIndex of Structural ResponseMasonry CategoriesMost Probable Collapse MechanismSeismic RiskSeismic Risk Category
Building aIII (0.43)B, A, AVertical Deflection0.42Low
Building bII (0.33)B, A, ACantonal Overturning0.33Medium
Building cIV (0.67)A, A, AVertical Deflection0.22Low
Building dIV (0.65)A, A, AVertical Deflection0.23Low
Building eIV (0.67)A, A, AVertical Deflection0.22Low
Building fII (0.33)B, A, ACantonal Overturning0.45Low
Building gV (0.72)A, A, AVertical Deflection0.21Low
Building hIV (0.59)A, A, AVertical Deflection0.25Low
Table 11. Results of the validation—traditional vs. expeditious methods.
Building ID
(1)
Type of Analysis
(2)
Results from Traditional Analysis, Ima, and Is (3)Index of Structural Response, Isr (4)Vulnerability Category (5)|1 − Isr/I|
(6)
M001LV10.850.74V0.13
M002LV10.020.24II11.00
M003LV10.350.25II0.29
M004LV10.370.23II0.38
M005LV10.380.25II0.34
M006LV10.380.25II0.34
M007LV10.510.46III0.10
M008LV10.340.34II0.00
M009LV10.100.17I0.70
M010LV10.340.38II0.12
M011LV10.270.34II0.26
M012LV10.360.38II0.06
M013LV10.510.40III0.22
M014LV10.480.42III0.13
M015LV10.770.43III0.44
M016Modal0.260.23II0.12
M017Modal0.510.28II0.45
M018Modal0.330.32II0.03
M019Modal0.820.78V0.05
M020Modal0.420.28II0.33
M021Modal0.280.34II0.21
M022Modal0.630.34II0.46
M023Modal0.690.48III0.30
M024Modal0.970.75V0.23
M025Modal0.920.63IV0.32
Disclaimer/Publisher’s Note: The statements, opinions and data contained in all publications are solely those of the individual author(s) and contributor(s) and not of MDPI and/or the editor(s). MDPI and/or the editor(s) disclaim responsibility for any injury to people or property resulting from any ideas, methods, instructions or products referred to in the content.

