1. Introduction
In 2020, Croatia was hit by two strong earthquakes that caused significant property damage to tens of thousands of buildings and to the essential infrastructure. The first strong earthquake, measuring 5.5 on the Richter scale, occurred on Sunday, 22 March 2020, predominantly affecting the capital city of Zagreb [
1,
2]. Just nine months after this earthquake, a devastating earthquake measuring 6.2 on the Richter scale occurred near the town of Petrinja on 29 December 2020. The highest intensity was given as VIII on the EMS scale. The greatest building damage, including the complete collapse of several buildings, occurred in Petrinja, and significant property damage was recorded in the neighboring towns of Sisak and Glina, as well as in the wider area of Sisak-Moslavina County. Due to the force of the impact, the earthquake also caused damage to buildings in neighboring counties, including progressive damage to buildings damaged in the Zagreb earthquake [
3].
These two major earthquakes occurred in the region of northwestern Croatia, the seismic activity of which is described as moderate, with rare occurrences of strong events, but highly vulnerable due to the economic importance and concentration of population centers, including the capital Zagreb [
4]. The analysis of the earthquake catalogue presented in [
5] indicates that the continental part of Croatia can generate on average one Mw = 5.0 earthquake per year or one Mw = 6.4 event per century.
The December 2020 Petrinja earthquake series occurred within the Petrinja–Zrinska gora seismic zone, which includes the Petrinja fault system [
5,
6,
7,
8]. The maximum expected moment magnitude there is estimated to be M6.5. The probabilistic seismic hazard analyses performed for the local type A soil conditions predict a peak horizontal ground acceleration (PGA) for Petrinja and Glina of 0.11 g for a return period of 225 years and 0.15 g for 475 years [
9,
10]. However, the Petrinja and Glina communities are mainly located on recent alluvial sediments, so the actual PGA value is likely to be higher [
3].
The 2020 Petrinja earthquake series began with moderately strong foreshocks on December 28, 2020, with epicenters near Strašnik, about 5 km southeast of Petrinja city center with the strongest shock of ML = 5.1 at 5:28 UTC. The main earthquake occurred the next day, 29 December 2020 at 11:19 UTC, with an epicenter near the foreshocks—its magnitude was estimated at ML = 6.2 [
11] and MW = 6.4 [
12]. The main earthquake had a focal depth of about 6–7 km. The earthquake series was recorded by the National Strong Motion Network, which consists of seven stations in the Zagreb metro area. All stations are located north-northwest of Petrinja within a narrow backazimuthal range at epicentral distances between 45 and 60 km. At one of the stations with an epicentral distance of Repi = 48 km, the measured peak ground acceleration is PGA = 0.13 g. The approximate shakemaps [
13] of the main shock perceived PGA at the ground surface in the epicentral area around 0.5 g, while in Zagreb, PGA was estimated to be 0.1–0.15 g, which agrees well with the recorded data [
3].
According to official data, the December 2020 earthquake affected about 50,000 buildings, which were inspected by March 2022. Most of the significant damage affected older buildings of unreinforced masonry built before the adoption of the first official seismic regulations [
3], introduced in 1964 after the devastating 1963 Skopje earthquake. According to the Rapid Damage and Needs Assessment document [
14] prepared by the Croatian government with technical assistance from the World Bank, the total economic impact of the Petinja earthquake based on the adopted international DaLA methodology was approximately EUR 4.8 billion (
Figure 1), with Sisak-Moslavnina County being the hardest hit, with a share of about 80%. This includes damage (buildings and infrastructure) in the form of the replacement value of damaged or destroyed physical assets. Estimated losses are based on changes in economic flows resulting from the temporary absence of damaged assets or the disruption of access to goods and services in the form of lost sales, higher operating costs, and risk reduction measures [
14].
It is worth mentioning that the seismic risk in Croatia is considered high [
15], but there are no systematic strategies for its mitigation [
16]. Risk mitigation activities in the country are insufficient and are mostly based on individual initiatives of research institutes, local authorities, and civil protection teams. There is no program for the systematic seismic assessment and retrofitting of buildings of strategic importance, and there are few studies involving hospitals and schools, bridges, and other important facilities [
15,
16,
17]. Another major problem is that the building stock in Croatia is very old and more than 40% of the buildings were built more than 50 years ago.
With the development of technical regulations in Croatia, seismic requirements for buildings have gradually increased (
Figure 2). However, it is important to emphasize that the regulations relate primarily to the construction of new buildings and those undergoing major reconstruction. Inadequacies related to earthquake-damaged buildings in the technical regulation itself, as well as deficiencies in specific knowledge in engineering practice, proved to be key problems after the 2020 earthquakes. As a result of these, the Technical Regulations for Building Structures [
18] was amended in order to include the reconstruction of buildings damaged in an earthquake. Additionally, the Act on the Reconstruction of Earthquake-Damaged Buildings [
19] was issued and adopted after the Petrinja earthquake in order to regulate the procedures of reconstruction and seismic retrofitting, as well as the removal of damaged buildings in the areas of counties affected by earthquakes in March and December 2020.
The engineering and scientific community became heavily involved in activities to mitigate the effects of the earthquakes. Many experts from the academic community were directly involved in the assessments and preparation of studies on damaged buildings and the retrofitting techniques. This includes detailed guidelines for conducting post-earthquake damage inspections of buildings [
20] and bridges [
21,
22], the development of methodologies for the assessment and retrofitting strategies of masonry buildings [
23], RC buildings [
24], heritage buildings [
25,
26,
27], and vulnerability assessments of historical building aggregates [
28].
Figure 2.
Development of technical regulations for seismic design in Croatia (adopted from [
23]).
Figure 2.
Development of technical regulations for seismic design in Croatia (adopted from [
23]).
Detailed seismic performance assessments of individual buildings are essential tools for obtaining more reliable data to determine the seismic vulnerability of a specific building typology. At minimum, it should be available for all buildings of strategic importance, such as hospitals [
17,
29,
30], that must remain fully functional after an earthquake. However, given the diversity of structural systems and irregular structural geometry, it can be considered scarcely reported. Moreover, the use of field monitoring data is strongly recommended when applying numerical analyses. The methodology involving the derivation of “time-building specific” fragility curves for the existing eight-story RC hospital building is reported in [
29]. The importance of on-site investigation to evaluate actual structural conditions is emphasized in the seismic vulnerability assessment of an existing RC school building in Italy using a variety of alternative formulations to calculate the vulnerability index [
31]. In another case study, where an irregular RC hospital building was investigated using a nonlinear static method based on a multimodal distribution of lateral loads, it was shown that conventional load patterns may not be conservative with respect to the inelastic behavior of the irregular RC building [
30]. Other important issues in evaluating the seismic performance of the buildings concern the numerical modelling approach itself. A detailed overview of the challenging issues related to the use of different modelling strategies with equivalent frame models and models with a more “refined” discretization with 2D or 3D elements that do not strictly require any a priori identification of piers and spandrels are discussed in [
32]. The paper emphasizes that perfect calibration between the simplified and refined models is generally not possible in all regions of the panel failure domain and that a solid expertise in the seismic response of the building is still required given the variety of options available in modelling approaches. Numerical epistemic uncertainties that arise when using the equivalent frame model (EFM) approach to model unreinforced masonry buildings are discussed in [
33]. Based on the analysis of two existing masonry buildings, it was concluded that the choice of conservative deterministic parameters aims at a conservative approximation of the PGA at failure; however, in that case, there is a certain risk of overlooking certain damage mechanisms and their locations.
This paper presents a case study on the building of a higher education institution located in Petrinja. Among educational facilities, a total of 271 buildings were affected by the earthquake (
Figure 1), of which 109 are located in Sisak-Moslavina County, of which 18 were marked as temporarily unusable and 14 as unusable. It should be emphasized that in the affected region, much of the important infrastructure, such as hospitals and schools, was built after World War II and is usually a mixture of reinforced concrete frames and brick walls [
2]. The floor structures of these buildings often consists of a reinforced concrete fine-rib floor that is load-bearing in only one direction and cannot be fully considered a rigid diaphragm. A case study building consists of a system of RC columns and beams in one direction, while the main load-bearing system in the other direction consists of brick walls. For this period of construction (until 1965), it is typical that RC columns do not have a minimum transverse reinforcement, so brittle shear failure in the concrete is to be expected. This type of dual system is peculiar and rarely found in the literature. The building under consideration has an irregular plan only on the ground floor, which further complicates the structural response during an earthquake.
This study presents a comprehensive methodology for seismic performance assessment and retrofit strategy for this type of structural system, which are commonly present in the territory of the countries of the former Yugoslavia. In the following sections, the structural system of the case study building damaged by the Petrinja earthquake is described in detail. A brief overview of the earthquake damage is provided, followed by a numerical evaluation of the seismic performance of the as-built state of the building based on a pushover analysis. Two modeling approaches are investigated and a numerical model using finite elements and macroelements is used. The second part of the paper gives an overview of the relevant strengthening techniques and the evaluation of the seismic performance of the retrofitted building. When considering the seismic retrofit strategy, the frames of the RC façade are affected by minimal structural strengthening measures since the building was energy retrofitted in 2018. Therefore, the retrofit strategy aims to reduce the displacements of the original frame system to a level that prevents early brittle shear failure of the RC columns. In the last section, relevant conclusions and discussions are given concerning the numerical methods used and the retrofit strategy.
2. Case Study Building
2.1. General Information about Case Study Building
The building of the higher education institution in Petrinja, Croatia, was built in 1963 and underwent energy renovation in 2018. The building consists of the ground, 1st, and 2nd floors; the area on the ground floor is 1294.3 m
2 and on the upper floors 603.4 m
2. The total gross floor area of the building is 2501.1 m
2, while the useful heated area of the building is approximately 2130 m
2. The building has an irregular T-shaped layout and consists of three volumes connected into one whole (
Figure 3). In the northwest–southeast direction (hereafter X-dir), there are two volumes that have only the ground floor. The volume marked as V1 is 3.84 m high, while the volume V2 in the southeastern part of the building is 5.52 m high and consists of a one large hall. The central volume V3 of the building is arranged in a northeast–southwest direction (hereafter Y-dir) and has three stories with a total height of 11.52 m.
The load-bearing structure consists of interconnected reinforced concrete (RC) columns and beams that form façade frame systems at the building edges. Within the floor plan, the load-bearing system in the longitudinal direction consists of masonry brick walls with a thickness of 38 and 30 cm. In the transverse direction, the system consists of brick walls 30 cm thick, while the partition walls are 20 cm thick and are arranged irregularly within the floor plan. Columns and walls have RC strip foundations, most of which are interconnected. The floor structure is monolithic reinforced concrete, the so-called thin ribbed RC floor.
2.2. Detail Description of the Structure
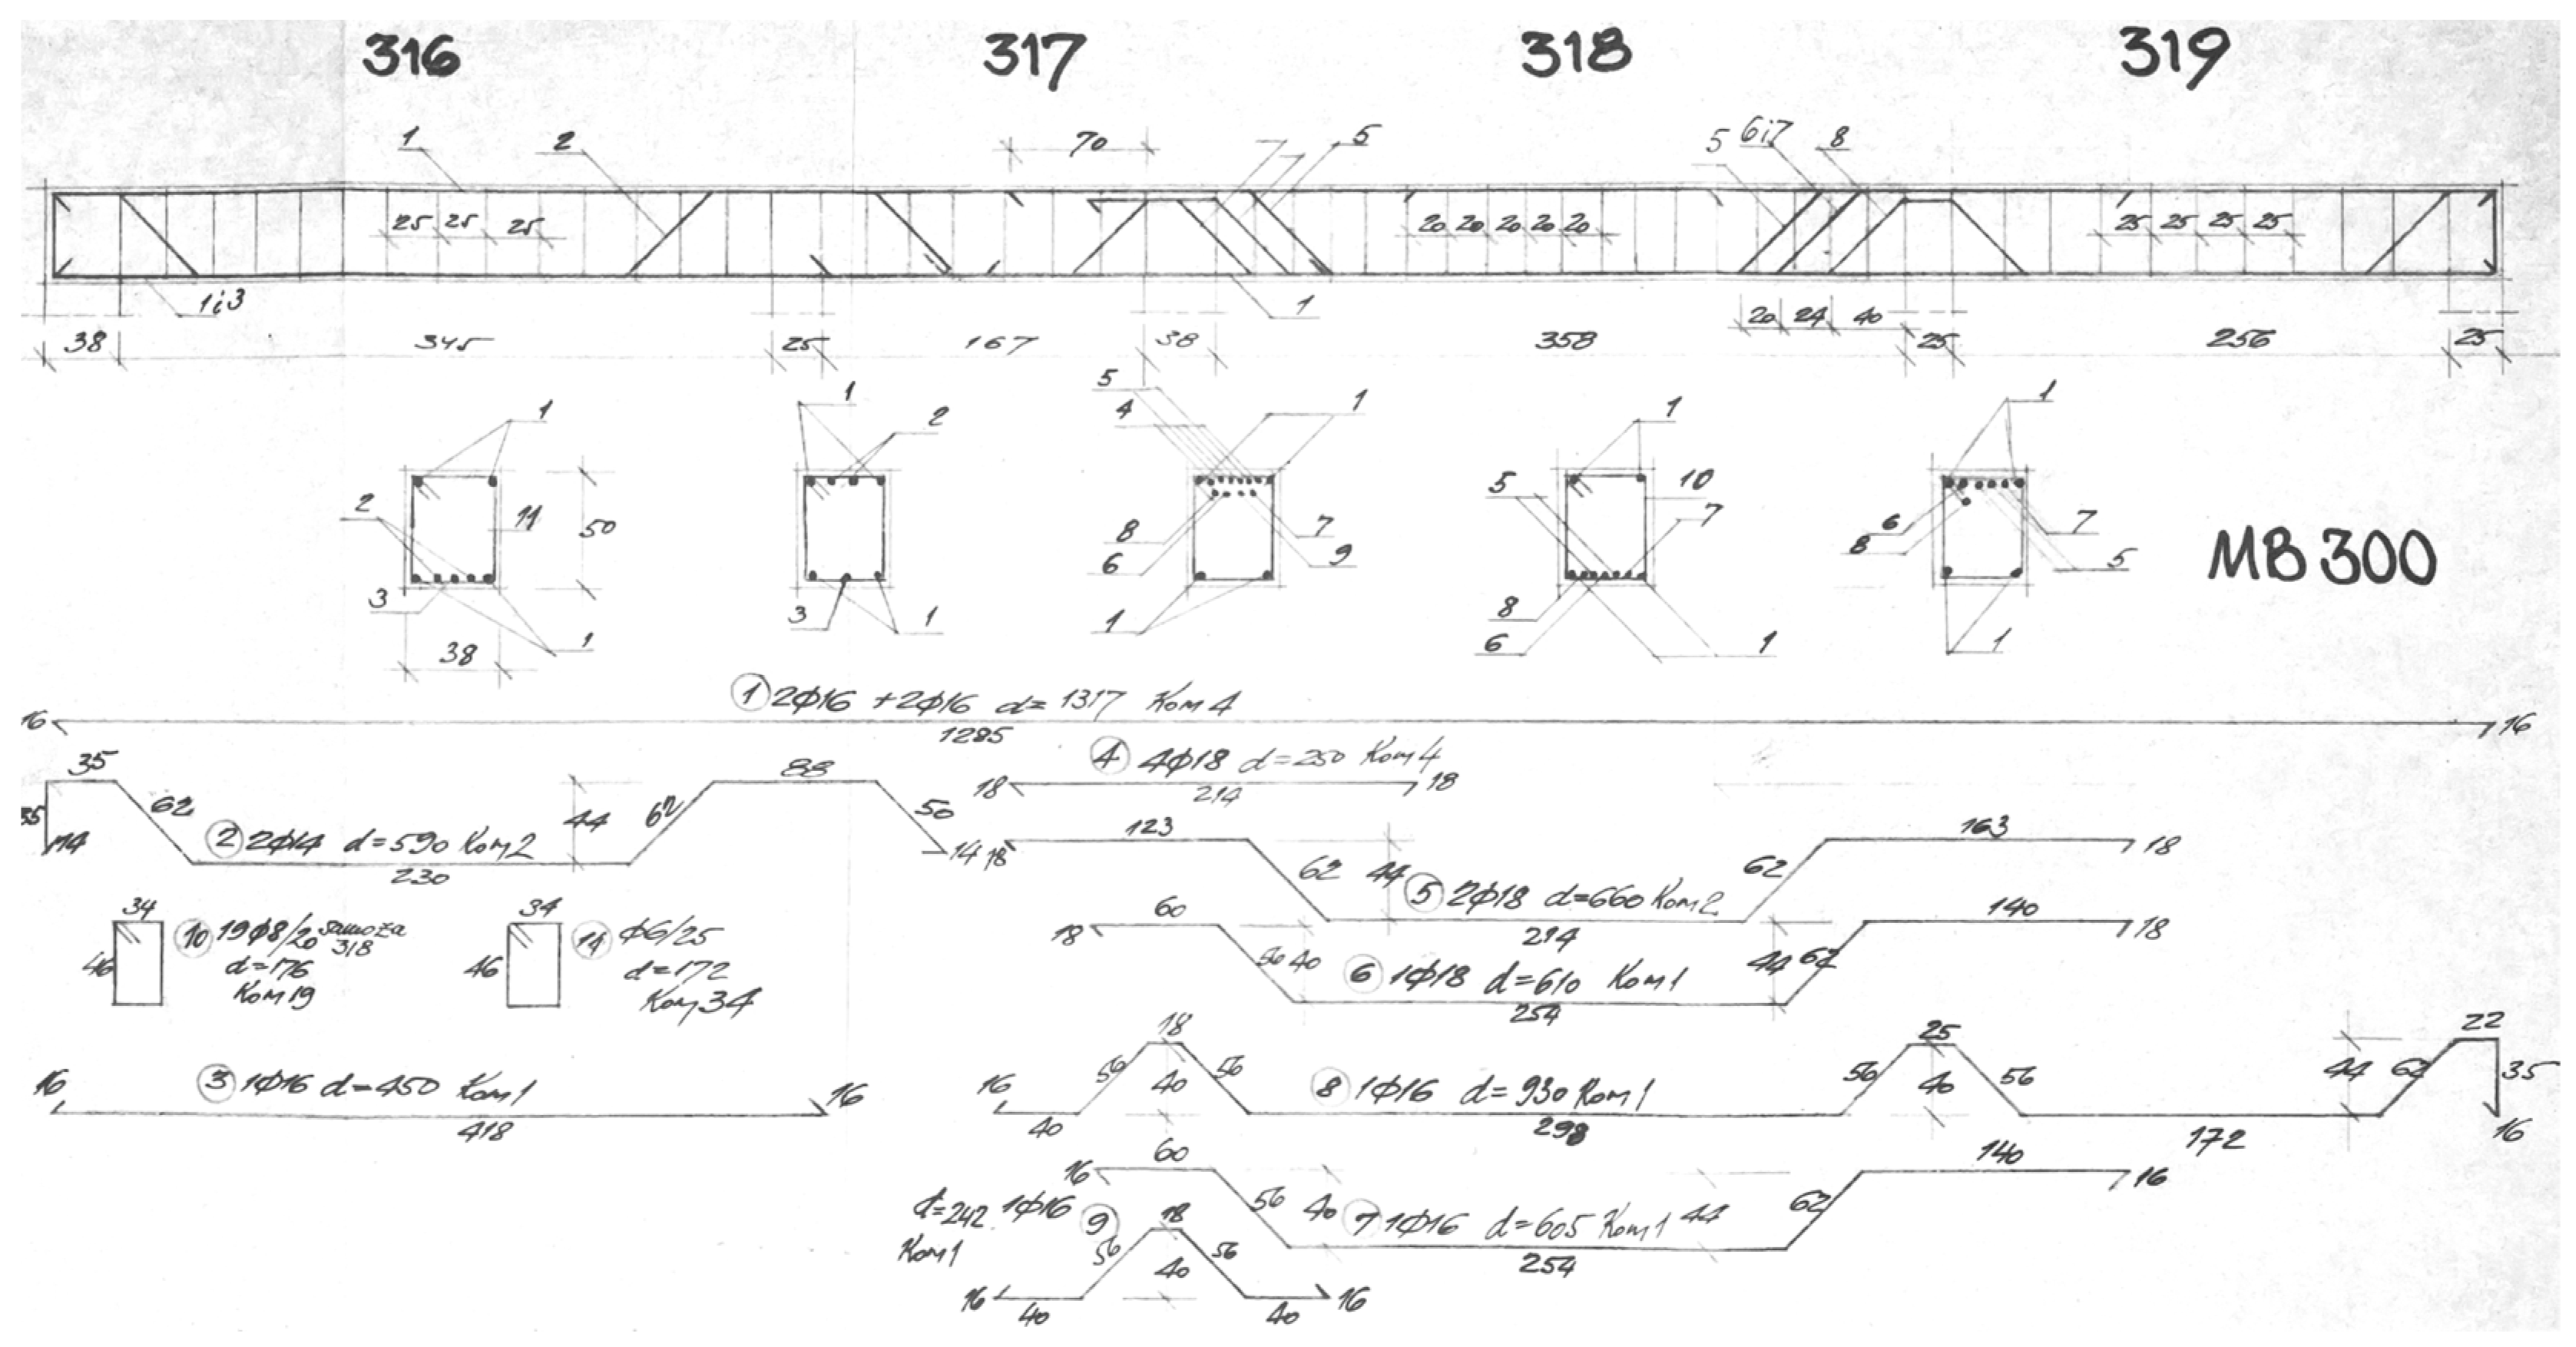
The dimensions of the structural elements were obtained from the drawings accompanying the original static design (
Figure 4), an architectural drawing of the as-built condition from 2015, the energy retrofit project from 2018, and an on-site survey. A detailed inspection of the load-bearing structure revealed that the building was not built entirely in accordance with the project documentation. The arrangement of columns was altered so that they were not constructed in some locations when a brick wall was present (
Figure 5). Other subsequent interventions, alterations, or modernizations carried out over time did not have a significant impact on the load-bearing capacity of the structure. These were mainly offsets of the partition walls.
The detailed building inspection determined the type, layers, and dimensions of the floor structures, verified the location of the reinforced concrete columns, determined the dimensions of the brick walls, and identified other information important for understanding the structural system of the building. Based on the results of experimental testing of concrete quality on the taken samples from columns and beams and with a sclerometer, it is estimated that the concrete embedded in RC elements is of compressive strength, corresponding to concrete class C20/25 (MB25). All reinforcement bars embedded in RC elements are of smooth steel with a yield strength of 220 MPa and ultimate tensile strength of 360 Mpa (approximately corresponding to BSt 22/34 GU). The reinforcement of some columns was also confirmed on-site. The load-bearing walls of the building are masoned with solid bricks of size 29 × 15 × 6.5 cm. The results of the testing of the shear strength of the mortar in the solid brick walls showed that the average value of the shear strength of the mortar at all locations is 0.685 MPa, i.e., the shear strength with the contribution of vertical stress.
Reinforced concrete frames consist of columns with dimensions 25/38 cm and beams with dimensions 38/43 cm. The columns are provided with four reinforcing bars of 12, 14, and 16 mm diameter, depending on their position. Transverse reinforcement consists of 6 mm diameter bars on the spacing of 25–30 cm. The frame beams are located along certain façades of the building (volumes V1 and V3). The reinforcement of the beams is smooth, as mentioned before, and it is bent diagonally from the upper zone to the lower zone of the section (
Figure 4), i.e., at the zones with the highest shear stresses. The frame parapets are made of 19 cm thick hollow concrete blocks.
In the central part of V1, there are load-bearing brick walls in the X-dir with a thickness of 38 cm, which serve as a mid-support for the ribbed concrete slab. In the Y-dir, there are slab ribs 40 cm high and 12 cm thick, spaced 50 cm apart. The concrete slab is 6 cm thick. There are also ribs for stiffening in one third of the span of the slab. In volume V3, the load-bearing walls in Y-dir are 38 cm thick that are manly continuous in height and partly interrupted by openings. There is also a brick walls 20 cm thick in Y-dir, these are partition walls. Since they also have stiffness and load-bearing capacity, they are included in the numerical models. The 30 and 20 cm thick brick walls in X-dir are only partially continuous in height. In this part of the building there is also a two-flight staircase.
Along the edge of the floor plan in the southeastern part of the building there is a hall (volume V2), which is a single volume with a height of 5.52 m. It is bounded on three sides by 38 cm thick brick walls, which are not adequately connected to the RC elements. On the fourth side, there is a RC frame consisting of columns with dimensions 25/38 cm and beams with dimensions 38/43 cm. The edge supports of the beams rest directly on the transverse brick walls. The floor structure also consists of an RC ribbed slab, the ribs are 64 cm high and 12 cm thick at 50 cm intervals, while slab is 4 cm thick. The span of the floor structure is 10.0 m, and there are ribs for stiffening in Y-dir.
2.3. Damage in Petrinja Earthquake
The building was damaged during the 29 December 2020 Petrinja earthquake. After a preliminary inspection, it was labelled as temporarily unusable with the need for emergency intervention measures due to the suffered damage. There was a risk of plaster and installations falling from the callings and the out-of-plane failure of severely damaged partition walls, so access was restricted in some parts of the building. The inspection revealed slight damage to the floor structures, moderate damage to the vertical elements and severe damage to the staircase and partition walls. The overall damage to the structure was classified as Level 3, according to the EMS scale. Characteristic damage can be seen in the
Figure 6 with indicated location information.
Further detailed inspection in particular revealed that the damage to the brick wall to which the staircase landing is connected is significant and possess a considerable risk for usage. It is the only staircase in the building. Due to the structural irregularities, special attention was given to the locations where different volumes connect. Although there is no dilatation, the detailed inspection showed that the slabs are partially separated and that the stiffening ribs connect the different units of the building. In this location, between the lower and upper parts of the building, damage to the floor structure was observed. To determine the extent of the damage found, the lower layers of the ceiling were removed, and cracks were also found on the stiffening ribs of the slab in this area. Furthermore, in the section connecting volumes V1 and V3, cracks were recorded on the part of the wall located above the ground floor. Other observed damage included minor damage to the load-bearing masonry walls, extensive cracking of partition walls and major damage to the lower layers of ceiling structures, with cracking and the falling of plaster on almost all walls.
3. Assessment of the Seismic Performance of the Existing Building
3.1. Numerical Models
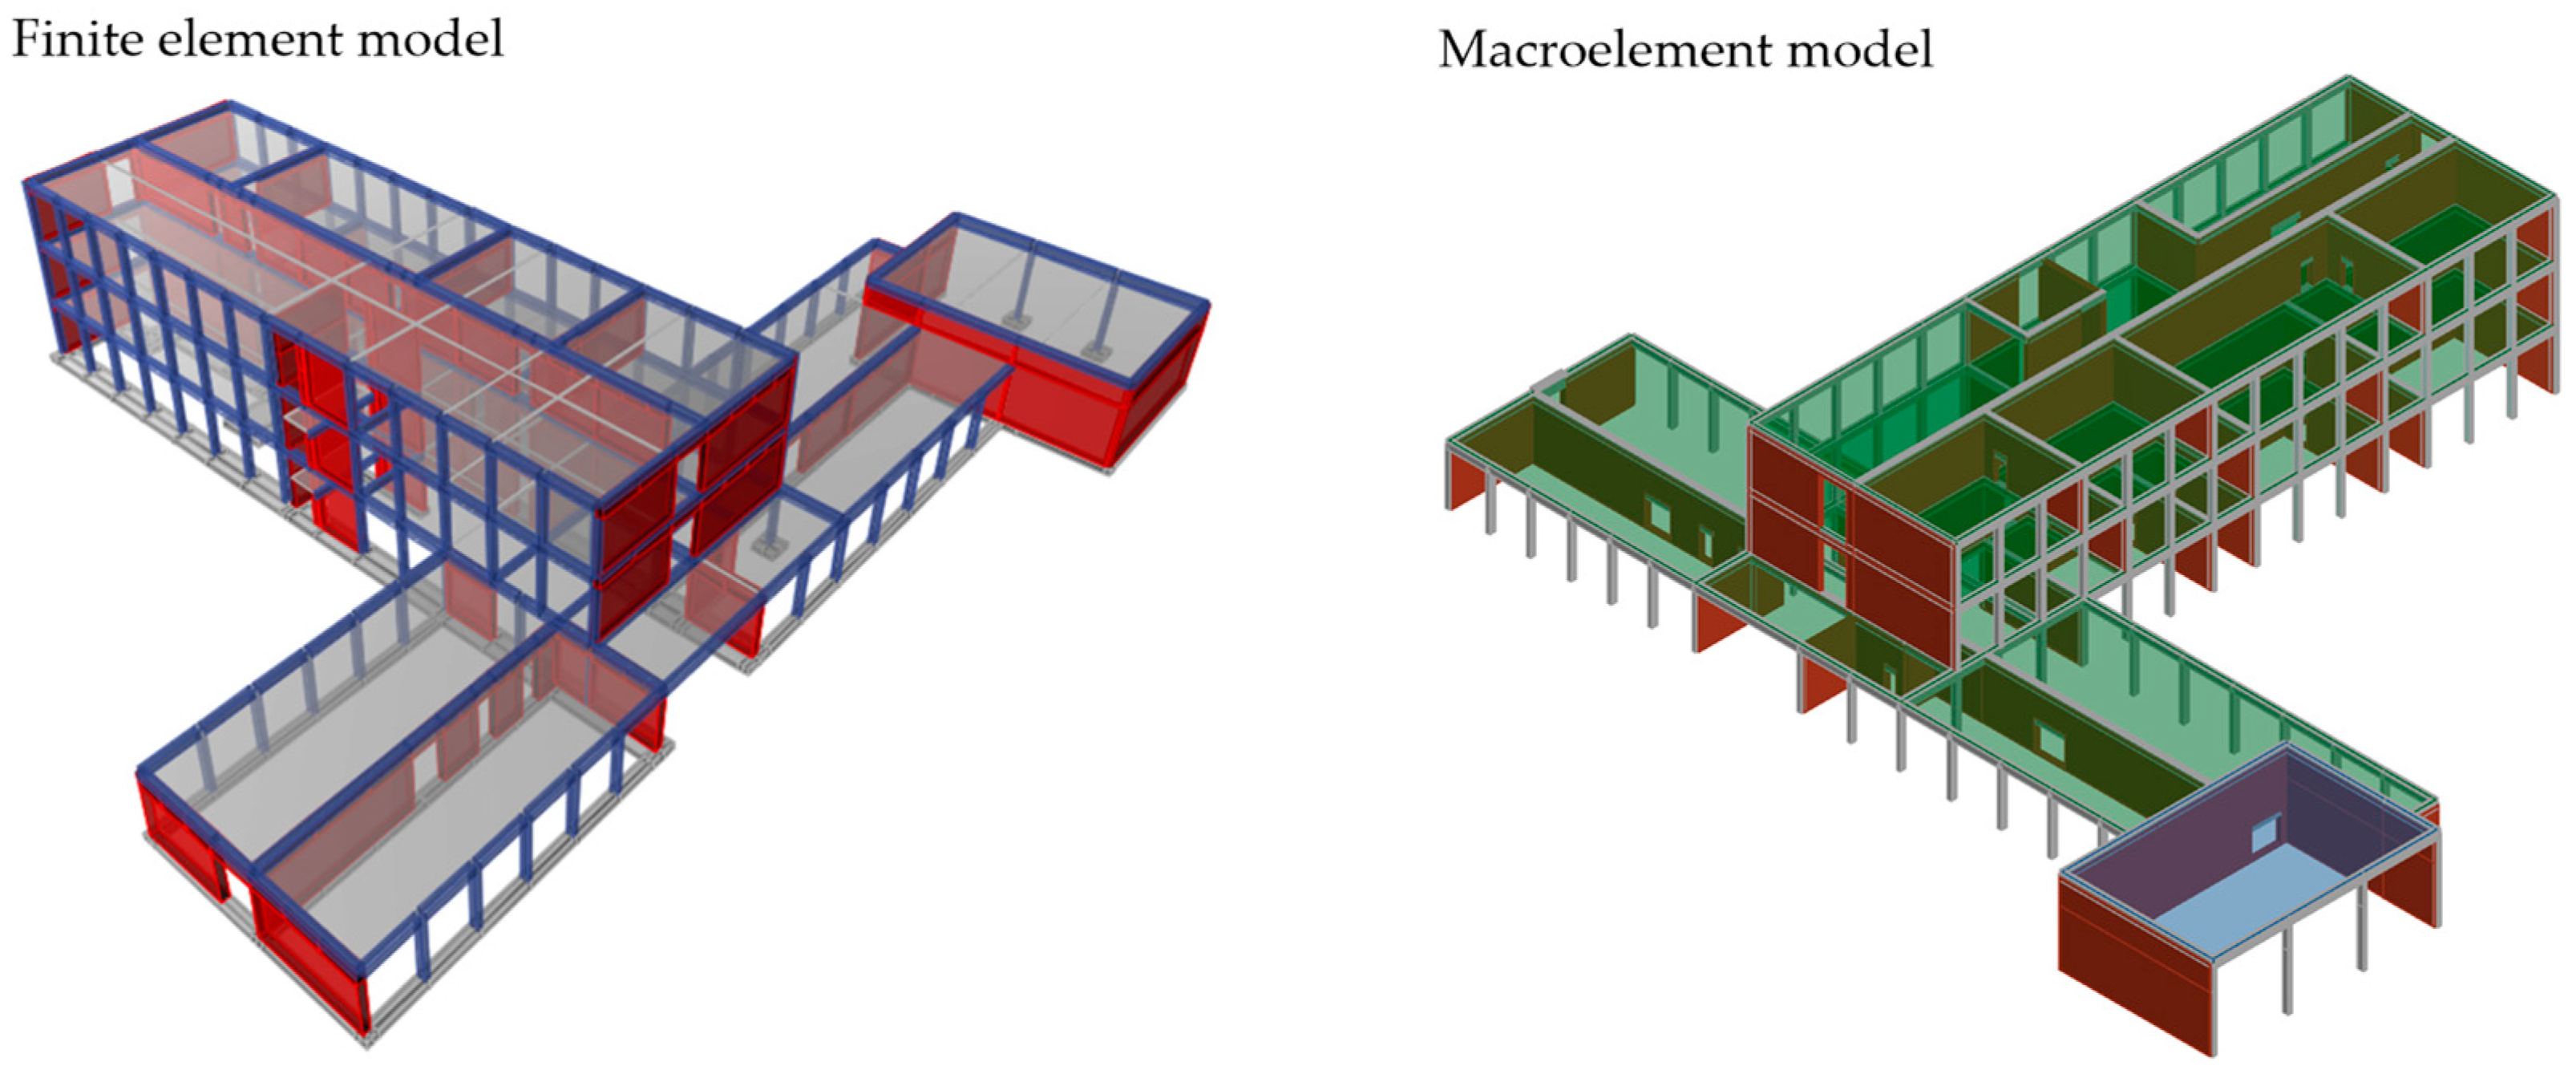
In order to verify the methodology and to evaluate the applicability of different modelling approaches, two types of numerical model were employed for the assessment of the building’s seismic performance (
Figure 7). The first model is based on the finite element method (FEM) and is designed using the CSI ETABS [
34] software package that is intended for the numerical analysis of buildings in seismically active areas. The modeling of the load-bearing structure consisting of columns and beams was carried out using frame elements, while the masonry walls were modeled with shell elements. The horizontal structures were modeled with shell elements, and they were additionally assigned the property of rigid diaphragms. The cracking of cross-sections during an earthquake was taken into account in the model according to the guidelines from Croatian standards (adopted Eurocode regulation [
35,
36]), so that the bending stiffness of reinforced concrete beams, columns, and walls was reduced by 50%. The shear stiffness of all elements is taken also with 50% reduction of the initial stiffness.
The nonlinear behavior of the elements in FEM model was accounted for by the assumption of local opening of the plastic hinges in the relevant load-bearing elements of the structure. To determine the capacity curve of a load-bearing masonry walls (
Figure 8), different failure mechanisms were accounted for and the predominant one was selected. The shear failure by the development of diagonal cracks in the wall or shear failure by sliding of the wall is proved to be the prevailing mechanism of damage. There was also a failure mechanism due to crushing the material at the element edges, which is initiated by wall rocking.
The deformation capacity of elements that include columns, walls, lintels, and beams is taken according to [
34]. Force-deformation relations (
Figure 9) for reinforced concrete columns and beams were calculated on the basis of the strength of the concrete and the installed reinforcement, by considering several code guidelines [
34,
35,
36,
37,
38].
The second model is based on the macroelements and formation of equivalent frames model (EFM) for which the 3Muri [
39] software package was employed. In this model, the previously stated assumptions about stiffness reduction and rigid diaphragms were also used. In this numerical model the nonlinear masonry wall elements are taken into account by bilinear behavior with maximum values of shear force or bending moment, depending on the prevalent failure mechanism automatically determined by the program. The failure of an element by bending under pressure is determined by the relationship that connects the normal stress and the peak value of the moment, under the assumption of a material with no tensile strength. The shear failure mechanism is defined in the model according to the Mohr–Coulomb criterion, i.e., shear cracking along the mortar joints. The resistance mechanisms of the RC elements considered are ductile bending (with or without normal forces) for each of end with the consequent formation of a plastic hinge and fragile to shears, in conformity with the criteria found in the code [
39]. With this model, the element damage mechanism is automatically calculated by the program, depending on internal forces.
The characteristics of the materials used in the calculation were adopted based on experimental tests and estimated conservative values. Based on the material testing program and review of all significant details in the structure, knowledge level 3 was selected, and therefore the confidence factor in the calculation of the structure is equal to 1.0. In the calculation, the mean values of the mechanical characteristics of the materials were used, which were taken as slightly smaller than the measured values due to the unreliability of the measurement method and the dispersion of the results (
Table 1).
The software packages automatically take into account the self-weight (W) of all assigned elements of the structure. The additional permanent load (G) was partially taken from the original design and evaluated during the detailed inspection of the building. Additional permanent loads of 2.6 kN/m
2 are applied to all floor structures and 3.3 kN/m
2 to the roof level. Additional loads from parapet and façade weight are applied to the edge frames at approximately 5 kN/m. The imposed load (Q) is considered according to the current regulations, which is 3 kN/m
2 for areas with tables, such as in schools, and for the roof level 1 kN/m
2. The load combinations considered are summarized in
Table 2.
As for the seismic actions on the site,
Figure 10 shows the peak ground acceleration values for soil class A (a
gR). Since this is an educational building, the importance factor γ
I is 1.2. For the calculation of the seismic action, the MASS combination of vertical forces is used.
3.2. Limit States
The survey of damage to the buildings after the earthquakes in 2020 [
1,
2,
3,
20] has shown that the extensive retrofitting of buildings or replacement with new buildings will be difficult to achieve and will require significant investment to ensure modern earthquake safety standards. Therefore, in order to ensure that reconstruction measures will lead to a certain level of seismic safety, the Croatian Technical Regulation for Building Structures (CTRBS, [
18]) established various seismic safety requirements depending on the purpose of the building and the level of damage, which applies only to buildings being rehabilitated due to seismic damage [
18]. In contrast to the three limit states defined in code [
36], i.e., Near Collapse (NC), Significant Damage (SD), and Damage Limitation (DL), the CTRBS refers only to the SD limit state. The CTRBS defines the significant structural damage index (SDI) as a ratio of the design seismic resistance of the structure and the structural requirement for the significant damage limit state. Design seismic resistance is defined by the value of the seismic action for the design peak ground acceleration on type A ground for which the structure reaches the limit state of significant damage. The design ground acceleration on type A ground (a
g) is equal to the reference peak ground acceleration (a
gR) on type A ground for the return period of 475 years (probability exceeding 10% in 50 years) times the importance factor. The seismic resistance levels are:
Level 2: The level of structural retrofitting should reach a significant structural damage index (SDI) of at least 0.5.
Level 3: The level of structural retrofitting should reach a significant structural damage index (SDI) of at least 0.75.
Level 4: The level of structural retrofitting should reach a significant structural damage index (SDI) of at least 1.0.
Level 3 is a mandatory minimum level for educational buildings, such as the one in this study. Therefore, according to the CTRBS, for the building in question, the design acceleration value of agR = SDI × PGA × γI = 0.75 × 0.15 g × 1.2 = 0.135 g on type A ground was used for the definition of demand requirement.
3.3. Finite Element Model Results
First, the calculation of the structure for permanent vertical load was carried out. Relevant requirements for structural elements are carried out by means of the combinations of static loads, based on the provisions of the current codes. Furthermore, these results represent the basis for further non-linear analysis, and in addition, it is important to know the internal stress state of the elements before applying the seismic load in order to gain insight into other structural faults and week parts of the structure itself. Due to the large amount of data, only the most significant results, which are important for the proposal to strengthen the structure, are shown.
Figure 11 shows normal stresses of masonry walls. As can be seen, the stress in the walls of the ground floor is up to 0.75 MPa on the central longitudinal brick wall, which is about 22% of the compressive strength of the walls.
In addition, it was found that the existing reinforcement mostly meets the requirements for permanent vertical action. However, there were three critical positions in structural system that need to be strengthened. These are the beams on the ground floor in the axis marked in
Figure 12. They are all located in the entrance area of the building. Their exceeding load capacity is the result of the displaced position of the columns as well as the existence of masonry walls in the upper floors, which has interrupted the flow of forces in the structure. It is mainly a matter of lack of transverse reinforcement, but in some places the longitudinal reinforcement is also lacking.
Numerical results of the dynamic properties, i.e., eigenperiods and mode shapes, are presented below.
Figure 13 shows the results of a model that has a limited crack state since it is loaded only by the weight of the structural elements and other permanent and service loads. Further results for eigenmodes are obtained for the state of the structure near the SD limit state (
Figure 14). In this case, the stiffness of the structure is significantly reduced, which is reflected in the prolonged eigenperiods. It should be noted that the irregularity of the building on the ground floor can cause torsional effects that increase the requirements for the relative displacements of the perimeter walls, which could lead to their greater vulnerability during earthquake.
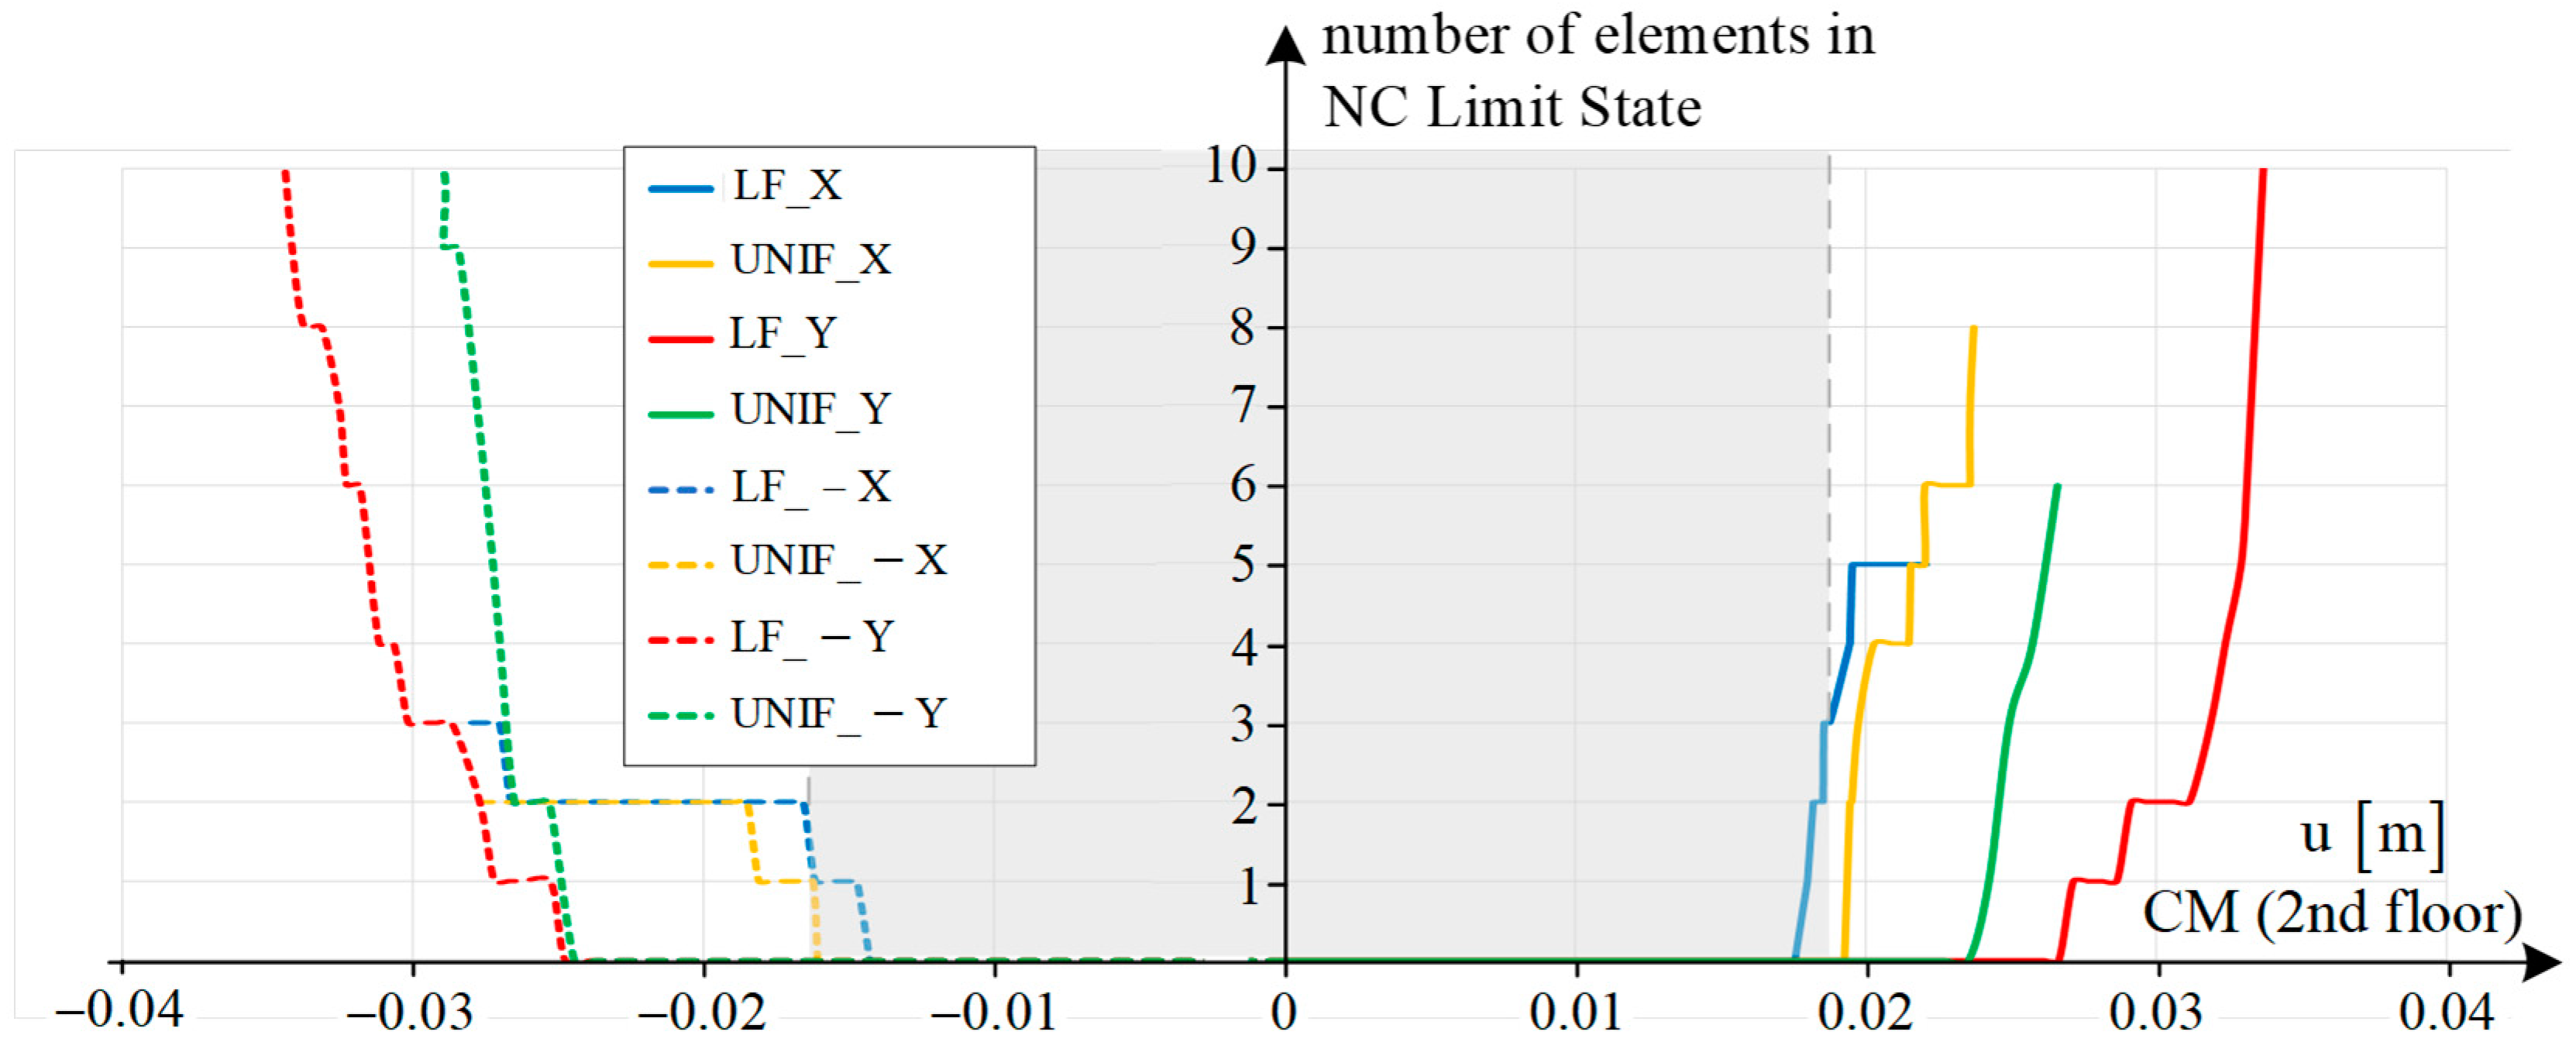
A pushover analysis for various horizontal loading patterns was performed and critically analyzed, but only the most important results for determining the lateral capacity of the structure are presented here. The uniform distribution (UNIF) and the distribution according to the lateral force method (LF), i.e., the triangular distribution, are considered as load patterns. Pushover curves were determined separately for each horizontal direction, considering both positive and negative loading directions, and assuming an eccentricity of ±5% with respect to the center of mass (CM) of the floor. The CM on the 2nd floor was chosen as the control point. The evolution of the damage mechanisms along the bearing capacity curve of the building was analyzed by following the distribution of the internal forces and the bearing capacity of the structural elements.
It was found that the same patterns of lateral force distribution were relevant for both load directions. The pattern of load distribution that corresponds to the vertical distribution of horizontal forces according to the lateral force method (LF) proved to be the most critical.
The most significant pushover curves for the action of the lateral force in the X-dir are shown in
Figure 15. It can be seen that some elements of the structure come to a state of limited damage, which is reflected on the curve as a decrease in stiffness, i.e., the slope at a force of 1800 kN (base shear coefficient, B.S. = 5.6%) and a displacement of 7.4 mm. Then there is the initial opening of cracks and a reduction in the stiffness of individual elements. The diagram shows elements on the ground floor where cracks appear, even though they are present on all floors. The beginning of the failure of the structural elements occurs at a force of 2900 kN (B.S. = 9.1%) and at a displacement of 17.5 mm. The columns on the 1st floor reach the SD limit state due to exceeding the shear capacity. Since such damage of the columns is non-ductile, exceeding their ultimate capacity means that they soon reach the NC limit state.
The next important point is the failure of these columns at a lateral force of 2900 kN and for a displacement of 18 mm. The masonry wall on the 1st floor next to the critical columns is also in a SD limit state, but it still has not utilized total load-bearing capacity. At this point, it can be said that the bearing capacity of part of the building is reached and that a local failure of the building is possible. As a result, the local failure of the floors may occur. It can already be said that the building is in a NC limit state, and it can be classified as having the highest degree of damage. However, even in the case of local failure, it is unlikely that the rest of the structure will collapse at this level of loading. The walls and columns of the ground floor and the 2nd floor are not critical for action in the X-dir, since none have reached the SD limit state.
Figure 16 shows the most significant pushover curves for the action of the lateral force in the positive Y-dir with markings of the points, indicating the state of structural damage. At a force of 3900 kN (B.S. = 12.1%) and a displacement of 12 mm, limited damage occurs on several elements. Significant damage in the structural system occurs at a force value of 5500 kN (B.S. = 17%) and a displacement of 26 mm. The critical elements that first reach the SD limit state are the masonry walls in the central axis on the 1st floor. Subsequently, other walls in the same axis reach the SD limit state. Eventually, the failure of several walls occurs, and the bearing capacity of the structure decreases significantly with a maximum displacement of about 33 mm. The walls on the ground floor and the 2nd floor have not been shown to be critical to the action in the Y-dir.
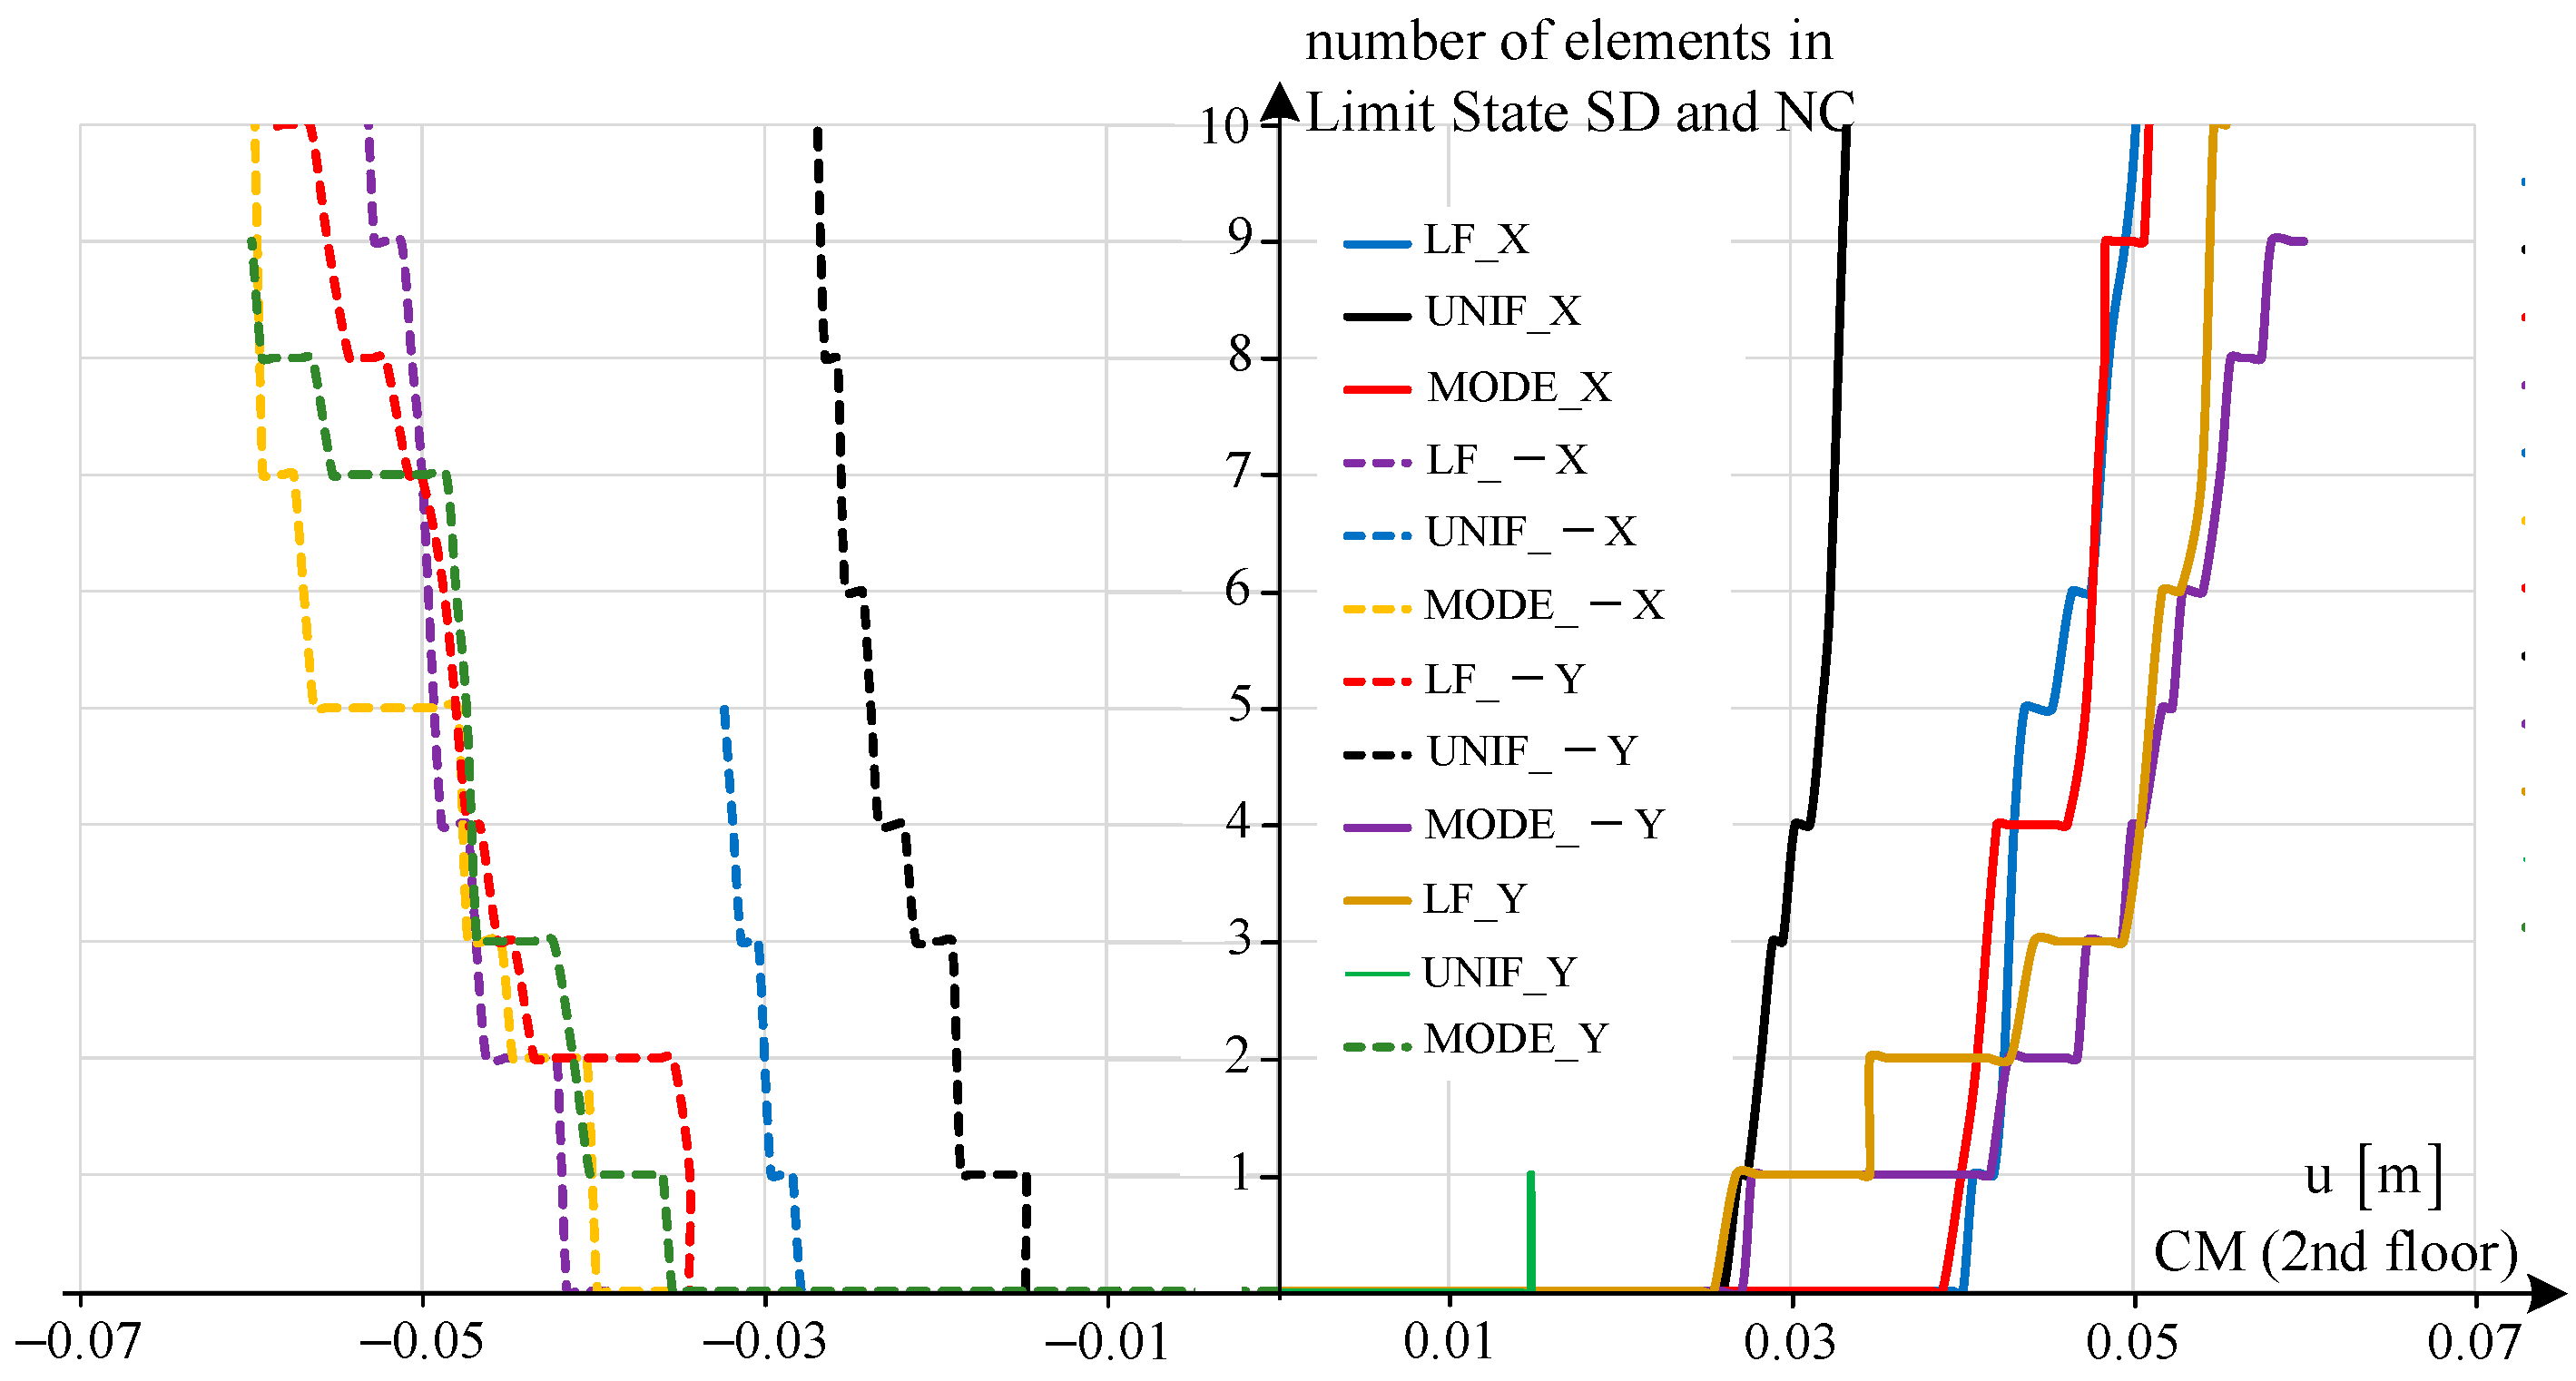
Figure 17 shows a diagram that cumulatively represents the number of elements that have reached the limit state of near collapse. For the action in the X-dir, the elements begin to enter this region at a displacement of about 2 cm, while in the Y-dir, this occurs at a value of about 2.5 cm.
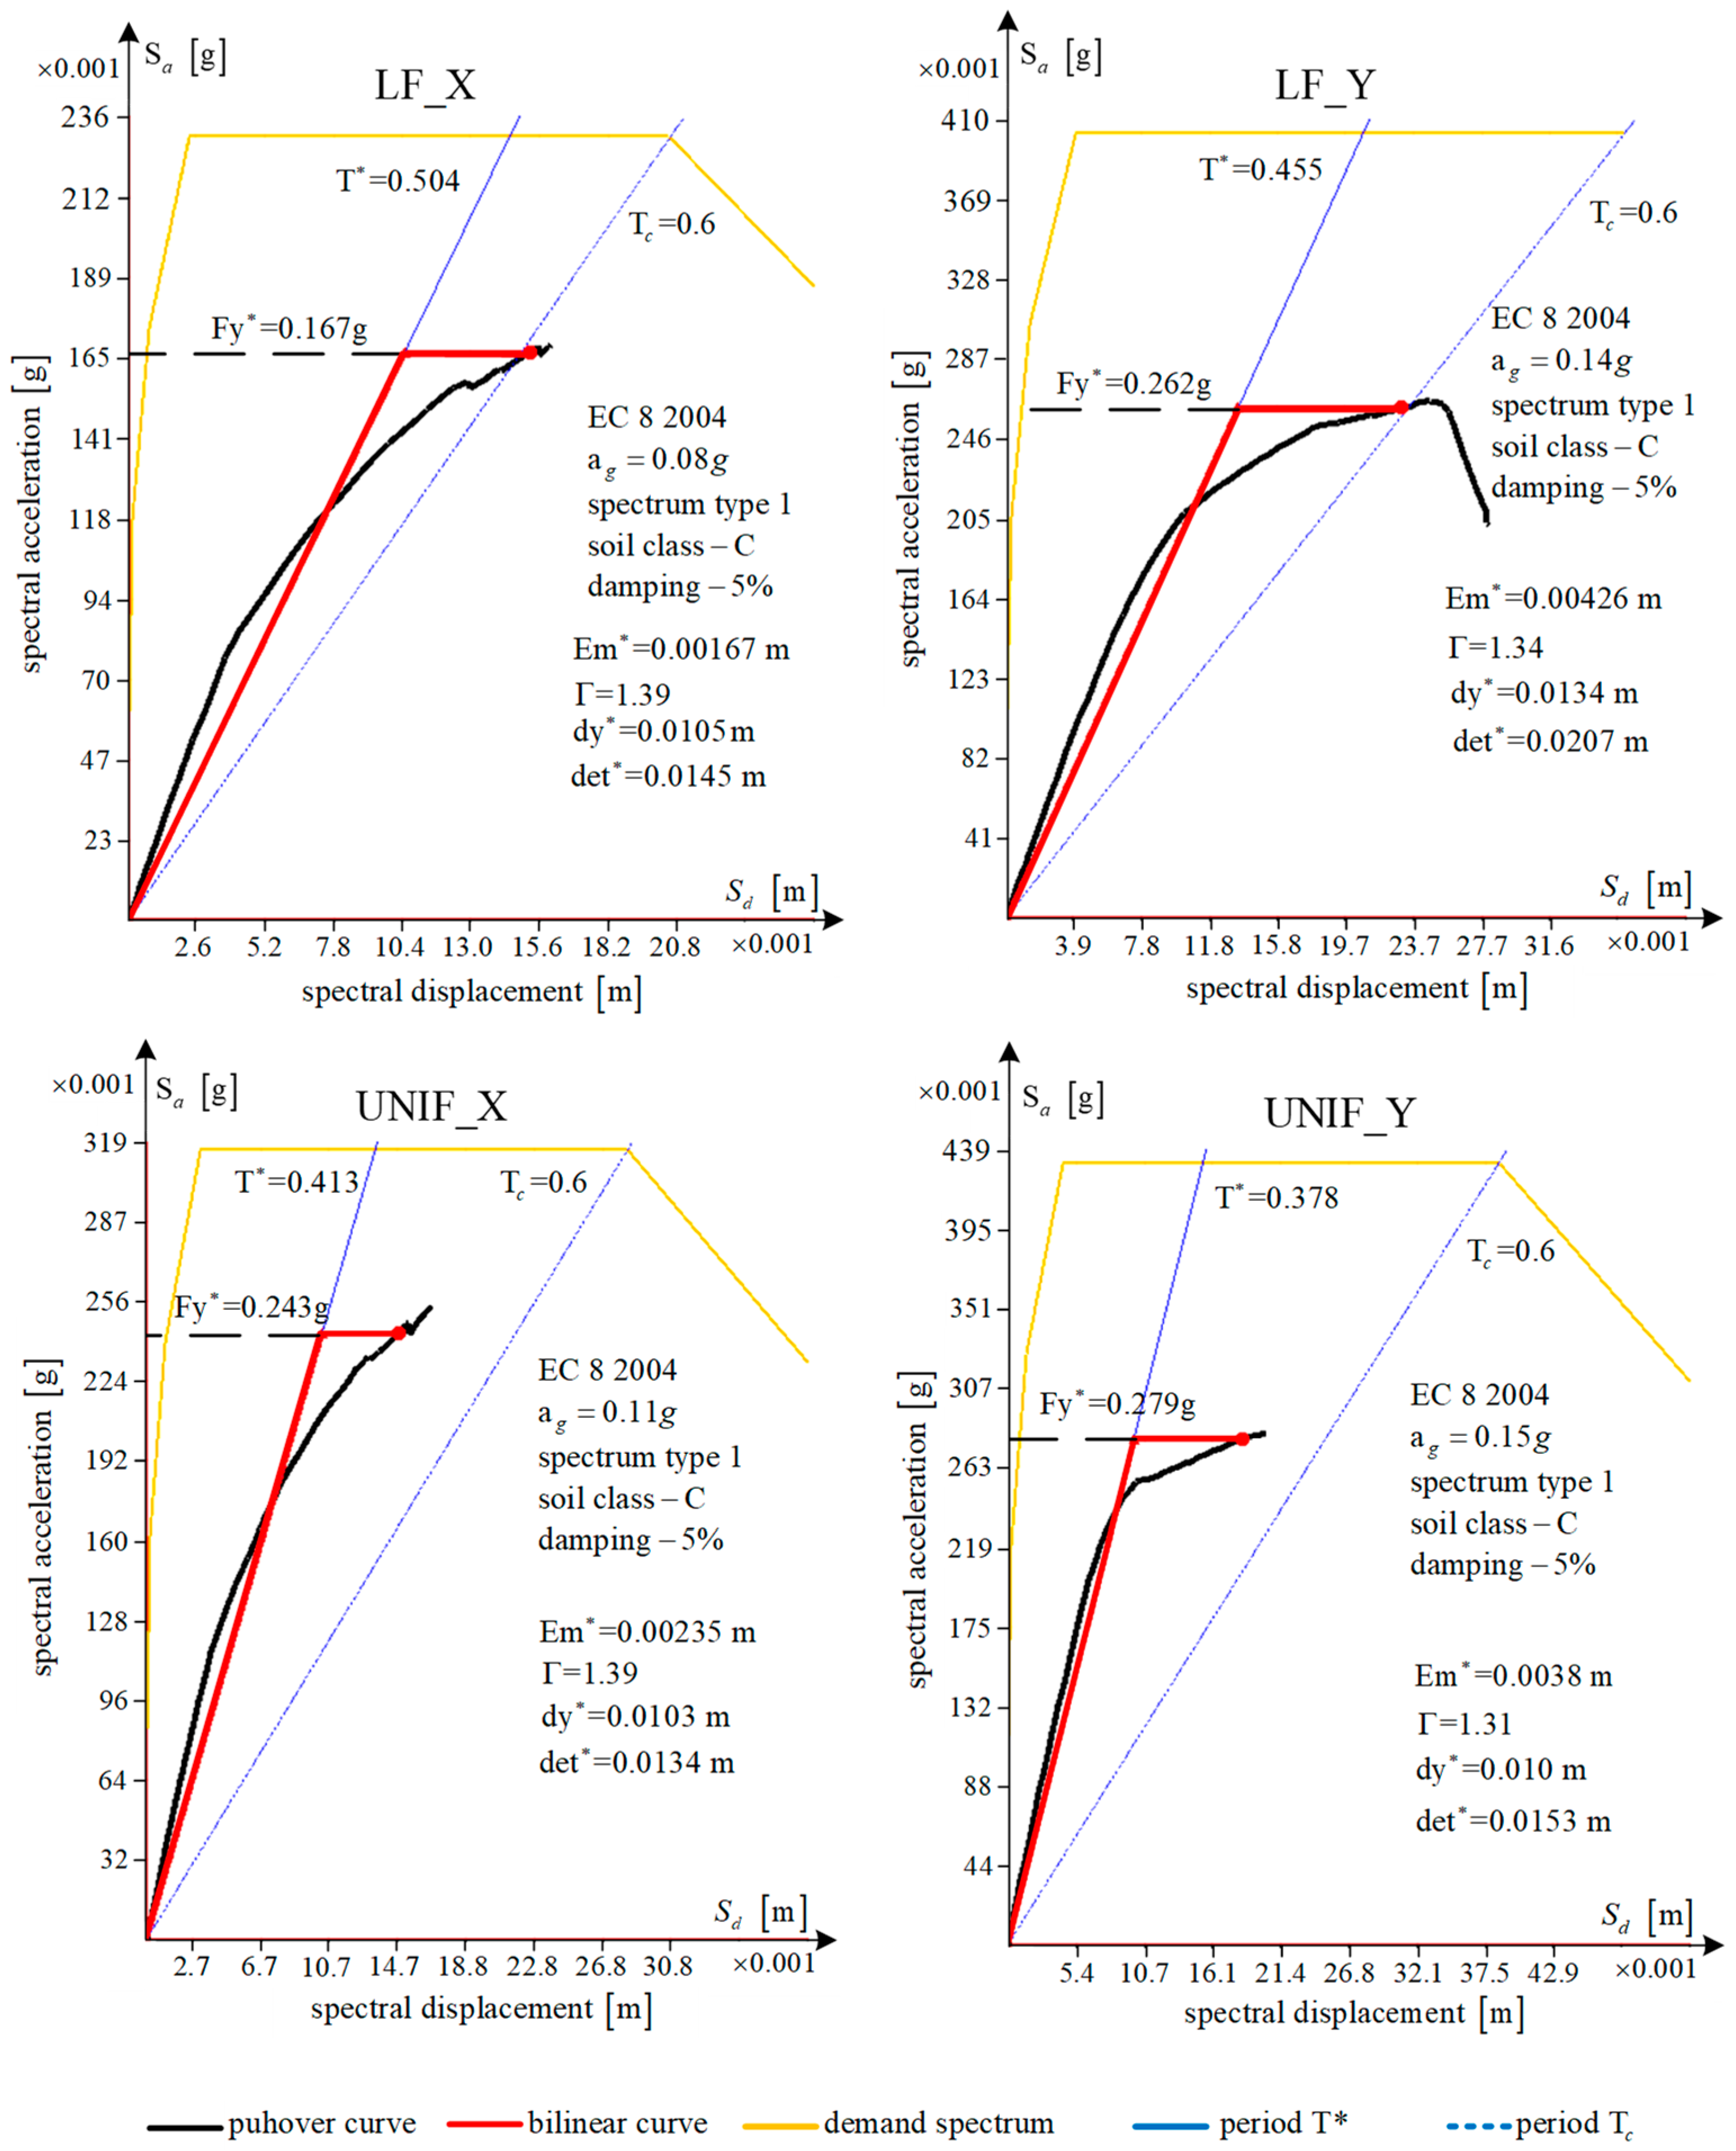
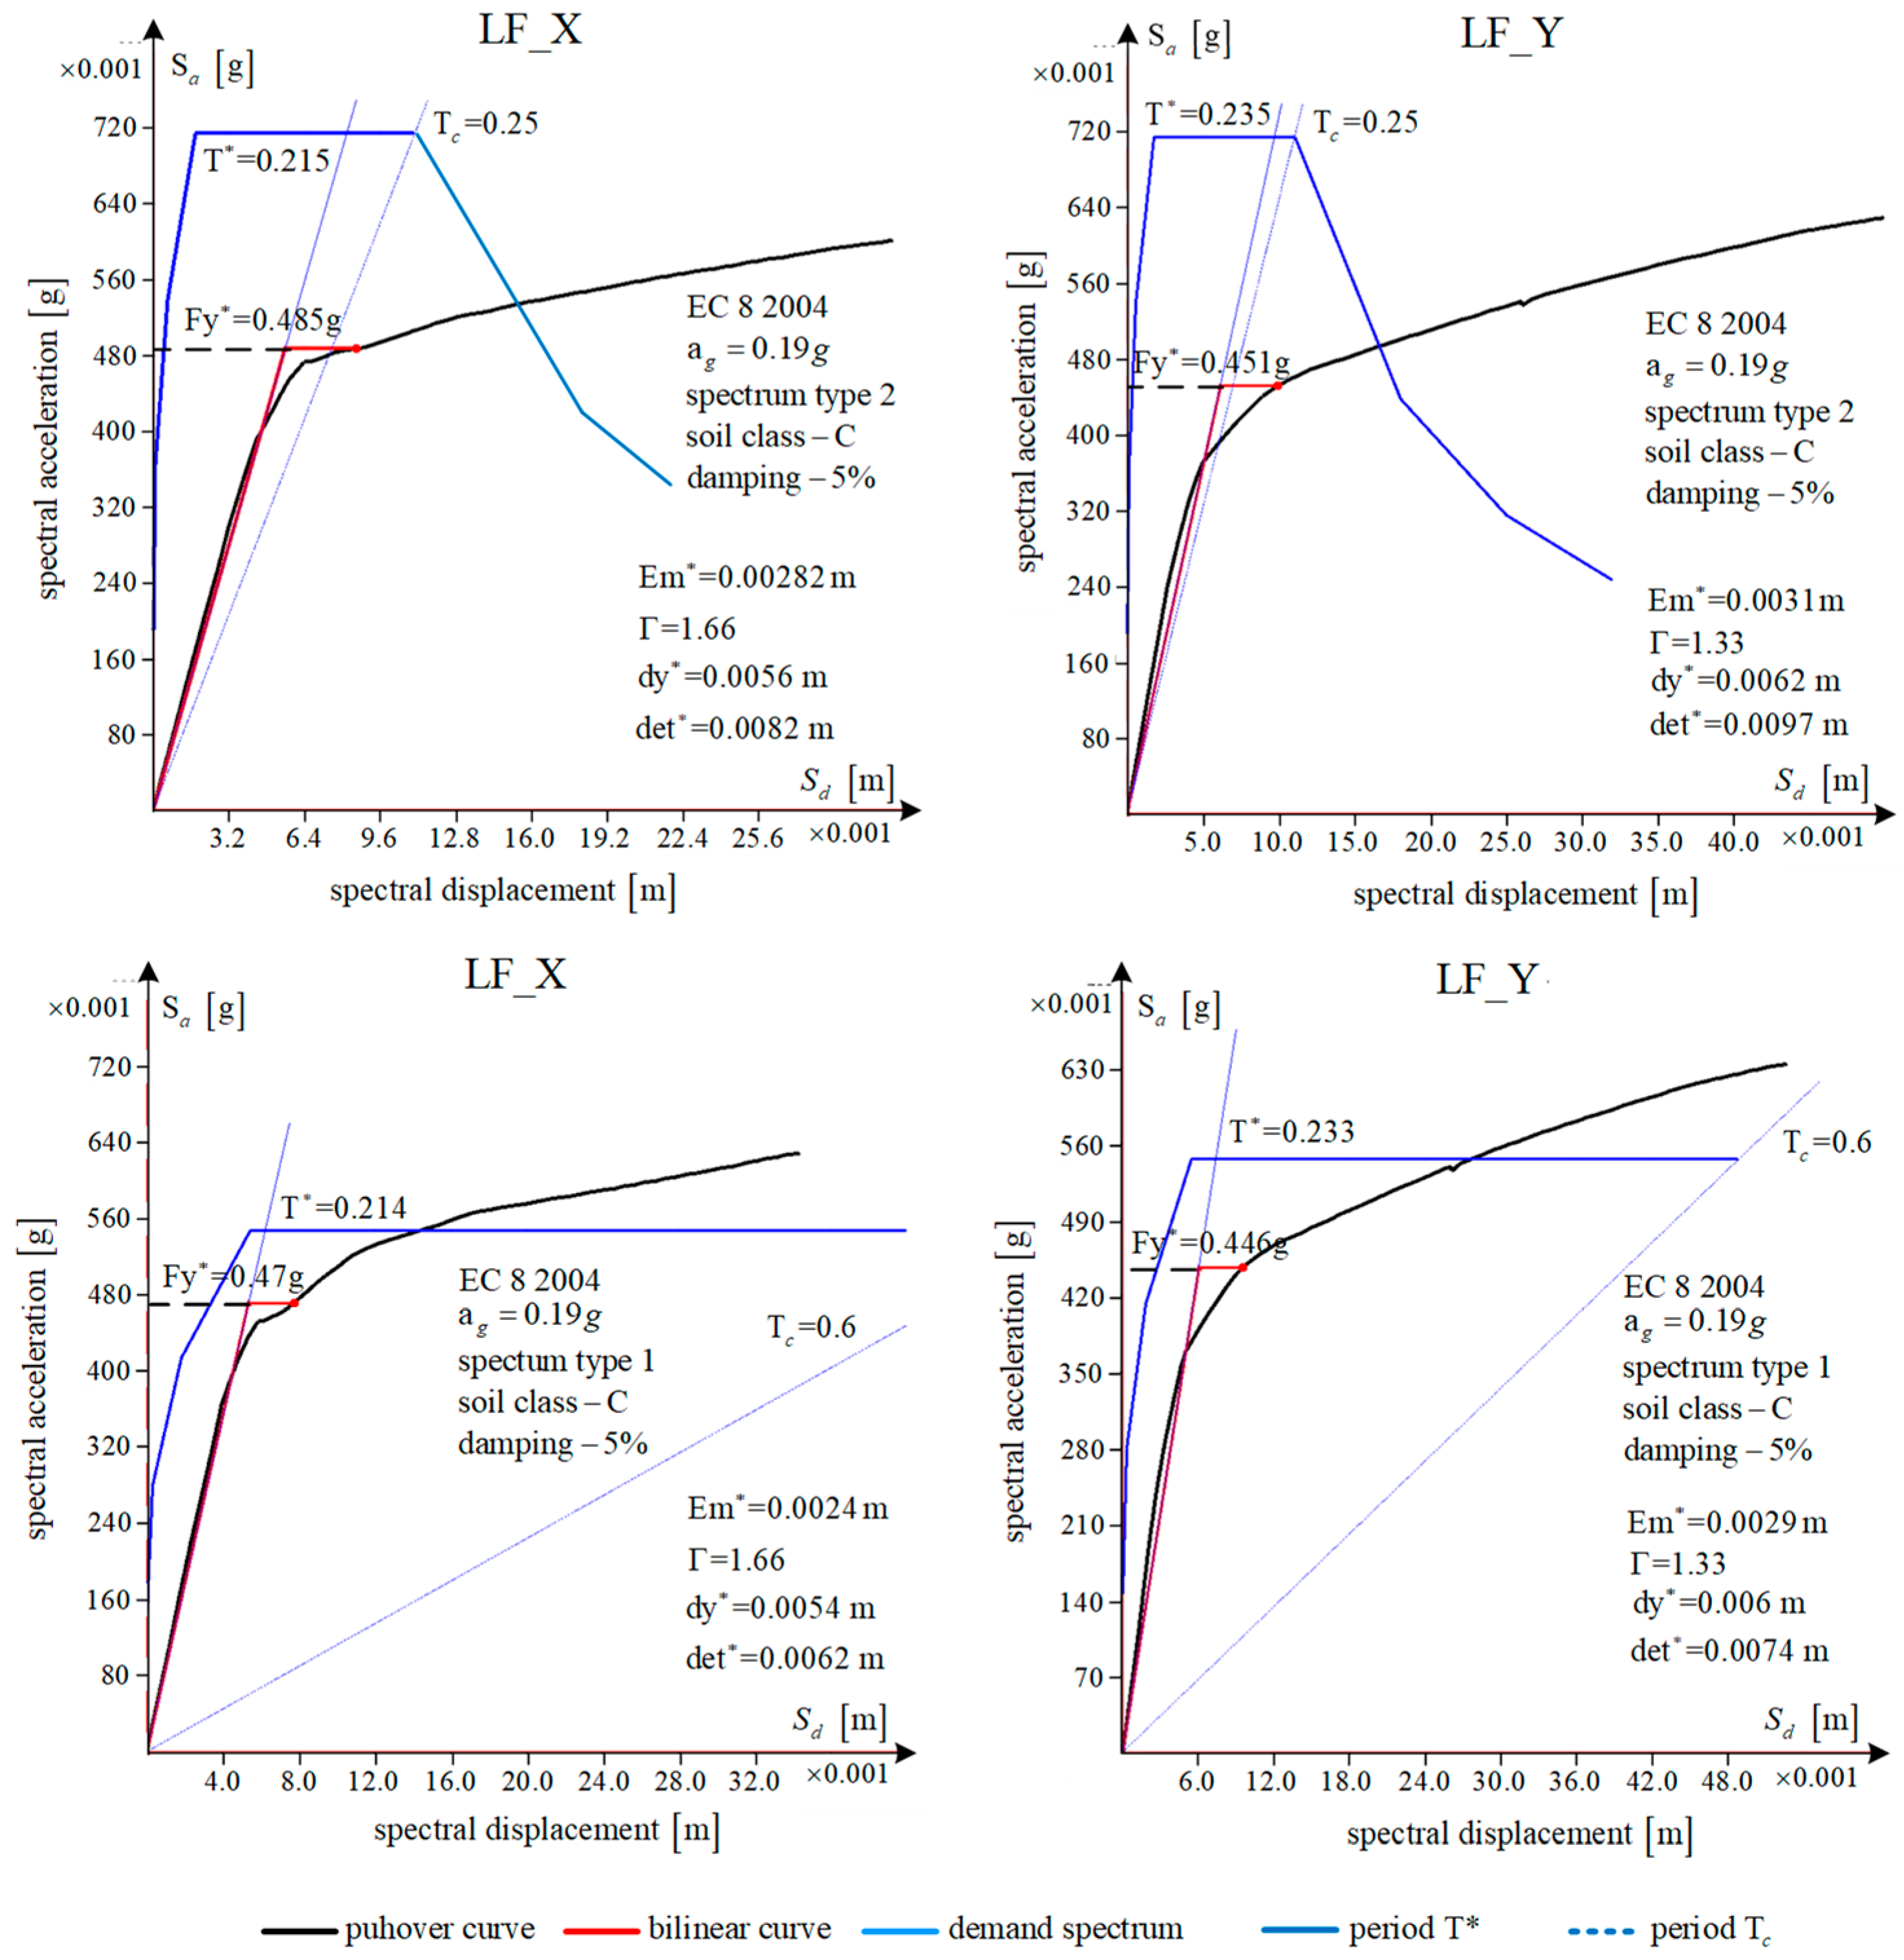
Bearing capacity and building deformation requirement by reducing the system to an equivalent system with one-degree-of-freedom (1DOF) was also determined. The procedure is carried out according to the N2 method [
40,
41]. The
Figure 18 shows the relevant idealized capacity curves correspond to ground acceleration on the bedrock of 0.08g for X-dir and LF load pattern, while for the UNIF load pattern, the value equals 0.11g. On the right, the idealized curves show the idealized capacity curve for Y-dir, which results in 0.14g and 0.15g of peak ground acceleration on bedrock for LF and UNIF patterns of lateral load, respectively. Corresponding critical value of SDI is 0.44 and 0.78, for X-dir and Y-dir, respectively.
3.4. Macroelement Model Results
The second model was created with the program 3Muri [
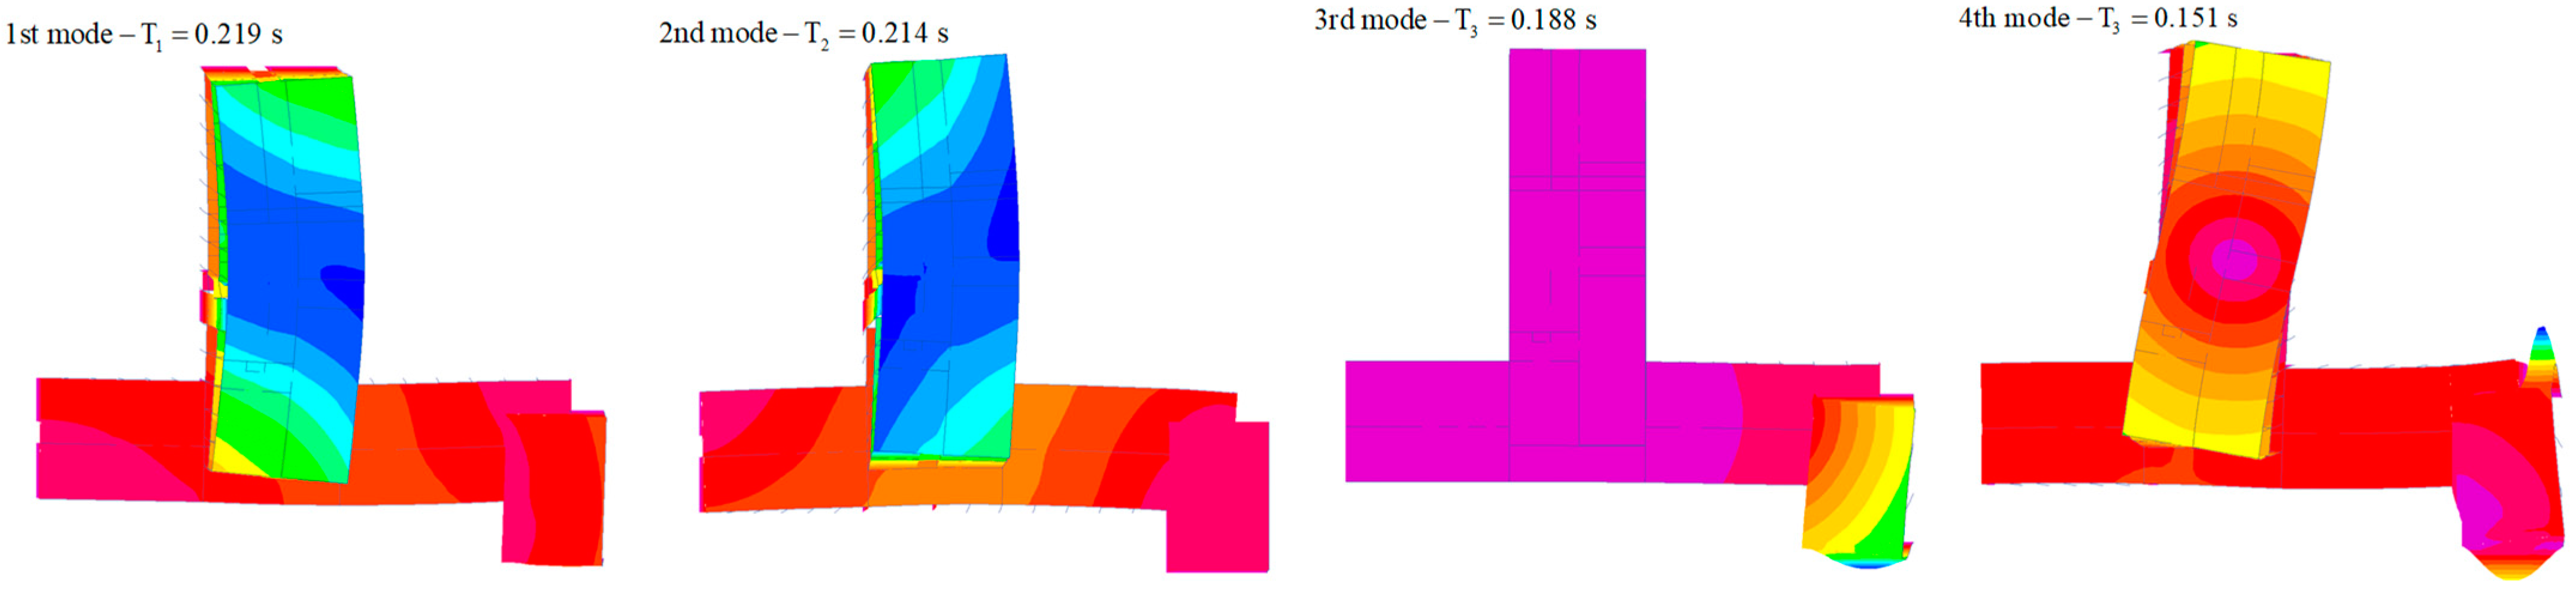
39], as mentioned before. First, the eigenmodes and the corresponding periods are determined for the structure, taking into account the crack state of the elements (
Table 3 and
Figure 19). The first period of the structure is 0.45 s and corresponds to the translation in the X direction, activating 62.5% of the total mass, while the translation mode in the Y direction with a period value of 0.356 s occurs in the third mode of vibration with the participation of 63.1% of the mass, noting that in this mode the torsional deformation is also coupled with the translation Y. Another relevant vibration mode with a period of 0.388 s is the torsion resulting from the deformation of the structure by the floors. However, the program does not calculate the participation of the moment of inertia, so the contribution of the moment of inertia to the corresponding vibration mode is not known.
Pushover curves were obtained separately for each horizontal direction, considering both positive and negative directions of loading and the eccentricity option. The final failure mechanism of the building is presented for the relevant analysis.
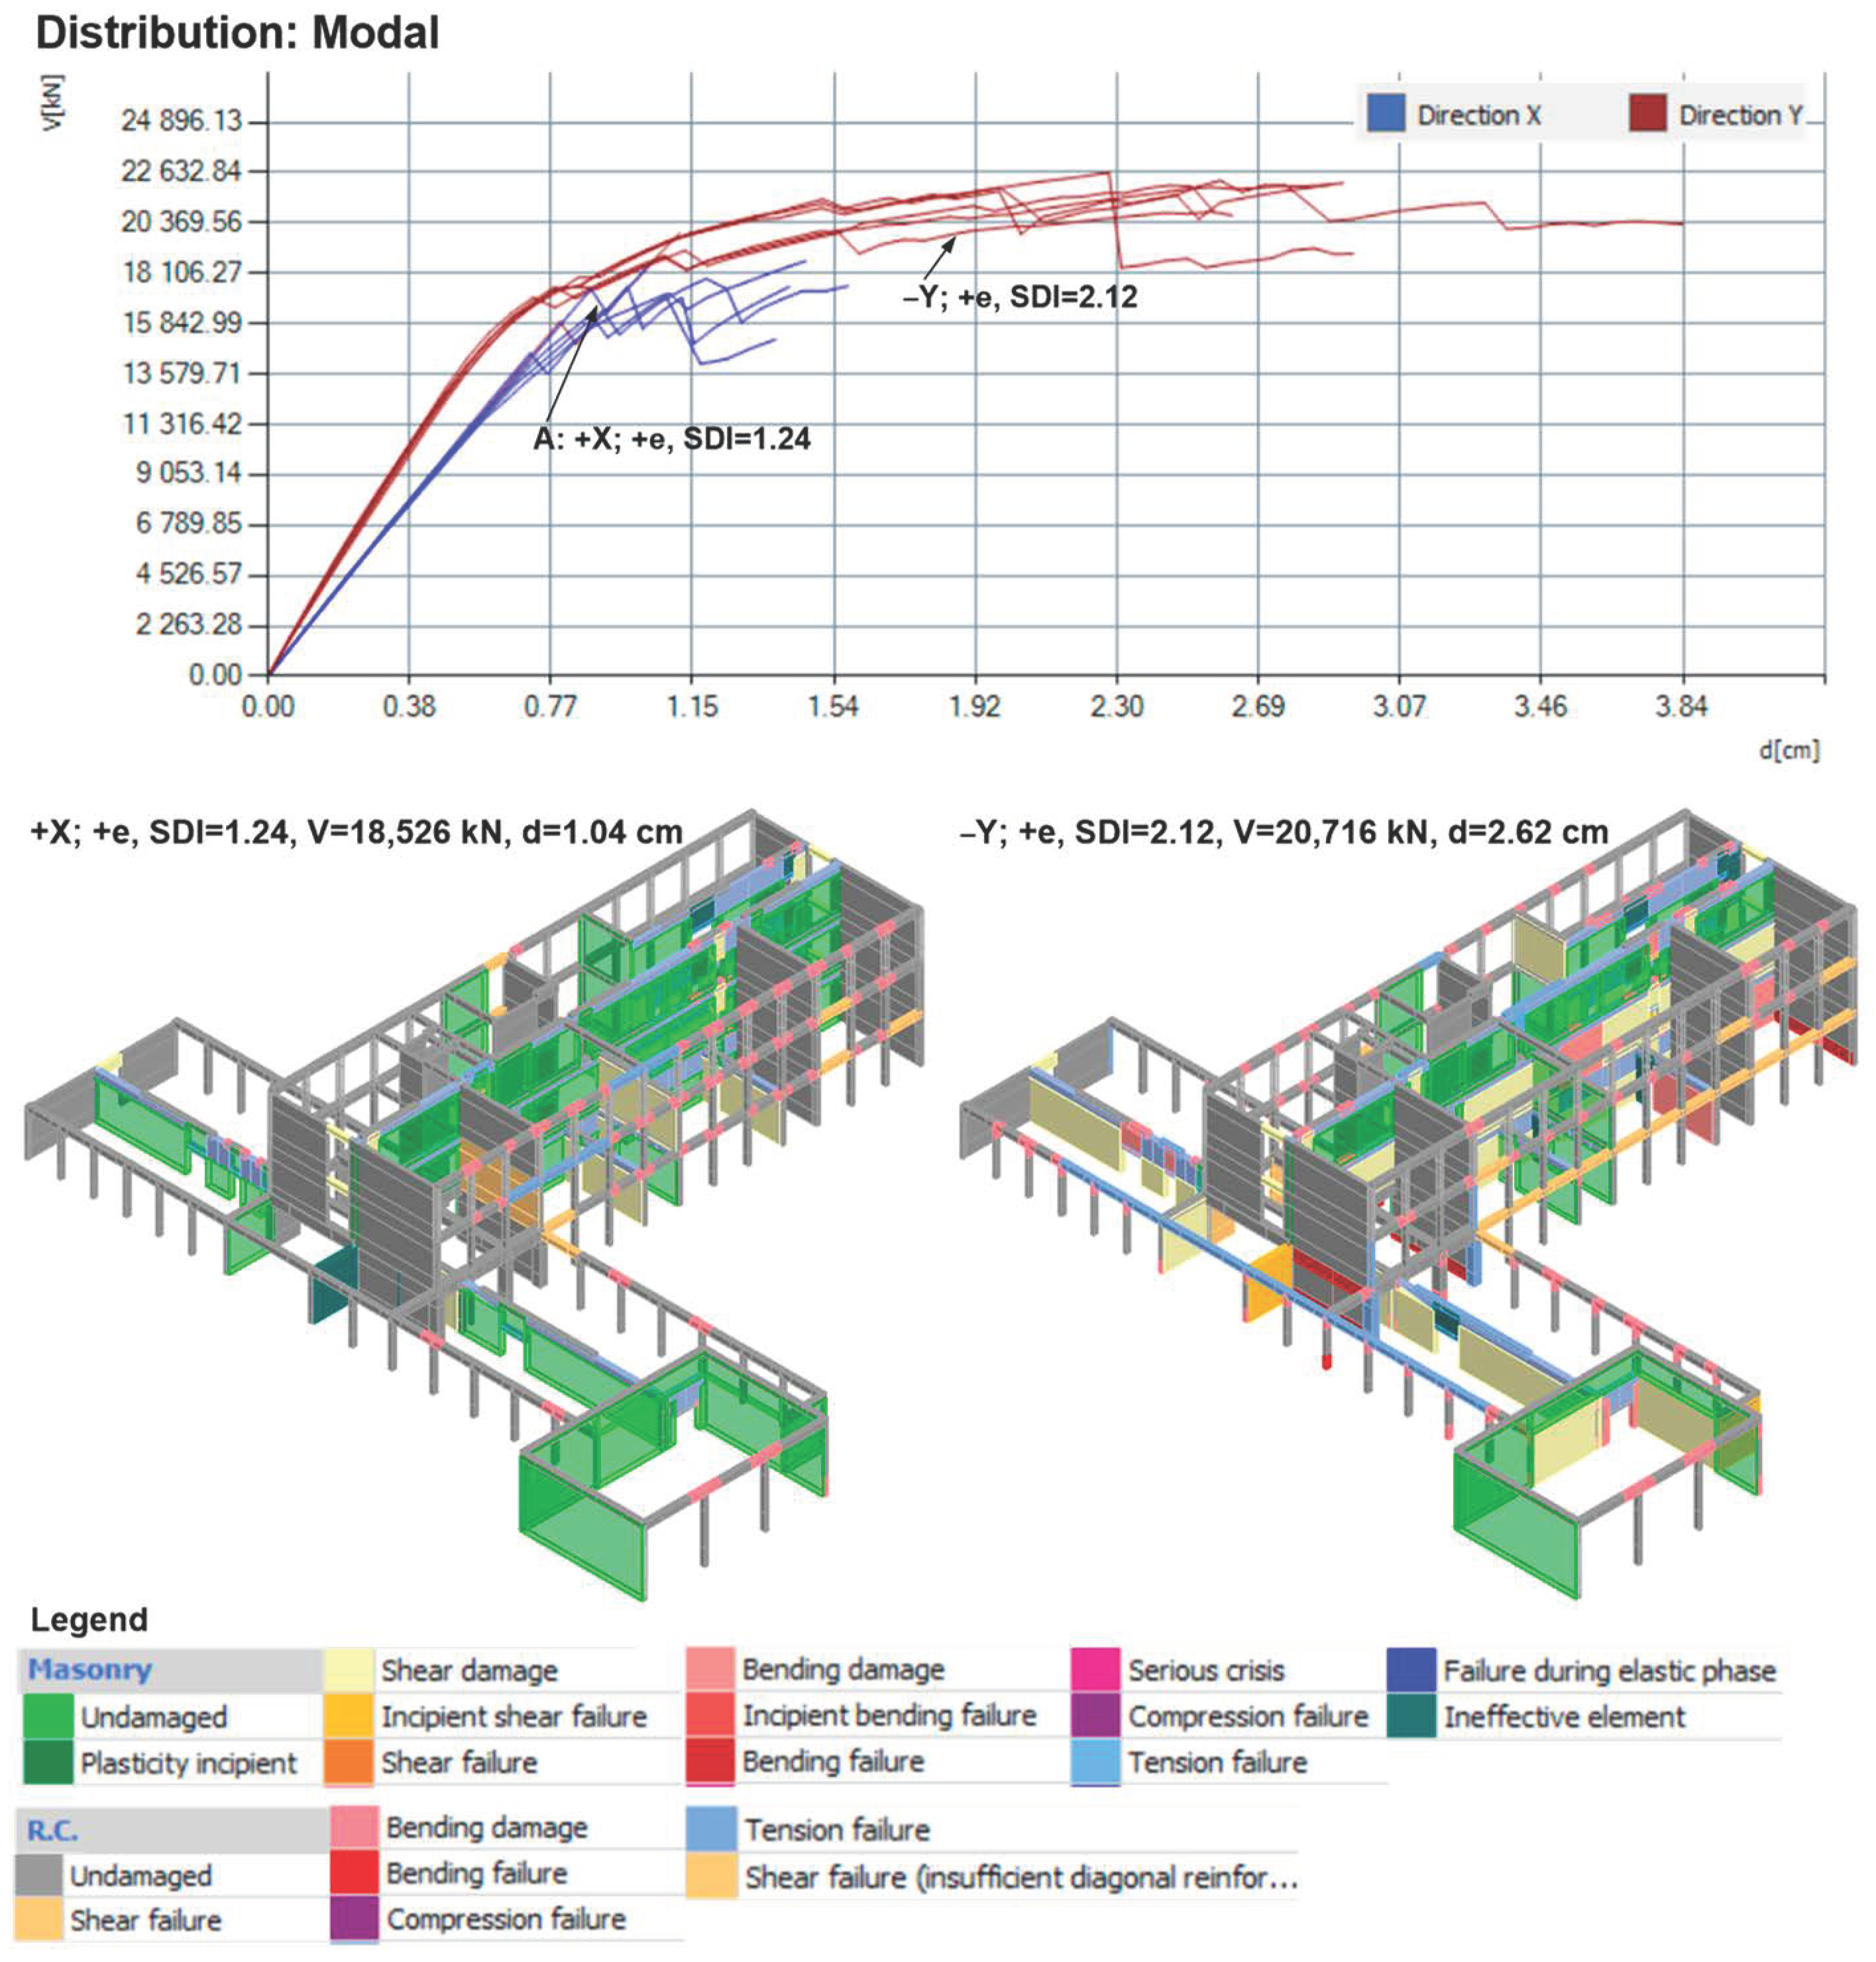
In the case of uniform distribution (Uniform,
Figure 20) in the X-dir, the maximum value of the lateral force ranges from 3700 kN to 4500 kN, and the relevant analysis indicates a failure mechanism caused by the shear failure of the perimeter walls on the P20 axis, and of the walls that are not continuous in height on the axes P14, P21, P23, and P24, as well as the wall of the staircase P7 and the walls on the 2nd floor on the axis P3. Damage also occurs on the elements of the edge frames, most of which is damage to beams and columns due to bending, while the shear failure of beams is visible on axes P1, P2, and P19. The critical value of SDI for the X-dir is 0.52. The pushover curves obtained in the Y direction indicate the structure has a significantly higher load capacity, which is approximately 7400 kN, and the relevant damaging mechanisms indicate that the walls of the ground floor on axis P9 and the walls of the large hall on axis P17 are particularly critical. Furthermore, damage to the walls on axis P1 and P12 due to the shear mechanism is also noticeable, and in addition to this, there is shear damage to the walls in the X-direction on axes P3 and P20. On the edge frames, the failure of the beams at the ground floor level due to shear is critical. The smallest value SDI is 0.71 and corresponds to the +Y-dir and a positive eccentricity value.
The analysis performed for the load distribution pattern according to the lateral force method (Static forces,
Figure 21) proves to be less favorable for the structure than the previous case. Although the relevant structural failure mechanisms remain almost unchanged for the X-dir, the peak lateral force is around 2900 kN and the corresponding SDI is 0.38. In the Y-dir, significant damage is observed on a large number of walls on all floors, and in addition to the shear failure mechanism, there is also damage due to bending. However, the critical elements are the walls on the P9 axis, whose damage is noticeable on all floors. The main analysis performed for this direction has an SDI of 0.71.
5. Conclusions and Discussion
The recent earthquakes in Croatia have led to a series of activities and adaptations of technical regulations aimed at creating a legal framework for the assessment of seismic safety and the level of the rehabilitation of damaged buildings. Reconstruction priorities are certainly housing and critical infrastructure, but other sectors are also crucial for the functioning of society, including health, education, the productive sector, and others. It is extremely important to prevent the displacement of people from the affected area, and for this it is necessary to ensure the functioning of the social community.
The case study building is one of the few higher educational institutions in Sisak-Moslavina County. This paper describes the current condition of the building and its seismic performance of its as-built state. A concept for strengthening the structure was proposed and the seismic performance additionally analyzed. In the numerical analysis, two modeling approaches are employed.
In general, the numerical models showed that the stiffness of the retrofitted structure increased significantly, primarily due to the introduction of new elements but also due to the strengthening of the existing elements. This is evident when comparing the periods of the models of the existing and the retrofitted structure but also when analyzing the slope of the initial part of the pushover curves. The load-bearing capacity of the building has also increased significantly, since the strengthened elements have a higher peak resistance force. The good positioning of the new reinforced concrete elements prevents the local failure of the brittle elements. The ductility of the strengthened system has obviously increased according to the pushover curves, but it should be emphasized that the brittle failure of the columns occurs at the same displacement value as before strengthening. Crucially, the strengthening has significantly reduced the demand displacement. The level of demand displacement is such that there is no failure of the non-ductile elements in the structure.
By using finite element modelling for the as-built state of the building, it can be said that the maximum ground acceleration on the bedrock at which the displacement requirement is satisfied is approximately 0.08g for the X-dir and 0.14 g for the Y-dir. The X-dir proved to be critical (SDI = 0.44), since the dominant bearing system in that direction is frame consisting of columns with insufficient transverse reinforcement that cannot achieve the required ductility. The Y-dir has a higher seismic resistance level (SDI = 0.78), and it meets the requirement for Level 3 according to CTRBS. The model of the retrofitted building showed that the requirement of the modern building code can be achieved. In addition, the building has significant reserve capacity at the prescribed load, and some of the elements are in a state of limited damage, which is to be expected at such an intensity of seismic action. The strengthening made the building relatively stiff, and the displacements of the floors were significantly reduced compared to the existing condition. As a result, most of the columns did not utilize their ductility capacity and remained in a state of limited damage even though they were not directly strengthened.
In another model, by using macroelements damaging mechanism for the as-built state of the building, the results proved to be rather similar. For the same load pattern that corresponds to the distribution according to lateral force method, the maximum ground acceleration is 0.07g (SDI = 0.38) and 0.13g (SDI = 0.71) for X-dir and Y-dir, respectively. For the retrofitted structure, the relevant damaging mechanisms show that in the X-dir the system has less ductility, which is a consequence of the more RC walls. Given that the strengthening in the Y-dir is mainly provided by reinforcing the walls with the RC-jacketing of the masonry walls on the P9 axis, a more ductile behavior of the critical walls is expected with a significant increase in their bearing capacity. It is important to note that in the model of the retrofitted structure, the difference in the bearing capacity of the structure with regard to the X and Y-dir is also significantly reduced. The damage is mainly concentrated on the elements on the ground floor, where the value of the lateral force is the highest, and therefore it is important that all load-bearing elements have certain strengthening measures to ensure the stability of the structure. Additionally, it is important to emphasize that the program has a limitation because it does not assume the ductile behavior of the new RC walls, i.e., the bilinear load-bearing diagram for shear mechanism, which leads these elements to brittle failure.
The eigenperiods and mode shapes do not completely match in the two program packages. There are a number of reasons for these discrepancies, but the most important reason is that they are different methods of numerical calculation. Each pier or spandrel modeled as a finite element has its own discretization and six degrees of freedom per node, while the tree-dimensional rigid nodes of equivalent fame has a total of five degrees of freedom, which are a collection of two-dimensional rigid nodes identified in each of the incident walls, and the nodes belonging to only one wall remain two-dimensional and retain only three degrees of freedom, instead of five. The influence of the out-of-plane stiffness of the elements is present in the finite element case but has been kept to a minimum in order to make the calculation conservative. The deformation of the elements is different in both software packages, which is a consequence of the discretization and formulation of the element. A similar situation is observed when a wall is modeled as an equivalent frame element in a finite element model. Equivalent frame has rigid zones at the junctions of piers and spandrels, which is also an assumption. At the slightest irregular geometry and irregular arrangement of elements in the joint, these influences multiply and discrepancies occur. Nevertheless, it can be said that these differences in the given results are minimal, since in both models it has been shown that the 2nd and 3rd modes are quite close. During an earthquake, the cross sections crack unevenly and the stiffness decreases globally and locally within the element. Therefore, the coupling of the 2nd and 3rd modes is to be expected, even if they do not completely coincide in the different numerical programs.
In the analysis of the as-built state of the structure, both models had very similar results in terms of the significant damage index. However, the damage mechanisms did not completely agree, although they were similar in certain parts of the structure. The difference in damage mechanisms was even more evident in the models for the retrofitted structure. In FEM model, the utilization of the load-bearing capacity of the structure is caused by the failure of the strengthened walls at the ground floor and the capacity utilization of the existing columns, while only a few new RC walls reached the state of limited damage. In the second EFM model, the brittle failure of the new RC walls was critical, but the additional ductility of the structure was provided by redistributing the lateral force to other reinforced elements. However, it is worth mentioning that the 3Muri program is primarily intended for the analysis of masonry structures. Various numerical models and methods are a necessary tool to evaluate the seismic performance of buildings. Therefore, engineers should critically consider the assumptions used in certain models and the results of the analysis to evaluate the applicability of certain modeling approaches.
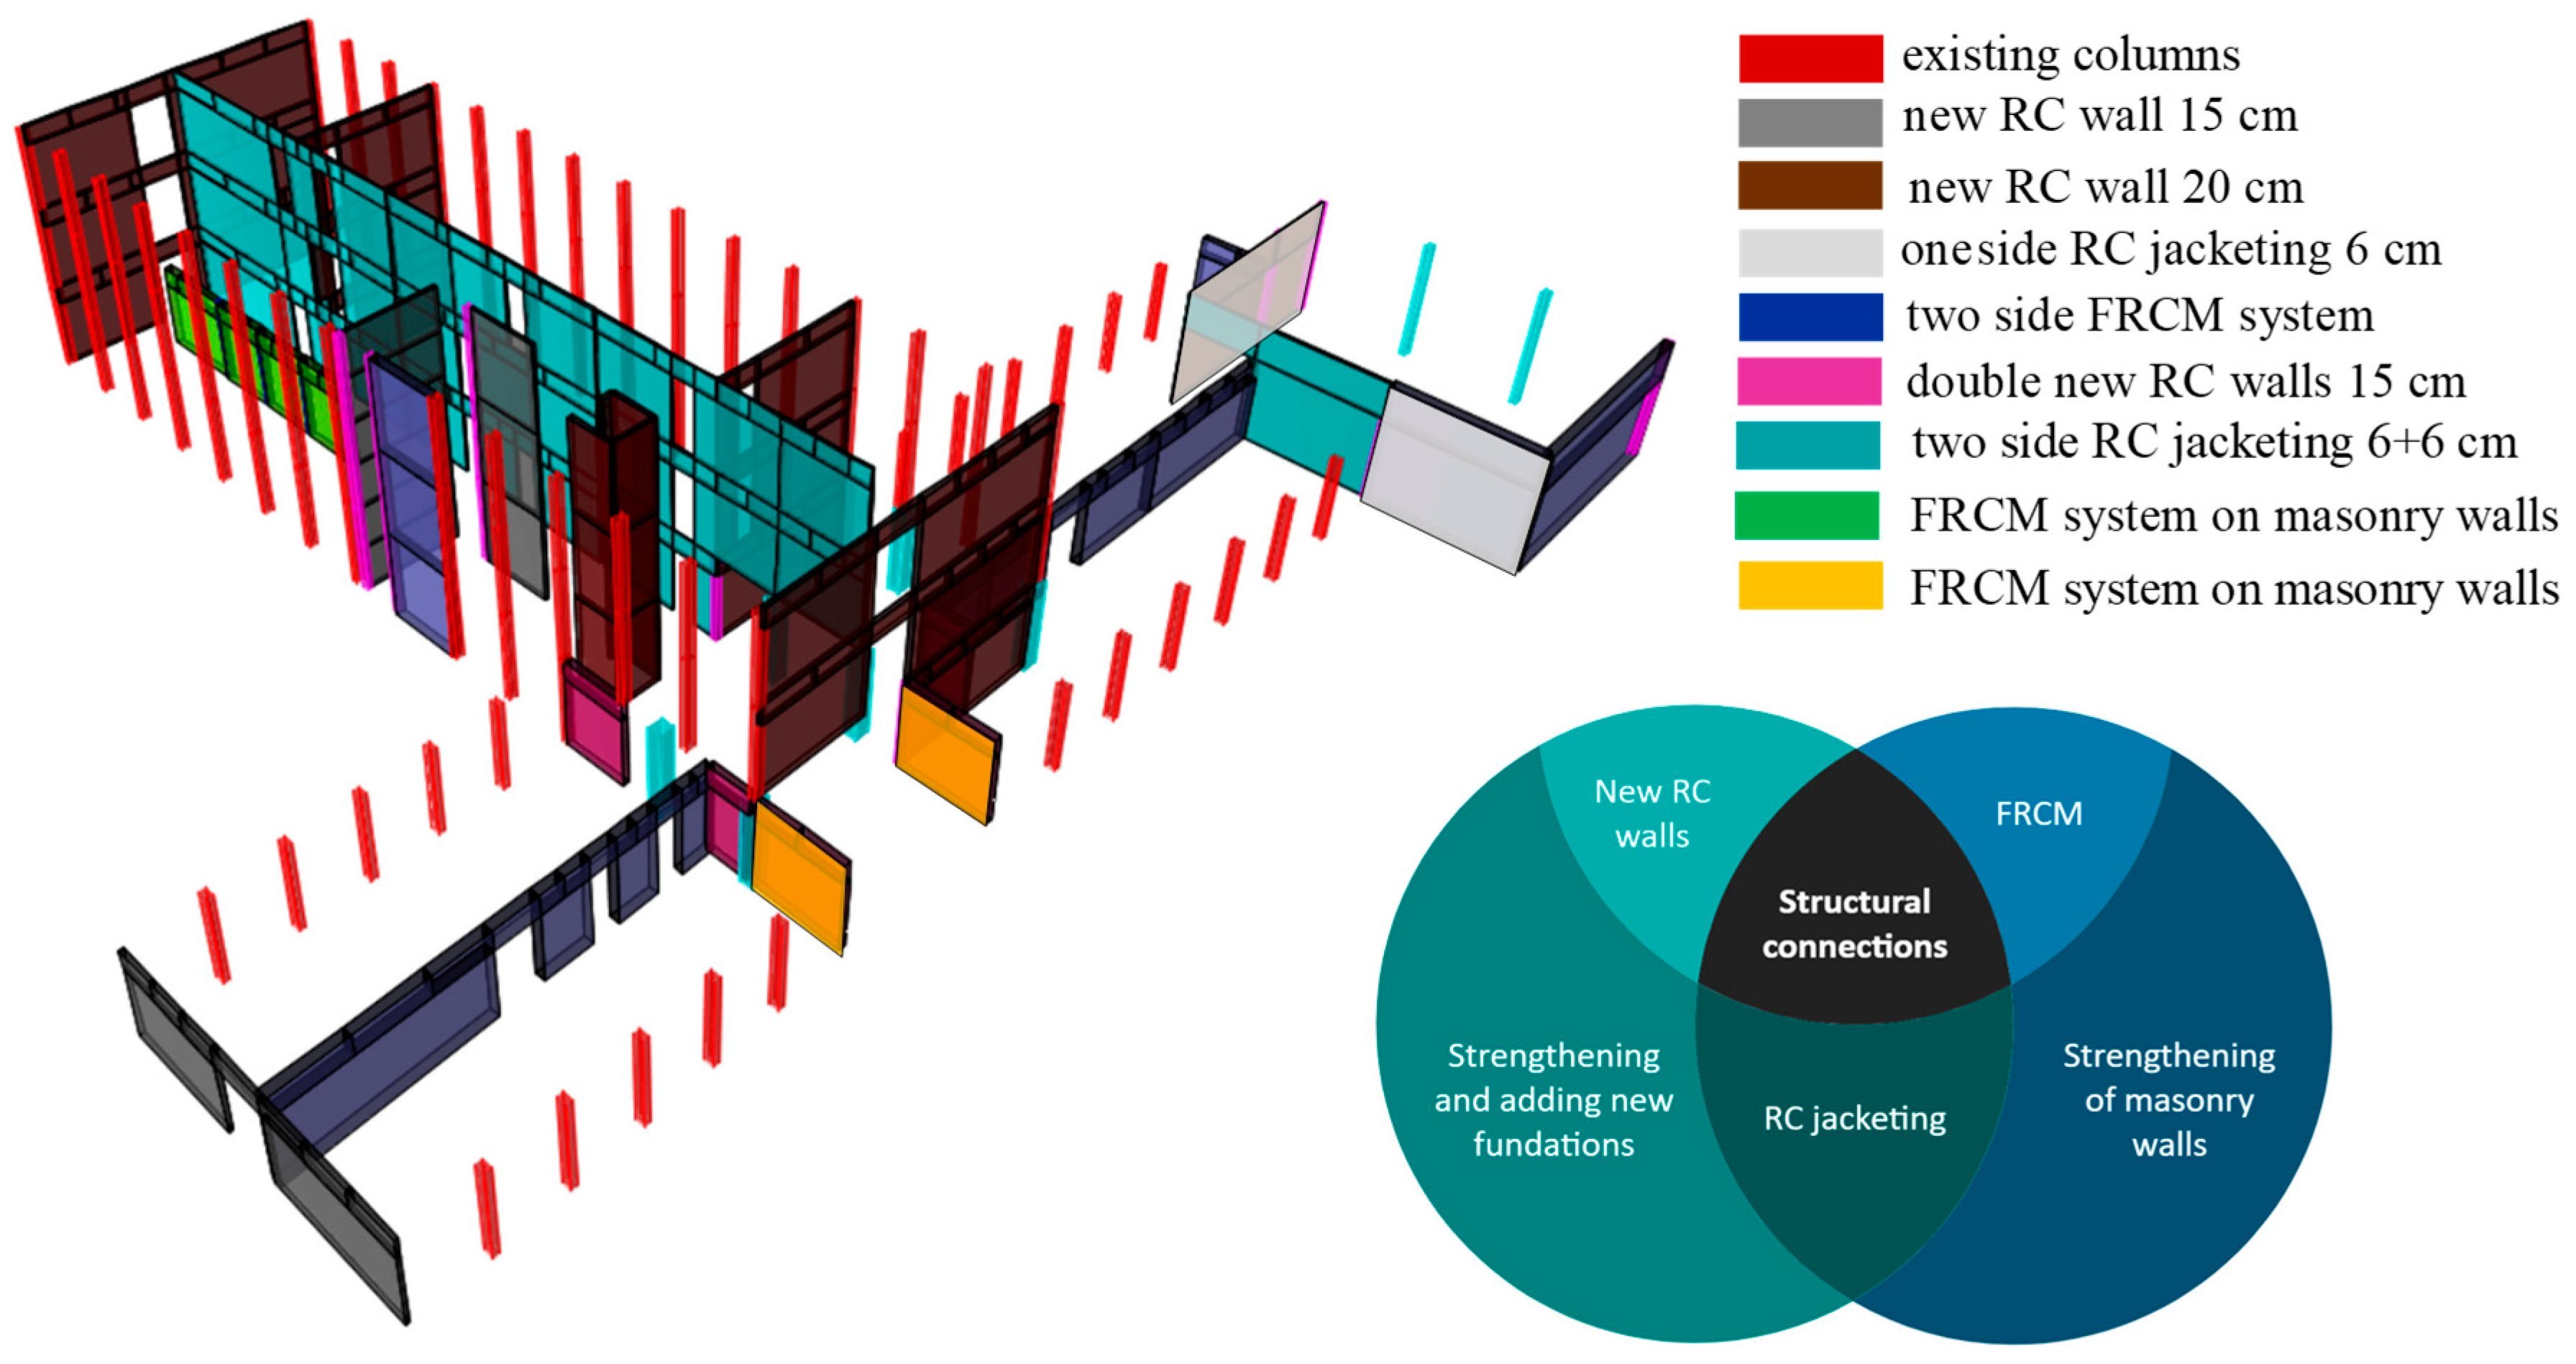
In addition to the aforementioned discrepancies in the use of different numerical models, this paper provides a methodology for evaluating the seismic performance and retrofit strategy of a dual structural system consisting of RC frames and masonry walls. Taking into account the previously mentioned peculiarities, mainly related to the geometric irregularity, the retrofit strategy aims to reduce the interventions in the original frame system, which is the critical structural part of the building due to the expected brittle failure of the RC elements. One of the solutions presented here is to systematically increase the stiffness of the structure so that the ductility of the existing elements is sufficient. This would allow the façade to be mostly preserved. This solution reduces the previously calculated displacements at key points of the structure. The arrangement of the new reinforcement elements is also important and results from the analysis of the failure mechanism. Another important condition is the ability of the diaphragm to efficiently transfer forces to the new elements, so their arrangement should correspond to the stiffness of the diaphragm. This approach leads to the use of different reinforcement systems for certain parts of the building. Thus, in the ground-floor area, the strengthening was carried out with the addition of new walls, RC-jacketing, and the FRCM system, while on the upper floors, new RC walls and RC-jacketing techniques were mainly used in key positions. It is also possible to carry out the solution in steel (bracing, the steel jacketing of RC elements), but it is important to arrange them in such a way that there is no critical displacement of the frame system. The result of this approach is an optimal retrofit solution that provides satisfactory safety and requires a minimum of construction work.
Finally, it can be said that the problem of retrofitting key infrastructure buildings, such as hospitals and schools, is particularly pronounced in earthquake-prone areas. Many of these structures were built after World War 2, when the use of concrete was significant, but the knowledge of seismic design and the ductility of reinforced concrete elements was not yet so well known. Therefore, when retrofitting such buildings, the problem of the low ductility of most load-bearing elements should be solved systematically. Increasing the ductility of columns and beams individually incurs high costs, and retrofitting may be unprofitable. Moreover, such buildings have often been renovated for energy efficiency reasons, which usually means that the façade has been renovated and its removal would cause additional high costs. The analysis of the seismic performance of such buildings should be nonlinear in order to determine the actual load-bearing capacity of the building and the failure mechanisms that can occur during an earthquake. Due to the importance of the building and the sensitivity of the failure mechanism to the initial conditions, it is recommended that the analysis be performed in two different software packages.
The analysis of irregular structures with different structural systems requires a comprehensive approach, since the numerical assessment of seismic performance is not straightforward and requires a high level of engineering judgment. The response of the structure should be monitored and critically considered in order to ensure that the load-bearing elements perform optimally during an earthquake. Further investigations concerning this type of structural system should focus on targeted retrofitting strategies and aim to minimize the cost of retrofitting or consider some constraints, such as the use of certain materials or the preservation of the originality of certain parts of the building—a factor that is commonly required for heritage buildings.


