1. Introduction
The territorial regeneration initiatives aim at a positive transformation of the local system. The sustainable development goal also requires significant attention to the long-term effects of projects and the impact on the most fragile elements of the territory [
1].
The evaluation process of projects represents an essential step in terms of the development expectations and the potential of the resources available to the community. In this sense, the assessment phases should be addressed to identify the best use of scarce economic resources, in order to define the most suitable strategy to both maximize the benefits and minimize the costs. Urban planning, in fact, becomes a fundamental tool to support local governments for the definition of land-use policies aimed at pursuing local sustainable development [
2,
3,
4,
5,
6].
In the context outlined, feasibility assessment and reporting tools have to be drawn up to maximize the possibility of achieving sustainable development goals and to constantly inform the stakeholders about the progress toward the defined aims [
7]. With reference to the sustainable urban growth, one of the most significant purpose is connected to the planning and creation of healthy and livable communities. The mentioned goal is connected to the attempt to consider and integrate the four sustainability pillars—related to the economic, environmental, social, and institutional spheres—in an equitable way [
8].
Planning decisions generate considerable impacts on both natural and built environments. By implementing different tools, planning measures can be applied to address set goals [
9]. These policies should be selected among various potential and possible alternatives. The decision makers must know the effects that these project solutions might bring about [
10], especially considering the limited resources, and that the decisions about the use of them should be made consciously. Therefore, the planner’s choices should be based on the implementation of assessment methodologies able to compare different alternatives and scenarios before their realization. As a result, the evaluation constitutes an intrinsic part of decision mechanism [
11,
12,
13]. It provides a rational support for the verification of the effectiveness and soundness of choices, by increasing their transparency and enhancing the collaborative processes [
14,
15].
In this sense, the project’s evaluation is fundamental for the implementation of interventions, either incorporating ex ante assessment of alternative projects solutions or ex post evaluation of the policy as it is delivered [
16]. In recent years, the smart city has emerged as a model for sustainable territories management. It is capable of achieving sustainable purposes according to which projects need to integrate a high level of flexibility strictly linked to the continuously changing collective needs [
17]. The contribution of local communities [
18] can influence the process phases. The communities’ knowledge can integrate with the experts’ investigations, to describe the current state of the urban area and the ongoing territorial dynamics. The citizens’ needs and interests are crucial for the participatory approach to orient the future design alternatives, to propose project variations and to assess the initiatives impacts on the existing status quo [
19].
Urban and regional planning can be considered an evolving process and the need to combine assessment and interpretative methods is always growing, aimed at identifying governance policies for the sustainable local development [
20,
21]. In the framework illustrated, the increasing inclusion of private investors in regeneration interventions, due to the current economic conditions, is verified [
22,
23,
24,
25,
26]. At the same time, the degraded urban areas’ recovery need makes it even more urgent to promote evaluation tools able to (i) verify the financial feasibility, (ii) quantify the collective costs and benefits, and (iii) define adequate cooperation strategies for the identifications of the roles and risks for the parties involved.
The present research is part of the wider topic mentioned. Among several cases in which regeneration projects are necessary (run-down public buildings enhancement, unused properties refurbishment, collective green spaces renovation, degraded or abandoned urban areas recovery, former industrial sites function reconversion, polluted former factory buildings, including vacant properties, restoration, etc.) brownfield site redevelopment initiatives are analyzed. Borrowing the operative logic of the break-even analysis (BEA) [
27,
28,
29,
30], in the present paper a non-linear evaluation method is developed. The method can be used in the preliminary design stages able to “quickly” verify the financial feasibility of urban regeneration projects, by overcoming the unrealistic—in specific conditions—hypothesis of unit selling price stability (a basic assumption of the classical BEA technique). In this sense, the proposed evaluation model represents an innovative tool to be used in the decision-making processes that neglects the assumption of the invariance of unit selling prices due to discount mechanisms that occur in the real market in the bargaining phases between sellers and buyers. Therefore, the model contributes to fill the gap in the reference literature between the existing assessment methods based on the BEA and its simplifying hypothesis related to revenue linearity, that ignores the real market phenomena for which a growth of built floor area corresponds to a decrease in unit price.
The proposed model could be included among the ex ante evaluation techniques aimed at preliminarily assessing the feasibility of the investment, prior to the site works. As ordinarily carried out, within the project life cycle, the forecast verification of investment feasibility through the costs and revenues estimation is included in the first phase of project conception. In this sense, the ex ante evaluation is carried out within the design steps in accordance with their technical deepening. The in itinere evaluation intends both to identify the work variants during the construction phase and to assess the incidence on first analysis. Finally, the ex post evaluation aims to verify the congruity of the built intervention with previous convenience analysis.
The present research is organized into six sections. In
Section 2 the aim of the paper is clarified.
Section 3 provides a general analytical framework related to the brownfield site’s clean-up and functional reconversion issue.
Section 4 illustrates the literature review on two topic: the first one is an analysis of the national and international literature on the influence of brownfields on real estate market, the second one is related to the examination of different studies that have implemented the BEA for different purposes. In
Section 5, the proposed evaluation model is described: starting from the main aspects of BEA, the model implementation, by considering the absence of linearity revenues hypothesis, is presented. In
Section 6 the model is applied to a case study: in detail, the case study is described, the economic parameters necessary for the implementation of the model are summarized and the results obtained are outlined. Finally, in
Section 7 the main findings of the research are discussed, and the practical implications of the developed methodology and possible future investigations are explained.
2. Aim
The present research aims to define an evaluation model for supporting the public and private investors’ decision-making towards the effective planning of brownfield recovery projects.
The current need to carry out appropriate assessments, preliminary to the implementation of brownfield regeneration interventions, often “collides” with the scarce reliability of traditional models that do not always consider the real market mechanisms.
In particular, the uncertainty of the future market trends connected to the current socio-political situation and the persistent financial crisis [
31] make the definition of effective evaluation tools necessary for the development of valid sustainable strategies on the territory. The real estate market volatility associated with unexpected and relevant shocks that determine changes in the structural dynamics and sellers and buyers’ behaviors require the implementation of flexible models, able to verify the feasibility of the interventions according to the real market phenomena.
In this sense, the proposed model is innovative compared to the standard residual methods, ordinarily used for the valuation of vacant land ripe for development or of land and building/s with the potential for redevelopment or refurbishment [
32]. In fact, the developed model takes into account the scale economies or/and discount mechanisms connected to the selling prices dynamics in the cases in which large floor areas are included in the regeneration initiative.
In particular, the model derives from the BEA logic. By considering the contexts of small urban centers or a new planning that includes a relevant number of new buildings and/or the functional reconversion of existing disused complexes, a real estate oversupply compared to local demand can be detected. Therefore, the hypothesis of the total revenue (Rt) linearity is inconsistent, as the ordinary inelasticity of property supply is not verified and selling prices will tend to become depressed. In general terms, according to the microeconomic theory of the firm, Rt is obtained by multiplying the quantity of the goods or services (q) by the unit selling price (pu), i.e., Rt = q ∗ pu. In the situations mentioned, the invariance of the unit selling price (pu = constant) to be used in BEA does not reflect the reference market. In fact, the new floor areas to be introduced are relevant and, according to the current real estate demand, abundantly satisfy the detected requests. This determines the need to analyze targeted discount mechanisms that justify the unit selling price decrease in correspondence of the amount of gross floor area (GFA) increase. In these cases, BEA standard assumptions could constitute a rough limitation for the outputs obtained and, therefore, could invalidate the entire analysis. In this sense, in the preliminary phases of decision-making processes the proposed evaluation model could help (i) public entities to identify, by considering different prices and costs scenarios, the GFA to be built and to be sold, capable of reaching the break-even point of the initiative’s financial balance, and (ii) private investors to quickly verify financial feasibility, by taking into account a more consistent framework of a simplifying hypothesis, in which the one related to revenue linearity is scarcely valid.
3. The Brownfields: The Main Aspects
During the last decades, brownfield site recovery has emerged as a sustainable land use strategic measure and an incentive for urban revitalization [
33]. Throughout Europe, the redevelopment of brownfields assumes a fundamental role in avoiding urban sprawl and increasing the environmental quality, for an effective territorial development [
34]. In theoretical terms, brownfields are defined as “sites that have been affected by the former uses of the site and the surrounding land; have real or perceived contamination problems; are mainly in developed urban areas; are derelict or underused; require intervention to bring them back to beneficial use” [
35,
36].
The main issues related to the environmental recovery of contaminated sites assume relevant importance both locally and globally. They constitute one of the major priorities on the agenda in national plans for the safeguarding of public health and environmental protection. The positive effects mainly regard (i) the environment, in terms of protection of the territory and reduction of polluting loads, (ii) the society, in terms of public health protection and redevelopment of degraded areas, and (iii) the economics, by considering the impacts on the areas directly affected and the surrounding ones.
Since a contaminated site implies a danger to the environment and people, the brownfields located in strategic geographical positions (for commercial and productive activities, for the presence of primary and secondary urbanization, or the proximity to important urban and suburban traffic roads, to public transport lines, etc.) offer concrete possibilities to be not only cleaned up, but also transformed into more profitable areas, i.e., able to generate income.
In these situations, private investors are interested in participating in the transformation initiative—in terms of its financing—to manage the future redeveloped areas and to enjoy the benefits resulting from their reuse. In the framework outlined, several requalification typologies are carried out. The first concerns a “hard reuse”: it includes a complete renovation of the buildings located on the area to be cleaned up through demolitions and reconstructions. The second one is a “soft reuse”, for which the full edification is not provided, and the soil is biologically productive. The two typologies are not mutually exclusive. They can be implemented together in a specific recovery project where a portion of the soil to be regenerated remains waterproofed and built up, while in the remaining part green areas are included [
37].
By considering the persistent lack of free spaces to assign to residential, commercial and industry construction, and the current political attitudes strongly orientated towards the creation of a more sustainable built environment, increasing attention must be focused on the city spaces and, mainly, on the areas to be redeveloped.
Thus, in recent decades, territorial development policies have aimed to promote the territory reuse by identifying the available urban areas to recover and leaving the greenfields unchanged, i.e., the non-anthropized areas. The removal of the environmental risks associated with brownfields and the re-entry of the recovered areas on the real estate market are significant. Therefore, the definition of overall interventions aimed both at solving pollution problems and at urban regeneration in the surrounding context is crucial in the political debates. Many governments have already adopted various initiatives for the achievement of these two main purposes, in line with sustainability goals. The measures include (i) the establishment of public registers of contaminated soils and the obligation for the parties involved to carry out exploratory soil analysis; (ii) the implementation of rational land use planning policies, which take into account the land capacities, and aimed at the preservation of greenfields; (iii) the stipulation of agreements between public entities and private partners, able to activate operations for brownfield reclamation; and (iv) scientific research in the field of risk assessment and management methods for the analysis of the effective tools to be used by the subjects involved in redevelopment interventions. Currently, the main obstacle to activate projects on contaminated sites is represented by the high redevelopment costs, as these are strongly associated with the pollution level and with the types of pollutants. In addition to the high costs associated with brownfield redevelopment, legal and regulatory obstacles and community opposition constitute significant aspects to be considered in the contaminated site’s recovery. In theoretical terms, the brownfield transformations are limited by some difficulties connected to the management of territorial government tools. For the developers, the obstacles are those of large urban projects, with the further aggravating factor of the presence of pollutants, both in terms of higher costs and greater complexity of the decision-making process. Brownfield initiatives are riskier investments than large urban projects, mainly due to (i) the scarce spread of the skills necessary to manage the procedural problems related to polluted sites, (ii) the excessive time of the decision-making process relating to large urban projects, that is even longer when reclamation interventions are needed, and (iii) the uncertainty of the costs—and also on the results of the intervention—connected to the lack of information on pollutants and the project variants that may become necessary within the bureaucratic procedures before the approval of the final reclamation plan. The red tape makes the complex process to obtain the regular authorizations highly intricate, also due to the different involved public and private stakeholders and the professionals (engineers, urban planners, landscape designers, ecologist, etc.).
The European urban contexts are characterized by the frequent presence of abandoned areas that no longer perform the economic function for which they were initially developed and redevelopment interventions are mandatory, for re-thinking their potential use [
38]. With reference to the Italian context, in 2020 about one hundred million square meters of abandoned industrial areas were located in the national territory. In the last years, different political actions have been carried out to support the sustainable urban transformation. A set of virtuous examples of brownfield redevelopment has been developed, e.g.,: the recovery and functional reconversion of the former Federconsorzi chemical plant of the city of Naples-Bagnoli; the demolition of the former Italgas facility in Turin and its transformation into a university campus; the conversion of the former Ferrero steelworks (Settimo Torinese) into a residential and commercial complex; the refurbishment of the Italsider building located in the city of Genoa for the introduction of productive and commercial activities; the realization of a new urban district with residential, retail and service functions through the reconversion of the industrial properties of the former Ansaldo mechanical workshops (Genoa); the removal of the former “Fabbrica Italiana Tubi” in Sestri Levante (Genoa) and the realization of an urban green area and of a sport center; the transformation of the former Agip refinery (Milan) into a fair complex; the recovery of the former Fiat car plant (Florence) for residential and commercial buildings introduction; the transformation of former Mira Lanza chemical facility (Rome) into exhibition areas, theatre and university residences; the complete demolition of the former “Molino De Cecco” (Pescara) and the realization of a polyfunctional complex; the creation of a new urban hub for cultural and commercial activities in the former distillery located in the city of Barletta (Bari).
The disposal of industrial buildings constitutes the main cause of the rise in urban voids. In the period between the early 1900s and the 1970s, the rapid development of industrial plants determined the demand for consumption growth. Consequently, the production increase created a market with demand and supply based on mass consumption [
39]. Moreover, the growth of urban centers was also linked to an increase in the population that moved from rural to urban centers. However, the disposal phenomenon is not only connected to the industrial complexes’ removal or transfer but also to the infrastructures and services progress [
40]. Between the 1970s and 1980s in most European cities, the industrial sector was affected by strong changes mainly associated with industries downsizing—due to the technological adaptations in production to the market demands—in addition to the relocation of facilities [
41]. Currently, the perception of urban voids as a “resource” connected to their geographical, physical and morphological characteristics supports the definition of strategies for the reuse of these areas. The different issues related to the former industrial sites’ functional reconversion are primarily associated to the possible soil contamination and the consequent need for environmental restoration and, therefore, to the high costs necessary for clean-up operations. In particular, the critical and complex aspects relating to the redevelopment of abandoned areas concern (i) the levels of pollution, strictly associated with the type of activity present before the disposal and which will influence the costs based on the type and the quantity of pollutant in the soil; (ii) the new technologies and materials to be used, that must be compatible with the environment; (iii) the industrial identity of the area that should be integrated and preserved with the new project (where possible) in order to protect the historical memory of the place; and (iv) the need to introduce new urban standards, often large green areas and the requirement to comply with the regulatory plan in force.
The complexity of these initiatives regards all their phases (design, implementation, management), by taking into account the difficult forecast of the project’s social effects, such as the creation of new jobs and the introduction of functions able to satisfy the community’s needs [
42].
In general terms, in addition to the financial topic, firstly linked to the considerable clean-up costs, in the brownfield redevelopment initiative, the environmental aspects should be considered. In fact, for areas with soil pollution, a greater difficulty in re-entering in the market are usually detected, especially due to the very long waiting times.
It is known that urban recovery interventions are characterized by higher and less-predictable cost items and execution times compared to the ex novo realization. This difference is more significant when the clean-up costs and the restrictions imposed by administration and the community for the urban regeneration are greater [
43]. For these reasons, the brownfields’ renovations qualify as environmental and urban regeneration, since they involve soil recovery through reclamation procedures and the brownfield site reconversion with targeted measures of functional reconversion [
44].
4. Literature Review
The issue of contaminated site reclamation represents one of the most difficult environmental questions to be solved, both for the technical, legal and economic aspects, and for the social implications. The polluted area’s recovery allows the restoration of soil which, according to the sixth IPCC report 2021 on climate change [
45,
46] constitutes a resource to be protected, as it is able to absorb part of the carbon dioxide emitted into the atmosphere and to preserve the permeability function for rainwater.
Within the Next Generation EU [
47], in Italy, the National Recovery and Resilience Plan [
48,
49] includes the issue of the remediation of “orphan sites” among the measures and goal to be achieved. These areas should be reclaimed, but the subject responsible for the contamination cannot be identified or it is not possible to attribute the clean-up costs to a specific one. In order to redevelop the polluted sites, and to transform them into a resource for economic development, the land reuse and the reclaimed areas’ reintegration in the real estate market are strongly promoted. These strategies constitute a necessary tool for the protection of the environment and human health, playing an important role also for the purpose of territory enhancement. The Italian legislative framework related to the clean-up of polluted sites is included in Title V of Part Four of the Legislative Decree 3 April 2006, No. 152 [
50]. It regulates the environmental remediation and restoration of contaminated sites and defines the procedures, criteria and methods for carrying out the operations necessary for the elimination or the reduction of pollutant concentrations, in line with EU standards, with particular reference to the ‘polluter pays’ principle” (art. 239, subparagraph 1). The EU cohesion policies have assumed a key role in the rehabilitation of industrial sites and contaminated land. In the 2007–2013 period, more than EUR 3 billion were allocated to the regions for their strategic programs aimed at including new productive investments and new infrastructures with high standards of sustainability. In 2021, the World Health Organization [
51] published a report with the findings of an expert consultation on the redevelopment of contaminated sites for new urban intended uses, to evaluate the interventions impacts on the health and environment and to identify valid practices to support effective projects.
Disused industrial buildings have generated physical, environmental and social degradation processes and, simultaneously, represent an opportunity to re-design urban spaces and re-think the functions and services distribution. The environmental remediation projects imply an accurate identification of the buildings’ and areas’ stock in order (i) to define a priority lists of interventions to be carried out, (ii) to promote a resilient organization of the city and (iii) to plan new community spaces [
52].
The relationship between the presence of brownfields and the real estate market is examined in the reference literature in terms of a decrease in the demand for properties adjacent to these areas for both rent and sale. A study developed by Confindustria [
53] investigated the likely positive effects of investments in brownfield rehabilitation for the Italian public sector. In particular, the research has proposed an estimation for the comparison of the disused industrial public areas renovation costs with the benefits for the economic system, in terms of employment increases, new investments and positive effects for public finances. Through an input–output analysis of the sectors involved in the remediation activity, the results of the model have been used to assess the effect on general taxation. In 2015, an increase of approximately EUR 1.6 billion in terms of direct taxes, of over EUR 1.7 billion in terms of indirect taxes, and an overall increase of approximately EUR 1.4 billion in terms of greater social contributions have been detected.
In terms strictly related to the real estate market, the brownfield area inside a city has negative effects on the real estate market. With reference to the city of Milan (Italy), Gibilaro and Mattarocci [
54] evaluated the economic effects of abandoned areas, by studying the impacts of brownfield areas on prices and rent values of property assets located within 2 km. The authors outlined that houses and shops are the most sensitive sectors to the proximity of brownfield areas. The lower rents or prices that characterize the properties close to brownfield areas represent a direct economic cost borne by the community that could be avoided through intervention policies of the local authorities to support urban regeneration [
55].
De Sousa et al. [
56] estimated the impacts of publicly assisted brownfield redevelopment in Milwaukee and Minneapolis (United States). The research showed that the increase in nearby residential values is relevant in both volume and geographic extent. By considering approximately one hundred brownfield projects, a hedonic method to quantify the variations of property values was implemented. The obtained results confirm the expected ones, by attesting that the spillover–in terms of surrounding property value growth—is considerable, equal to +11.4% for the close residential prices in the city of Milwaukee and +2.7% in Minneapolis.
In order to orient political decision makers towards strategies able to reap the maximum economic benefit from brownfield redevelopments, Woo and Lee [
57] examined the brownfield redevelopment’s impacts on neighboring housing prices in Cuyahoga County, Ohio (United States). By comparing the trends in housing prices before and after the remediation based on housing sales data from 1996 to 2007, the research specified how the effects of brownfield renovation vary under different land use once the intervention is complete. The findings attest that after the brownfield clean-up, the negative impacts of contaminated sites on neighboring housing prices are removed. With reference to the US Environmental Protection Agency Brownfields Program, the identification of the effects of brownfield remediation has been analyzed in Unites States also by Haninger et al. [
58], who found property values increased by an average of 5.0% to 11.5%.
Moreover, Linn [
59] focused on the Site Remediation Program in Illinois (United States). He estimated the effect of brownfields certification on nearby property values, by determining that the certification of a brownfield 0.25 miles away grows the property value by approximately 1% compared to an analogous one. The impacts decrease approximately inversely with the distance between the brownfield and the property. Also, Mihaescu and vom Hofe [
60] demonstrated that brownfield sites have a significant influence on the neighboring one-family residential property prices when they are located within proximity to them. More specifically, by using the outputs obtained from the Spatial Error Model or the Spatial Autoregressive specification, the authors evaluated brownfields in the City of Cincinnati, Ohio (United States). They determined a reduction in housing prices of as much as 19.96% to 21.93% for the properties adjacent to contaminated sites. A study developed by Savchenko and Braden [
61] observed that brownfield clean-up in New York (United States) led to a housing prices increase of 8% or 1%, depending on whether sustainable forms of redevelopment take place.
The negative (environmental and social) effects of brownfields jeopardise residents’ health and well-being, by making close areas less attractive for employment and investment, and determining selling price discounts. Zihannudin et al. [
62] carried out extensive studies on the property market sensitivity to brownfield sites through a critical review of previous relevant researches. They confirmed that the proximity to a brownfield site constitutes a factor considered in property purchase decisions.
Through a hedonic analysis of the influence of brownfields on housing properties in the New South city of Charlotte (NC, United States), by using data from 1997 to 2005, Schwarz et al. [
63] attested that the distance from brownfields to be recovered—typically former industrial properties with modest contamination—have no impact on selling values. Conversely, the proposed clean-up remediation has positive, and significant influence, especially within 0.5 miles of the brownfield. In addition, the authors noted that the brownfield size reduces property values up to 0.5 mile from the closest brownfield. In particular, for a house within 0.5 miles of the brownfield, a 3% reduction in selling price for every 10,000 sq ft increase in the size of the brownfield was determined. A nearly 30% increase in price was assessed for the houses within 0.5 miles from a brownfield to be remedied and redeveloped, offset by a 0.5% decline for every 10,000 sq ft increase in its dimensions. For a medium-sized brownfield, the overall benefit has been estimated as equal to a 17% increase in selling price, and for a house sold after recovery of the nearest brownfield (within 0.5 mile), an additional 12% increase in selling price has been evaluated.
In the context of Malaysia, the analysis of the links between brownfields and selling prices was carried out by Yap [
64]. He analyzed 557 transaction sales between 2001 to 2013 by detecting a growing housing price of 19.6% for residential districts located 1 km from Kemayan City, a disused shopping complex for almost 20 years. Leigh and Coffin [
65] studied the positive influence of brownfield redevelopment in Cleveland and Atlanta (United States). By using databases that include known and potential brownfields, they implemented a threshold modeling strategy to capture neighborhood impacts by grouping housing properties by their distance from the degraded area. The outputs outlined a property value decrease—equal to an average of 0.4% in Atlanta and 0.48% in Cleveland—for every 100 feet closer it is to a listed brownfield site, pointing out that, for both cities, the major effect was revealed to be within 500 feet.
Ihlanfeldt and Taylor [
66] examined the impact of small-scale hazardous waste contaminated sites on commercial and industrial buildings in Atlanta (GA, United States). By means of the ordinary least squares and spatial autoregression analysis, they concluded that the largest impacts were found for office and apartment buildings. The authors demonstrated that a growth within 0.5 to 2 miles of a brownfield site determines a 36% increase in property value for office buildings, a 23% increase for apartment buildings, 16% for vacant land, 12% for retail property and 3% for industrial properties. In contrast, Longo and Alberini [
67] highlighted that commercial and industrial buildings in Baltimore (United States) remained virtually indifferent to the closeness of a contaminated site. This indicates the scarce attractiveness for developers in terms of brownfield property investments.
In the framework outlined, the present study focuses on the issue concerning brownfields regeneration, through the development of an assessment model for the definition of sustainable investments.
With reference to the BEA financial assessment technique, in the existing literature, several contributions have aimed to explain its purposes [
68,
69], its underlying basic logic [
70,
71,
72], and its assumptions [
73,
74]. During the last decades, the BEA implementation has concerned different fields. Salat [
75] applied this technique to analyze the impact of urban densities on value creation, infrastructure costs, and the embodied energy. Sinambela et al. [
76] suggested the furniture industrial operators need to know the break-even point of each production run to monitor the costs and avoid relevant losses. By using the BEA, Xia and Luo [
77] defined a model for calculating the economic critical depth of shale gas resources. Within the real estate market field, the BEA has been developed on a proposed residential subdivision for a farmstead on the southern fringe of the city of La Crosse (USA) in order to ascertain the potential profitability of the intervention [
78]. Moreover, Keast et al. [
79] have used a modified BEA to forecast the future financial potential of the current pharmacy business, to attract new owners. With regard to urban transport business initiatives, the analysis of the feasibility was carried out by Hamidi and Lisnawati [
80] by using the BEA, to obtain an overview of the expenses and turnover of urban transport drivers in the city of Sukabumi (Indonesia). In the same national context, Budiarto [
81] analyzed the financial resilience of public transport in the city of Surakarta in terms of passengers’ number. The BEA has been also applied within the hotel business in Indonesia by Ramdani [
82], to identify the break-even point, the sales planning and the minimum sales level to be maintained. Furthermore, Asciuto et al. [
83] determined the net return and break-even point to verify the financial feasibility of an aquaponic system in a Mediterranean urban context. Balena et al. [
84] simultaneously implemented the GIS and BEA to analyze the technical and financial convenience of installing roof-top photovoltaic systems in an urbanized area and to define the optimal size and form of roof-top area available for solar energy applications. In additional, an evaluation model to support the public administration decision making processes in planning urban strategies was proposed by Morano and Tajani [
85], aimed at determining the maximum amount of subsidized housing to be realized by the private investor and the administered selling price to be applied.
5. Model
From the first phases of all territorial development initiatives, the role played by the evaluation is central. In general terms, the assessment of the feasibility of the intervention concerns all design phases. According to the project technical detail level, the evaluation aims at verifying the investment sustainability from different points of view and subjects involved. In the context of the most used techniques to support the choices processes, BEA is included. It represents a methodological approach to rapidly determine the GFA to be built and sold, able to ensure the condition of minimum feasibility of the initiative in terms of the break-even point of the financial balance.
At an international level, BEA is mostly developed to assess the impact that technical, economic and management entrepreneurial choices can have on an investment’s financial feasibility. Furthermore, the technique allows the calibration of the strategies to implement, neutralize or facilitate any variations in the economic context in which the project takes place, caused by changes in market conditions. In these contexts, the cost volume profit analysis (CVPA), in which BEA is included as a step of the entire assessment, is carried out for (i) the dimensioning of the project [
86]; (ii) the definition of the product’s (good or service) unit selling price [
87]; (iii) the comparison between different technical solutions [
88]; (iv) the financial arrangements of the operation [
89]; (v) the “sensitivity” analysis of the investment; and (vi) the development of competitive strategies [
90].
In general terms, CVPA is a tool for choice processes to be used within the business planning for the validation of decisions in the short to medium term. In Anglo-Saxon countries, CVPA is mainly implemented to assess an entrepreneurial decision’s impact on the financial feasibility of an investment, to define effective strategies in contrast to likely socio-economic modifications [
91,
92,
93,
94,
95,
96]. CVPA enables a targeted study of the effect on the success of the intervention caused by the composition of the project’s financial cost structure. With traditional project evaluation models, these analyses can be carried out in a less systematic and organic manner. This is because traditional models directly provide a measure of the project’s cost-effectiveness by means of indicators of a different nature. However, they do not take into account an approach that deals separately with the effects caused by the fixed and variable cost components on the feasibility of the initiative. CVPA also allows the immediate understanding of the relationships existing between the technical and financial variables with the greatest impact on the operation, thanks to their assembly into simple analytical functions and their graphical representation. The algebraic relationships—between fixed costs, variable costs, quantity produced, prices, sales volumes and financial results of the initiative—define the logical–functional structure of CVPA. These prerogatives are particularly important due to the complexity of urban regeneration interventions.
CVPA structure consists of three components. The first is BEA, to be implemented to verify the financial feasibility of design choices. The second is the analysis of the contribution margin, to check the investment capacity to generate revenues able to cover the fixed costs. The third is the analysis of operational leverage that intends to test the result’s stability.
In specific terms, BEA (the first part of CVPA) is a decision-making support tool used in business and/or investment planning, by public and private operators involved in urban transformation interventions. The main variables involved in BEA are constituted by the financial intervention costs, the revenues and the total profit, i.e., the essential financial data included in the feasibility evaluations. With reference to the urban transformation initiatives costs, their subdivision in “fixed costs” component and “variable costs” component is considered. The first component concerns the costs that do not vary as GFA quantity to be built and sold varies—i.e., related to the purchase of the land, to its clean-up and reclamation, to the urbanization and the infrastructure costs, to the refurbishment of the existing buildings, to the introduction of collective interest spaces and equipment, to the administrative salaries, to the property taxes, and to the interests on mortgages.
In the second category, instead, the expenses that change in direct proportion to a variation in activity volume—i.e., energy costs, expenses of raw materials costs for the marketing and sale of the products, workers’ salaries, sales commissions—are included. The total costs are constituted by the sum of the fixed cost items (Cf) and the variable ones (Cv).
Against the total production costs, the sale at market prices of goods and/or services determines the intervention financial returns. For each GFA the total revenue (Rt) can be calculated by multiplying the unit selling price (pu) by the quantity realized and sold (q), i.e., Rt = pu ∗ q). Thus, the estimation of the unit selling prices constitutes the first step for the revenue’s assessment.
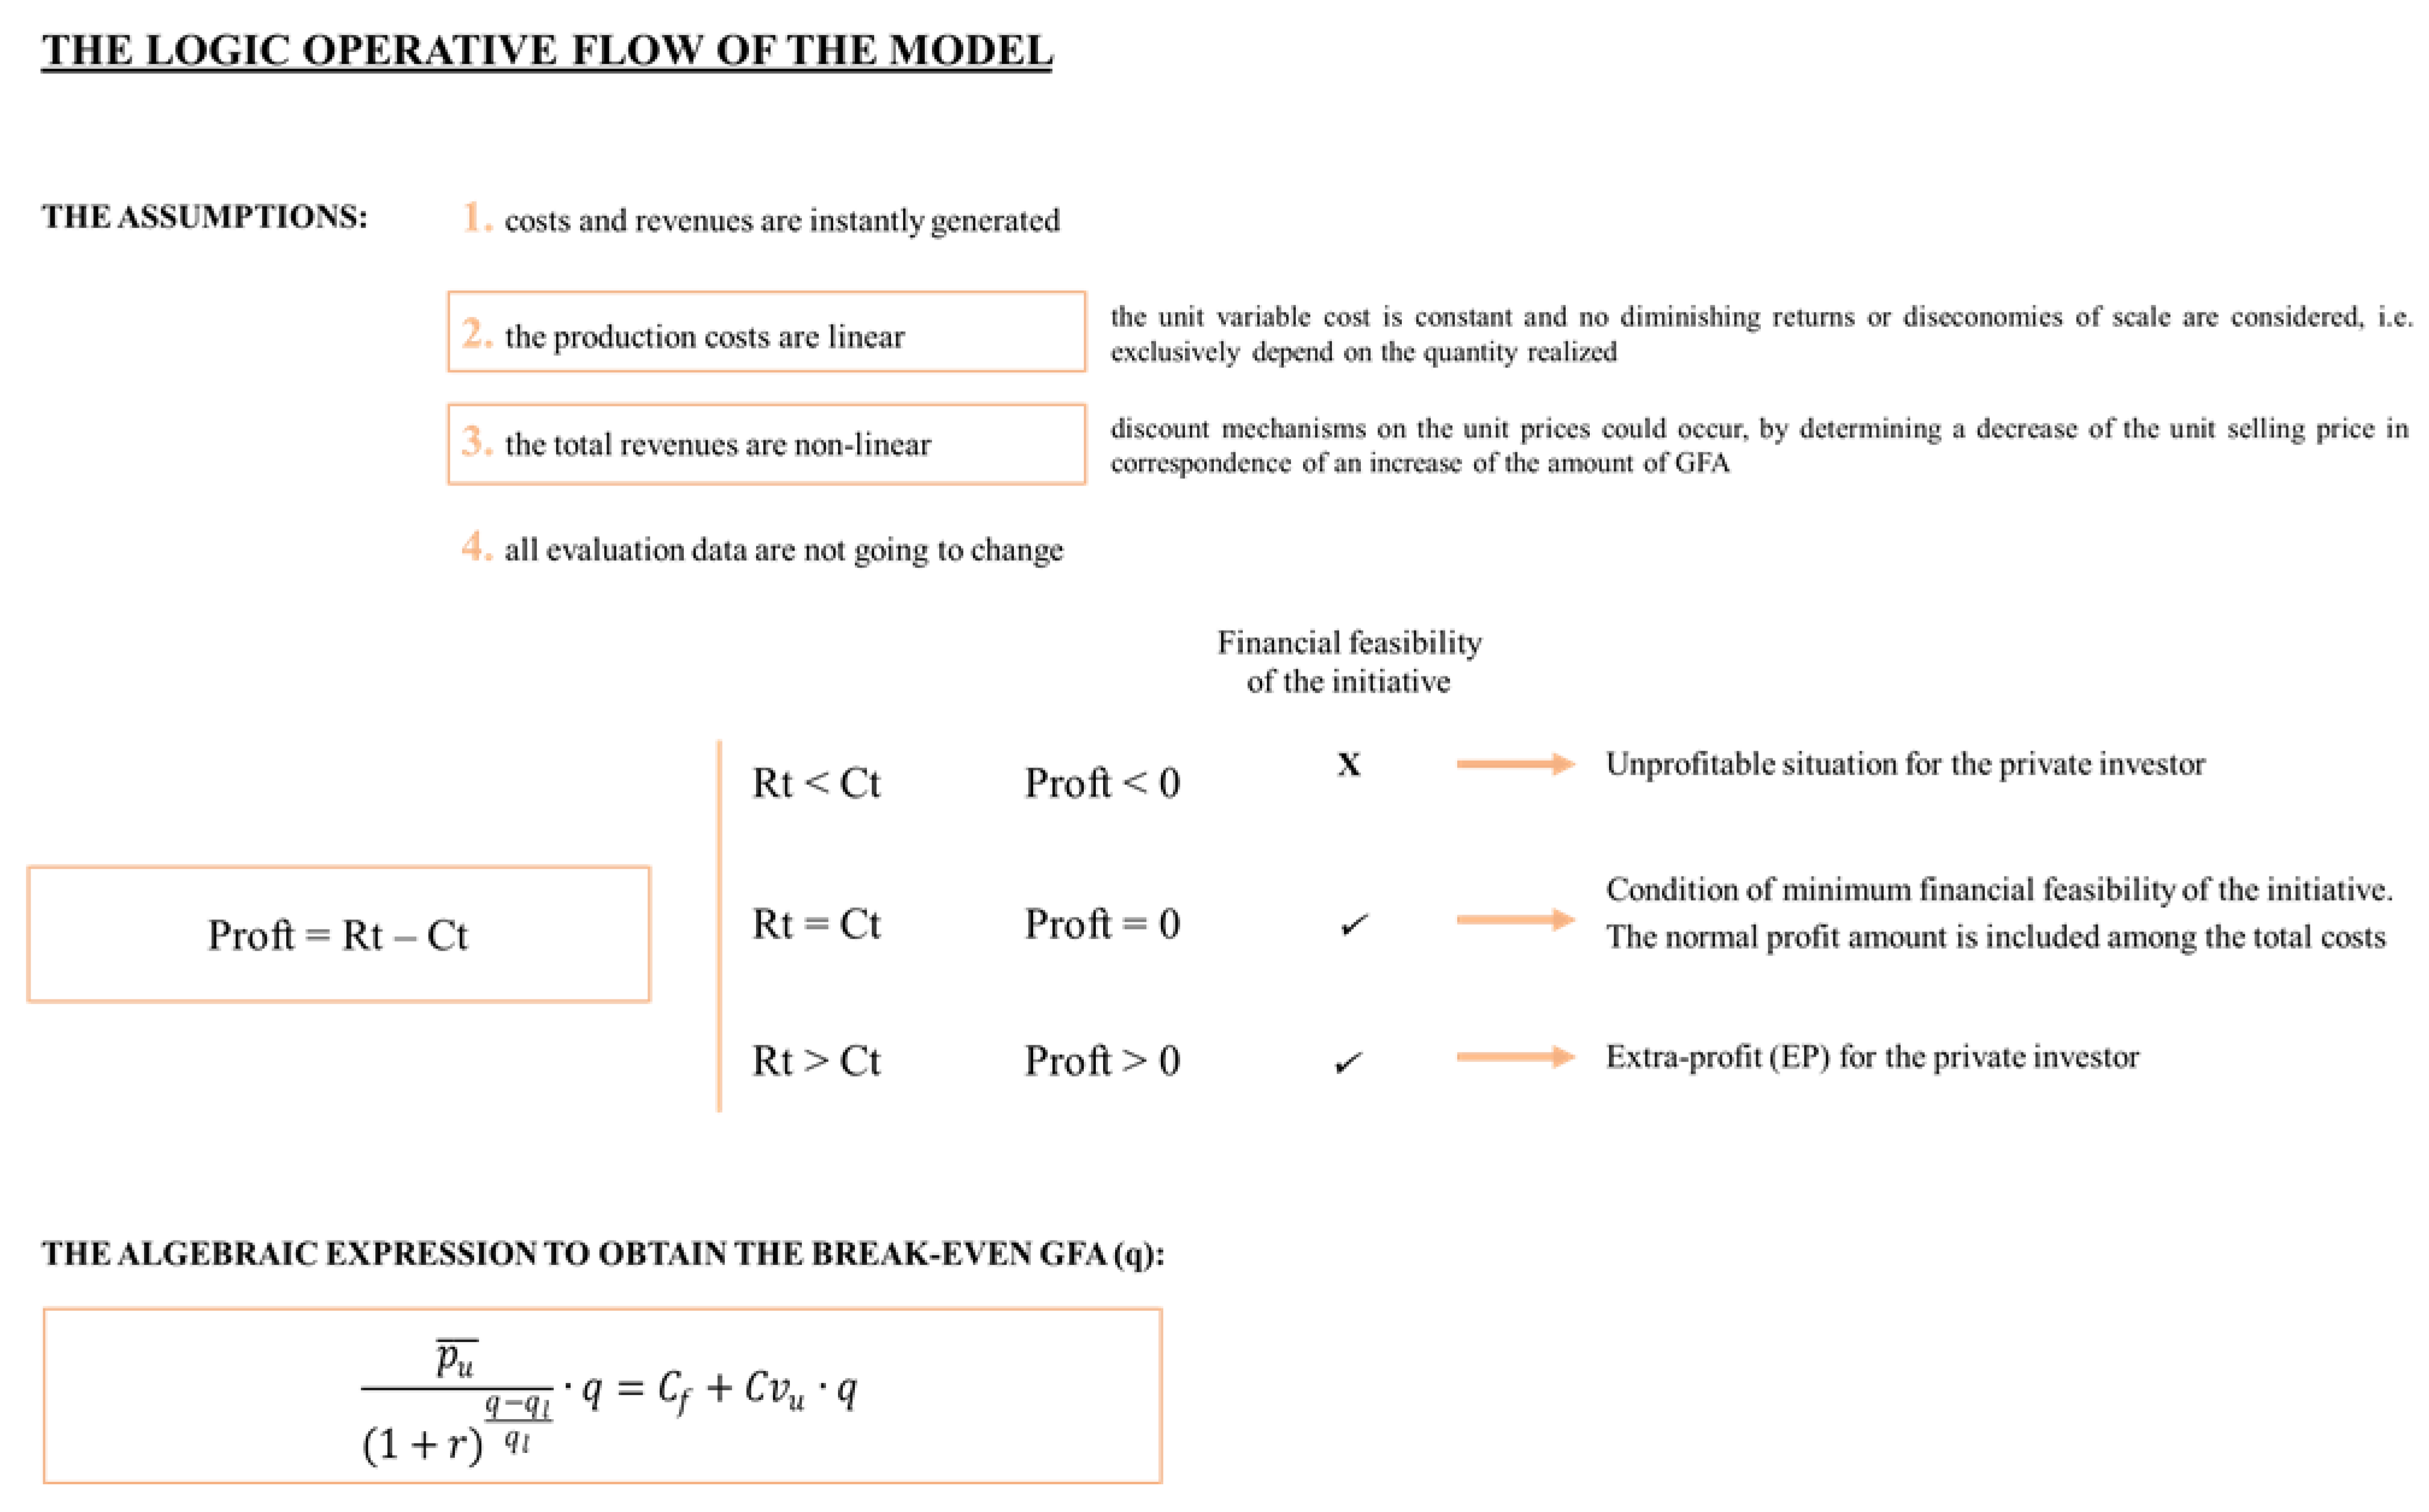
Finally, the algebraic difference between the total revenues and the total costs allows to determine the total profit (Proft = Rt − Ct), by which the investor can assess the financial feasibility of the initiative (Proft ≥ 0). The main assumptions of the logical procedure for BEA implementation are described as follows: (i) costs and revenues are instantly generated, so the GFA is produced, sold and collected at the same time, that is the evaluation moment; (ii) the production costs are linear, as the unit variable cost is constant and no diminishing returns or diseconomies of scale are considered, i.e., exclusively depend on the quantity realized; (iii) the total revenues are linear, as the unit selling price is constant; (iv) all data that contribute to define the reference framework of the evaluation are certain and are not going to change. The model proposed in the present research aims at the improvement of BEA in specific situations. By neglecting the hypothesis (iii), the innovative model intends to make the conditions in which the tool is implemented more valid and consistent with the real market phenomena.
The ordinary (also namely “normal”) profit expected by the private subject—that is the minimum margin that the investor aims to earn, according to the risks, the organization and management activities related to the analysed initiative—is included in the total costs. Thus, the quantity of GFA obtained by the classical application of the BEA defines the condition of minimum feasibility of the initiative (i.e., the “break-even” quantity = Proft = 0). Beyond this quantity, the total revenues are higher than the total costs and, therefore, the initiative will determine an extra-profit (EP = Proft > 0). This is an additional compensation for the private subject or a possible maximum burden that the public administration could require of the entrepreneur.
For a smaller quantity than that break-even identified, the feasibility to activate the initiative is not verified and the total profit is negative, i.e., an unprofitable situation is expected (Proft < 0).
By considering the standard assumptions of BEA, except the hypothesis (iii) (concerning the revenues linearity), the extra-profit is set equal to the value zero (EP = 0). In particular, the mathematical relationship of the extra-profit is expressed by the algebraic difference between the total revenues and the total costs.
Therefore, the break-even GFA allows the achievement of a balanced financial budget for the operation—i.e., the initiative minimum feasibility for the investor. This is the floor area quantity to be sold: for this quantity, the total costs are equal to the total revenues and guaranteeing the normal profit amount.
By borrowing the algebraic form to determine the break-even GFA amount (
q), that is:
where
pu is the unit selling price of GFA [EUR/m
2];
q corresponds to the GFA size [m
2];
Cf represents the fixed costs [EUR];
Cvu constitutes the unit variable cost [EUR/m
2], the term before “=” (on the left side of the equation) indicates the total revenues (Rt), whereas that after “=” (on the right side of the equation) defines the total costs (
Ct). According to the BEA classical implementation, i.e., in the hypothesis of
Rt and
Ct functions linearity, the mathematical formula to determine the break-even quantity is:
The innovative evaluation model intends to overcome the limitation of the invariance of the unit selling price that implies the hypothesis of the linearity of the revenue curve in the “classical” BEA [
97], by performing the development of the “real” trend of the marginal prices
pu. In particular, the curve of the unit selling price is characterized by a logarithmic and decreasing trend, due to the inclusion of two variables in the model, i.e., (i) the rate of variation (
r); and (ii) the GFA threshold quantity (
ql). In particular,
r expresses the reference market volatility associated with the variations in real estate supply/demand.
ql represents the area able to meet the current demand for new real estate units, beyond which a supply surplus will occur, to which for the market absorption could correspond to unit prices lower than the current market values for similar real estate units.
In the proposed model, the variability of the unit selling prices is expressed by the logarithmic function of the unit price in Equation (3):
where
represents the unit market value of the new units to be built with regard to the current supply (i.e., in the situation before the new floor area’s realization) and
is the differential between the GFA determined by the investment and by those of breakup/saturation of the current market demand.
Thus, the algebraic expression obtained including the (3) into (1) is:
The resolution of Equation (4) allows the assessment of the GFA break-even amount (q), by considering (i) the unit market value of the GFA to be built ()—determined with reference to current market situations; (ii) the threshold GFA quantity (ql)—determined through a market analysis (e.g., by considering the relationship between demographic trends and existing real estate stock, the forecasts of current urban planning tools, etc.); (iii) the fixed costs (Cf) and the variable unit cost (Cvu) of the intervention; and (iv) the variation rate (r), that reflects the market volatility related to the location and the considered intended uses.
This coefficient could be determined through a statistical elaboration of the time series of detected selling prices in the area in analysis [
98]. By performing an iterative calculation, the break-even GFA could be rapidly obtained by implementing the starting parameters of the analysis.
In
Figure 1 the logic operative flow is reported in a diagram.
Furthermore, in the situations in which the public administration establishes the monetary sum to be given by the private investor—the amount of which can at most equal the extra-profit of the investor, the model represents a highly valid tool to the definition of a Pareto frontier [
99] of the optimal combinations of floor areas to be realized (
q). These combinations are able to simultaneously guarantee the intervention’s financial feasibility and the maximum request of the public administration (
Cf). The proposed model—for different values of the variation rate
r—allows the return of the solutions that guarantee the conveniences of both parties. Therefore, the investor will able to satisfy the burden requested by public entity after ensuring its minimum profit margin. On the other hand, the public subject will obtain this monetary sum, in compliance with the financial feasibility of the initiative. Thus, the proposed model can be included among the instantaneous/static techniques for evaluating investments that do not consider the “time” variable among the influencing factors on the results of the analysis. In this sense, similarly to the static classical application of the BEA, the model takes into account the real revenue trends, by overcoming the critical issues of the residual methods.
In fact, unlike the discounted cash flow analysis (DCFA) in which the temporal disaggregation of the analysis period in the “construction phase”, the “activity development phase”, the “full operativity phase” are taken into account and the time value of money is assessed, the model developed in the present research assumes that all the monetary amounts connected to the intervention (C and R) occur at the same instant. This is the moment in which the evaluation is carried out. In this way, the operations of discounting the cash flows through appropriate discount rates are not performed. Despite the wide acceptance of DCFA to evaluate the profitability of interventions, the implementation of the proposed model could constitute the first evaluation of the investment feasibility. Subsequently, the initiative financial convenience could/should be investigated through a more detailed technique, as the cost–revenue analysis and cost–benefit analysis.
6. Case Study
The case study concerns an urban transformation intervention of a brownfield located in a municipality in the Southern Italy. Some characteristics of the area are explained in brief: (i) the public administration is the site owner, (ii) the area is characterized by a degraded conservative state (it is a former industrial site, currently abandoned and contaminated), (iii) the area extension is approximately equal to 12,000 m2. The analyzed site is located in an expanding, well-served city area in which different infrastructures and services are included. Moreover, in the reference area, the most common intended uses of the buildings are commercial functions—located on the ground floors of the multi-floor buildings—and residential on the others floors.
The transformation project concerns the realization of nine buildings of six floor levels each—including one basement level: in particular, parking spaces are provided for on the basement floors and residential units are planned on the others—from the mezzanine floor to the sixth.
The hypothesis to be assumed is that the public brownfield site redevelopment initiative costs (related to the degraded area clean-up and the buildings realization and the external areas renewal) will be borne by a private investor. Then, it is assumed that the investor will sell the residential units—included the appurtenant parking spaces—in a free market regime.
Application of the Model
In order to implement the model proposed to the case study, in
Table 1 the assumed data are reported. The costs (fixed and variable) have been determined by taking into account the local market. In particular, these concern the raw material costs and all expenses necessary for the intervention implementation (land purchase, taxes and notary fees, demolition of existing buildings, area reclamation, roads and sidewalks, technical and general expenses, residential urbanization, normal profit of the property developer, residential construction, financial charges for the borrowed capital, etc.). The cost assessment has been developed, for each work item, on the final costs of similar interventions recently carried out in Southern Italy. When necessary, the amounts obtained have been corrected on the basis of the data reported in the local government price lists, to validate or “adjust” the amounts deduced through the summary estimate.
Furthermore, for the residential unitary selling prices, the main market operators have been consulted in order to define fair property prices. The articulation of the private investor’s balance items in “fixed” and “variable” has been carried out. In the first category, land purchase, taxes and notary fees, reclamation costs, realization of the green area costs, technical and general expenses and financial charges are included. In particular, in technical costs, the design, and acceptance test charges are considered. In the general expenses’ category, the costs for technical experts and the commercialization of building units are included. The technical and general expenses have been estimated by assuming an incidence of 5% on the total construction costs. This percentage is consistent with those generally used in the analyzed geographic context. Furthermore, the financial charges concern the costs of the capital borrowed from the bank by the private investor. This amount depends on (i) the total project costs, (ii) the size of the borrowed amount, (iii) the passive interest rate usually applied in the reference market at the time of the evaluation, (iv) the financial guarantees offered by the debtor, and (v) the period of the loan. For the case study, the financial charges have been calculated under the assumption that 50% of the total needed capital investment costs is obtained by a loan with an interest rate equal to 6.70% [
100]. The assumed rate is consistent with the interest rate ordinarily used for similar initiatives in the geographical territory considered in the analysis.
The variable unit costs, however, concern the construction costs related to the residential properties and the parking spaces and the amount of normal profit of the investor. It should be added that among the variable costs the normal profit defines the remuneration for the private investor for the initiative management and the risk related to the operation. It is calculated as a percentage of the construction costs, by considering the profit of the local ordinary private investor. For the case study, a 40% ordinary percentage was estimated. This percentage is reasonably valid as it is consistent with the shares of profit compared to the construction costs detected in the reference area market (in the range between the 37% and 42%).
It should be pointed out that the risks of the initiative are split up among the private and public parties involved: the public administration remains the owner of the site area, whereas the private investor bears the degraded area clean-up, recovery and construction costs in order to sell the residential units and to obtain a monetary profit.
The fixed costs components in the balance of the transformation project considered in the analysis are reported in
Table 2.
By considering the indications provided by existing urban planning tools, the ql was determined in accordance with the maximum allowable height, area and volume specified. Moreover, the current and forecast absorption capacity of new residential properties, due to the demographic trends, the economy context and the market demand and supply, was examined.
The assessment of the revenues of the analyzed initiative is strongly influenced by the gross areas to be realized—respecting the maximum permissible—and the residential unit prices. A direct survey by analyzing housing units—recently sold in the same trade area where the brownfield to be renovated is located—and whose final market price has been known, was carried out. Therefore, the unit selling price to be included in the analysis for the revenue’s assessment, was defined.
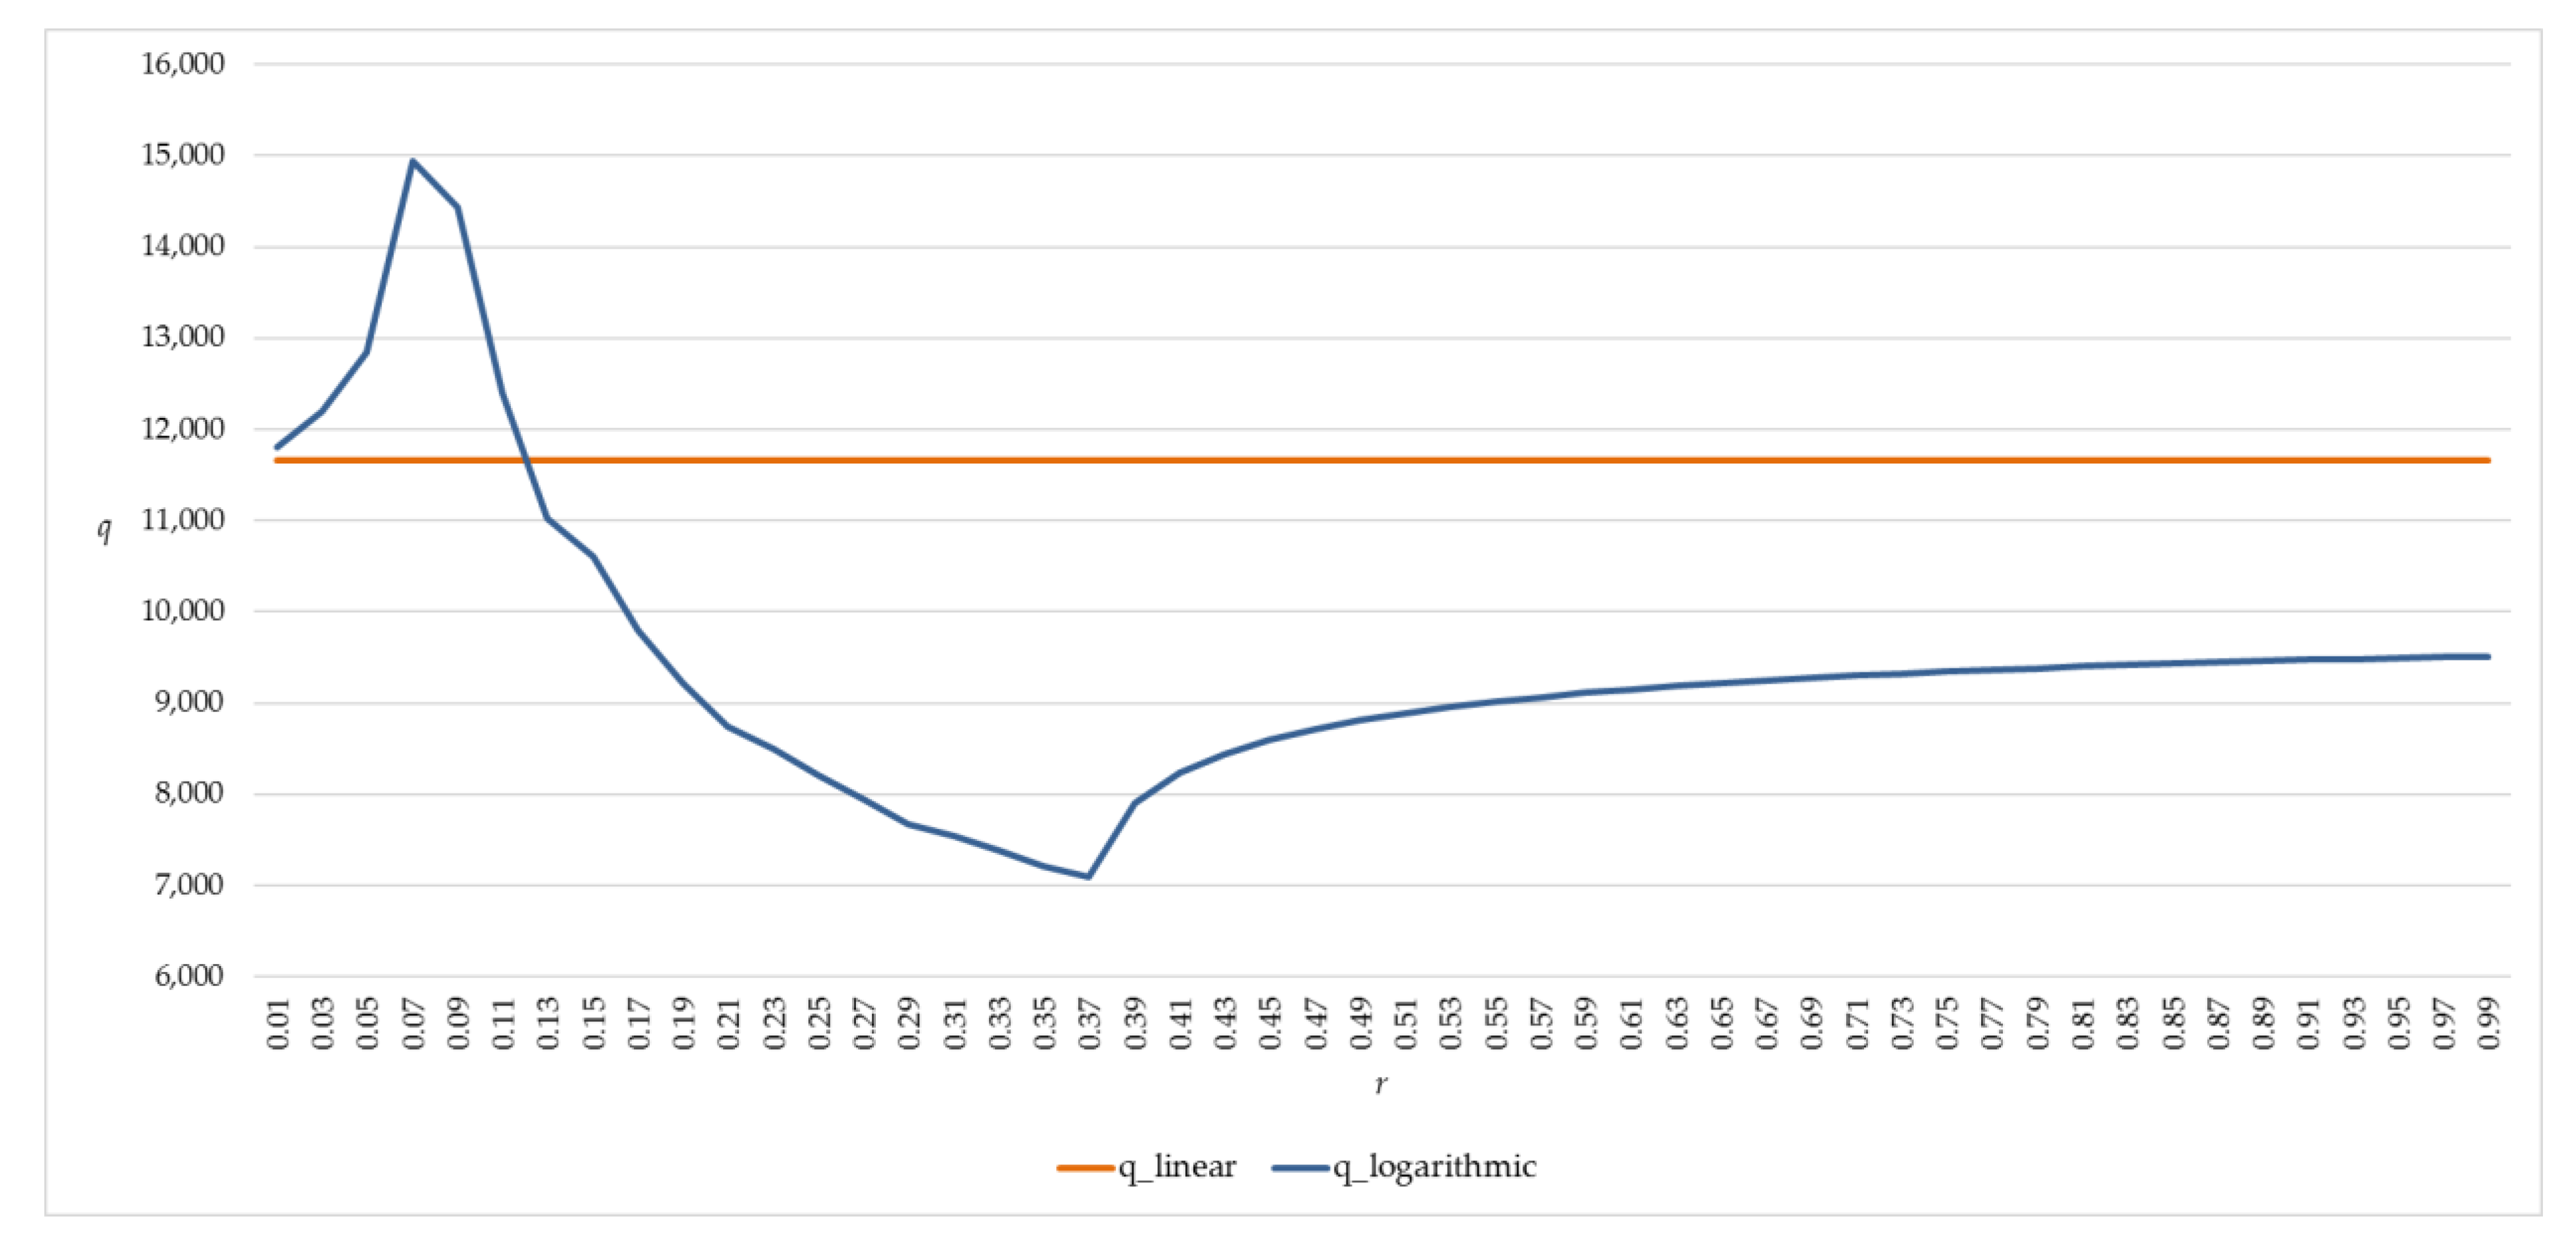
With reference to the variation rate
r, this factor has been made to change in the range [0.01; 0.99]. The graph of
Figure 2 shows the outputs obtained by the proposed model (
q_logarithmic) for the different values of the rate
r in the selected range, compared with the horizontal curve, i.e., parallel to the
x-axis (
q_linear) in the application case of the classical linear model of the BEA.
The results give rise to relevant insights. First of all, it should be observed that, in conditions of limited volatility of the reference market (r ≤ 0.07), the model returns a quantity of break-even building GFA higher than that determined in the linear model (equal to 11,667 m2). In the logarithmic model, the quantity of break-even GFA varies between 11,808 m2 (r = 0.01) and 14,950 m2 (r = 0.07). Therefore, in conditions of scarce market volatility (i.e., when a strong price stability is observed), the reduction in the unit market value for increasing supply could be offset by the growth of the quantity of building GFA to be sold, to guarantee the condition of minimum feasibility for the investor.
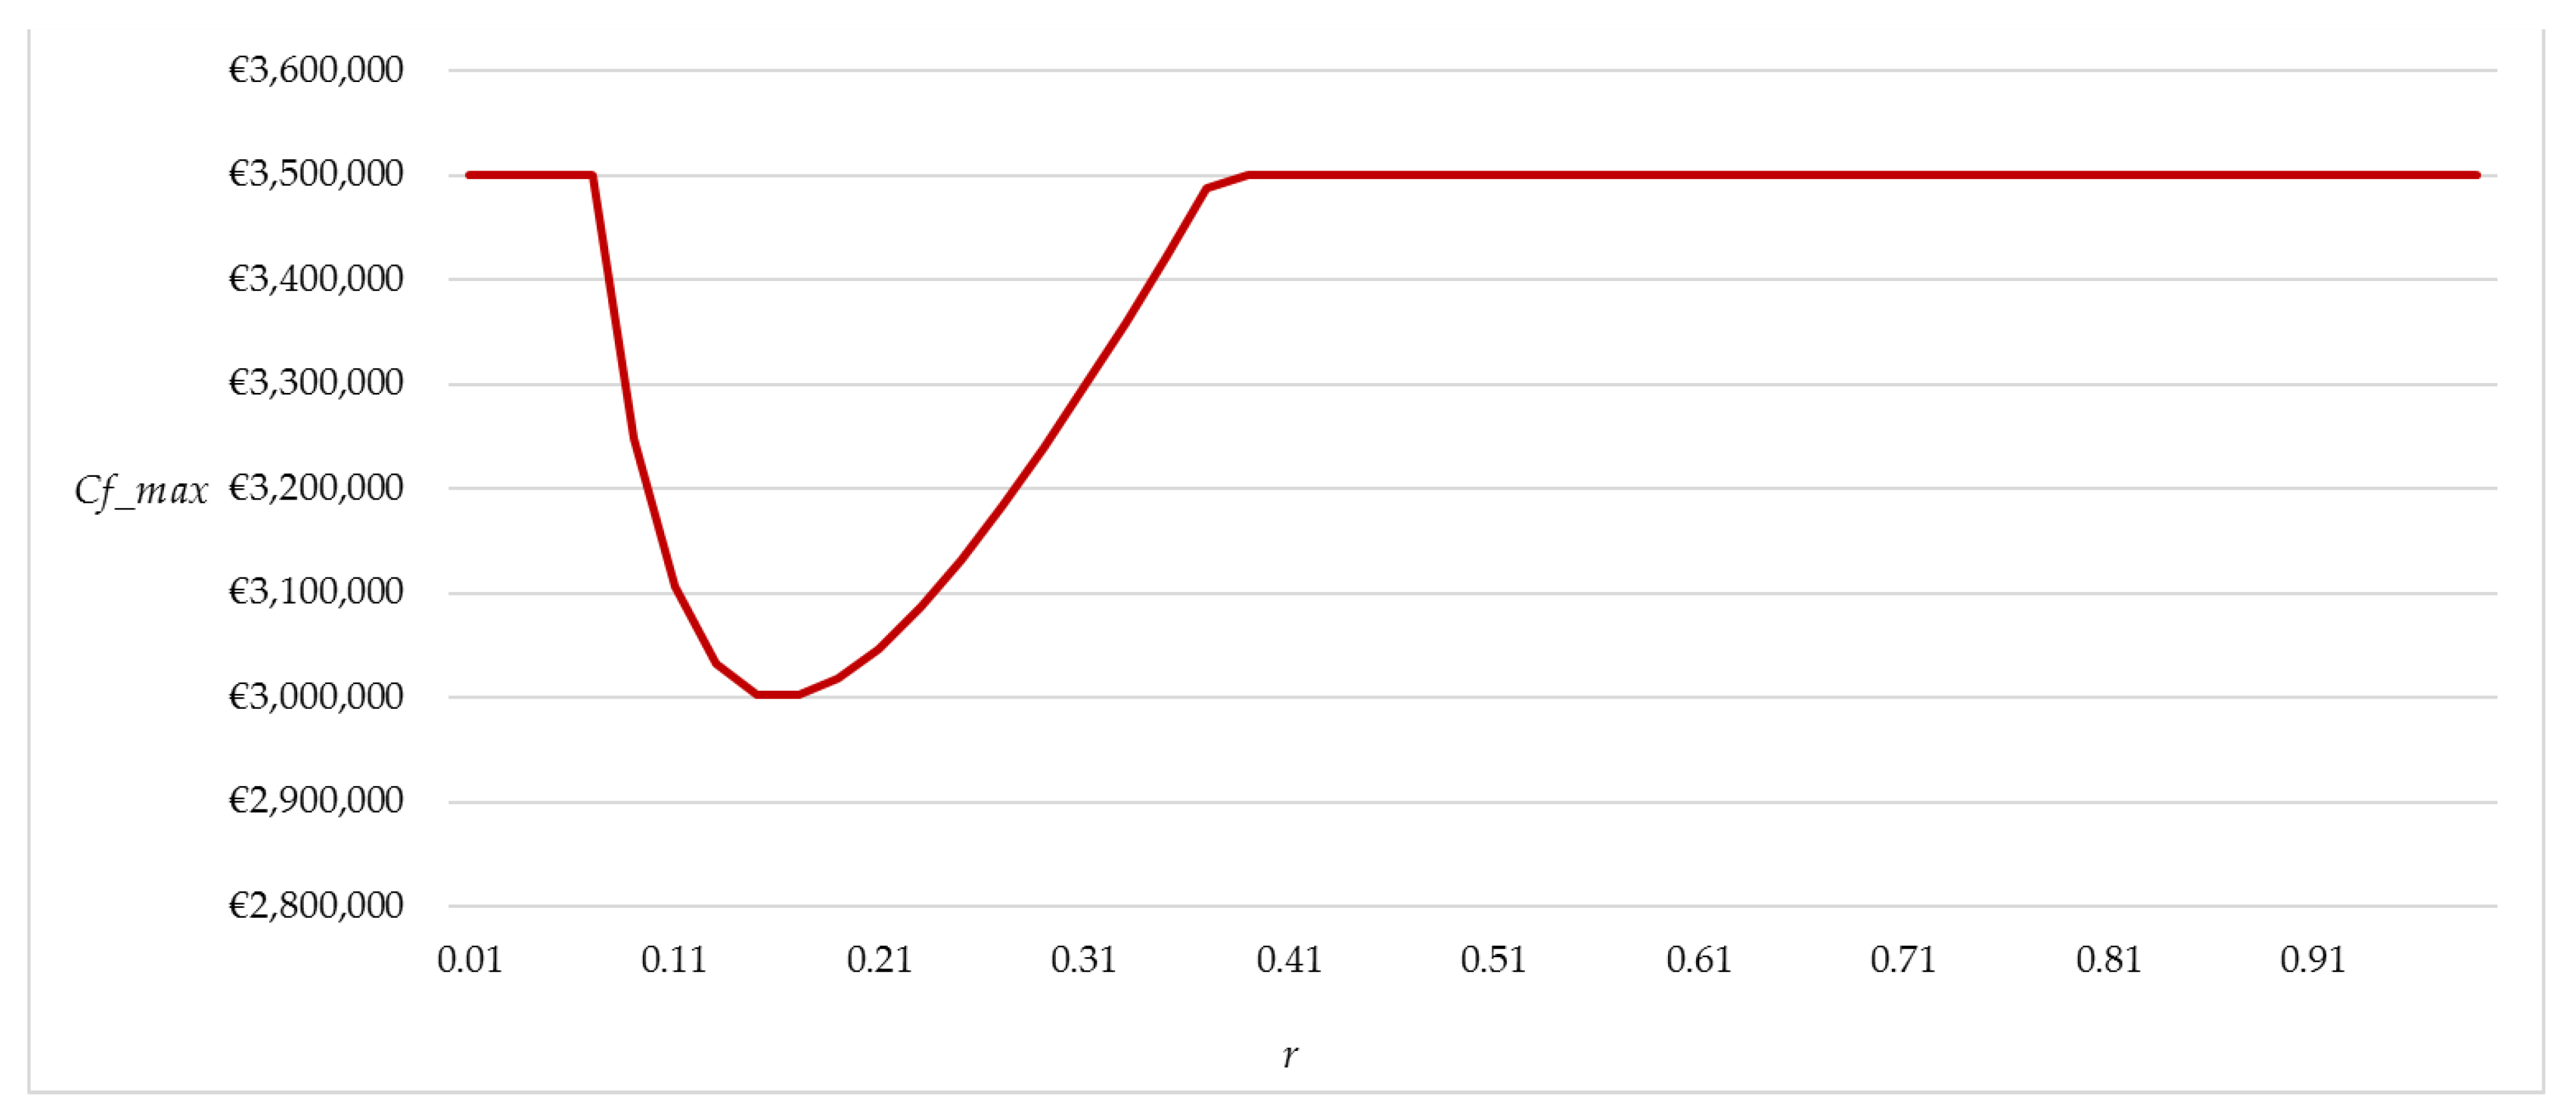
For variation rates between 0.07 and 0.39, the logarithmic model is unable to identify a GFA quantity capable of ensuring the condition of minimum feasibility for the private investor and, at the same time, of guaranteeing the payment of the charges provided for in
Table 1 (
Cf = EUR 3,500,000). In graphical terms, the revenue curve never crosses the total cost line. In this sense, the only possibility is that of providing a Pareto frontier of the optimal solutions, i.e., limit combinations [
q;
Cf_max], with
Cf_max < EUR 3,500,000, such as to allow the private operator to reach the sustainability of the initiative. From the graphical point of view, a translation of the total costs line towards the
x-axis should be performed, in order to identify the point of tangency with the total revenue curve, that corresponds to the GFA break-even amount.
In
Table 3, the combinations [
q_logarithmic; Cf_max] by varying the rate
r in the range analyzed [0.09–0.37] are reported, For the present case, these combinations define the Pareto frontier able to obtain the investment feasibility. It should be highlighted that, as market variability increases, even if the maximum sustainable cost of the private subject has a parabolic trend, the quantity of break-even building GFA decreases. Thus, the decreasing function of the unit price suggests avoiding going beyond a certain quantity of GFA, to preserve the condition that the unit market value is higher than the unit cost of production.
For r values ≥ 0.39, the constraints system of the logarithmic model guarantees the initial public burden, equal to EUR 3,500,000, and the GFA amount tends to grow again, albeit always remaining lower than that determined by the linear model. The break-even amount in the logarithmic model varies between 7911 m2 (r = 0.39) and approximately 9500 m2 (r = 0.99).
Higher quantities would risk precluding the condition of minimum feasibility of the operation.
Figure 3 shows the function of
Cf_max by varying the rate
r in the range selected [0.09–0.37]. The parabolic trend of
Cf_max is observed in the range [0.09–0.37]: up to the
r = 0.09 the
Cf_max are constant, as in the following
r interval [0.38–0.99].
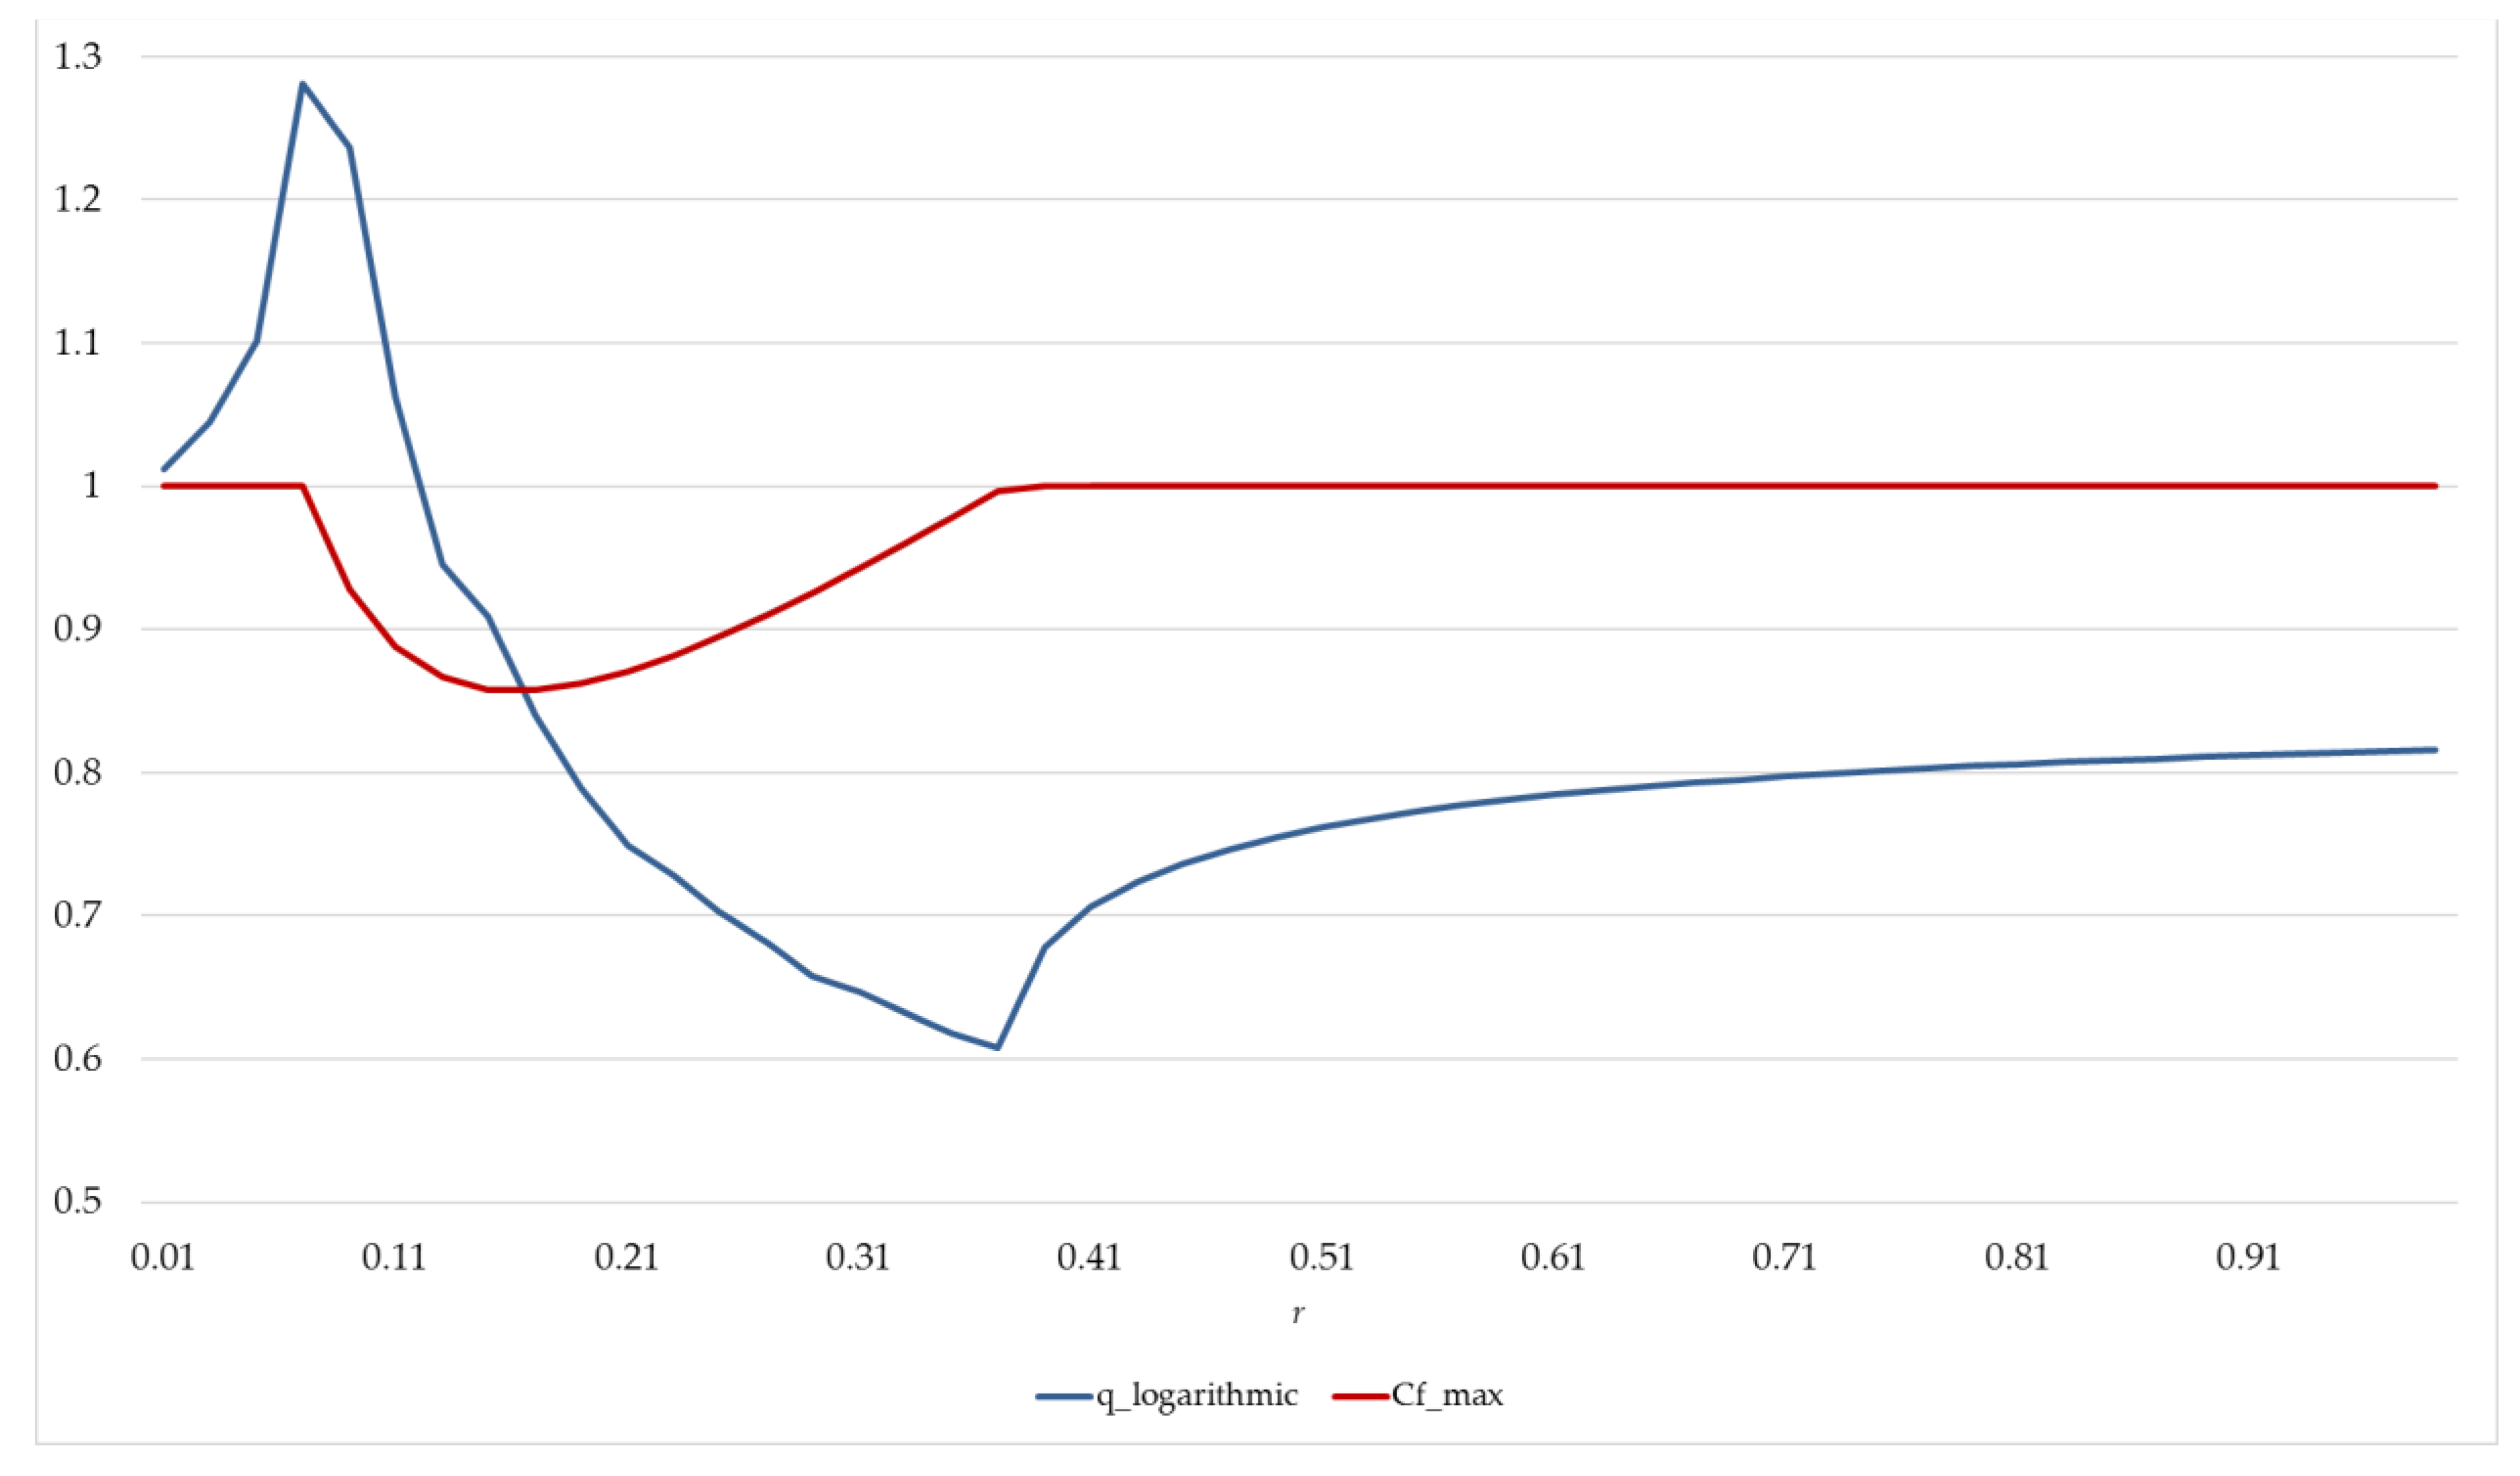
In
Figure 4, the normalized values of the optimal combinations [
q; Cf_max] are reported. Therefore, the
q_logarithmic and the
Cf_max trends are combined in the same graph in order to define the best solutions of the floor area to be realized able to guarantee the initiative’s financial feasibility and the maximum request of the public sector (e.g., in terms of land purchase costs).
By way of example,
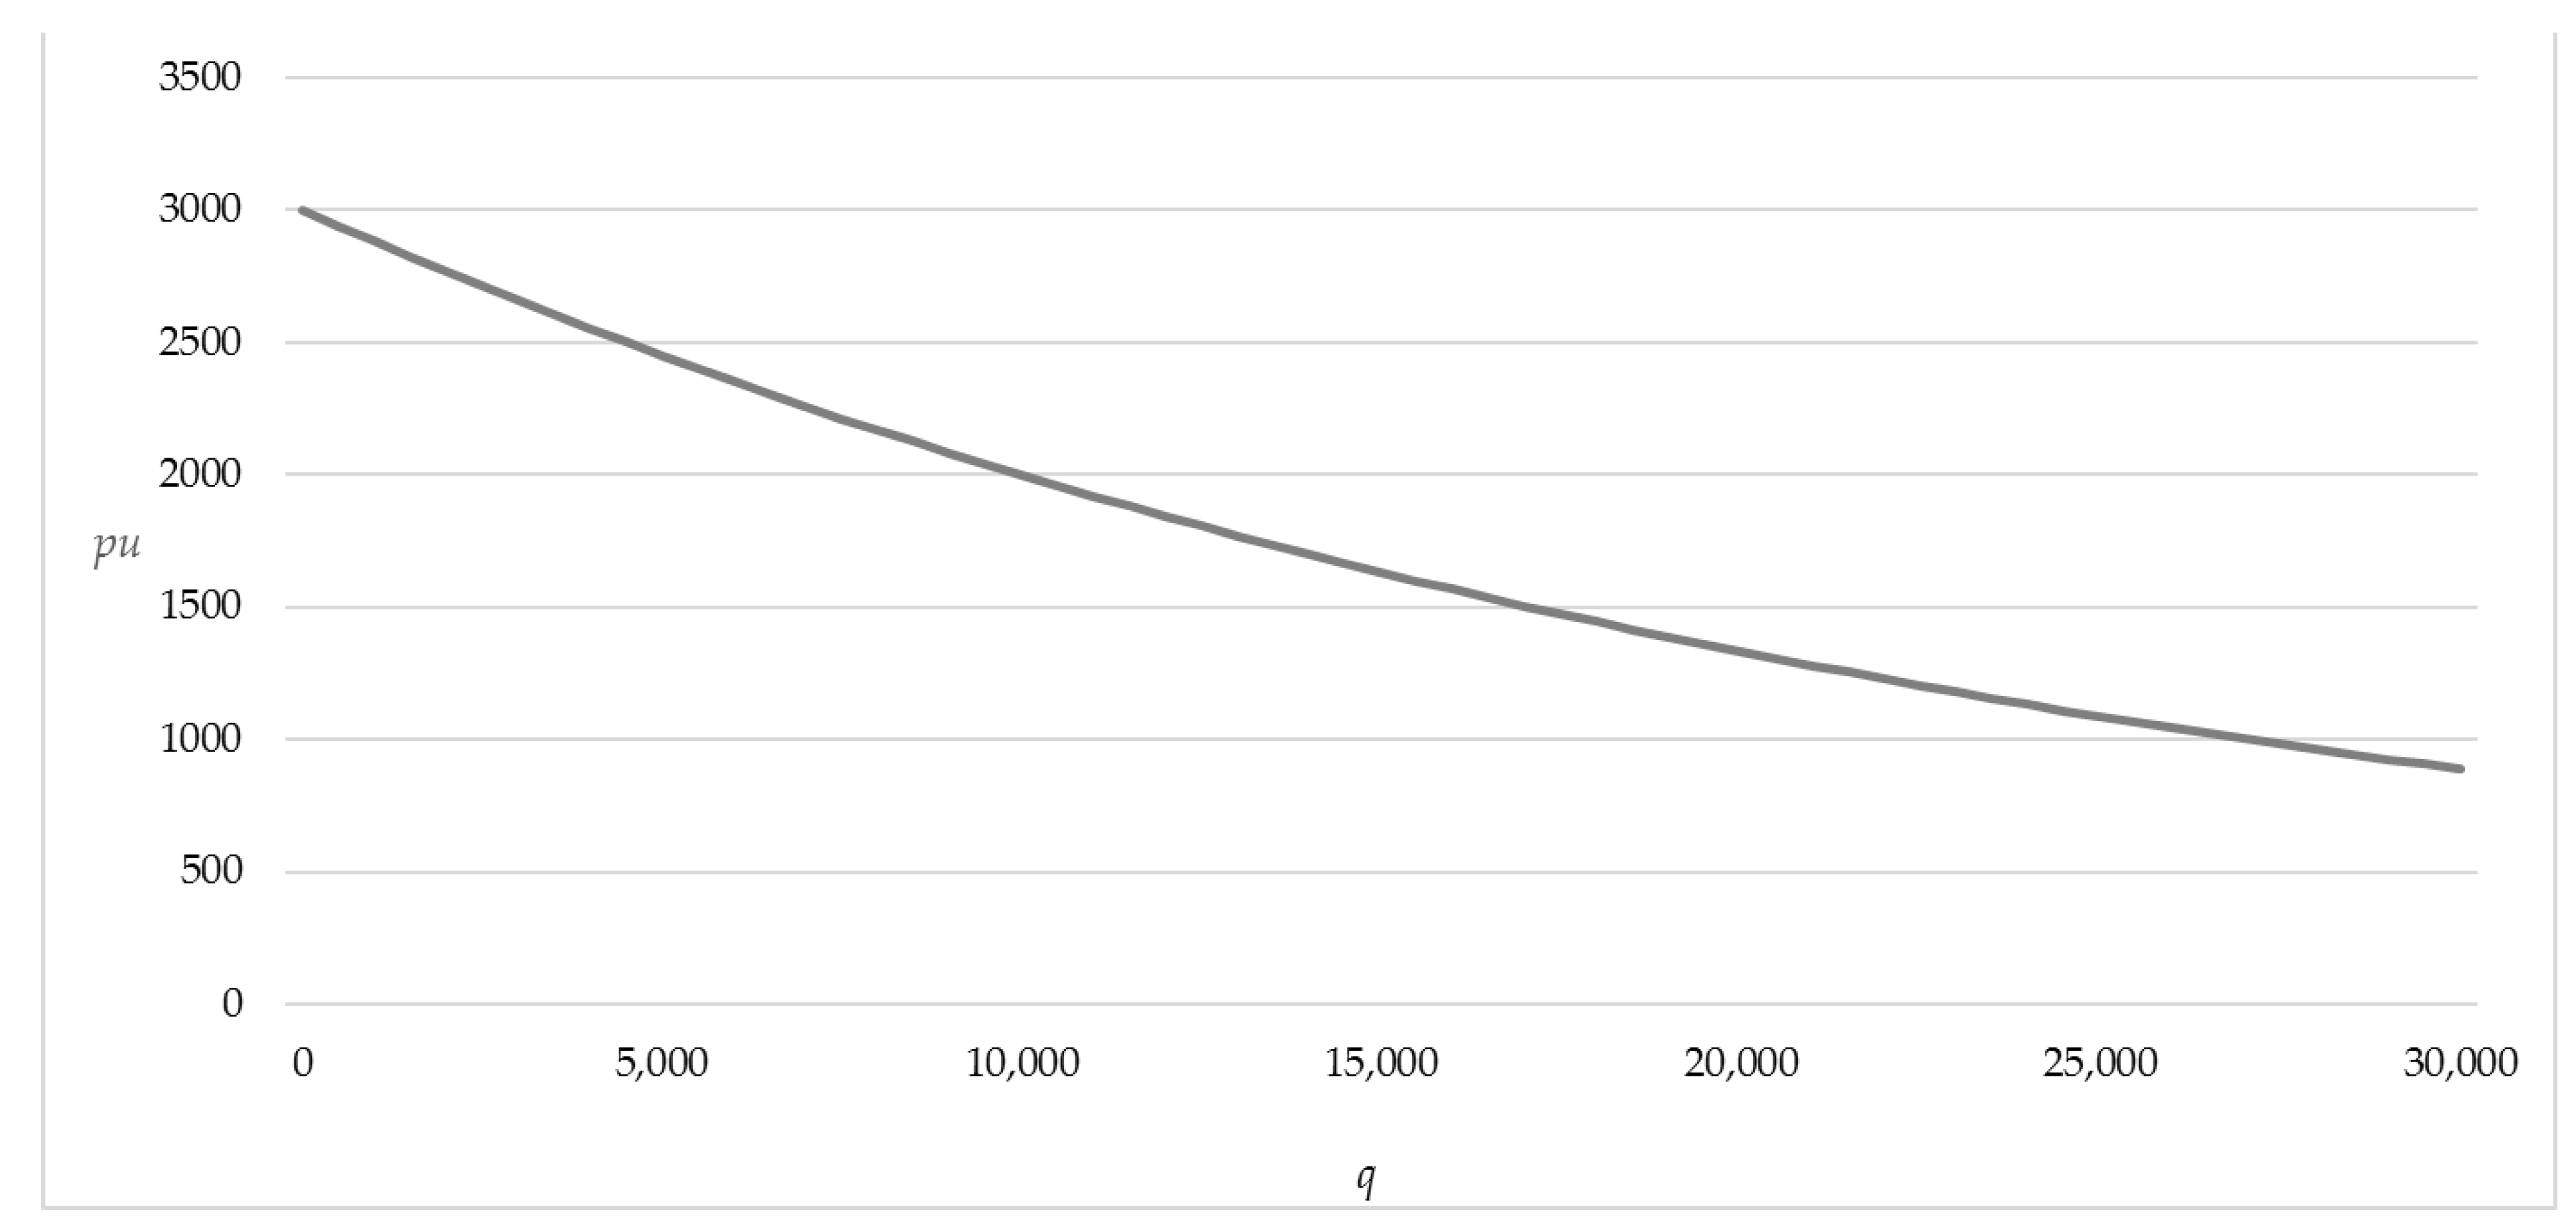
Figure 5 shows the function of the unit market value by considering
r = 0.5. The trend underlines the inverse correlation between the unit selling price (
pu) and the floor areas to be realized (
q) in accordance with the market demand curve, for which the
pu decreases as the quantity grows. The curve is consistent with the relationship between unit selling price and good quantity in the microeconomic theory.
In
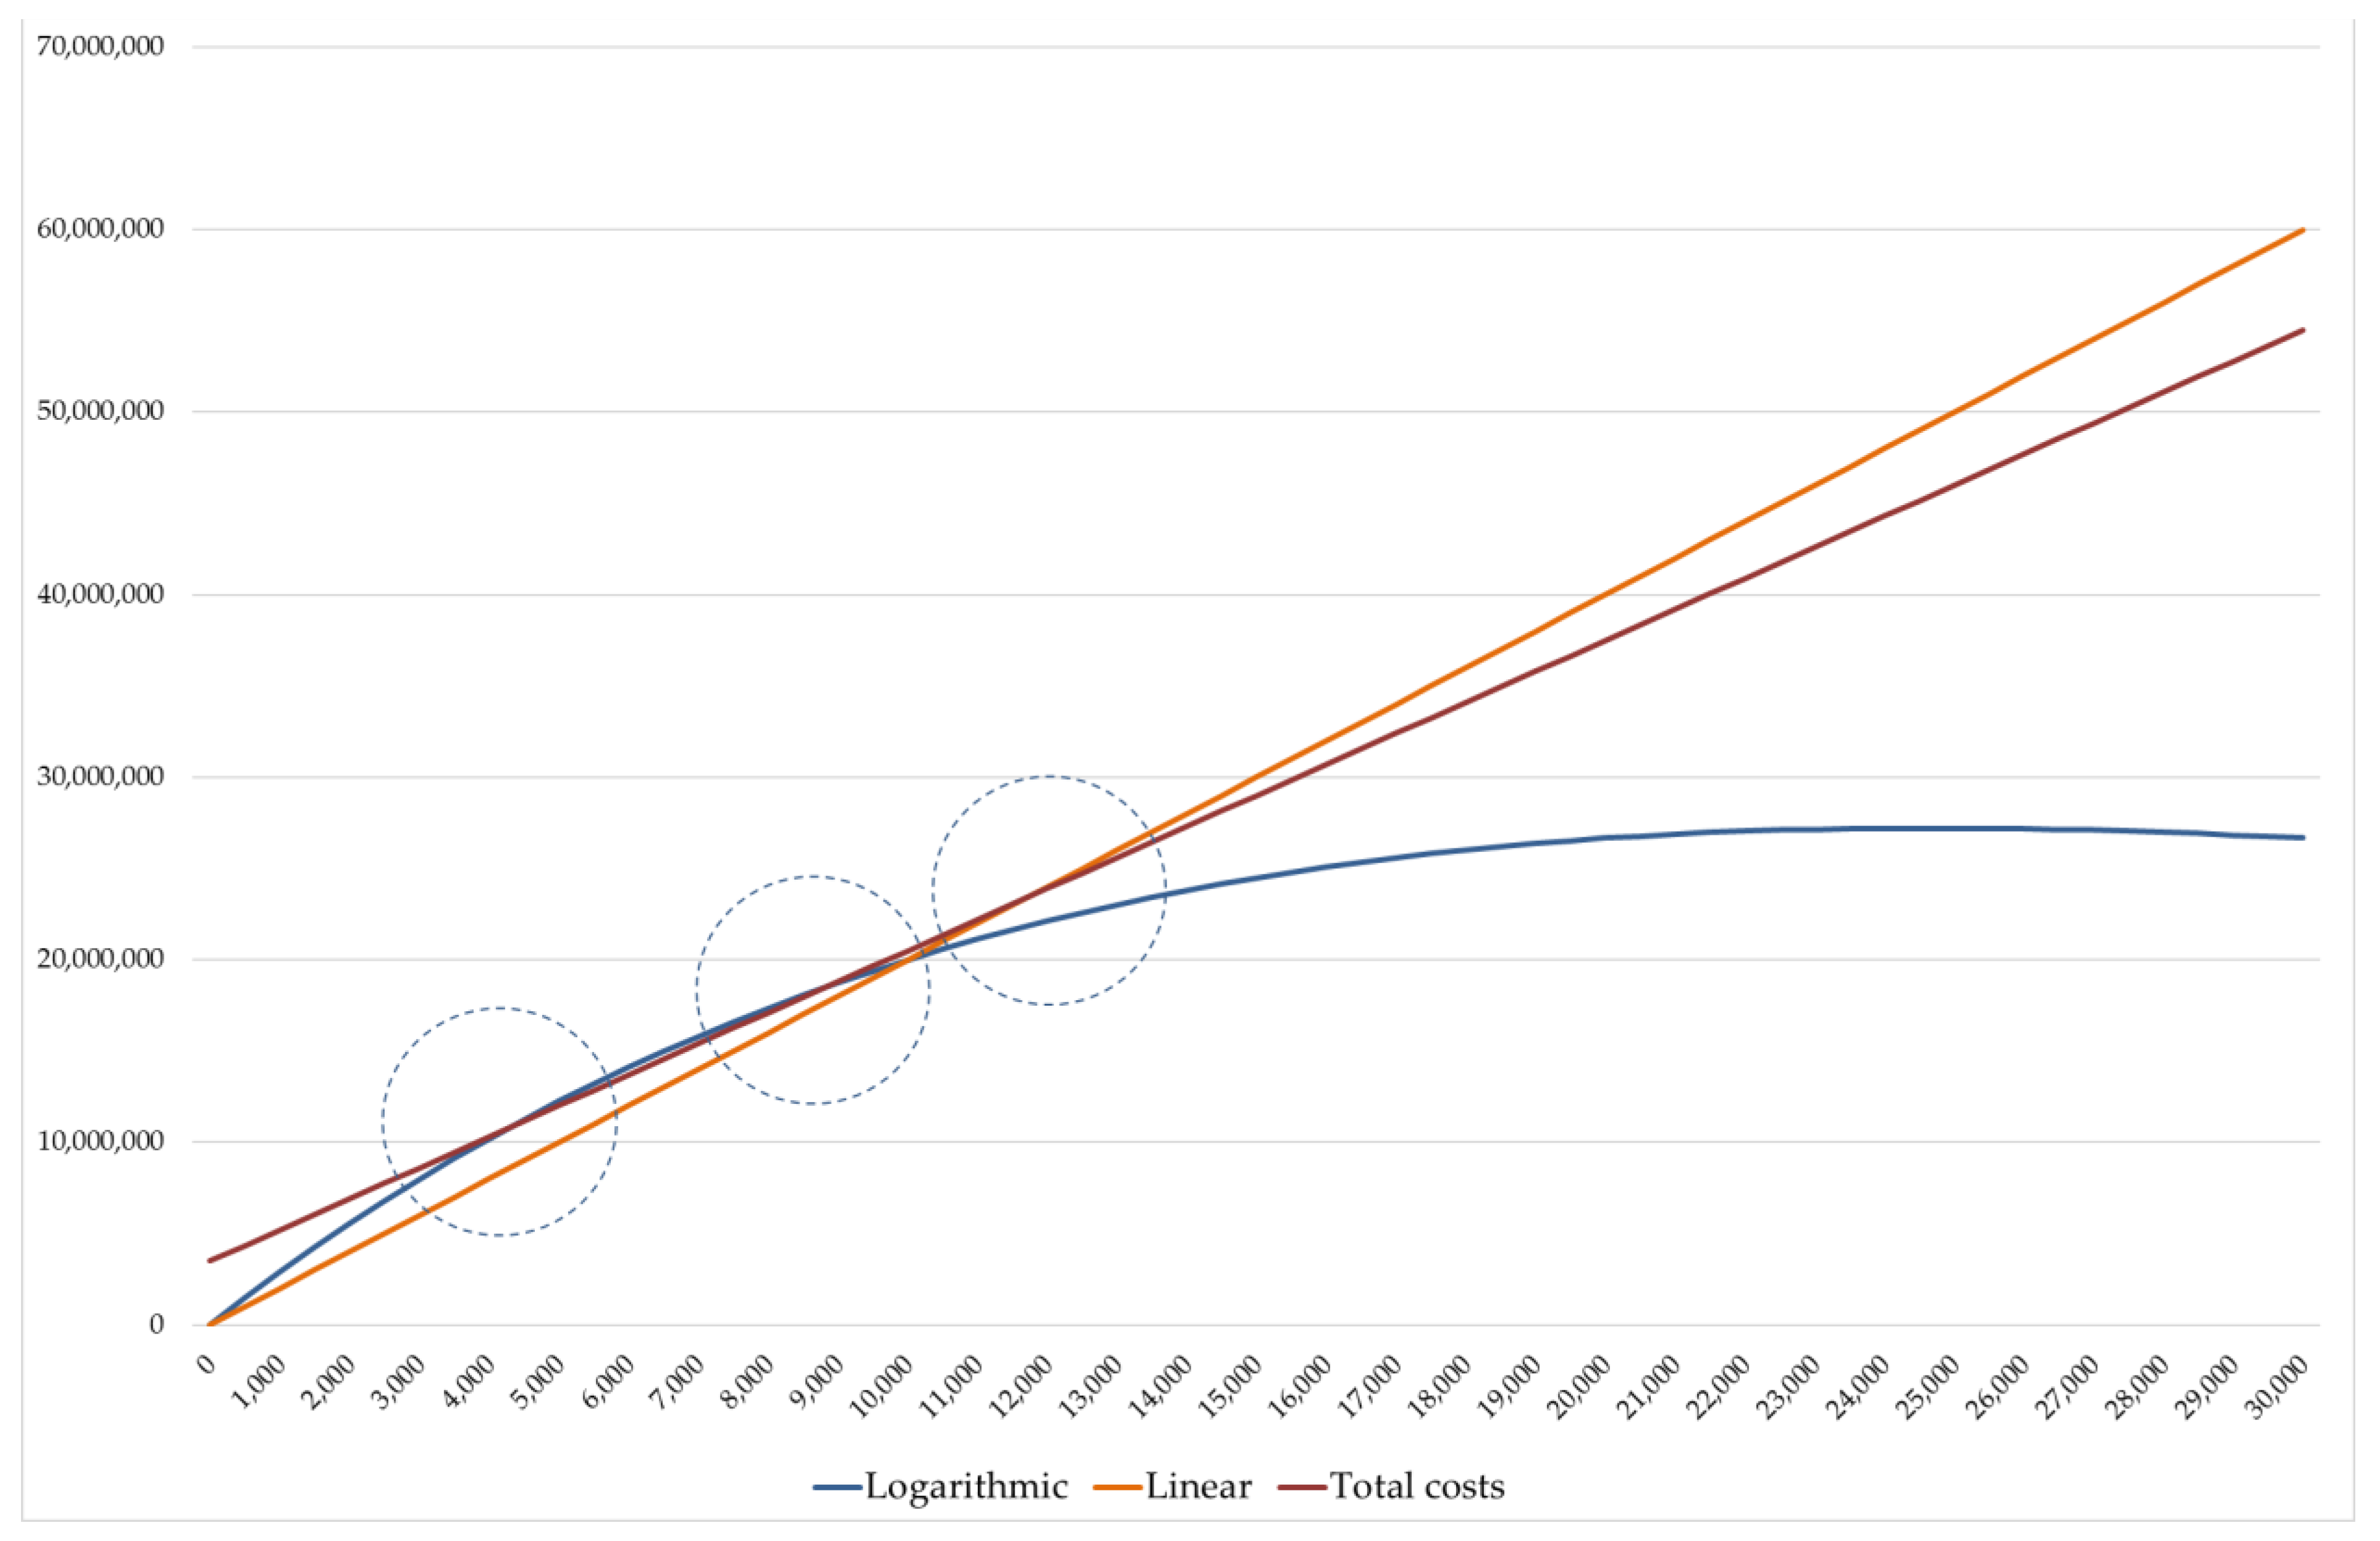
Figure 6, the corresponding curves of revenues according to the linear model and logarithmic model and total costs are indicated. From the analysis of the graph in
Figure 6, it should be observed that there are three regions to be examined, as the intersection points between the revenues curve and the total costs line.
In the linear model, starting from the quantity “0” to
q* (break-even quantity), an absence of feasibility in implementing the initiative is found (as the total costs curve is “above” the revenue one). From the break-even quantity
q* an extra profit for the private investor is expected, that could constitute an “extra burden” monetary sum to be paid by the private operator to the public administration. This point ensures the feasibility of the initiative for the private investor, as the normal profit is included in the total costs.
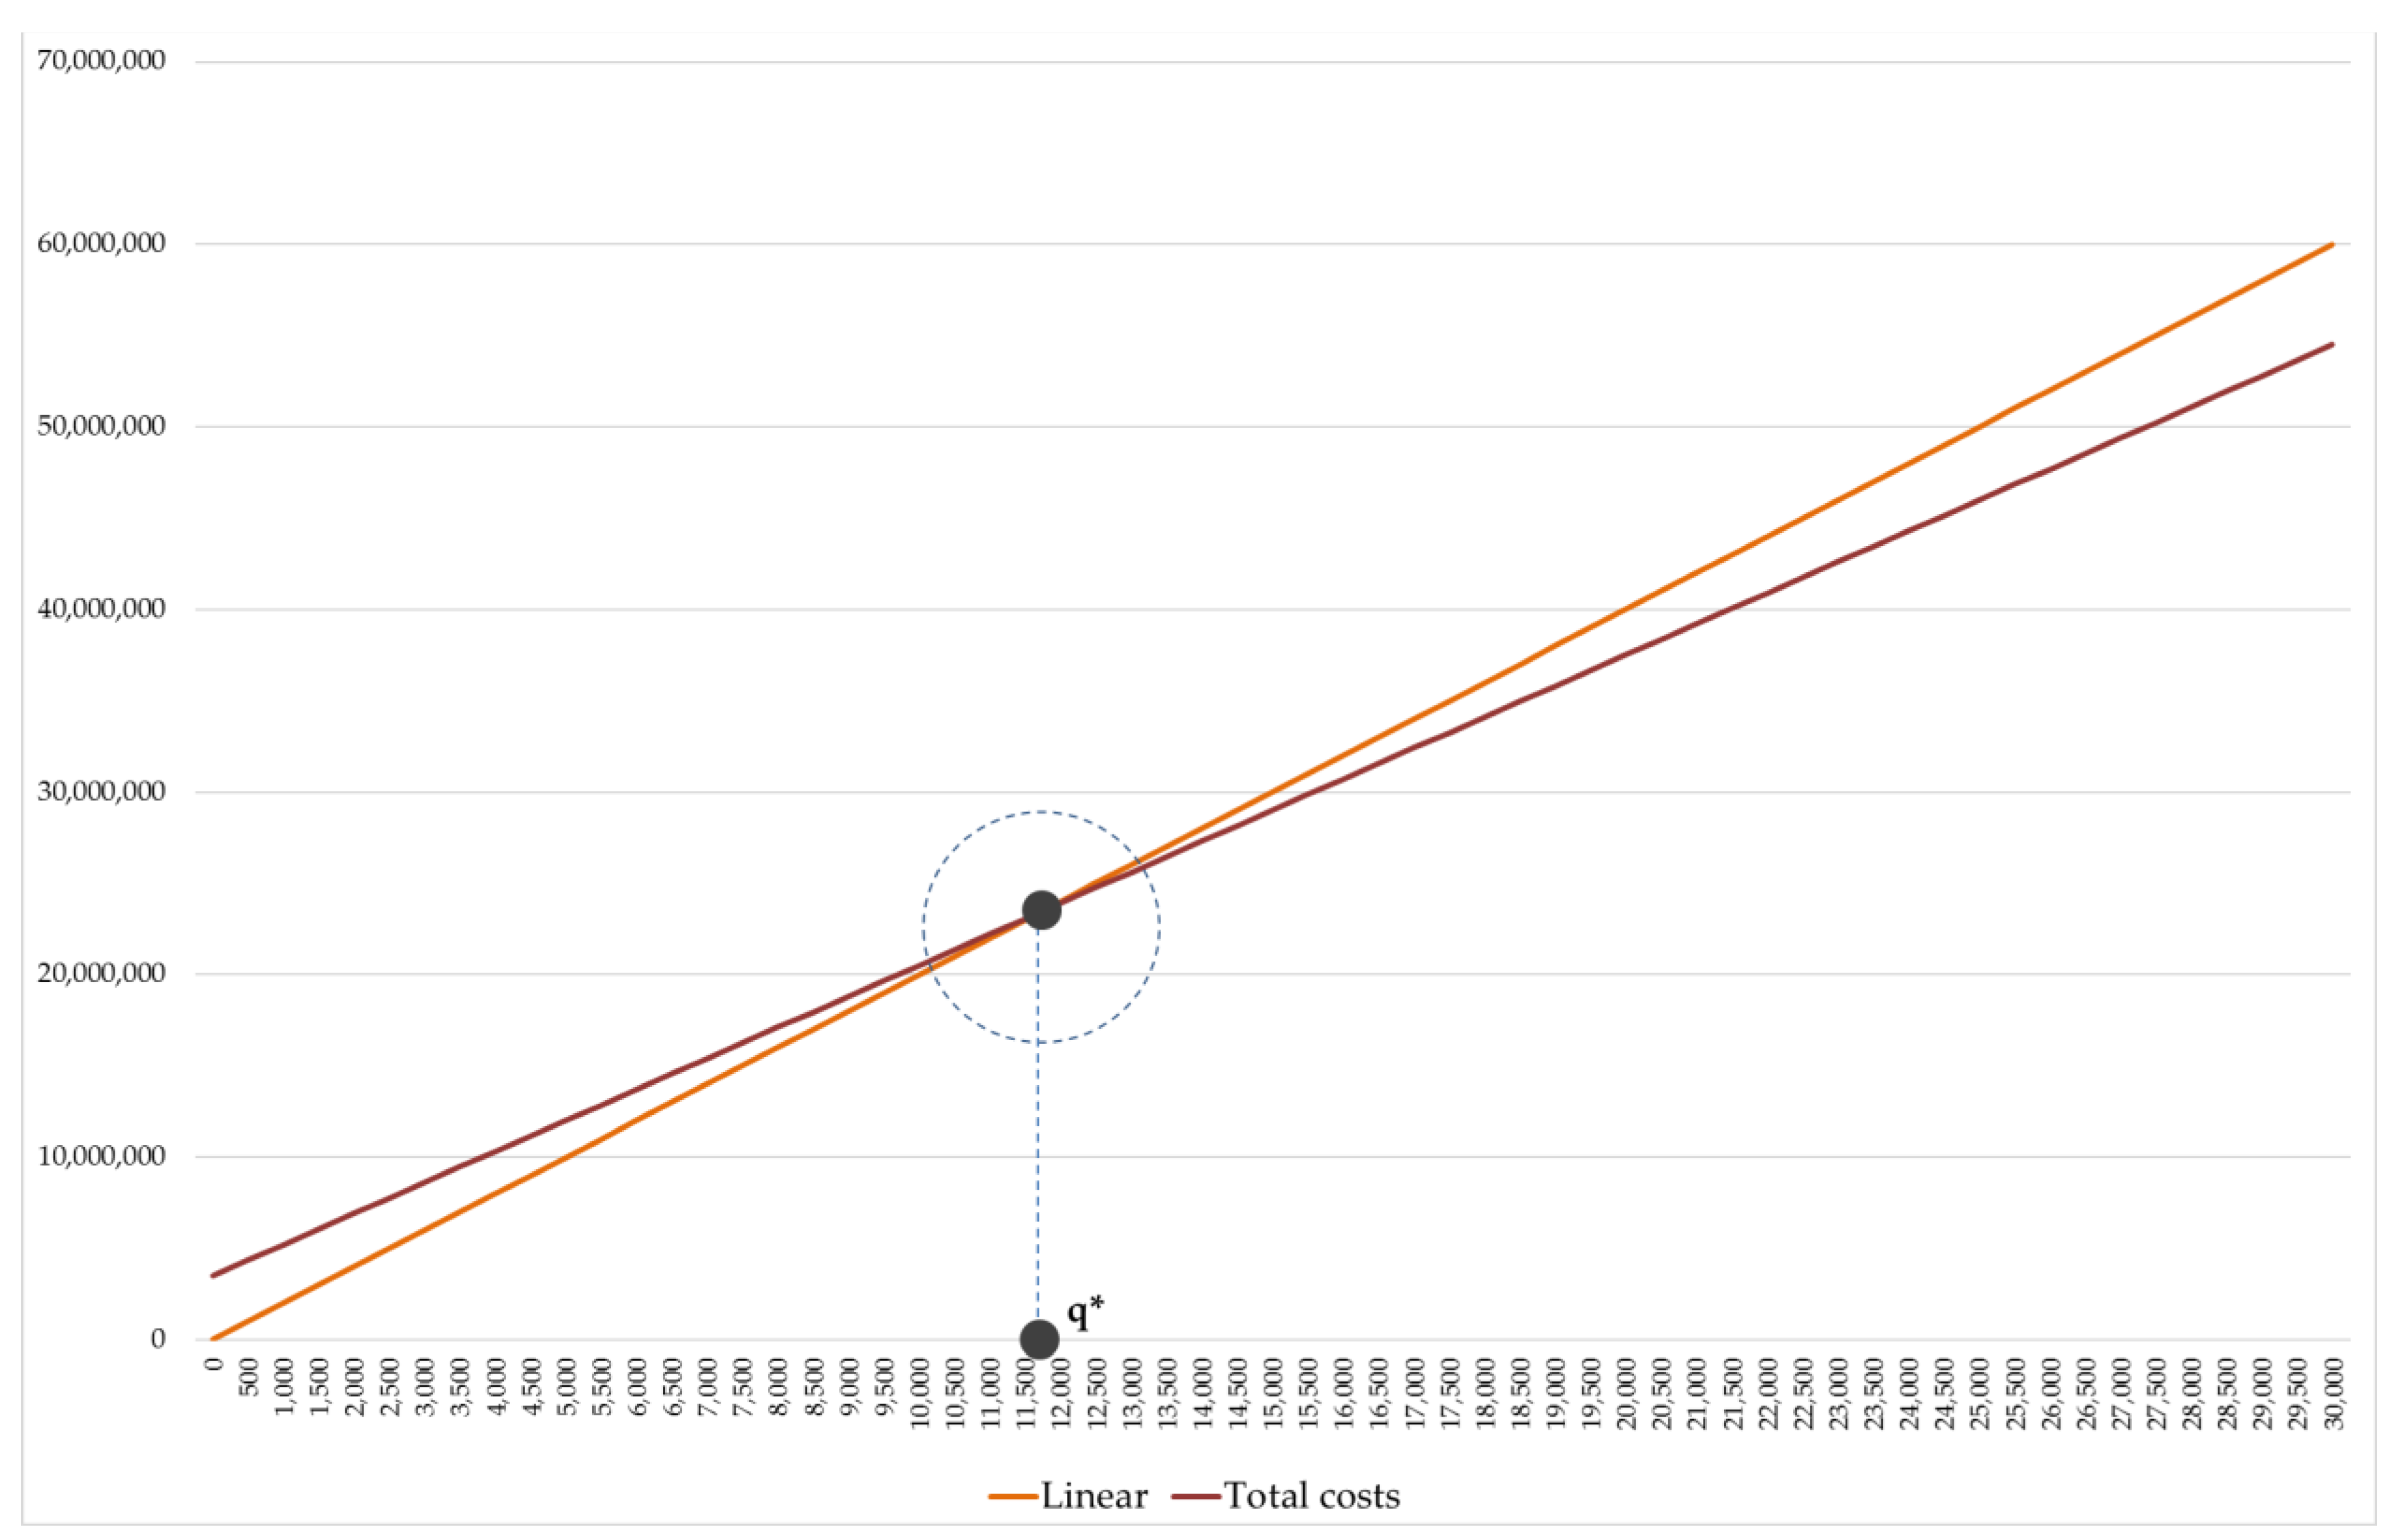
Figure 7 reports the revenues and total costs trends in the classical application of BEA (linear model) and the break-even point (
q*) is specified.
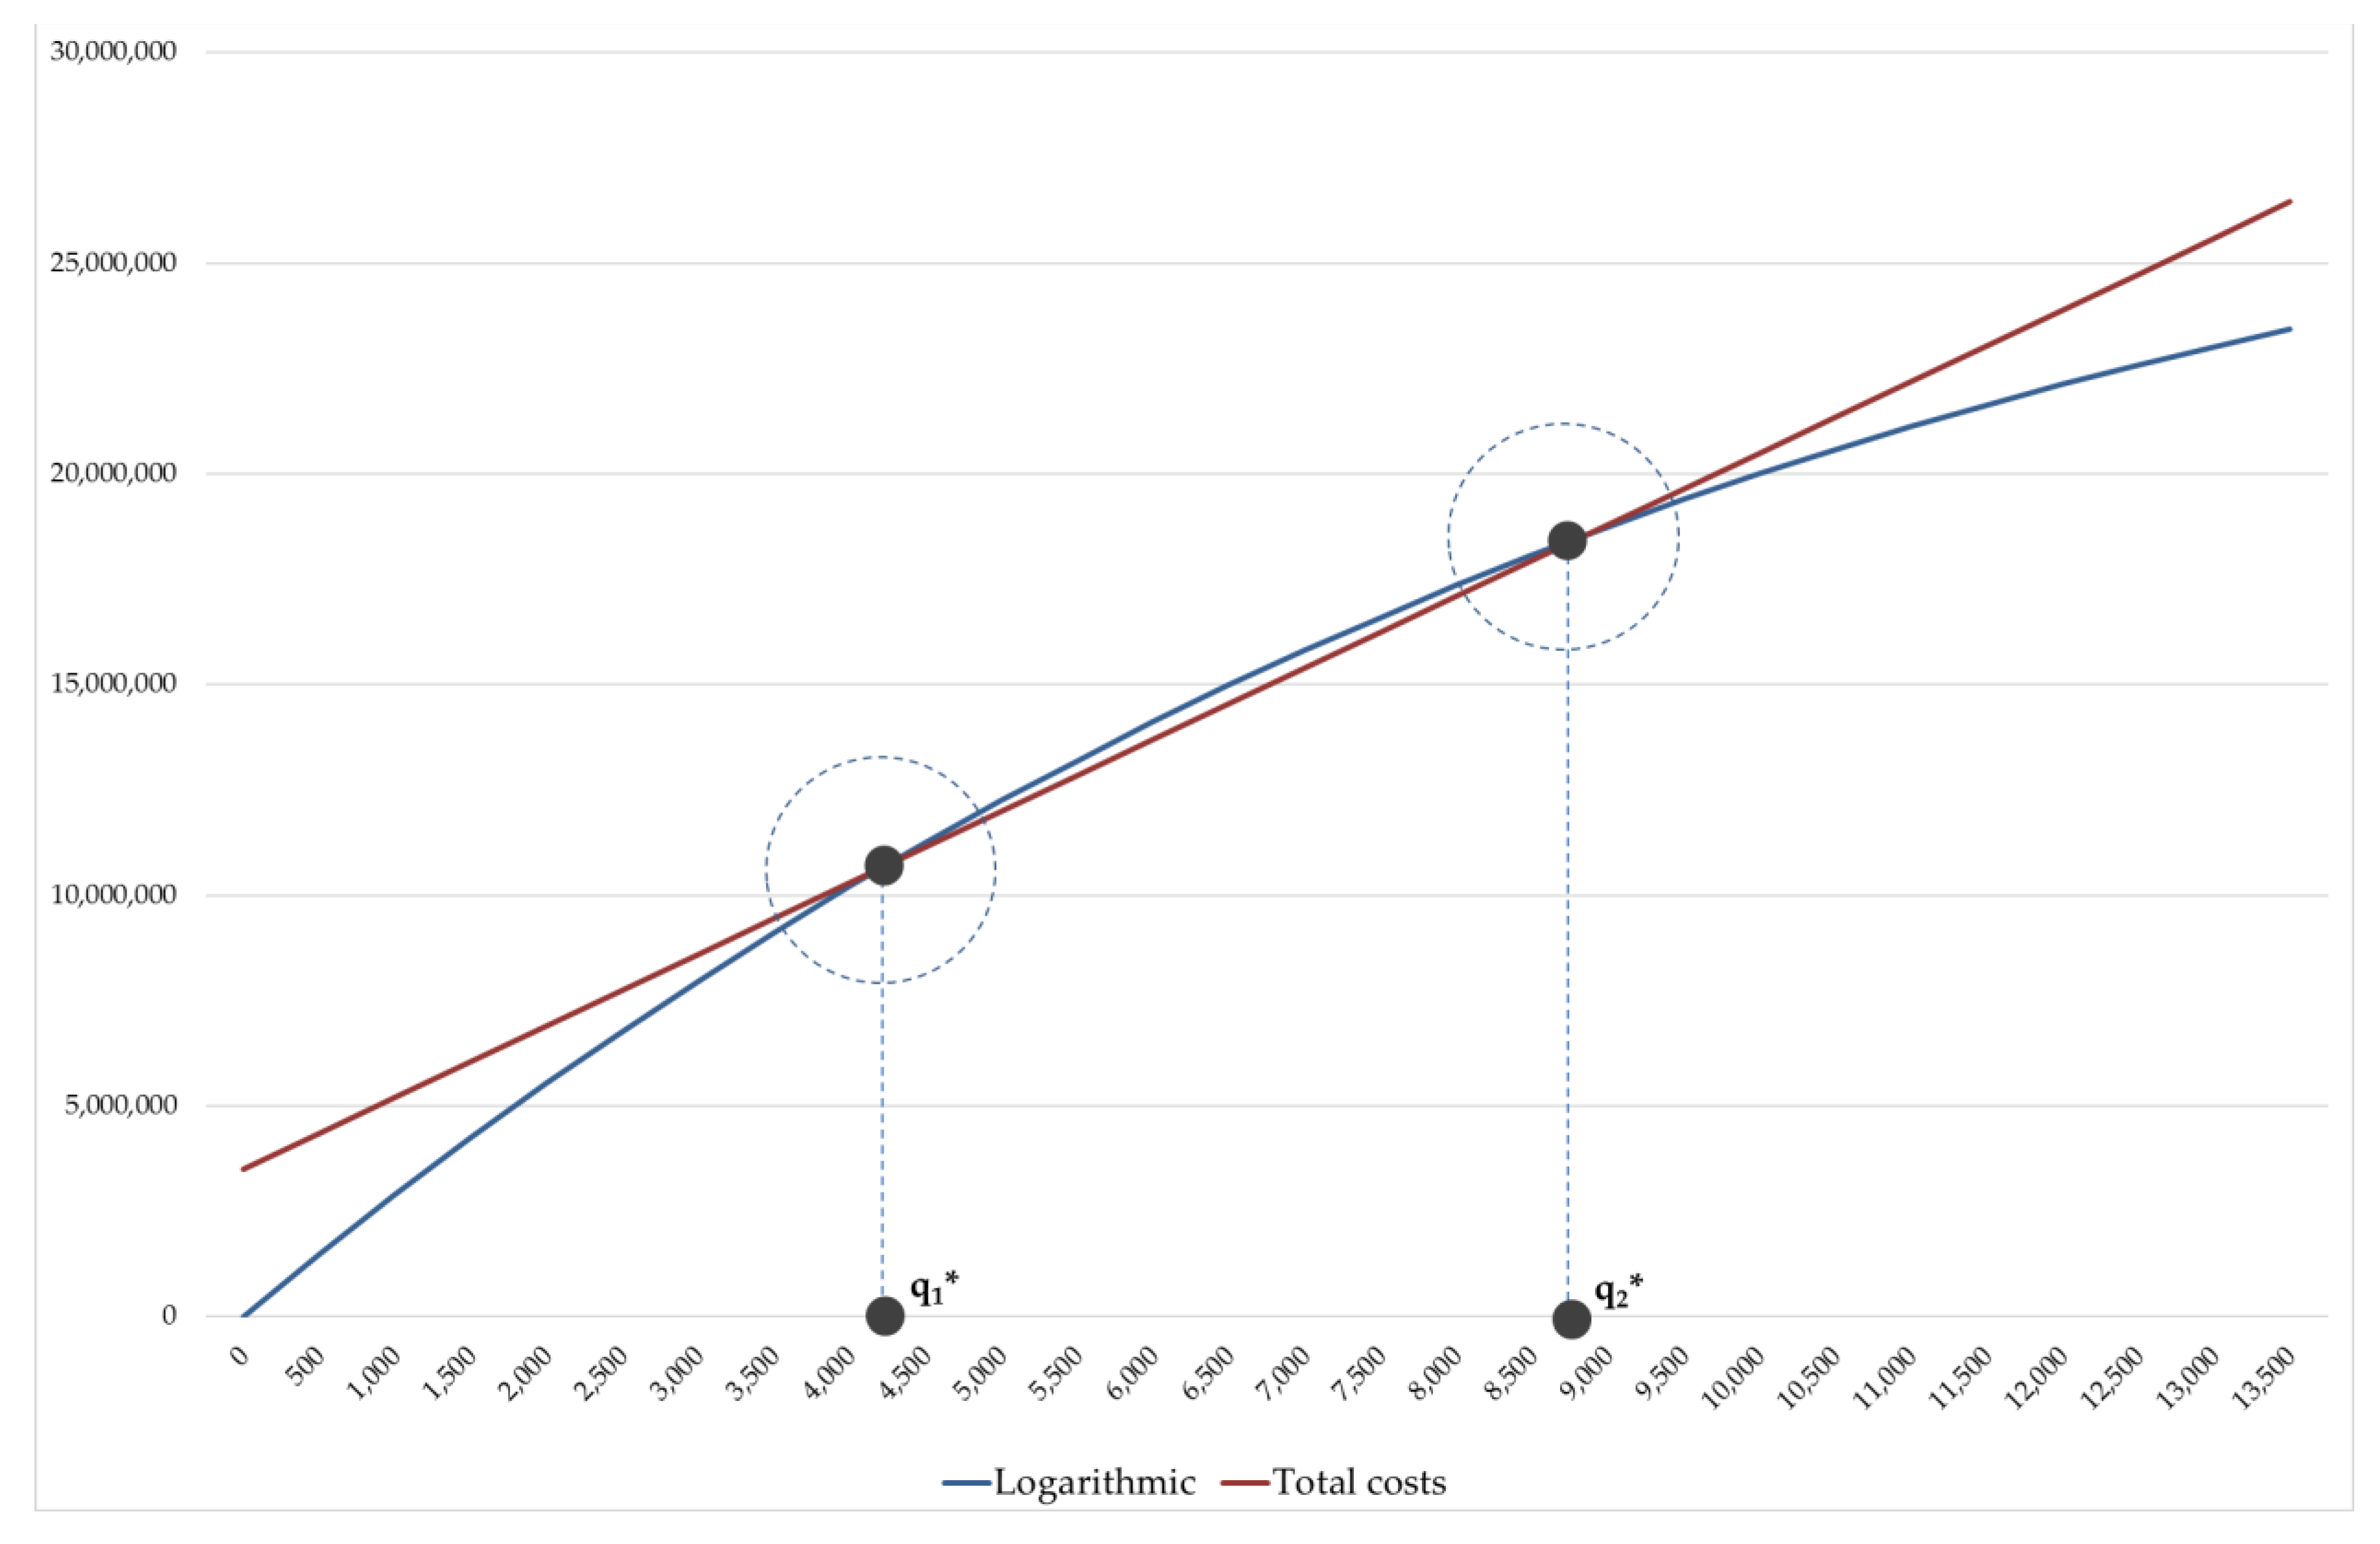
With reference to the curves of the proposed non-linear model (
Figure 8), the extra-profit area is enclosed between two graph portions, in which the absence of investment feasibility is detected. This graph region is defined by two break-even points, in correspondence of which the verification of the condition of minimum financial feasibility for the investor (EP = 0) is ensured.
In contrast to the revenue increasing trend in the linear model determined by the constant unit price and the growing quantity, the proposed model outlines different conditions not only related to the quantities to be produced, but also for the unit selling price of building GFA. In a first phase the unit price is increasing, due to a sort of “anxiety effect” in the market demand in the initial moment in which the first GFA quantities are realized and the subsequent quantities are planned, but they are not yet sufficiently known. A unit price “bubble” is defined, for which a first break-even point (q1*) is obtained with a unit selling price higher than the initially estimated value. By taking into account that the normal profit is a function of the total revenues/costs, the investor should increase the quantities of building GFA to be realized. In this way, an extra-profit (EP > 0) and, at the same time, an additional monetary amount that could be required by the public administration, can be obtained. The market bubble progressively deflates when the projected or advertised GFA quantities increase and, consequently, the unit selling price begins to decline. The feasibility for the investor is still guaranteed, up to q2*, that is, the quantity after which the total revenues are lower than the total investment costs, and the normal profit is not ensured. In general terms, the investor intervention should target at the q2* building, in order to reach an economic optimum to maximize the normal profit. On the other hand, the public administration goal should concern the building floor areas in the q1* and q2* range, in order to both guarantee the investor normal profit and bargain the extra profit.
7. Conclusions
The issue of the regeneration of brownfield sites constitutes a relevant debate in urban planning for sustainable development policies. According to the SNPA report [
101], in Italy from 2015 to 2022 private operators invested EUR 133 billion in urban regeneration projects, in particular, in 310 square kilometers of built surfaces in disuse, without using new soil. This is a significant trend in environmental protection, taking into account that the same report estimated that the value of the loss of ecosystem services provided by natural soil is around EUR 90,000 per hectare per year.
However, the purchase, re-use and disposal of a brownfield require advanced and specialized evaluation techniques. Cities develop much faster than the regulatory dispositions, which have different levels of complexity. The missing use of a property asset is a loss of value, leading to further degradation and passive expenditure. The assessment methods should define effective strategies for their enhancement and functional reconversion to facilitate their reintroduction to the market with new uses that meet the community’s demand. During the last years, the increasing attention towards urban regeneration initiatives has determined the development of innovative reclamation measures used at distressed brownfields. The main barrier to the activation of brownfield site renovation is the site clean-up costs according to safe standards. This is mainly due to the considerable preliminary costs for the analysis of the contamination and the identification of specific procedures for the persistent pollutants’ reclamation (pollutants e.g., asbestos, released by industry, transport and other economic activities that travel long distances and reach the ground, where they are diluted and are temporarily stored).
The present research is part of the wider issue with the aim of proposing a non-linear model for the assessment of the feasibility of regeneration initiatives of the (private and public) subjects involved. By starting from the operative logic of BEA, the model has tried to overcome the hypothesis related to the non-linearity of revenues—consequent to the unit selling price invariance assumption. When the market supply is significantly higher than the market demand or where a relevant amount of new improvements compared to the local demand is planned, this assumption does not constitute a reasonably valid condition.
By carrying out an accurate analysis of the demographic, urban and socio-economic factors that can affect the absorption of new building GFA (population, household incomes, building stock, public services and infrastructures, etc.), the proposed model represents a fundamental support to identify the minimum threshold financial feasibility. The innovative model, in fact, allows to identify the break-even GFA quantity to be realized, and, at the same time, the maximum request that the public administration can make to the private investor.
The application of the model to a brownfield transformation in the Southern Italy has allowed a comparison of the outputs obtained by the linear trend and the non-linear one. In situations in which the market supply already tends to absorb the local demand before the project realization, in the new planning that provides a large buildings construction and/or the transformation of big existing disused complexes (i.e., in highly variable markets), the new floor areas are quantitatively relevant compared to the current real estate demand. Therefore, in these cases, the standard methods (e.g., residual ones) are not adequate to define financially sustainable urban regeneration initiatives. With reference to the brownfield redevelopment initiatives, the proposed model, by taking into account the logarithmic trend of the selling prices, constitutes a useful tool to orient the public and private decision processes towards choices able to (i) ensure the financial feasibility of the intervention, and (ii) allow the public administrations to obtain the monetary sum required. In this sense, the main novelty of the evaluation model compared to the classical version of the BEA, that includes the invariance of the unit selling price hypothesis, is related to the introduction of the real trend of the revenues. The proposed model overcomes the rigid starting assumption on revenues that cannot actually occur. In fact, by taking into account the discount mechanisms on the unit prices corresponding to an increase in the amount of GFA, the evaluation model is able to consider the real market mechanisms, by proving more valid outputs in terms of the financial feasibility of the intervention. Following an economic and demographic analysis of the context in which the initiative is planned, the model represents a relevant support tool for the decision-making processes related to territorial redevelopment policies. Therefore, the present research constitutes a first and significant attempt to improve the BEA limits, in order to strengthen its implementation for the definition of effective urban strategies.
However, the main limitation of the proposed assessment model mainly relates to the intrinsic uncertainty in cases in which specific exogenous shocks (e.g., COVID-19 pandemic, significant financial crisis, geopolitical tensions, unexpected fiscal policies, etc.) occur. Therefore, the shortcoming of the non-linear evaluation model developed in the present research concerns the intrinsic (and general) weakness of the assessment tools, i.e., the inability to appropriately forecast the effects of relevant shocks that could have a prominent influence on property market dynamics. In these situations, new models should be formulated, based on the arising structural variations and the current real phenomena.
Further insights of the research include the neglect of the simplifying hypothesis of the invariance of total intervention costs, included in the classical application of the BEA. The consequent new model introduces different unit variable costs associated with scale economies and/or discount mechanisms to be implemented in situations in which a significant quantity of goods or services are produced. Moreover, for the same case study the cost-revenue analysis (CRA) may be carried out, in order to compare and furtherly validate the results obtainable by the implementation of the proposed model. Finally, different case studies concerning brownfield redevelopment initiatives located in various geographical contexts may be investigated, to test the model reliability and to compare the outputs of several ex ante financial assessment techniques.


