Article

Citizen Perception and Ex Ante Acceptance of a Low-Emission Zone Implementation in a Medium-Sized Spanish City

by
Montaña Jiménez-Espada
1,
Francisco Manuel Martínez García
2 and
Rafael González-Escobar
1,*
1
Department of Construction, School of Technology, Research Institute for Sustainable Territorial Development (INTERRA), Universidad de Extremadura, Avda de la Universidad s/n, 10003 Cáceres, Spain
2
Department of Art and Territorial Sciences, Universidad de Extremadura, 10003 Cáceres, Spain
*
Author to whom correspondence should be addressed.
Buildings 2023, 13(1), 249; https://doi.org/10.3390/buildings13010249
Submission received: 12 December 2022 / Revised: 11 January 2023 / Accepted: 13 January 2023 / Published: 16 January 2023
(This article belongs to the Special Issue Advances in Sustainable and Smart Cities)

Abstract

:
The public decision-making process at the municipal level becomes extremely complicated for government managers when unpopular measures must be adopted. In this sense, citizen participation processes become a tool of undoubted added value that allows municipalities to adapt their policies to the needs and feelings of their inhabitants. The aim of this research was to focus on addressing the point of view of the citizens of a medium-sized Spanish city in the face of the imminent implementation of a low-emission zone, in order to identify which aspects were of concern to citizens. The methodology used in the research was based on a declared preferences survey that allowed us to determine the daily behaviour of the user in terms of urban mobility and to anticipate the citizen’s reaction to the implementation of socially unacceptable initiatives, such as restrictions on access, circulation, and the parking of vehicles. The results obtained in relation to the consultation on alternative measures to tackle pollution, noise and traffic jams showed that citizens are receptive to improvements in universal accessibility, subsidies for public transport, increased road safety for PMV’s infrastructure, subsidies for the purchase of environmentally friendly vehicles and PMV, and the promotion of pedestrianisation. However, there are undoubted threats to the implementation of the LEZ, such as the lack of acceptance of the measure. Therefore, it is considered imperative for public administrations to work on the search for sustainable actions that contribute to improving the degree of compliance with the measure, while at the same time making an effort to disseminate the advantages of the LEZ for the quality of life and health of citizens (through information campaigns). There is a knowledge gap in scientific research on the ex ante assessment of the effects of possible transport measures to improve air quality in city centres and consultation through citizen participation. It is estimated that the resolution of this research gap could contribute to a more feasible, reasonable, and effective implementation of various urban mobility policies in medium-sized Spanish cities.

1. Introduction

Transport policies aimed at improving air quality in cities are in the process of expansion in many urban centres. However, the role that ex ante citizen participation can play in identifying possible impacts and potential implementation strategies for urban mobility and designing a more liveable city has not yet been fully exploited, as the effectiveness of these policies is strongly affected by strong social controversy. The intrinsic relationship between the development of human daily activities and mobility must be analysed in depth and with caution, involving a global vision, which allows for connecting distant areas of the city and, in turn, minimising the resulting externalities [1,2,3,4,5,6,7]. Sustainable mobility provides an alternative paradigm within which investigating the complexity of cities and strengthening the links between land use and transport becomes a priority in the planning agendas of many cities. The generation of policies that achieve sustainable urban mobility patterns seems crucial for political, social and academic agendas worldwide [8,9]. In the last century, there has been an indiscriminate choice to favour the use of private vehicles for everyday travel, generating a tacit dependence on this means of transport. This fact is accepted and internalised by the user and assumed as an habitual pattern of behaviour. However, multiple initiatives have been undertaken to transition mobility towards more sustainable patterns [10,11,12,13], including the involvement of different stakeholders in assessing the sustainability of mobility [14]. There is useful literature outlining strategic policy lines for a more liveable city and more sustainable mobility [15,16,17]. On a national level, several authors [18,19,20] have detailed a comparative approach regarding the measures adopted in different SUMPs in Spanish cities, and it can be deduced that it is essential to formulate holistic strategies that take into account essential aspects, such as mobility and the short and long-term impacts of public policies, the quality of life of citizens, the associations and neighbourhood groups affected, the social culture, and the urban fabric where each measure is applied. It is considered decisive to address lines of work focused on planning the form and design of the city, in addition to those that can be established in public transport, given that, despite the possibilities offered by the Internet and computerised communication networks, it is still essential to move from one place to another to access different basic services such as health, education, and even leisure.
Over the last few years, different ways of approaching the change towards a less polluting mobility model have been appearing, including demand management policies that include combined stimulus and dissuasion strategies, making the use of private vehicles more difficult or penalising them and making other means of transport more attractive through incentives and improvements. Such was the case in the establishment of urban tolls in London, the “Pico y placa” system in Colombia, or congestion charges in Rome, Oslo, Frankfurt, Berlin and Lisbon, among others [14,21,22,23,24,25]. Although, regardless of previous initiatives, it is observed that many cities in the old continent exceed the air quality limit values set by the European Union, as argued in [26]. Therefore, assessing the most efficient measures to reduce pollution levels is one of the premises developed in [27,28]. Examining how a transport pricing policy aimed at reducing car use can affect people’s quality of life is the main task in [29], while [30] aims to shed light on why citizens are satisfied with government performance by including their views on the use of restrictive instruments, as well as inhabitants’ evaluation of transport quality. The special issue [31] discusses a range of decision-support tools that can help overcome barriers to effective policymaking.
Other schools of thought have opted to develop and test collaborative approaches intended to evaluate ex ante the implementation of specific transport measures to improve inner-city air quality through stakeholder involvement [32], as well as the development of an integrated modelling approach to assess ex ante the air quality impacts of LEZs in urban areas [33]. These approaches in the literature reflect a growing societal concern about the challenge of controlling transport-generated air pollution in cities [34]. A clear example of this can be seen in the research developed in [35], where the interest lies in knowing the degree of public acceptance of the Barcelona LEZ.
In Spain, according to Law 7/2021 of 20 May on climate change and energy transition [36], municipalities with more than 50,000 inhabitants in Spain must adopt sustainable urban mobility plans by 2023 that introduce mitigation measures to reduce emissions from mobility, including the establishment of low-emission zones, defined as areas delimited by a public administration within its territory in which restrictions on access, circulation and the parking of vehicles are applied to improve air quality and mitigate greenhouse gas emissions, in accordance with the classification of vehicles by their emissions level as established by the Directorate General of Traffic (DGT). In view of this regulatory and mandatory requirement, there are 149 medium-sized municipalities in Spain that must establish the premises for the establishment of a low-emission zone in their territory. For the moment, there is no common criterion that definitively establishes the types of vehicles that will or will not be able to circulate within these low-emission zones, as it will be each local council, through its different municipal ordinances, that will impose specific and concrete restrictions.
At this juncture, which generates a certain amount of uncertainty and concern among citizens, this research has opted to analyse the a priori impression of the population of an average Spanish city in the face of the imminent implementation of a LEZ in its territory, using as a working methodology the development of surveys of declared preferences. Knowing the position of citizens, as well as the possible degree of acceptance of certain proposed measures, is crucial in the planning and management processes of local administrations. This paper aimed to shed some light on the knowledge gap that exists in the ex ante evaluation of urban measures that promote air quality and the use of public participation processes.
The authors consider this research to be a useful contribution to the advancement of knowledge in the context of LEZs. In that sense, the article is based on a combination of three fundamental aspects: (a) to identify people’s travel patterns in a standard medium-sized city prior to the implementation of the measure, as well as their personal assessment of the expected changes (through a stated preference survey); (b) to provide public managers with a better understanding of citizens’ motivations and predisposition towards the LEZ (which would allow redirecting negative impacts and optimising the social benefits of sustainable urban mobility policies); and (c) to understand the stability of the approach to implementing a low-emission zone, as well as the relationship of this initiative with the challenges of climate change through a SWOT analysis (prior to making strategic decisions with the aim of increasing the level of information and reducing citizen uncertainty).

2. Materials and Methods

2.1. Study Area

This research focused on the analysis of the future implementation of an LEZ in Cáceres, one of the medium-sized Spanish cities where it will be mandatory, according to national legislation, as of 1 January 2023. Cáceres is located in the centre of the Autonomous Community of Extremadura and has a census population (according to the Spanish National Statistics Institute in 2021) of 95,418 inhabitants. The city limits are bordered to the east by the Ribera del Marco and the Sierra de la Mosca, to the west by the Sierra de Aguas Vivas and to the north and south by the Trujillo-Cacereña peneplain. The consolidated urban centre is divided from an administrative point of view into four districts: centre, north, south, and west (Figure 1), although for the development of this research, the districts of the city and the neighbouring municipalities have also been considered as the possible origin-destination of trips to the LEZ of Cáceres.
The heritage and monument-filled part of the city of Cáceres boasts worldwide recognition. Due to its rich historical past, which has a not inconsiderable attraction, the monumental complex was awarded in 1986 with the declaration of World Heritage City by UNESCO. This honourable distinction is essentially due to its excellent state of heritage conservation, being considered the best preserved monumental complex in Spain, and reaching third place in the ranking in Europe [37]. This jewel of Extremadura’s heritage is unique for its historical features, which show traces of multiple and contradictory influences. The historical complex is characterised by the presence of fortress-houses, palace-houses and towers that nowadays surprise the tourist with their high level of conservation and material integrity. Focusing on the four districts that divide the territorial area of the city under study, it can be seen that they show significant differences in the following elements: building typology, urban fabric, demography and history. It can be clearly observed that there is a densely populated district formed by the historic quarter inside and outside the city walls (centre), which is surrounded by neighbourhoods of urban expansion with an urban fabric similar to those of other Spanish cities at the end of the 20th century [38]. Adjacent to the central district, there are three other districts with lower density and higher zoning: the west-east district (predominantly residential and low density), the north district (which has greater urban diversity, combining residential areas, the university campus and other periurban facilities and providing a large area occupied by high-capacity road infrastructure) and the south district (with a very low-density urbanisation of periurban character, small industries, housing developments and a growing variety of land uses in areas close to the center). In addition, the railway line has encouraged the division of some neighbourhoods with marked social segregation (Aldea Moret industrial mining town), while other well-known and traditional neighbourhoods of peripheral origin have been perfectly integrated into the compact urban fabric (Las Trescientas or Llopis Iborra). The four districts mentioned are structured by a set of radial road infrastructures, planned and contemplated in the urban planning since 1923, which converge in the center district (specifically in the Plaza de América), as well as by various bypasses suggested in the 1979 planning and carried out in the 1998 and 2010 plans [39]. For the above reasons, it is estimated that the city of Cáceres exhibits a typical urban fabric in the national scenario, presenting a historic center accompanied by a dense urban development completed by a series of expansion areas, perfectly identifiable in its General Municipal Plan. This fact has led to an increase in the occupied surface area five times greater than the increase in population since 1965. There has also been a gradual reduction of public facilities in the historic center in favour of periurban spaces, as well as a shift in the habitual use of housing in favour of tourist uses [40].
With regard to the dynamics of movement, there is a daily flow of journeys between the neighbouring municipalities towards the city of Cáceres, generating pendular movements from these neighbouring municipalities towards the provincial capital (a real commercial, socio-economic and administrative centre). In their day-to-day lives, the inhabitants’ daily journeys are favoured by the backbone provided by its important road network, mainly due to the existence of three high-capacity infrastructures (A-66, A-58, and A-5).
According to the latest report of the Metropolitan Mobility Observatory [41], the motorisation index (vehicles/1000 inhabitants) for the city of Cáceres is 515 for cars and 106 for motorbikes, and for the metropolitan area (including adjacent municipalities) it is 540 for cars and 103 for motorbikes. Focusing on the characteristics of mobility in the metropolitan areas, in Cáceres there are 0.19 million journeys on a working day, which means two journeys per person per day. In terms of modal split, 56.8% of the population opts for the private car, 33.5% for walking or cycling and the remaining 9.7% for public transport. The supply of parking spaces for private vehicles is divided into: (1) unregulated surface public road (39,762 spaces); (2) regulated surface public road (850 spaces); and (3) publicly managed underground (1100 spaces). The Cáceres urban bus has 14 lines, with a total length of 308.7 km and 411 stops, which means an average length of 22 km and a spatial coverage of 3 km of lines/km2 and 4 stops/km2, developing an average annual commercial speed of 14.9 km/h with an average peak hour interval of 22 min and a daily service lasting 16 h. The cost of a single ticket is €1.1, a 10-trip pass is €8, and a monthly pass is €29. Recently, the city has approved the exemption of inhabitants under 16 years of age from paying for public transport, which is leading to a clear modal shift towards this means of transport on the part of this sector of the population. On the other hand, in terms of cycling mobility, the city has a total of 40 km of cycle lanes, which are expected to increase in the short and medium term. Despite the positive modal transfer that the COVID-19 pandemic has brought about in terms of travel and given that this trend has led to the expansion of new forms of mobility, it can be seen that the city of Cáceres does not yet have shared mobility services (car, motorbike, bicycle or scooter).
Considering the guidelines set out in the new Climate Change Law, it is clear that the city of Cáceres will have to adapt and propose measures to encourage a shift towards more sustainable forms of mobility. In this research work, the city of Cáceres was selected as an example under analysis for several reasons which are set out below: (1) it is one of the 149 medium-sized Spanish cities in which the establishment of a ZBE will be mandatory as of 1 January 2023; (2) due to its urban configuration and territorial planning, it has a typical urban fabric in the national panorama (with a historic centre accompanied by a dense urban development and a series of expansion areas), which makes it possible to serve as a comparative reference for other similar cities; and (3) the development of surveys of the population is an arduous and complicated process, not without its vicissitudes, which is why it was decided to undertake the study in the city where the researchers considered that they would obtain the greatest success in terms of the number of responses (with the aim of obtaining a valid representative sample).

2.2. Research Design

The main objective of the research project was the implementation of a low-emission zone (LEZ) in the city of Cáceres, taking as a reference other Spanish or European cities where this type of measure is already fully operational, in order to achieve adequate parameters in terms of urban sustainability. The secondary objectives were: (1) the promotion of sustainable mobility by reducing the congestion generated by motor vehicle traffic, establishing pedestrian priority and the commitment to efficient public transport; (2) improvement of the social welfare and health of citizens by reducing greenhouse gases; (3) reduction of accidents in terms of urban road safety; and (4) release of part of the occupation of public space used primarily by private vehicles. The following regulations and strategic planning have been taken into account as reference tools to achieve the project objectives: (a) Law on Climate Change and Energy Transition [36]; (b) Integrated National Energy and Climate Plan [42]; (c) Strategy for Safe, Connected and Sustainable Mobility 2030 [43]; (d) Law on Sustainable Mobility and Transport Finance [44]; (e) Long-Term Decarbonisation Strategy 2050 [45]; (f) Cáceres Sustainable Urban Mobility Plan (PIMUS) [46]; (g) Cáceres Integrated Sustainable Urban Development Strategy (EDUSI) [47]; and (h) General Municipal Plan of the city of Cáceres (PGM) [48].
At the beginning of the research project (prior to the design and drafting of the survey), a working meeting was held between representatives of the company AHILAR, the University of Extremadura and municipal technicians in order to identify as realistically as possible what would be the delimitation of the outer contour of the different areas of the city that could be included within the LEZ. The researchers developed different initial attempts at LEZ zones using computer-aided design software (AutoCAD) and geographic information tools (QGIS) and finally opted to include in the survey the map shown in Figure 1, which implies an extension of the LEZ similar to the one currently delimited by the City Council of Cáceres using access control cameras, since it was considered the most viable. Subsequently, in order to address the main objective of this research (to know the social perception of the forthcoming implementation of an LEZ in the city of Cáceres), a survey campaign was carried out with the intention of capturing the main variables influencing modal choice at the individual level. The questionnaire was designed based on a detailed review of similar forms on urban mobility and LEZs, and a validation process was carried out before launching the final version of the survey [49]. Initially, it was decided to send a very advanced draft of the survey to a group of people with different characteristics, so that they could give their opinion on the following aspects: understanding of the questionnaire, meaning of the wording, the involvement of the respondent, the length of the text, the duration, difficulties encountered, possible typos or omissions, design, etc. Taking into account the contributions of the validation process and in order to obtain the appropriate socio-demographic heterogeneity, a refined questionnaire was prepared whose dissemination plan combined multiple channels: (1) online through social networks (WhatsApp, LinkedIn, Facebook, Twitter); (2) through email to the university community and local public administrations; (3) dissemination in written and digital press; (4) by generating a paper flyer providing a QR code distributed in the establishments, hotels, foundations and other buildings within the area established as a future LEZ; and (5) face-to-face surveys through fieldwork at street level (with the aim of bridging the digital divide and facilitating access to digitally unskilled sectors of the population that face technological barriers on a daily basis). The approach of combining different survey formats (online, paper, face-to-face) and dissemination through the press, arises from the purpose of reaching the maximum number of inhabitants possible, with the aim of obtaining an image adjusted to the reality of the behaviour of the population of the city under study in terms of mobility and their perception of the implementation of a low-emission zone. The research project was developed over a one-year period, starting in December 2021. The survey was conducted over a period of one month, starting on October 2022, and a total of 419 valid responses were obtained. Figure 2 shows the methodological process followed for the implementation of the survey.

2.2.1. Questionnaire Structure

With regard to the elaboration and design of the questionnaire, it was decided to divide it into three large thematic blocks according to their category, consisting of a total of twenty questions. The content of the three sections is detailed below:
  • Section A (Socio-demographic data): This block of questions aims to facilitate the segregation of data according to different aspects, namely: sex of the respondent, age, employment status, level of studies, possession of driving licence and vehicles available;
  • Section B (Characterisation of the usual trip): This module tries to identify the origin-destination matrix, reason for trips and means of transport used, frequency, necessary steps in the trip, assessment of mobility proposals, opinion on particular situations at street level, aspects to be improved in terms of universal accessibility and point of view regarding the overuse of the private vehicle;
  • Section C (Implementation of a LEZ in Cáceres): This group of questions is divided into three distinct parts. Initially, it focuses on collecting the user’s degree of knowledge about concepts such as LEZs, climate change, environmental labels, etc. Subsequently, a series of measures for action in the city to tackle pollution and noise and to achieve more sustainable mobility are openly posed using a five-point Likert scale [50]. Finally, a series of questions are set out to be rated by the user, expressing their stated preferences on the impact that an LEZ would have on the city in general, as well as on a personal level.
The sample covers a wide range of information and reliably represents the user’s preferences prior to the implementation of an LEZ in the city of Cáceres. The invaluable data obtained through citizen participation following the development of stated preference surveys are a cornerstone for stakeholders in spatial planning, providing invaluable information to city managers [51]. The quantitative approach based on surveys is underpinned by their frequent use in transport and mobility studies.

2.2.2. Sample Size

Regarding the survey, 419 valid responses were obtained for an adult population of 78,634 inhabitants. In order to identify whether the sample size is representative of the population and to be able to validate the study, the margin of error in the surveys was estimated. The values used in the calculation carried out are as follows: t-size of the surveyed population N = 78,634; sample size n = 419, with a distribution of p = 0.5. In this case, considering a confidence level of 95%, it is concluded that the margin of error is less than 5%. Therefore, the sample is considered representative of the population analysed and presents two fundamental characteristics: randomness and adequate size.

3. Results

The results collected at the end of the period established for carrying out the surveys are intended to provide a true reflection of the information obtained for each of the three sections that made up the structure of the questionnaire. First, the socio-demographic data of the respondents is highlighted, containing information at a personal level and allowing the typology and characteristics to be observed. Second, the information relating to mobility patterns was analysed to find out the spatial distribution of journeys in the city of Cáceres and the main aspects that determine them, with the intention of trying to identify possible problems a priori. Finally, by means of the declared preference survey methodology, the perception of the public about the implementation of the low-emission zone in the city of Cáceres was studied in order to identify how the implementation of the LEZ would affect the inhabitants of Cáceres.

3.1. Socio-Demographic Data

The analysis of the socio-demographic situation of the respondents is a tool that allowed us to obtain relevant information about different attributes, such as: gender, age range, employment status and level of studies, so that this segregation of the data would make it easier to observe the essential characteristics of the respondents. Table 1 shows the number of valid responses analysed, as well as the degree of representativeness of each group and subgroup considered, together with the responses obtained regarding the availability of driving licences by the users surveyed.
As can be seen from the figures presented in Table 1, more than 60% of respondents were male (a fairly high degree of representativeness) compared to women (almost 38%). With regard to the age range, the subgroup with the highest number of responses was between 36 and 50 years of age, with the 18–25, 26–35 and 51–65 age brackets having similar values of around 20%. The presence of the digital divide can be clearly seen in the responses obtained from the population over 65 years of age. With regard to the employment situation of the respondents, those working in the workplace are the most represented, with 62% of the responses, followed by students (less than 20% of the total). On the other hand, there is an upward trend of mixed workers (combining face-to-face and telematic tasks) and a timid representation of purely telematic workers. Focusing on the level of education of the respondents, more than 75% of the respondents have a university education, and 20% have a vocational training qualification or a baccalaureate (excellent educational figures). Going fully into the user’s relationship with regard to the use of a private vehicle, the respondents were asked about the availability of a driver’s licence. The answers to this question, together with the availability of vehicles in each family unit, make it possible to determine how the implementation of the LEZ in the city of Cáceres would directly affect the user. Table 1 shows that more than 93% of the responses refer to the availability of a car driving licence and 6.4% have no driving licence at all. In addition, and in relation to the question on the availability of a driving licence, the survey included a question on the number of vehicles in each household and their type. 
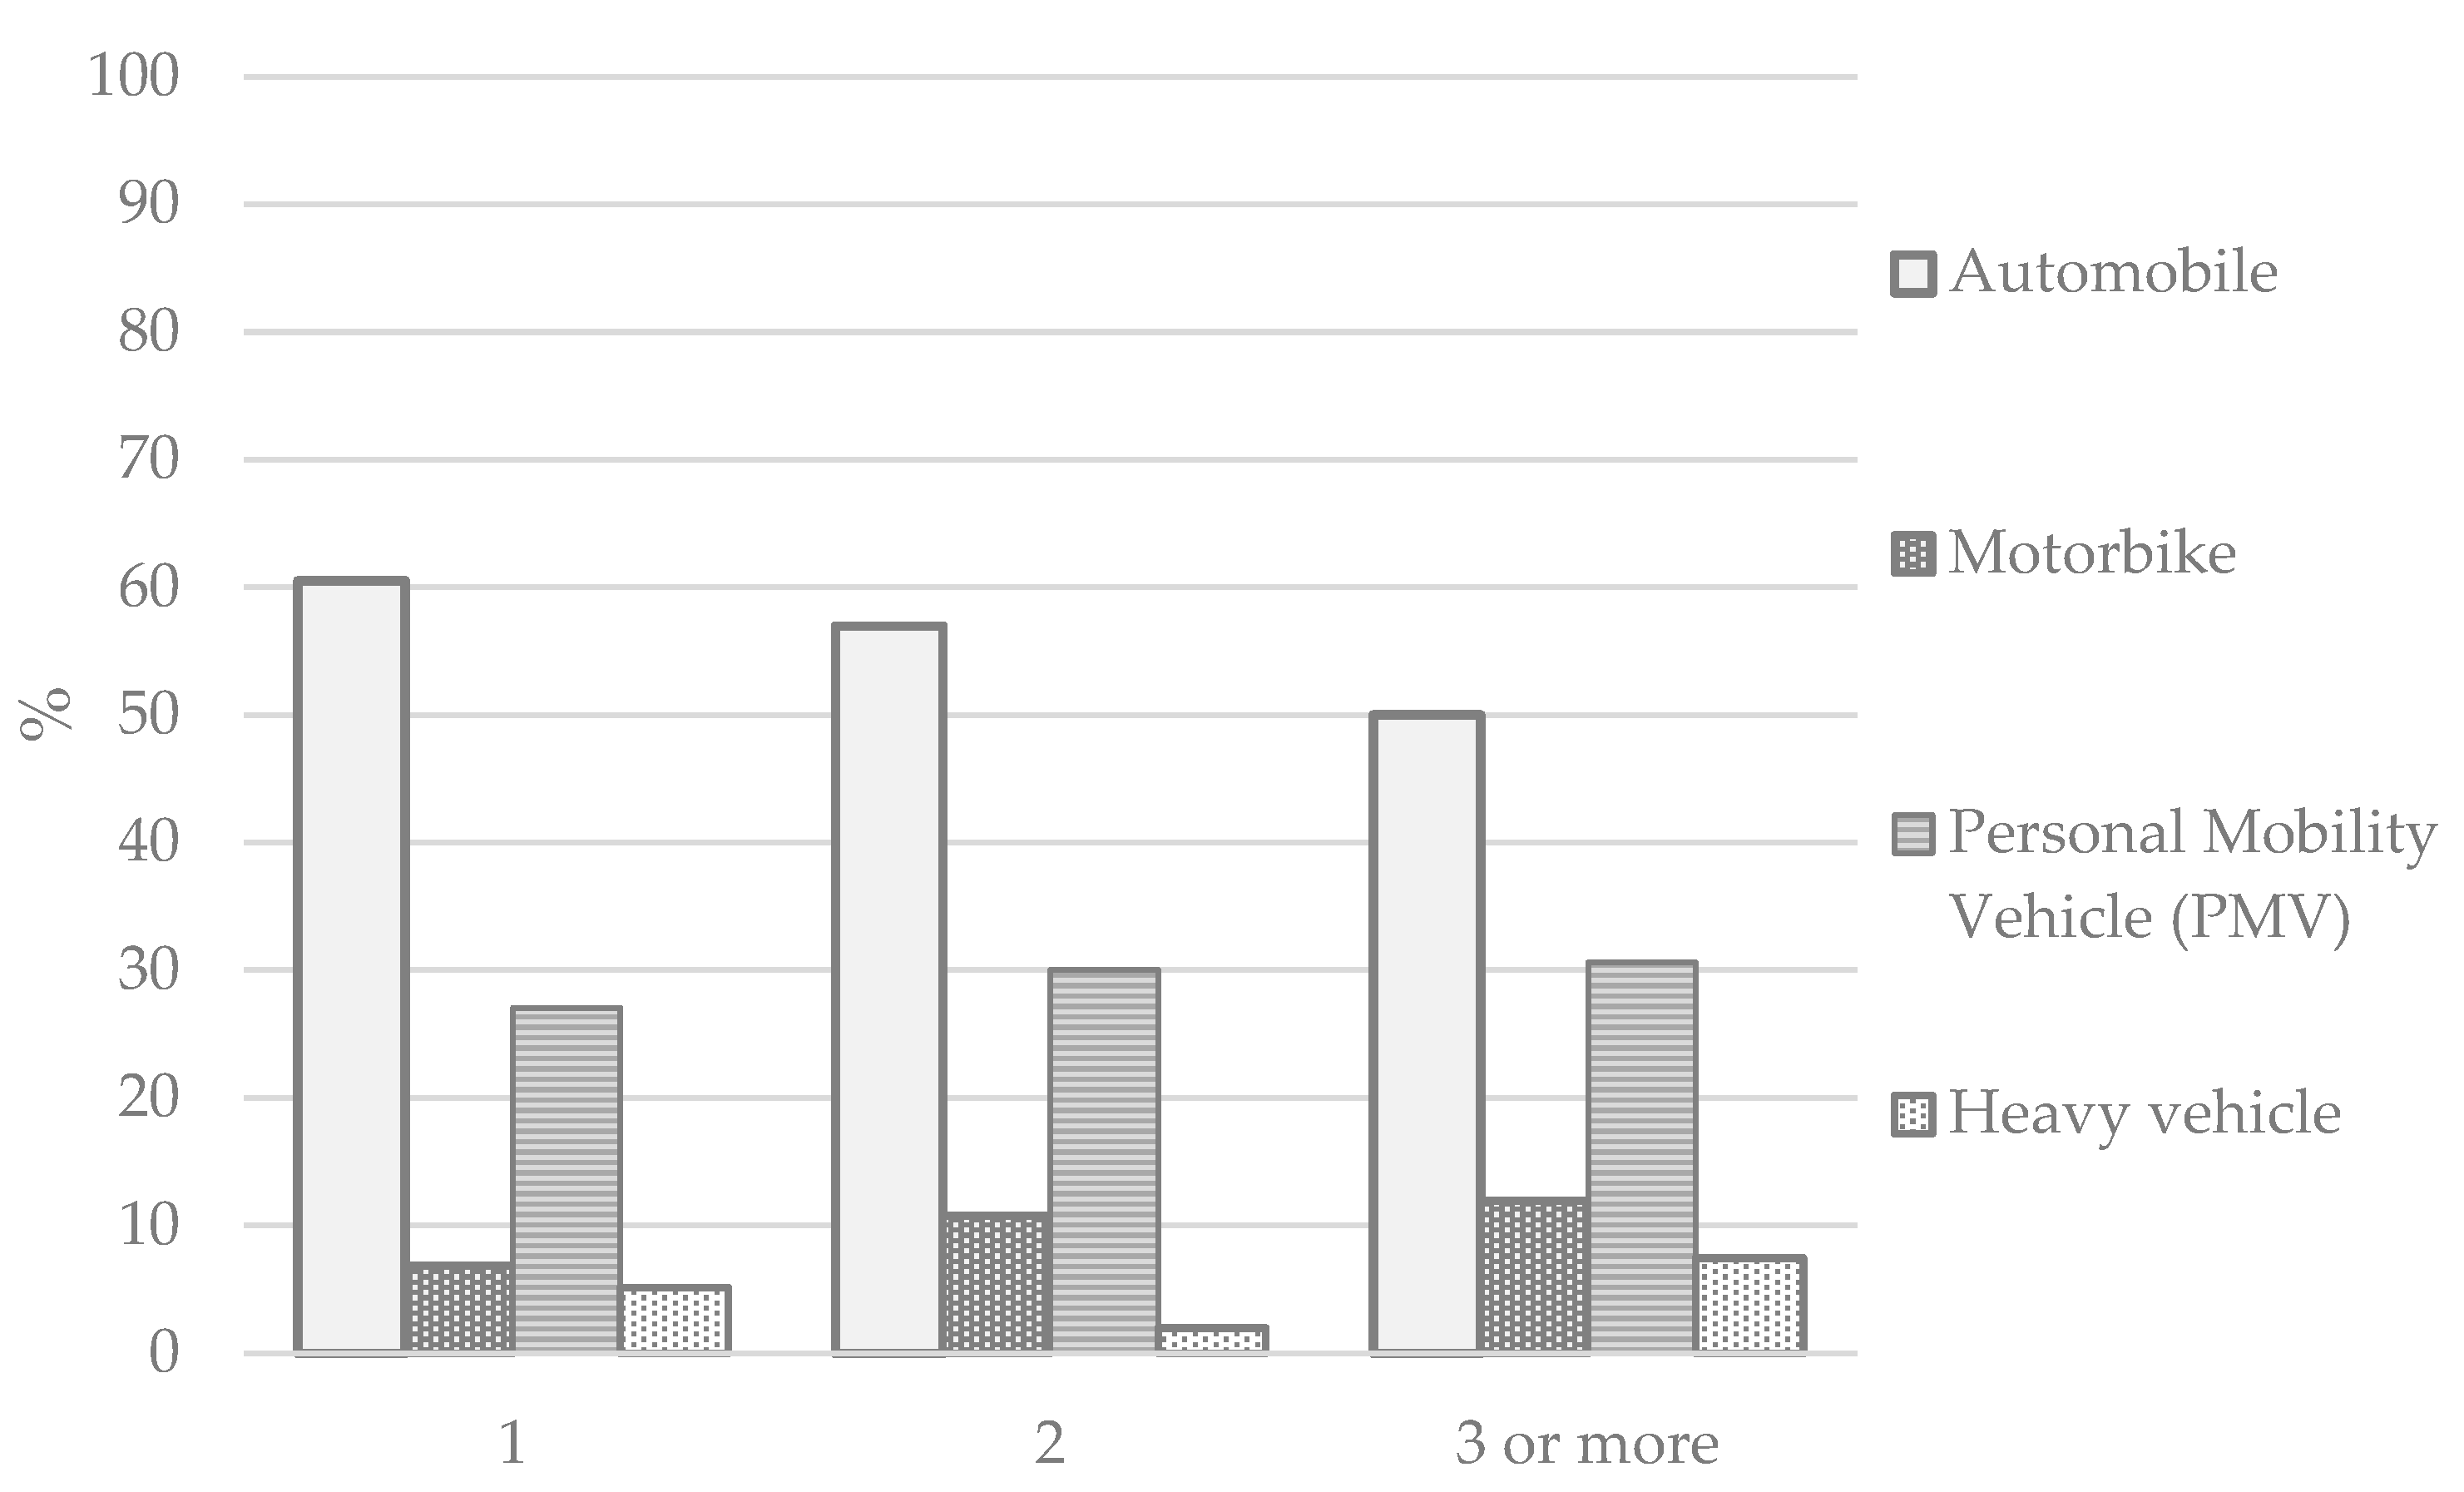
Figure 3 shows the proportion of responses considering the typology of the different vehicles and the number per household analysed.
Consequently, it is clear from the results of this last question that the car is the vehicle with the highest representation in each household among those surveyed, with over 50% in households with 1, 2 and 3 or more vehicles. Behind the car, personal mobility vehicles (PMVs) have a greater presence (with values of around 25%), followed by motorbikes and motorbikes.

3.2. Characterisation of Usual Commuting

It is considered essential to gather all the relevant information in terms of daily commuting, given that the city of Cáceres is a real pole of attraction and development for its immediate surroundings. In this way, the aim is to understand how the implementation of a LEZ would affect the citizens of Cáceres, but also the inhabitants of the districts and municipalities which interact with the provincial capital daily. To this end, questions relating to the user’s reasons for travelling and their frequency, the main means of transport used and certain subjective considerations which are considered to need to be resolved in relation to mobility and accessibility in the city are developed. In Table 2, we attempt to provide an origin-destination matrix of the journeys made by the people surveyed, thus deepening our knowledge of the mobility patterns of the citizens of Cáceres and the surrounding municipalities.
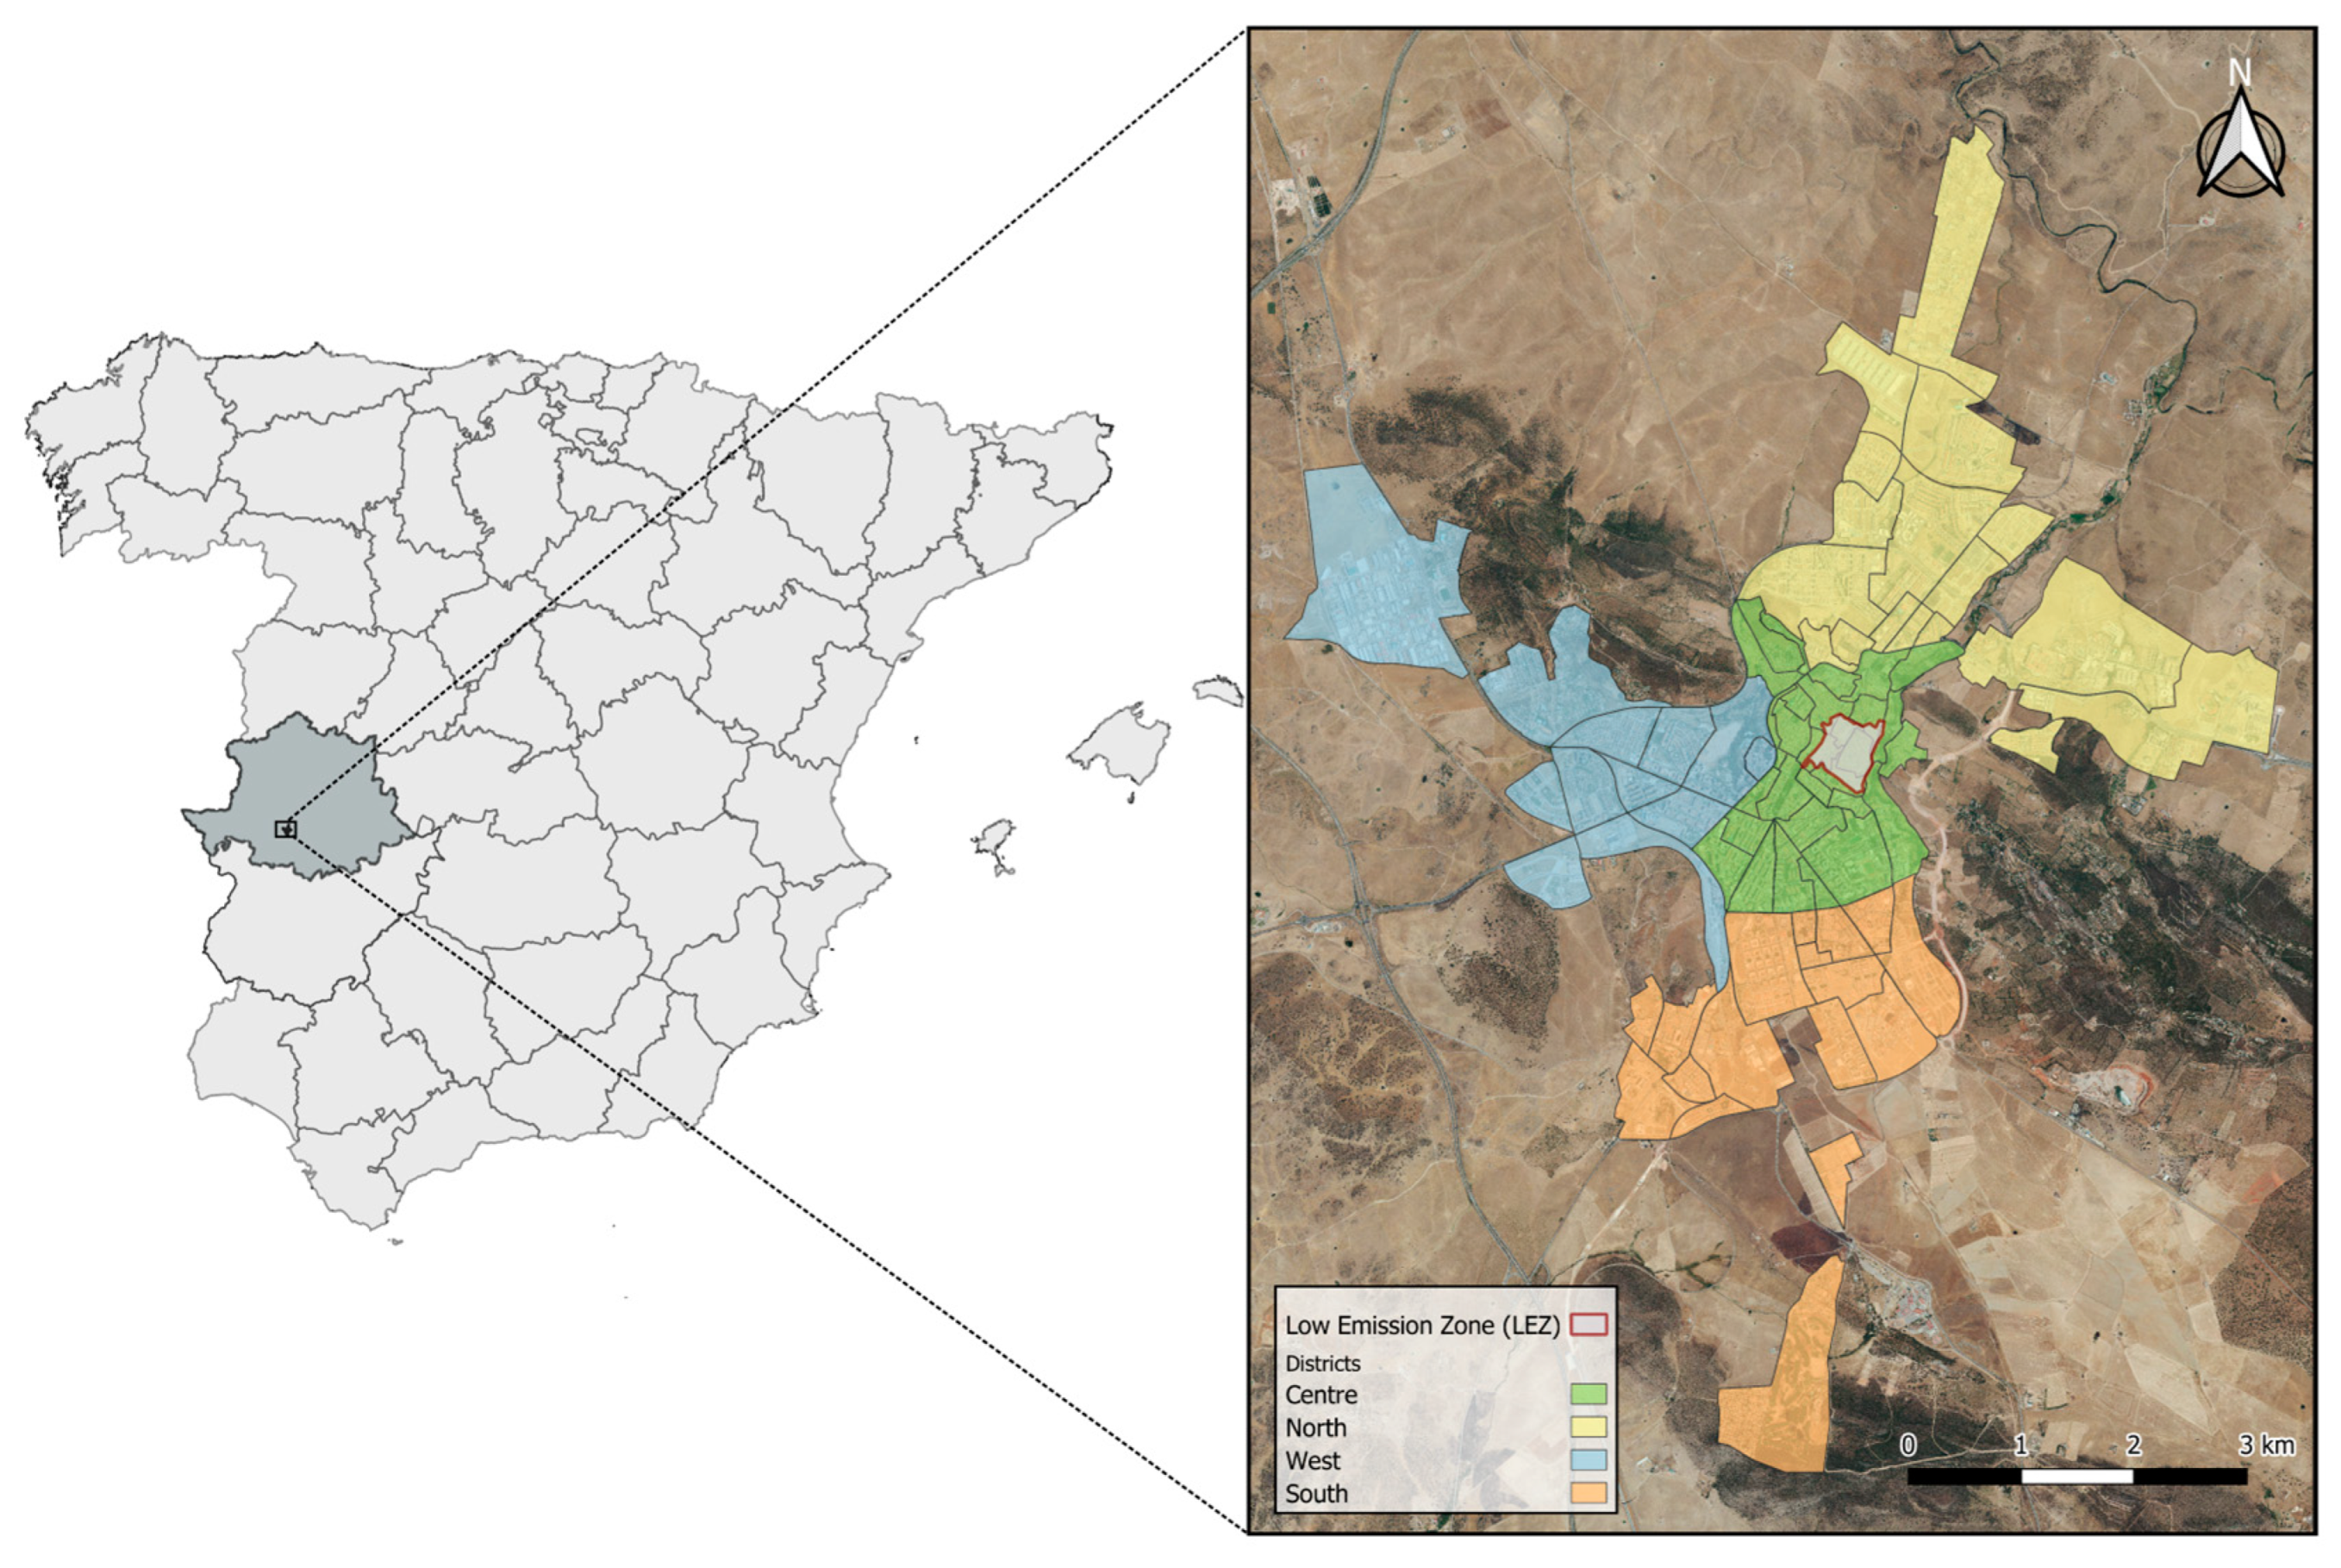
Table 2 shows the pattern of travel behaviour between the different districts of the city of Cáceres and the low-emission zone. In general terms, 42% of the population living in the central, northern, western, and southern districts commute daily to the possible low-emission zone to be implemented in the city of Cáceres, and these citizens are considered to be the most directly affected by this delimitation. In particular, the districts with the greatest mobility towards the LEZ are the west (13.1%) and south (15.4%), with journeys from neighbouring municipalities (16.2%) and those within the LEZ itself (27.3%) also standing out. Broadly speaking, it can be seen that journeys from the different districts of Cáceres tend to be made mainly to the central and northern districts (with values of over 30%), with a similar trend in the municipalities adjoining the city of Cáceres. Focusing on the district level, it can be observed that from the central district they usually move to a greater extent to the northern district (45.4%), and the same happens the other way round (36.9%). The frequent movements of citizens from the western district are distributed between the central district with 24.6% and the northern district with 38.5%. As far as the southern district is concerned, the distribution of daily commuting according to the respondents is equally distributed between the central and northern district with 38.5%.
On the other hand, in order to be able to analyse in depth the mobility pattern of the population of Cáceres, it is crucial to specify the reasons for the trips, the means of transport used, and the frequency according to the reason for the trip. Table 3 shows, firstly, the type of means of transport used according to the reason for the trip. It can be seen that a large proportion of the citizens surveyed say that they make their journeys mainly on foot or by car, regardless of the reason for the journey.
Focusing on journeys on foot, more than 50% of those surveyed said that they walk for tourism, health, and leisure purposes. Similarly, more than 40% of users indicated that they walk when they are going to do business, shopping, or for study or work purposes. As for the use of cars, more than 40% of those surveyed use them to carry out tasks related to their own business, shopping or for work, with slightly more than 30% of those users who use private vehicles for study, tourism, health, or leisure purposes. As for the other means of transport, they do not show significant usage values, with motorbike trips (around 4% depending on the reason for the trip) and bus trips (slightly above 3% depending on the reason for the trip) standing out slightly.
With regard to the frequency of journeys, there is greater variability depending on the reason, in contrast to the above according to the type of means of transport used (mainly centred on two of the established types: on foot and by car). Within this apparent variability, occasional trips stand out (with values of around 30% for all the established reasons), followed by trips made two to three times a week (with figures close to 20%) and then trips made more than twice a month, depending on the reason (with results of around 15%).
In order to analyse more precisely the interrelationship between the reasons for travel and the means of transport used, we chose to carry out a cross-analysis of the information, taking into account the gender of the respondent and their age range. Firstly, taking into consideration the means of transport, in the case of the male gender there is a clear preponderance of trips by private vehicle (36%) and on foot (19%), with little representation of other means of transport. Focusing the evaluation by age range, there is an increase in the use of buses and motorbikes in the male population aged 18–25 (mainly university students) and an increase in the use of private vehicles in the 36–50 age range. Regarding the female population, the general trend is similar to the previous one, with a predominance of car trips (55%) and walking (35%). There is also an increase in the use of buses in the female population aged 18–25. Secondly, when examining the reasons for travel, the male population between 18–25 years of age mentioned that they travel mainly for study (26%), between 26–35 for tourism (19%) and study (17%), in the range between 36–50 years of age they mentioned work/business (23%) as the main option, as well as in the category between 51–65 (15%). In the case of the female population, the pattern of the educational ratio is repeated in the 18–25 age group (19%), with no clear trend in the 26–35 age group. However, in the 36–50 age range, work/business reasons are balanced with leisure reasons (15%), with similar values for travel reasons in the 51–65 age range.
Another factor that helps to determine daily mobility is the number of stages a citizen needs to take to make a journey, with each means or form of travel used being established as a stage. 
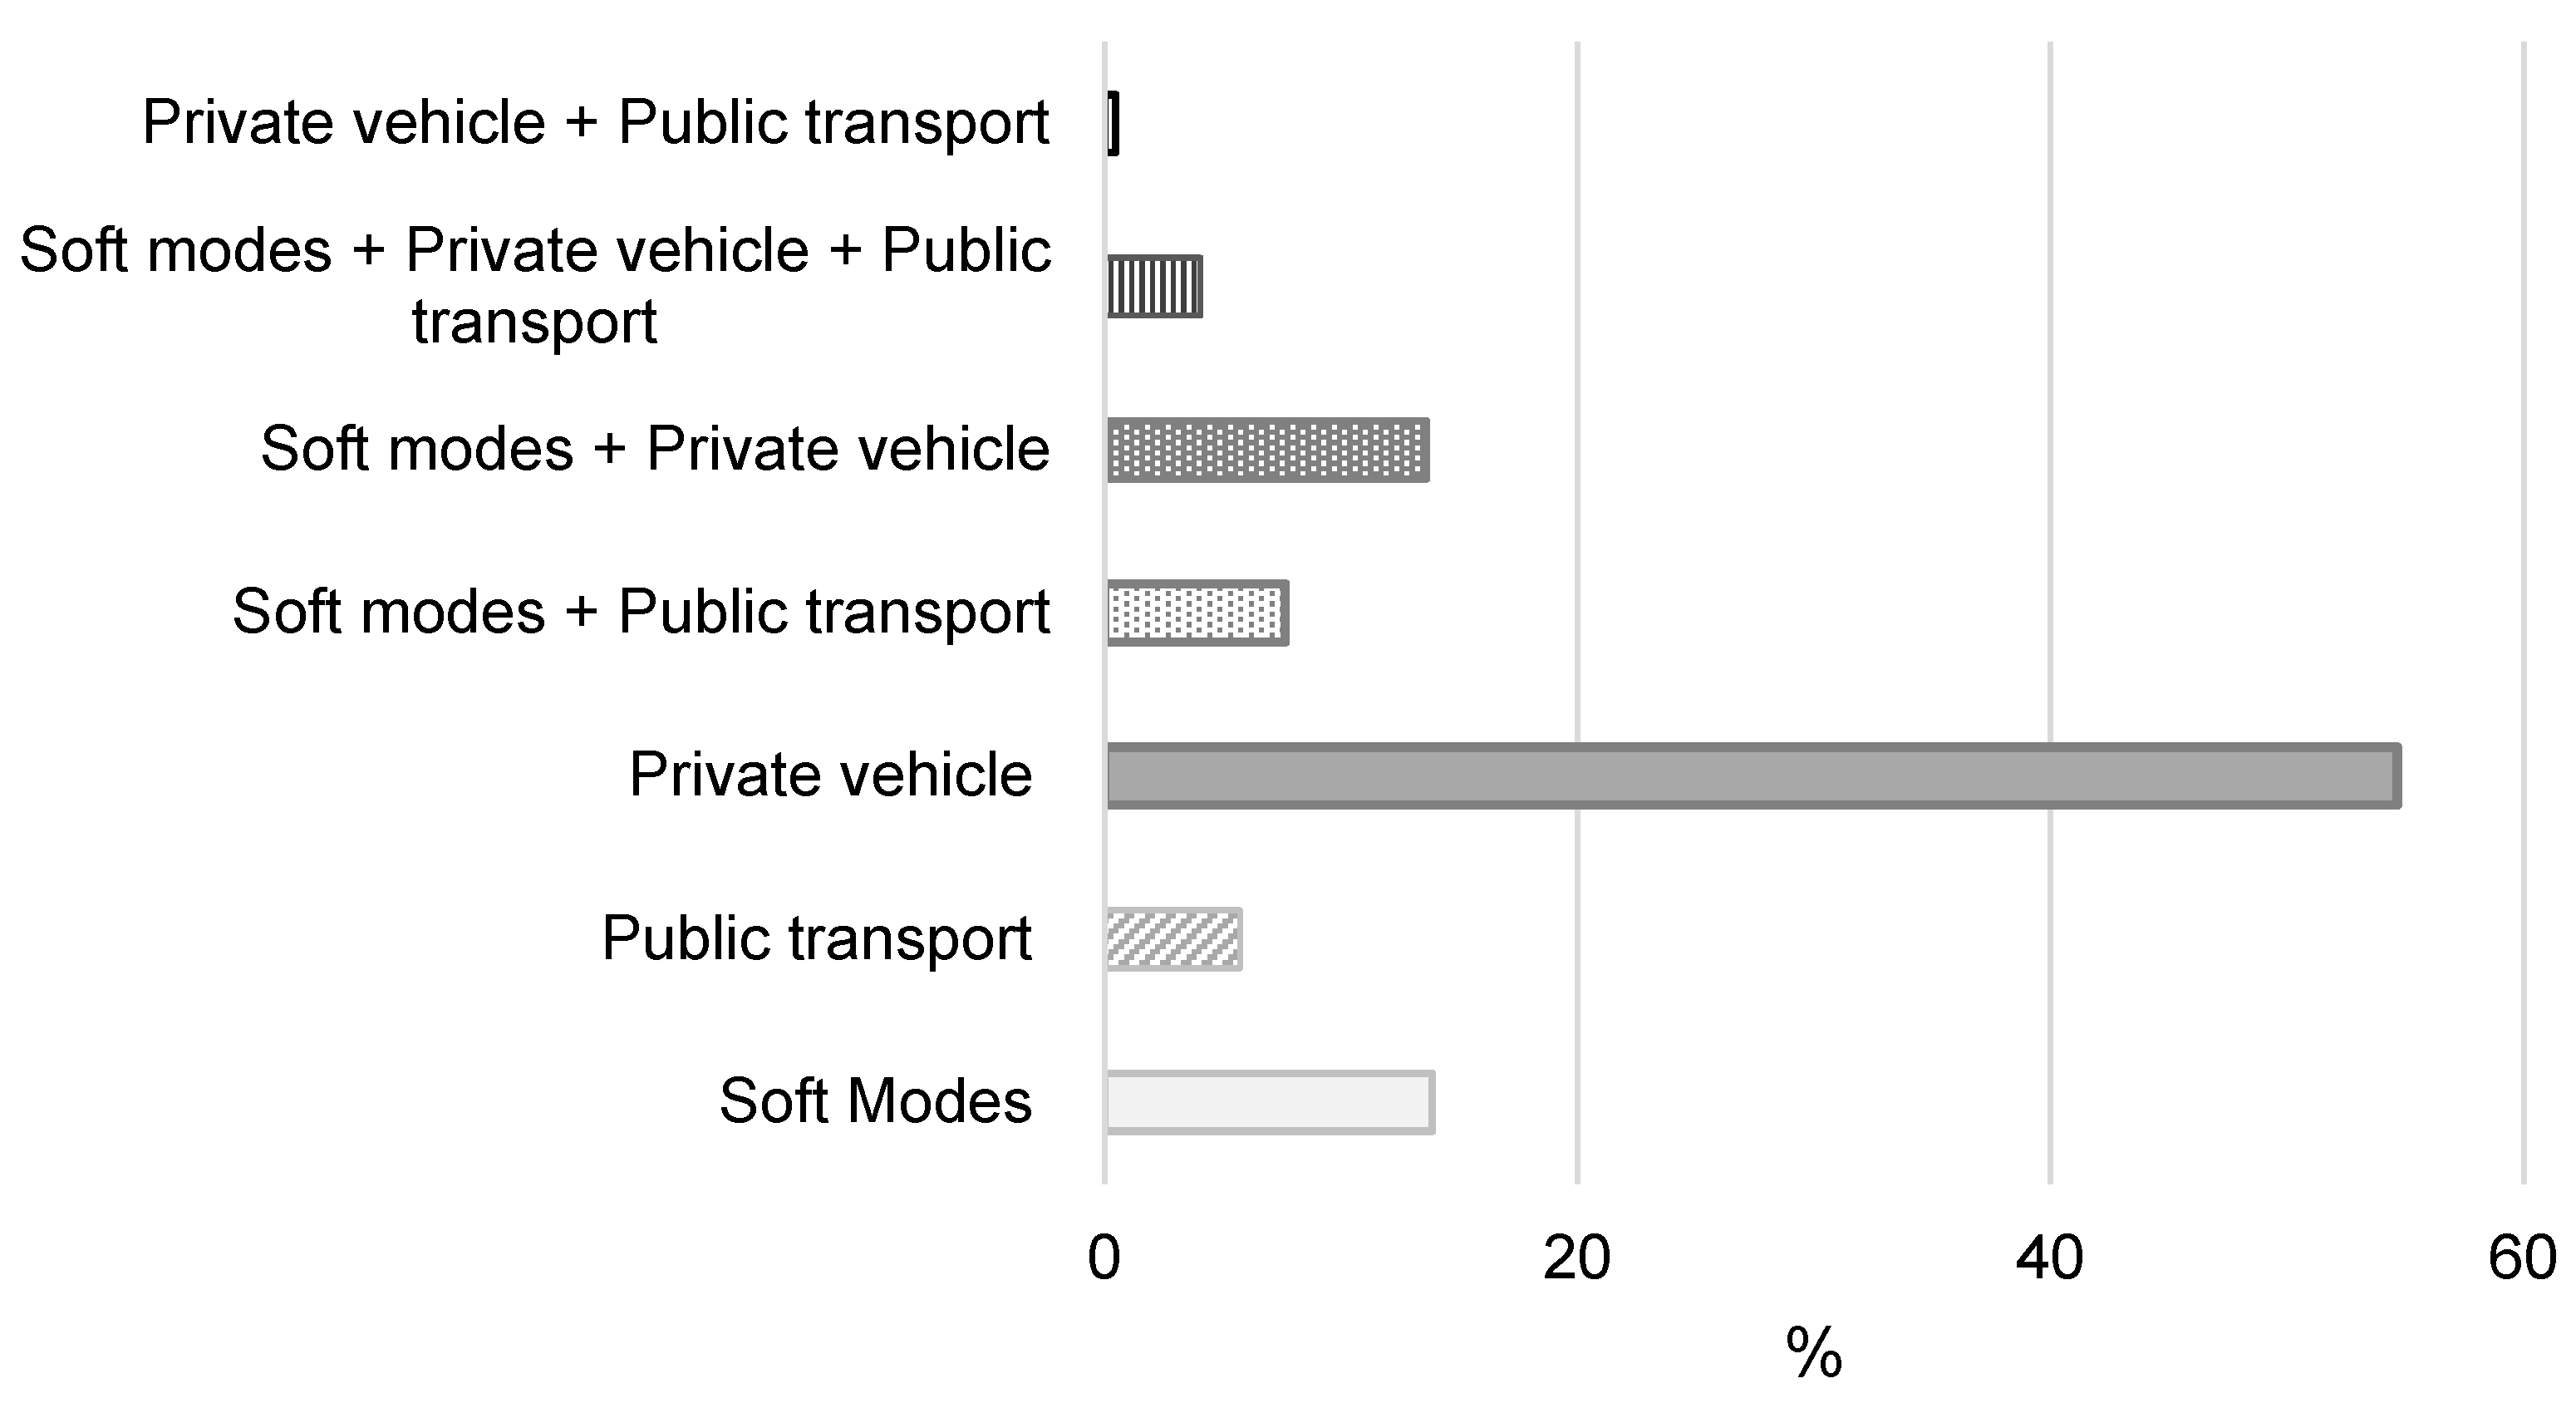
Figure 4 shows the values obtained considering the number of stages and according to the means of transport used, differentiating between soft modes (on foot/bicycle/scooter), public transport (bus/taxi) and private vehicles (car/motorbike) and their different combinations.
Figure 4 shows that more than 50% of journeys are made using the private vehicle, making it the main means of transport among those surveyed. Soft modes are the second most used element of mobility, with values very similar to the combination of soft modes with the private vehicle for trips (values above 13%). Public transport is the least attractive means of transport for citizens (5.7%).
Another of the fundamental aspects of the second part of the questionnaire consisted of evaluating different mobility proposals, as well as collecting the user’s opinion on particular situations existing at street level. In this sense, Table 4 shows the results obtained in the survey, showing the user’s subjective response to the various options, using a five-point Likert scale for their evaluation (value 5 being considered the highest priority for action).
Beginning with the citizen’s assessment of different approaches to sustainable mobility, Table 4 shows that the most popular aspect would be the promotion of measures that would favour economic advantages such as possible reductions in the cost of using public transport on a regular basis. Other actions considered a priority by those surveyed were the creation of cycle lanes and charging points for electric vehicles, together with bicycle rental. Measures such as the rental of electric vehicles by the minute or scooters were given lower scores, and the introduction of free fares in the regulated parking area for electric cars was the least valued.
With regard to the assessment of the situation of the municipality at street level, Table 4 shows that respondents consider the existing traffic and road safety measures adopted, as well as the space for pedestrians and the accessibility of pavements, to be acceptable (rating 3 on the Likert scale). However, the user-friendliness of the PMVs, the existence of school roads, and noise and pollution are rated as acceptable-bad. The lowest-rated factor is on-street parking, with no clear trend when asked about the availability of parking around residences.
In order to complete section B of the survey, citizens were asked about those aspects that they felt could be improved in the city in terms of universal accessibility, with the intention of identifying the possible problems of walking, as well as the point of view related to the overuse of private vehicles and the risks related to public health. Table 5 shows the results of the survey of stated preferences according to the answers provided by citizens.
In relation to the public consultation on what aspects citizens consider should be improved in terms of universal accessibility, it can be seen that the highest priority is given to aspects such as: widening pavements, improving the paving and the appropriate placement of street furniture, accessibility to public transport by relocating stops and improving their functional design, as well as increasing the level of street lighting. Other elements that are also considered as required, although with lower ratings, are: increasing the number of pedestrian streets, reducing traffic, acting on crossings and signposting, improving the layout of on-street parking and universal accessibility to buildings. On the other hand, when asked about their concerns regarding the excessive use of private vehicles, citizens consider that the most relevant aspects to consider are: lack of parking, climate change linked to the increase in greenhouse gases, as well as the increase in noise pollution. To a lesser extent, they are concerned about the risk of illness and traffic congestion.

3.3. Implementation of an LEZ in Cáceres

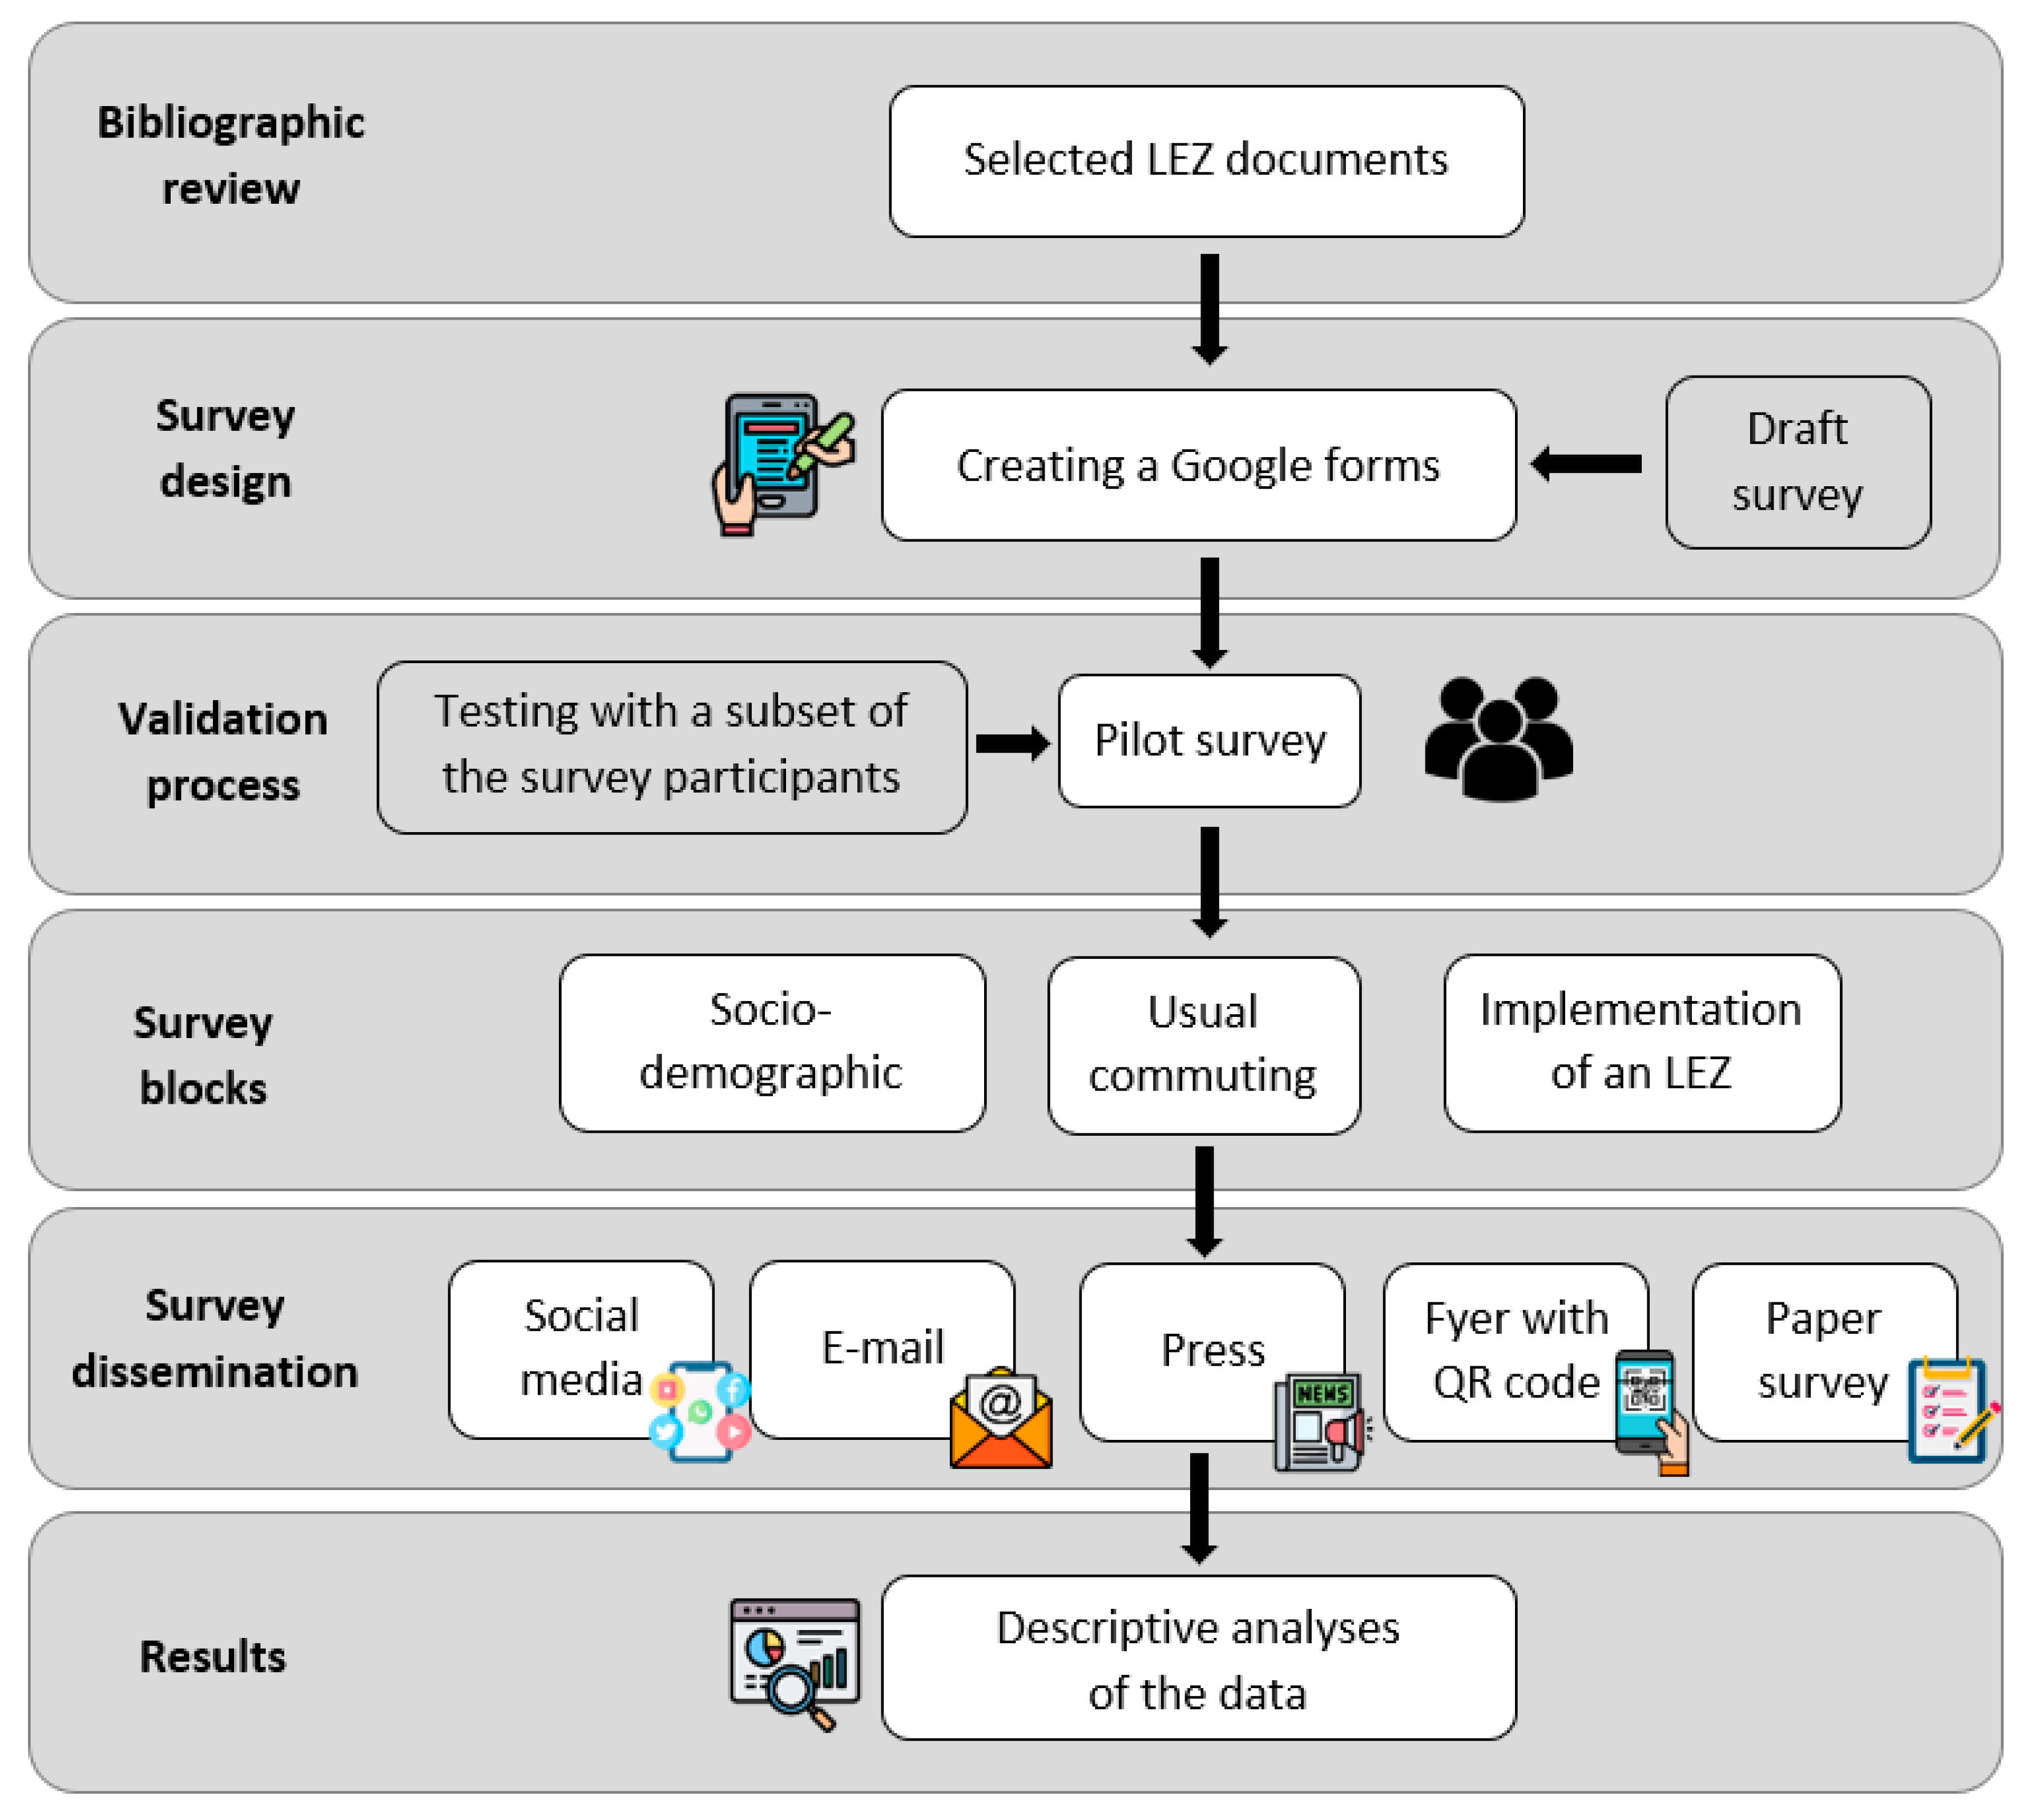
As anticipated in the section on the methodological design of the research, this section is divided into three distinct parts. At the beginning, it focuses on the degree of user knowledge on aspects such as LEZs, climate change, environmental labels, etc. Subsequently, a series of measures for action in the city are proposed to the citizen, with the premise of achieving more sustainable mobility. Finally, a series of alternatives to be evaluated by the user are provided, expressing their stated preferences on the impact that a LEZ could have on the city of Cáceres, both in general and at a particular level. Table 6 shows citizens’ opinions on the consultation on low-emission zones and on the situation of the municipality under analysis.
From the results obtained in Table 6, a high percentage of the population of Cáceres are aware of the concept of the low-emission zone and are aware of the restrictions that have been implemented in the residential priority area established in the centre of Madrid (currently known as Madrid 360), as well as the environmental badges required for cars to be able to circulate within the designated perimeter. A lower percentage, although still considerable, said that they were informed about issues related to climate change. With regard to citizens’ assessment of municipal infrastructures, it can be seen that those surveyed consider that there is sufficient space for walking, although this is not the case for cycling. In general, they gave a balanced score to infrastructures for public passenger transport services, with no clear tendency towards a modal shift if both bicycle lanes and pedestrian routes were improved.
When asked about alternative measures to tackle pollution, noise, and traffic congestion, it is clear that the most unpopular action would be the introduction of urban tolls. On the other hand, citizens are receptive to improvements in universal accessibility, subsidies for public transport, increased road safety in infrastructure for MPVs, subsidies for the purchase of environmentally friendly vehicles and MPVs, and the promotion of pedestrianisation. Other measures envisaged, such as the implementation of LEZs and 30 zones, received inconclusive evaluations.
In order to assess the social perception and personal criteria of each citizen, we decided to ask, in the case of the implementation of an LEZ in the municipality under study, what effect it would have, both on the city and on the daily life of the respondent. Table 7 shows the answers given by the population to this question.
In the first case, citizens clearly define the aspects which, in their opinion, will affect their daily journeys and cause them to change their approach to daily mobility. Respondents consider that they will walk more and improve their individual quality of life, and do not feel that their freedom of movement will be reduced. Citizens expect to use fewer private vehicles, although they do not a priori consider switching to a less polluting type of vehicle or making greater use of MPVs or public transport.
In the second case, when respondents were asked about the effect that the LEZ would have on the municipality in general, it was observed that in all cases they were mainly in favour of the considerations that it would improve the health of citizens and their quality of life, and that it would reduce both traffic and noise, promoting a cleaner and healthier city.
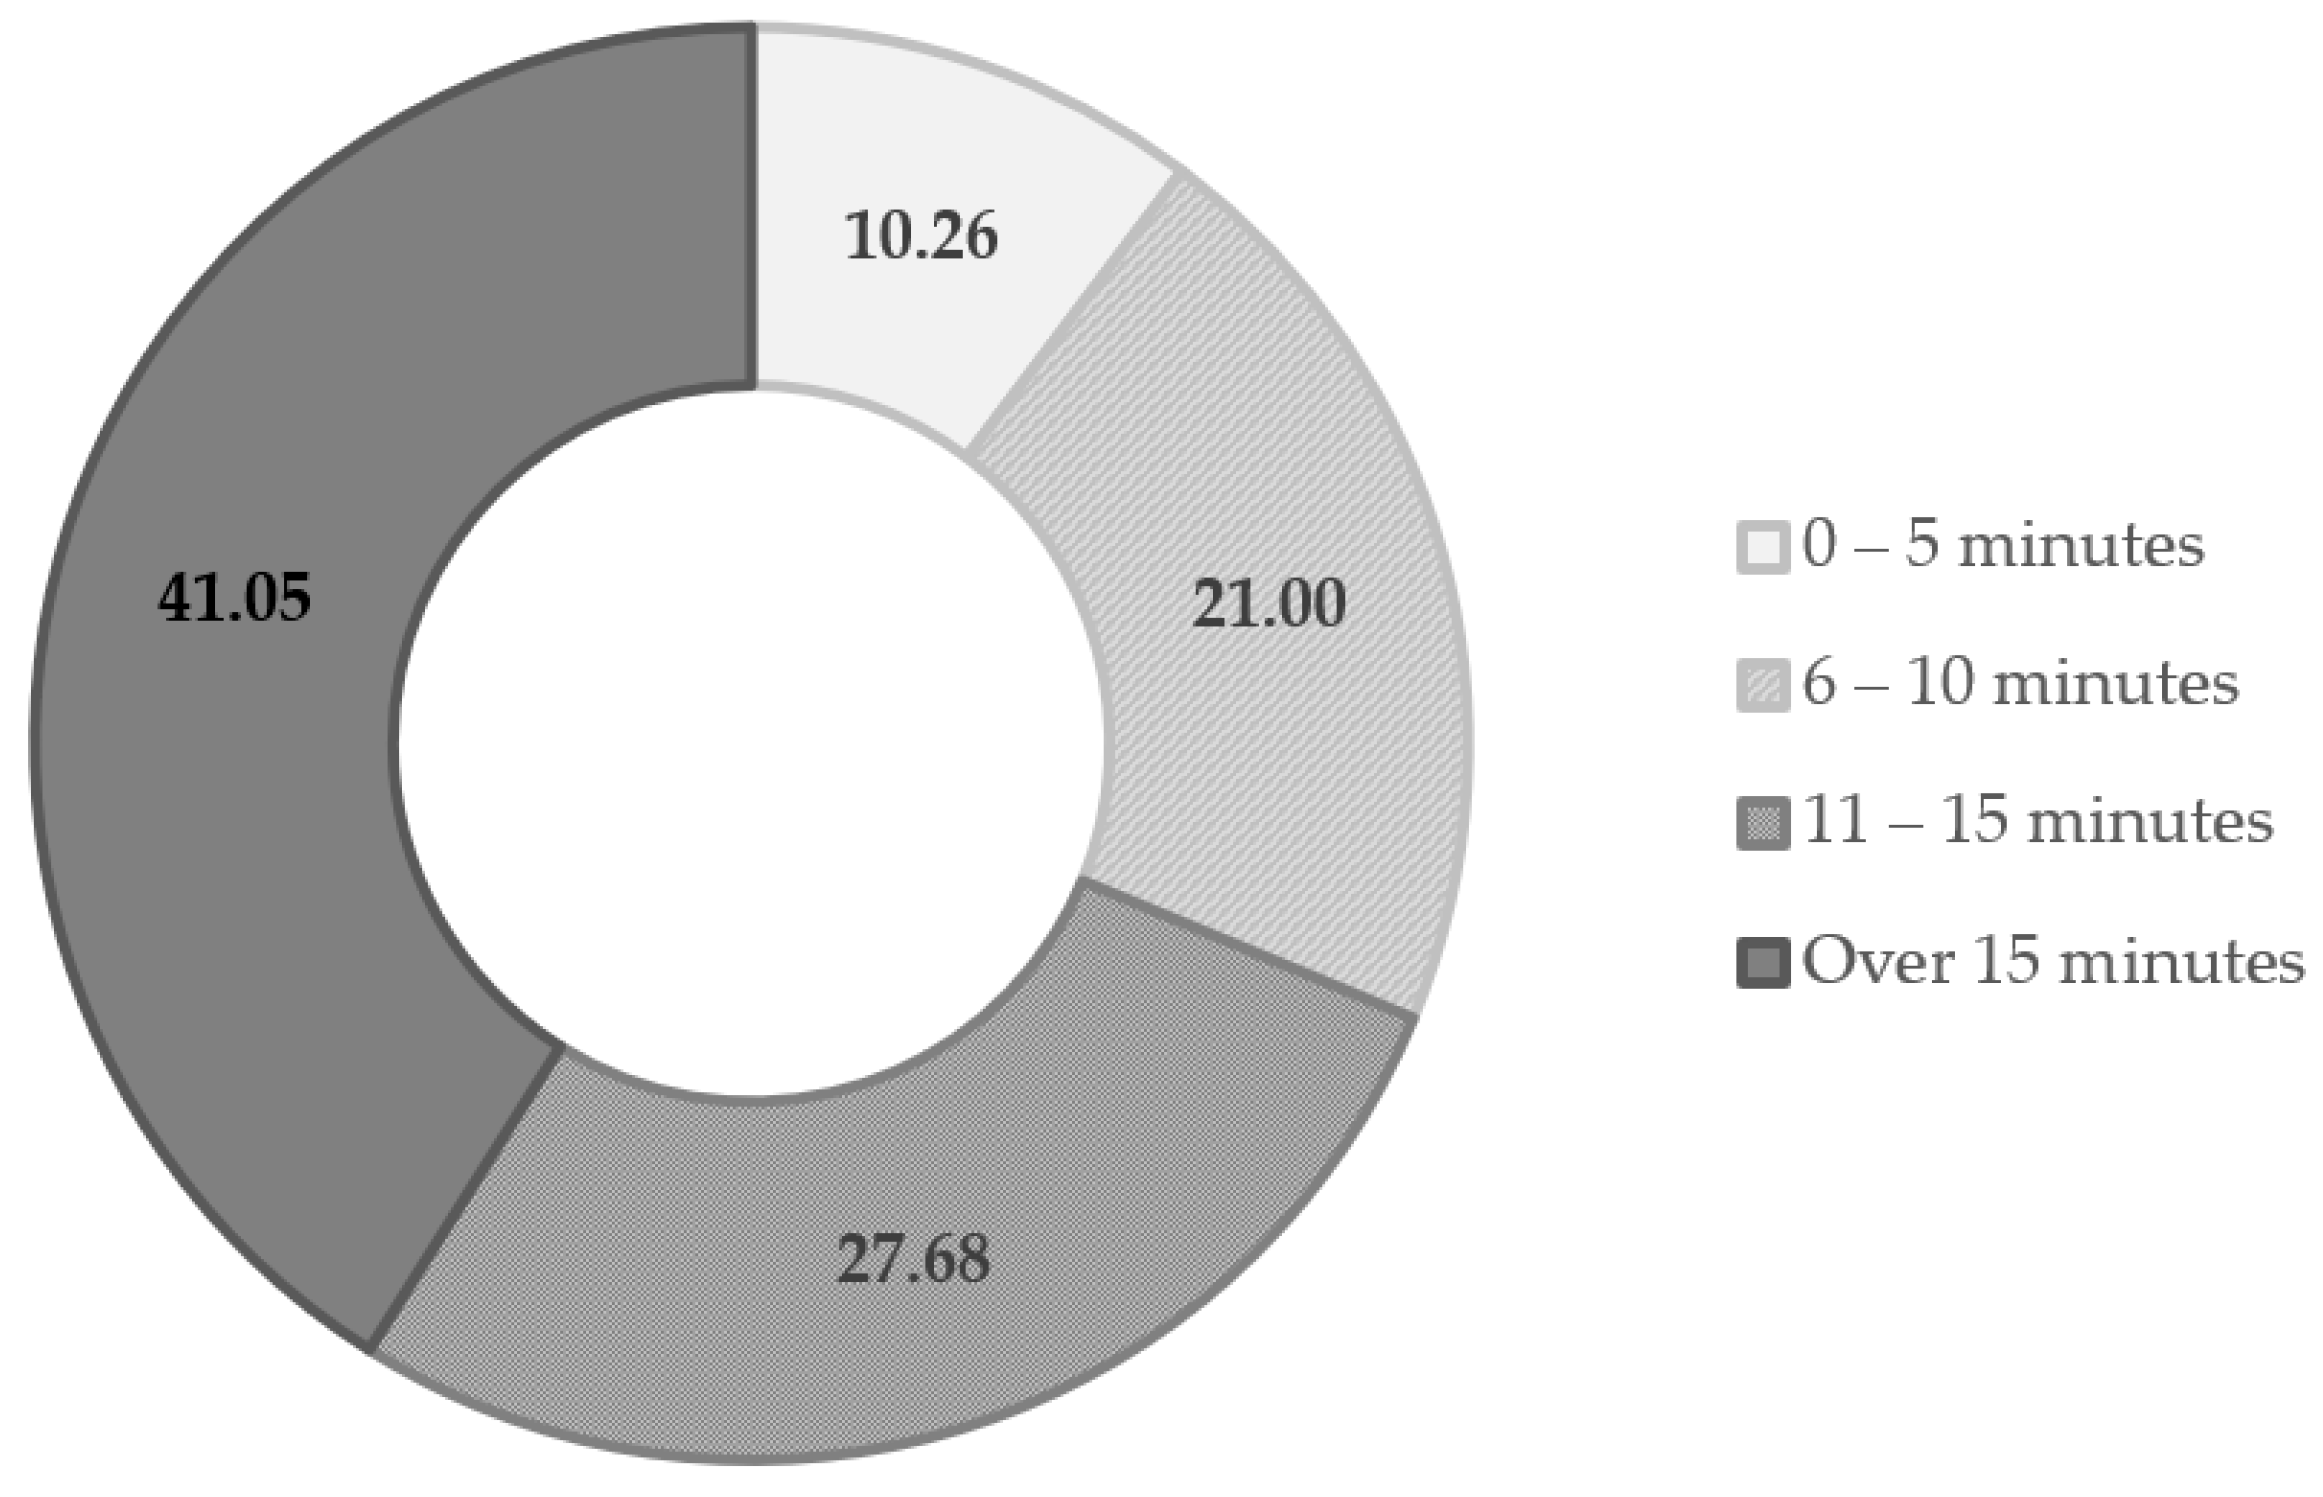
Finally, citizens were asked how long they would be willing to walk to their destination if they were provided with both convenient and affordable parking and a safe pedestrian priority zone. The results are shown in Figure 5.
Figure 5 shows that more than 68% of the population would agree to walk more than ten minutes to their destination, and that for 31% it would be feasible to walk from 0 to 10 min. Therefore, it can be deduced that the creation of infrastructures such as peripheral car parks in combination with semi-pedestrianisation or pedestrianisation (following the model of the city of Pontevedra) could be a response to the modal shift that would allow for greater walking distances.

3.4. Analysis of Respondents’ Perceptions

In order to evaluate in greater depth how the implementation of an LEZ would affect the daily life of the inhabitants of the city of Cáceres on a personal level, it was decided to carry out a cross-analysis of the information, taking into account the gender of the respondent and their age range.
Focusing on the first group of questions shown in Table 6 (concerning the state of the municipality), both male and female respondents, regardless of their age, consider that the city under study has enough space for walking, but on the other hand, it is not an accessible and attractive public space from the point of view of cycling. On the other hand, all the women surveyed and the 36–50 age group of men consider that the public transport infrastructure does not meet their expectations, in contrast to the opinion of the rest of the male sector, which refers to the existence of adequate urban transport facilities. When asked whether they would change the way they travel if improvements were made to cycling infrastructure, the male sector was indifferent, while the female sector dismissed the proposal, with the exception of women between 36 and 50 years of age, where there was a slight hint of a modal shift. With regard to the issue of promoting and improving pedestrian routes, the male sector as a whole (with the exception of the 18–25 age group), as well as women aged 26–50 (apart from those aged 51–65) are inclined towards a modal shift towards this soft mode. Women between 18–25 and 66–75 are indifferent to the proposal.
Considering the second group of questions represented in Table 6 (alternative measures to tackle pollution, noise and traffic jams), regardless of the gender of the respondent and their age range, the inhabitants are in favour of the implementation of a low-emission zone that includes the construction of new pedestrian zones, the establishment of subsidies for public transport and the purchase of PMVs and cars with Eco- or Zero-emission labels, the creation of safer infrastructure for PMVs, as well as facilitating municipal universal accessibility. On the other hand, they are totally opposed to the introduction of urban tolls. At the same time, with regard to the implementation and signposting of new 30 zones, all men and women between 18–35 years of age do not consider this to be a good measure, but women over 36 years of age consider it to be a really favourable measure.
In relation to the questions listed in Table 7 and specifically when respondents are asked how they consider that the implementation of the LEZ would affect them personally in their day-to-day life, regarding the question on whether they consider that their quality of life would improve, the male population between 18–25 years of age is mainly indifferent to the question, while from this age range onwards, the respondents consider that they agree with the question as a whole. In relation to the female sector, as in the previous case, the population between 18–25 is indifferent, in the range between 26–35 no clear criterion is defined, but above that age a positive evaluation is maintained in relation to the question asked. As far as the reduction of freedom of mobility is concerned, the male population aged 18–25 seems to be clear that the implementation of the LEZ would be a limitation, but there is no clear trend in the rest of the age brackets. On the other hand, the female population between 18–25 and 36–50 years of age is indifferent to this question, and those between 26–35 and 51–65 consider that their freedom of movement will not be reduced. With regard to the use of cars/motorbikes for everyday journeys, men aged 18–25 and 36–50 are of the opinion that they will not dispense with their use, while those aged 26–35 remain indifferent, while men aged 51–65 are clearly in favour of using these means of transport to a lesser extent. Women are generally indifferent between the ages of 18–35 and are less inclined to use the car/motorbike over the age of 36. As far as the use of public transport is concerned, in general, the male population does not consider that they will make more use of public transport after the implementation of the LEZ, with the exception of the 26–35 age group, which does not show a clear trend in their responses. On the other hand, the female sector is strongly in favour of a modal shift towards the bus. With regard to personal mobility vehicles (bicycles and electric scooters), the male population does not show particular acceptance and considers that they will no longer use these means of transport with the implementation of the LEZ, with the exception of the 26–35 age group. Likewise, the female sector as a whole does not consider using PMVs more frequently. In the case of walking, both the male and female respondents are in favour of walking more when the LEZ measures are implemented. On the other hand, when respondents are asked their opinion on how the implementation of the LEZ would affect their city (in general), there is a clear trend among both men and women. Regardless of gender and age, citizens agree or strongly agree with the effects of the LEZ measures, considering that it would visibly improve the health of citizens, reduce traffic and noise in the city, and have a positive impact on street cleanliness. However, when asked about the overall quality of life in the municipality, men in the 18–25 age group do not have an a priori opinion and are indifferent to the measure.

4. Discussion

The implementation of low-emission zones (LEZs) in many municipalities will provide a an effective toolto mitigate the negative externalities of urban transport, such as noise and greenhouse gas emissions. Several authors have focused on understanding the effects of LEZs on air quality [52,53], neglecting the economic and social effects. On the other hand, worldwide know-how advises that the implementation of an LEZ should be subject to an ex ante evaluation considering social acceptance, in order to foresee and solve the obstacles that would generate the adoption of the new measures. Considering that the effectiveness of an LEZ is intimately linked to the degree of social acceptance and the impact on citizens’ behaviour and intentions, quantifying preferences and social views prior to the establishment of the measure would serve to assess the relationship between the adoption of behavioural patterns by residents and car users and the level of restrictions [54]. Individual citizens’ interests may clash head-on with the acceptance of certain sustainable transport policies, in particular when residents are asked to make a significant effort to adapt their lifestyle and mobility habits, which may affect their comfort or generate economic costs [55]. In this research, as a complement to the stated preference survey, a SWOT analysis (Strengths, Weaknesses, Opportunities, Threats) was developed to understand the stability of the approach to the implementation of a low-emission zone in the city of Cáceres, and to identify the relationship between this sustainable mobility policy measure and the challenges posed by climate change. A SWOT analysis is used in the preliminary phase of strategic decision-making and consists of an assessment of strengths and weaknesses (internal) and opportunities and threats (external). Considering the process of urban management and planning, it is observed that the internal strengths and weaknesses (endogenous factors) are mainly the role of the municipal administration, while the opportunities and threats (exogenous factors) are external stimuli beyond the control of the public authorities [56]. The SWOT analytical framework is a tool to reduce citizens’ uncertainty about foreseeable changes since it generates an increase in the level of information. At the same time, it enables the generation of urban planning strategies because it can be used as a decision support system. The results are expected to help provide evidence for improving the resilience of the city, anticipating the challenges of climate change, and assisting in the establishment of measures that can form the basis of urban planning strategies based on improved mobility. The integrated information for structuring the SWOT analysis was collected through surveys conducted among the population, together with existing studies and research on the city. Table 8 includes the SWOT analysis for the establishment of an LEZ in the city of Cáceres.
From the internal (endogenous) point of view, Table 8 shows both the weaknesses and strengths of the proposal. On the one hand, certain intrinsic potentialities of the implementation of an LEZ in the city of Cáceres are evident, such as: (1) in terms of health (the reduction of noise and environmental pollution, improvement of quality of life and preservation of public health and social well-being); (2) from a tourism point of view (protection of the historical-artistic heritage and safe, accessible and sustainable tourism); (3) in the field of infrastructure (reorganisation of parking spaces and creation of parking spaces for car parks and appropriate spatial organisation of complementary actions to the LEZ); and (4) in the field of sustainable urban mobility (promotion of soft modes, public transport and car sharing and intensification of public interest in environmentally friendly vehicles). With regard to the weaknesses of the LEZ, different vulnerabilities can be identified: (1) in the social sphere (lack of public awareness of future measures, social opposition to the creation of the LEZ and overuse of private vehicles for short distances); (2) in terms of public administration (lack of a legislative framework specifying the restrictions, possible discrepancy between different political groups in the approach to measures, lack of clear delimitation of the scope; and (3) in terms of mobility as a global concept (lack of charging stations for electric vehicles, lack of sustainable mobility infrastructure (cycle paths) and/or their connections, complicated urban orography and imbalance in the supply of public transport services in certain areas of the city, together with the age of the vehicle fleet).
With regard to exogenous factors, Table 8 defines the threats and opportunities presented by the implementation of the LEZ in the city. Starting with those that would represent a favourable situation, the following possibilities are listed: (1) in economic terms (revitalisation of the historic centre and the area’s commerce, R&D&I advances in technological control of urban traffic, new options for companies derived from the sale of electric or eco vehicles, bicycles and PMVs); (2) from a social point of view (citizen willingness for the transfer towards soft mobility and growing social awareness due to the negative repercussions of environmental pollution from excessive vehicle traffic); (3) in the field of public administrations (clear political interest in improving road safety and drafting adaptable legislation); and (4) in the field of sustainable urban mobility (improvement of city infrastructures and connections, creation of new pedestrian zones, reorganisation of public transport lines and adjustment of timetables, implementation of a public service for the rental of shared electric vehicles and MPVs). In relation to the risks to which the LEZ is exposed, the main considerations are listed below: (1) in the social sphere (economic obstacle for residents due to the required replacement of cars by eco-vehicles, citizen unease resulting from an immediate entry into force instead of a gradual process of putting the LEZ into operation, lack of approval by the inhabitants due to the absence of a public consultation procedure and user disincentive propensity towards the implementation of the LEZ due to the limitation of their personal freedom, situations that may result in a disregard of the restrictions by the citizen); (2) with regard to the public administration (possibility of legal proceedings against the municipal council for the implementation of the measure); and (3) with regard to mobility as a global concept (competition between users of soft mobility due to the use of road facilities, infrastructure congestion and increased traffic in the areas surrounding and outside the LEZ, increased travel time for the user, as well as the emergence of problems linked to last-mile logistics).
The SWOT analysis developed in the city of Cáceres under the premise of the implementation of an LEZ shows that, although there are barriers and limitations that could hinder the initiative, there are multiple opportunities that open the way to a new future of mobility in the city. Citizen consultation, as has been carried out in this article, is considered fundamental, since detecting social preferences and opinions prior to the establishment of LEZs could help to balance the middle ground between the level of restrictions, the supply of infrastructure and public services and citizen behaviour under different roles on the road. The application of mechanisms such as fiscal incentives to encourage modal shift towards public transport and PMV could perhaps be more fruitful for sustainable urban mobility than the development of restrictive policies unknown to the citizen. Without the necessary social acceptance, the behavioural change required for better air quality and living conditions for city dwellers will not be achieved.
The research carried out in this article can provide urban planners, transport planners and public managers with a better understanding of the motivations of the people who feel affected by LEZs, which would allow redirecting the negative impacts and optimising the social benefits of sustainable urban mobility policies. In parallel, it is considered that the results obtained could feed into participatory planning processes, in which different citizen profiles can be selected and involved in terms of the acceptability of LEZs [57]. Moreover, the results achieved could become an interesting platform for policymakers to identify key variables to better interpret modal choice and its effect after the implementation of an LEZ. It should be considered that some research clearly underlines the initial rejection by private car drivers of policies that restrict car access to certain areas [23], which is a controversial aspect for coherent urban mobility planning. Other authors indicate that personal reasons seem to be more important for modal choice than ideology or awareness [58].
In many cases, motorists are receptive to the immediate individual benefits of the private car for their journeys (cost, time, comfort, etc.), as the following research has shown [59,60]. However, changes in mobility behaviour towards less-polluting modes of transport are crucial to improve air quality. This research is a useful contribution to knowledge in the context of LEZs, as it aims to identify people’s travel patterns prior to the implementation of the measure [61,62]. In this sense, the authors consider it very useful to establish an ex post questionnaire after the implementation of the measure, to find out what changes have occurred in the mobility behaviour of the inhabitants after the implementation of the LEZ and to assess whether the actions of the citizens are really consistent with the answers given in the ex ante evaluation.

5. Conclusions

The aim of this research is to analyse citizen perception of the imminent implementation of a LEZ in a medium-sized Spanish city, using as a working methodology the development of declared preference surveys. In the planning and management processes of municipal public administrations, it is considered essential to ascertain the citizen’s point of view and the possible degree of acceptance of certain measures to be considered which may have an undeniably unpopular dimension. This paper aims to shed some light on the knowledge gap that exists in the ex ante evaluation of urban air quality measures in coordination with the use of public participation processes. The methodology employed consisted of a citizen survey campaign, with the intention of identifying the main variables influencing modal choice at the individual level of travel. The structure of the questionnaire was divided into three blocks: (A) Socio-demographic data, (B) Characterisation of the usual mode of transport and (C) Implementation of an LEZ in Cáceres. The results obtained initially show the presence of a digital divide among the population over 65 years of age, as well as an upward trend of mixed workers (face-to-face + telematic). On the other hand, with regard to the mobility of the study area, it can be seen that the LEZ is a destination widely selected by citizens of neighbouring municipalities, as well as residents of the western and southern districts. According to the type of means of transport used together with the reason for the journey, it can be seen that a large proportion of the citizens surveyed make their journeys mainly on foot or by car, regardless of the reason for the journey. About the frequency of journeys, the results show greater variability depending on the reason, with occasional journeys standing out, followed by journeys made two to three times a week and then journeys made more than twice a month depending on the reason. In terms of citizens’ assessment of various sustainable mobility alternatives, the most popular questions were possible reductions in the cost of public transport, the creation of cycle lanes and charging points for electric vehicles, and bicycle rental.
Regarding the questions related to the implementation of an LEZ in the city of Cáceres, it appears that a high percentage of the population of Cáceres is aware of the implications of the concept and knows about the existence of environmental labels. A lower percentage said that they were aware of issues related to climate change. With regard to the public’s assessment of municipal infrastructures, it can be seen that those surveyed consider that there is sufficient space for walking. When asked about alternative measures to tackle pollution, noise and traffic jams, citizens consider that the most unpopular action would be the introduction of urban tolls. On the other hand, citizens are receptive to improvements in universal accessibility, subsidies for public transport, increased road safety in infrastructure for MPVs, subsidies for the purchase of environmentally friendly vehicles and MPVs, and the promotion of pedestrianisation.
These results are in line with the SWOT analysis carried out, where fragile endogenous aspects emerge, such as the population’s lack of awareness of future measures, a problem that could be solved with information campaigns developed by public administrations and aimed at the population, providing the benefits of the LEZ. Although the implementation of the LEZ presents clear opportunities for the city in terms of sustainable mobility, air quality and territorial organisation (making it possible to recover public space for citizens), there are undoubted threats such as the lack of acceptance of the measure, which could lead to a negative predisposition on the part of users, resulting in non-compliance with the restrictions. However, respondents have stated that, with the implementation of the LEZ, they consider that they will walk more, and their individual quality of life will improve, and they do not feel that their freedom of movement will be reduced. Nevertheless, work should be done on solutions within the framework of sustainability standards that contribute to improving the acceptability of the measure and the quality of life of citizens in general.
In order to mitigate the limitations present in the article and improve the effectiveness of the analysis developed, the authors plan to employ the following lines of future research: (1) the implementation of stakeholder participation (policymakers, researchers, urban planners, environmental consultants, municipal technicians, transport planners and professional associations), through the design of a collaborative evaluation framework comprising semi-structured interviews and an open dialogue space, (2) the establishment of an ex-post questionnaire after the implementation of the LEZ, in order to identify changes in users’ mobility behaviour patterns and to assess whether citizens’ behaviour is actually consistent with the responses expressed in the ex ante evaluation and (3) the use of computer tools for the statistical treatment of the information provided by the study results (in terms of quantitative data evaluation).

Author Contributions

M.J.-E. conceived and designed the research. F.M.M.G. performed the calculations. M.J.-E., F.M.M.G. and R.G.-E. wrote and revised the paper. M.J.-E., F.M.M.G. and R.G.-E. made formal analysis. M.J.-E., F.M.M.G. and R.G.-E. supervised the paper. All authors have read and agreed to the published version of the manuscript.

Funding

This publication has been made possible thanks to funding granted by the Consejería de Economía, Ciencia y Agenda Digital de la Junta de Extremadura, and by the European Regional Development Fund of the European Union through the contribution to the COMPHAS research group under reference GR21159.

Institutional Review Board Statement

Not applicable.

Informed Consent Statement

Not applicable.

Acknowledgments

We would like to formally express our gratitude to the company AHILAR Ingeniería (especially Francisco Borrella and Raúl Galán), for their participation in the Innovation and Talent 2021 Programme of the Regional Government of Extremadura, within the project “Implementation of a low-emission zone in the city of Cáceres”, in collaboration with the University of Extremadura. We would also like to thank the students of the Polytechnic School who have been involved in the on-line distribution and development of the street surveys (Ana Maldonado, Irene Arroba, José Mª Márquez and María Cabrera), the students of the Degree in Civil Engineering in Urban Transport (Milagros Muñoz and Rubén García) who have helped to calibrate the length of the questionnaire, as well as all the citizens and public administrations who have kindly collaborated in our research.

Conflicts of Interest

The authors declare no conflict of interest.

References

  1. Kiba-Janiak, M.; Witkowski, J. Sustainable urban mobility plans: How do they work? Sustainability 2019, 11, 4605. [Google Scholar] [CrossRef] [Green Version]
  2. Bertolini, L. Planning the Mobile Metropolis: Transport for People, Places and the Planet; Bloomsbury Publishing: London, UK, 2017. [Google Scholar]
  3. Bratzel, S. Conditions of success in sustainable urban transport policyPolicy change in “relatively successful” European cities. Transp. Rev. 2010, 19, 177–190. [Google Scholar] [CrossRef]
  4. Bassolas, A.; Barbosa-Filho, H.; Dickinson, B.; Dotiwalla, X.; Eastham, P.; Gallotti, R.; Ghoshal, G.; Gipson, B.; Hazarie, S.A.; Kautz, H.; et al. Hierarchical organization of urban mobility and its connection with city livability. Nat. Commun. 2019, 10, 4817. [Google Scholar] [CrossRef] [PubMed] [Green Version]
  5. Camagni, R.; Cristina, M.; Rigamonti, P. Urban mobility and urban form: The social and environmental costs of different patterns of urban expansion. Ecol. Econ. 2002, 40, 199–216. [Google Scholar] [CrossRef]
  6. Arsenio, E.; Martens, K.; Di Ciommo, F. Sustainable urban mobility plans: Bridging climate change and equity targets? Res. Transp. Econ. 2016, 55, 30–39. [Google Scholar] [CrossRef]
  7. Jordová, R.; Brůhová-Foltýnová, H. Rise of a new sustainable urban mobility planning paradigm in local governance: Does the sump make a difference? Sustainability 2021, 13, 5950. [Google Scholar] [CrossRef]
  8. Banister, D. The sustainable mobility paradigm. Transp. Policy 2008, 15, 73–80. [Google Scholar] [CrossRef]
  9. Ariza-Álvarez, A.; Soria-Lara, J.A.; Arce-Ruiz, R.M.; López-Lambas, M.E.; Jimenez-Espada, M. Experimenting with scenario-building narratives to integrate land use and transport. Transp. Policy 2021, 101, 57–70. [Google Scholar] [CrossRef]
  10. Gallo, M.; Marinelli, M. Sustainable mobility: A review of possible actions and policies. Sustainability 2020, 12, 7499. [Google Scholar] [CrossRef]
  11. Holden, E.; Gilpin, G.; Banister, D. Sustainable mobility at thirty. Sustainability 2019, 11, 1965. [Google Scholar] [CrossRef]
  12. Klecha, L.; Gianni, F. Designing for sustainable urban mobility behaviour: A systematic review of the literature. Smart Innov. Syst. Technol. 2018, 80, 137–149. [Google Scholar] [CrossRef] [Green Version]
  13. Alonso, A.; Monzón, A.; Cascajo, R. Comparative analysis of passenger transport sustainability in European cities. Ecol. Indic. 2015, 48, 578–592. [Google Scholar] [CrossRef] [Green Version]
  14. Gu, Z.; Liu, Z.; Cheng, Q.; Saberi, M. Congestion pricing practices and public acceptance: A review of evidence. Case Stud. Transp. Policy 2018, 6, 94–101. [Google Scholar] [CrossRef]
  15. European Commission. Action Plan on Urban Mobility; European Commission: Brussels, Belgium, 2009. [Google Scholar]
  16. European Commission. Green Paper—Towards a New Culture for Urban Mobility; European Commission: Brussels, Belgium, 2007. [Google Scholar]
  17. European Commission. Together towards Competitive and Resource-Efficient Urban Mobility; European Commission: Brussels, Belgium, 2013. [Google Scholar]
  18. Mozos-Blanco, M.Á.; Pozo-Menéndez, E.; Arce-Ruiz, R.; Baucells-Aletà, N. The way to sustainable mobility. A comparative analysis of sustainable mobility plans in Spain. Transp. Policy 2018, 72, 45–54. [Google Scholar] [CrossRef]
  19. Lopez-Carreiro, I.; Monzon, A. Evaluating sustainability and innovation of mobility patterns in Spanish cities. Analysis by size and urban typology. Sustain. Cities Soc. 2018, 38, 684–696. [Google Scholar] [CrossRef]
  20. Acero, J.A.; Simon, A.; Padro, A.; Coloma, O.S. Impact of local urban design and traffic restrictions on air quality in a medium-sized town. Environ. Technol. 2012, 33, 2467–2477. [Google Scholar] [CrossRef]
  21. Polichetti, G. Effect of travel restriction on PM10 concentrations in Naples: One year of experience. Atmos. Environ. 2017, 151, 12–16. [Google Scholar] [CrossRef]
  22. Ramos, R.; Cantillo, V.; Arellana, J.; Sarmiento, I. From restricting the use of cars by license plate numbers to congestion charging: Analysis for Medellin, Colombia. Transp. Policy 2017, 60, 119–130. [Google Scholar] [CrossRef]
  23. Szarata, A.; Nosal, K.; Duda-Wiertel, U.; Franek, L. The impact of the car restrictions implemented in the city centre on the public space quality. Transp. Res. Procedia 2017, 27, 752–759. [Google Scholar] [CrossRef]
  24. Aydin, E.; Kürschner Rauck, K. Low-Emission Zones, Modes of Transport and House Prices: Evidence from Berlin’s Commuter Belt. Transportation 2022, 1–49. [Google Scholar] [CrossRef]
  25. Ferreira, F.; Gomes, P.; Tente, H.; Carvalho, A.C.; Pereira, P.; Monjardino, J. Air quality improvements following implementation of Lisbon’s Low Emission Zone. Atmos. Environ. 2015, 122, 373–381. [Google Scholar] [CrossRef]
  26. Holman, C.; Harrison, R.; Querol, X. Review of the efficacy of low emission zones to improve urban air quality in European cities. Atmos. Environ. 2015, 111, 161–169. [Google Scholar] [CrossRef]
  27. Duque, L.; Relvas, H.; Silveira, C.; Ferreira, J.; Monteiro, A.; Gama, C.; Rafael, S.; Freitas, S.; Borrego, C.; Miranda, A.I. Evaluating strategies to reduce urban air pollution. Atmos. Environ. 2016, 127, 196–204. [Google Scholar] [CrossRef]
  28. York Bigazzi, A.; Rouleau, M. Can traffic management strategies improve urban air quality? A review of the evidence. J. Transp. Health 2017, 7, 111–124. [Google Scholar] [CrossRef]
  29. de Groot, J.; Steg, L. Impact of transport pricing on quality of life, acceptability, and intentions to reduce car use: An exploratory study in five European countries. J. Transp. Geogr. 2006, 14, 463–470. [Google Scholar] [CrossRef]
  30. Christiansen, P. Public support of transport policy instruments, perceived transport quality and satisfaction with democracy. What is the relationship? Transp. Res. Part A Policy Pract. 2018, 118, 305–318. [Google Scholar] [CrossRef]
  31. May, A.; Ison, S. Decision-support for sustainable urban transport strategies. Transp. Policy 2008, 15, 325–327. [Google Scholar] [CrossRef]
  32. Soria-Lara, J.A.; Tarriño-Ortiz, J.; Bueno, P.; Ortega, A.; Vassallo, J.M. A collaborative appraisal framework to evaluate transport policies for improving air quality in city centres. Cities 2019, 92, 112–124. [Google Scholar] [CrossRef]
  33. Dias, D.; Tchepel, O.; Antunes, A.P. Integrated modelling approach for the evaluation of low emission zones. J. Environ. Manag. 2016, 177, 253–263. [Google Scholar] [CrossRef]
  34. Schwanen, T.; Banister, D.; Anable, J. Scientific research about climate change mitigation in transport: A critical review. Transp. Res. Part A Policy Pract. 2011, 45, 993–1006. [Google Scholar] [CrossRef]
  35. Oltra, C.; Sala, R.; López-asensio, S.; Germán, S.; Boso, À. Individual-level determinants of the public acceptance of policy measures to improve urban air quality: The case of the barcelona low emission zone. Sustainability 2021, 13, 1168. [Google Scholar] [CrossRef]
  36. Jefatura del Estado de España. Ley 7/2021, de 20 de mayo, de cambio climático y transición energética. BOE 2021, 121, 62009–62052. [Google Scholar]
  37. Jiménez-Espada, M.; Martínez García, F.M.; González-Escobar, R. Urban Equity as a Challenge for the Southern Europe Historic Cities: Sustainability-Urban Morphology Interrelation through GIS Tools. Land 2022, 11, 1929. [Google Scholar] [CrossRef]
  38. Sánchez Franco, C. El Desarrollo Urbano de Cáceres a Través de su Planeamiento (1961–2018). Ph.D. Thesis, Universidad de Extremadura, Badajoz, Spain, 28 June 2021. [Google Scholar]
  39. Ruíz García, J. La Evolución Urbana de Cáceres; Grupo Ciudades Patrimonio de la Humanidad de España: Ávila, Spain, 2011. [Google Scholar]
  40. Rengifo Gallego, J.I.; Campesino Fernández, A.-J.; Sánchez Martín, J.M.; Salcedo Hernández, J.C.; Martín Delgado, L.M. Los apartamentos turísticos de la ciudad de Cáceres: Rehabilitación y refuncionalización del centro histórico. Cuad. Geográficos 2020, 59, 238–263. [Google Scholar] [CrossRef]
  41. Informe del Observatorio de la Movilidad Metropolitana 2020 (Avance 2021); Ministerio deTransportes, Movilidad y Agenda Urbana: Madrid, Spain, 2022. Available online: https://observatoriomovilidad.es/en/informes/ (accessed on 10 January 2023).
  42. Ministerio para la Transición Ecológica y el Reto Demográfico. Plan Nacional Integrado de Energía y Clima; Ministerio para la Transición Ecológica y el Reto Demográfico: Madrid, Spain, 2021.
  43. Estrategia de Movilidad Segura, Sostenible y Conectada 2030. Available online: https://esmovilidad.mitma.es/ (accessed on 10 January 2023).
  44. Ministerio de Transportes Movilidad y Agenda Urbana. Ley de Movilidad Sostenible. Available online: https://www.mitma.gob.es/el-ministerio/campanas-de-publicidad/ley-de-movilidad-sostenible-y-financiacion-del-transporte (accessed on 10 January 2023).
  45. Ministerio para la Transición Ecológica y el Reto Demográfico. Estrategia a Largo Plazo Para Una Economía Española Moderna, Competitiva y Climáticamente Neutra en 2050; Ministerio para la Transición Ecológica y el Reto Demográfico: Madrid, Spain, 2020.
  46. Ayuntamiento de Cáceres. Plan de Movilidad Urbana Sostenible (PIMUS) 2014; Ayuntamiento de Cáceres: Cáceres, Spain, 2014. [Google Scholar]
  47. Ayuntamiento de Cáceres. Estrategia de Desarrollo Urbano Sostenible Integrado para el Municipio de Cáceres; Ayuntamiento de Cáceres: Cáceres, Spain, 2015. [Google Scholar]
  48. Ayuntamiento de Cáceres. Plan General Municipal. Available online: https://www.ayto-caceres.es/ayuntamiento/plan-general-municipal/ (accessed on 10 January 2023).
  49. Monzon, A.; Julio, R.; Garcia-Martinez, A. Hybrid methodology for improving response rates and data quality in mobility surveys. Travel Behav. Soc. 2020, 20, 155–164. [Google Scholar] [CrossRef]
  50. Tarriño-Ortiz, J.; Soria-Lara, J.A.; Gómez, J.; Vassallo, J.M. Public acceptability of low emission zones: The case of “Madrid Central”. Sustainability 2021, 13, 3251. [Google Scholar] [CrossRef]
  51. Jiménez-Espada, M.; Naranjo, J.M.V.; García, F.M.M. Identification of Mobility Patterns in Rural Areas of Low Demographic Density through Stated Preference Surveys. Appl. Sci. 2022, 12, 34. [Google Scholar] [CrossRef]
  52. Whitmarsh, L.; Swartling, Å.G.; Jäger, J. Participation of experts and non-experts in a sustainability assessment of mobility. Environ. Policy Gov. 2009, 19, 232–250. [Google Scholar] [CrossRef]
  53. Lebrusán, I.; Toutouh, J. Car restriction policies for better urban health: A low emission zone in Madrid, Spain. Air Qual. Atmos. Health 2021, 14, 333–342. [Google Scholar] [CrossRef]
  54. Kowalska-Pyzalska, A. Perspectives of Development of Low Emission Zones in Poland: A Short Review. Front. Energy Res. 2022, 10, 551. [Google Scholar] [CrossRef]
  55. Pridmore, A.; Miola, A. Public Acceptability of Sustainable Transport Measures: A Review of the Literature; OECD Publishing: Berlin, Germany, 2011. [Google Scholar]
  56. Berte, E.; Panagopoulos, T. Enhancing city resilience to climate change by means of ecosystem services improvement: A SWOT analysis for the city of Faro, Portugal. Int. J. Urban Sustain. Dev. 2014, 6, 241–253. [Google Scholar] [CrossRef]
  57. Tarriño Ortiz, J.; Soria-Lara, J.A.; Vassallo, J.M. Diseño de un enfoque colaborativo para la evaluación de políticas de transporte destinadas a mejorar la calidad del aire en el centro de las ciudades. R-Evol. Transp. 2021, 11, 2353–2375. [Google Scholar]
  58. Vassallo, J.M.; Tarriño, J.; Gomez, J.; Soria-Lara, J.A. Impacto en la aceptabilidad y reparto modal de las medidas para mejorar la calidad del aire en Madrid central. R-Evol. Transp. 2021, 11, 1591–1627. [Google Scholar]
  59. Luan, X.; Cheng, L.; Song, Y.; Zhao, J. Better understanding the choice of travel mode by urban residents: New insights from the catchment areas of rail transit stations. Sustain. Cities Soc. 2020, 53, 101968. [Google Scholar] [CrossRef]
  60. Tyrinopoulos, Y.; Antoniou, C. Factors affecting modal choice in urban mobility. Eur. Transp. Res. Rev. 2013, 5, 27–39. [Google Scholar] [CrossRef] [Green Version]
  61. Ahanchian, M.; Gregg, J.S.; Tattini, J.; Karlsson, K.B. Analyzing effects of transport policies on travelers’ rational behaviour for modal shift in Denmark. Case Stud. Transp. Policy 2019, 7, 849–861. [Google Scholar] [CrossRef]
  62. Croci, E. Urban Road Pricing: A Comparative Study on the Experiences of London, Stockholm and Milan. Transp. Res. Procedia 2016, 14, 253–262. [Google Scholar] [CrossRef]
Figure 1. Location of study area.
Buildings 13 00249 g001
Figure 2. Methodology flowchart.
Buildings 13 00249 g002
Figure 3. Number of vehicles available in the household by typology.
Buildings 13 00249 g003
Figure 4. Means of transport required for travel.
Buildings 13 00249 g004
Figure 5. Question: How long would you be willing to walk to your destination?
Buildings 13 00249 g005
Table 1. Socio-demographic information.
GroupSubgroupNº of Responses%
GenderMan26062.05
Woman15937.95
Age range18–259522.67
26–358620.53
36–5014233.89
51–659021.48
66–7561.43
Employment statusUnemployed92.15
Student7718.38
Retired71.67
Housework51.19
Mixed worker348.11
Face-to-face worker26062.05
Teleworker122.86
Other153.58
Education levelBachelor/BUP/COU5713.60
University studies32377.09
FP296.92
Primary92.15
Uneducated10.24
QuestionTypology
Do you have a driver’s licence?Car39293.55
Truck112.62
Motorbike6014.32
Bus 10.48
No ID card276.44
Table 2. Origin-destination of movements.
Question Destination of Movements (%)
District/PlaceCentreNorthWestSouthNeighbouring MunicipalitiesVillagesLEZ
Origin of movementsCentre30.6045.366.563.288.201.094.92
North36.9238.461.546.157.690.009.23
West24.5940.989.843.286.561.6413.11
South38.4638.462.562.562.560.0015.38
Neighbouring municipalities29.7332.430.002.7018.920.0016.22
Villages0.000.000.000.000.00100.000.00
LEZ15.1530.3012.123.0312.120.0027.27
Table 3. Means of transport and frequency of travel by purpose.
Reason for the Journey (%)
QuestionTipologyOwn AffairsShoppingStudiesWorkTourismHealth CareLeisure
Reasons for travelOn foot44.3448.2148.6249.1455.2452.4750.85
Bus3.173.595.502.863.503.703.39
Bicycle1.361.542.751.712.101.851.69
Car46.1542.0537.6141.7133.5737.6539.55
Motorbike4.524.104.594.004.903.703.95
Taxi0.450.510.920.570.700.620.56
Frequency of journeys2/3 times per week21.0021.8119.1819.4820.8819.3121.59
More than 2 times per month15.3015.6417.1213.4214.2914.8514.54
Occasionally29.1831.6932.8831.6035.1634.1632.60
Every day9.9610.708.9011.6911.5412.3810.57
Once a day11.038.648.2210.827.697.437.49
Several times a day13.5211.5213.7012.9910.4411.8813.22
Table 4. Assessment of proposals and current situation of the city.
Valuation (%)
Question 12345
Evaluates the following mobility proposalsCreation of bicycle lanes8.595.4910.2631.2644.39
Creation of charging points for electric vehicles5.733.1022.4332.7036.04
Rental of electric scooters9.075.7326.9729.8328.40
Bicycle rental7.884.5319.3334.3733.89
Free blue zone for electric vehicles15.0411.9325.3023.6324.11
Carsharing (rental of electric vehicles by the minute)9.314.5329.1229.8327.21
Regular public transport discounts/offers for public transport use7.162.8610.5024.1155.37
Assess the following situations at street levelOn-street parking22.9138.4229.596.922.15
Parking in the area of residence15.7525.3030.0720.538.35
Pedestrian space7.4015.0441.7726.499.31
Accessibility of pavements9.7922.6741.7719.096.68
Traffic and road safety7.8819.3346.7820.055.97
Ease of use of bicycles and electric scooters23.6337.2327.686.924.53
Noise and pollution11.2226.2541.7713.607.16
School roads16.2329.3637.7110.506.21
Table 5. Assessment of accessibility and the problem of excessive use of private vehicles.
Valuation (%)
Question 12345
What aspects do you think should be improved in terms of universal accessibility?Increase the number of pedestrian streets16.4715.7524.3420.2923.15
Widen pavements9.3118.1419.8122.9129.83
Reduce traffic12.6517.9027.6821.4820.29
Street crossings7.6414.3234.6126.2517.18
Paving and/or street furniture4.3010.2627.9226.9730.55
Street signage6.6811.9339.1422.6719.57
On-street parking arrangements5.4910.7430.3125.5427.92
Public transport, location and design of stops6.449.5521.2428.4034.37
Access to buildings9.0715.7536.0419.8119.33
Street lighting6.4411.4627.9222.9131.26
What are your concerns about excessive car use?Lack of parking9.799.7917.6624.8237.95
Traffic jams12.6517.1821.4823.8724.82
Increased noise pollution11.2213.3721.7224.8228.88
Risk of disease19.0918.1424.3416.9521.48
Increased greenhouse gases and climate change13.3710.9817.1820.7637.71
Table 6. Opinion on Low-emission zones (LEZs) and proposed measures.
Valuation (%)
Question 12345
What is your opinion on Low-emission zones (LEZs) and the situation in the municipality?Did you know about the LEZ concept?18.855.4912.1712.1751.31
Do you know about “Madrid Central”?6.445.7314.5617.1856.09
Do you know about the existence of environmental labels?4.534.0610.0215.0466.35
How informed are you about climate change?0.954.0621.2430.5543.20
Do you consider that Cáceres has enough space for walking?6.6811.2225.0630.3126.73
Do you think that the municipality is accessible for cycling?23.6328.6426.2512.658.83
Do you consider that there is a good public transport infrastructure?13.6022.6734.3720.538.83
Would you change your way of getting around if the cycling infrastructure were improved?28.6414.0817.1818.3821.72
Would you change the way you get around if the pedestrian routes in the municipality were improved?21,7214,5620,2922,2021,24
What do you think of the following alternative measures to tackle pollution, noise and congestion?Implementing urban tolls61.5812.6513.606.215.97
Pedestrianisation13.3711.2222.4320.0532.94
30 Zones22.9115.9928.6419.3313.13
Implementation of a Low-emission zone20.539.7924.3422.9122.43
Subsidies for the purchase of Eco and Zero Emission cars14.807.8816.7123.3937.23
Increased safe bicycle/pedestrian infrastructure9.555.7318.6223.3942.72
Subsidies for public transport7.165.4918.3822.6746.30
Subsidies for the purchase of electric bicycles/scooters16.717.4024.8218.6232.46
Universal Accessibility6.212.6316.7124.5849.88
Table 7. Assessment of the possible implementation of an LEZ in Cáceres.
Valuation (%)
Question 12345
If a Low-emission zone were to be implemented in Cáceres, how would it affect your daily life?It will improve my quality of life22.6721.7224.8212.1718.62
Reduce my freedom17.1816.2326.4916.4723.63
It will make me use my car/motorbike less for my daily commute21.4815.2731.2614.0817.90
Will make me consider switching to a less polluting type of vehicle18.6211.6928.6412.6528.40
Make me use public transport more18.3816.2327.6815.9921.72
Will cause me to use my bicycle/electric scooter more15.2715.7524.8212.4131.74
It will make me walk more24.1130.7921.009.0715.04
If a Low-emission zone were to be implemented in Cáceres, how do you think it would affect the municipality?It will improve the health of citizens31.2630.5518.386.6813.13
Improve the quality of life32.4625.5419.579.0713.37
Reduce traffic in the city30.7931.9813.6011.2212.41
Make the city cleaner27.6832.4617.669.7912.41
Decrease traffic noise32.2237.4712.897.1610.26
Table 8. SWOT analysis of the possible implementation of an LEZ in Cáceres.
StrengthsWeaknesses
S1. Pollution abatement and positive impact on air qualityW1. Public ignorance of future measures and social opposition to the creation of the LEZ
S2. Protection of the historical and artistic heritage of the cityW2. Lack of a proper legislative framework of reference that clearly specifies the restrictions
S3. Reduction of noise nuisance in the city centre due to traffic restrictionsW3. Possible disagreement of political groups on the approach of measures
S4. Safe, accessible and sustainable tourismW4. Age of the vehicle fleet
S5. Increased quality of life for citizensW5. Absence of clearly defined delimitation of the LEZ
S6. Balanced geographical distribution of actions complementary to the LEZW6. Lack of a dissemination campaign on the benefits of the strategy for the citizen
S7. Reorganisation of parking spaces and generation of park-and-ride facilitiesW7. Gap in coverage of a sufficient network of charging stations for electric vehicles
S8. Improvement of sustainable urban mobility through the promotion of soft modes, public transport and shared or non-polluting vehicles W8. Shortage of sustainable mobility infrastructures (cycle lanes) and/or lack of connection
S9. Intensifying public interest in new, less polluting vehicle modelsW9. Urban orography and insufficient public transport services in certain areas
S10. Preservation of public health and social well-beingW10. Overuse of private vehicles for short distances
OpportunitiesThreats
O1. New business alternatives (sale of electric or eco vehicles, bicycles, MPVs)T1. User’s negative disposition towards the implementation of the LEZ due to the limitation of their personal freedom
O2. Advances in the development of technological control of urban trafficT2. Economic barrier for residents due to the burden of the possible replacement of polluting cars by eco-friendly vehicles
O3. Willingness of citizens to travel in a more sustainable way (transfer towards soft mobility)T3. Saturation of road infrastructure and increased traffic congestion in areas adjacent to and outside the LEZ
O4. Growing social awareness of the negative impact of environmental pollution due to excessive traffic in the cityT4. Organisational problems in urban freight distribution (last mile logistics)
O5. Political interest in improving road safety and generating flexible legislationT5. Competition/conflict between soft mobility users for road use
O6. Revitalisation of the historic centre and commerceT6. Non-compliance with restrictions by the population
O7. Launching of a public service of electric car sharing and personal mobility vehicles (PMVs) on a per-minute rental basisT7. Possible initiation of legal proceedings or lawsuits against the City Council for the implementation of the measure
O8. Progress in the creation of new pedestrian and semi-pedestrian zonesT8. Increased travel times for the user
O9. Restructuring of lines and adaptation of public transport timetablesT9. Danger of imminent entry into force instead of a gradual process of implementation
O10. Improving the city’s infrastructures and connections for more efficient mobilityT10. Lack of acceptance of the measure due to the lack of a public consultation procedure
Disclaimer/Publisher’s Note: The statements, opinions and data contained in all publications are solely those of the individual author(s) and contributor(s) and not of MDPI and/or the editor(s). MDPI and/or the editor(s) disclaim responsibility for any injury to people or property resulting from any ideas, methods, instructions or products referred to in the content.

