Article

Detecting Changes in Perceptions towards Smart City on Chinese Social Media: A Text Mining and Sentiment Analysis

1
School of Management Science and Real Estate, Chongqing University, Chongqing 400044, China
2
School of Economics and Management, Tongji University, Shanghai 200092, China
3
Department of Building and Real Estate, The Hong Kong Polytechnic University, Hong Kong 999077, China
*
Author to whom correspondence should be addressed.
Buildings 2022, 12(8), 1182; https://doi.org/10.3390/buildings12081182
Submission received: 11 July 2022 / Revised: 29 July 2022 / Accepted: 3 August 2022 / Published: 8 August 2022
(This article belongs to the Special Issue Advances in Sustainable and Smart Cities)

Abstract

:
Examining the public’s attention and comments on smart city topics in social media can help enable a full understanding of the development characteristics of smart cities, and provide a realistic reference for improving the level of public participation and citizens’ sense of acquisition in smart city construction. Based on Sina Weibo, a well-known social media platform in China, over 230,000 public comments related to smart cities were extracted to analyze. Using LDA (Latent Dirichlet Assignment) and CNN-BiLSTM (Convolutional Neural Network and Bi-directional long and short memory) models, a topic mining and sentiment analysis model for user comments was constructed to study the current state of public perception of smart city concepts. The results demonstrate that public discussions on smart cities were macro-oriented, focusing on strategic layout and technical applications. As public awareness of smart cities deepens, topics about application scenarios and social services are gradually emphasized. The public’s positive sentiment toward smart cities dominates and varies in sentiment intensity across years; the positive sentiment intensity of individual users on smart city ideas is significantly lower than that of official certified Weibo users, such as government departments and corporate organizations, which reveals the identity and temporal characteristics of public participation in cyberspace.

1. Introduction

In recent years, smart city pilot projects have begun to be built and promoted in many countries [1]. However, with the continuous expansion of the scale of development, problems such as the deviation and the out-of-focus of the development mainline, duplicated construction, and a lag in supporting systems have appeared in the construction process of smart cities in some countries [2,3,4]. Some scholars have found that relying on top-down policy advancement alone is not enough to improve smart city construction. This model will cause urban reforms to lack the initiative of a long-term mechanism, and local governments are prone to implement smart city construction passively as a task [5]. Furthermore, under the guidance of information technology companies and market monopoly, local governments’ smart city construction models are prone to homogenization, resulting in the “misalignment” between construction models and target planning, which cannot meet the needs of construction and governance in different cities [6,7]. At present, numerous scholars emphasize that increasing public recognition and attention to the smart city concept is a critical factor in improving smart city construction [8,9]. Increasing public participation in smart city construction can also improve the level of smart city construction. The orderly operation of the social economy depends on healthy interactions between the government and society, and the government and citizens, as does the healthy development of smart cities. The effective development of smart city construction requires not only the provision of accurate services for the diverse and individualized needs of the public, but also the participation and political support from citizens [10].
At present, in smart city research, the bottom-up construction model has increasingly become the focus of scholars, and the public’s active attention to the smart city concept is an extremely important factor [11,12]. Numerous studies indicate that enhancing public participation in smart cities can promote the level and sense of achievement of smart city construction [13,14]. However, many scholars have pointed out that the current smart city construction still has problems, such as the lack of an empowerment mechanism for citizens and the lack of a clear understanding of the prospects of the smart city concept by the public. As a prerequisite for public participation, a full understanding of the concept of a smart city is the basis and premise for raising public enthusiasm to participate in smart city construction [15]. It also benefits from formatting a unified vision of smart city development between the government and the public [16]. Therefore, in the current critical period of smart city construction, how to efficiently mobilize the public to participate in the construction of smart cities and improve the public’s sense of happiness and gain is an issue that the government needs to consider urgently [17,18].
In the context of the rapid development of the Internet, various forms of social media have been established such as Twitter, Facebook, Weibo, WeChat, etc. These social media provide effective carriers and voice channels for public interaction and public participation in social activities [19,20]. The “voice” of the public through social media is not only an expression of emotion but is also an effective way for the public to participate in the construction of smart cities [5]. At the same time, it is also a comprehensive judgment of society’s self-examination and cognition of smart cities [21], and it will have a direct effect on public participation in the process of smart city construction management and construction results [11]. Therefore, taking discussions on smart city topics in social media as a research sample is an important method for analyzing the public’s cognition and emotional polarity of smart city ideas [22]. However, despite the growing number of smart city-related research studies, the use of social media content and analysis of public engagement in smart cities remains an under-researched area that has received significantly less attention [13,23]. To answer this question, our analysis focuses on China, one of the largest developing countries. As a country with the highest urbanization rate, China is building the world’s largest smart city to cope with the harm caused by increasingly severe urbanization [24,25]. As of April 2020, the cumulative number of smart city pilots in China has reached 749. The rapid and large-scale urbanization transformation, significant regional differences, and complex urban development challenges, coupled with the government’s continuous capital investment in the construction of smart cities, have driven China’s smart city construction process to undergo significant phases and non-linear changes. To this end, Sina Weibo is considered a research vehicle in our research because it is the largest blogging platform in China, with more than 462 million users, accounting for 55.7% of all Internet users [20]. Therefore, based on the public comment data on smart city topics in social media, this study applies topic mining and sentiment discrimination models to analyze the public’s attention to the smart city concept and the trend of sentiment changes. The ideas of this study will also contribute to a better understanding of the public’s cognitive status of smart city construction. The conclusions of this study have important implications for smart city construction planning. The novelty and contributions of this paper are mainly in the following two aspects. First, by applying massive social media data, this study proposes an integrated solution that integrates text mining methods and sentiment analysis and applies it to examine the state of public perceptions of smart city ideas, which is something no previous work has done using quantitative methods to investigate comprehensively. Second, in contrast to existing studies, this study uses large-scale, timely, and objective data based on leading Chinese social media platforms to determine public concerns about the smart city concept. Social media data can accurately reflect public interest claims and concerns about the smart city development process, and this wealth of information can further our understanding of the Chinese public’s concerns about the smart city development process.

2. Literature Review

2.1. Public Perception of Smart City Construction

As a hot spot in the field of urban development, topics related to public participation in smart city construction have attracted much attention in academia [26,27]. The ultimate goal of smart city construction and management is to provide residents with a better living environment [28,29]. Through the multi-channel participation model, the public can participate easily and efficiently in the construction and management of smart cities, and they can view the progress of problem solving and related pictures anytime, anywhere, and have access to the historical records. More effective planning and understanding of social issues, and fairer and more transparent management are also among the advantages [11]. The higher the degree of public participation, the more people will accept the results, and the more convincing the results of planning and decision making, which can also change the relationship between government departments and the public and improve service quality [30,31]. Previous research believes that public participation is a coordinated countermeasure under the condition of diverse needs and the involvement of different stakeholders, emphasizing public participation, decision making, and management; hence, it has received increasing attention about the construction of smart cities [32]. In the construction of smart cities, its content involves participation in decision making, planning and design, service design, and serving as an important source of data collection and feedback. As an important dimension in the development of smart cities, the potential of public participation in seeking solutions to urban problems has been widely recognized [18,29,33].
With the rapid development and popularization of technologies such as the Internet, information and communication technology (ICT) provides favorable conditions for the public to participate in the construction of smart cities. First, it enriches the informatization channels for the public to participate in the construction of smart cities through convenient, extensive, and in-depth interaction and participation [34]. Second, it enables the public to effectively acquire, share, and use urban data resources, and provide a data support and a behavioral decision making reference for public participation in smart city construction [35]. Finally, it provides innovative public participation and interaction. The model provides effective and increasingly flexible ways of participation, thereby stimulating the collective wisdom of the online and the offline [13]. In many cases, smart cities are finding answers to various urban problems by employing ICTs designed to gather feedback from citizens. In this way, it is possible to rely on the “wisdom of citizens” to seek solutions to urban problems to improve democratic decision making and transparency [21].

2.2. Application of Social Media in Smart Cities

Technology solutions can allow city dwellers to “access services and stay connected to what’s going on around them in an easy, inexpensive way”. However, the realization of this solution requires not only the support of “hard infrastructure” at the technical level represented by information technology, but also the cooperation of “soft infrastructure” at the mechanism level represented by the public participation policy [26]. In general, citizen participation in decision making is not limited to the political sphere, nor is it limited to municipal (local government) elections [36]. Citizens need to engage in adequate consultation and public debate before making a decision. This link requires a tool that bridges the “hard infrastructure” and “soft infrastructure” of smart cities, documents, and communication tools for citizens to exchange and distribute information.
In this context, as a cheap and convenient communication channel, the existence of social media plays a crucial role in the implementation of the smart city concept. Social media can be divided into two categories [20]. One type is expressive social media, which is done by individuals, and encourages or advocates for people to express themselves by sharing text, pictures, and videos on platforms such as Facebook, Twitter, YouTube, etc. The other type is social media which emphasizes multi-person collaboration, allowing people to accomplish some common goals together through interaction and cooperation [21]. For example, Wikipedia and Yammer are typical cooperative social media. Social media provide a very good platform for government departments, which can greatly promote public participation and strengthen collaboration with the public and social capital. For example, by opening an application programming interface (API), the public and enterprises can access and use official data and enjoy government services directly [37].

2.3. Measuring Social Media User Engagement

Functional infrastructure is critical in building smart cities, but it cannot truly contribute to smart cities without citizen participation and collaboration. However, extant smart city research does not adequately reflect the ongoing practice of how cities are actively reconfiguring themselves and their growing smart city movement around the world. Previous studies have developed research on smart cities from the perspectives of information companies, the public, and others, through channels such as media surveys and interviews [14,36]. However, there is still a lack of systematic analysis on how to mobilize the enthusiasm of the public to participate in the construction of smart cities, and further research is needed to make them truly participate in the construction of smart cities and have an impact. Using online metrics to analyze user engagement willingness or emotional status through social media is a topic that has a large potential to be explored. Interactions with brands through social media are often studied through consumer surveys, with standard methods including Likert scales [38]. However, qualitative techniques are also applied, including in-depth interviews and case studies [23,39].
In general, questionnaire or in-depth interview methods tend to be complex and expensive, especially when the intention is to observe participation behavior and measure engagement longitudinally over time [20]. However, the massive data samples in social media provide a wide range of resources for conducting public engagement studies that can be used in a more effective way to assess the level of public and managerial engagement in the smart city building process. Several authors have pointed out that “likes”, “comments”, and “shares” on social media are expressions of user behavioral engagement [40]. Accordingly, users’ dependence on social media can be reflected when these options are used more frequently by users on social media sites [41]. Similarly, this can be interpreted as users’ engagement and interest in the content of online posts and their willingness to establish communication channels [42].
In addition, most of the current cases of smart city construction or management are promoted by the government and large technology companies in one direction. This model lacks a bottom-up communication and feedback mechanism, which causes the public to lack a sense of participation and access. Therefore, the introduction of social media analysis in this study is innovative and necessary because social media allows for participation, interaction, and open forms of communication, a platform that can reach a variety of stakeholders and reveal different narratives and positions. Unlike existing studies that mainly rely on data obtained through focus groups or interviews, our study analyzes data from comments of the urban public, which are spontaneously generated and authentic. To do so, we focused on a group of people who are attracted to cities because of their innovative potential and who are committed to them. They are the bridge between the top-down and bottom-up models of urban development: the internet users who are active on social media and willing to speak out for smart cities. Examining public attention and comments on smart city topics in social media helps to fully understand the characteristics of smart city development and provides a realistic reference for improving the level of public participation and citizens’ sense of access to smart city construction.

3. Materials and Methods

3.1. Case Study

The research selected China as the case study context. The reasons are the following: As the most populous country, China is facing a rapid and large-scale urbanization transition, significant regional disparities, and complex urban development challenges. In response to the emerging urban issues and to improve the efficiency of urban governance, the Chinese government has embarked on a series of smart city constructions, and the continuous financial investment in smart city construction has led to significant phased and non-linear changes in China’s smart city construction. At the same time, the number of Chinese netizens ranks first in the world, with a total of 1.011 billion netizens as of June 2021. Online social media is changing the traditional way of communication, providing an important channel for public expression and information dissemination, and is also an effective way to analyze the status of public participation in smart city construction. As a result, China has become a remarkable case for studying the development of smart cities. we take China, an emerging market in the wave of large-scale smart city construction, as an example to examine and review the public’s attention and comments on smart city topics in existing social media, which is helpful to fully understand the development characteristics of smart cities and to improve the development of smart cities. The level of public participation in smart city construction and citizens’ sense of acquisition provides a realistic reference. At the same time, it can also provide some references and suggestions for the construction of smart cities in developing countries.

3.2. Data

Obtaining data from Weibo is a challenge because netizens who post about smart city-related topics usually do not have a fixed topic and the relevant text contains a lot of noisy data, such as missing values in fields, garbled information, and a lot of repeated information, which need to be identified. Data cleaning is performed before the initial dataset can be created. Therefore, to ensure the validity of the obtained data, we conducted a full-scale search on the Weibo platform with the subject word “smart city.” The search time was 1 July 2021, and finally, a total of 281,300 posts related to smart cities were obtained during the period from January 2011 to July 2021. Furthermore, we identify different types of users with the user authentication service that Weibo has, such as “Officially certified user” and “Unofficially certified user”. According to statistics, the above-mentioned “smart city” comments were issued by 70,539 accounts, including 29,963 official Weibo users and 40,576 non-Weibo official users.

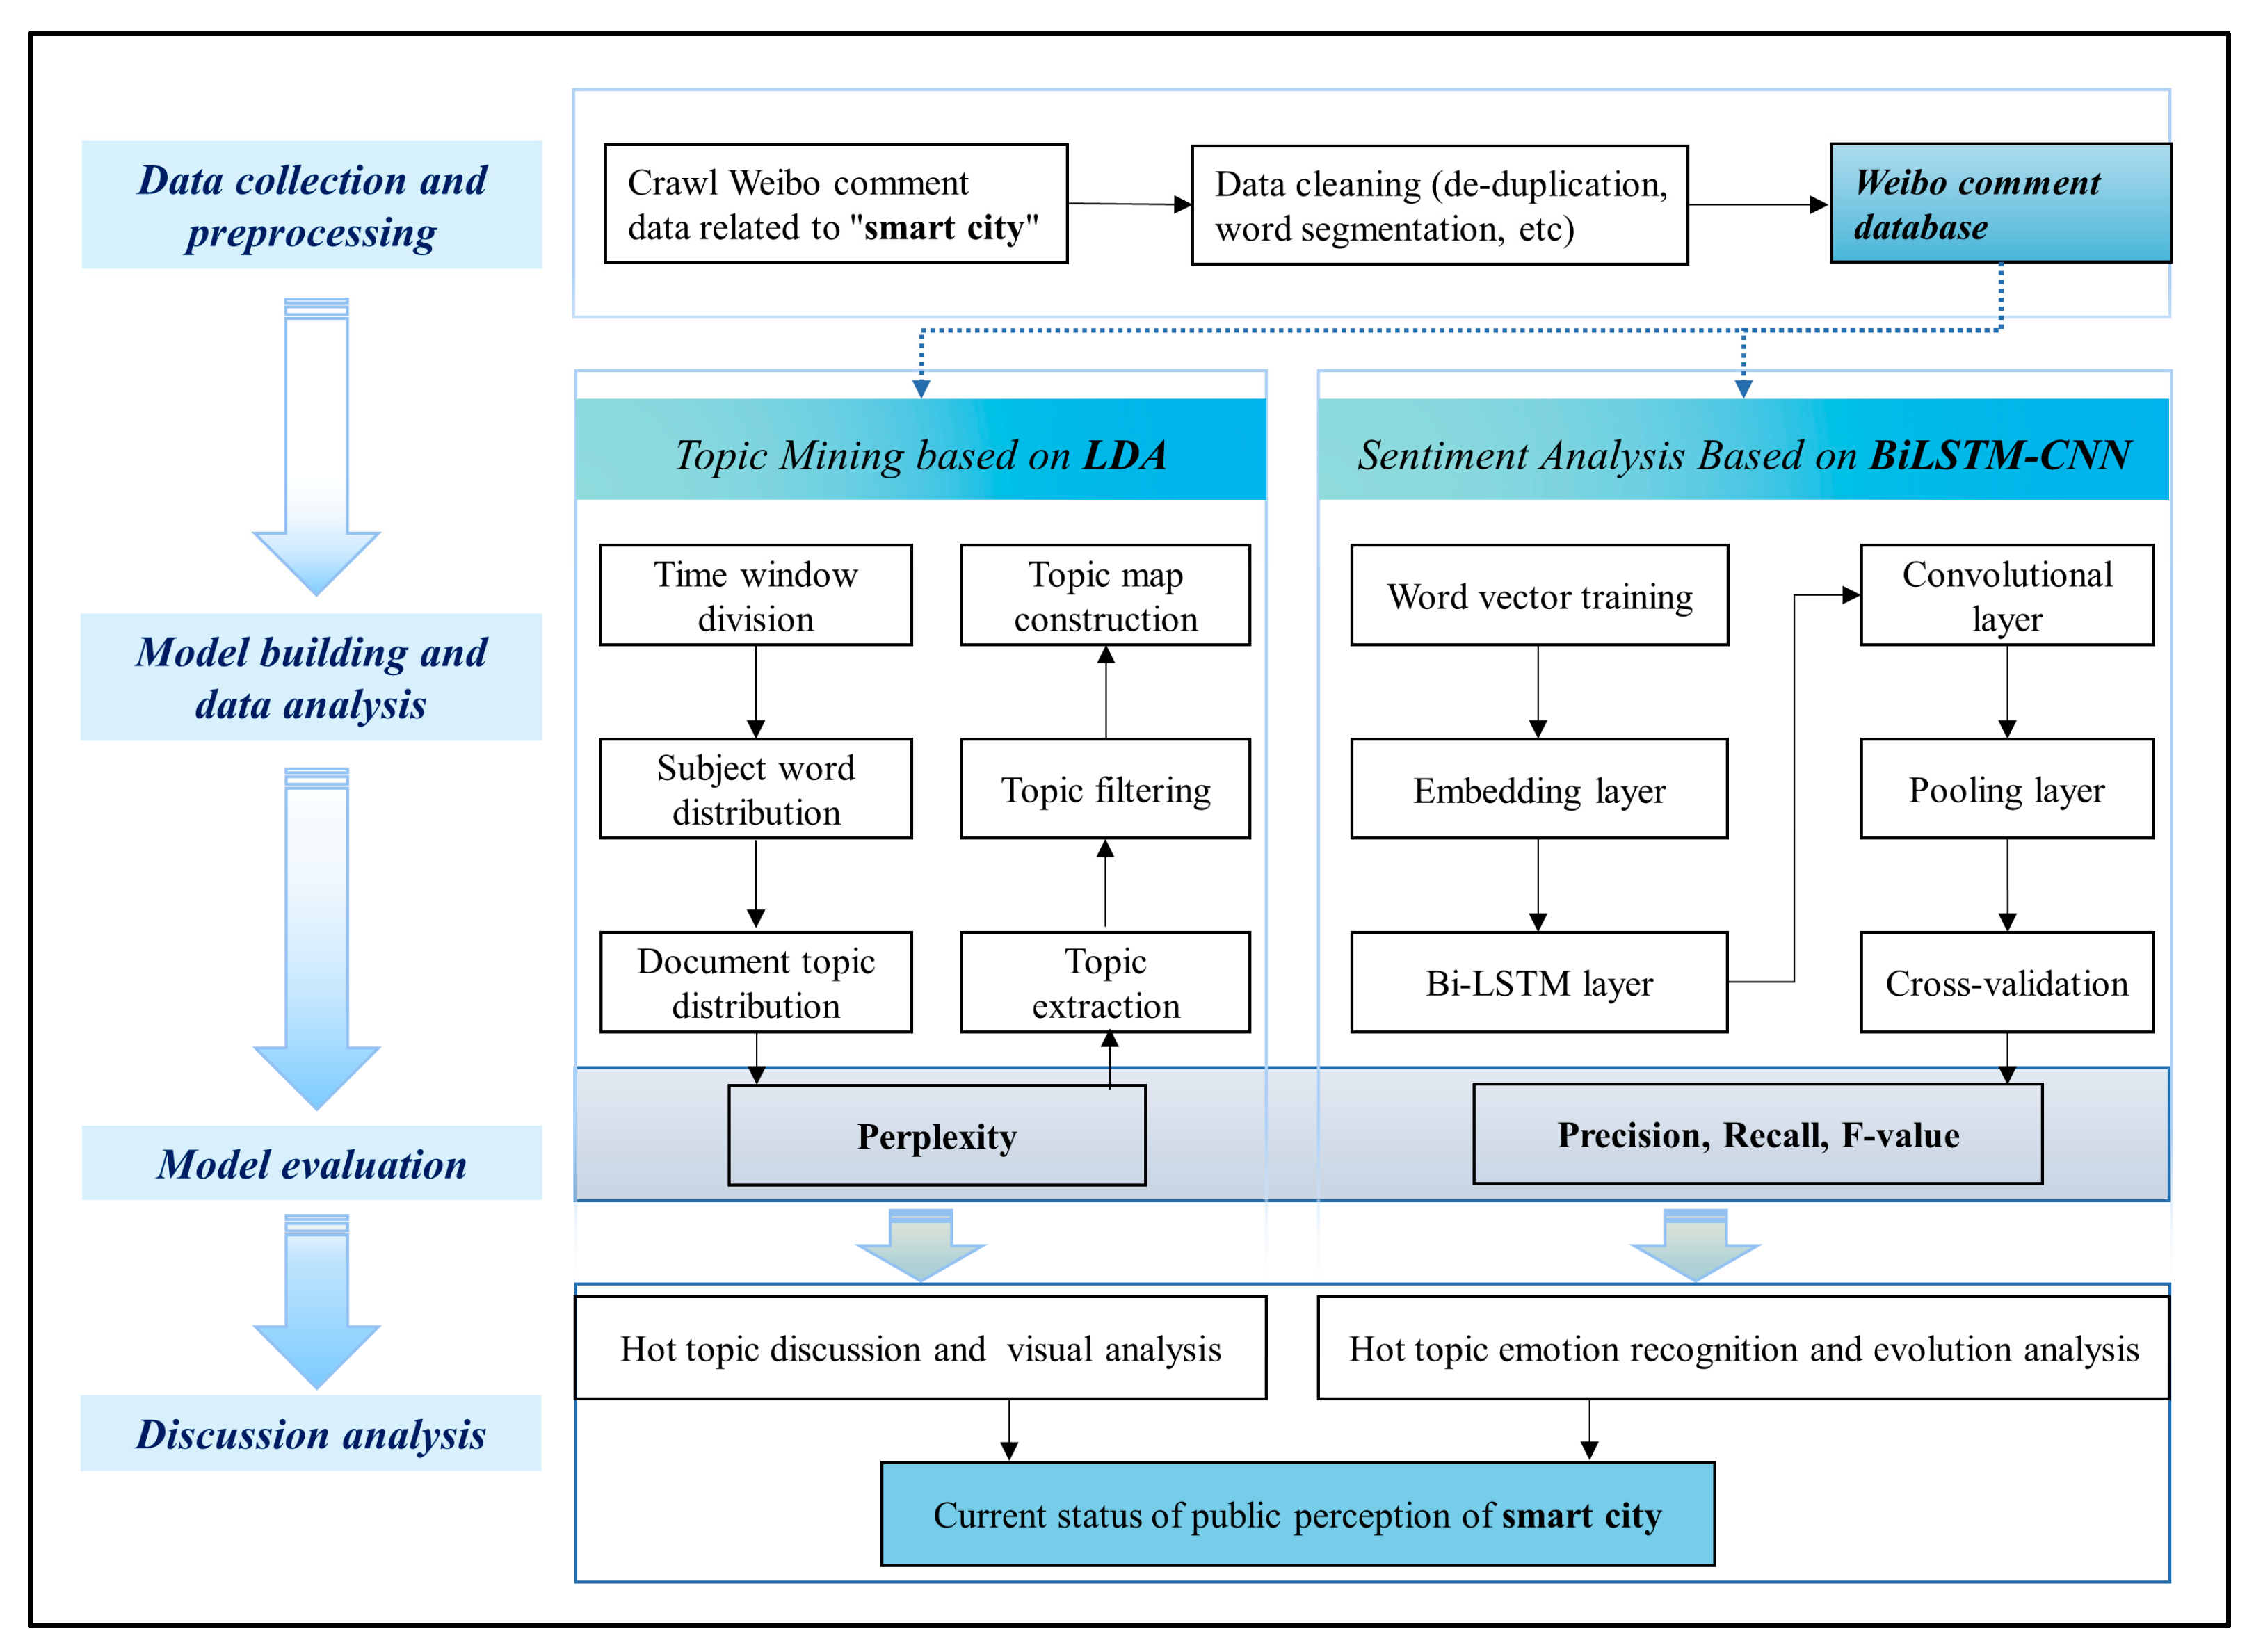
3.3. Research Framework

Based on the LDA model and the CNN-BiLSTM model, this paper establishes an analytical framework for the state of public perception and sentiment level of smart cities. The research framework is shown in Figure 1, and includes four parts: data acquisition and preprocessing, data processing and model building, model evaluation, and discussion and analysis.

3.3.1. Data Collection and Preprocessing

After data collection, data preprocessing plays an important role in the following work and affects the objective accuracy of the research. This paper preprocesses the obtained data, deletes the content of emoji comments, filters invalid or meaningless characters, and finally obtains 230,726 pieces of valid data due to the irregularity and diversity of Weibo comment data obtained by web crawlers and avoids the interference of invalid data.

3.3.2. Model Establishment

Based on the obtained data samples, the research reconstructs based on the convolutional neural network (CNN) and the LSTM (long short-term memory network), and uses the LDA topic model and the CNN-BiLSTM model to construct a topic mining model of a “smart city” topic based on user the comments and the sentiment analysis models. The model is introduced as follows.
(1)
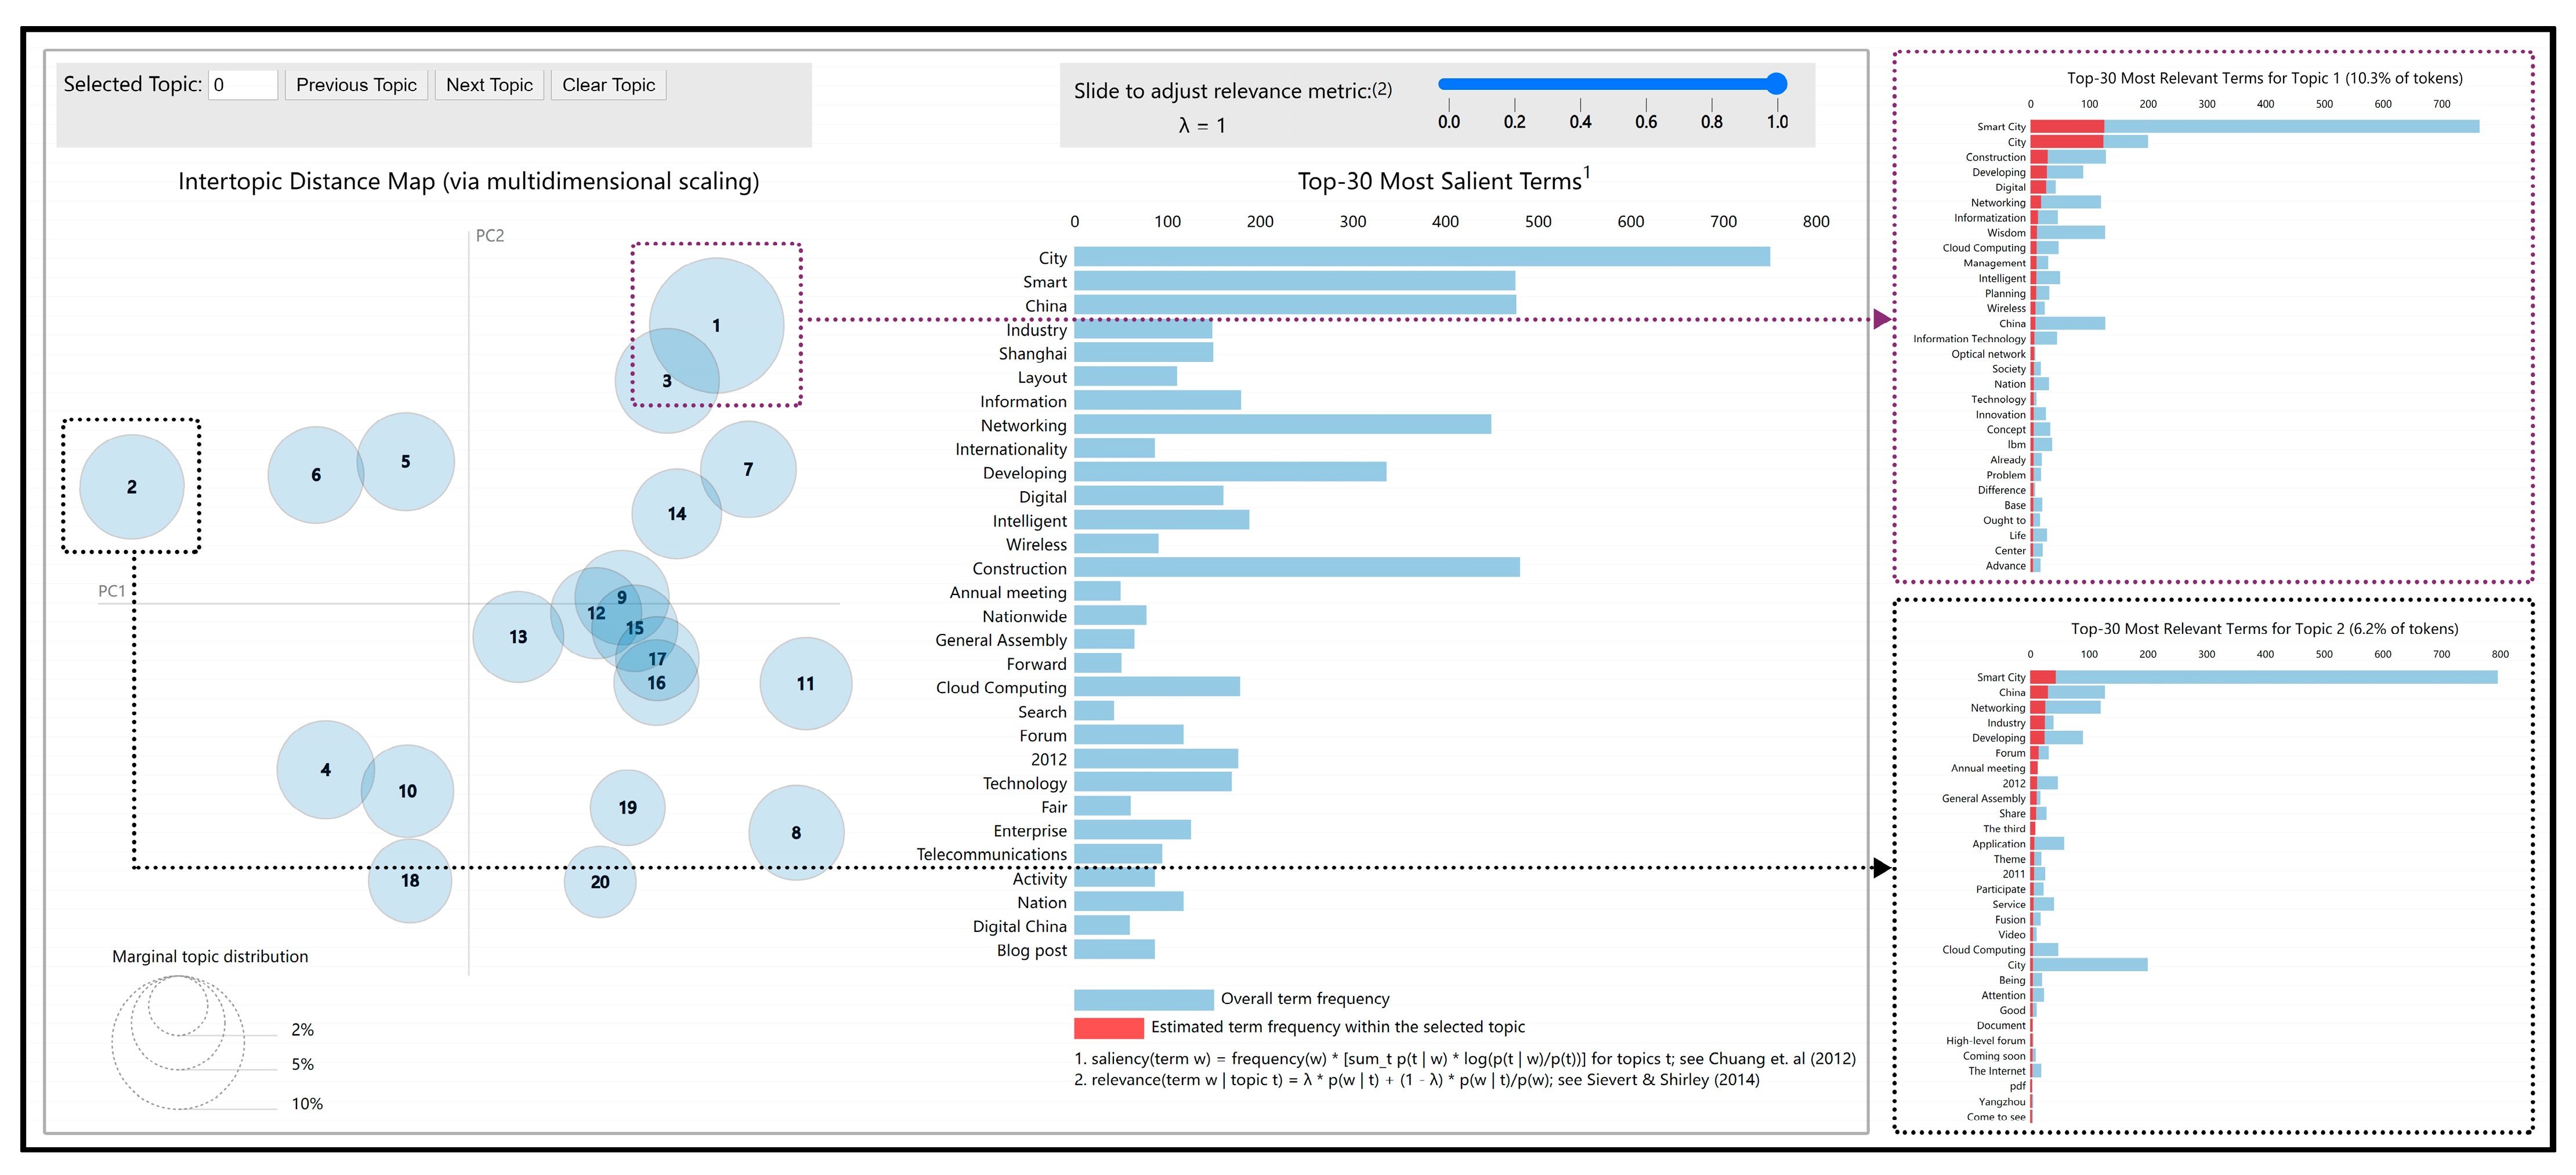
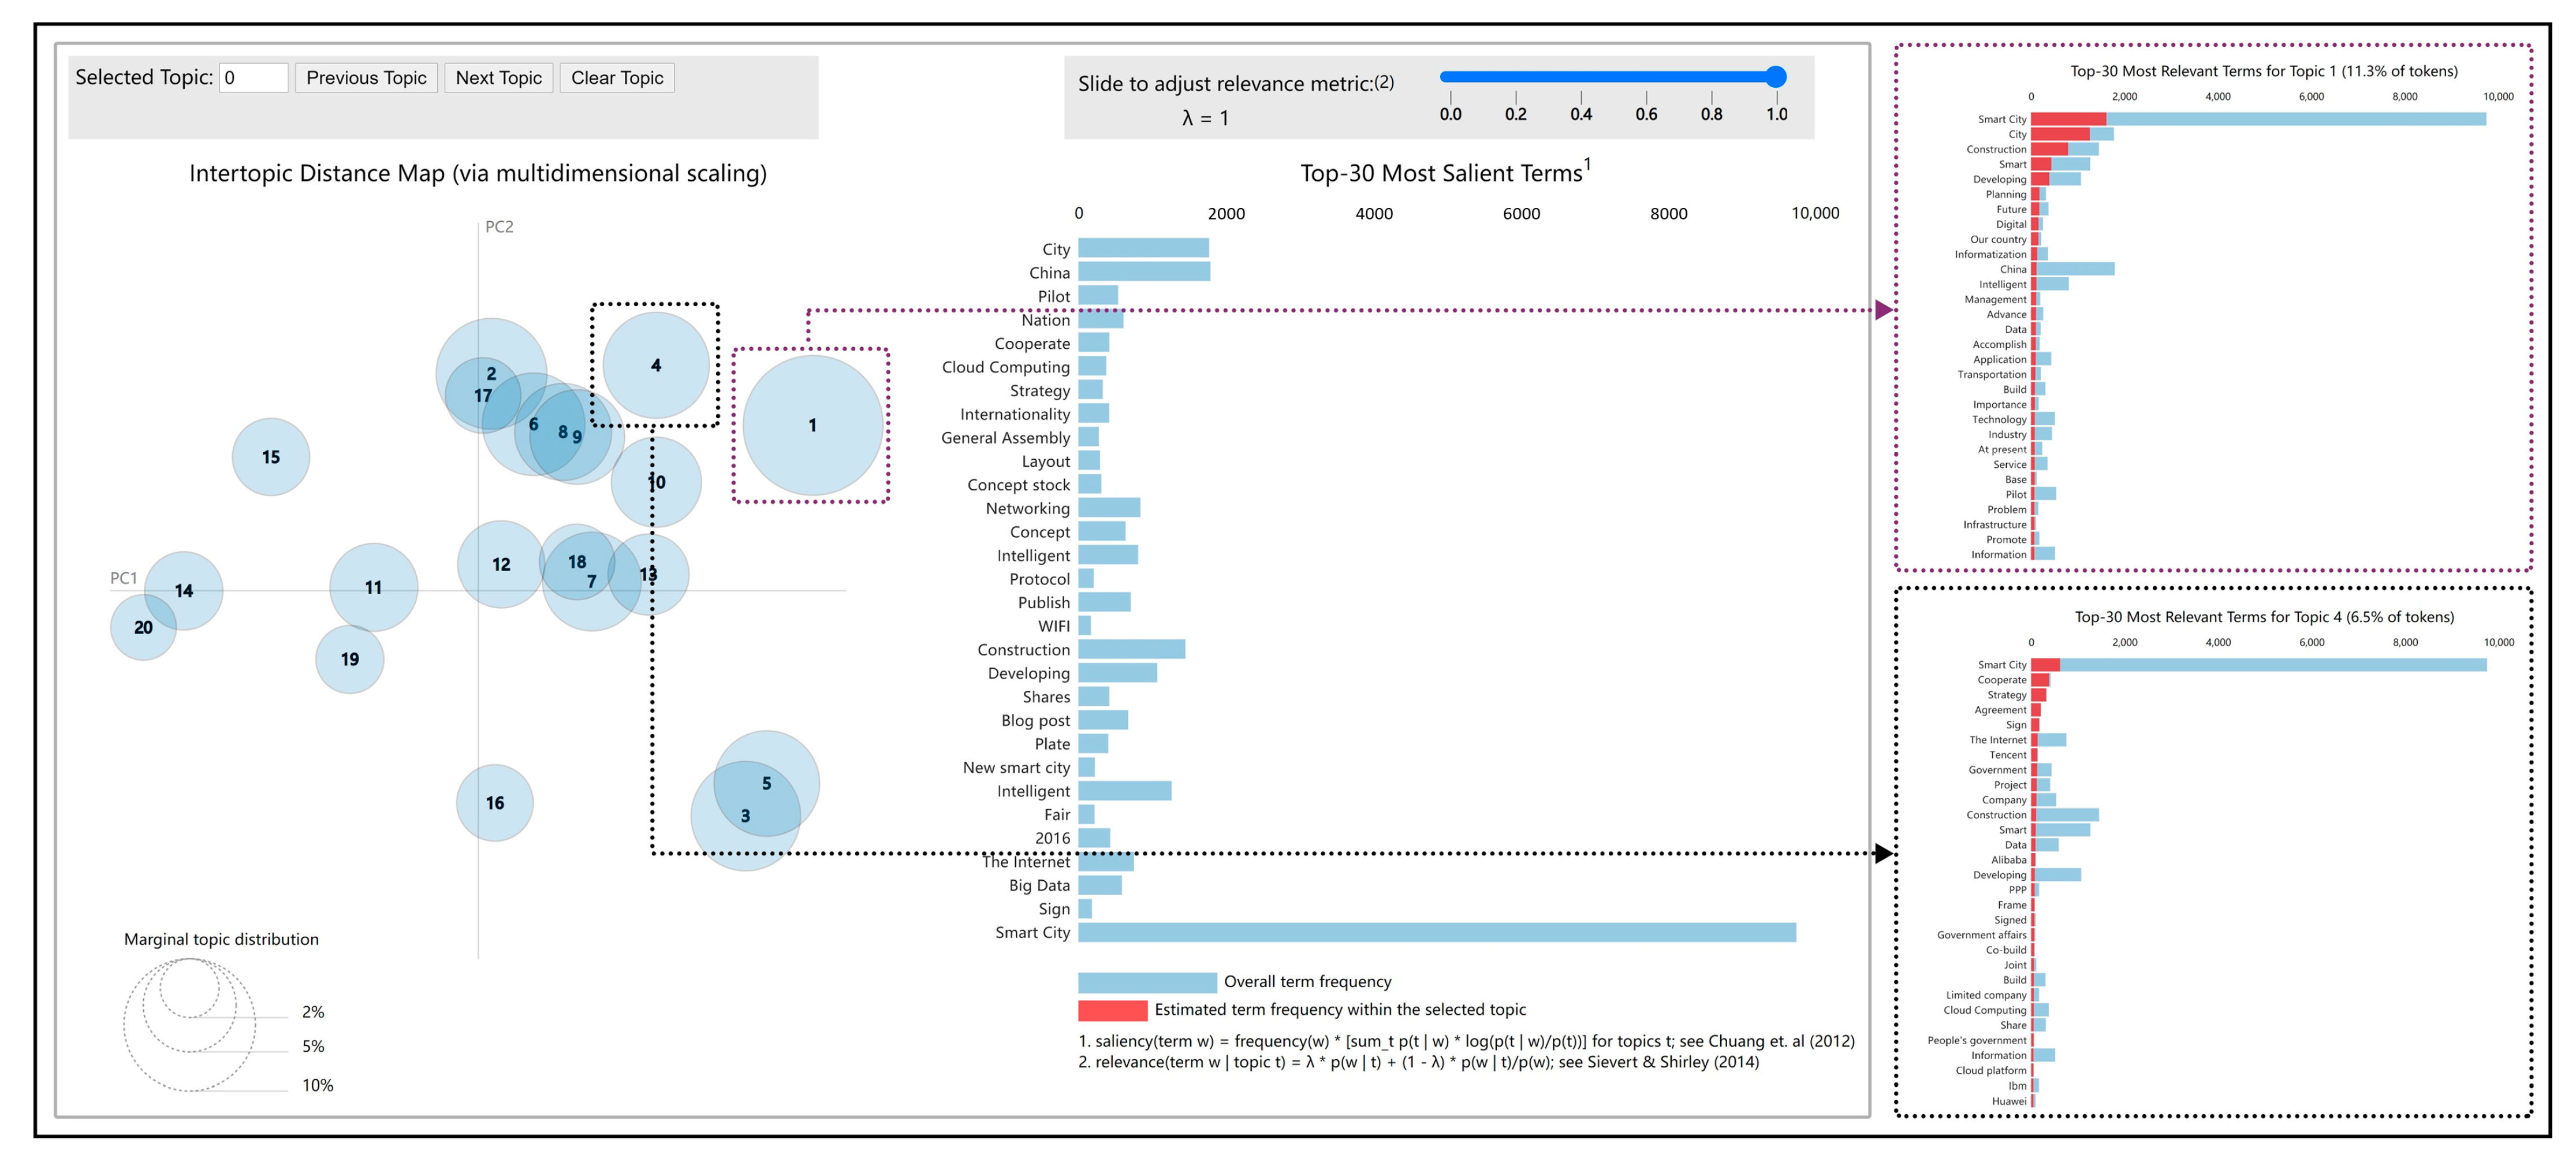
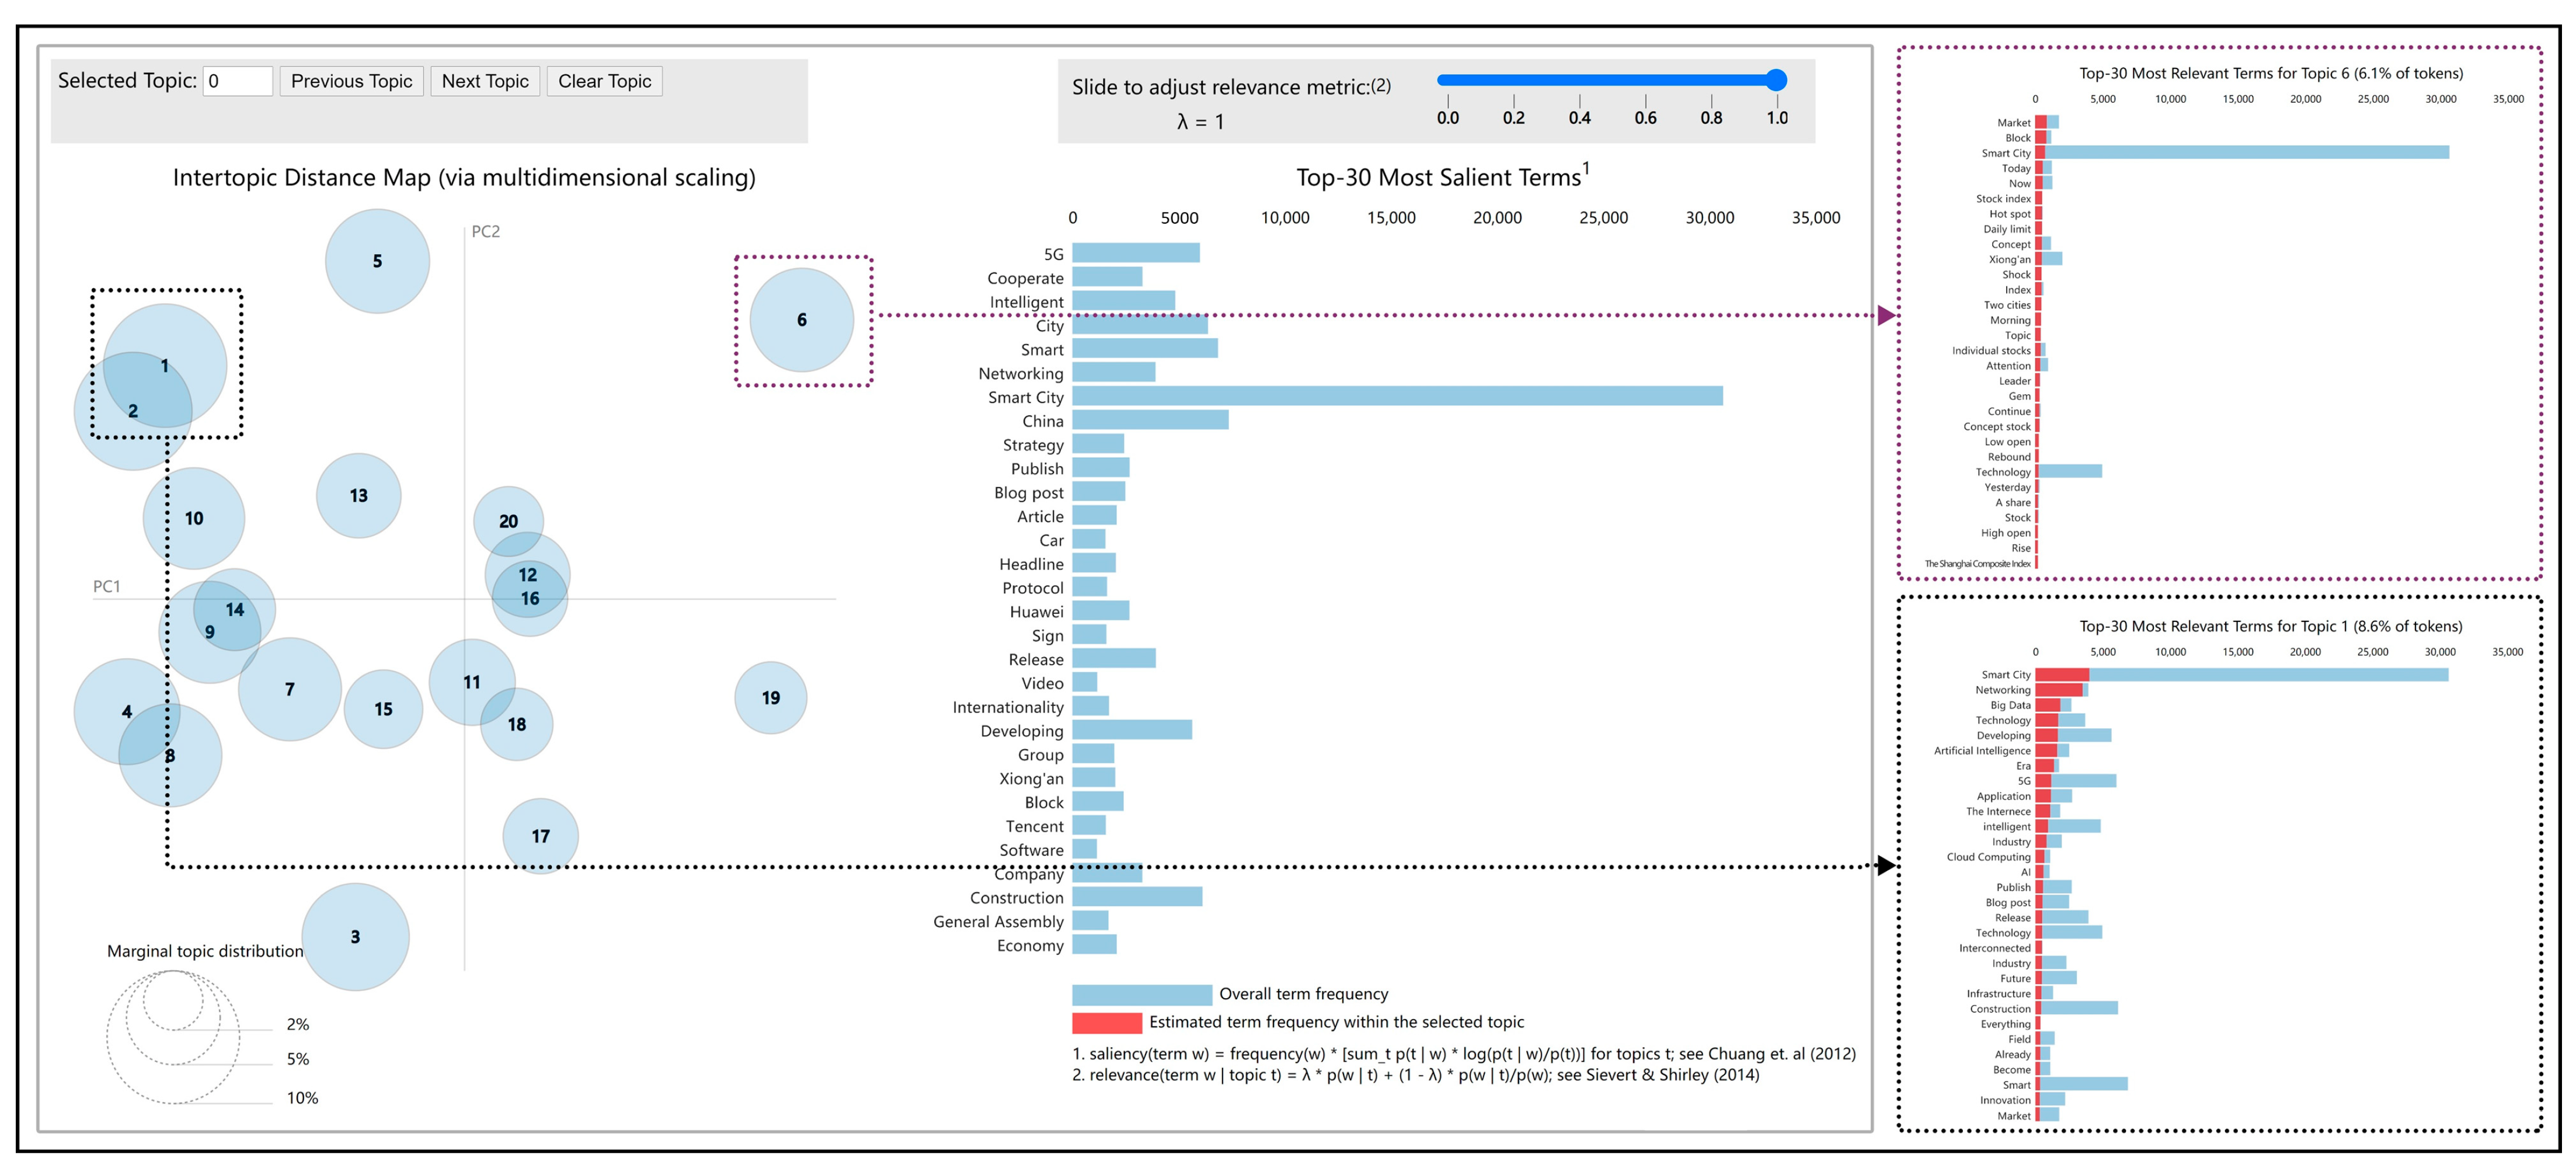
LDA. LDA is a three-level Bayesian probabilistic graphical model developed by the Blei research team [43]. Its composition structure includes three granularities of the document, topic, and word. The model can mine the latent topic information in the document set or corpus, and use the bag of words to build the model, which constitutes the “document-topic/word distribution” without considering the order in which the words appear [44]. For online public opinion topic events in the big data environment, the LDA model can assist in the text-based analysis processes, such as potential topic identification and user clustering [45]. The research is based on the obtained comment data from Sina Weibo using the LDA topic model, the research preliminarily extracts the public’s cognitive topics, and summarizes the distribution of the public’s cognitive topics for smart cities to summarize and analyze the public’s cognitive status of smart cities. In addition, based on the subject headings obtained by the LDA model, the research uses the pyLDAvis toolkit under Python to draw a visual map of the LDA topics to analyze the correlation between research topics and to identify the core and secondary research topics [46,47].
(2)
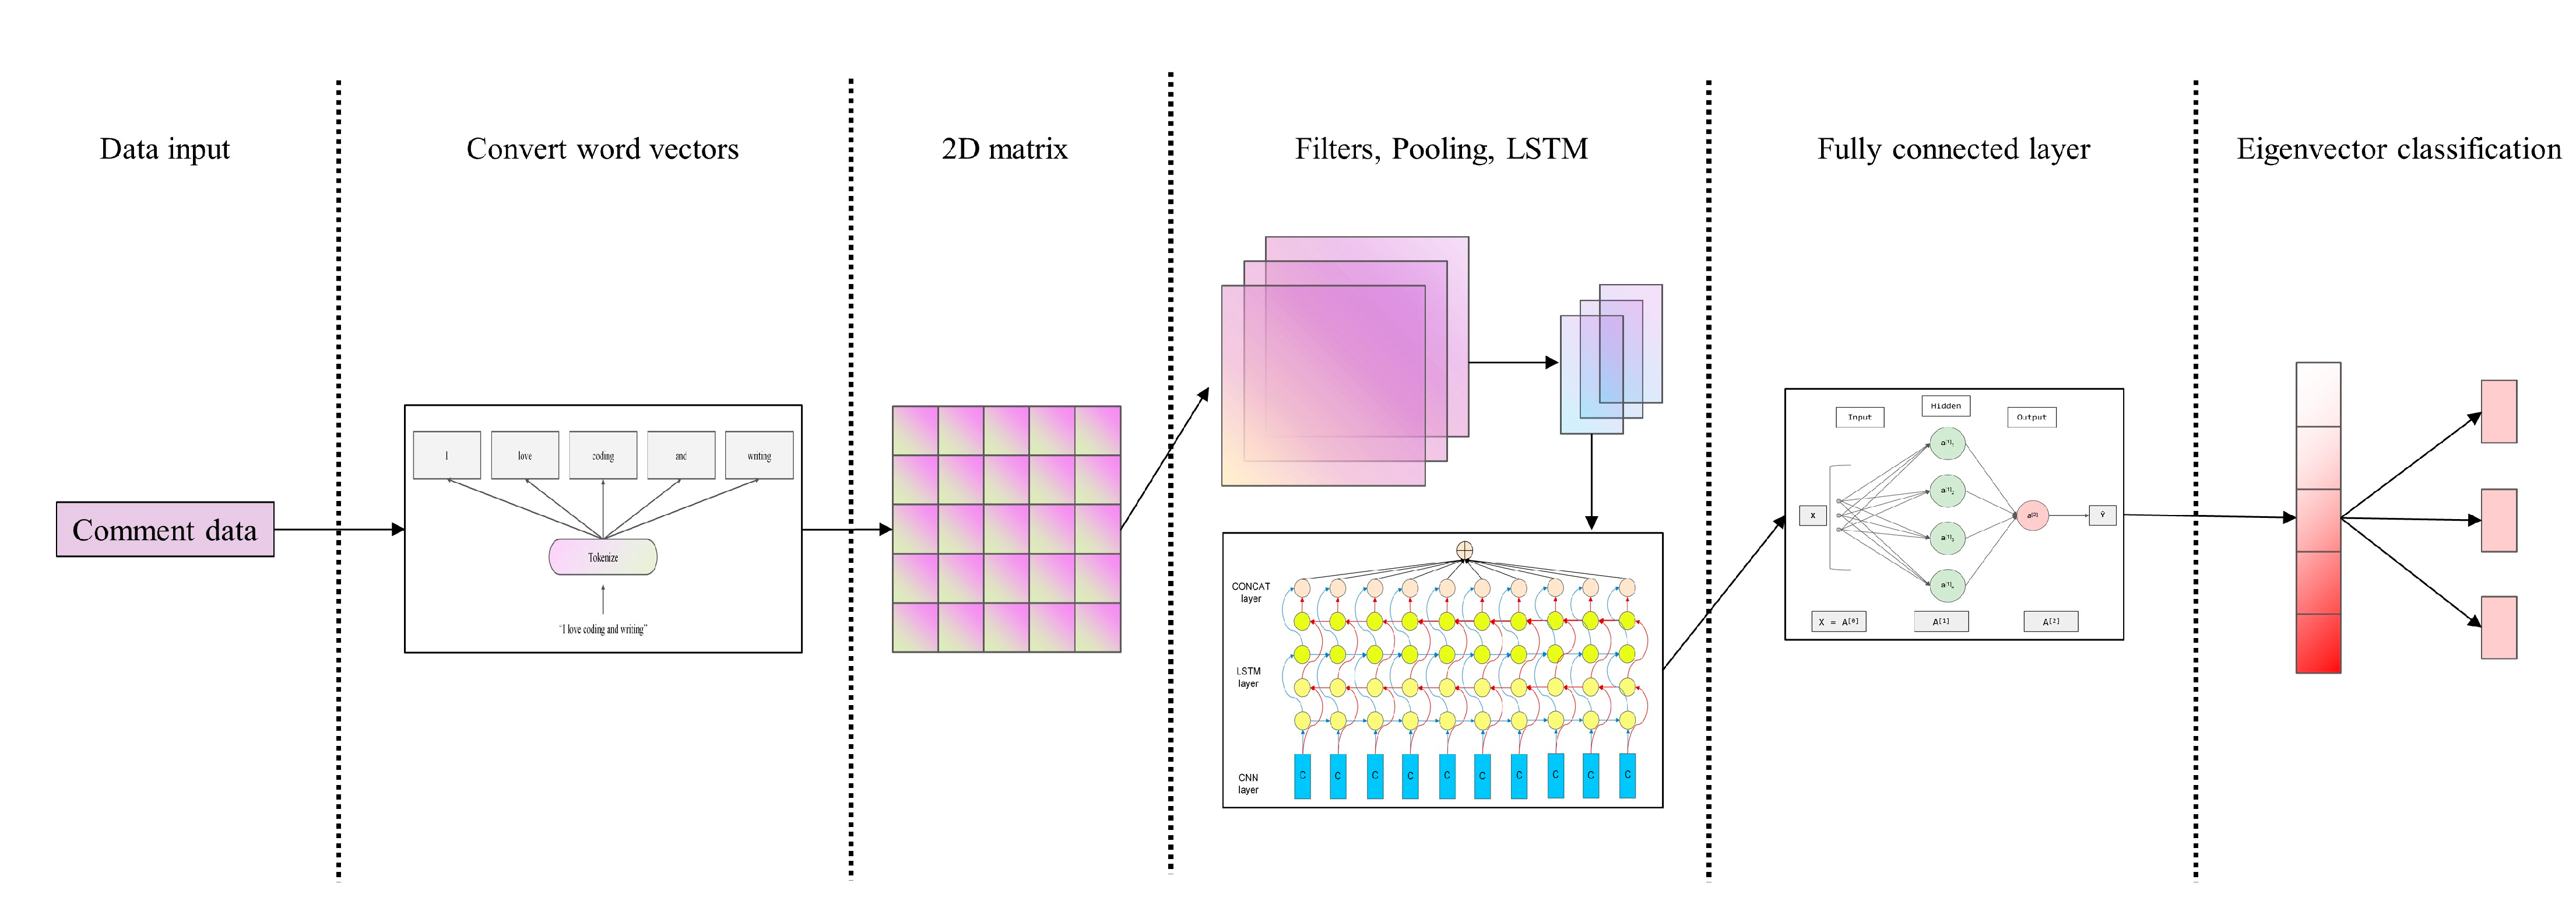
CNN-BiLSTM. As a deep neural network classification model commonly used in large-scale Internet corpus and natural language processing algorithms, the LSTM model is particularly suitable for modeling time series data because of its characteristics [48,49]. It can capture longer-distance dependencies to associate words in context, but unidirectional LSTMs fail to encode back-to-front information when dealing with finer-grained classification tasks. In this paper, the forward and backward LSTMs are combined to form a bidirectional long short-term memory recurrent neural network (Bi-LSTM), which can better capture bidirectional semantic dependencies [50]. However, using this model directly may result in an excessive computational overhead because of the high input dimensionality. Therefore, this paper considers using a CNN to reduce the dimension of the word vector matrix formed by the original data, and integrates the BiLSTM model for sentiment analysis, thereby improving the operating efficiency and prediction accuracy of the model [51]. The model construction sequence is as follows: text data input, word vector representation, mapping into a two-dimensional matrix, architecture layer (including filter, pooling layer, etc.), fully connected layer, and feature vector representation and classification. The output of each layer is the input to the next layer. Specifically, Word2Vec is used to train the comment data, and the obtained word vector matrix is used as the input of the convolution layer. The convolution layer uses the filter to perform the convolution operation on the word vector matrix of the comment data to generate a feature map. The feature map is sampled, and the most important features in the map are extracted and passed to the fully connected layer. Finally, the fully connected layer obtains the sentiment polarity of comments through the SoftMax function and outputs the final classification result of the sentiment tendency of Weibo comments [50]. The specific model architecture is shown in Figure 2.

3.3.3. Model Evaluation

This paper evaluates the reliability of the LDA model and the CNN-BiLSTM model through evaluation indicators such as Perplexity (perplexity), accuracy rate P (Precision), recall rate R (Recall), and F-value (F-value) to verify the reliability of the above models. Among them, the perplexity evaluation index is often used to measure the pros and cons of a probability distribution or a probability model to predict the sample and can be used to adjust the number of topics to determine the optimal number of topics in the LDA model [44]. The other three indicators are used to evaluate the running results of the CNN-BiLSTM model [52].

4. Results

4.1. Descriptive Statistics

4.1.1. Analysis of Narrative Subject of “Smart City”

The statistics of users who posted on the topic of “smart city” based on the obtained samples showed that 230,726 pieces of valid data were sent by a total of 70,539 accounts, with an average of 3.27 Weibo posts per account. Among them, there are 29,963 official Weibo users, with an average of 4.72 Weibo posts per account, and 40,576 non-Weibo official users, with an average of 2.00 posts per account. Among them, there are 15,690 Weibo personally authenticated users, with an average of 2.86 posts per account. In terms of the number of postings, Weibo official certified users posted 141,361 blog posts, accounting for 61.27% of the total sample, while non-Weibo official users posted 86,511 blog posts, accounting for 38.73%. These perceptions reflect the current state of public attitudes and perceptions more objectively and pertinently toward smart cities, the study used data from 86,511 posts made by Unofficial certified users as research samples for theme mining and sentiment analysis. The distribution of users is shown in Table 1.

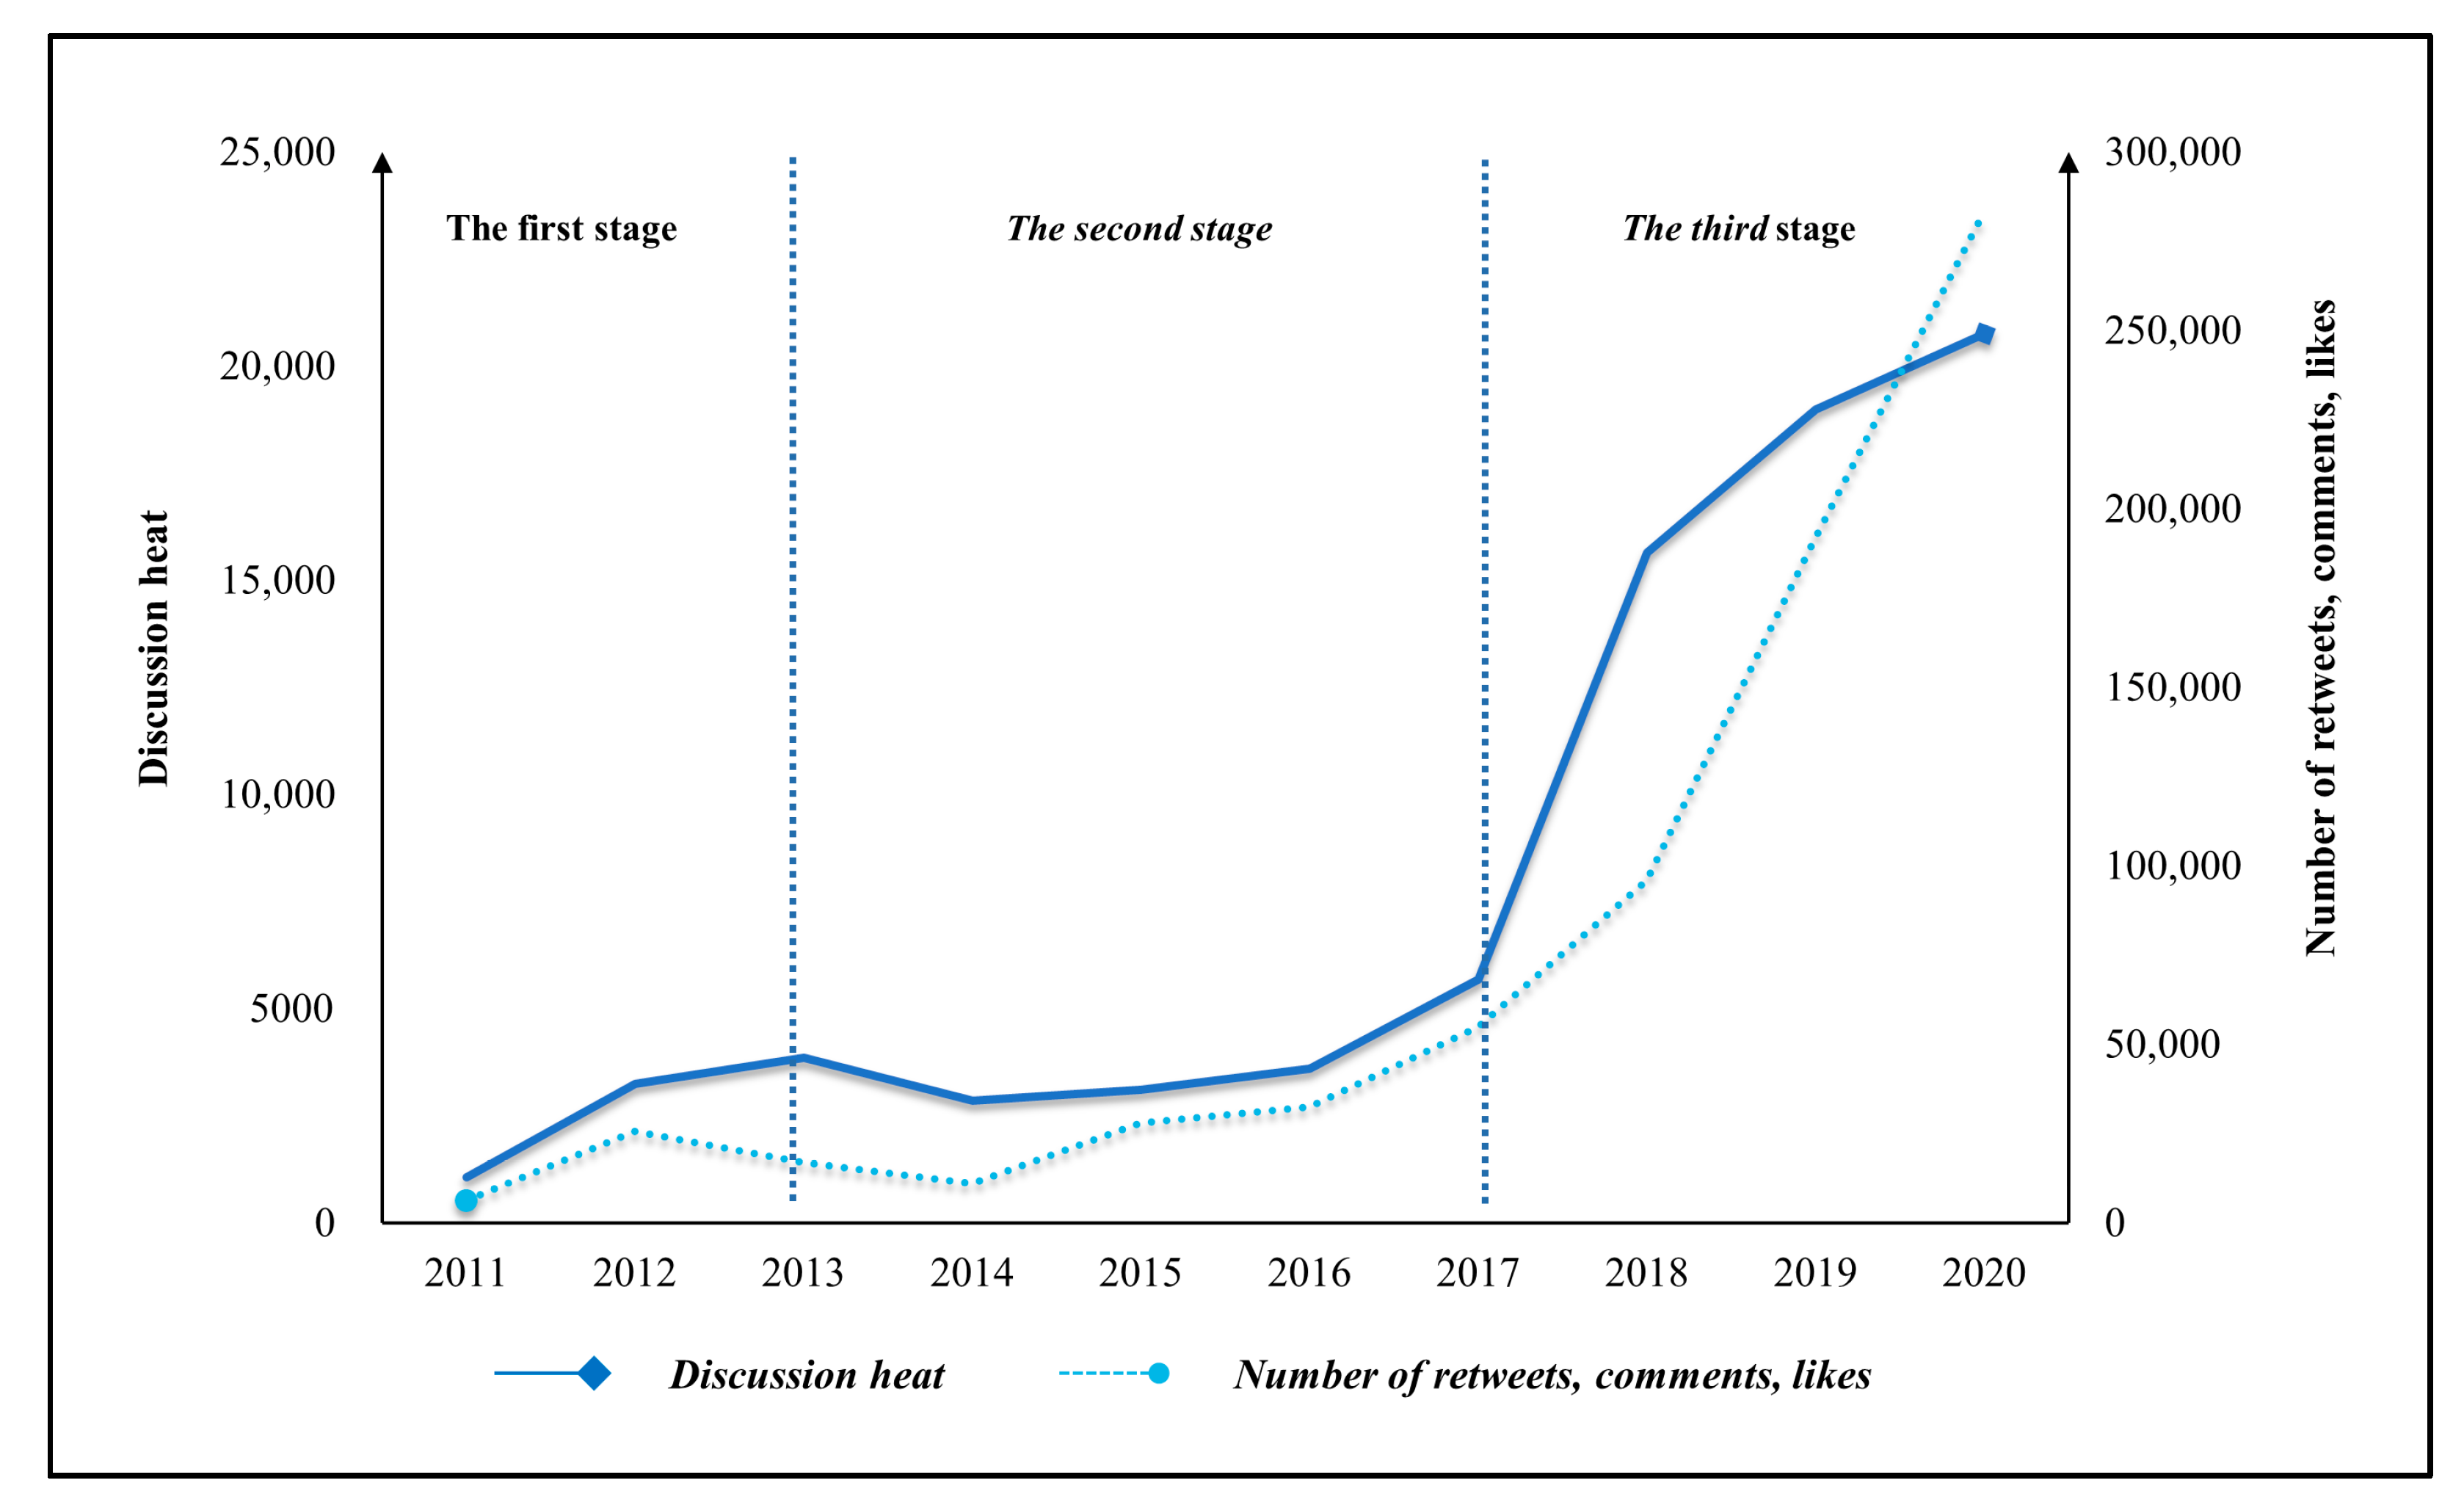
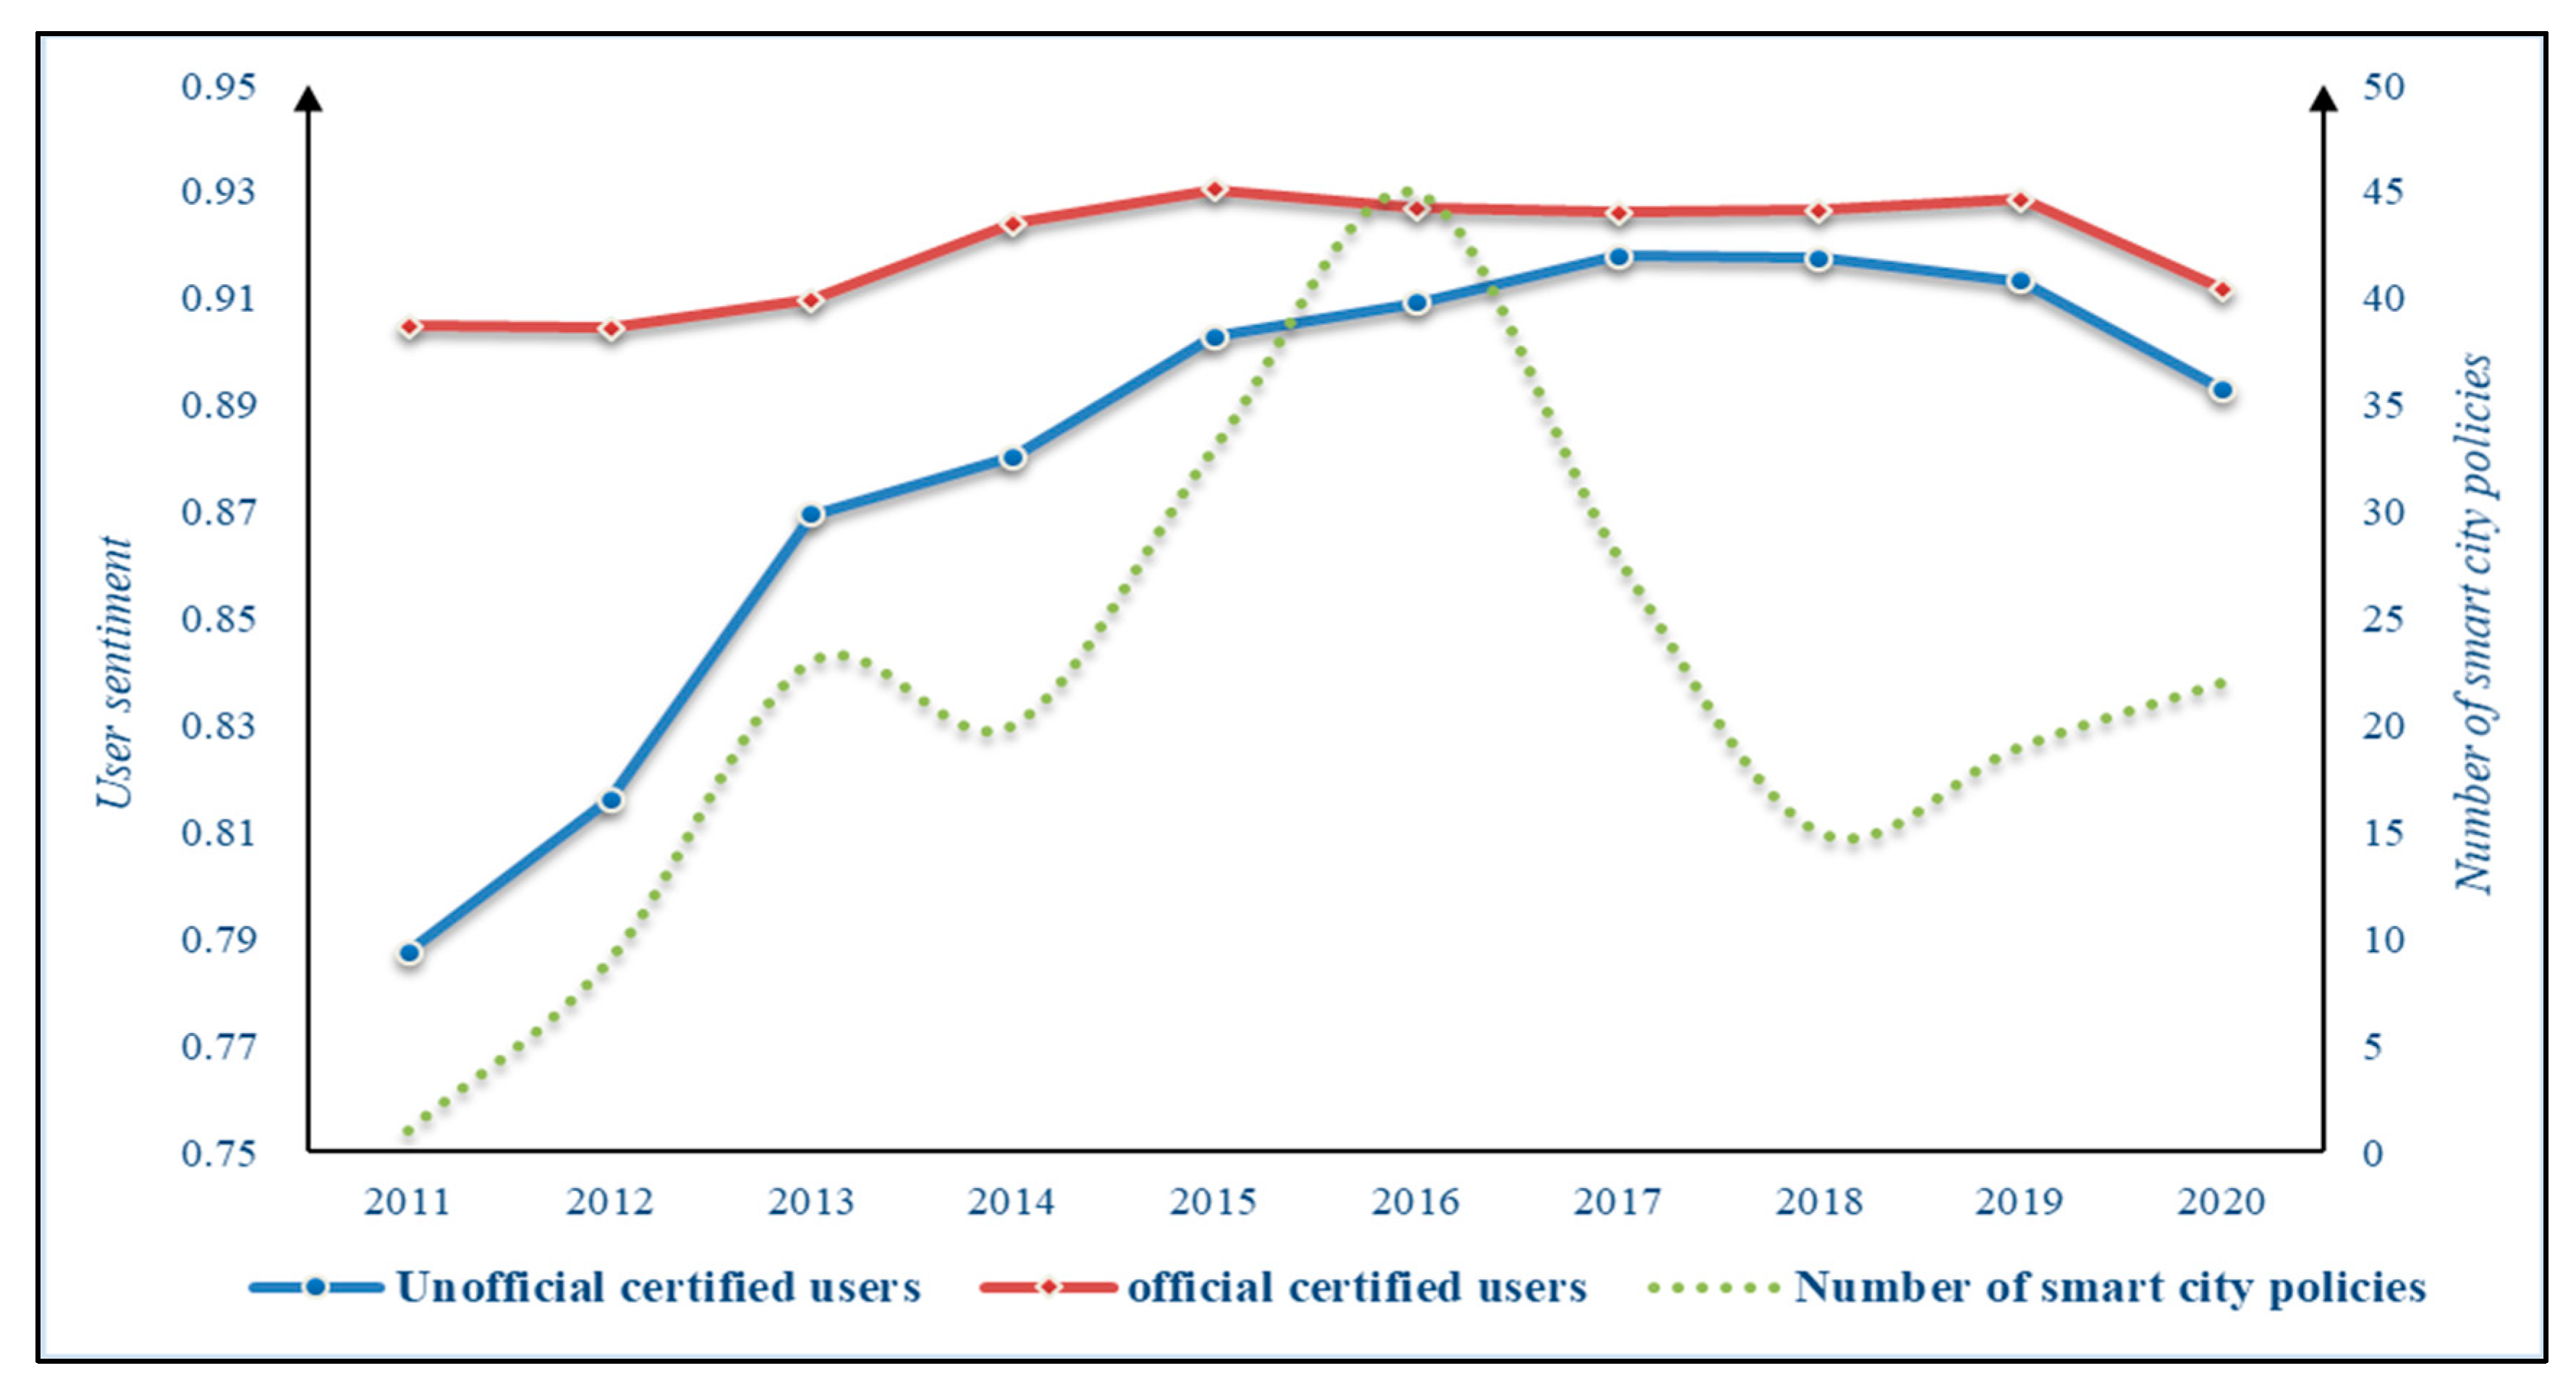
4.1.2. Evolution Trend of Public Opinion on the Topic of “Smart City”
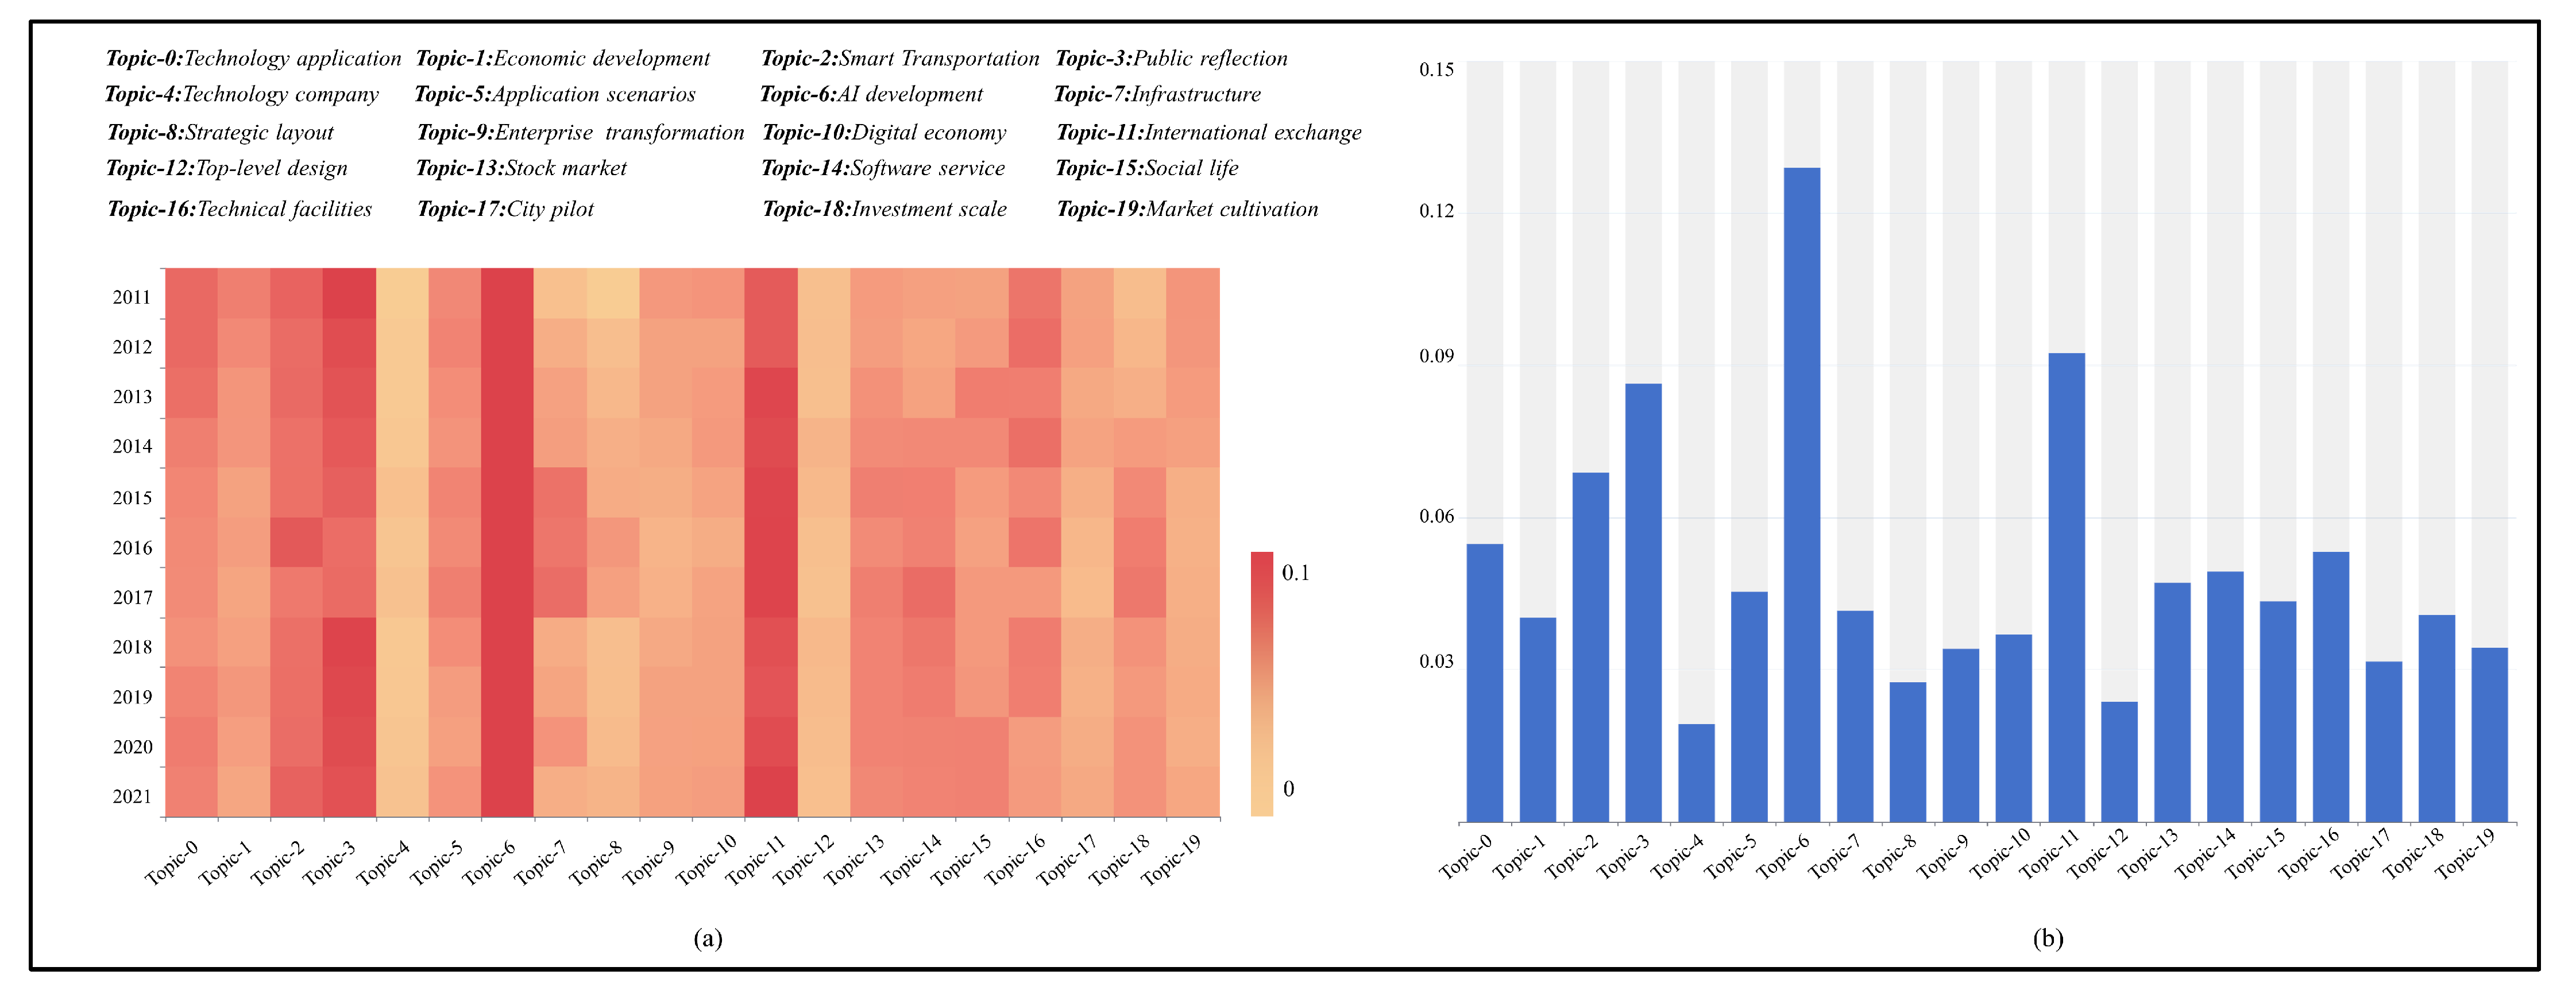
According to the division method of the evolution cycle of public opinion, the discussion heat and the number of likes and comments on the topic of “smart city” are summarized and counted, and the evolution trend of public opinion heat on the topic of “smart city” is divided into stages according to the corresponding data. The evolution trend of topic public opinion is shown in Figure 3.
Figure 3 shows the trend of the discussion on the topic of “smart city” on Sina Weibo and the changes in the number of likes and comments are generally similar. The public opinion cycle can be divided into three stages according to the development of public opinion. In the first stage (2011–2013), 2011 was the initial discussion stage on Sina Weibo about the topic of “smart city.” from 2011 to 2013, the discussion of related topics exploded and reached a peak for the first time in 2013, followed by a gradual oscillation stage of topic heat. The topic of “smart city” has been noticed by the public for the first time and aroused heated discussions, and the amount of discussion gradually increased. With the development of the expansion of the scope of public participation, the audience of the topic differed in terms of environment, identity background, intellectual level, etc. There are also different interpretations of the information on “smart cities” [25]. In the second phase (2014–2017), public discussion about smart cities fluctuated since 2013, and in 2017, the discussion heat rose to about 5000, with more than 50,000 comments and likes. However, public attention is limited at this stage, and the popularity of public opinion fluctuates slightly and remains at a relatively low level. In the third stage, with the government’s increasing emphasis on the concept of smart city, the central ministries and commissions issued nearly 100 policy documents related to the smart city around 2016, which raised the public awareness of the concept of smart city [53,54]. The discussion heat on the topic of “smart cities” exploded in 2018, the topic was discussed with more than 20,000 heat and nearly 300,000 comments and likes. The demand for knowledge and information has led to a rapid increase in public discussions on the topic of “smart cities.” To sum up, the distribution of public opinion hotspots in the time series reflects the logic of the public’s psychological demand for smart cities, that is, from the early pursuit of the novelty of smart cities to the confusion and doubts on some practices in the promotion and construction of smart cities. Finally, with the policy-driven and successive application, the concept of “smart city” has gradually been recognized and accepted by the public.

4.2. Topic Mining

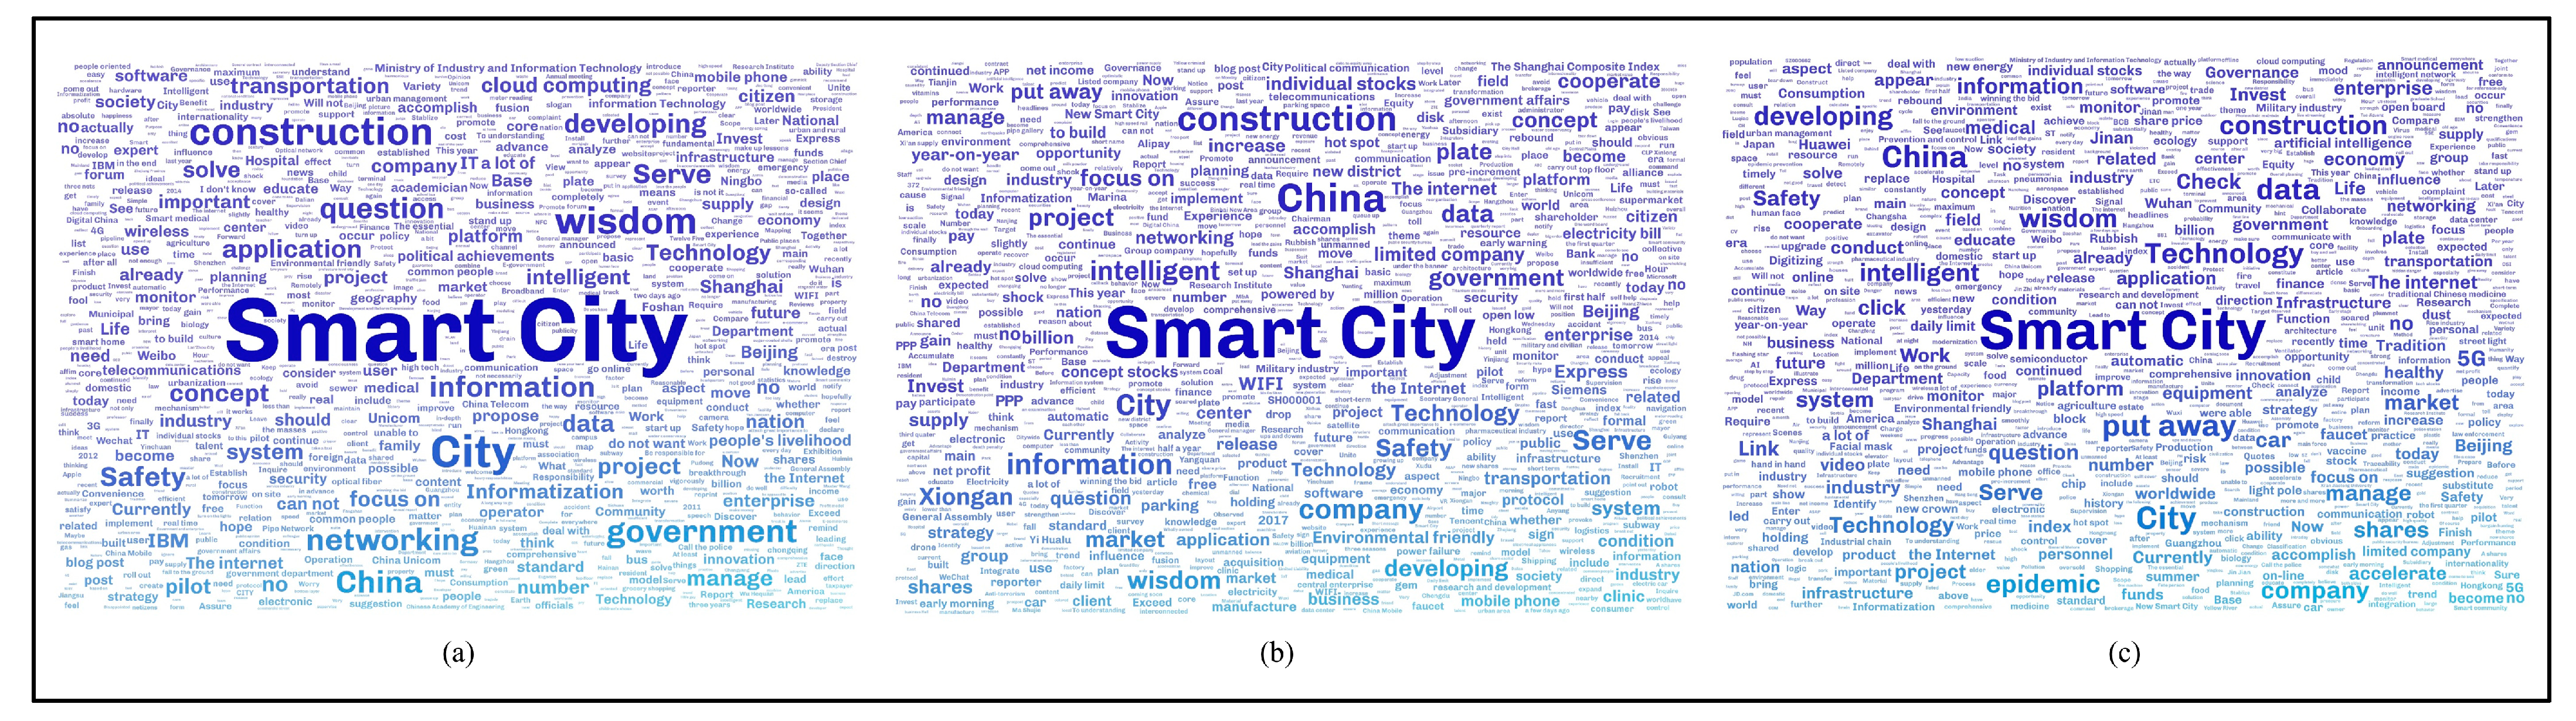
4.2.1. Theme Overview

The topic recognition of smart city public cognition is based on the clustering results of the LDA model. After data preprocessing, this paper uses the LDA topic model to classify and train the preprocessed texts and draws up the classification within the interval. Integer is used as the number of candidate topics. The logarithmic perplexity values of different models are obtained by using the Log Perplexity method in the LDA model [55]. In the final study, according to Occam’s razor criterion, this paper intends to select 20 potential topics as the number of topics to be extracted from the public perception of smart cities. The partial results of the 20 topic words extracted by the model are shown in Table 2, and the top 10 topic feature words are selected for each topic. According to the characteristic words contained in each topic, the meanings of some topics are summarized as follows: Topic #0: emphasizes the public’s emphasis on the application of new technologies and service intelligence in the construction of smart cities; Topic #1: emphasizes the public’s interest in the development of smart cities construction process and emphasis on the industry-driven level; Topic #2: emphasizes the public’s attention to the future intelligent life model in the smart city represented by intelligent driving; Topic #3: reflects the public’s interest in smart city technology-related information companies; Topic #4: reflects the public’s concern about technology companies in the construction of smart cities; Topic #5: reflects the public’s concern about the application scenarios in the construction of smart cities; Topic #6: reflects the public’s concern about artificial intelligence technology in the construction of smart cities; Topic #7: reflects the public’s concern about information infrastructure in the construction of smart cities; Topic #8: reflects the public’s concern about the strategic layout of smart city construction; Topic #9: reflects on the public’s concern about the digital transformation of enterprises in the context of smart city construction; Topic#10: reflects the public’s concern about the digital transformation of enterprises in the context of smart city construction; Topic#11: reflects on the public’s concern about the digital industry economy in the context of smart city construction; Topic#12: reflects the public’s concern about international experience exchange in the context of smart city construction; Topic#13: reflects the public’s concern about the stock market in the process of smart city construction; Topic#14: reflects the public’s concern about the software service in the construction of smart cities; Topic#15: reflects the public’s concern about social livelihood in the context of smart city construction; Topic#16: reflects the public’s concern about the technical facilities in the construction of smart cities; Topic#17: reflects the public’s concern about pilot cities in the process of smart city construction; Topic#18: reflects the public’s concern about the scale of investment in the construction of smart cities; Topic#19: reflects the public’s concern about the market cultivation of smart city construction. Therefore, the study named Topic#0–Topic#19 according to the obtained topic features words in the order of: technology application, economic development, smart transportation, public reflection, a technology company, application scenario, AI development, infrastructure, strategic layout, enterprise digital transformation, digital industry economy, international exchanges, top-level design, stock market, software services, social livelihood, technical facilities, urban pilot projects, investment scale, and market cultivation.
This paper calculates the average of all the theme probabilities based on the document-topic distribution, and the results are shown in Figure 4. Figure 4a shows the heat map of theme intensity, and Topic #6 (AI development) and Topic #11 (International exchange) both maintain high-intensity values for 2011–2021. The development of AI and the comparison and exchange with other countries’ smart city construction have been topics of more public concern in the process of smart city construction. In addition, the intensity values of Topic #3 (Public reflection) and Topic #2 (Smart transportation) are also at a high level. The intensity values of Topic #12 (Top-level design) and Topic #4 (Technology company) are low, which also indicates that the public is not active in discussing topics, such as government policy planning about smart cities and information technology companies, and from the side, it can also reflect the lack of government efforts to promote and publicize policies related to smart cities. The study compared the average intensity value of each topic for 2011–2021 to compare the intensity level of each topic more intuitively and the ranking results are shown in Figure 4b. The horizontal axis is the topic category and the vertical axis is the probability value. Among them, Topic #6 (Artificial Intelligence development) has the highest average probability, followed by Topic #11 (International exchange), and Topic #3 (Smart transportation). Topics with lower probability values are Topic #4 (Technology company), Topic #12 (Top-level Design), and Topic #8 (Strategic layout).

4.2.2. Topic Identification and Stage Characteristics of Public Cognition under the Topic of “Smart City”

To better analyze the relationship between the LDA topics and the characteristics of topics in each stage, we used the results of the LDA topic identification in the previous step, and studied and constructed the low-dimensional spatial distribution of the LDA topics. The pyLDAvis toolkit under Python was used to draw the three-stage Interactive LDA topic visualization map to discover the core topics of the public perception of “smart city” in various periods on the Sina Weibo platform. The results are shown in Figure 5, Figure 6 and Figure 7.
Figure 5, Figure 6 and Figure 7 show the 20 circles on the left side of the figure representing the 20 topics obtained by the LDA model, and the histograms on the right side that represent the 30 most important keywords in each topic. The area of the circle represents the relative dominance of each topic, and the distance between the circles represents the degree of correlation between the identified topics. When the distance between the circles is too close or overlapping, it can be regarded as a relatively similar topic [46], and the two histograms on the far right side of the upper and lower distributions show the keywords of the two topics. Based on these data, a brief analysis of the public perception of the topic of “smart city” in different periods can be made.
As shown in Figure 5, the distribution of topic words in the first stage is relatively dense, but the content of its discussions focuses mostly on topics such as urban development, networking, and optical fiber. Among them, the Topic #1 heading is in a relatively dominant position in the heading map. In addition to the macro-level discussions, such as smart city development, the public also involves digitization, informatization, cloud computing, and other technical concepts. The Topic #2 heading is in a relatively marginal position in the subject heading map, and it is not related closely to other topic headings. The content of the subject heading contains words such as “forum, conference, and annual meeting”, indicating that, as the concept of a smart city has just been introduced into China, many public discussions on the concept are mostly through various channels, such as academic conferences, corporate, or government forums [11]. As shown in Figure 6, the distribution of subject headings in the second stage is relatively dense, but the Topic #1 heading in the core dominant position is relatively independent. The Topic #1 heading mainly discusses the content of smart city development planning, top-level layout planning, etc. In addition, the Topic #4 heading has a larger area of subject heading nodes, which involves mainly the discussion of “strategic cooperation, agreement signing, government-enterprise cooperation, and PPP model”. Overall, at this stage, the public has carried out a more in-depth discussion on the construction of smart cities, which specifically involves the multi-stakeholders, cooperation strategies, and cooperation models of smart city construction. This change also reflects that, with the deepening of the dissemination of the smart city concept and the popularization and promotion of related policies, the depth and breadth of the public’s awareness of the smart city concept have been improved continuously. As shown in Figure 7, different from the concentrated discussion of topics in the first two stages, the distribution of topic words in the third stage is relatively independent, and the number of topics is distributed more evenly. Discussions during this period focused on topics such as 5G, cooperation, and construction. Among them, the topic word nodes with a larger area in the graph are the #1 and #2 topic words, and the two nodes have partial overlap, which reflects the similarity of the content contained in the two nodes. The content of the Topic #1 heading focuses on the application and development of technologies, such as big data, artificial intelligence (AI), and cloud computing. This phenomenon shows that after the concept of the smart city matured and entered the public’s daily cognition, most of the public realized that the ubiquity of smart city profoundly affects their daily life and future technological development [56,57]. Therefore, many keywords on the core technology level of smart cities have gradually emerged in this stage of discussion, which in turn leads to different opinions and tendencies of the public on technology applications and data security.

4.3. Sentiment Analysis

The CNN-BiLSTM model needs to be pretrained based on training samples to build a classification model [50]. We selected the comment data from 2011 to 2012 in our sample set and annotated the sentiment polarity of the comment text by manual annotation. The research selected two doctoral and masters students in the field of smart city research, and one masters student who majored in information science. Students annotated and compound emotional memories, judged emotional tendencies (positive, negative, and neutral), and finally formed a training sample set [58]. Then, after hyperparameter adjustment and multiple rounds of training, the Precision, Recall, and F1 factor of the CNN-BiLSTM model were 94.19%, 89.36%, and 91.71%, respectively, indicating that the model can accurately predict the text sentiment tendency. Some data samples are shown in Table 3.

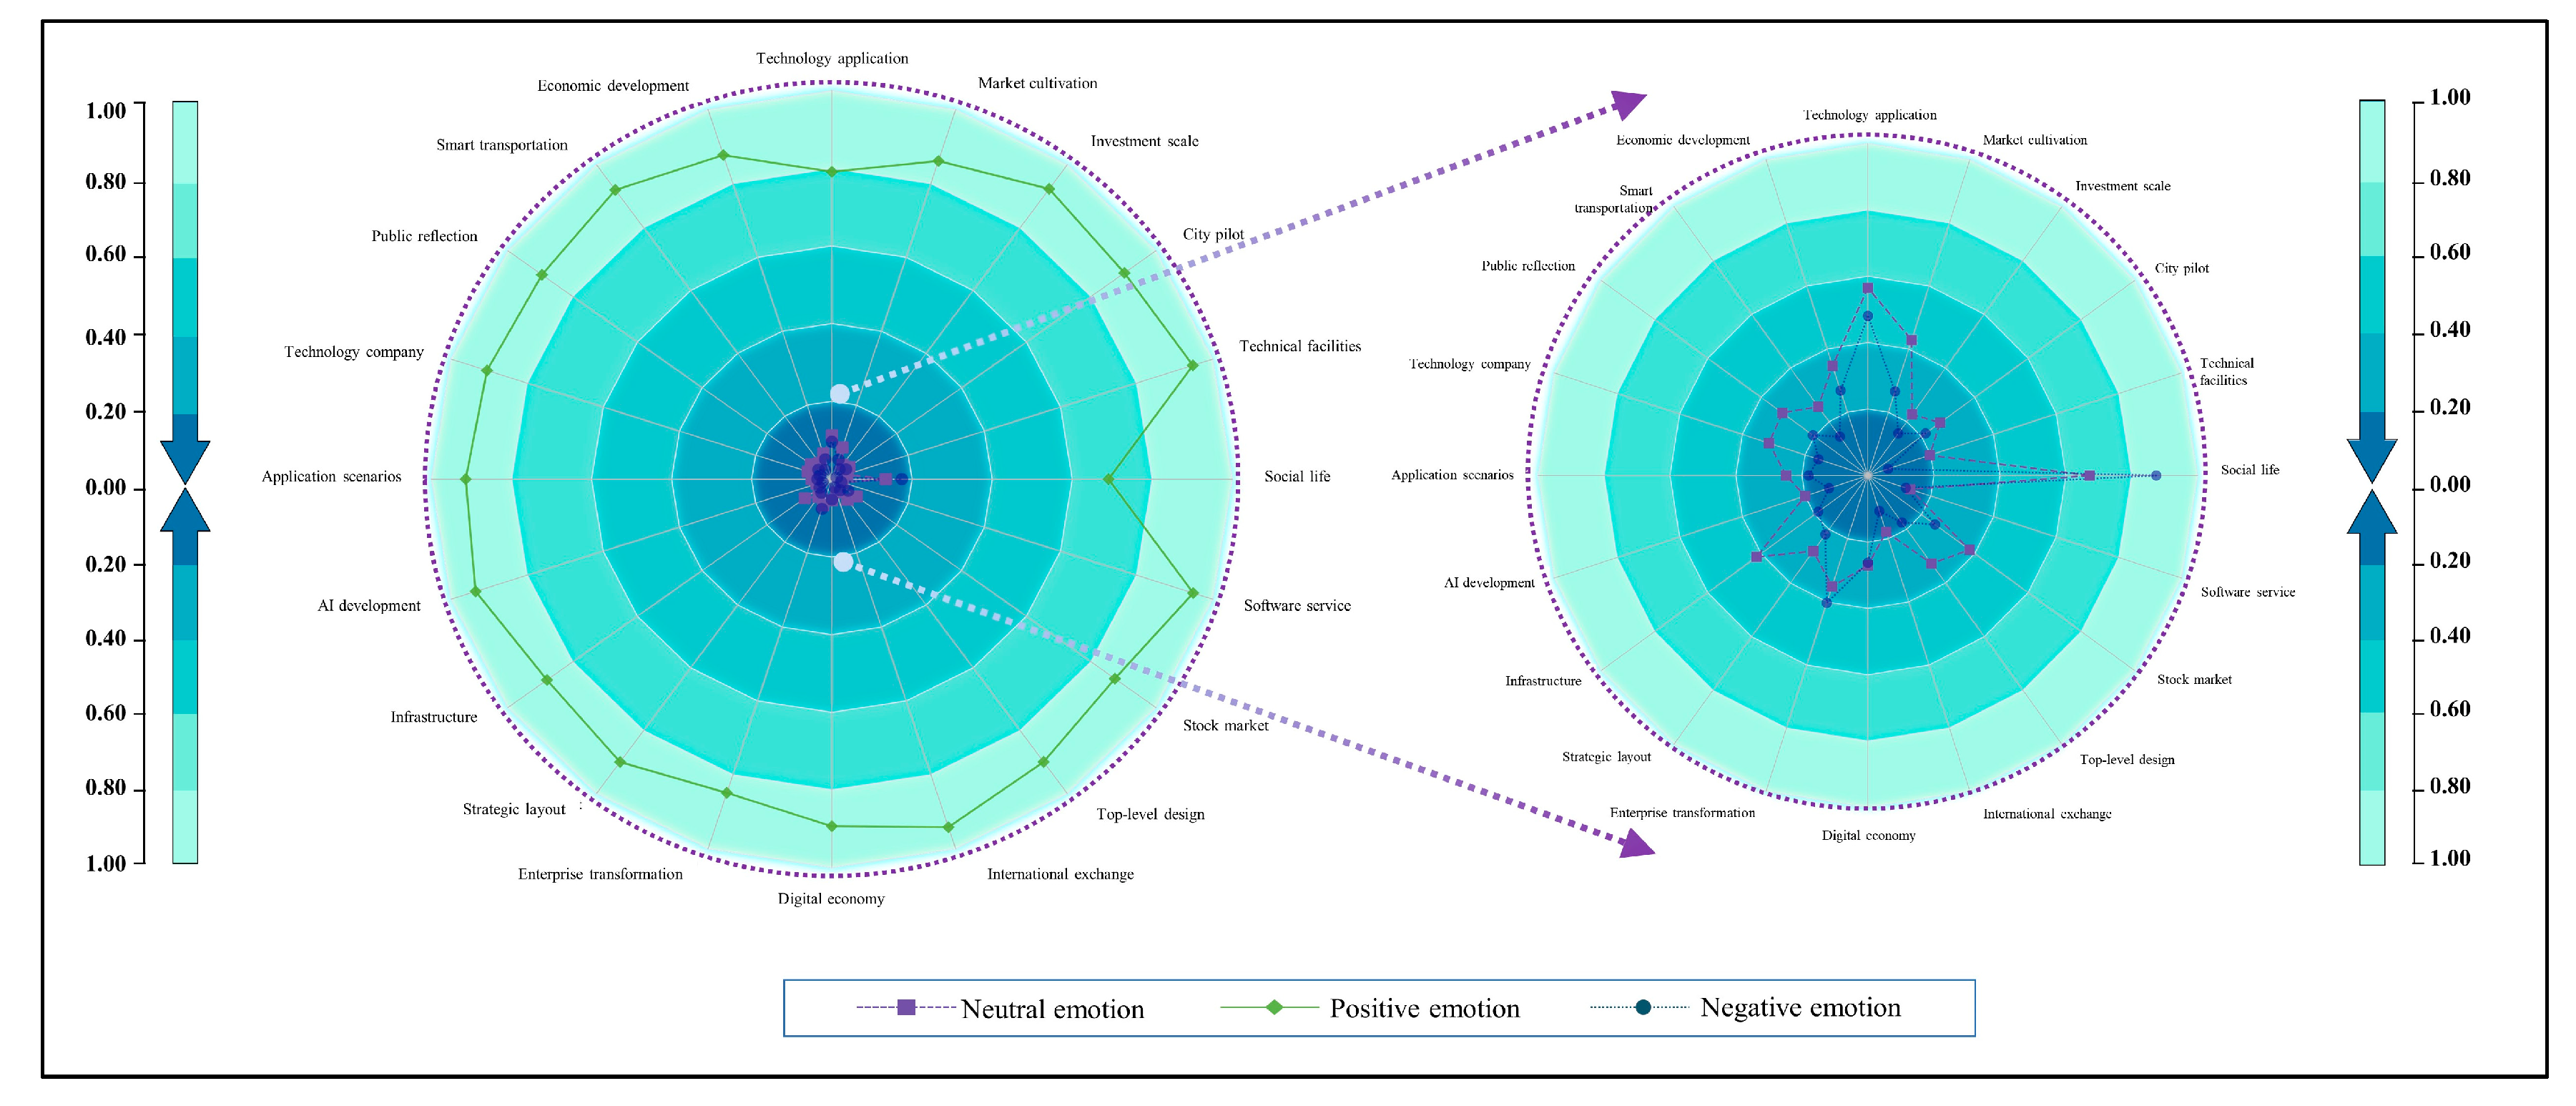
4.3.1. Topic Sentiment Polarity Distribution

The study uses the CNN-BiLSTM model to perform statistical analysis on the distribution of emotional tendencies of each topic based on the LDA topic mining results obtained above. The distribution of emotional tendencies of different topics and the proportion of emotional polarity of each topic are shown in Table 4 and Figure 8, respectively.
The above table shows that nearly 78,327 comments of the public on the discussion topics about smart cities on the Weibo platform showed positive emotions, accounting for 90.5% of the total sample. Neutral emotions accounted for 5.6% of the total sample. Negative emotions were the least, accounting for only 3.9%, indicating that the general public has an optimistic attitude towards the perception of smart cities and the development of the concept. Specific to the emotional polarity distribution of each topic, the development of artificial intelligence and international exchanges have the largest number of related comments and show larger-scale positive emotions. However, it is worth noting that among the topics with negative emotional polarity, the number of comments with negative emotions in Topic #0 technology applications is higher, second only to the development of AI. Studies have shown that an individual’s emotional state arises from their cognition and attribution of the external environment. To a certain extent, this result shows that the public still has many doubts about the application of technology in smart cities. It is urgent to carry out popular science publicity and corresponding government measures [59].
To see the distribution of sentiment polarity in each topic more intuitively, the research summarizes the distribution of sentiment polarity for each topic, as shown in Figure 8. From Figure 8, it can be found that the public’s perception of smart cities is generally dominated by positive emotions. In the distribution of emotional polarity corresponding to each theme, positive emotions have always maintained a high level of leadership, and the emotional polarity level fluctuates around 0.8. However, there are differences in the emotional tendencies of each topic. Based on the emotional scores of each topic, in the positive comments, intelligent transportation, AI development, international exchanges, software services, and infrastructure are the topics with higher positive scores. Among the negative comments, the negative comments focus mainly on the three themes of society and people’s livelihood, technology application, and the digital transformation of enterprises.

4.3.2. Evolution Analysis of Emotional Tendency of Different User Types

To compare the evolution trend of different types of users on the microblogging platform for the emotional polarity of smart cities, this research used the previous use of the CNN-BiLSTM model to accumulate the emotional value of each comment and calculate the average value to obtain the public’s perception of “smart city” in each year. In addition, to compare the emotional tendencies of different types of users on the topic of “smart city,” the study divided the obtained samples into Weibo official certified users and non-Weibo official certified users according to user types, namely, Weibo masters, Weibo members, and other types. The evolution trend of emotional tendencies of different types of users is shown in Figure 9.
Figure 9 shows that overall, the fluctuation trend of emotion values of different types of users is roughly the same, and the public’s perception of smart cities is generally dominated by positive emotions. Specifically, from 2011 to 2015, the positive emotional intensity of the public’s cognition of smart cities increased gradually, then leveled off at 0.9. After 2017, the positive emotional intensity value gradually decreased. According to the subdivision of the different types of user groups, the emotional tendencies of Weibo officially certified user groups on the topic of “smart city” have a greater positive emotional intensity, while the emotional intensity of non-Weibo officially certified users on the topic of “smart city” is somewhat higher. Since 2011, the positive emotional intensity of this group’s perception of smart cities has risen rapidly and reached a peak in 2017. It gradually stabilized and negative emotions increased, but mainly the positive emotions dominated. In addition, to explore the relationship between policies and the public’s emotional tendencies towards the topic of “smart city,” the study collated the number of smart city-related policies issued by the central government and above from 2011 to 2020. The number of smart city-related policies issued at the national level from 2011 to 2016 showed a trend of rapid fluctuation and rapid increase, which is related closely to the evolution of the emotional tendencies of non-Weibo officially certified users. After 2016, the number of policies related to smart cities reduced drastically, and the public’s positive emotional intensity towards the topic of “smart cities” gradually stabilized and exhibited a downward trend. To sum up, this paper shows to a certain extent that the emotional tendency of users (especially those not officially certified by Weibo) toward “smart city” is related closely to the introduction of policies [60], and that the government’s timely publication of information disclosing the vision and progress of smart city construction can have a positive guiding effect on public sentiment. This trend is more significant for unofficially certified user.

4.3.3. Content Analysis of Negative Comment Data

It was found that negative comments are more perceptive to the public than positive comments, mainly because negative public information about smart cities is more seductive and attention grabbing than positive information [61]. To identify the problems in the development of smart cities, analyzing negative public comments about smart city ideas often reveals more about the shortcomings of smart cities, as shown in Figure 10. The texts of negative emotions were subject to topic mining and word cloud graph analysis to explore and summarize the current public opinion demands of the public on smart city topics to investigate the topics that the groups that post negative comments are concerned about and the trend of topic evolution, based on the results of sentiment analysis, from the three stages of 2011–2013, 2014–2017, and 2018–2021.
The main conclusions are as follows: (1) In the first stage (2011–2013), the concept of a smart city was still in the concept introduction period, and the public’s negative discussions on smart cities focus was mainly on urban construction, technology application, management services, concepts, government, information, etc. A check on the corresponding comment texts shows that most of the negative comments believed that the construction of smart cities is driven mainly by the government’s view of political achievements and questioning the concept of smart cities, and that excessive emphasis on the introduction of information technology will lead to excessive technology dependence. In addition, some comments from this stage indicate the absence of clear urban development issues and citizens’ needs, and that investing considerable government funds in smart city construction cannot serve the people. (2) In the second stage (2014–2017), the public’s negative discussions on smart cities focused mainly on urban construction, market development, information security, and smart services. With the deepening of the dissemination of the smart city concept and the government’s introduction of relevant policies for popularization and promotion, coupled with the demonstration effect of relevant foreign successful cases, the public’s acceptance and awareness of the smart city concept was improved continuously. The cognition of the concept focused mostly on topics such as life services, pilot cities, and application scenarios. After the concept of the smart city matured and entered the scope of daily cognition, most of the public realized that the ubiquity of the smart city profoundly affected the development of smart cities, including their daily life and future technological developments. The public’s psychological expectations and requirements also increased. They were no longer willing to continue to play the role of “outsiders” and were not easily agreeable with the initial application and scene description in the existing system or government documents. (3) In the third stage (2018–2021), after a long period of construction, compared with the previous two stages, there were discussions on topics such as “idea discussion”, “technology application”, and “market development”, etc. The discussion topics of negative public sentiment in 2019 were more focused, involving topics such as “artificial intelligence”, “data assets”, “information protection”, “smart medical care”, “epidemic”, “5G”, etc. Looking back at the corresponding comment text, we can find that the discussions on “artificial intelligence” and “5G” in the negative comments believe that the application of “artificial intelligence”, “5G”, and other technologies had not achieved intelligent results and had ethical risks and “information protection”. Negative comments suggest that the current smart city has not effectively utilized massive data assets and established complete safeguards for the public’s personal information. The concept of smart medical care in smart cities has also been criticized by the public.

5. Discussion

A full understanding of the concept of a smart city is the basis and premise for stimulating the enthusiasm of the public to participate in the construction of a smart city [14,16]. Thus, to analyze the state of public cognition of the smart city concept, this paper constructs a research framework of public cognition of smart city covering “topic identification and affective change” from two dimensions, and reveals the heterogeneity and dynamics of public cognition of smart cities in different periods. The performance of this paper provides a theoretical basis and direction guide for policy formulation to promote public participation in smart cities. The results show the themes of public interest in smart cities are diverse and wide-ranging. Covering many topics, such as top-level design, economic development, strategic layout, and pilot cities, it also includes discussions on AI market development scale, international exchanges, and digital transformation of enterprises that are closely related to smart city development. The general public’s attitude towards smart city construction remains optimistic and cognition is becoming more rational, but the public’s emotional inclinations on smart city topics are different on specific topics. Among the positive comments, smart transportation, AI development, international exchanges, and software services are topics with high positive scores. The negative comments focused mainly on the three themes of social and people’s livelihood, technology application, and enterprise digital transformation. In addition, the study also found a strong correlation between the public’s emotional inclination towards “smart cities” and the frequency of smart city policies, especially among individual user groups. On the practical side, this study further validates the strong correlation between government guidance through policy advocacy and public awareness to participate in smart cities. The potential patterns mined from online data and the negative sentiments expressed by the public can also provide more knowledge to help government officials to make targeted compensations to the existing policy system [62]. Thus, this study facilitates the design of better measures and policies to increase public participation in smart cities.
Furthermore, it is worth noting that too much public attention is not a good thing. Broad and positive public attention is the key to smart city construction [3]. However, negative public attention such as anxiety and distrust of government will also be detrimental to smart city construction [16]. This paper focuses on the public’s content perceptions as well as the emotional status of smart cities, although the study shows that the public generally has a predominantly positive attitude toward the concept of smart cities. However, the government should also pay attention to negative public concerns to avoid undesirable situations, such as public opinion incidents that may be further triggered by negative sentiment overload. Specific to each period, with the advancement of the smart city construction process, the topics involved in negative comments have changed. In the early stage of the dissemination of the smart city concept, most negative comments focused on the macro-level of conceptual cognition and the origin of the concept, and some of the public held a pessimistic attitude towards the applicability of smart cities and believed that the process of urban governance was excessively dependent on technology that would lead to a series of problems such as information security. With the dissemination of the concept of the smart city and the demonstration effect of the successful cases of related cities at home and abroad, the public’s acceptance and awareness of the concept of the smart city have been improved continuously [63], because the ubiquity of smart cities has profoundly affected their daily lives. It is worth noting that many negative expressions of emotions can also be found in Weibo comments on topics related to public interests, such as society and people’s livelihood and data security. In the process of smart city construction, the public has gradually expressed concerns on information protection and ethical risk management and control mechanisms. In addition, data mining based on massive data assets and the application of 5G and other technologies in smart cities under the background of the epidemic have also been criticized. However, this is not due to the opposition to the smart city concept pushed by the public and the government, but rather more due to the relevant technical measures not being complete, the lack of information, and the expectations of the government’s response. In addition, the breadth of online publicity and the fairness of reflecting the public’s wishes are also very important. Currently, in the process of smart city construction, the discourse of internet users on social media has reflected the demands of younger or more educated people for city construction, while the demands of those disadvantaged groups are difficult to be considered by social media [11], such as infants and young children, elderly people, poor people, or people who lack online expression channels [4].

6. Conclusions

Based on social media data, the research uses the LDA and CNN-BiLSTM models to construct a topic mining model and a sentiment analysis mode based on public comment data. It analyzes the current situation of the public’s cognition of smart cities from the two dimensions of topic identification and sentiment change. While monitoring the public’s cognitive feedback on smart cities in social media in real-time, the research can help us discover uncontrollable factors in the development of smart cities and provide theoretical support and practical guidance for public participation in smart city management. The study found that the themes of public interest in smart cities are diverse and wide-ranging. It not only covers many topics, such as top-level design, economic development, strategic layout, and urban pilots, but also involves technology applications, software services, technology companies, and other technology or technology providers. It also includes the AI market development scale and international discussions on topics such as exchanges and the digital transformation of enterprises. In general, the public has positive emotions toward smart cities. The emotional tendencies of the public on smart city topics vary in specific years. Around 2017, the public’s positive emotions on smart city topics reached a peak. Compared with official Weibo users certified by official government departments and enterprises, the positive emotional intensity of individual users towards the concept of smart city has decreased. This phenomenon reveals the particularity of public participation in cyberspace.
Analyzing each type of user stickiness separately and considering sentiment analysis of comments can give us a deeper understanding of how different post characteristics affect different types of user stickiness. Therefore, governments should consider analyzing social media data based on the purpose of its posts and current activity. In other words, government experts need to process the data according to their agency’s mission and level of involvement to achieve a high level of citizen engagement in the smart city building process so that government entities gain innovative knowledge to help guide the direction of smart city efforts. One way to increase civic engagement is to post interactive tweets that ask users to submit their ideas, share their stories, rank posted views, and add content they create themselves, such as pictures and videos. These engagement strategies, also known as “pull” or “push and listen” are critical to increasing an entity’s popularity with the public. Furthermore, adding multimedia features to published posts can attract more users to the posts, thereby increasing the effectiveness of the entity. In addition to using videos and images, social media authors should also ensure that posts are readable, using plain and simple language that allows everyone to understand the content of the post and form an opinion.

6.1. Suggestions for Future Policies

Based on the above analysis conclusions, the research believes that in the current frame construction period of the public’s cognition of the smart city concept, the government needs to seize the opportunity of the era of big data and new media, build a more reasonable smart city public participation platform, and improve the public participation mechanism. Based on this study, the future recommendations are as follows: (1) It is recommended that relevant departments strengthen cooperation with mainstream news media, continue to pay attention to and report on the progress and dynamics of smart city construction from multiple dimensions and fields, improve public awareness of the concept of the smart city, and expand the depth of its influence. (2) Party and government departments at all levels should keep pace with the times, adapt to the public’s habits, establish multi-level and multi-channel channels for social and people’s livelihood appeals, and eliminate the public’s accumulation of negative emotions and cognitive deficiencies towards smart cities. (3) While expanding the channels of appeals, it should also guide the rational appeals of the public to generate more benign interactions and effective discussions, and improve the efficiency and effectiveness of public participation in the construction and management of smart cities. (4) Government departments should respond promptly and respond to the public’s concerns on the problems in the construction of smart cities [16], and expand and innovate channels for the public to participate in smart city construction in a timely manner so that smart city construction and management is not just a one-man show for the government or enterprises, Specifically, based on social media demand collection, the demands of disadvantaged groups should be reflected through offline publicity and surveys to increase their participation in smart city construction, so that the public can truly understand the transformation of the city and participate in it to create a favorable public opinion atmosphere for smart city construction [64].

6.2. Limitations of This Work

The limitations of this study must be pointed out: (1) The groups covered in this paper are limited. Social media users are not representative of the overall population of China. According to the 2021 China Internet Development Statistics Report, the number of Internet users in China is 98.29 million. Most of these users are adults between the ages of 20 and 29 years with middle and high school education levels. Meanwhile, the number of non-Internet users is 562 million, most of whom live in rural areas and do not have access to the Internet. The lack of Internet use skills and the limitations of low education are the main reasons for non-Internet users not going online. Therefore, our results cannot be generalized to non-Twitter users. (2) The research scope of this paper is only for e-participation. In this paper, citizens’ offline discussions of their views on smart city topics are excluded from the scope. Future research should focus on where offline engagement can better support policymakers’ decisions. Moreover, mining information from social media and e-participation platforms can facilitate offline participation activities. This ecosystem view of offline and online engagement to improve smart city policymaking will be of great interest in the future. (3) The findings of this paper have limited generalizability. This study was conducted in the context of a developing Asian city with a small sample size. Therefore, although the methodological framework is transferable, the results may not apply to other contexts without careful validation. (4) It would be interesting to develop a further analysis of the identified negative comments. Follow-up research work could be carried out to analyze the negative comment content identification, negative comment content clustering, negative comment behavior formation, etc. The results of the study can provide very targeted help for policy formulation and smart city construction.

Author Contributions

Conceptualization; methodology; data curation; software; formal analysis, A.Y. Project administration; resources; supervision, C.M. Methodology, data curation; formal analysis, L.C. Methodology, data curation, Z.L. (Zebang Liu). Data Collection; visualization analysis, C.Z. Visualization analysis, Z.L. (Zhiqiang Li). All authors have read and agreed to the published version of the manuscript.

Funding

This research was funded by the National Social Science Foundation of China in 2019, grant number 19BGL278; Chongqing Social Science Fund Project, grant number 2021yc008; Junior Fellowships for Advanced Innovation Think-tank Program of China Association for Science and Technology, grant number 2021ZZZLFZB1207134).

Institutional Review Board Statement

Not applicable.

Informed Consent Statement

Not applicable.

Data Availability Statement

The metadata of the dataset that supports the findings of this study are available on Weibo (https://weibo.com/newlogin?url=https%3A%2F%2Fweibo.com%2F, accessed on 1 July 2021).

Acknowledgments

This study is part of a study on smart urban governance. We thank the National Social Science Foundation and the China Science Association Foundation for their general support.

Conflicts of Interest

We declare that we have no financial and personal relationships with other people or organizations that can inappropriately influence our work, there is no professional or other personal interest of any nature or kind in any product, service and/or company that could be construed as influencing the position presented in, or the review of, the manuscript entitled.

References

  1. Wang, A.; Lin, W.; Liu, B.; Wang, H.; Xu, H. Does Smart City Construction Improve the Green Utilization Efficiency of Urban Land? Land 2021, 10, 657. [Google Scholar] [CrossRef]
  2. Anthopoulos, L. Smart utopia VS smart reality: Learning by experience from 10 smart city cases. Cities 2017, 63, 128–148. [Google Scholar] [CrossRef]
  3. Lin, Y. A comparison of selected Western and Chinese smart governance: The application of ICT in governmental management, participation and collaboration. Telecommun. Policy 2018, 42, 800–809. [Google Scholar] [CrossRef]
  4. Kasznar, A.P.P.; Hammad, A.W.A.; Najjar, M.; Qualharini, E.L.; Figueiredo, K.; Pereira Soares, C.A.; Haddad, A.N. Multiple Dimensions of Smart Cities’ Infrastructure: A Review. Buildings 2021, 11, 73. [Google Scholar] [CrossRef]
  5. Yigitcanlar, T.; Kankanamge, N.; Vella, K. How Are Smart City Concepts and Technologies Perceived and Utilized? A Systematic Geo-Twitter Analysis of Smart Cities in Australia. J. Urban Technol. 2021, 28, 135–154. [Google Scholar] [CrossRef]
  6. Bibri, S.E.; Krogstie, J. Smart sustainable cities of the future: An extensive interdisciplinary literature review. Sustain. Cities Soc. 2017, 31, 183–212. [Google Scholar] [CrossRef]
  7. Mondschein, J.; Clark-Ginsberg, A.; Kuehn, A. Smart cities as large technological systems: Overcoming organizational challenges in smart cities through collective action. Sustain. Cities Soc. 2021, 67, 102730. [Google Scholar] [CrossRef]
  8. Ji, T.; Chen, J.-H.; Wei, H.-H.; Su, Y.-C. Towards people-centric smart city development: Investigating the citizens’ preferences and perceptions about smart-city services in Taiwan. Sustain. Cities Soc. 2021, 67, 102691. [Google Scholar] [CrossRef]
  9. Vidiasova, L.; Cronemberger, F. Discrepancies in perceptions of smart city initiatives in Saint Petersburg, Russia. Sustain. Cities Soc. 2020, 59, 102158. [Google Scholar] [CrossRef]
  10. Chong, M.; Habib, A.; Evangelopoulos, N.; Park, H.W. Dynamic capabilities of a smart city: An innovative approach to discovering urban problems and solutions. Gov. Inf. Q. 2018, 35, 682–692. [Google Scholar] [CrossRef]
  11. Molinillo, S.; Anaya-Sanchez, R.; Morrison, A.M.; Coca-Stefaniak, J.A. Smart city communication via social media: Analysing residents’ and visitors’ engagement. Cities 2019, 94, 247–255. [Google Scholar] [CrossRef]
  12. Han, M.J.N.; Kim, M.J. A critical review of the smart city in relation to citizen adoption towards sustainable smart living. Habitat Int. 2021, 108, 102312. [Google Scholar] [CrossRef]
  13. Adikari, A.; Alahakoon, D. Understanding Citizens’ Emotional Pulse in a Smart City Using Artificial Intelligence. IEEE Trans. Ind. Inform. 2021, 17, 2743–2751. [Google Scholar] [CrossRef]
  14. de Waal, M.; Dignum, M. The citizen in the smart city. How the smart city could transform citizenship. Inf. Technol. 2017, 59, 263–273. [Google Scholar] [CrossRef]
  15. Belanche, D.; Casalo, L.V.; Orus, C. City attachment and use of urban services: Benefits for smart cities. Cities 2016, 50, 75–81. [Google Scholar] [CrossRef]
  16. Kowalik, K. Social media as a distribution of emotions, not participation. Polish exploratory study in the EU smart city communication context. Cities 2021, 108, 102995. [Google Scholar] [CrossRef]
  17. Caragliu, A.; Del Bo, C.F. Smart innovative cities: The impact of Smart City policies on urban innovation. Technol. Forecast. Soc. Change 2019, 142, 373–383. [Google Scholar] [CrossRef]
  18. Boukhris, I.; Ayachi, R.; Elouedi, Z.; Mellouli, S.; Ben Amor, N. Decision Model for Policy Makers in the Context of Citizens Engagement: Application on Participatory Budgeting. Soc. Sci. Comput. Rev. 2016, 34, 740–756. [Google Scholar] [CrossRef]
  19. Steinmetz, C.; Rahmat, H.; Marshall, N.; Bishop, K.; Thompson, S.; Park, M.; Corkery, L.; Tietz, C. Liking, Tweeting and Posting: An Analysis of Community Engagement through Social Media Platforms. Urban Policy Res. 2021, 39, 85–105. [Google Scholar] [CrossRef]
  20. Xu, S.; Sun, K.; Yang, B.; Zhao, L.; Wang, B.; Zhao, W.; Wang, Z.; Su, M. Can public participation in haze governance be guided by government? --Evidence from large-scale social media content data mining. J. Clean. Prod. 2021, 318, 128401. [Google Scholar] [CrossRef]
  21. Simonofski, A.; Fink, J.; Burnay, C. Supporting policy-making with social media and e-participation platforms data: A policy analytics framework. Gov. Inf. Q. 2021, 38, 101590. [Google Scholar] [CrossRef]
  22. Rose, G.; Willis, A. Seeing the smart city on Twitter: Colour and the affective territories of becoming smart. Environ. Plan. D-Soc. Space 2019, 37, 411–427. [Google Scholar] [CrossRef]
  23. Bonson, E.; Royo, S.; Ratkai, M. Citizens’ engagement on local governments’ Facebook sites. An empirical analysis: The impact of different media and content types in Western Europe. Gov. Inf. Q. 2015, 32, 52–62. [Google Scholar] [CrossRef]
  24. Li, G.; Wang, Y.; Luo, J.; Li, Y. Evaluation on Construction Level of Smart City: An Empirical Study from Twenty Chinese Cities. Sustainability 2018, 10, 3348. [Google Scholar] [CrossRef] [Green Version]
  25. Jiang, H.; Jiang, P.; Wang, D.; Wu, J. Can smart city construction facilitate green total factor productivity? A quasi-natural experiment based on China’s pilot smart city. Sustain. Cities Soc. 2021, 69, 102809. [Google Scholar] [CrossRef]
  26. Lombardi, P.; Giordano, S.; Farouh, H.; Yousef, W. Modelling the smart city performance. Innov.-Eur. J. Soc. Sci. Res. 2012, 25, 137–149. [Google Scholar] [CrossRef]
  27. Quijano, A.; Hernandez, J.L.; Nouaille, P.; Virtanen, M.; Sanchez-Sarachu, B.; Pardo-Bosch, F.; Knieilng, J. Towards Sustainable and Smart Cities: Replicable and KPI-Driven Evaluation Framework. Buildings 2022, 12, 233. [Google Scholar] [CrossRef]
  28. Kankaala, K.; Vehilainen, M.; Matilainen, P.; Valimaki, P. Smart city actions to support sustainable city development. Techne-J. Technol. Archit. Environ. 2018, 1, 108–114. [Google Scholar] [CrossRef]
  29. White, G.; Zink, A.; Codeca, L.; Clarke, S. A digital twin smart city for citizen feedback. Cities 2021, 110, 103064. [Google Scholar] [CrossRef]
  30. Moser, S.; Swain, M.; Alkhabbaz, M.H. King Abdullah Economic City: Engineering Saudi Arabia’s post-oil future. Cities 2015, 45, 71–80. [Google Scholar] [CrossRef]
  31. Stratigea, A.; Papadopoulou, C.-A.; Panagiotopoulou, M. Tools and Technologies for Planning the Development of Smart Cities. J. Urban Technol. 2015, 22, 43–62. [Google Scholar] [CrossRef]
  32. Batty, M.; Axhausen, K.W.; Giannotti, F.; Pozdnoukhov, A.; Bazzani, A.; Wachowicz, M.; Ouzounis, G.; Portugali, Y. Smart cities of the future. Eur. Phys. J.-Spec. Top. 2012, 214, 481–518. [Google Scholar] [CrossRef] [Green Version]
  33. Afzalan, N.; Sanchez, T.W.; Evans-Cowley, J. Creating smarter cities: Considerations for selecting online participatory tools. Cities 2017, 67, 21–30. [Google Scholar] [CrossRef]
  34. Doran, D.; Gokhale, S.; Dagnino, A. Human Sensing for Smart Cities. In Proceedings of the IEEE/ACM International Conference on Advances in Social Networks Analysis and Mining (ASONAM), Niagara Falls, ON, Canada, 25–28 August 2013; pp. 1323–1330. [Google Scholar]
  35. Siyam, N.; Alqaryouti, O.; Abdallah, S. Mining government tweets to identify and predict citizens engagement. Technol. Soc. 2020, 60, 101211. [Google Scholar] [CrossRef]
  36. Joss, S.; Cook, M.; Dayot, Y. Smart Cities: Towards a New Citizenship Regime? A Discourse Analysis of the British Smart City Standard. J. Urban Technol. 2017, 24, 29–49. [Google Scholar] [CrossRef] [Green Version]
  37. Anttiroiko, A.-V. City-as-a-Platform: The Rise of Participatory Innovation Platforms in Finnish Cities. Sustainability 2016, 8, 922. [Google Scholar] [CrossRef] [Green Version]
  38. Brodie, R.J.; Hollebeek, L.D.; Juric, B.; Ilic, A. Customer Engagement: Conceptual Domain, Fundamental Propositions, and Implications for Research. J. Serv. Res. 2011, 14, 252–271. [Google Scholar] [CrossRef]
  39. Yang, Y.; Su, Y.Y. Public Voice via Social Media: Role in Cooperative Governance during Public Health Emergency. Int. J. Environ. Res. Public Health 2020, 17, 6840. [Google Scholar] [CrossRef]
  40. Oh, C.; Roumani, Y.; Nwankpa, J.K.; Hue, H.-F. Beyond likes and tweets: Consumer engagement behavior and movie box office in social media. Inf. Manag. 2017, 54, 25–37. [Google Scholar] [CrossRef]
  41. He, F. Research on Evaluation System of Smart City Construction Based on Analytic Hierarchy Process. In Proceedings of the 7th International Conference on Education, Management, Information and Computer Science (ICEMC), Shenyang, China, 16–18 June 2017; pp. 886–891. [Google Scholar]
  42. Kankanamge, N.; Yigitcanlar, T.; Goonetilleke, A.; Kamruzzaman, M. Determining disaster severity through social media analysis: Testing the methodology with South East Queensland Flood tweets. Int. J. Disaster Risk Reduct. 2020, 42, 101360. [Google Scholar] [CrossRef]
  43. Blei, D.M.; Ng, A.Y.; Jordan, M.I. Latent Dirichlet allocation. J. Mach. Learn. Res. 2003, 3, 993–1022. [Google Scholar] [CrossRef]
  44. Dereli, T.; Eliguzel, N.; Ccetinkaya, C. Content analyses of the international federation of red cross and red crescent societies (ifrc) based on machine learning techniques through twitter. Nat. Hazards 2021, 106, 2025–2045. [Google Scholar] [CrossRef]
  45. Khan, S.M.; Chowdhury, M.; Ngo, L.B.; Apon, A. Multi-class twitter data categorization and geocoding with a novel computing framework. Cities 2020, 96, 102410. [Google Scholar] [CrossRef]
  46. Gottfried, A.; Hartmann, C.; Yates, D. Mining Open Government Data for Business Intelligence Using Data Visualization: A Two-Industry Case Study. J. Theor. Appl. Electron. Commer. Res. 2021, 16, 1042–1065. [Google Scholar] [CrossRef]
  47. Zhao, Y.; Zhang, J.; Wu, M. Finding Users’ Voice on Social Media: An Investigation of Online Support Groups for Autism-Affected Users on Facebook. Int. J. Environ. Res. Public Health 2019, 16, 4804. [Google Scholar] [CrossRef] [Green Version]
  48. Sadiq, S.; Mehmood, A.; Ullah, S.; Ahmad, M.; Choi, G.S.; On, B.-W. Aggression detection through deep neural model on Twitter. Future Gener. Comput. Syst.-Int. J. Escience 2021, 114, 120–129. [Google Scholar] [CrossRef]
  49. Zhang, N.; Xue, J.; Ma, Y.; Zhang, R.; Liang, T.; Tan, Y.-a. Hybrid sequence-based Android malware detection using natural language processing. Int. J. Intell. Syst. 2021, 36, 5770–5784. [Google Scholar] [CrossRef]
  50. Gan, C.; Feng, Q.; Zhang, Z. Scalable multi-channel dilated CNN-BiLSTM model with attention mechanism for Chinese textual sentiment analysis. Future Gener. Comput. Syst.-Int. J. Escience 2021, 118, 297–309. [Google Scholar] [CrossRef]
  51. Freire, P.J.; Osadchuk, Y.; Spinnler, B.; Napoli, A.; Schairer, W.; Costa, N.; Prilepsky, J.E.; Turitsyn, S.K. Performance Versus Complexity Study of Neural Network Equalizers in Coherent Optical Systems. J. Lightwave Technol. 2021, 39, 6085–6096. [Google Scholar] [CrossRef]
  52. Alsayadi, H.A.; Abdelhamid, A.A.; Hegazy, I.; Fayed, Z.T. Non-diacritized Arabic speech recognition based on CNN-LSTM and attention-based models. J. Intell. Fuzzy Syst. 2021, 41, 6207–6219. [Google Scholar] [CrossRef]
  53. Qian, X.W.; Sun, L.J.; Ukkusuri, S.V. Scaling of contact networks for epidemic spreading in urban transit systems. Sci. Rep. 2021, 11, 4408. [Google Scholar] [CrossRef] [PubMed]
  54. Yang, S.; Chong, Z. Smart city projects against COVID-19: Quantitative evidence from China. Sustain. Cities Soc. 2021, 70, 102897. [Google Scholar] [CrossRef]
  55. Zhou, Z.; Zhou, X.; Qian, L. Online Public Opinion Analysis on Infrastructure Megaprojects: Toward an Analytical Framework. J. Manag. Eng. 2021, 37, 04020105. [Google Scholar] [CrossRef]
  56. Wu, Y.; Zhang, W.; Shen, J.; Mo, Z.; Peng, Y. Smart city with Chinese characteristics against the background of big data: Idea, action and risk. J. Clean. Prod. 2018, 173, 60–66. [Google Scholar] [CrossRef]
  57. Zhu, S.; Li, D.; Feng, H. Is smart city resilient? Evidence from China. Sustain. Cities Soc. 2019, 50, 101636. [Google Scholar] [CrossRef]
  58. Zhang, H.; Wang, D.; Xu, H.; Sun, S. Sentiment Classification of Micro-blog Public Opinion Based on Convolution Neural Network. J. China Soc. Sci. Tech. Inf. 2018, 7, 695–702. [Google Scholar]
  59. Zhou, Q.; Zhu, M.; Qiao, Y.; Zhang, X.; Chen, J. Achieving resilience through smart cities? Evidence from China. Habitat Int. 2021, 111, 102348. [Google Scholar] [CrossRef]
  60. Qian, Y.; Liu, J.; Cheng, Z.; Forrest, J.Y.-L. Does the smart city policy promote the green growth of the urban economy? Evidence from China. Environ. Sci. Pollut. Res. 2021, 28, 66709–66723. [Google Scholar] [CrossRef]
  61. Zhang, J.Q.; Craciun, G.; Shin, D. When does electronic word-of-mouth matter? A study of consumer product reviews. J. Bus. Res. 2010, 63, 1336–1341. [Google Scholar] [CrossRef]
  62. Wagner, S.A.; Vogt, S.; Kabst, R. The future of public participation: Empirical analysis from the viewpoint of policy-makers. Technol. Forecast. Soc. Change 2016, 106, 65–73. [Google Scholar] [CrossRef]
  63. Wang, M.M.; Zhou, T.; Wang, D. Tracking the evolution processes of smart cities in China by assessing performance and efficiency. Technol. Soc. 2020, 63, 101353. [Google Scholar] [CrossRef]
  64. Tymkiewicz, J. The Role of an Architect in Creating the Image of an Elderly-Friendly Sustainable Smart City. Buildings 2019, 9, 223. [Google Scholar] [CrossRef] [Green Version]
Figure 1. Public perception research framework of smart cities.
Buildings 12 01182 g001
Figure 2. Sentiment polarity discrimination model based on CNN-BiLSTM.
Buildings 12 01182 g002
Figure 3. Evolution trend of public opinion on the topic of “smart city”.
Buildings 12 01182 g003
Figure 4. Radar chart and ranking chart of topic intensity change. (a) Topic Intensity Heatmap. (b) Topic average intensity value.
Buildings 12 01182 g004
Figure 5. Visualization of the first stage of public cognition topics.
Buildings 12 01182 g005
Figure 6. Visualization of the second stage of public cognition topics.
Buildings 12 01182 g006
Figure 7. Visualization of the third stage of public cognition topics.
Buildings 12 01182 g007
Figure 8. Radar chart of Sentiment polarity of each topic.
Buildings 12 01182 g008
Figure 9. Evolution trend of emotional tendencies of different types of users.
Buildings 12 01182 g009
Figure 10. Word cloud analysis of negative reviews in different periods. (a) 2011–2013. (b) 2014–2017. (c) 2018–2021.
Buildings 12 01182 g010
Table 1. Distribution of Posting Users.
User TypeOfficially Certified UserUnofficial Certified UsersTotal
PersonalExpertMemberOthers
User InfoNumber29,96315,690976710316,80770,539
Number of posts per capita4.722.861.511.831.783.27
Blog postNumber141,36144,889147613,02429,976230,726
Percentage61.27%19.46%0.64%5.64%12.99%100%
Table 2. Subject word distribution.
TopicSubject IdentificationTop 10 High Probability Words Related to the Topic
0Technology applicationTechnologyApplicationServeIntelligentNetworking
DataWisdomplatformSystemField
1Economic developmentEconomyDevelopingindustryAdvancePromote
AccelerateInfrastructureBig DataNationEstablish
2Smart TransportationSmartFutureCarLifeIntelligent
EraBecomeCityDevelopmentTransportation
3Public reflectionNoTodayNowAlreadyPossible
EveryoneVeryChanceContinuea lot of
4Technology companyCompanyShareTechnologyFaucetProducts
R&DElectronicRelatedDisplaybusiness
5Application scenariosScenesChipWisdomTravelCommunity
SemiconductorElectricityProductionAgricultureVehicle
6AI developmentAIIncreaseMarketIndustryBig Data
LayoutIncomeSecurityPerformanceAccelerate
7InfrastructureInternetTencentCommunicationWuhanBase station
CoverOperatorCommercialMobileTelecomputer
8Strategic layoutCooperateFirmstrategyGroupTechnology
ProtocolSignContractAssetsField
9Enterprise transformationEnterpriseDigitizingNeedTransformAutonomous
SecuritiesTradeChinaMarketContinued
10Digital economyDigitalEconomyDevelopingChinaIndustry
DigitizingCityConstructionInnovationTechnology
11International exchangeChinaInternationalWorldConferenceShanghai
EnterpriseIntelligentProductHoldExhibit
12Top-level designDesignUseTop floorStandardPackage
PayFormulateSpecificationFeaturesUser
13Stock marketInfrastructurePlateMarketTechnologyConcept
Daily limitIndividualFundsHoldingIndex
14Software serviceBusinessSoftwareParkingServeSatellite
CustomerBeidouProviderFlowR&D
15Social lifeCityCommunityConstructionEcologyArea
CitizenCultureFacilityGreenServe
16Technical facilitiesMonitorIoTUnmannedETCShared
ConsumerOne-stopTechnologyPrivacyFree
17City pilotBeijingShenzhenchongqingGuangzhouXi’an
NanjingShanghaiWuxiBeijingChangsha
18Investment scaleProjectInvestBillionMillionFund
RMBBrokerageLayoutNational levelScale
19Market cultivationHuaweiArchitectureEnergyConceptMarketing
Low carbonCleanFormatTrainingRural
Table 3. Examples of data samples.
NumberSentiment LevelExcerpts from Weibo Comments
1Positive (0.9)“That’s right, a smart city is also a kind of social management. The current social management innovation advocated by the central government also needs to solve these three problems: people’s livelihood projects, modern management, and sustainable economic development.”
2Neutral (0.5)“This morning, I randomly asked a few relatives and friends: What is a smart city? The answer is strikingly similar: I don’t know! The government, social organizations, and enterprises have spent so much effort to build a smart city, but citizens still don’t know it, which shows that this work still has a long way to go, and practitioners need to continue to work hard.”
3Negative (0.2)“Haha, now many governments just play the “smart city” into a new concept, many of which are new bottles of old wine. And these governments don’t care what alcohol is. But a new way of asking the finances for money...”
Table 4. Sentiment distribution of different topics.
Subject IdentificationSentiment PolarityTotal
NeutralPositiveNegative
Technology application11.30%79.08%9.62%4690
Economic development6.94%87.69%5.37%2363
Smart Transportation5.12%91.98%2.90%5798
Public reflection6.41%89.47%4.12%9950
Technology company6.31%90.53%3.16%412
Application scenarios4.96%91.44%3.61%2662
AI development4.01%93.52%2.47%19,517
Infrastructure8.35%87.93%3.72%4325
Strategic layout5.64%89.98%4.39%1277
Enterprise transformation7.03%84.89%8.07%1635
Digital economy5.42%89.32%5.26%1236
International exchange3.57%94.17%2.25%10,025
Top-level design6.56%89.94%3.50%686
Stock market7.62%87.35%5.03%2704
Software service2.72%94.87%2.42%5414
Social life13.45%69.07%17.48%2208
Technical facilities3.94%94.77%1.29%5355
City pilot5.41%90.28%4.31%1368
Investment scale4.55%92.31%3.13%3382
Market cultivation8.58%86.10%5.32%1504
Total5.55%90.54%3.91%86,511
Publisher’s Note: MDPI stays neutral with regard to jurisdictional claims in published maps and institutional affiliations.

