Article

Seismic Vulnerability Assessment of Masonry Residential Buildings in the Older Parts of Tehran through Fragility Curves and Basic RVS Scores

by
Mohammad Yekrangnia
Department of Civil Engineering, Shahid Rajaee Teacher Training University, Tehran 16785-163, Iran
Buildings 2023, 13(2), 302; https://doi.org/10.3390/buildings13020302
Submission received: 12 December 2022 / Revised: 12 January 2023 / Accepted: 17 January 2023 / Published: 19 January 2023
(This article belongs to the Special Issue Seismic Behaviour of Reinforced and Confined Masonry Buildings)

Abstract

:
The present study aims to determine the Rapid Visual Screening (RVS) basic scores for four representative Unreinforced Masonry (URM) and their corresponding Confined Masonry (CM) buildings. Two types of analysis were carried out on the finite element models: modal and push-over analysis. It was observed that confining URM walls with horizontal and vertical RC ties leads to a significant improvement in both the ultimate strength and ductility ratio of URM buildings. The natural frequency and strength of the studied buildings were strongly influenced by the walls’ relative area. The push-over-based fragility curves indicate that there is an average of 100% increase in the spectral acceleration related to the 50% exceedance probability of the CP performance level of CM buildings compared to their corresponding URM buildings. Moreover, the average resulted RVS basic score of CM buildings was 45% higher compared to those of their corresponding URM buildings and their sensitivity to the higher seismicity of the region was lower, thus greatly reducing the vulnerability of masonry buildings.

1. Introduction

According to the majority of seismic design codes, masonry buildings are classified into the three categories: (1) Unreinforced Masonry (URM) buildings, usually referred to as ordinary masonry; (2) Confined Masonry (CM); and (3) Reinforced Masonry (RM) buildings [1,2,3]. Masonry buildings are one of the most common structural types in Iran. One of the main weaknesses of URM buildings is the lack of ductility during an earthquake. Adding vertical and horizontal Reinforced Concrete (RC) ties as confining members has proved to be an effective method to reduce the seismic vulnerability of masonry structures and making them Confined Masonry (CM) [4]. To add, confined masonry is the only masonry structural system that was recognized by the Iranian Code of Practice for Seismic Resistant Design of Buildings (Standard 2800) [3] in seismic-prone areas. Although the results of several numerical and experimental studies indicate the superior response characteristics of CM buildings compared to URM buildings [5,6,7], rather limited data are available in the literature about the evaluation of CM buildings against future earthquakes, i.e., pre-earthquake condition assessment [8]. One of the significant undertakings in the seismic performance evaluation of buildings is to assess the vulnerability of existing buildings against probable future seismic actions. This is of critical significance when it comes to large-scale vulnerability assessment of building in terms of disaster management and resiliency [9]. The M7.3 Ezgeleh, Iran earthquake of 12 November 2017, was a reminder that it is critical to rapidly assess buildings’ safety upon an earthquake and determine whether they are apt for maintaining their functionality [10]. It is also necessary to have the vulnerability scores of those buildings before earthquakes [11,12,13,14,15,16].
The FEMA P-154 handbook entitled “Report, Rapid Visual Screening of Buildings for Potential Seismic Hazards” [17] and its accompanying documentation FEMA P-155 [18] propose a methodology for the Rapid Visual Screening (RVS) of buildings for possible seismic hazards. This procedure was developed to identify, inventory, and screen buildings that are potentially vulnerable to future earthquakes. Once recognized as potentially dangerous, such buildings should be further assessed by a seismic design expert. The RVS process utilizes a methodology based on a visual survey of the building from the exterior, and, if possible, the interior. Based on the collected data, a score is determined that provides an indication of the expected seismic performance of the studied building. In the scoring procedure, basic scores for various building types are used, which are later modified based on the details of the building under evaluation. These scores relate to the exceedance probability of building collapse, if the Maximum Considered Earthquake (MCE) occurs. Final scores range between 0 and 7, with higher scores related to higher expected seismic performance.
Ruggieri et al. [19] proposed an RVS method to assess the seismic risk of RC school buildings by filling out a factsheet that included both structural and non-structural vulnerability items. The influence of the hazard and exposure were also taken into account in determination of the safety index using simplified parameters. Ahmed et al. [20] performed seismic vulnerability mapping on 2900 RC buildings of a case-study province in Northern Algeria. A parametric study was carried out to evaluate the effect of the individual variables in the RVS method on the vulnerability indices. Perrone et al. [21] proposed an RVS method to determine a Safety Index for hospital buildings. The method was applied to two Italian hospitals located in different seismic areas, and the results of the proposed method were compared with an index obtained from a push-over analysis. There are other similar studies aiming at utilizing the RVS method in the vulnerability assessment of infrastructures [22,23].
The main aim of this study is to derive the basic scores for performing RVS on masonry residential buildings located in the older parts of the city of Tehran according to the framework of FEMA P-154. This is of the utmost importance because this document only includes URM and reinforced masonry as the masonry structural types. In other words, confined masonry is not mentioned in this framework. Moreover, there is no previous study dealing with the determination of RVS scores for confined masonry buildings. Customizing the RVS basic scores for URM buildings in the older parts of Tehran is another aim of this study considering the geometrical characteristics, the material properties and the workmanship and constructional details practices in Tehran which makes URM and CM buildings in this city different from ones practiced elsewhere.
In this paper, four typical masonry buildings, which characterize a large number of residential buildings in older textures of the city of Tehran, are considered for determination of the basic RVS scores in both URM and CM states. For this purpose, the three-dimensional model buildings were analyzed in the finite element software Abaqus. Push-over and frequency extraction analyses were performed to study the force-displacement and the modal characteristics of the buildings. The results of the push-over analyses were employed to derive fragility curves for each building. Based on the results of modal analyses and the exceedance probability of collapse prevention performance level, the RVS basic score of the studied URM and CM buildings were determined.
In Iran, out of more than 4 million rural houses, approximately 250 thousand are CM buildings. There are a huge number of confined masonry school buildings in Iran as well [24]. Unfortunately, reliable comprehensive studies on Iranian residential buildings are missing; however, this is not the case for Iranian school buildings. Taxonomy of the Iranian residential and school buildings based on the available data is shown in Figure 1. As a result, there is an urgent and important need in further understanding the seismic response of CM buildings. Moreover, a glimpse into the seismic vulnerability of Iranian school buildings shows that approximately 90% of school buildings, including nearly 400,000 classrooms, are structurally categorized as URM and CM [25,26]. Most of these school buildings are single-story buildings and about 84% of them are located in areas with high and very high seismicity. Furthermore, about 67% of Iranian school buildings were built before the establishment of any seismic design requirements [27]. Although, the majority of these school buildings are confined masonry buildings, which are significantly more ductile compared to URM walls [28,29,30]. Examples of failure modes of masonry buildings in Iran are shown in Figure 2. These district typical failure modes in URM and CM buildings, observed in multiple moderate-to-strong earthquakes in the past, indicate the vulnerability of these types of buildings.

2. Materials and Methods

In this part, four buildings, representing a significant number of residential buildings in the worn-out texture in the city of Tehran, are evaluated numerically to determine their seismic vulnerability. These buildings are introduced fist; then, modeling method and assumptions about these buildings are elaborated. Finally, the results of the vulnerability assessment of these buildings are presented. It should be noted that the selected buildings are based on the field studies of masonry residential buildings in Tehran. Based on the previous studies, the selected buildings cover approximately 44% of the existing buildings in these areas [33]. The map of the worn-out areas in Tehran is shown in Figure 3.

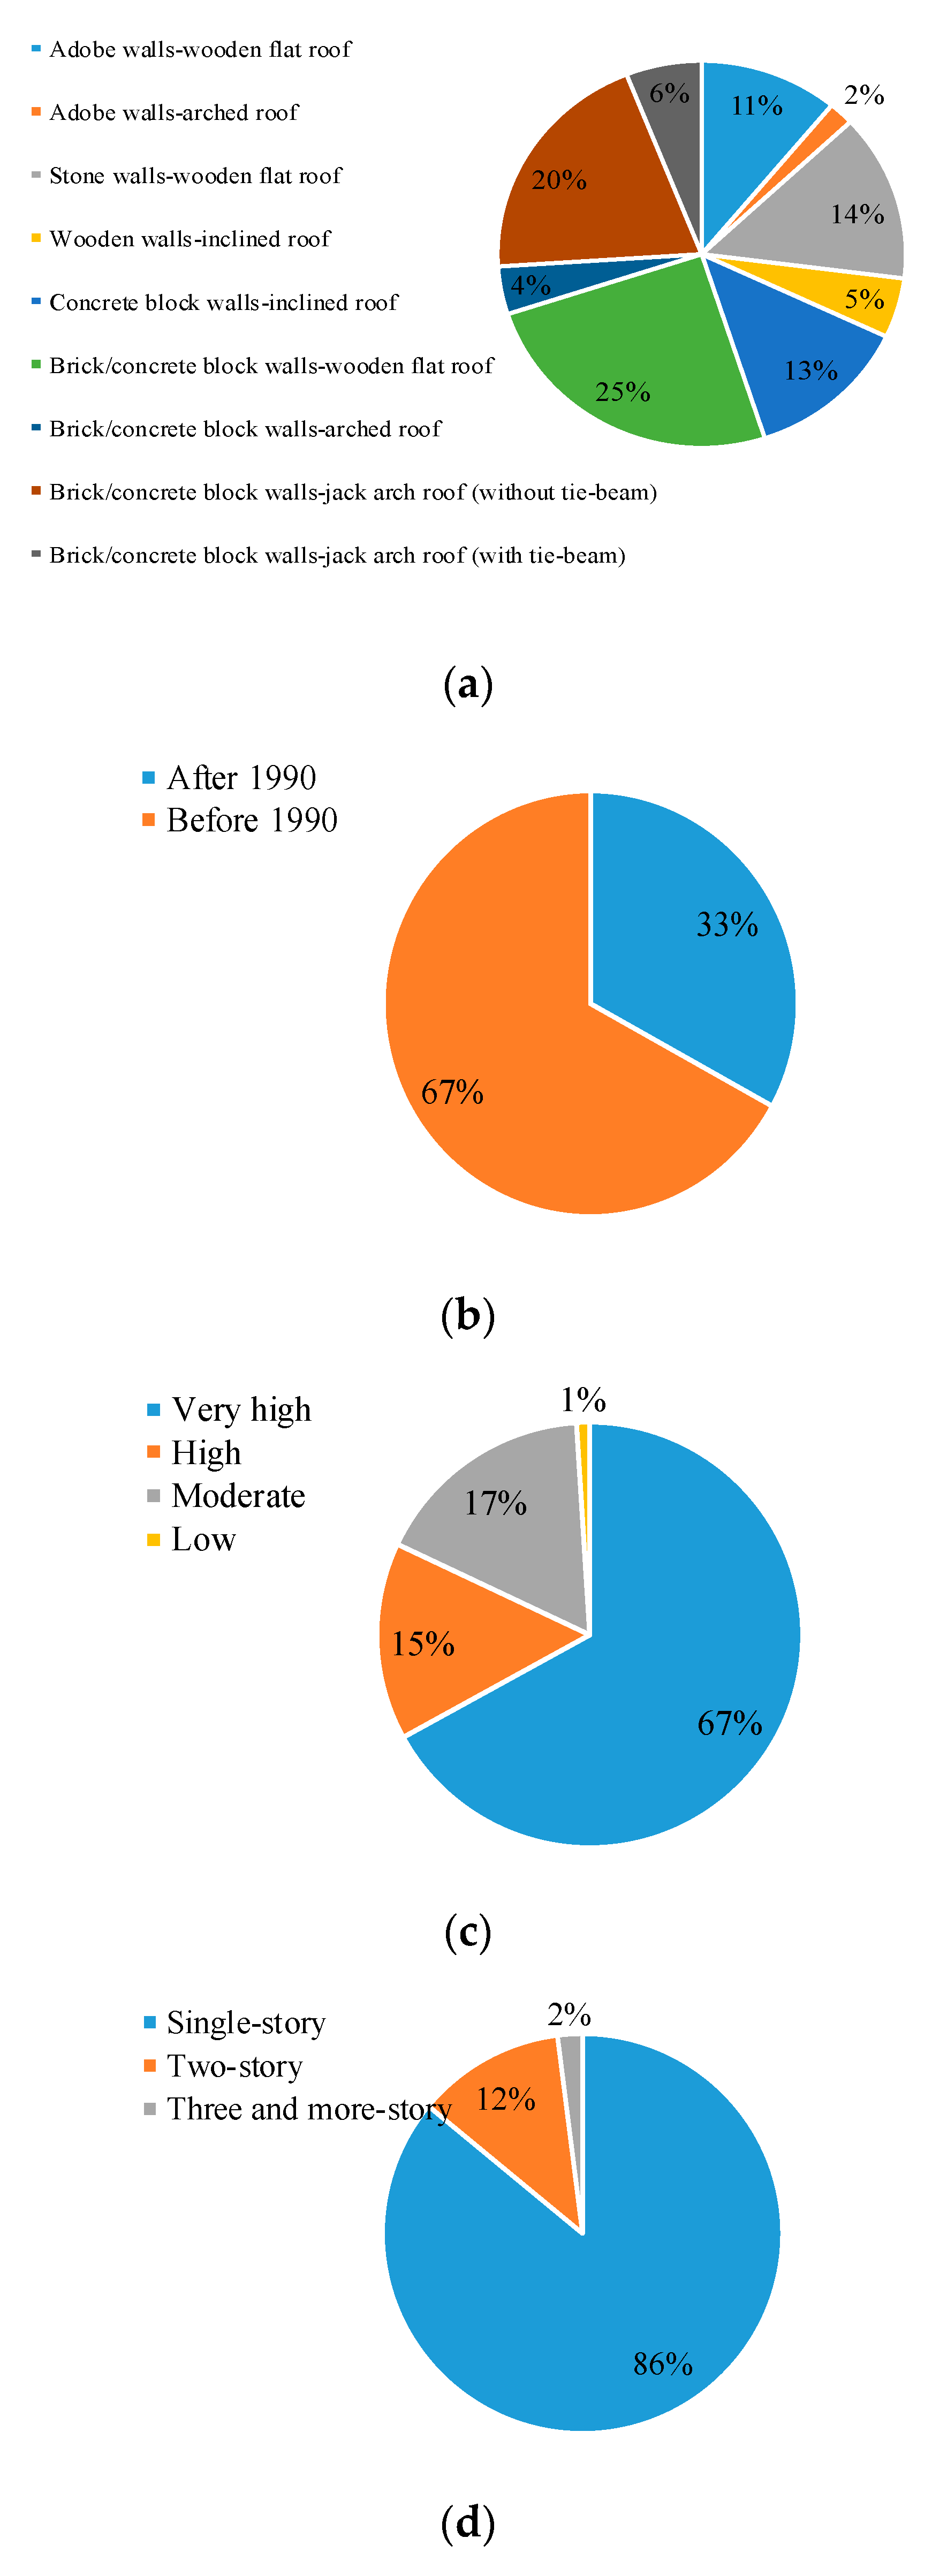
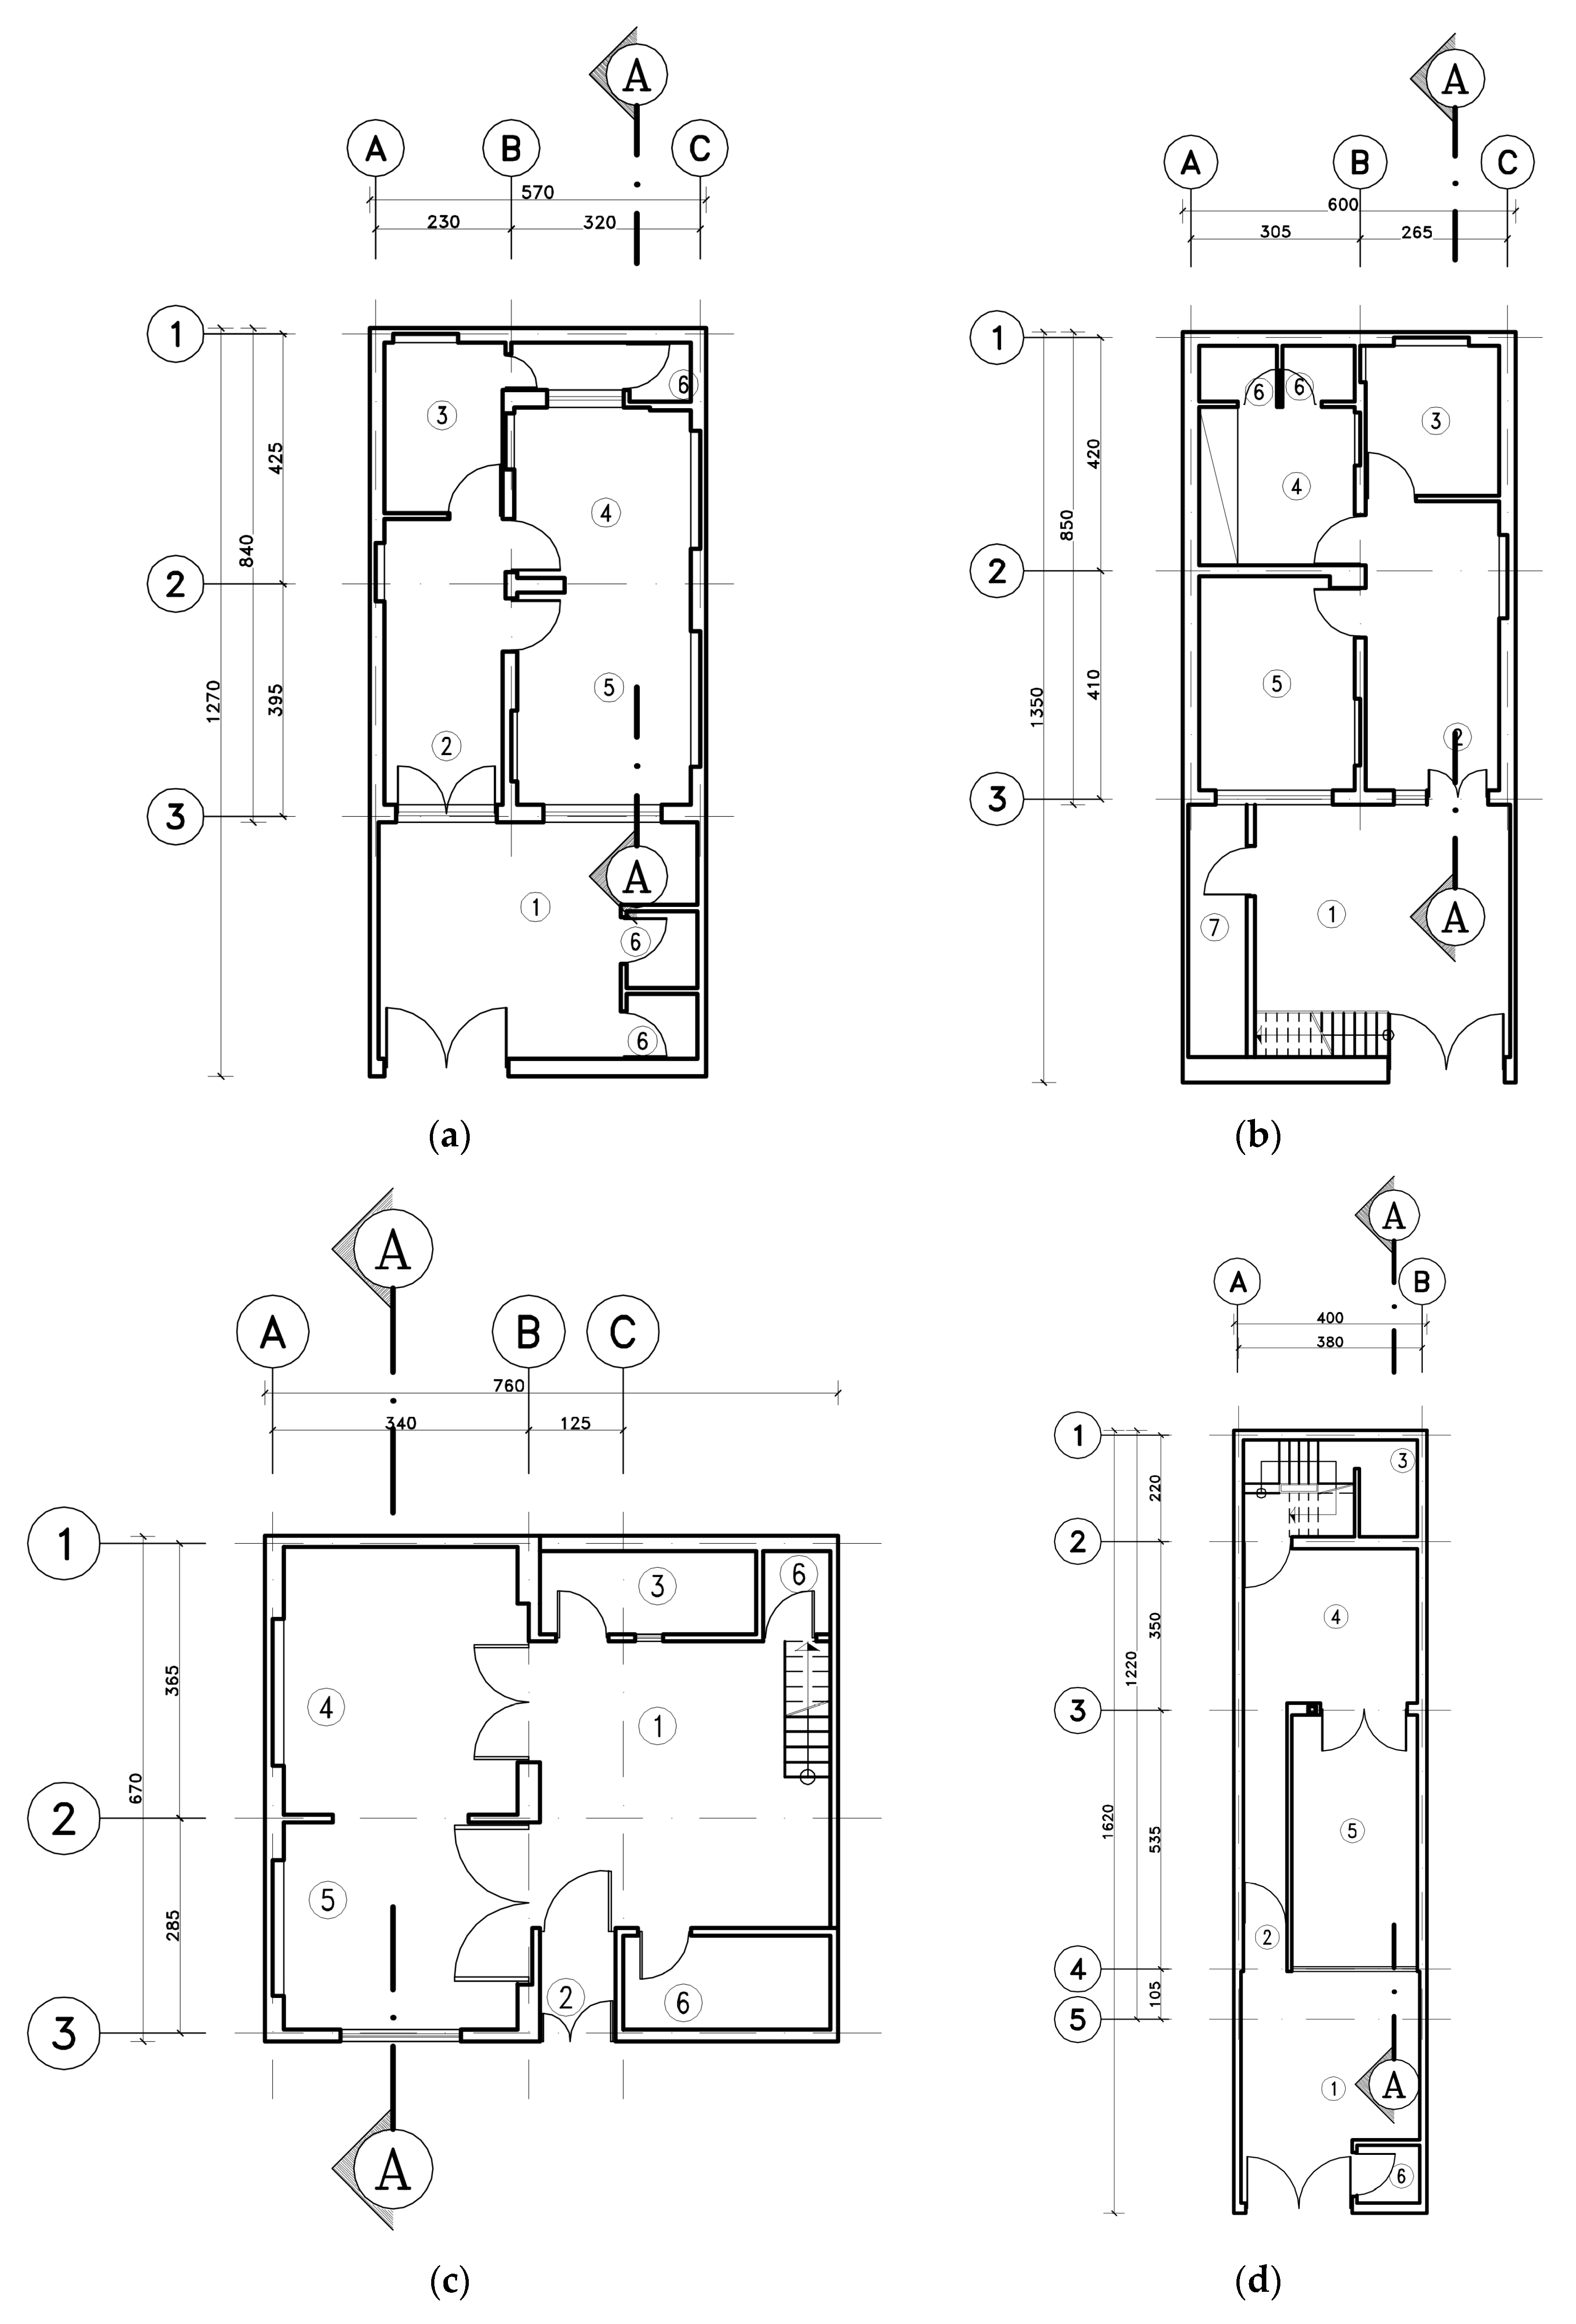
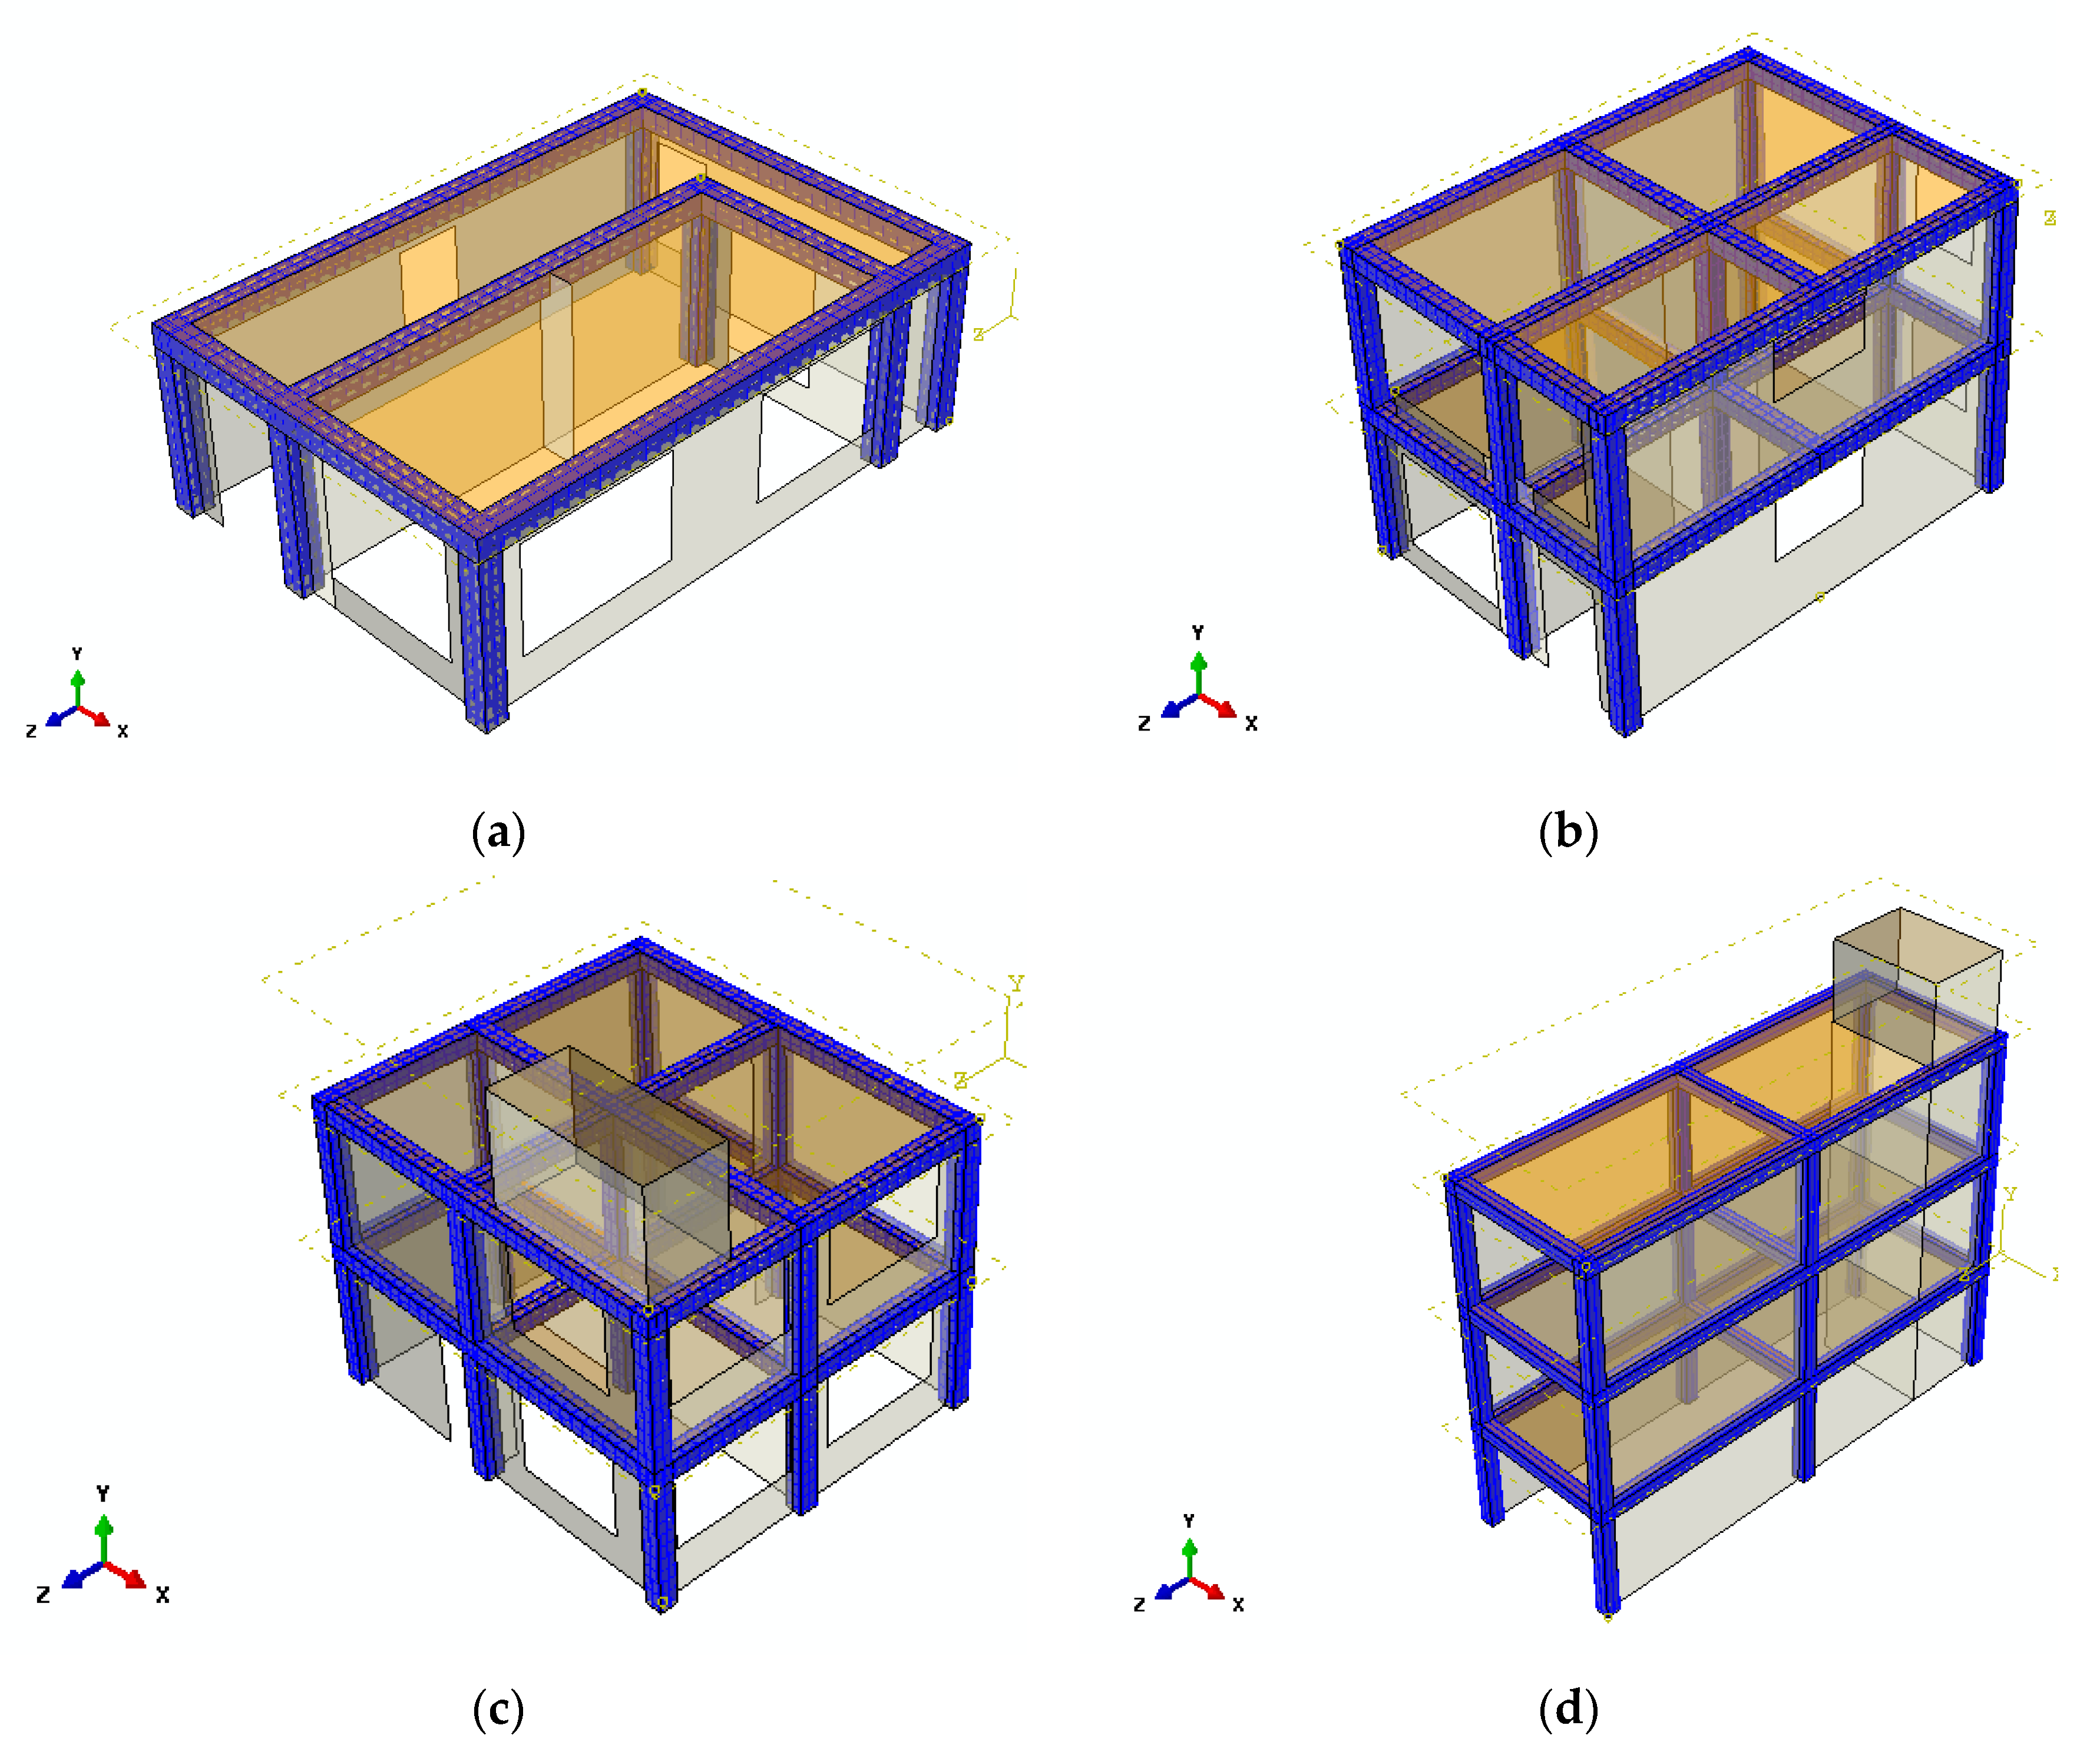
2.1. Representative Buildings

In 2010, a comprehensive field investigation was carried out in the worn-out areas of Tehran with the aim of gathering geometrical characteristics of the residential buildings [33]. The results of this investigation led to classification of URM and CM residential buildings in these areas into four representative buildings. The schematic plans of these typical buildings that represent a considerable percentage of URM and CM residential buildings are shown in Figure 4.
The diaphragm system of these buildings is jack-arch roof that has been one of the most practiced roofs in residential buildings in Iran since the 1920s. There is no comprehensive study on the physical and mechanical properties of these diaphragm systems in Iranian URM residential buildings. Based on a national data gathering from URM school buildings in Iran [34], the average unit mass of these diaphragms in the building roof and lower stories is 730 and 540 kg/m2, respectively. The details of these roofs in different stories are shown in Figure 5. In many cases, the structural walls in Iranian URM buildings are either 35 or 22 cm in thickness. The walls with 35 cm thickness are usually used in peripheral walls and in the basements. The average mass per unit area of these walls is 737 and 586 kg/m2 for 35 and 22 cm thick walls, respectively. The walls’ ratio in each direction of the models, which is the ratio of the sum of the walls’ cross-sectional area in each direction to the plan’s gross area, is presented in Table 1.
It is noted that the dimensions of the walls of the representative models were based on the results of a previous field study ordered by the municipality of Tehran. However, few tests were performed to determine the mechanical properties of the material. This was mainly due to the budget and time limitations as well as restrictions posed by the owners of those buildings. To solve this problem, it was decided to adopt the mechanical properties of the material that were considered by Tasnimi in a comprehensive experimental study on the typical masonry walls in Tehran [35].
URM buildings in Iran usually experience damages in walls, which are concentrated at the mortars. This is because the quality of mortar is very low and the mechanical properties of mortar, including the compressive strength, are lower than those of average bricks in Iran. Considering the moderate vertical stresses on these walls and low height-to-length ratio, the dominant failure mode of many Iranian URM walls is shear sliding. As such, the shear strength of mortar is one of the most important mechanical properties of materials in these buildings. Based on a vast field testing of masonry buildings to determine the mortar’s shear strength in Iran [36], the average and standard deviation of mortar shear strength was 0.27 and 0.16 MPa, respectively. Other mechanical properties of masonry and concrete that were not available were assumed based on the limited test data of previous laboratory studies [35].
In this study, two sets of models, namely, URM and CM, are considered. The CM models, duplicating the corresponding URM ones, are studied to investigate the effects of vertical and horizontal RC ties on the performance improvement. The RC ties were considered at the most appropriate locations, which are commonly practiced in Iran and include at the intersection of the perpendicular walls, and the top of the walls. Figure 6 shows the location of the vertical and horizontal RC ties in CM model buildings. The ties have 350 × 350 mm cross-section with six 10 mm longitudinal steel bars and 6 mm transverse steel stirrups at each 250 mm.

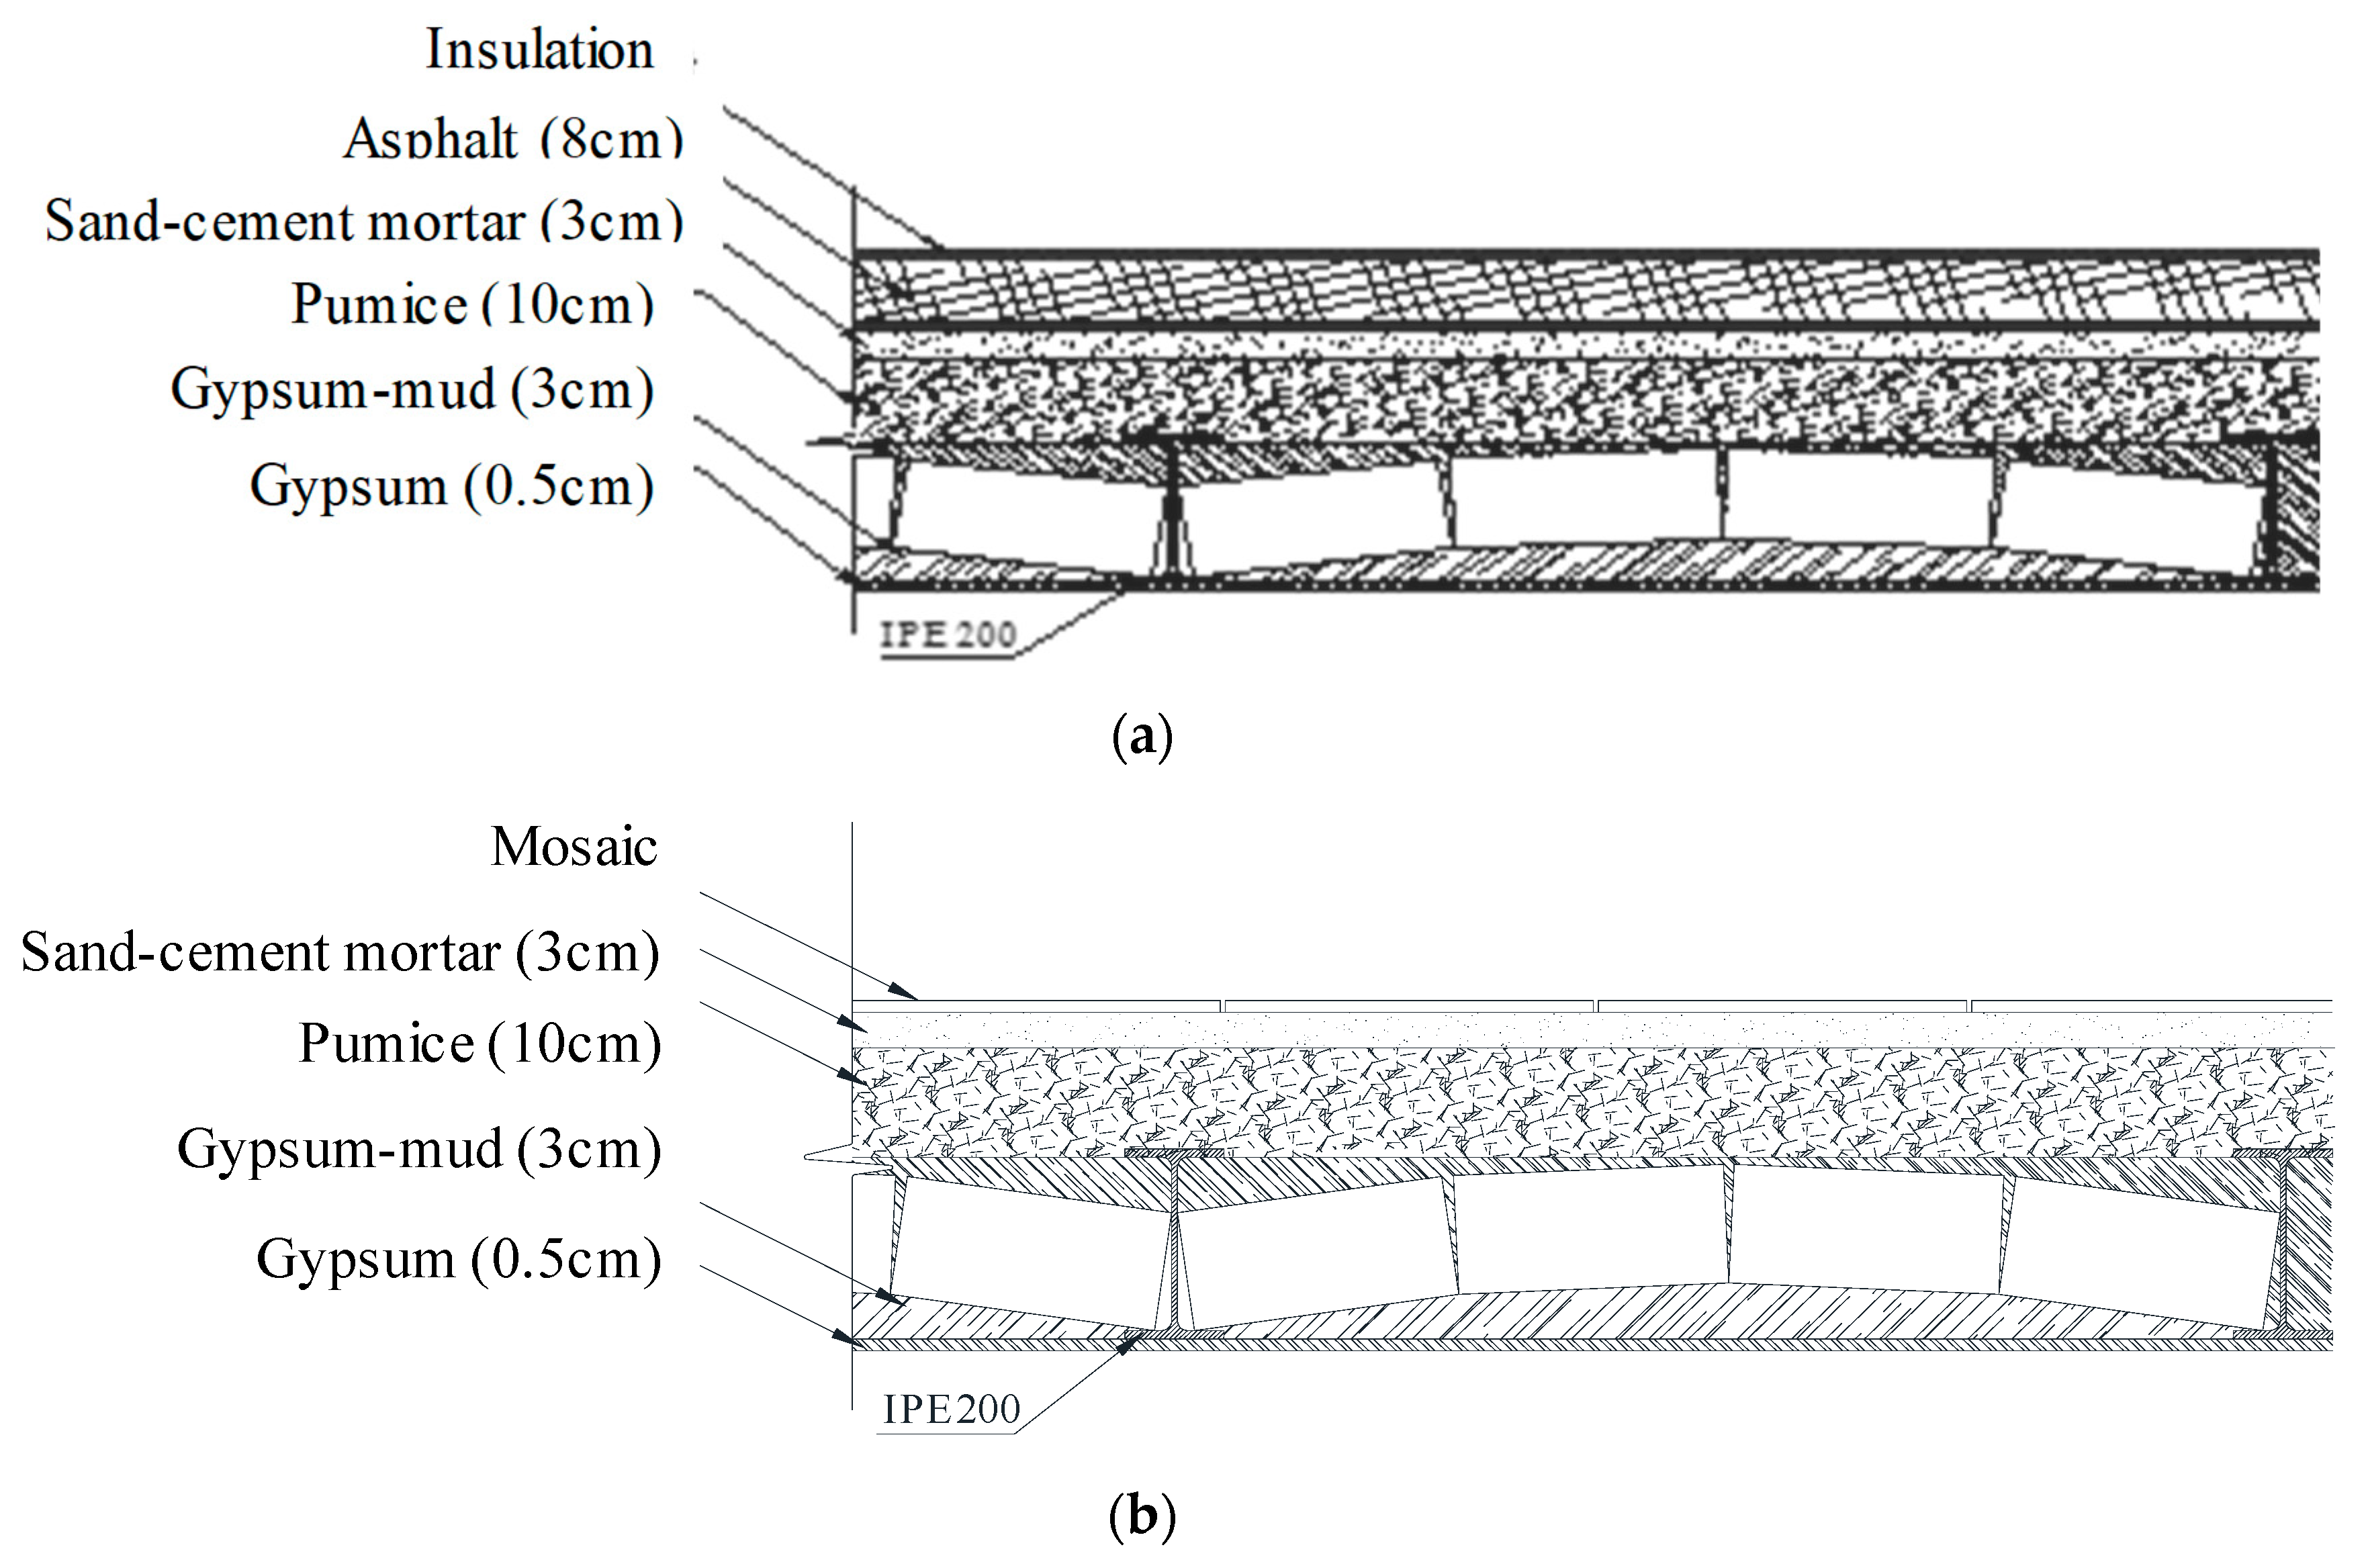
2.2. Modeling Method and Assumptions

In this study, the numerical simulation and analyses were performed by ABAQUS general-purpose finite element software [37]. In general, depending on the accuracy and desired simplicity, one or a combination of the following modeling strategies can be utilized in the numerical simulation of masonry: (1) Detailed micro-modeling, in which units and mortars in joints are represented by interface elements, and unit-mortar interfaces are represented by separate elements. (2) Simplified micro-modeling, where expanded units are represented by continuum elements. On the other hand, the mortar junction and the behavior of the interface between the unit and the mortar are grouped into discrete elements [38]. (3) Macro-modeling, in which units, mortars, and the interface between units and mortars are propagated into a continuum [39].
The walls and diaphragms of the models was meshed by first-order, reduced-integration quadrilateral shell elements (S4R) and the steel reinforcement were simulated using first-order truss elements (T2D2). The RC ties were modelled by continuum first-order, reduced integration hexahedral elements (C3D8R). The diaphragms were also modelled using S4R. According to the results of an experimental study by Shakib et al. [40], the in-plane stiffness of jack-arch roofs is significant compared to the lateral stiffness of masonry walls. As such, it was decided to model the diaphragms as rigid shells for in-plane directions. As such, the behavior of such diaphragms was assumed to be isotropic. The out-of-plane stiffness of the diaphragms were automatically calculated by the software based on the net thickness of the brick material (100 mm) and the modulus of elasticity of masonry which was assumed to be similar to that of the masonry walls. It should be mentioned that because no major damages were observed in the jack-arch roofs and the intersection of the roof and the walls in several previous earthquakes, the behavior of the diaphragms was assumed to be linear-elastic. Moreover, the ideal connection between the roof diaphragms and the masonry walls, i.e., inter-constraining all the degrees of freedom at the diaphragm–wall intersection, was considered in the numerical models, which prevents any slippage and/or separation between these two structural elements.
Gilbert and Warner model [41] and Kent and Park model [42] were utilized for stress–strain of masonry in walls and in the diaphragms, and in the concrete in the vertical and horizontal ties in CM models in tension and compression, respectively. A converged mesh size of 62 mm was used after performing mesh sensitivity analysis. To simulate the behavior of masonry in tensile and compressive regimes, Concrete Damaged Plasticity (CDP) was utilized. This model takes into account the mixture of non-associated multi-hardening plasticity and isotropic damaged elasticity to model damage initiation and controls stiffness recovery during reversals in the load. The flow potential G adopted for CDP is the Drucker–Prager hyperbolic function that is based on Equation (1).
G = ( ϵ σ t 0 t a n ψ ) 2 + q ¯ 2 p ¯ t a n ψ
in which σ t 0 is the failure uniaxial tensile stress; ψ is the dilation angle in the pq plane at high confining pressure; and ε is eccentricity that defines the function’s rate of approaching the asymptote. The model employs the Lubliner’s yield function [43], which was modified by Lee and Fenves [44] to consider various evolution of strength under tensile and compressive stresses according to Equation (2).
F = 1 1 α ( q ¯ 3 α p ¯ + β ( ε ˜ p l ) σ ¯ ^ m a x γ σ ¯ ^ m a x ) σ ¯ c ( ε ˜ c p l ) = 0 α = ( σ b o σ c o ) 1 2 ( σ b o σ c o ) 1 ; 0 α 0.5   ,   β = σ ¯ c ( ε ˜ c p l ) σ ¯ t ( ε ˜ t p l ) ( 1 α ) ( 1 + α ) ,   γ = 3 ( 1 K c ) 2 K c 1
in which σ b o σ c o is the ratio of initial equi-biaxial yield stress in compression to the initial uniaxial yield stress in compression; σ ¯ ^ m a x is the maximum principal effective stress; K c is the ratio of the second stress invariant on the tensile meridian to that on the compressive meridian at initial yield for any given value of the pressure invariant p such that the maximum principal stress is negative;   σ ¯ c ( ε ˜ c p l ) and σ ¯ t ( ε ˜ t p l ) are the effective compressive and tensile stresses, respectively. The assumed mechanical properties of masonry, steel and concrete in this study are presented in Table 2, where E is the modulus of elasticity, υ is the Poisson’s ratio, f c and f t are the compressive and tensile strength, G f I and G f I I are the tensile and shear softening energy, respectively.
The base of the models was restrained against all the Degrees Of Freedom (DOF). Full bond between the steel bars and the surrounding concrete ties was assumed. Moreover, all the DOF’s of the ties and the walls at their intersection were tied together to prevent any slippage or separation at these locations because of the toothing provided by the masonry wall and the surrounding ties [46,47]. Because of severe material nonlinearity and brittleness, the analyses were carried out using the dynamic explicit method that incorporates central difference method with the conditional numerical stability as per Equation (3):
Δ t s t a b l e = 2 ω m a x ( 1 ξ 2 ξ )
in which Δtstable is the time increment, ξ is the critical damping ratio, and ω m a x is the maximum numerical frequency of the model. It should be noted that implicit numerical solving method is based on Newton–Raphson method, which incorporates some increments and iterations. When the convergence criteria are not met at each iteration, the stiffness at that iteration is updated [48]. After several unsuccessful iterations, the increment is forced to cut-back with a smaller size. This, in addition to increasing computational costs, can result in the abortion of the analysis when the convergency is not satisfied in several successive increments. As such, one of the best solutions to this problem is to apply central-difference method, which is based on very small increments with no iteration. The linear and quadratic bulk viscosity parameters were assumed to be 0.6 and 1.2 based on the software default values. Because the models in this study were evaluated by push-over analyses, all the loads were applied to the models gradually to reduce the dynamic effects to a minimum. For this purpose, the ratio of kinetic energy to the internal energy at each time increment in the whole model was monitored to be less than 10%. Moreover, the difference between the external work and the internal energy of the whole model at each increment was monitored to be negligible to ensure numerical stability. The gravity loads were applied to the models first; then, after completion of this load, the lateral load was exerted on the model mass-proportionally with inverted triangular pattern with respect to the height of the model building, while the gravity loads remained constant.

2.3. RVS Basic Score

It should be noted that the URM is among the structural systems recognized by FEMA P-155; however, no attempt has been made so far to propose RVS basic scores for CM buildings. Based on the FEMA P-155 methodology, the basic score of each building can be determined according Equation (4):
S = log 10 ( POC )    
where the probability of collapse (POC) is calculated based on Equation (5)
POC = P [ COL | CD ] ×   P [ CD ]
where CD is the Complete Damage; P[CD] is derived based on the fragility curve and the exceedance probability related to CP performance levels given a spectral acceleration related to the first mode of vibration. P[COL|CD] is based on Equation (6):
P [ COL | CD ] = Collapse   Factor

3. Results and Discussions
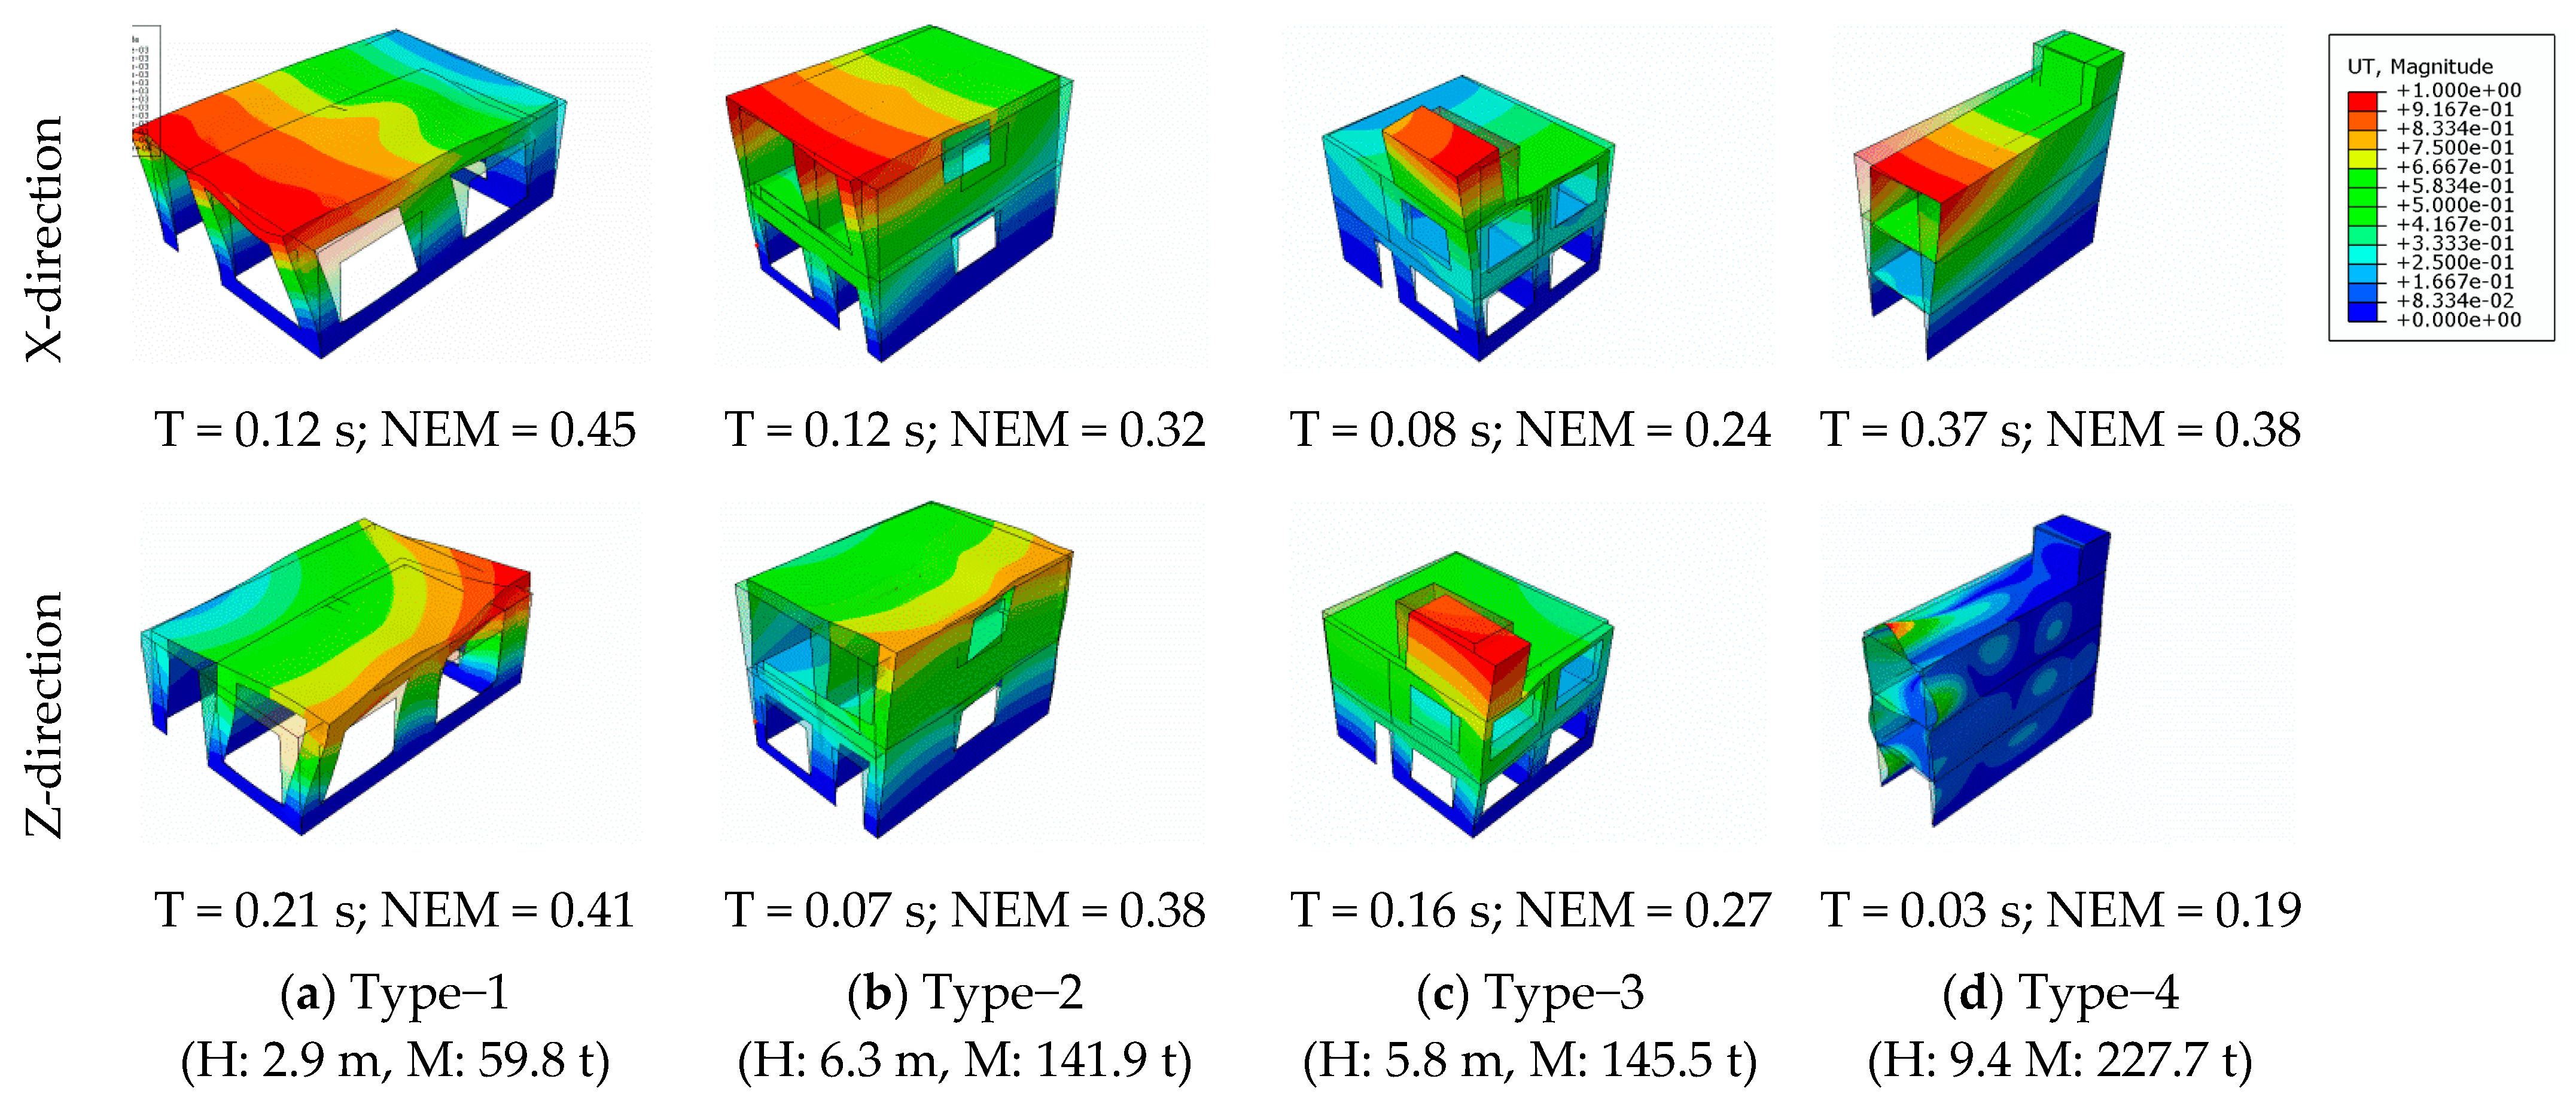
3.1. Modal Analysis

The first series of analyses on the models were performed to obtain the natural mode shapes and frequencies to be used in derivation of fragility curves. The results of modal analysis on URM model buildings in terms of the natural period of the dominant mode in each direction as well as the mode shape are presented in Figure 7. The Normalized Effective Masses (NEM) for each mode are also presented in this figure. Note that Type-4 mode shape around Z-direction also has a significant contribution in the vertical direction. This is because the stiffness of this model building in the Z-direction is considerable due to significant walls’ ratio in this direction. It should be noted that no significant differences between the modal analysis results of the URM models and their corresponding CM models were observed. This similarity was expected, as the use of RC ties has no major contribution in the mass and initial stiffness of the URM walls.

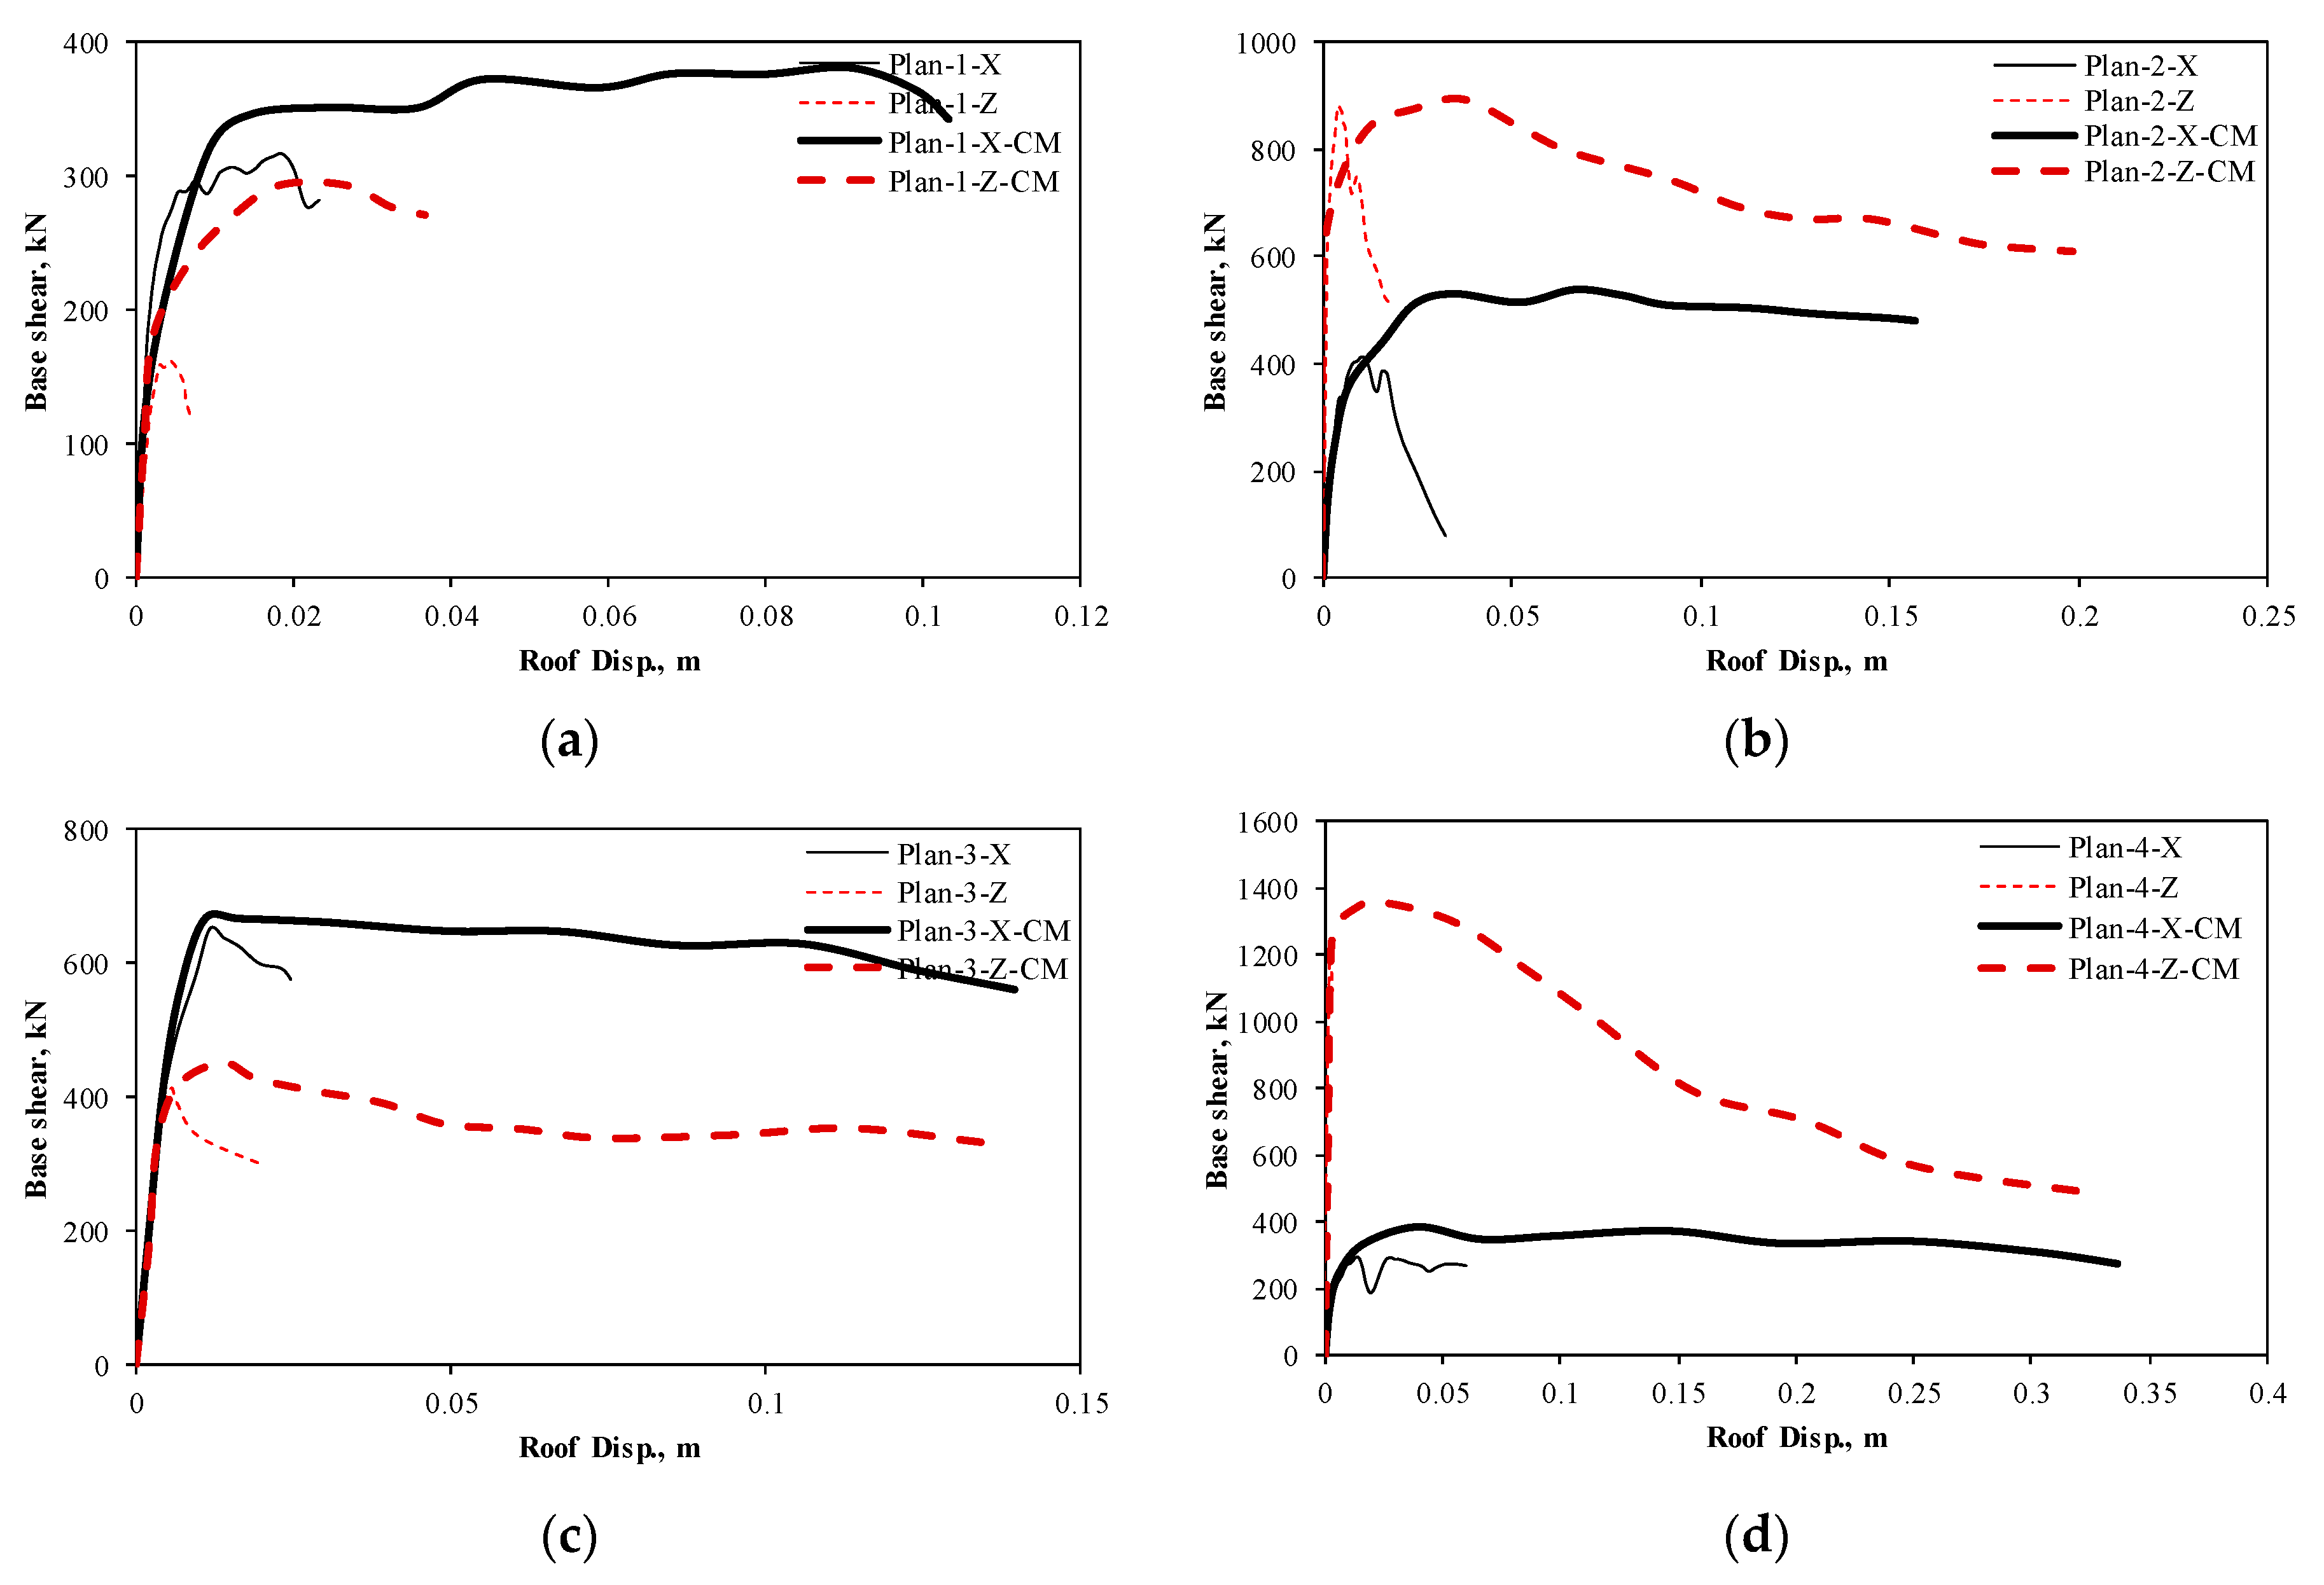
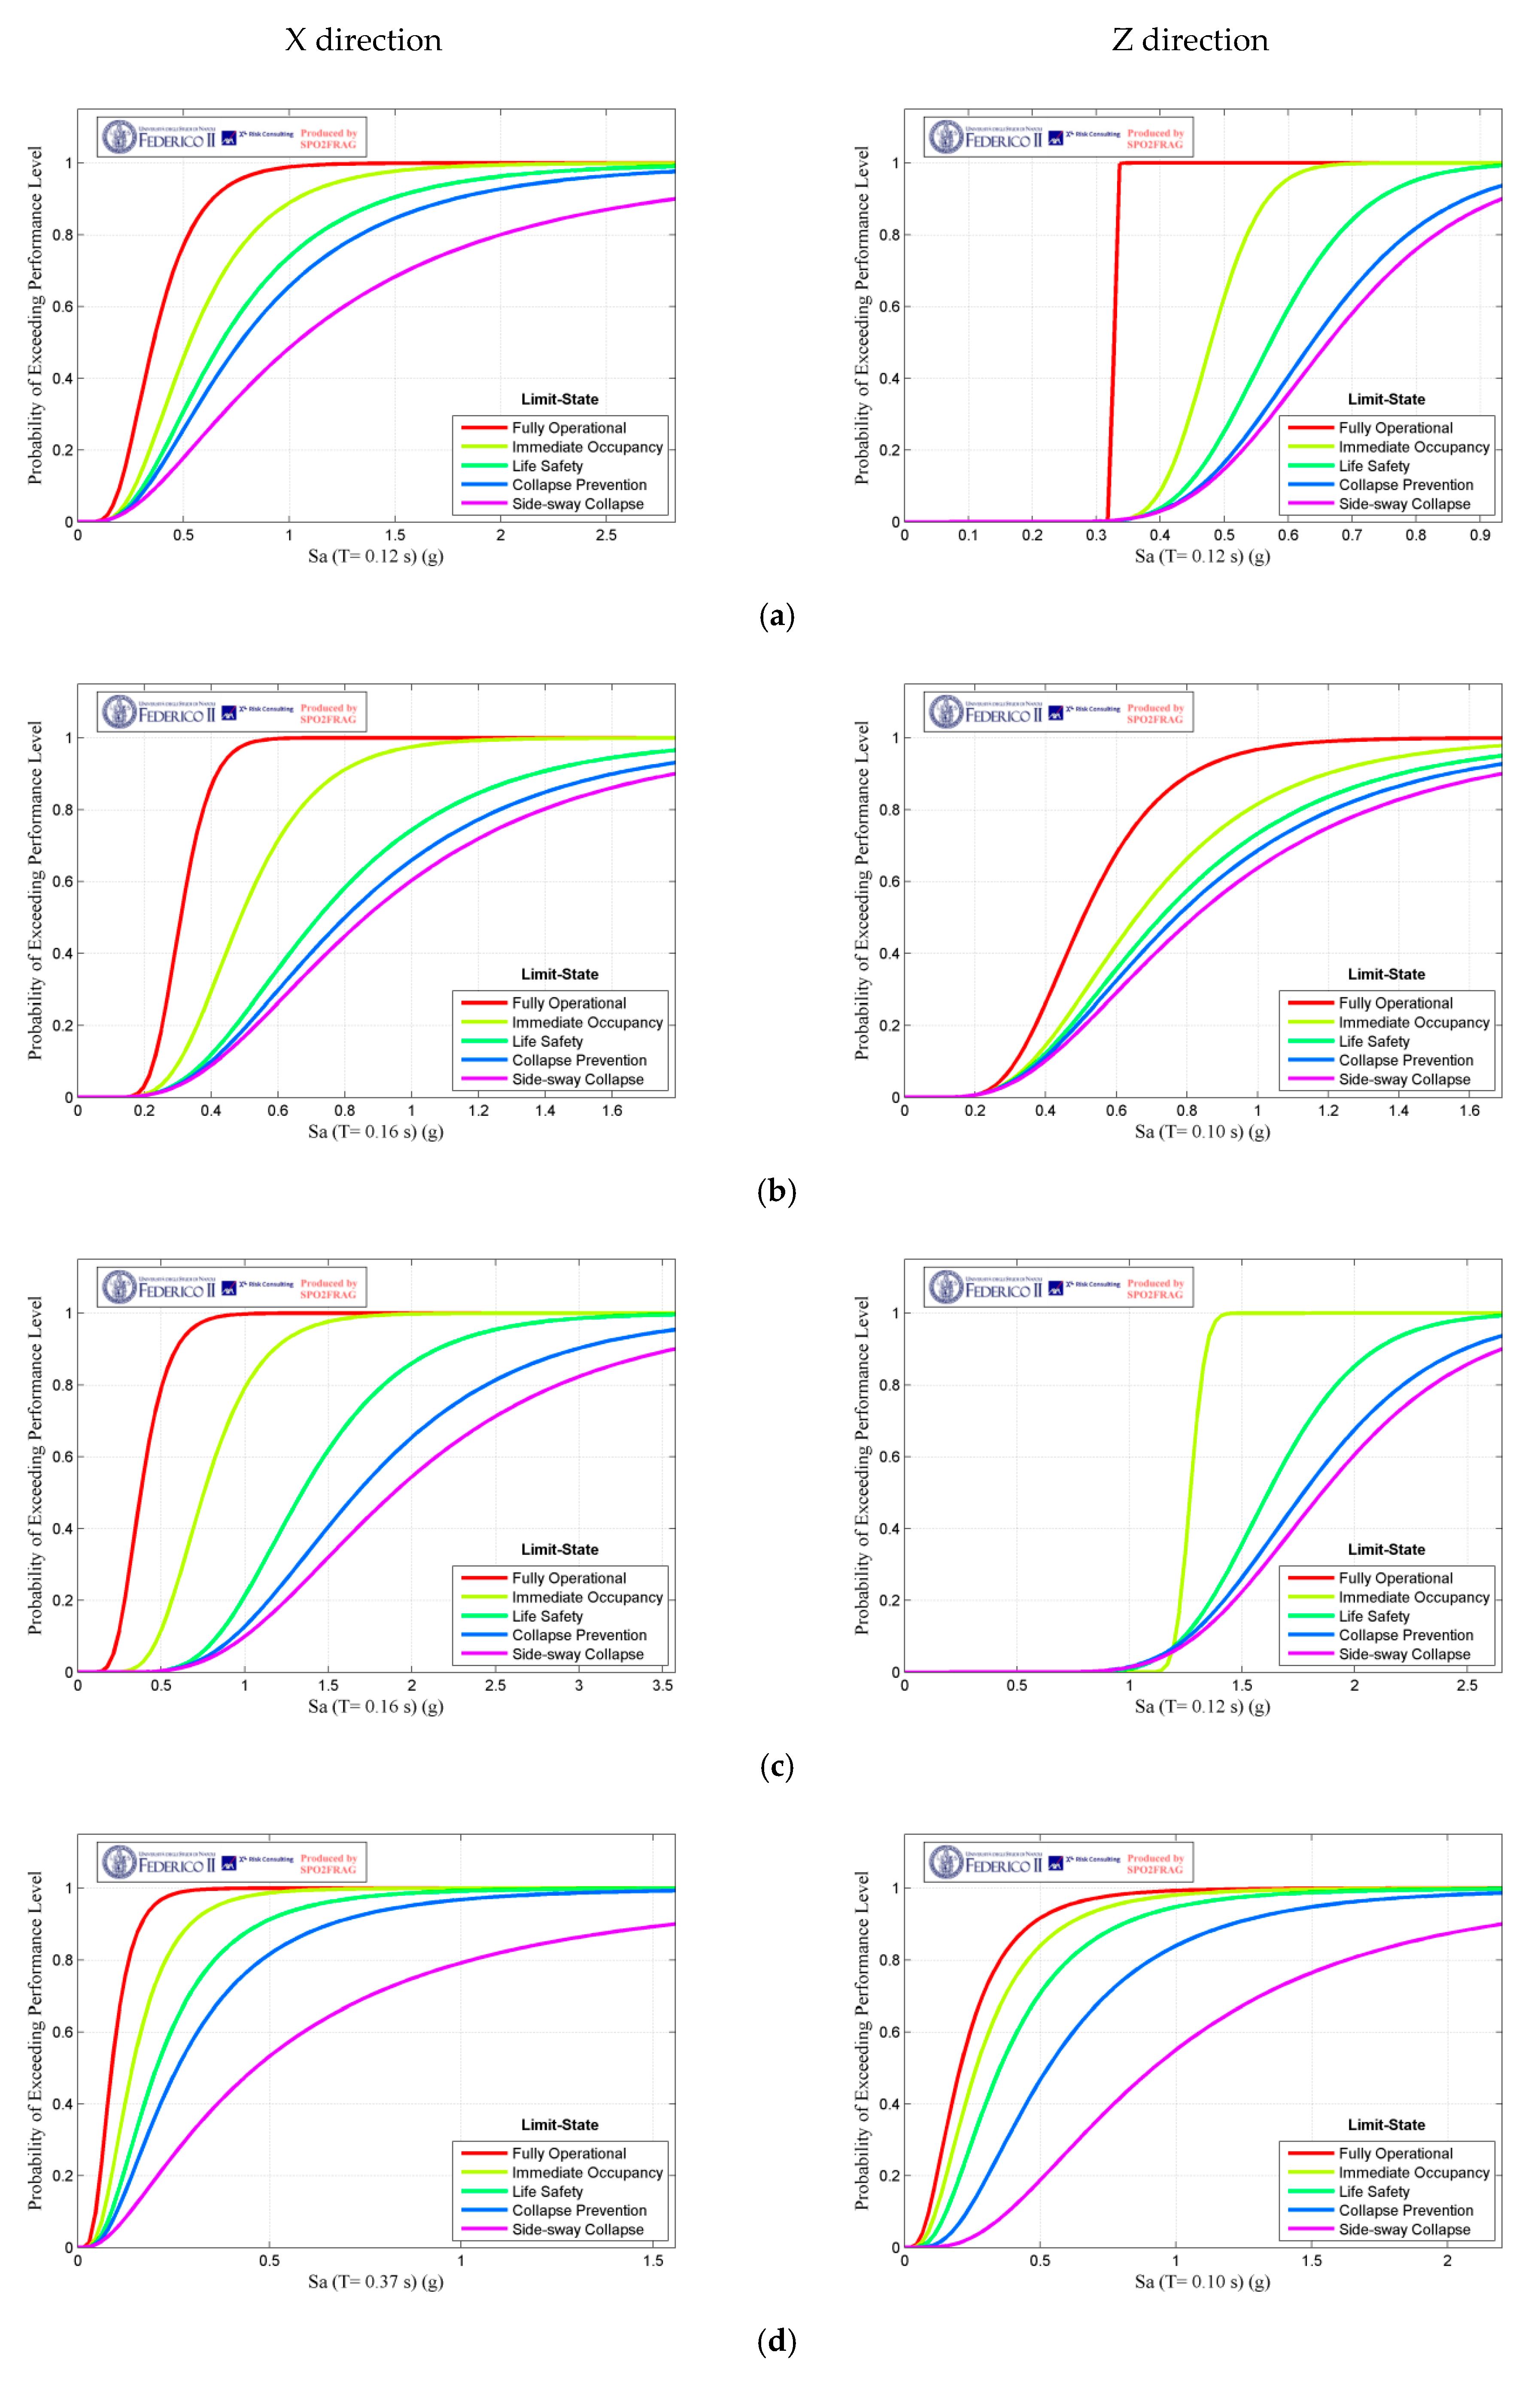
3.2. Push-Over Analysis

The results of push-over analyses on the models in both horizontal directions in terms of base shear versus roof displacement are shown in Figure 8. In these analyses, the lateral body force was applied mass-proportionally to the models gradually and the related roof displacement (the average lateral displacement of the four corners of the roof) was recorded at each increment. As seen in Figure 8, the initial stiffness and maximum force strength of the models greatly depend on the wall ratio of the models in each direction. Moreover, adding RC ties to the buildings significantly increased the displacement capacity of the models, whereas it had no major effect on the force capacity. This is in accordance with the main aim of providing confinement to the URM walls, which is increasing the ductility of the masonry buildings. Unlike the URM model buildings, which show very brittle behavior, the CM model buildings exhibit an elasto-plastic response thanks to the presence of RC ties in increasing the ductility of masonry buildings. As discussed by Yekrangnia et al. [49], the evolution of damages in CM walls usually consists of the wall’s failure followed by RC ties’ failure. As mentioned previously, the failure of walls is shear-dominated. The failure of ties can be tensile, shear or compressive. Upon the failure of the wall (associated with the first stiffness degradation) to the point of the ties’ failure, the behavior of CM walls approximately follows a perfectly plastic pattern.
The ultimate strength and ductility ratio, based on the method prescribed by ASCE 41 [50], for model buildings are presented in Table 3. As can be seen, the confinement of walls led to an average of 25% increase in the ultimate strength of URM buildings; however, the main advantage of adding ties to the URM walls is the increase in the ductility ratio, with average increase of 377% in the ductility ratio thanks to the presence of confining ties. Based on the limit states and failure mode of URM and CM walls mentioned by Yekrangnia et al. [49], the modelling approach can simulate the failure modes of masonry walls and can also capture the possible failure modes of RC ties (tensile, shear, and compressive) as well. The more complex local mechanisms, including those related to detachments of some parts of the walls from the rest of the building, can be approximated by this approach in terms of excessive plastic strains. The overall response of the model buildings was of importance in this study.

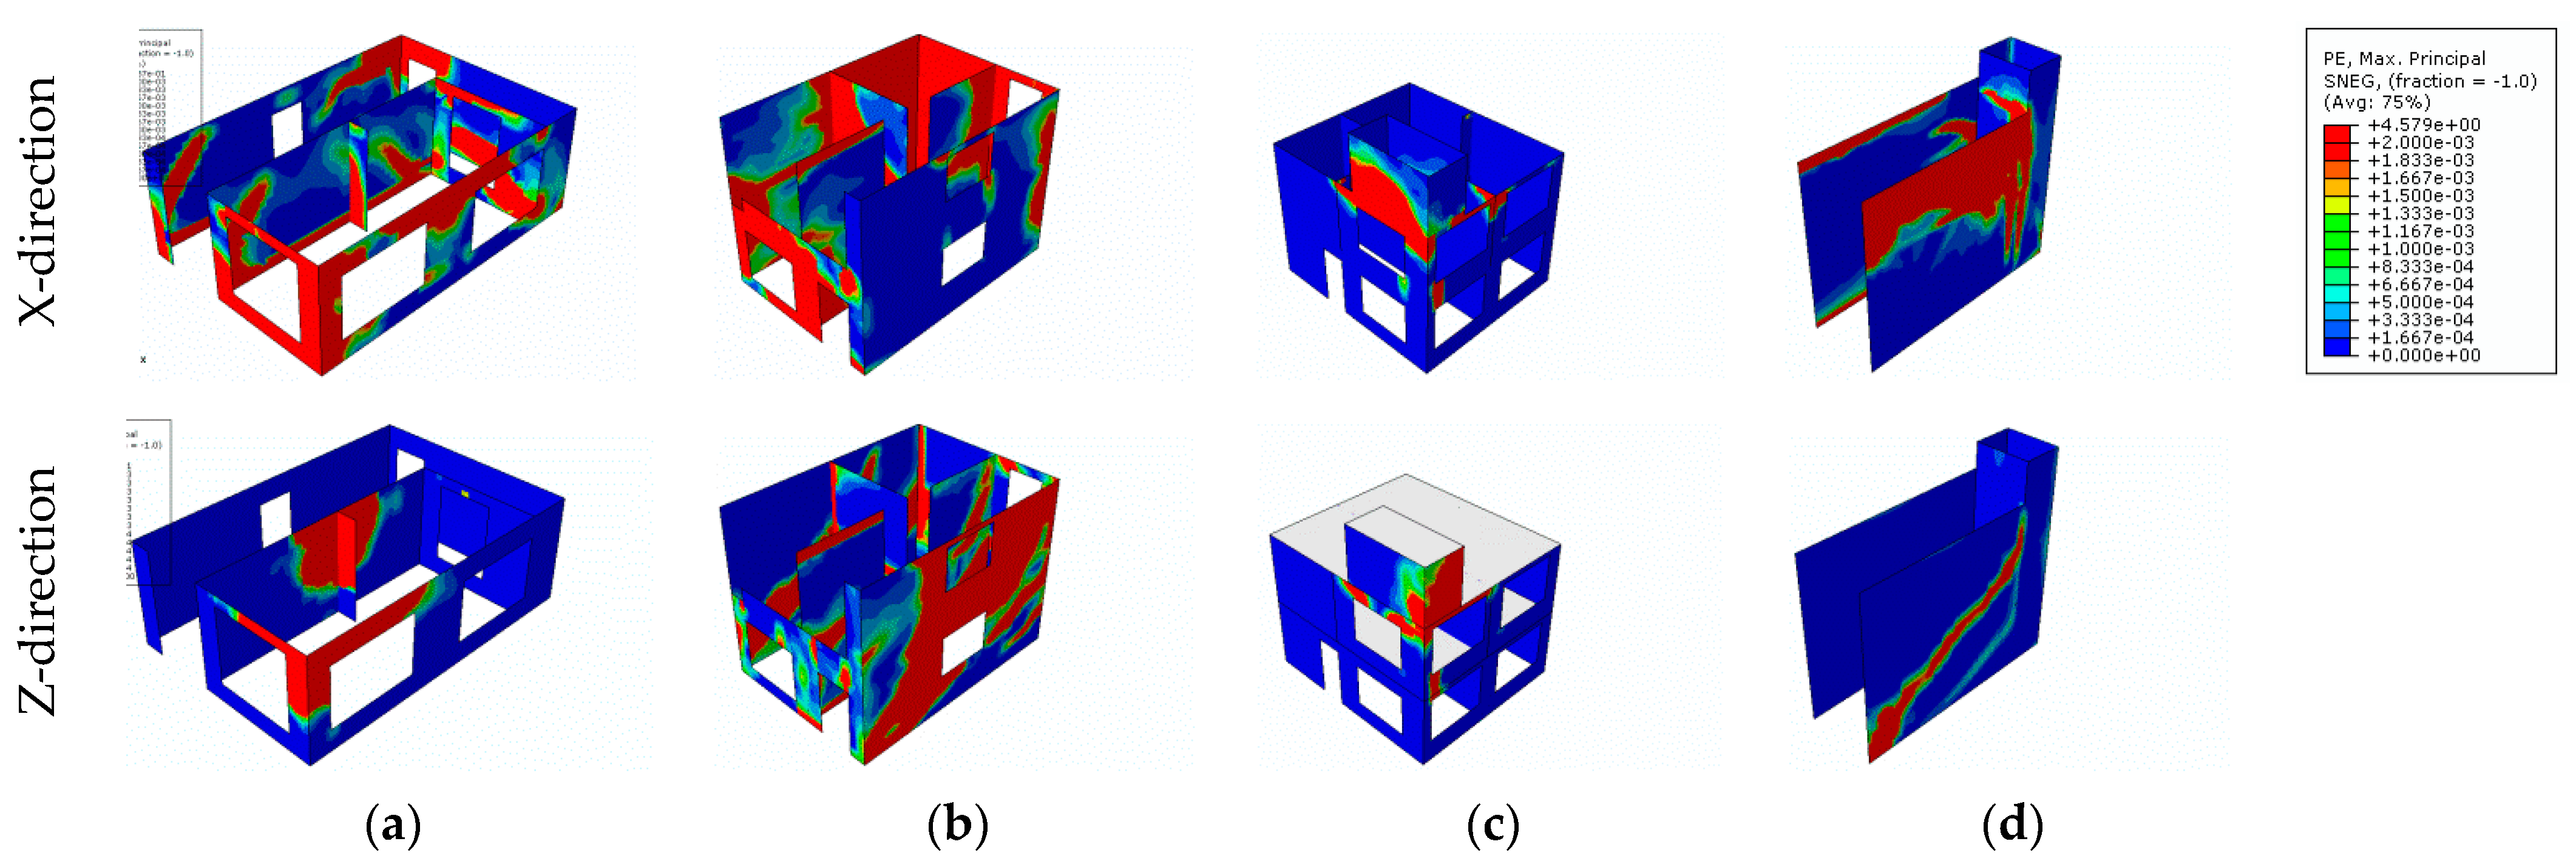
3.2.1. Push-Over Results of the Representative URM Buildings

The maximum principal plastic strain of the URM models that is associated with tensile cracks at the end of analyses is shown in Figure 9. The crack pattern in most of the walls is indicative of the shear-caused inclined failure mode, which is a common damage type in Iranian masonry buildings [31]. It should be noted that the stepped-diagonal failure in masonry walls is shear-dominated in nature and the sliding of the two wedges at their interface (crack path) governs this behavior. Sometimes, the shear sliding follows a horizontal path (usually known as bed-joint sliding in some seismic design codes). As a result, both failure modes are governed by shear. As seen in this figure, the cracks are propagated in all stories. Although the shear forces are larger in the lower stories compared those in upper ones, the strength of the walls for experiencing shear-caused failure is larger in the lower stories because of the higher level of axial stresses on the walls.
The fragility curves of the models that determined the probability of exceedance of different performance levels against the spectral acceleration in the first natural model of each URM model in each direction are presented in Figure 10. In this study, the fragility curves were derived making use of SPO2FRG software [51]. These curves that were based on the results of push-over analysis and the modal analyses were derived for five different performance levels, namely, fully operational (OP), immediate occupancy (IO), life safety (LS), collapse prevention (CP), and side-sway collapse (SSC), that were assumed to be associated with the story drift ratio of 0.05%, 0.1%, 0.2%, 0.3%, and 0.5%, respectively, for URM model buildings. The assumed drift ratio for the IO, LS, and CP were selected based on ASCE 41 [50] for URM walls with bed-joint sliding failure mode. For the CM walls, these threshold drift ratios were assumed to be 1.5 times the corresponding drift ratios for URM walls, as recommended by the Iranian instruction for seismic rehabilitation of existing buildings (Code 360) [52]. The details related to the derivation of fragility curves from the push-over analyses were elaborated by Baltzopoulos et al. [51].

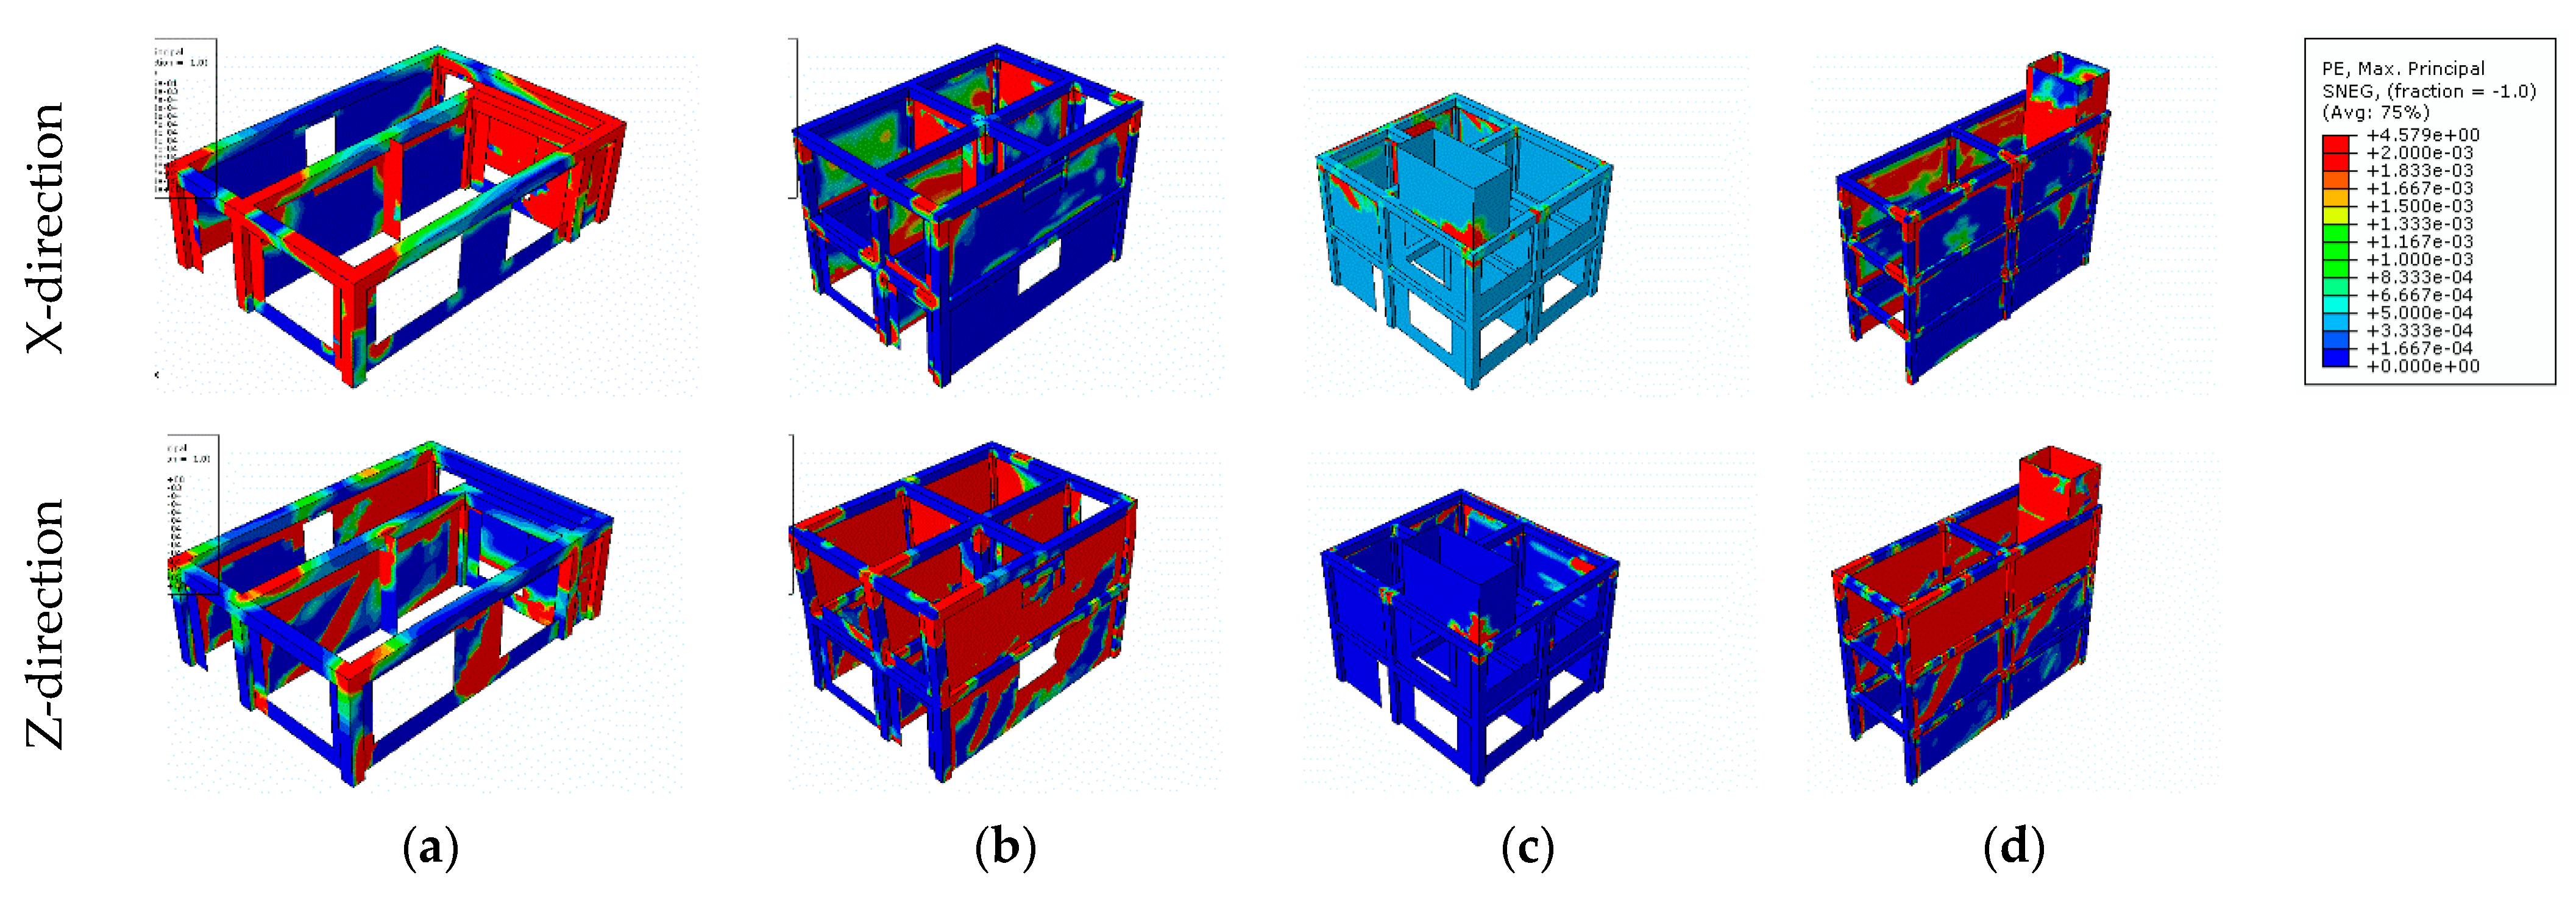
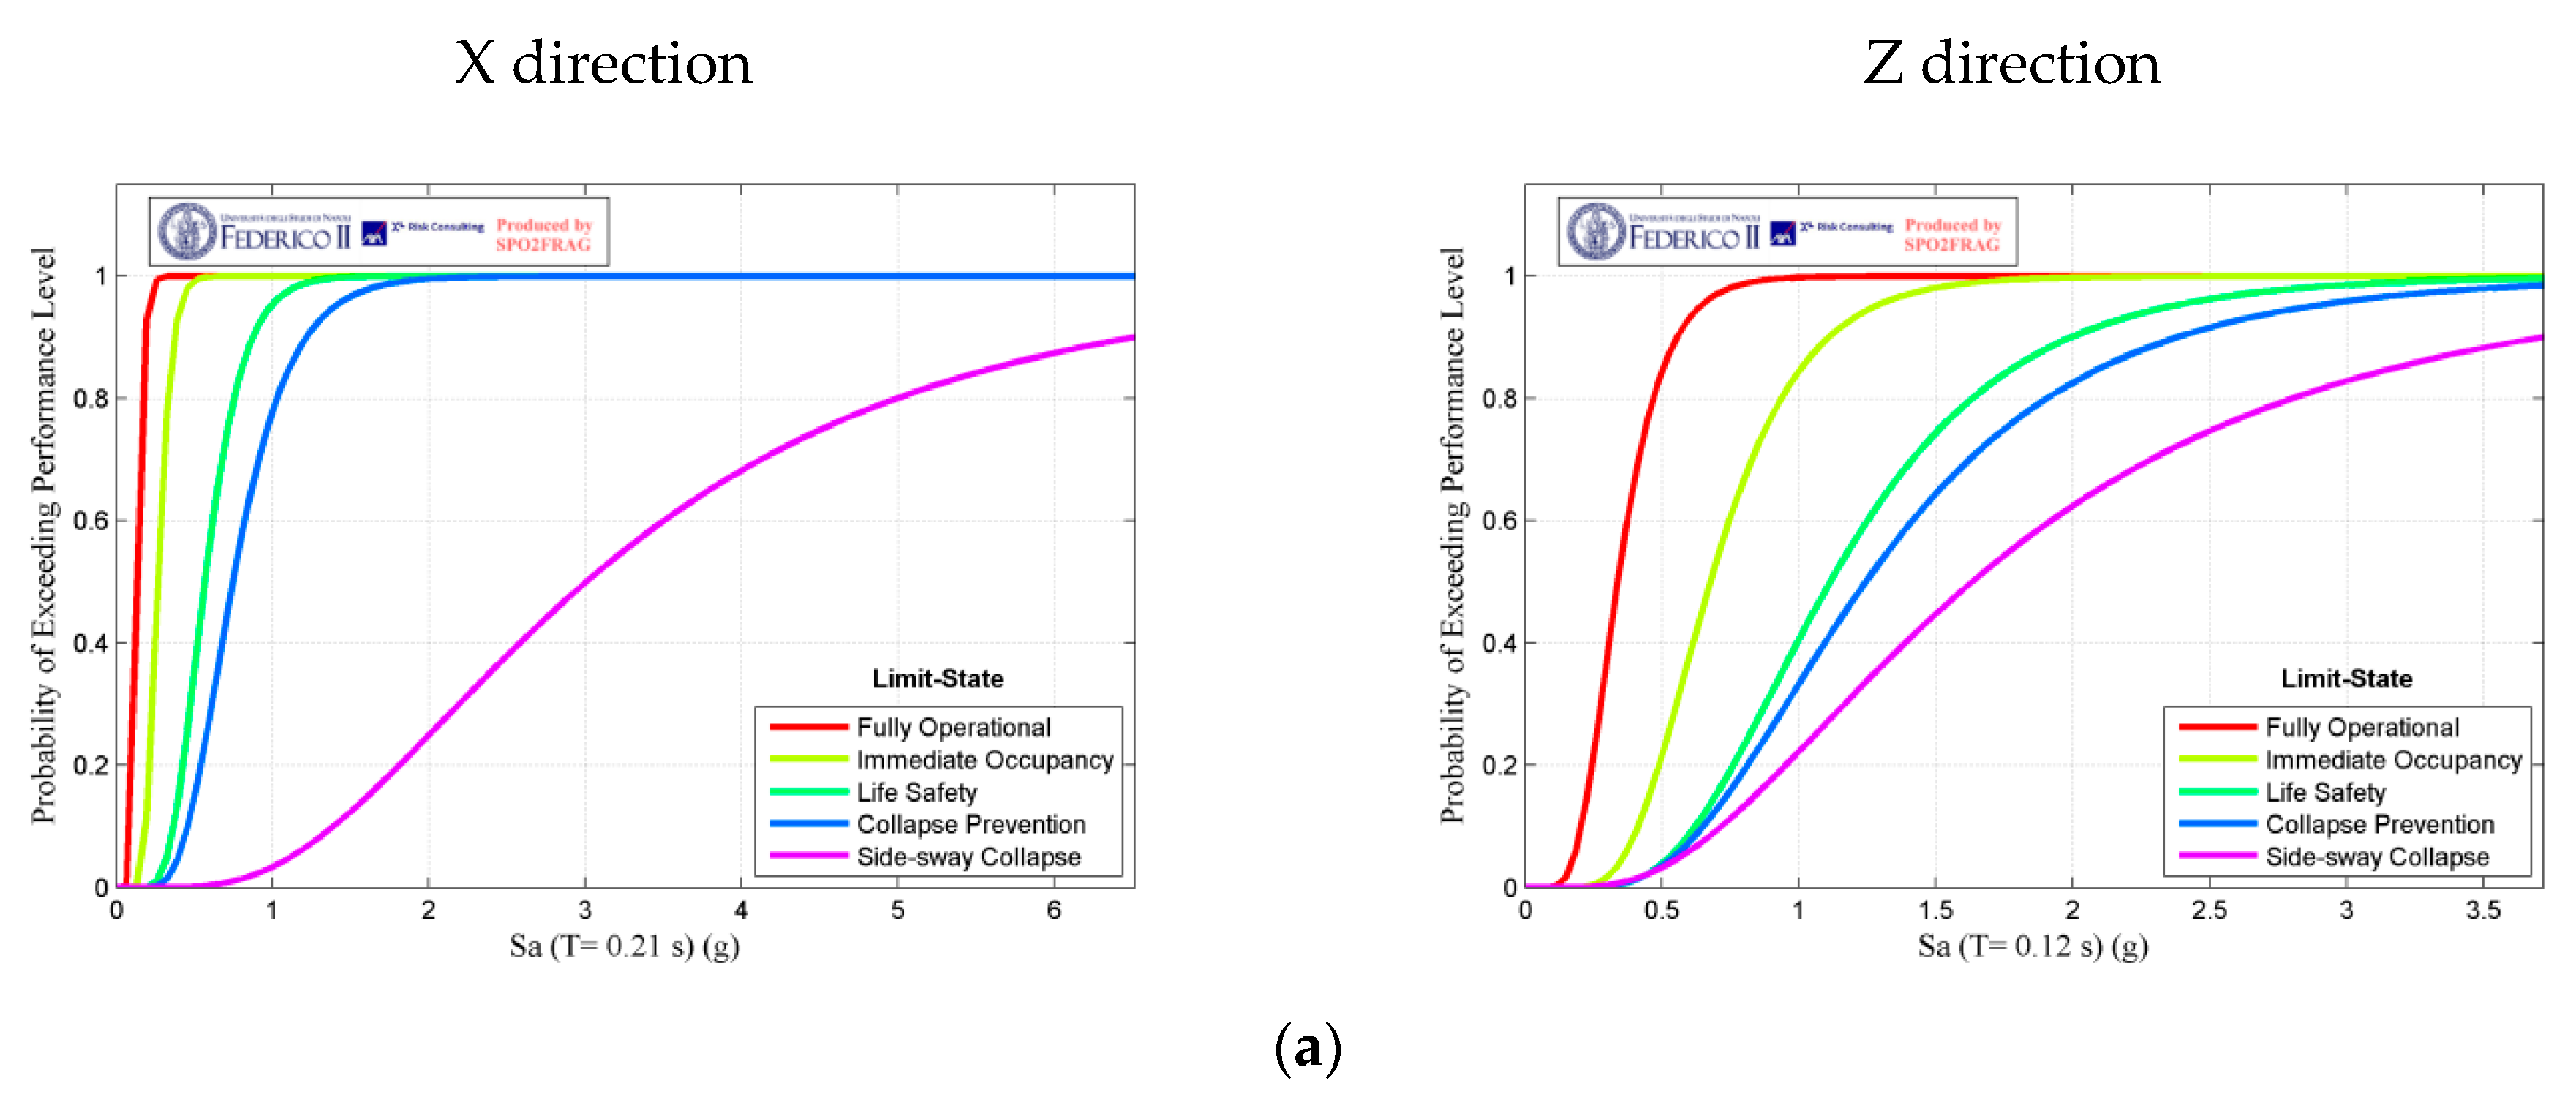
3.2.2. Push-Over Results of the Representative CM Buildings

The maximum principal plastic strain of the CM models that is associated with tensile cracks at the end of analyses is shown in Figure 11. Compared to the results of URM model buildings, the severity and propagation of plastic strains in CM models are higher. This is because the displacements at which the contours were recorded at the end of the analyses are significantly higher for CM models compared to the corresponding URM buildings. As seen in Figure 11, the RC ties experienced severe damages at both ends because of the concentrated shear and flexural forces from the walls.
The fragility curves of the models that determined the probability of exceedance of different performance levels against the spectral acceleration in the first natural model of each CM model in each direction are presented in Figure 12. Comparison of the results of this figure with the corresponding figure about the URM models indicates that great improvement has been achieved thanks to the presence of RC ties in the reduction in the exceedance probability of the performance levels given a spectral acceleration.

4. RVS Basic Scores

In this section, the basic scores for the RVS of the URM and CM buildings are determined based on the results of the fragility curves from the previous section. The collapse factor is the expected collapse when the building is experiencing the complete damage based on HAZUS TM [53]. This parameter is based on the structural system and performance levels, and is 0.15 for the base line performance for URM buildings based on HAZUS. As indicated for P[Complete Damage], the RVS basic score of the buildings depends on the spectral acceleration demand related to the first mode of vibration. As such, it is affected by the first natural mode of vibration of the building, the site effect, and the seismicity of the region. Based on FEMA P-155 [18], the Maximum Credible Earthquake (MCE) was assumed as the demand level for determination of spectral acceleration and the related exceedance probability of CP in the studied buildings. This demand level is 1.5 times higher than the Design-Based Earthquake (DBE) based on Standard 2800 [3]. As such, for each site class according to this code and for each seismicity, the MCE spectral acceleration demand is determined for each building type based on the related natural period of the building in each direction. Accordingly, the exceedance probability of CP for each building model in each direction, based on its natural period of the first mode of vibration, site class, and seismicity of the region can be determined, which finally leads to the RVS score. The results of RVS basic scores of the studied building under various conditions are presented in Table 4.

5. Discussion

The fragility curves of most typical URM and their corresponding CM residential buildings in the older sections of the city of Tehran were derived numerically. The results of the push-over analysis on the 3D finite element models were implemented to derive these curves. The probability of collapse based on the codified spectral acceleration was then used to determine the RVS basic scores of each studied building.
The results of the push-over analyses indicate that the presence of ties leads to more crack propagation, but it does not change the main failure mode of the masonry walls of the studied model buildings. In general, the confined masonry buildings exhibited a significant improvement in the displacement capacity, whereas a marginal increase was observed in the ultimate strength in comparison with their corresponding URM model buildings. This finding is in agreement with several design code recommendations [52].
Speaking of basic scores, there was no sensitivity of the basic scores improvement of CM compared to URM with respect to the site seismicity and soil type. The ratio of basic scores of the studied CM buildings compared with the corresponding URM buildings were increased with an average and standard deviation of 1.51 times and 0.02, respectively. This indicates the considerable contribution of RC ties in reducing the vulnerability of masonry buildings. Based on FEMA P-155, the RVS basic scores for each structural type depends on the seismicity of the region only. Consequently, the results in Table 4 were averaged over the building plan type and site class and are presented in Figure 13. The RVS scores of URM and Reinforced Masonry (RM) [54] with Flexible Diaphragm (FD) in FEMA P-155 are also included in this figure for comparison. The difference between the PGA of different seismicity levels of the two sets of results, i.e., the present study and FEMA P-155, is because of different PGAs related to each seismicity level introduced by ASCE 7 [55], as the basis for FEMA P-155, and Standard 2800, which was the used code for determination of the MCE-related spectral acceleration demand in this study. As seen, good proximity between the results of URM of the present study and those of the URM proposed by FEMA P-155 exists. Moreover, the results of the RVS basic score of CM in this study are comparable with those of RM FD proposed by FEMA P-155.

6. Conclusions

In this study, RVS basic scores for typical URM and corresponding CM buildings in the older parts of the city of Tehran were determined using the methodology prescribed by FEMA P-155. For this purpose, four buildings, which represented a significant number of buildings of their type, were simulated numerically in Abaqus. By performing frequency extraction and push-over analysis on these models, the main results were as follows:
-
The addition of RC ties to the URM buildings has negligible effects on the natural frequencies of the buildings. This result is justified by the fact that RC ties have no meaningful effects on the stiffness and mass of the URM walls.
-
CM buildings, compared to their corresponding URM buildings, showed a significant improvement in the ultimate displacement capacity, whereas no considerable increase in the ultimate strength was achieved. This can be justified by the fact that the RC ties were placed based on common practice at the farthest possible stances from each other, i.e., at the intersection of the perpendicular walls. No special attention was given to Standard 2800 recommendations, which limit the distance of the horizontal and vertical ties to 4 and 5 m, respectively. As such, a marginal increase in the strength was observed thanks to the presence of RC ties, as shown by Yekrangnia et al. [49].
-
The natural frequency and strength of the studied buildings were strongly influenced by the ratio of the walls’ area to the plan area known as the walls’ relative area in each direction of the buildings. The higher this parameter, the lower the natural period and the higher the strength became. Consequently, the minimum required walls’ relative area prescribed by some seismic design codes is a good indicator of the seismic performance of URM and CM buildings.
-
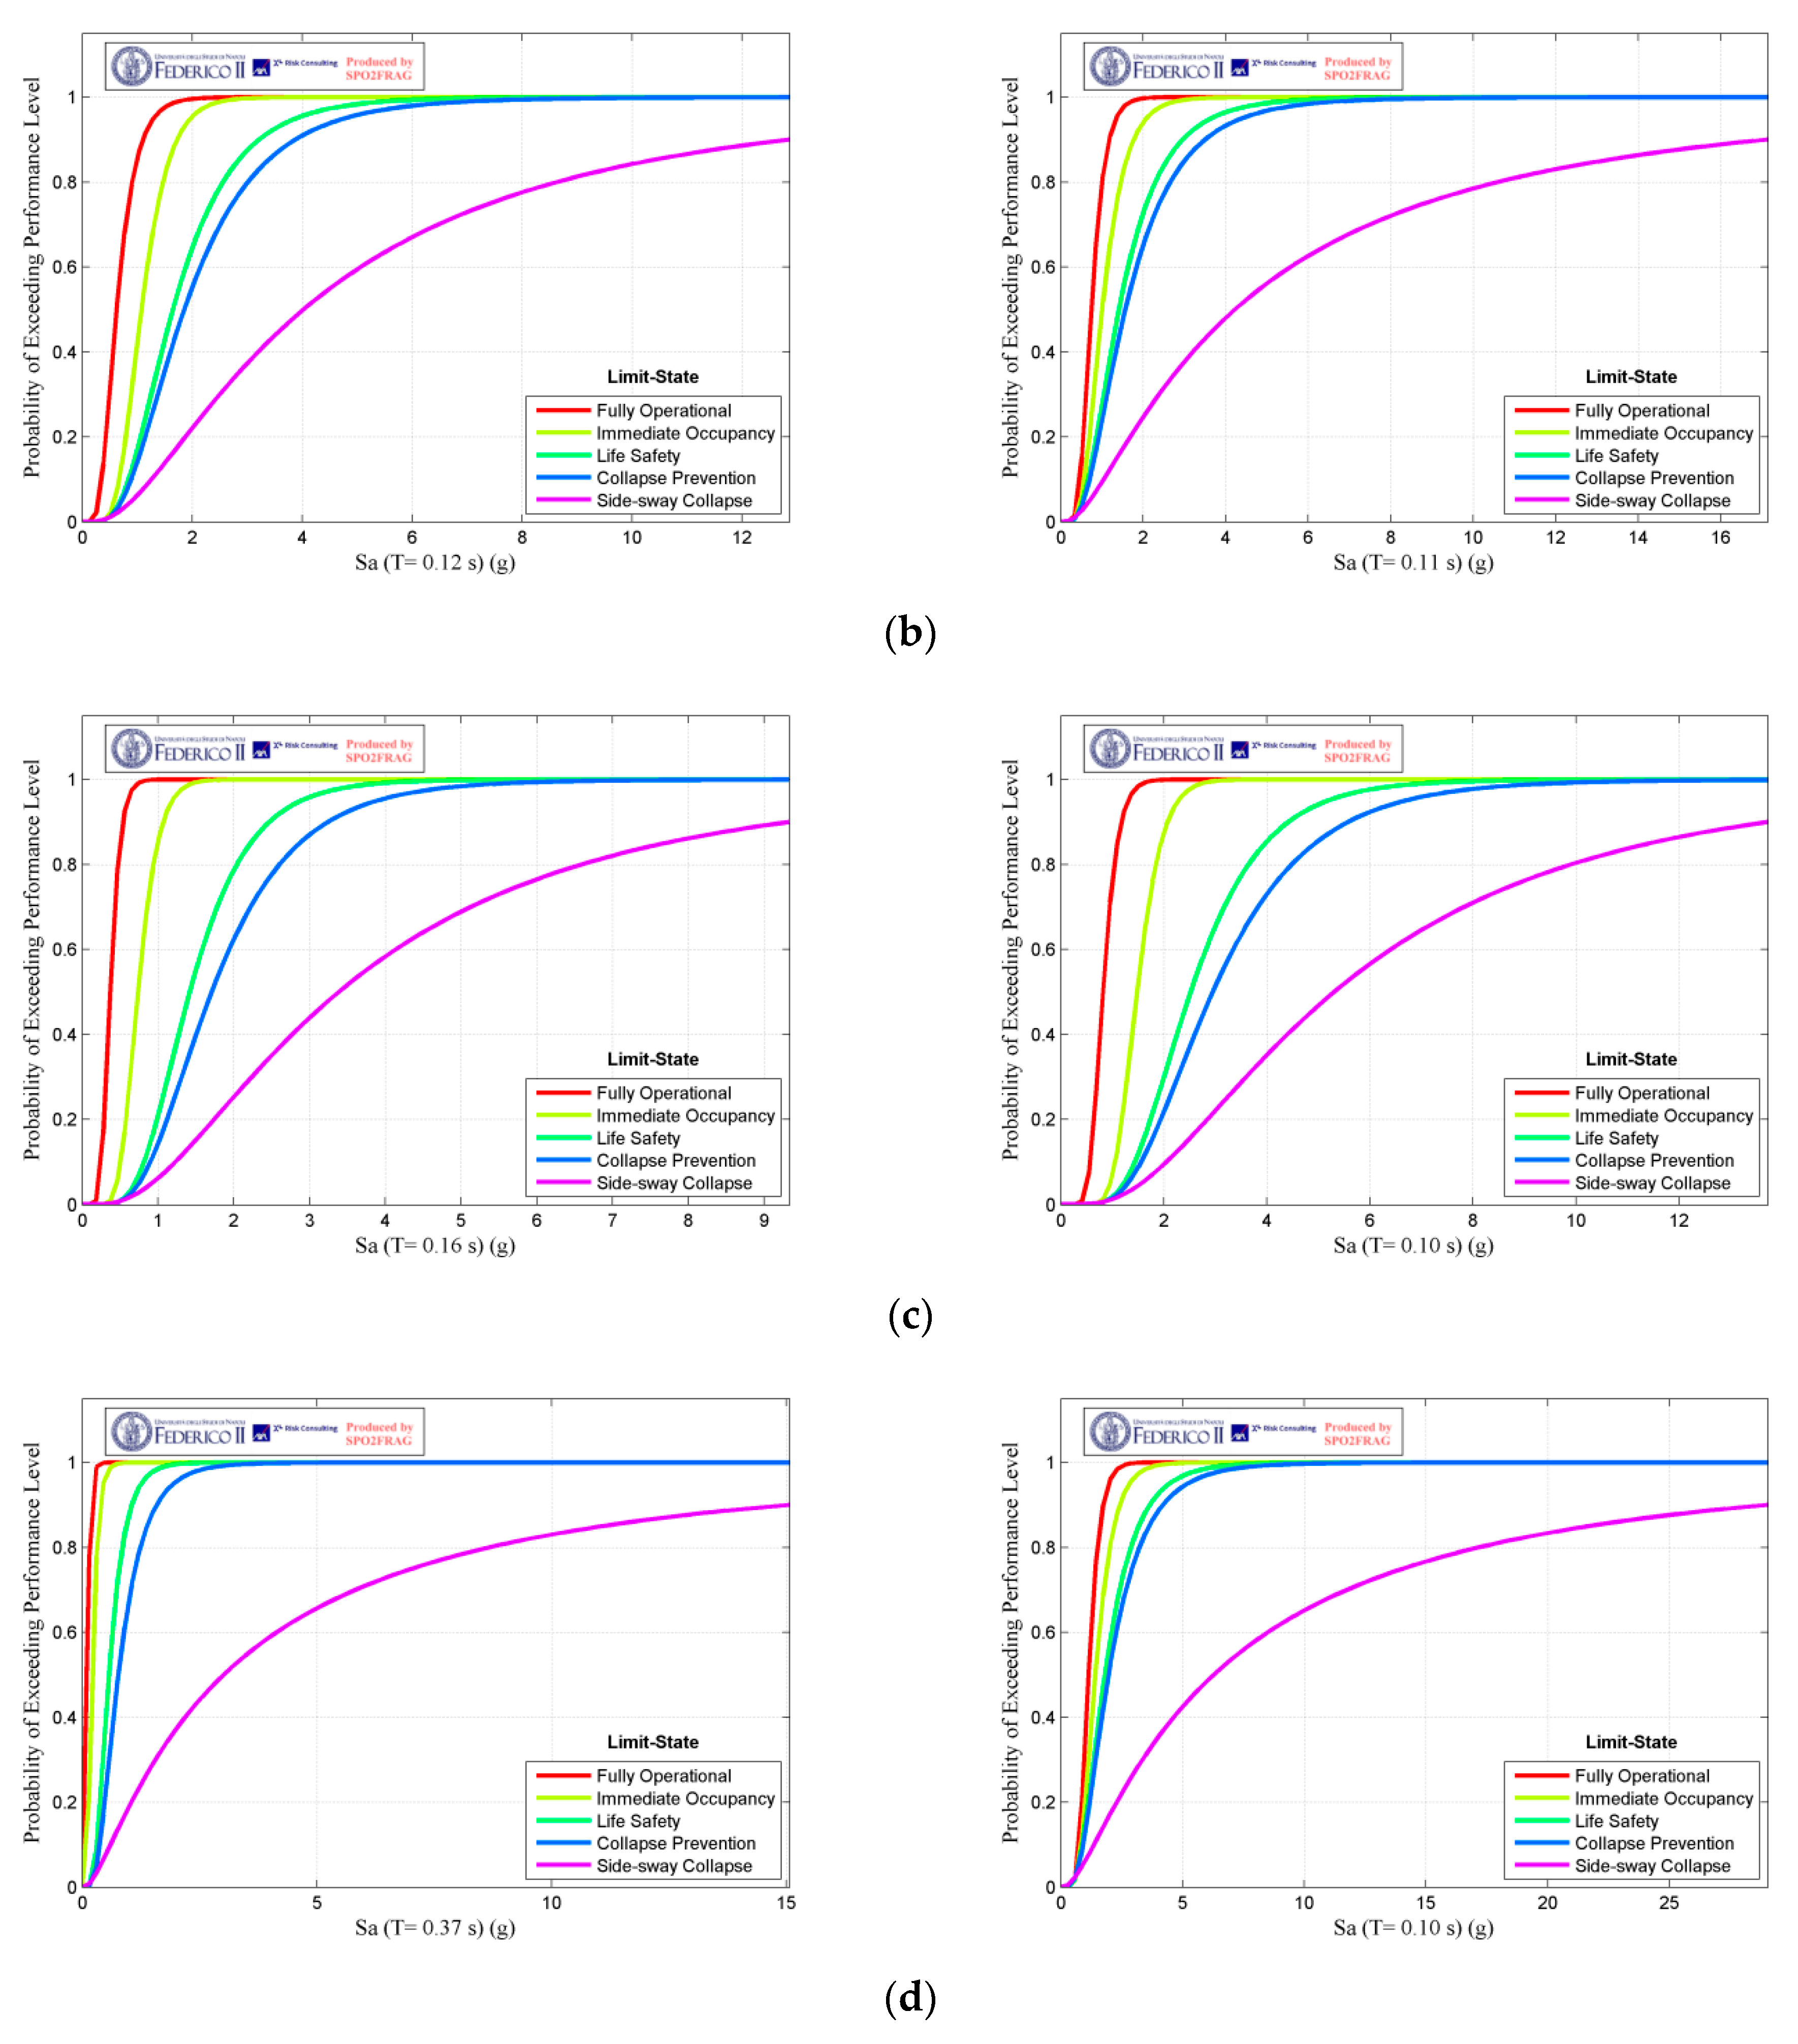
The results of the fragility curves show that, on average, there is 100% increase in the spectral acceleration related to the 50% exceedance probability of the CP performance level of CM buildings compared to their corresponding URM buildings. Other performance levels also experienced a considerable increase in this parameter for CM buildings. This is a very significant performance improvement provided by confining the URM wall with horizontal and vertical RC ties.
-
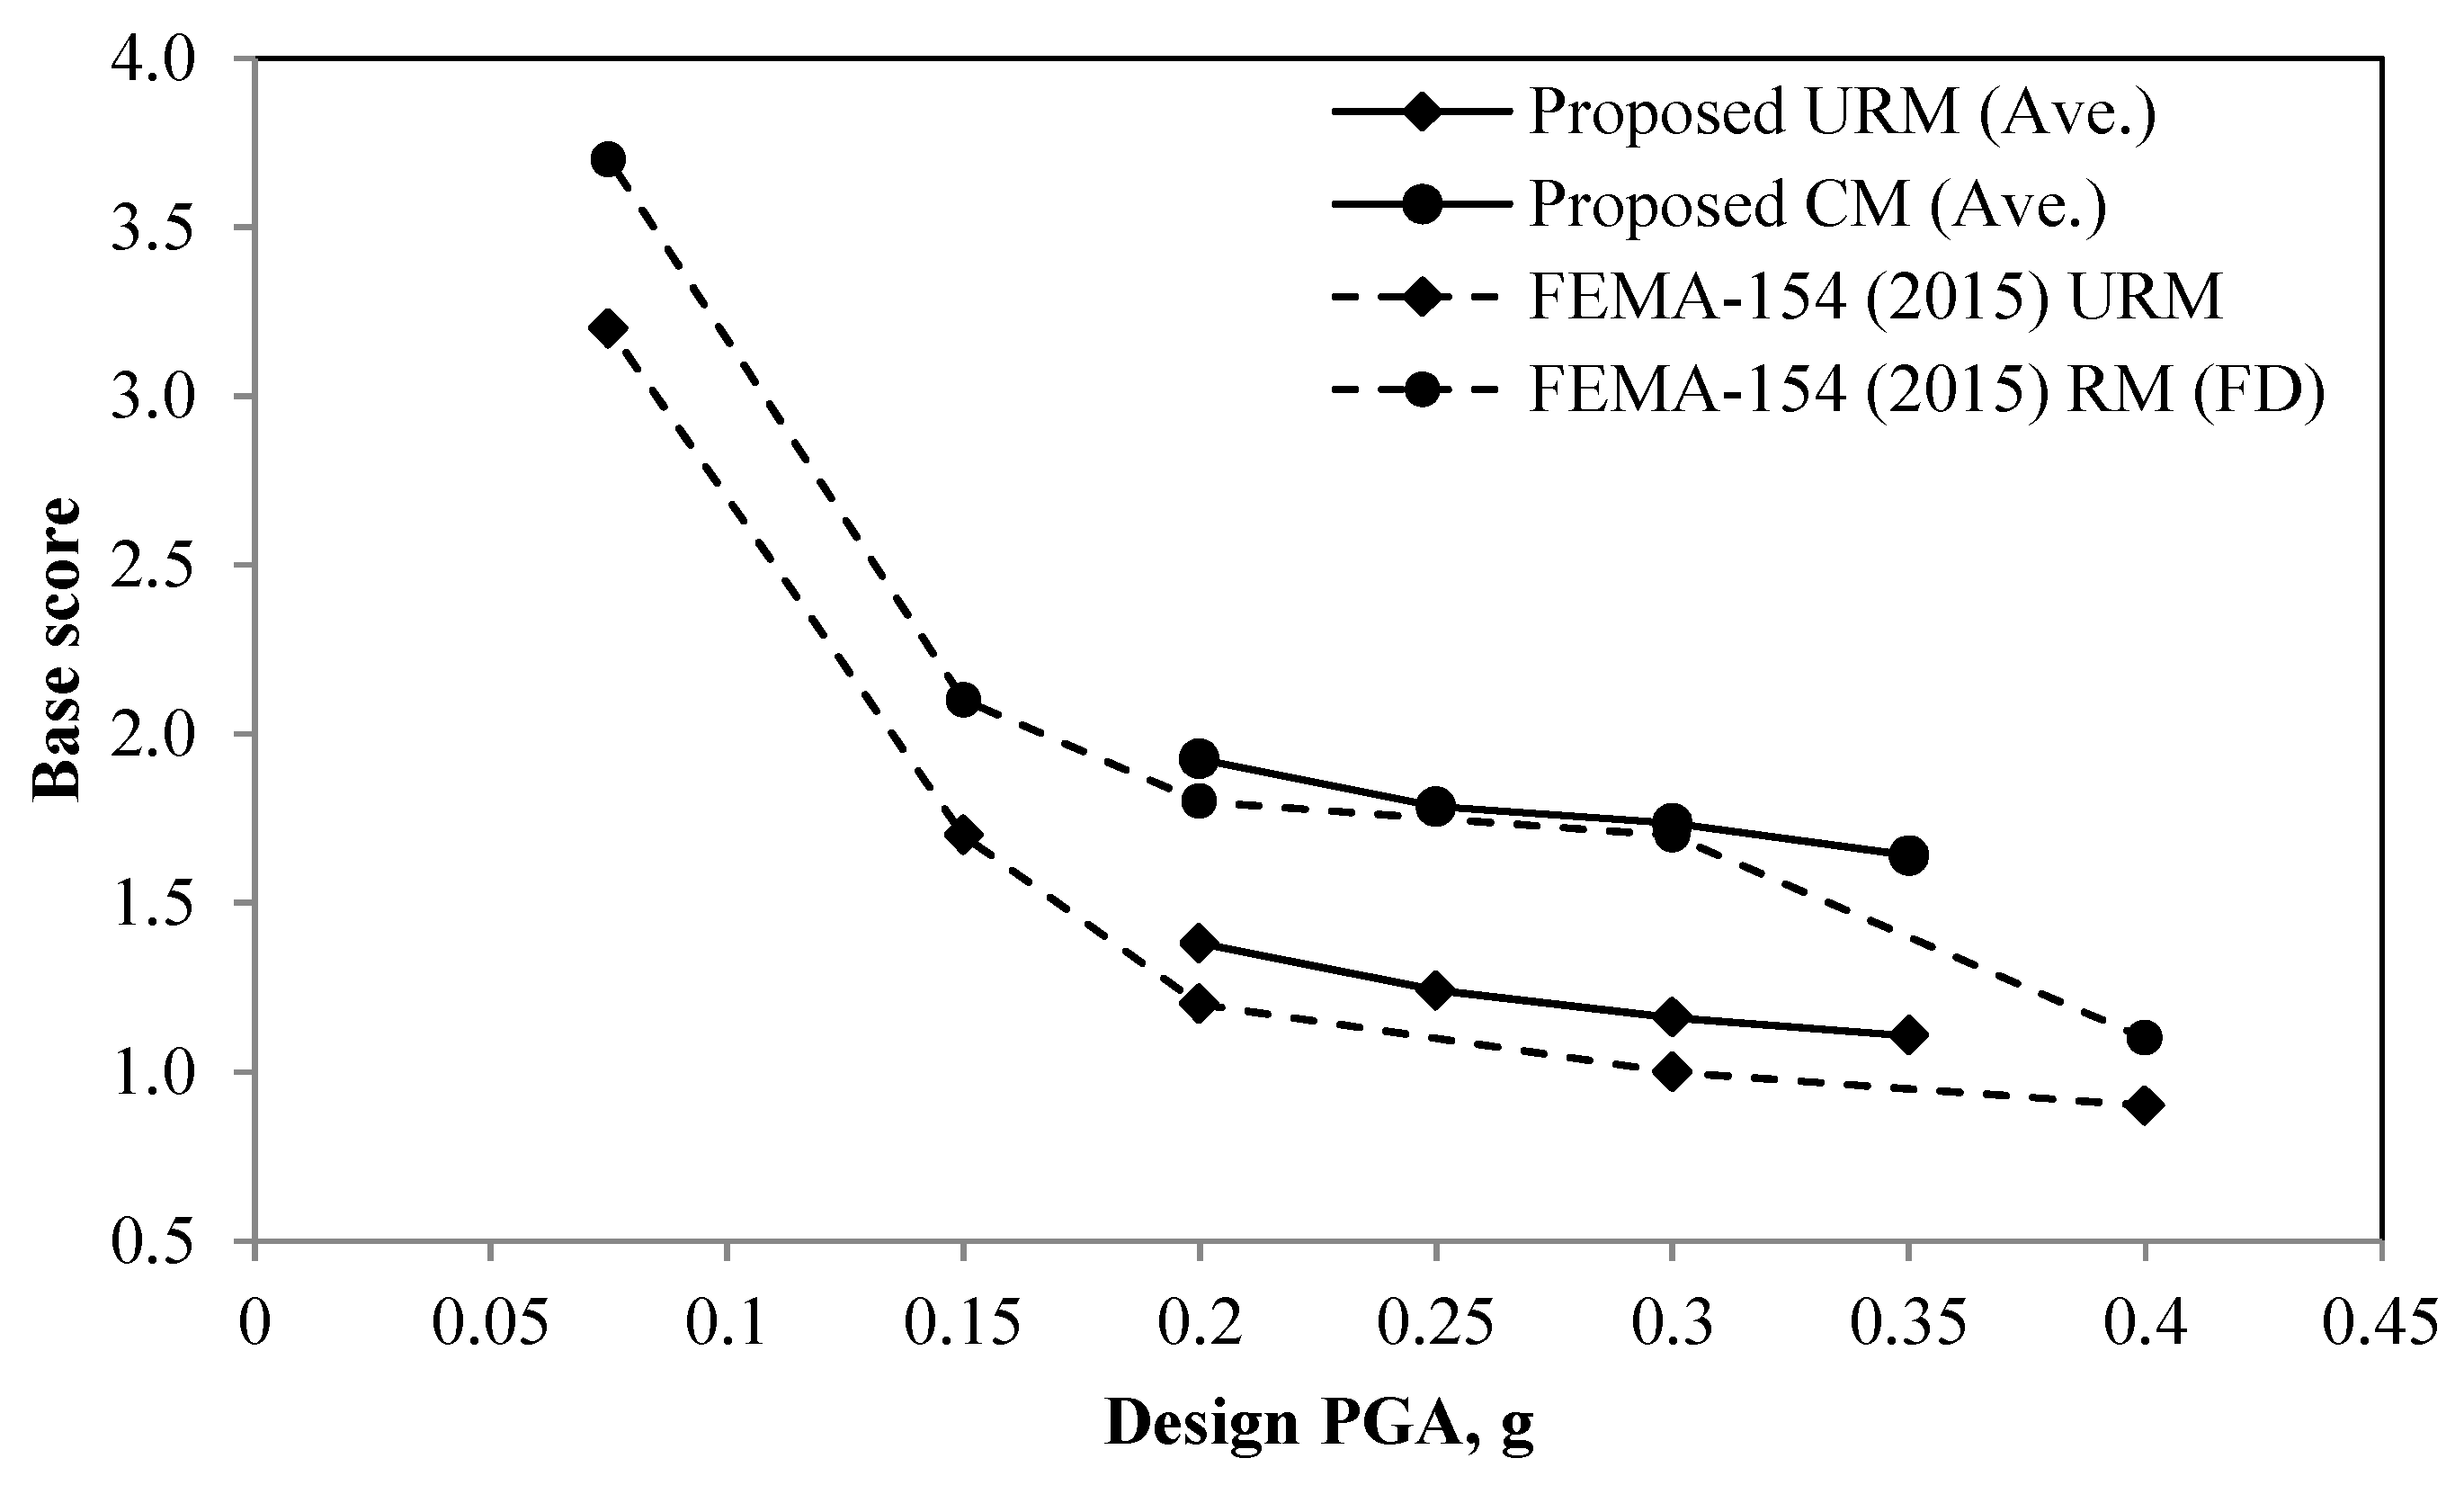
It was observed that the RVS basic score of the studied CM buildings showed an average of 45% increase compared to those of their corresponding URM buildings. Moreover, the decrease in this score because of the higher seismicity of the region for CM was lower than that of the URM; with a 15% decrease in the CM buildings, basic score related to very high seismicity compared to that related to low seismicity, whereas this decrease was 20% for URM buildings.
-
The results of this study are of direct use in performing RVS on URM and CM residential buildings located in the older parts of the city of Tehran, and the determination of their vulnerability paves the way to more detailed studies and seismic risk reduction measures.
-
The results of this study can be directly applied to the RVS of URM and CM buildings. The RVS method leads to prioritization of the buildings prone to higher seismic risk and to assisting decision-makers in the application of seismic risk reduction strategies. With the aid of the basic scores proposed in this study, it is possible to quickly evaluate a large number of buildings to identify those that require more accurate analyses.

Funding

This research was funded by Tehran Disaster Mitigation and Management Organization (TDMMO) grant number 14466.

Data Availability Statement

The data presented in this study are available on request from the corresponding author. The data are not publicly available due to ethical restrictions.

Conflicts of Interest

The author declares no conflict of interest.

References

  1. Muravljov, M.; Stevanović, B. Zidane i Drvene Konstrukcije Zgrada (Masonry and Timber Buildings); Faculty of Civil Engineering, University of Belgrade: Belgrade, Serbia, 2003. (In Serbian) [Google Scholar]
  2. PTN-Z. Pravilnik o Tehničkim Normativima za Zidane Zidove (Technical Norms Regulation for Masonry Walls); Official Gazette of SFRY No. 87/91; Yugoslav Institute for Standardization: Belgrade, Yugoslavia, 1991. (In Serbian) [Google Scholar]
  3. Iranian Code of Practice for Seismic Resistant Design of Buildings (Standard 2800), 4th ed.; Building and Housing Research Center: Tehran, Iran, 2013. (In Persian)
  4. Brzev, S.; Mitra, K. Earthquake-Resistant Confined Masonry Construction; NICEE, National Information Center of Earthquake Engineering, Indian Institute of Technology Kanpur: Kanpur, India, 2007. [Google Scholar]
  5. Rankawat, N.; Brzev, S.; Jain, S.K.; Gavilan, J.J.P. Nonlinear seismic evaluation of confined masonry structures using equivalent truss model. Eng. Struct. 2021, 248, 113114. [Google Scholar] [CrossRef]
  6. Perez Gavilan, J.J.; Flores, L.E.; Alcocer, S.M. An experimental study of confined masonry walls with varying aspect ratios. Earthq. Spectra 2015, 31, 945–968. [Google Scholar] [CrossRef]
  7. Singhal, V.; Rai, D.C. In-plane and out-of-plane behavior of confined masonry walls for various toothing and openings details and prediction of their strength and stiffness. Earthq. Eng. Struct. Dyn. 2016, 45, 2551–2569. [Google Scholar] [CrossRef]
  8. Blagojević, P.; Brzev, S.; Cvetković, R. Simplified seismic assessment of unreinforced masonry residential buildings in the Balkans: The case of Serbia. Buildings 2021, 11, 392. [Google Scholar] [CrossRef]
  9. Ademović, N.; Hadzima-Nyarko, M. Seismic Vulnerability, Damage and Strengthening of Masonry Structures in the Balkans with a Focus on Bosnia and Herzegovina. In Proceedings of the 16th European Conference on Earthquake Engineering, Thessaloniki, Greece, 18–21 June 2018. [Google Scholar]
  10. Yekrangnia, M.; Eghbali, M.; Panahi, M.; Zanganeh, S.Y.; Beyti, M.; Hayatgheybi, S.V. A Preliminary Report on School Buildings Performance during M 7.3 Ezgeleh, Iran Earthquake of November 12, 2017; Earthquake Engineering Research Institute (EERI): Oakland, CA, USA, 2017. [Google Scholar]
  11. Yekrangnia, M.; Torabizadeh, A.; Brzev, S. Post-Earthquake Damage Assessment of Buildings: Comprehensive Experimentally-based Maximum Drift Ratio Predictive Model based on Residual Drift Ratio. J. Earthq. Eng. 2022, 26, 7073–7117. [Google Scholar] [CrossRef]
  12. Instruction for Seismic Rehabilitation of Existing Unreinforced Masonry Buildings (Code 376); Management and Planning Organization Office of Deputy for Technical Affairs: Tehran, Iran, 2012. (In Persian)
  13. Rapid Seismic Evaluation of Existing Buildings (No. 364); Management and Planning Organization Office of Deputy for Technical Affairs: Tehran, Iran, 2008. (In Persian)
  14. Franch, K.A.G.; Morbelli, G.M.G.; Inostroza, M.A.A.; Gori, R.E. A seismic vulnerability index for confined masonry shear wall buildings and a relationship with the damage. Eng. Struct. 2008, 30, 2605–2612. [Google Scholar] [CrossRef]
  15. Lourenço, P.B.; Oliveira, D.V.; Leite, J.C.; Ingham, J.M.; Modena, C.; Da Porto, F. Simplified indexes for the seismic assessment of masonry buildings: International database and validation. Eng. Fail. Anal. 2013, 34, 585–605. [Google Scholar] [CrossRef]
  16. Ortega, J.; Vasconcelos, G.; Rodrigues, H.; Correia, M.; Ferreira, T.M.; Vicente, R. Use of post-earthquake damage data to calibrate, validate and compare two seismic vulnerability assessment methods for vernacular architecture. Int. J. Disaster Risk Reduct. 2019, 39, 101242. [Google Scholar] [CrossRef]
  17. FEMA. Rapid Visual Screening of Buildings for Potential Seismic Hazards: A Handbook (FEMA P-154); Federal Emergency Management Agency: Washington, DC, USA, 2015; p. 388. [Google Scholar]
  18. FEMA. Rapid Visual Screening of Buildings for Potential Seismic Hazards: Supporting Documentation (FEMA P-155); Federal Emergency Management Agency: Washington, DC, USA, 2015; p. 388. [Google Scholar]
  19. Ruggieri, S.; Perrone, D.; Leone, M.; Uva, G.; Aiello, M.A. A prioritization RVS methodology for the seismic risk assessment of RC school buildings. Int. J. Disaster Risk Reduct. 2020, 51, 101807. [Google Scholar] [CrossRef]
  20. Ahmed, S.; Abarca, A.; Perrone, D.; Monteiro, R. Large-scale seismic assessment of RC buildings through rapid visual screening. Int. J. Disaster Risk Reduct. 2022, 80, 103219. [Google Scholar] [CrossRef]
  21. Perrone, D.; Aiello, M.A.; Pecce, M.; Rossi, F. Rapid visual screening for seismic evaluation of RC hospital buildings. In Structures; Elsevier: Amsterdam, The Netherlands, 2015; Volume 3, pp. 57–70. [Google Scholar]
  22. Doğan, T.P.; Kızılkula, T.; Mohammadi, M.; Erkan, İ.H.; Kabaş, H.T.; Arslan, M.H. A comparative study on the rapid seismic evaluation methods of reinforced concrete buildings. Int. J. Disaster Risk Reduct. 2021, 56, 102143. [Google Scholar] [CrossRef]
  23. Gentile, R.; Galasso, C.; Idris, Y.; Rusydy, I.; Meilianda, E. From rapid visual survey to multi-hazard risk prioritisation and numerical fragility of school buildings. Nat. Hazards Earth Syst. Sci. 2019, 19, 1365–1386. [Google Scholar] [CrossRef] [Green Version]
  24. Yekrangnia, M. Advanced Design Examples of Seismic Retrofit of Structures; Butterworth-Heinemann: Oxford, UK, 2018. [Google Scholar]
  25. Raissi, M.; Yekrangnia, M.; Eghbali, M.; Mahdizadeh, A. Report on Retrofit Procedure of School Buildings in Islamic Republic of Iran. In Proceedings of the Second European Conference on Earthquake Engineering and Seismology, Istanbul, Turkey, 25–29 August 2014; pp. 1–11. [Google Scholar]
  26. Borzouie, J.; Yekrangnia, M.; Mahdizadeh, A.; Seyri, H.; Raissi, M. Financial analysis of retrofitting projects and its role in decision making. In Proceedings of the 15th World Conference on Earthquake Engineering, Lisbon, Portugal, 24–28 September 2012. [Google Scholar]
  27. Bakhshi, A.; Ghannad, M.; Yekrangnia, M.; Masaeli, H. Shaking table tests on dome-roof adobe houses. Earthq. Eng. Struct. Dyn. 2017, 46, 467–490. [Google Scholar] [CrossRef]
  28. AbdelRahman, B.; Galal, K. Experimental investigation of axial compressive behavior of square and rectangular confined concrete-masonry structural wall boundary elements. Eng. Struct. 2021, 243, 112584. [Google Scholar] [CrossRef]
  29. Obaidat, A.T.; Ashour, A.; Galal, K. Stress-strain behavior of C-shaped confined concrete masonry boundary elements of reinforced masonry shear walls. J. Struct. Eng. 2018, 144, 04018119. [Google Scholar] [CrossRef]
  30. Pérez-Gavilán, J.J. The effect of shear-moment interaction on the shear strength of confined masonry walls. Constr. Build. Mater. 2020, 263, 120087. [Google Scholar] [CrossRef]
  31. Abrams, D.P.; Moghadam, A.S.; Bozorgnia, Y.; Yekrangnia, M. Seismic retrofit of school buildings in Iran. In Proceedings of the 12th North American Masonry Conference, Denver, CO, USA, 17–20 May 2015. [Google Scholar]
  32. Yekrangnia, M.; Mahdizadeh, A. URM Buildings and Earthquake: In-Depth Evaluation of Earthquake Damages to URM Buildings; State Organization of Schools Renovation Development and Mobilization: Tehran, Iran, 2009. [Google Scholar]
  33. Practical Instructions for Partial Retrofit for Usual Buildings in Tehran; Tehran Disaster Mitigation and Management Organization: Tehran, Iran, 2010. (In Persian)
  34. Moghadam, A.S.; Yekrangnia, M. Prescriptive Retrofit Details for 2-Story URM School Buildings in Iran; Organization for Development, Renovation and Equipping Schools of IR Iran (DRES): Tehran, Iran, 2020. [Google Scholar]
  35. Tasnimi, A. The Behavior of Masonry Walls Constructed according to the Standard 2800; Bulletin of Research No. 404; Building and Housing Research Center: Tehran, Iran, 2004. [Google Scholar]
  36. Yekrangnia, M.; Bakhshi, A.; Ghannad, M.A.; Panahi, M. Risk assessment of confined unreinforced masonry buildings based on FEMA P-58 methodology: A case study—School buildings in Tehran. Bull. Earthq. Eng. 2021, 19, 1079–1120. [Google Scholar] [CrossRef]
  37. Abaqus, User’s Manual Version 6.9; Hibbitt, Karlsson and Sorensen Inc.: Pawtucket, RI, USA, 2005.
  38. Farahani, E.M.; Yekrangnia, M.; Rezaie, M.; Bento, R. Seismic behavior of masonry walls retrofitted by centercore technique: A numerical study. Constr. Build. Mater. 2021, 267, 120382. [Google Scholar] [CrossRef]
  39. Lourenco, P.B. Computational Strategy for Masonry Structures; Faculdade de Engenharia da Universidade do Porto: Porto, Portugal, 1996. [Google Scholar]
  40. Shakib, H.; Mirjalili, A.R. Experimental investigation of the effect of transverse beams on the in-plane behavior of brick-flat-arch roofs. J. Seismol. Earthq. Eng. 2010, 12, 51–59. [Google Scholar]
  41. Gilbert, R.; Warner, R. Tension stiffening in reinforced concrete slabs. J. Struct. Div. 1978, 104, 1885–1900. [Google Scholar] [CrossRef]
  42. Kent, D.C.; Park, R. Flexural members with confined con-crete. J. Struct. Div. 1971, 97, 1969–1990. [Google Scholar] [CrossRef]
  43. Lubliner, J.; Oliver, J.; Oller, S.; Oñate, E. A plastic-damage model for concrete. Int. J. Solids Struct. 1989, 25, 299–329. [Google Scholar] [CrossRef]
  44. Lee, J.; Fenves, G.L. Plastic-damage model for cyclic loading of concrete structures. J. Eng. Mech. 1998, 124, 892–900. [Google Scholar] [CrossRef]
  45. Khanmohammadi, M.; Marefat, M.S. Report of 20 Specimens of Masonry Walls; Structural Laboratory, Department of Civil Engineering, University of Tehran: Tehran, Iran, 2010. [Google Scholar]
  46. Singhal, V.; Rai, D.C. Role of toothing on in-plane and out-of-plane behavior of confined masonry walls. J. Struct. Eng. 2014, 140, 04014053. [Google Scholar] [CrossRef]
  47. Singhal, V.; Rai, D.C. Behavior of confined masonry walls with openings under in-plane and out-of-plane loads. Earthq. Spectra 2018, 34, 817–841. [Google Scholar] [CrossRef]
  48. Farahani, E.M.; Maalek, S. An investigation of the seismic behavior of a deck-type reinforced concrete arch bridge. Earthq. Eng. Eng. Vib. 2017, 16, 609–625. [Google Scholar] [CrossRef]
  49. Yekrangnia, M.; Bakhshi, A.; Ghannad, M.A. Force-displacement model for solid confined masonry walls with shear-dominated failure mode. Earthq. Eng. Struct. Dyn. 2017, 46, 2209–2234. [Google Scholar] [CrossRef]
  50. ASCE/SEI Seismic Rehabilitation Standards Committee. Seismic Rehabilitation of Existing Buildings (ASCE/SEI 41-17); American Society of Civil Engineers: Reston, VA, USA, 2017. [Google Scholar]
  51. Baltzopoulos, G.; Baraschino, R.; Iervolino, I.; Vamvatsikos, D. SPO2FRAG: Software for seismic fragility assessment based on static pushover. Bull. Earthq. Eng. 2017, 15, 4399–4425. [Google Scholar] [CrossRef]
  52. Instruction for Seismic Rehabilitation of Existing Buildings (Code 360); Management and Planning Organization Office of Deputy for Technical Affairs: Tehran, Iran, 2014. (In Persian)
  53. FEMA HAZUS-MH MR4 Earthquake; Technical Manual; Federal Emergency Management Agency, Mitigation Division: Washington, DC, USA, 2009.
  54. Robazza, B.R.; Yang, T.Y.; Brzev, S.; Elwood, K.J.; Anderson, D.L.; McEwen, W. Response of slender reinforced masonry shear walls with flanged boundary elements under in-plane lateral loading: An experimental study. Eng. Struct. 2019, 190, 389–409. [Google Scholar] [CrossRef]
  55. ASCE (American Society of Civil Engineers). Minimum Design Loads for Buildings and Other Structures, ASCE/SEI 7-16; American Society of Civil Engineers: Reston, VA, USA, 2016. [Google Scholar]
Figure 1. (a) Taxonomy of the Iranian residential buildings in rural areas [24]; (b) Year of construction of Iranian masonry school buildings [31]; (c) Scattering of Iranian masonry school buildings based on site seismicity [31]; (d) Number of stories in Iranian masonry school buildings [31].
Buildings 13 00302 g001
Figure 2. Common failure modes of masonry buildings in Iran [32]; (a) Detachment of perpendicular walls—damage at the interface of the walls (often occurs in URM buildings); (b) Horizontal in-plane cracks—damage in masonry walls (common in URM and CM buildings); (c) Stepped-diagonal cracks in the piers—damage in masonry walls (common in URM and CM buildings; if occurs in CM buildings, it propagates into RC vertical ties); (d) Stepped-diagonal cracks in solid walls—damage in masonry walls (common in URM and CM buildings; if occurs in CM buildings, it propagates into RC vertical ties); (e) Shear damage at the ties’ intersection due to insufficient shear reinforcement—damage in RC ties, often vertical ties (only in CM buildings); (f) Flexural failure at ties’ intersection due to inadequate overlapping of the longitudinal reinforcement of horizontal and vertical ties—damage at intersection of RC ties (only in CM buildings).
Buildings 13 00302 g002
Figure 3. Map of the worn-out areas in Tehran (Courtesy of the Department of spatial data of UROT, 2021).
Buildings 13 00302 g003
Figure 4. Geometrical characteristics of the representative URM residential buildings in worn-out areas in Tehran (dimensions are in cm); (a) Type-1 (single-story); (b) Type-2 (two-story); (c) Type-3 (two-story); (d) Type-4 (three-story).
Buildings 13 00302 g004
Figure 5. Details of jack-arch diaphragm system (dimensions are in cm): (a) Building roof; (b) Other stories.
Buildings 13 00302 g005
Figure 6. Location of the horizontal and vertical RC ties in CM model buildings (shown in blue): (a) Type-1 model building (single-story); (b) Type-2 model building (two-story); (c) Type-3 model building (two-story); (d) Type-4 model building (three-story).
Buildings 13 00302 g006
Figure 7. Natural period and mode shapes of the URM model buildings (H: total height; M: total mass).
Buildings 13 00302 g007
Figure 8. Lateral resisting force versus roof lateral displacement of URM and CM models in two directions: (a) Type-1; (b) Type-2; (c) Type-3; (d) Type-4.
Buildings 13 00302 g008
Figure 9. Maximum principal plastic strains (associated with tensile cracks) of the URM models at the end of analyses: (a) Type−1; (b) Type−2; (c) Type−3; (d) Type−4.
Buildings 13 00302 g009
Figure 10. Push-over-based fragility curves of the URM models: (a) Type-1; (b) Type-2; (c) Type-3; (d) Type-4.
Buildings 13 00302 g010
Figure 11. Maximum principal plastic strains (associated with tensile cracks) of the CM models at the end of analyses: (a) Type−1; (b) Type−2; (c) Type−3; (d) Type−4.
Buildings 13 00302 g011
Figure 12. Push-over-based fragility curves of the CM models: (a) Type-1; (b) Type-2; (c) Type-3; (d) Type-4.
Buildings 13 00302 g012aBuildings 13 00302 g012b
Figure 13. Comparison of the RVS basic scores of different masonry systems in the present study and FEMA P-155 for various seismicity levels.
Buildings 13 00302 g013
Table 1. Walls’ ratio in the models.
Model Building NameWalls’ Ratio
X-DirectionZ-Direction
Type-10.070.05
Type-20.050.12
Type-30.050.03
Type-40.060.18
Table 2. Mechanical properties of material [35,45].
MaterialLinearNonlinear
CompressiveTensileShear
E (MPa) υ f c   ( MPa ) κ p   κ m   f t   ( MPa ) G f I   ( MPa . mm ) G f I I   ( MPa . mm )
Masonry20000.153.00.0020.0030.10.040.4
Concrete21,0000.2020.00.0120.0182.00.323.2
Yield strength (MPa)Ultimate strength (MPa)Ultimate strain
Steel210,0000.303004200.07
Table 3. Ultimate strength and ductility ratio of model buildings.
Building TypeURMCM
X DirectionZ DirectionX DirectionZ Direction
Stiffness (MN/m)Strength (kN)Ductility RatioStiffness (MN/m)Strength (kN)Ductility RatioStiffness (MN/m)Strength (kN)Ductility RatioStiffness (MN/m)Strength (kN)Ductility Ratio
Type-11223144.5401621.21243786.6462923.2
Type-23894421.211438751.03945108.911478955.1
Type-38936671.22234151.08946728.42244528.1
Type-4652443.7994712021.0683838.7994913544.1
Table 4. RVS basic score of the studied buildings for various seismicity levels and site classes.
URMCM
Type-1Type-2Type-3Type-4Type-1Type-2Type-3Type-4
XZXZXZXZXZXZXZXZ
1st mode period, s0.210.120.120.070.160.080.370.030.210.120.120.070.160.080.370.03
Soil type I
SeismicityVery high0.920.820.910.941.321.920.820.950.871.111.651.781.352.122.121.43
High0.980.840.971.011.571.980.850.980.911.221.741.821.482.222.221.52
Moderate1.030.861.031.141.922.050.861.120.941.381.781.981.592.222.221.52
Low1.120.971.161.272.222.220.871.221.121.591.872.121.822.352.351.65
Soil type II
Very high0.920.820.910.941.321.920.820.950.871.111.651.781.352.122.121.43
High0.980.840.971.011.571.980.850.980.911.221.741.821.482.222.221.52
Moderate1.030.861.031.141.922.050.861.120.941.381.781.981.592.222.221.52
Low1.120.971.161.272.222.220.871.221.121.591.872.121.822.352.351.65
Soil type III
Very high0.900.820.921.001.281.980.820.950.851.121.681.821.282.122.121.43
High0.930.850.971.081.352.050.840.980.861.231.781.871.382.222.221.52
Moderate1.020.871.051.171.822.120.851.120.871.391.821.981.572.352.351.65
Low1.080.981.201.442.052.350.861.221.081.621.922.221.742.352.351.65
Soil type IV
Very high0.900.820.921.001.281.980.820.950.851.121.681.821.282.122.121.43
High0.930.850.971.081.352.050.840.980.861.231.781.871.382.222.221.52
Moderate0.940.860.981.081.382.050.850.990.881.241.781.871.382.222.221.52
Low1.020.871.111.261.872.120.861.160.891.501.872.221.572.352.351.65
Disclaimer/Publisher’s Note: The statements, opinions and data contained in all publications are solely those of the individual author(s) and contributor(s) and not of MDPI and/or the editor(s). MDPI and/or the editor(s) disclaim responsibility for any injury to people or property resulting from any ideas, methods, instructions or products referred to in the content.

