Article

Experimental Study on Impact Behavior of Concrete Panel with and without Polypropylene Macrofibers

1
GS Construction & Engineering, 33 Jong-ro, Jongno-gu, Seoul 03159, Republic of Korea
2
Department of Civil Engineering, Kangwon National University, Chuncheon 24341, Republic of Korea
*
Author to whom correspondence should be addressed.
Buildings 2023, 13(2), 303; https://doi.org/10.3390/buildings13020303
Submission received: 30 November 2022 / Revised: 13 January 2023 / Accepted: 16 January 2023 / Published: 19 January 2023

Abstract

:
Macrofibers have often been used to increase the tensile strength, durability, crack resistance, spalling, impact resistance, and toughness of concrete. However, the impact behavior of fiber-reinforced concrete (FRC) structures is quite different from their static behavior, and the effectiveness of macrofibers in improving impact resistance should be carefully evaluated. In this study, the impact behavior of FRC with polypropylene (PP) macrofibers was studied through a series of drop-weight impact tests. First, the material characteristics of the FRC with PP fibers under static conditions were evaluated. Test specimens were constructed and drop-weight impact tests were performed. The main parameters were the presence or absence of PP fibers and the drop height, which is related to the magnitude of the impact energy. From the results, it can be found that the crack width of the FRC specimen was smaller than the normal concrete specimen for a similar residual deflection after the impact test due to the bridging effect of the macrofibers. However, the effect of PP fibers on the impact resistance was not significant, even though there was a considerable increase in tensile and flexural performance under static conditions, since the hardening effect after the sharp reduction in strength shown in the static test of FRC is not effective in the impact test.

1. Introduction

The low tensile strength of concrete compared to its compressive strength limits the further application of concrete in many scenarios requiring impact resistance concrete (e.g., barriers under vehicles, railway accidents, offshore structures exposed to ship collisions, and protective structures in rock-fall zones) [1]. New concrete materials have been developed to compensate for tensile weakness by adding fibers to concrete mixtures to create fiber-reinforced concrete (FRC). Various discontinuous fibers, such as steel, polypropylene (PP), carbon, and polyvinyl alcohol (PVA), are commonly used to enhance tensile strength, durability, crack resistance, impact resistance, spalling, and toughness [2,3,4]. The impact energy-absorption capacity of fibers that fail, pull out, or bridge during impact makes FRC a good candidate for impact-resistant concrete.
Fibers can be categorized as microfibers or macrofibers. Microfibers are less than 0.3 mm in diameter and 12–19 mm in length, and the typical dose varies from 0.05 to 0.2% by volume. Macrofibers are 38–51 mm in length with a dosage of up to 10 kg/m3, depending on the application [4,5]. Fibers can be classified into two groups according to their purpose: structural performance or crack control. Microfibers are used to control shrinkage cracks in concrete without providing any resistance to further crack development and to reduce the explosive spalling of high-strength concrete exposed to fire. Due to the bridge effect, macrofibers can replace the steel reinforcement in concrete and fulfill a load-bearing function while also increasing flexural toughness and impact resistance [5].
Many studies have been conducted on steel and microfibers, but research on macrofibers is rare [2,6,7]. The structural application of PVA fibers is very limited because of their high cost and lack of local availability [8]. Yoo and Banthia [4] extensively reviewed the effect of fiber on impact resistance by considering fiber type and shape, orientation, and coarse aggregate. They reported that the strain-rate sensitivity of FRC varied according to the loading condition, matrix strength, and saturation. Blazy and Blazy [2] summarized the research on PP fiber-reinforced concrete and reported a positive effect on concrete impact resistance. Feng et al. [9], Altalabani et al. [10], and Karimipour et al. [11] conducted tests for the impact resistance of concrete with PP fibers, and they reported that the impact resistance of PP fiber-reinforced concrete is greater. As a result, PP macrofibers were adopted as a possible economical fiber material for impact-resistant concrete in this study. However, the impact tests used by previous researchers [9,10,11] were small-scale, and they focused on the material response rather than structural behavior. Thus, the effect of PP macrofibers on impact behavior should be verified at the structural system level.
The behavior of FRC under impact loading is different from that under static conditions. Thus, the effectiveness of FRC on impact resistance should be evaluated carefully while considering fiber characteristics, fiber volume, and impact-load conditions. For example, a high-volume fraction of fiber plays an important role in the enhancement of mechanical performance, and fibers with a volume fraction of 2% exhibit excellent pull-out behavior and bond strength [12]. However, an increase in the fiber content can affect the workability and consistency due to unevenly distributed small clumps of fibers and improper low fluidity. Therefore, the appropriate fiber content should be carefully determined to improve the mechanical properties of FRC. Furthermore, an optimal fiber fraction in static conditions is unlikely to be available for impact loading conditions.
The best way to investigate the impact behavior of FRC is by experimental study. The drop-weight impact test is commonly used because it can easily change the input impact energy by adjusting the drop height and concrete mass. The widely accepted and simplest low-velocity impact test method is the drop-weight test proposed by ACI [9,13,14], and many experiments have been conducted by developing independently instrumented impact-testing facilities [15,16,17,18]. Wu et al. [19] and Chen [15] investigated the impact characteristics of concrete using drop-weight impact tests at a strain-rate range of 10−1/s to 102/s.
Meanwhile, the impact resistance of normal and high-strength concrete, FRC, and even nanoscale FRC have been investigated [7]. However, these studies were mainly conducted on beams constructed using steel and polymer fibers or discussed blast effects on building damage [20]. Relatively few studies have been conducted on the impact behavior of concrete panels with PP macrofibers under low strain rates of loading, such as vehicle impact, plane crashes, or the collision of hydrogen storage vessels in a hydrogen station. Additionally, it is noted that the study with the large-scale impact test is rare, while most studies were performed with a small-scale impact test machine.
In this study, we focused on the impact behavior of an FRC panel with PP macrofibers compared to reinforced concrete at low strain rates, such as vehicle impact. The material properties of FRC with PP fibers under static conditions were evaluated. Subsequently, an experimental study was conducted using the drop-weight impact test. The main parameters were the impact energy and the effect of the PP macrofibers on the impact resistance. Six test specimens were constructed and tested by varying the drop-weight height. The impact energy-absorbing ability, crack, and deformation profiles were investigated through a series of tests.

2. Experimental Program

2.1. Test Material Sample Preparation

Type I ASTM C150 Ordinary Portland Cement (OPC), fly ash, and ground-granulated blast slag (GGBS) manufactured in Korea were used in this study. The tensile strength and modulus of elasticity of macro-scale PP fibers (51 mm in length and 0.67 mm in diameter) were 600 MPa and 9.5 GPa, respectively. Local crushed coarse aggregate and a combination of clearly washed sea sand and crushed fine aggregate were used. Granulometric curves of fine and coarse aggregate are shown in Figure 1.
The normal concrete (NC) for reinforced concrete (RC) panels used as the reference test specimens for the drop-weight tests had a minimum compressive strength, fc, of 27 MPa with a water-to-binder ratio of 0.42. The FRC mixture was engineered to obtain a minimum compressive strength of 40 MPa with a water-to-binder ratio of 0.40. The mixture proportions are listed in Table 1.
Because the target slump was set above 180 mm to ensure proper consistency and consolidation, the final fiber content was determined at a volume fraction of 1.125% with a slump of 195 mm. NC and FRC were produced at the same batch plant by adding all ingredients and fibers in predetermined quantities. For each mixture, 100 mm (diameter) × 200 mm (height) cylindrical specimens were prepared for compressive strength (ASTM C39) and modulus of elasticity (ASTM C469) tests.
The flexural strength tests of NC according to ASTM C78 and the flexural performance tests of FRC with third-point loading in accordance with ASTM C1609 [21] were conducted using 100 mm × 100 mm cross sections and 400 mm length prism specimens under displacement control at a constant rate of 0.0016 mm/s as shown in Figure 2, where the length between the supports, L, is 300 mm. Ten dog-bone specimens with dimensions of 30 mm × 30 mm × 60 mm were cast for direct tensile strength testing according to JSCE [22]. All the mixtures were cured in water for 28 days.

2.2. Concrete-Panel Specimens

Three concrete panels were made of FRC with the addition of PP macrofibers, and the same number of NC slabs were constructed for comparison. Six specimens were prepared for the drop-weight test, and the dimensions are shown in Figure 3.
All concrete panels had the same geometry (1000 mm × 760 mm × 150 mm) and reinforcement details. Five longitudinal reinforcements with a diameter of 10 mm were placed at the top and bottom of the specimen, with a spacing of 150 mm and a cover depth of 35 mm. Thus, the specimen’s 0.48% reinforcement ratio satisfied the minimum ratio of 0.35% specified in ACI 318 [23]. Four transverse reinforcements with diameters of 10 mm were placed at a spacing of 300 mm. It is noted that such a concrete panel is intended to be used as a barrier for a vehicle impact or train derailment. The main failure mode of such a barrier is a flexural failure by the impact load. Thus, the panel was designed to be failed by flexure, and the size of the specimen was determined by considering the dimensions of the drop-weight test facility. If PP macrofibers can increase the flexural performance of the specimen when an impact load is applied, it is suitable for impact resistance concrete, which can be confirmed by comparing the results of the FRC and NC specimens.

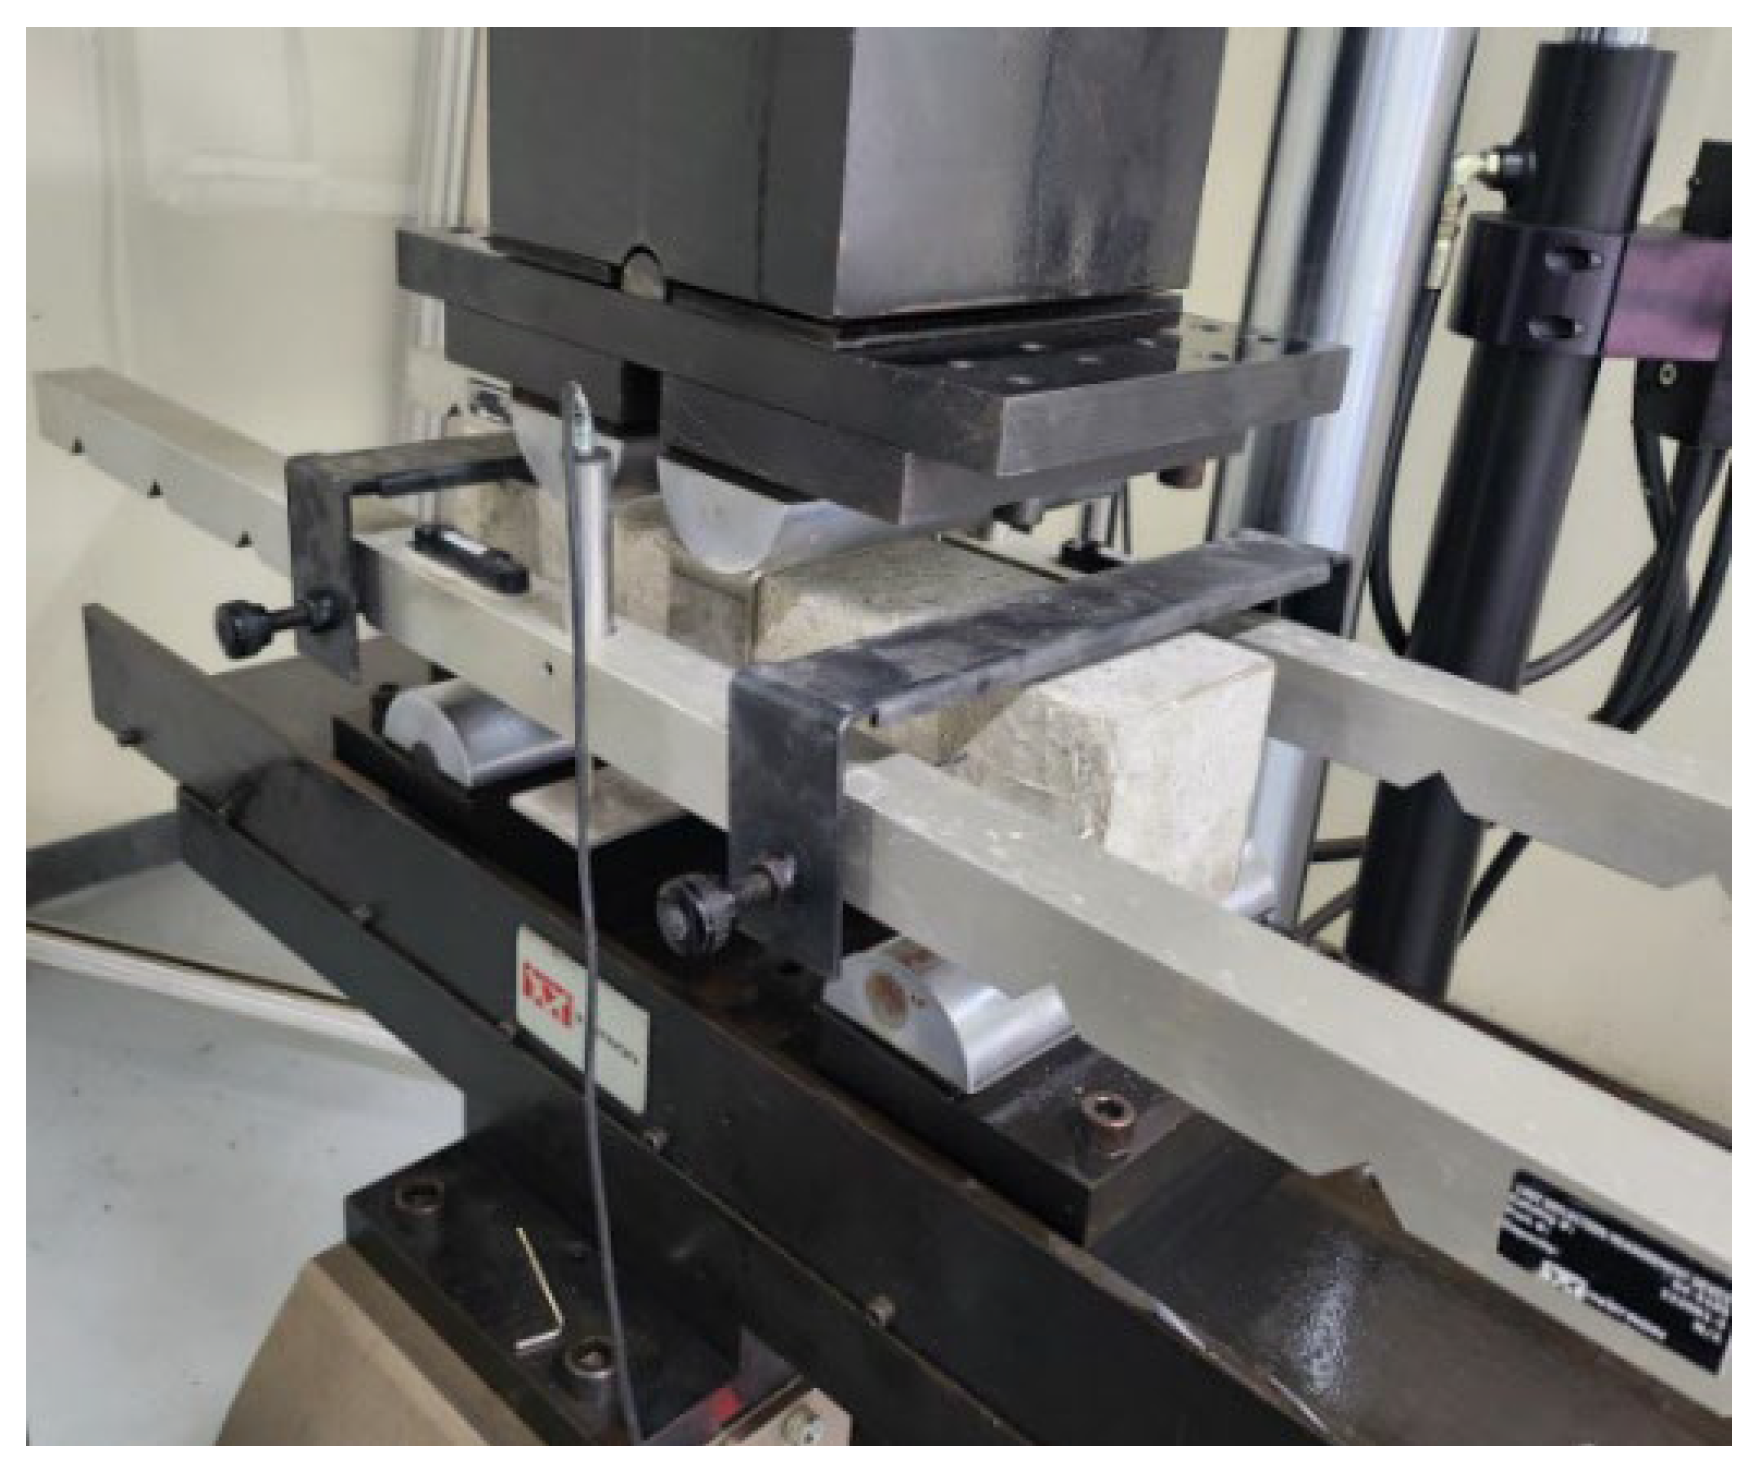
2.3. Drop-Weight Test Setup

The drop-weight test facility used is shown in Figure 4. The impact equipment consisted of an impact frame, two load cells with a capacity of 1000 kN each, and an impact head. The maximum drop height was 5.0 m, and the total mass of the impact equipment was 718 kg, where the mass of the impact frame, two load cells, and impact head was 430 kg, 14 kg, and 274 kg, respectively. The impact head had a rectangular shape with an impact width and depth of 135 mm and 500 mm, respectively.
The impact force obtained from the two load cells was different than the total impact force on the specimen because the load cells were located between the impact frame and impact head, as shown in Figure 5. In Figure 5, m1 and m2 are the masses of the impact head and frame, respectively, and a is the acceleration of the impact equipment. The impact force obtained from the load cells is equal to the mass of the impact frame multiplied by the acceleration of the impact equipment. Therefore, the total impact force must be calibrated by considering the mass of the impact head. The impact force can also be obtained from the impact acceleration. A 2000-g accelerometer was attached to the impact equipment to record the acceleration during the test.
Two high-speed cameras were located on both sides of the drop-weight test equipment to record the movement and displacement of the impact equipment and specimen at a rate of 2400 fps. The concrete panel specimens were supported on steel frames without restraints. The specimens were struck at various impact velocities by varying the drop-weight height, and the test details are summarized in Table 2. In Table 2, the drop height represents the measured height immediately before the impact test, and the impact velocity is the theoretical velocity calculated from the conservation of mechanical energy. It is noted that the maximum drop height was determined by the preliminary finite element analysis for the NC specimens, and the NC specimens completely failed when the drop height was equal to 1.0 m.

3. Test Results

3.1. Material Test Results

From the material tests under static conditions, the average cylindrical compressive strength at 28 days, fc, and the modulus of elasticity, Ec, of the NC mixture were 28.4 MPa and 19,369 MPa, respectively. In the case of the FRC mixture, the average fc and Ec were 51.0 MPa and 24,764 MPa, respectively. The target fc of NC and FRC were 27 MPa and 40 MPa, respectively. The actual fc of NC was almost the same as the target value, whereas the fc of the FRC was 27.5% higher than the designed value.
The flexural strength, fr, of the NC mixture was 3.4 MPa, and rapid brittle failure was observed, similar to other ordinary concrete. The flexural behavior of the FRC mixture was quite different than that of the NC mixture, and the strength–deflection relationship obtained from the flexural performance test in accordance with ASTM C1609 [21] is shown in Figure 6. A total of eight specimens (F1–F8) were tested. After the first peak, a sudden drop in the flexural strength was observed up to approximately 50% of the first peak. Hardening occurred up to approximately 100% of the first peak with remarkable ductile behavior.
The toughness of the FRC mixture was calculated according to ASTM C1609 [21] using the area under the strength–deflection curves up to the deflection of L/150, where L is the length between the supports (300 mm). The toughness varied from 27.5 J to 38.1 J at 2 mm deflection, while the average toughness of NC was estimated at approximately 1.2 J.
Figure 7 shows the direct tensile strength–strain relationship obtained from the direct tension test of a dog-bone specimen. A total of ten specimens (DT1–DT10) were used for the direct tension test, respectively. The overall behavior was similar to that of the flexural test, exhibiting a strain-softening response after the first peak. The average tensile strain capacity was approximately 6.0%, the average ultimate tensile strength was 2.85 MPa, and one or two major cracks were formed in the dog-bone specimens. The strength reduction after the first peak was approximately 51% of the first-peak tensile strength. The strength recovery with hardening behavior was smaller than that of the flexural performance test.
The tensile behavior of the concrete was clearly enhanced by adding PP fibers with a fiber volume fraction of 1.125%. However, a strength reduction after the first peak was observed, and the effect of the residual strength after the first peak on the flexural and tensile behavior during the impact should be verified, as the flexural and direct tensile behaviors noted in Figure 6 and Figure 7 were obtained from static conditions.

3.2. Data Filtering of Drop-Weight Test Results

The data from the impact test contained a large amount of unnecessary noise, and appropriate filtering of the data was needed. Figure 8a,b shows the Fast Fourier Transform (FFT) results of the load cell and accelerometer data of specimen NC-3 (refer to Table 2). As shown in Figure 8, the accelerometer data included high-frequency noise compared to the load cell data because the accelerometer is more sensitive to vibration than the load cell. Both the load cell and accelerometer results contained significant data with large amplitudes in the low-frequency region of 100 Hz or less.
A CFC filter is often used for vehicle collision tests, and CFC180 (cutoff frequency of 300 Hz) and CFC60 (cutoff frequency of 100 Hz) filters were adopted for the evaluation of occupant-protection performance and acceleration time–history analysis, respectively [24,25]. Because meaningful data are distributed at frequencies lower than 100 Hz and in the range of 200–300 Hz, as shown in Figure 8, both the CFC180 and CFC60 filters were examined to find the proper filtering method for the drop-weight impact tests.
The comparison results of the filtering method are shown in Figure 9, where the y-axis represents the impact forces obtained from the load cell and accelerometer. The impact force can be obtained directly from the load cell. In the case of the accelerometer, the impact load must be calculated by multiplying the mass by the filtered acceleration of the impact equipment. As mentioned in Section 2, the load cells were located between the impact frame and impact head, and only the mass of the impact frame was considered in the calculation.
The CFC180 filtering results continued to fluctuate after filtering, whereas the CFC60 results provided a much smoother impact force–time relationship. The maximum discrepancy in the impact forces obtained from the load cell and accelerometer was 31.79% and 4.32% for the CFC180 and CFC60 filters, respectively. Thus, the CFC60 filtering method was adopted in this study to investigate the impact behavior of the drop-weight tests.

3.3. Drop-Weight Test Results and Discussion

3.3.1. Failure Modes

Drop-weight impact tests were conducted on the NC and FRC specimens listed in Table 2. The failure shapes after the tests are shown in Figure 10 and Figure 11 for the NC and FRC specimens, respectively.
The maximum deflections during the tests and the residual deflections of the test specimens were obtained from the deflection tracking data of the high-speed cameras, and the results are summarized in Table 3. Figure 12 represents an example of deflection tracking for the NC-3 specimen. The maximum deflection during the impact was 10.26 mm, and the residual displacement after impact was approximately 5.47 mm; these values are the same as those shown in Table 3.
Typical flexural cracks occurred in the NC specimens. The NC-3 specimen successfully protected against the impact; however, considerable flexural cracks developed. The flexural cracks almost reached the upper faces of the concrete panel of NC-5, where the drop height was 0.508 m. In the case of NC-10, with a drop height of 1.0 m, even when the flexural cracks penetrated the specimen, the impact energy, which was approximately 7.044 kJ, was fully absorbed by the specimen without a complete collapse and separation. However, it is expected that the NC specimens may not withstand an impact energy higher than 7.044 kJ because the flexural crack completely penetrated the specimen. The maximum and residual deflection of the NC-10 specimen significantly increased compared to that of the NC-5 specimen, as shown in Table 3. For example, the residual deflection of the NC-10 specimen was 28.00 mm, which was 293% higher than that of the NC-5 specimen, even if the impact energy of the NC-10 specimen was approximately two times greater than that of the NC-5 specimen. In comparison, for the NC-3 and NC-5 specimens, the residual deflection of 75% increased when the impact energy increased by 66%.
The major cracks in the FRC specimens were developed by the flexure, as shown in Figure 11. Compared to the NC specimens, the penetration depths of the flexural cracks were smaller. For the FRC-5 specimen, the crack propagated to approximately 2/3 of the specimen depth from the bottom. For the FRC-10 specimen, the flexural cracks almost reached the upper part of the specimen, as shown in Figure 11c. The crack widths of the FRC specimens were smaller than those of the NC specimens. For example, the maximum crack width was approximately 2.0 mm when the residual deflection was 5.09–5.10 mm for the FRC-3 and FRC-5 specimens, while the maximum crack width was 4.0 mm for a similar residual deflection for the NC specimens (see NC-3 specimen in Table 3). This may be attributed to the increase in the compressive strength of the concrete and the bridging effect of the PP macrofibers. All the FRC specimens successfully absorbed impact energy without a complete collapse. However, similar to the NC specimens, the residual deflection and crack width of the FRC-10 specimen (an impact energy of 7.058 kJ) were considerably greater compared to the FRC-3 and FRC-5 specimens.

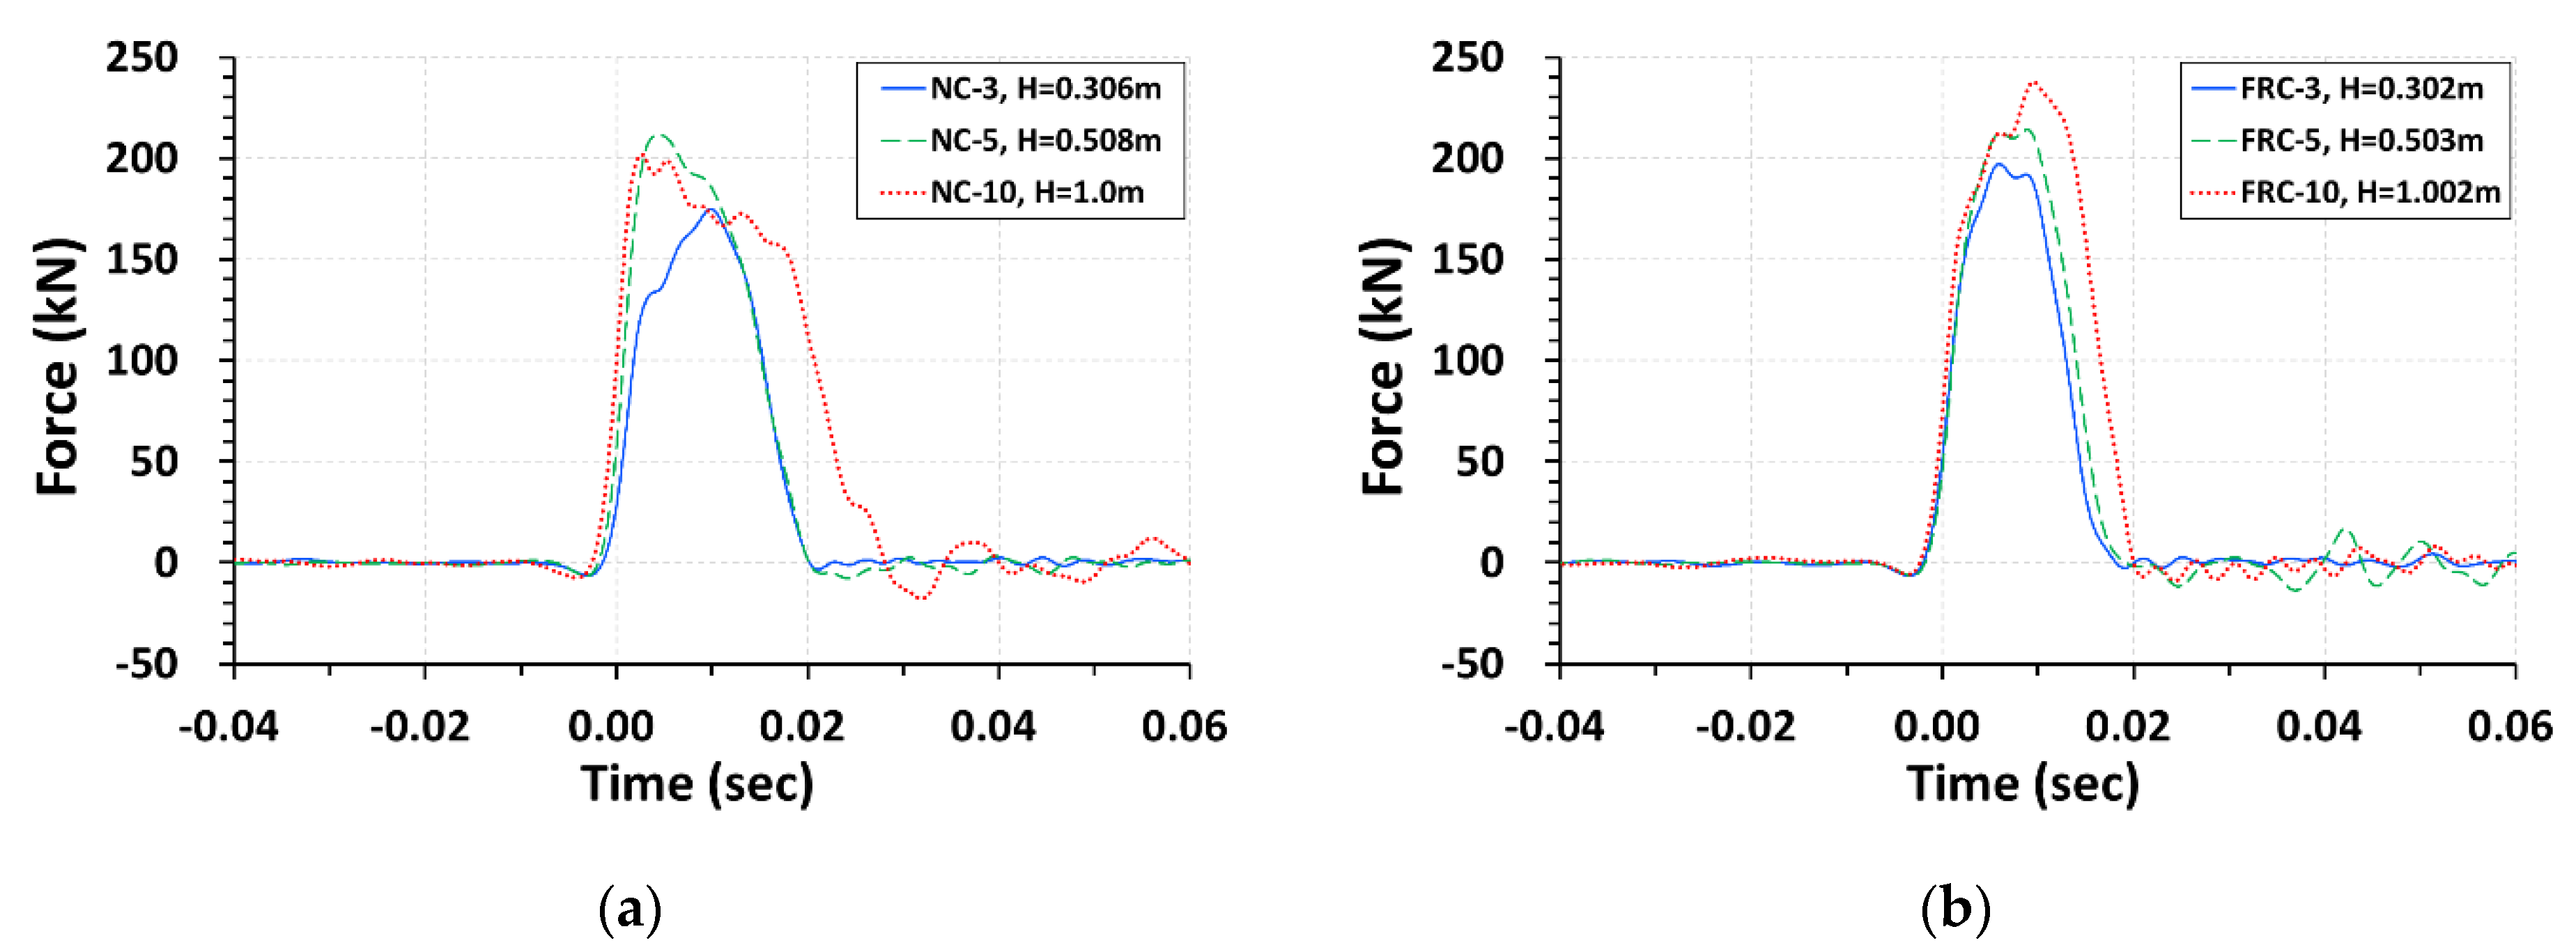
3.3.2. Impact Behavior

The impact forces on each specimen were evaluated, and the impact force–time curves obtained from the acceleration data are shown in Figure 13a,b for the NC and FRC specimens, respectively. The CFC60 filter described in Section 2 was used to convert the acceleration data to impact force.
For both the NC and FRC specimens, the maximum impact force increased with an increase in the drop height from approximately 0.3 m to 1.0 m, as shown in Table 4. The maximum impact force of the NC-10 specimen was slightly smaller than that of the NC-5 specimen because the impact force is limited by its own strength and does not increase once the impact force reaches that strength; however, the impact duration increased.
It is difficult to conclude whether the impact resistance of the FRC specimen was better than that of the NC specimen from the maximum impact forces shown in Figure 13 and Table 4 because the moment capacities of the two specimens were different. Thus, in this study, the average impact force acting on the duration of impact was evaluated and compared with the static maximum load obtained from the nominal moment capacity of the specimen. The average impact force, which can be treated as the static ultimate load, can be obtained by dividing the area of the impact force–time curve in Figure 13 by the impact duration. The calculated values are listed in Table 4. The static nominal moment capacities of the NC and FRC specimens were calculated as 21.3 kN.m and 23.9 kN.m, respectively. From these moment capacities, the ultimate static loads, Pu, for the NC and FRC specimens were obtained as 128.1 kN and 143.8 kN, respectively. The ratio of the average impact force to Pu is presented in Table 4.
The ratios of the average impact force to Pu of the NC-5 and NC-10 specimens were almost equal to 1. This means that the maximum impact resistance of the NC specimen may be limited to approximately 3.578 kJ (the impact energy of NC-5) to 7.044 kJ (the impact energy of NC-10). Only the FRC-10 specimen obtained a ratio of the average impact force to Pu of 1.0 among FRC specimens. Therefore, the impact resistance of the FRC-10 specimen was approximately 7.058 kJ (the impact energy of FRC-10). These results agree with the trends shown in the failure-shape analysis results in Section 3.3.1.
The compressive strength of the FRC mixture was 51 MPa and was much higher than that of the NC mixture. This leads to a higher moment capacity. The effect of the residual strength of the FRC shown in the flexural and direct tensile strength tests (refer to Figure 5 and Figure 6) was not considered in the calculation of Pu. Thus, the improvement in the impact resistance of the FRC specimen was a result of the high moment capacity caused by the high fc and not from the enhanced tensile ductility of the FRC mixture. Considering the residual strengths shown in the flexural and direct tensile strength tests, the moment capacity of FRC specimens will be much higher than what is in Table 4, resulting in a much lower ratio of the average impact force to Pu. However, the FRC-10 specimen almost failed to resist the impact load. Thus, the effects of residual strength and ductility shown in the flexural and direct tensile tests of FRC mixtures should not be considered in the impact behavior of FRC. Flexural and direct tensile strength tests are static tests, and the FRC exhibited a rapid strength reduction after the peak strength was obtained and subsequent hardening occurred. This hardening effect after the sharp decrease in strength after the first peak may not be effective for the impact test due to the higher strain-rate effect rather than the static condition. This means that the enhanced tensile performance of the FRC with PP macrofibers does not have a significant effect on the impact behavior. This conclusion is somewhat different from those of previous studies [2,9,10,11]. This is because previous studies measured impact resistance by using the toughness obtained from flexural performance tests, and when conducting drop-weight tests, previous studies used small-scale tests that focused on material behavior rather than structural performance.

4. Conclusions

This study presented the impact behavior of FRC panels with and without PP macrofibers. Firstly, the static flexural performance and direct tensile tests for FRC with PP macrofibers were conducted to identify the material characteristics under static conditions. From the test results, it can be seen that a sudden drop in strength of approximately 50% occurred after the peak strength, followed by strength hardening for the flexural performance and direct tensile tests in static conditions.
Then, a total of six FRC and NC panel specimens were constructed, and drop-weight impact tests were performed to investigate the effect of PP macrofibers on the impact behaviors. The major findings from the impact tests are as follows:
(1)
The Fast Fourier Transform results showed that both the load cell and accelerometer data contained a significant number of large amplitudes in the low-frequency region of 100 Hz or less, and the CFC60 filter (cutoff frequency of 100 Hz) is suitable for acceleration and load cell data filtering. The maximum discrepancy in the impact force obtained from the load cell and accelerometer was 4.32% for the CFC60 filter.
(2)
The drop-weight impact test showed that the main damage was a flexural crack in both the FRC and NC specimens. The crack width of the FRC specimen was comparatively smaller than that of the NC specimen for a similar residual deflection after the impact test. This may be attributed to the bridging effect of the macrofibers.
(3)
The average impact force was calculated from the impact force–time curves. Subsequently, the calculated average impact forces of each specimen were compared to the static ultimate load of the specimen. A comparison of results showed that the static ultimate load without the effect of residual strength and ductility exhibited in the flexural and direct tension tests for FRC mixtures agreed with the impact test results. This may be attributed to the hardening effect after the sharp reduction in strength demonstrated in the static test of FRC, which is not effective for the impact test due to its high strain rate compared to that of the static test. However, it should be noted that limited impact tests were conducted in this study, and various specimen scales, boundaries, and loading conditions should be examined in order to quantify the effect of PP macrofibers on the impact behavior. Additionally, a detailed finite element study with the validated model should be used for further parametric analysis.

Author Contributions

Methodology, J.M. and K.Y.; investigation, K.Y.; writing—original draft preparation, J.M.; writing—review and editing, K.Y.; project administration, K.Y. All authors have read and agreed to the published version of the manuscript.

Funding

This work was supported by the Ministry of Land, Infrastructure, and Transport of the Korean government through the Railway Technology Research Program (RS-2021-KA163289).

Conflicts of Interest

The authors declare no conflict of interest.

References

  1. Ismail, M.K.; Hassan, A.A.A.; Lachemi, M. Performance of Self-Consolidating Engineered Cementitious Composite under Drop-Weight Impact Loading. J. Mater. Civ. Eng. 2019, 31, 04018400. [Google Scholar] [CrossRef]
  2. Blazy, J.; Blazy, R. Polypropylene Fiber Reinforced Concrete and Its Application in Creating Architectural Forms of Public Spaces. Case Stud. Constr. Mater. 2021, 14, e00549. [Google Scholar] [CrossRef]
  3. Madjlessi, N.; Cotsovos, D.M.; Moatamedi, M. Drop-Weight Testing of Slender Reinforced Concrete Beams. Struct. Concr. 2021, 22, 2070–2088. [Google Scholar] [CrossRef]
  4. Yoo, D.Y.; Banthia, N. Impact Resistance of Fiber-Reinforced Concrete—A Review. Cem. Concr. Compos. 2019, 104, 103389. [Google Scholar] [CrossRef]
  5. ACI Committee 544; American Concrete Institute. Report on Indirect Method to Obtain Stress-Strain Response of Fiber-Reinforced Concrete (FRC); American Concrete Institute: Farmington Hills, MI, USA, 2016; ISBN 9781942727729. [Google Scholar]
  6. Mindess, S.; Zhang, L. Impact Resistance of Fibre-Reinforced Concrete. Proc. Inst. Civ. Eng. Struct. Build. 2009, 162, 69–76. [Google Scholar] [CrossRef]
  7. Chorzepa, M.G.; Masud, M.; Yaghoobi, A.; Jiang, H. Impact Test: Multi-Scale Fiber-Reinforced Concrete Including Polypropylene and Steel Fibers. ACI Struct. J. 2017, 114, 1429–1444. [Google Scholar] [CrossRef]
  8. Zhang, Q.; Baral, K. Development of High Performance Impact Resistant Concrete Mixtures for Crash Barrier Application LTRC (No. FHWA/LA.17); Louisiana Department of Transportation and Development: Baton Rouge, LA, USA, 2018. [Google Scholar]
  9. Feng, J.; Sun, W.; Zhai, H.; Wang, L.; Dong, H.; Wu, Q. Experimental Study on Hybrid Effect Evaluation of Fiber Reinforced Concrete Subjected to Drop Weight Impacts. Materials 2018, 11, 2563. [Google Scholar] [CrossRef] [PubMed] [Green Version]
  10. Altalabani, D.; Bzeni, D.K.H.; Linsel, S. Mechanical properties and load deflection relationship of polypropylene fiber reinforced self-compacting lightweight concrete. Constr. Build. Mater. 2020, 252, 119084. [Google Scholar] [CrossRef]
  11. Karimipour, A.; Ghalehnovi, M.; Brito, J.; Attari, M. The effect of polypropylene fibres on the compressive strength, impact and heat resistance of self-compacting concrete. Structures 2020, 25, 72–87. [Google Scholar] [CrossRef]
  12. Yoo, D.Y.; Banthia, N. Mechanical Properties of Ultra-high-Performance Fiber-Reinforced Concrete: A Review. Cem. Concr. Compos. 2016, 73, 267–280. [Google Scholar] [CrossRef]
  13. ACI Committee 544. 544.2R-89 Measurement of Properties of Fiber Reinforced Concrete; American Concrete Institute: Farmington Hills, MI, USA, 1999; Volume 544. [Google Scholar]
  14. Liu, Y.; Wei, Y. Drop-Weight Impact Resistance of Ultrahigh-Performance Concrete and the Corresponding Statistical Analysis. J. Mater. Civ. Eng. 2022, 34, 04021409. [Google Scholar] [CrossRef]
  15. Chen, Y.; May, I.M. Reinforced Concrete Members under Drop-Weight Impacts. Proc. Inst. Civ. Eng. Struct. Build. 2009, 162, 45–56. [Google Scholar] [CrossRef] [Green Version]
  16. Abid, S.R.; Murali, G.; Ahmad, J.; Al-Ghasham, T.S.; Vatin, N.I. Repeated Drop-Weight Impact Testing of Fibrous Concrete: State-of-the-Art Literature Review, Analysis of Results Variation and Test Improvement Suggestions. Materials 2022, 15, 3948. [Google Scholar] [CrossRef] [PubMed]
  17. Ranade, R.; Li, V.C.; Heard, W.F.; Williams, B.A. Impact Resistance of High Strength-High Ductility Concrete. Cem. Concr. Res. 2017, 98, 24–35. [Google Scholar] [CrossRef]
  18. Rehacek, S.; Hunka, P.; Kolisko, J.; Kratochvile, L. Two Type of Impact Load Tests, Tested on Fibre Reinforced Concrete Specimens. Procedia Eng. 2013, 65, 278–283. [Google Scholar] [CrossRef] [Green Version]
  19. Wu, M.; Chen, Z.; Zhang, C. Determining the Impact Behavior of Concrete Beams through Experimental Testing and Meso-Scale Simulation: I. Drop-Weight Tests. Eng. Fract. Mech. 2015, 135, 94–112. [Google Scholar] [CrossRef]
  20. Abbas, H.; Siddiqui, N.; Almusallam, T.; Abadel, A.; Al-Salloum, Y. Prediction of Ballistic Limit of Strengthened Reinforced Concrete Slabs Using Quasi-Static Punching Test. Buildings 2022, 12, 1815. [Google Scholar] [CrossRef]
  21. American Society of Testing and Materials C1609. Standard Test Method for Flexural Performance of Fiber-Reinforced Concrete (Using Beam with Third-Point Loading); ASTM International: Conshohocken, PA, USA, 2012. [Google Scholar] [CrossRef]
  22. Uchida, Y.; Tanaka, Y.; Katagiri, M.; Niwa, J. Outlines of JSCE “Recommendations for Design and Construction of Ultra High Strength Fiber Reinforced Concrete Structures (Draft)”. Concr. J. 2005, 43, 3–8. [Google Scholar] [CrossRef] [PubMed]
  23. ACI Committee 318. 318-14 Building Code Requirements for Structural. Concrete (ACI 318-14) and Commentary (ACI 318R-14); American Concrete Institute: Farmington Hills, MI, USA, 2017. [Google Scholar]
  24. SAE J211-1; Instrumentation for Impact Test, Part 1. Electronic Instrumentation. SAE International: Warrendale, PA, USA, 1995.
  25. ISO 6487; Road Vehicles: Measurement Techniques in Impact Tests: Instrumentation. International Organization for Standardization (ISO): Geneva, Switzerland, 2000.
Figure 1. Granulometric curves of fine and coarse aggregate.
Buildings 13 00303 g001
Figure 2. Test setup of flexural performance following ASTM C1609 [21].
Buildings 13 00303 g002
Figure 3. Details of concrete-panel specimens.
Buildings 13 00303 g003
Figure 4. Drop-weight test setup.
Buildings 13 00303 g004
Figure 5. Impact load calculation.
Buildings 13 00303 g005
Figure 6. Flexural strength–deflection relationship of FRC mixture.
Buildings 13 00303 g006
Figure 7. Direct tensile strength–strain relationship of FRC mixture.
Buildings 13 00303 g007
Figure 8. Fast Fourier Transform results of measured raw data: (a) load cell; (b) accelerometer.
Buildings 13 00303 g008
Figure 9. Impact-force comparison obtained from load cell and accelerometer considering only the mass of the impact frame: (a) CFC180 (300 Hz); (b) CFC60 (100 Hz).
Buildings 13 00303 g009
Figure 10. Failure shape of NC specimens after drop-weight test: (a) H = 0.306 m; (b) H = 0.508 m; (c) H = 1.000 m.
Buildings 13 00303 g010
Figure 11. Failure shape of FRC specimens after drop-weight test: (a) H = 0.302 m; (b) H = 0.503 m; (c) H = 1.002 m.
Buildings 13 00303 g011
Figure 12. Example of deflection tracking for the NC-3 specimen.
Buildings 13 00303 g012
Figure 13. Impact-force–time curves: (a) NC specimens; (b) FRC specimens.
Buildings 13 00303 g013
Table 1. Concrete mixture proportions.
ItemNCFRC
Type 1 OPC (kg/m3)315270
GGBS (kg/m3)40180
Fly ash (kg/m3)40N/A
Fine aggregate (kg/m3)833831
Coarse aggregate (kg/m3)902834
Water (kg/m3)167180
Admixture (kg/m3)2.775.4
Fibers by volume (%)N/A1.125%
Table 2. Details of drop-weight test.
Test SpecimenMixtureDrop Height (m)Impact Velocity (m/s)
NC-3NC0.3062.45
NC-5NC0.5083.16
NC-10NC1.0004.43
FRP-3FRC0.3022.43
FRP-5FRC0.5033.14
FRP-10FRC1.0024.43
Table 3. Summary of failure modes.
Test SpecimenDrop Height (m)Impact Energy (kJ)Max. Deflection (mm)Residual Deflection (mm)Max. Crack Width (mm)
NC-30.3062.15510.265.474.0
NC-50.5083.57813.429.577.0
NC-101.0007.04433.1728.0018.0
FRP-30.3022.12710.375.102.0
FRP-50.5033.54311.375.092.0
FRP-101.0027.05817.2012.5610.0
Table 4. Summary of impact forces.
Test SpecimenDrop Height (m)Impact
Energy (kJ)
Max. Impact Force from CFC60 (kN)Avg. Impact Force (kN)Pu (Static, kN)Avg. Impact Force/Pu
NC-30.3062.155174.83107.75128.10.84
NC-50.5083.578211.43130.67128.11.02
NC-101.0007.044201.85126.90128.10.99
FRC-30.3022.127197.11114.29143.80.79
FRC-50.5033.543214.20125.55143.80.87
FRC-101.0027.058237.73152.51143.81.06
Disclaimer/Publisher’s Note: The statements, opinions and data contained in all publications are solely those of the individual author(s) and contributor(s) and not of MDPI and/or the editor(s). MDPI and/or the editor(s) disclaim responsibility for any injury to people or property resulting from any ideas, methods, instructions or products referred to in the content.

