Article

Investigation of the Influence of Design Parameters on the Strength of Steel–Concrete Composite Shear Walls by Finite Element Simulations

Civil Engineering Department, Faculty of Engineering, University of Santiago of Chile (USACH), Santiago 9170022, Chile
*
Author to whom correspondence should be addressed.
Buildings 2023, 13(1), 187; https://doi.org/10.3390/buildings13010187
Submission received: 3 November 2022 / Revised: 29 November 2022 / Accepted: 19 December 2022 / Published: 10 January 2023
(This article belongs to the Section Building Structures)

Abstract

:
In this paper, the influence of design parameters on the strength of steel–concrete composite shear walls is investigated by means of finite element (FE) simulations. The shear wall typology studied in this paper consists of multiple composite plate shear wall-concrete encased on one or both sides of the plates. The FE models include contact technology to capture debonding between concrete and steel, tensile cracking in concrete, and large deflection theory involving local instabilities. Some design parameters considered in this work are the height-to-width ratio of the steel plates and their thickness, number of steel plates, the cross-section of the columns, and the height-to-width ratio of the shear wall. Furthermore, a sensitivity analysis of the normalised shear strength per unit cost of structure for these design parameters is also studied. Our numerical predictions are validated successfully with experimental data reported in the literature, revealing the predictive capabilities of the model. The present results provide further insight into the structural behavior of steel–concrete composite shear walls and pave the way for the future development of more efficient and innovative steel–concrete composite systems.

1. Introduction

In recent years, steel–concrete composite shear walls have been widely used in the construction of high-rise buildings, such as the Wuhan Centre Tower in China and Abeno Harukas in Japan, among others [1,2,3,4]. The steel–concrete composite shear wall system has favourable features, for instance, high bearing capacity, superior in-plane stiffness and strength, and a large level of ductility and energy dissipation. For these reasons, this structural system is of special interest for countries located in very active earthquake-prone areas. The steel–concrete composite shear wall consists of two CFST columns, a full-size steel plate connecting the columns, and shear stud anchors placed on both sides of the steel plate. The shear studs connect the lateral concrete volumes and the steel plates, allowing the system to act as a single element. Over the last few years, several experimental studies have been conducted to investigate the structural behavior of steel–concrete composite shear walls with CFST boundary columns. Guo et al. [5] studied the cyclic behavior of steel plate shear wall and composite steel plate shear wall systems. A new kind of connection between steel plates and reinforced concrete walls was proposed. Wang et al. [6] presented a CFST frame sandwich-insulation composite wall structure and investigated the seismic behavior of four full-size specimens under low-cyclic loading. An equivalent compression strut model was used to calculate the bearing capacity of the proposed structures. Later, Wang et al. [7] performed experimental tests on steel–concrete composite shear walls with CFST columns and steel plates. Huang et al. [8] used rectangular and T-shaped CFST boundary columns with an additional CFST column in the middle of the shear walls and steel plates on both sides of the wall connected by tie bars. Zhang et al. [9] studied the cyclic behavior of composite shear walls and used steel fibres to repair them. Wang et al. [10] studied the seismic behavior of steel–concrete composite shear walls. Nie et al. [11] carried out an experimental study on reinforced concrete filled composite plate shear walls. Lu et al. [12] performed an experimental study on the seismic performance of steel fibre reinforced high strength concrete composite shear walls with different steel fibre volume fractions. Ren et al. [13] investigated the seismic behavior of composite shear walls incorporating concrete-filled steel and FRP tubes as boundary elements. Dong et al. [14] proposed CFST columns as boundary elements with multiple steel plates and an I-shape steel central column. Qiao et al. [15] analysed shear walls with CFST boundary columns with a CFST central column and multiple steel plates. The behavior of other types of CFST columns was also investigated recently [16]. Yudong et al. [17] studied a semi-rigid connection steel frame with steel plate shear walls. Ghafar et al. [18] carried out experimental and numerical studies on the cyclic behavior of an innovative infill web-strips steel plate shear wall with rigid beam-to-column connections. Majlesi et al. [19] studied the semi-rigid connection of perforated steel plate shear walls with laterally braced steel frame. Xiong et al. [20] evaluated composite shear walls filled with demolished concrete lumps and self-compacting concrete after fire. Zhang et al. [21] investigated the seismic behavior of squat steel-reinforced concrete shear walls with high axial load ratio.
Regarding numerical studies of steel–concrete composite shear walls with steel boundary columns, few studies have been reported. Rahnavard et al. [22] performed a numerical study to investigate the reversed cyclic behavior on composite steel plate shear walls to evaluate the effects of different parameters on the performance of this system under cyclic loading. The computational model was compared with a steel shear wall without concrete, and several parameters were studied. Epackach et al. [23] investigated numerically the monotonic response of steel plate concrete composite shear wall piers. Rassouli et al. [24] evaluated the effect of light-weight concrete on the cyclic performance of composite steel plate shear walls. They concluded that the shear capacity of the specimen with light-weight concrete was approximately similar to the specimen with normal-weight one. Qi et al. [25] studied the stud anchor shear force demand in traditional composite steel plate shear walls using FE analysis. They incorporated an effective simulation of the boundary frame as well as reasonable interaction behaviors of elements and validated in comparison with available tests. More recently, Wang et al. [7] tested six innovative shear critical composite shear walls without tie bars to study the shear compression failure and ductility. Kisa et al. [26] studied a series of composite shear walls with different configurations with L-shaped cold-formed steel sheets.
Some advantages of using the steel–concrete composite shear walls with multiple steel plates and CFST columns are:
(a)
Less steel is required when compared to systems with similar shear force demand, reducing the cost of the steel;
(b)
Time savings in the construction process mainly because the welding process of additional shear stud anchors on the sides of the plate is not considered;
(c)
Easier installation process with little amount of mechanical resources when multiple and smaller steel plates are defined;
(d)
A reduction of the total weight of structure by reducing the size of the structural elements, foundations and excavation;
(e)
Favourable architectural plan definition due to the increasing floor areas associated with a reduction of the cross-section of the composite shear wall.
The above literature review shows that, despite the increasing interest in steel–concrete composite shear walls, its structural behavior is still an open subject which still requires further investigation. In view of the existing gap in the understanding of this type of structural system, the main objective of the present paper is to investigate the influence of design parameters on the strength of steel–concrete composite shear walls by means of FE simulations. This study is based on the experimental studies carried out by Qiao et al. [15]. Contact technology is adopted to capture the contact interaction between concrete and steel. Furthermore, cracking is included in the constitutive modelling of concrete. Large deflection theory is also adopted in the modelling process. The parameters investigated are the height-to-width ratio of the steel plates and their thickness, the number of plates, the cross-section of the columns, and the height-to-width ratio of the shear wall.

2. Selected Experimental Case

The particular structural system investigated in this paper is taken from Qiao et al. [15]. This type of structure is classified as a composite plate shear wall-concrete encased (C-PSW/CE) in accordance with the ANSI/AISC 341-16 [27] nomenclature. C-PSW/CE includes steel plates and reinforced concrete encasement on one or both sides of the plate. Due to its relevance for the structural engineering community and the limited studies conducted in this context [28], the configuration investigated in Ref. [15] has been adopted as a reference or baseline for the present study. Furthermore, the choice of Qiao et al.’s work is also motivated by the complete experimental information available in this paper, particularly on the mechanical properties of the materials and the structural response of the system when subjected to loading and unloading cycles.

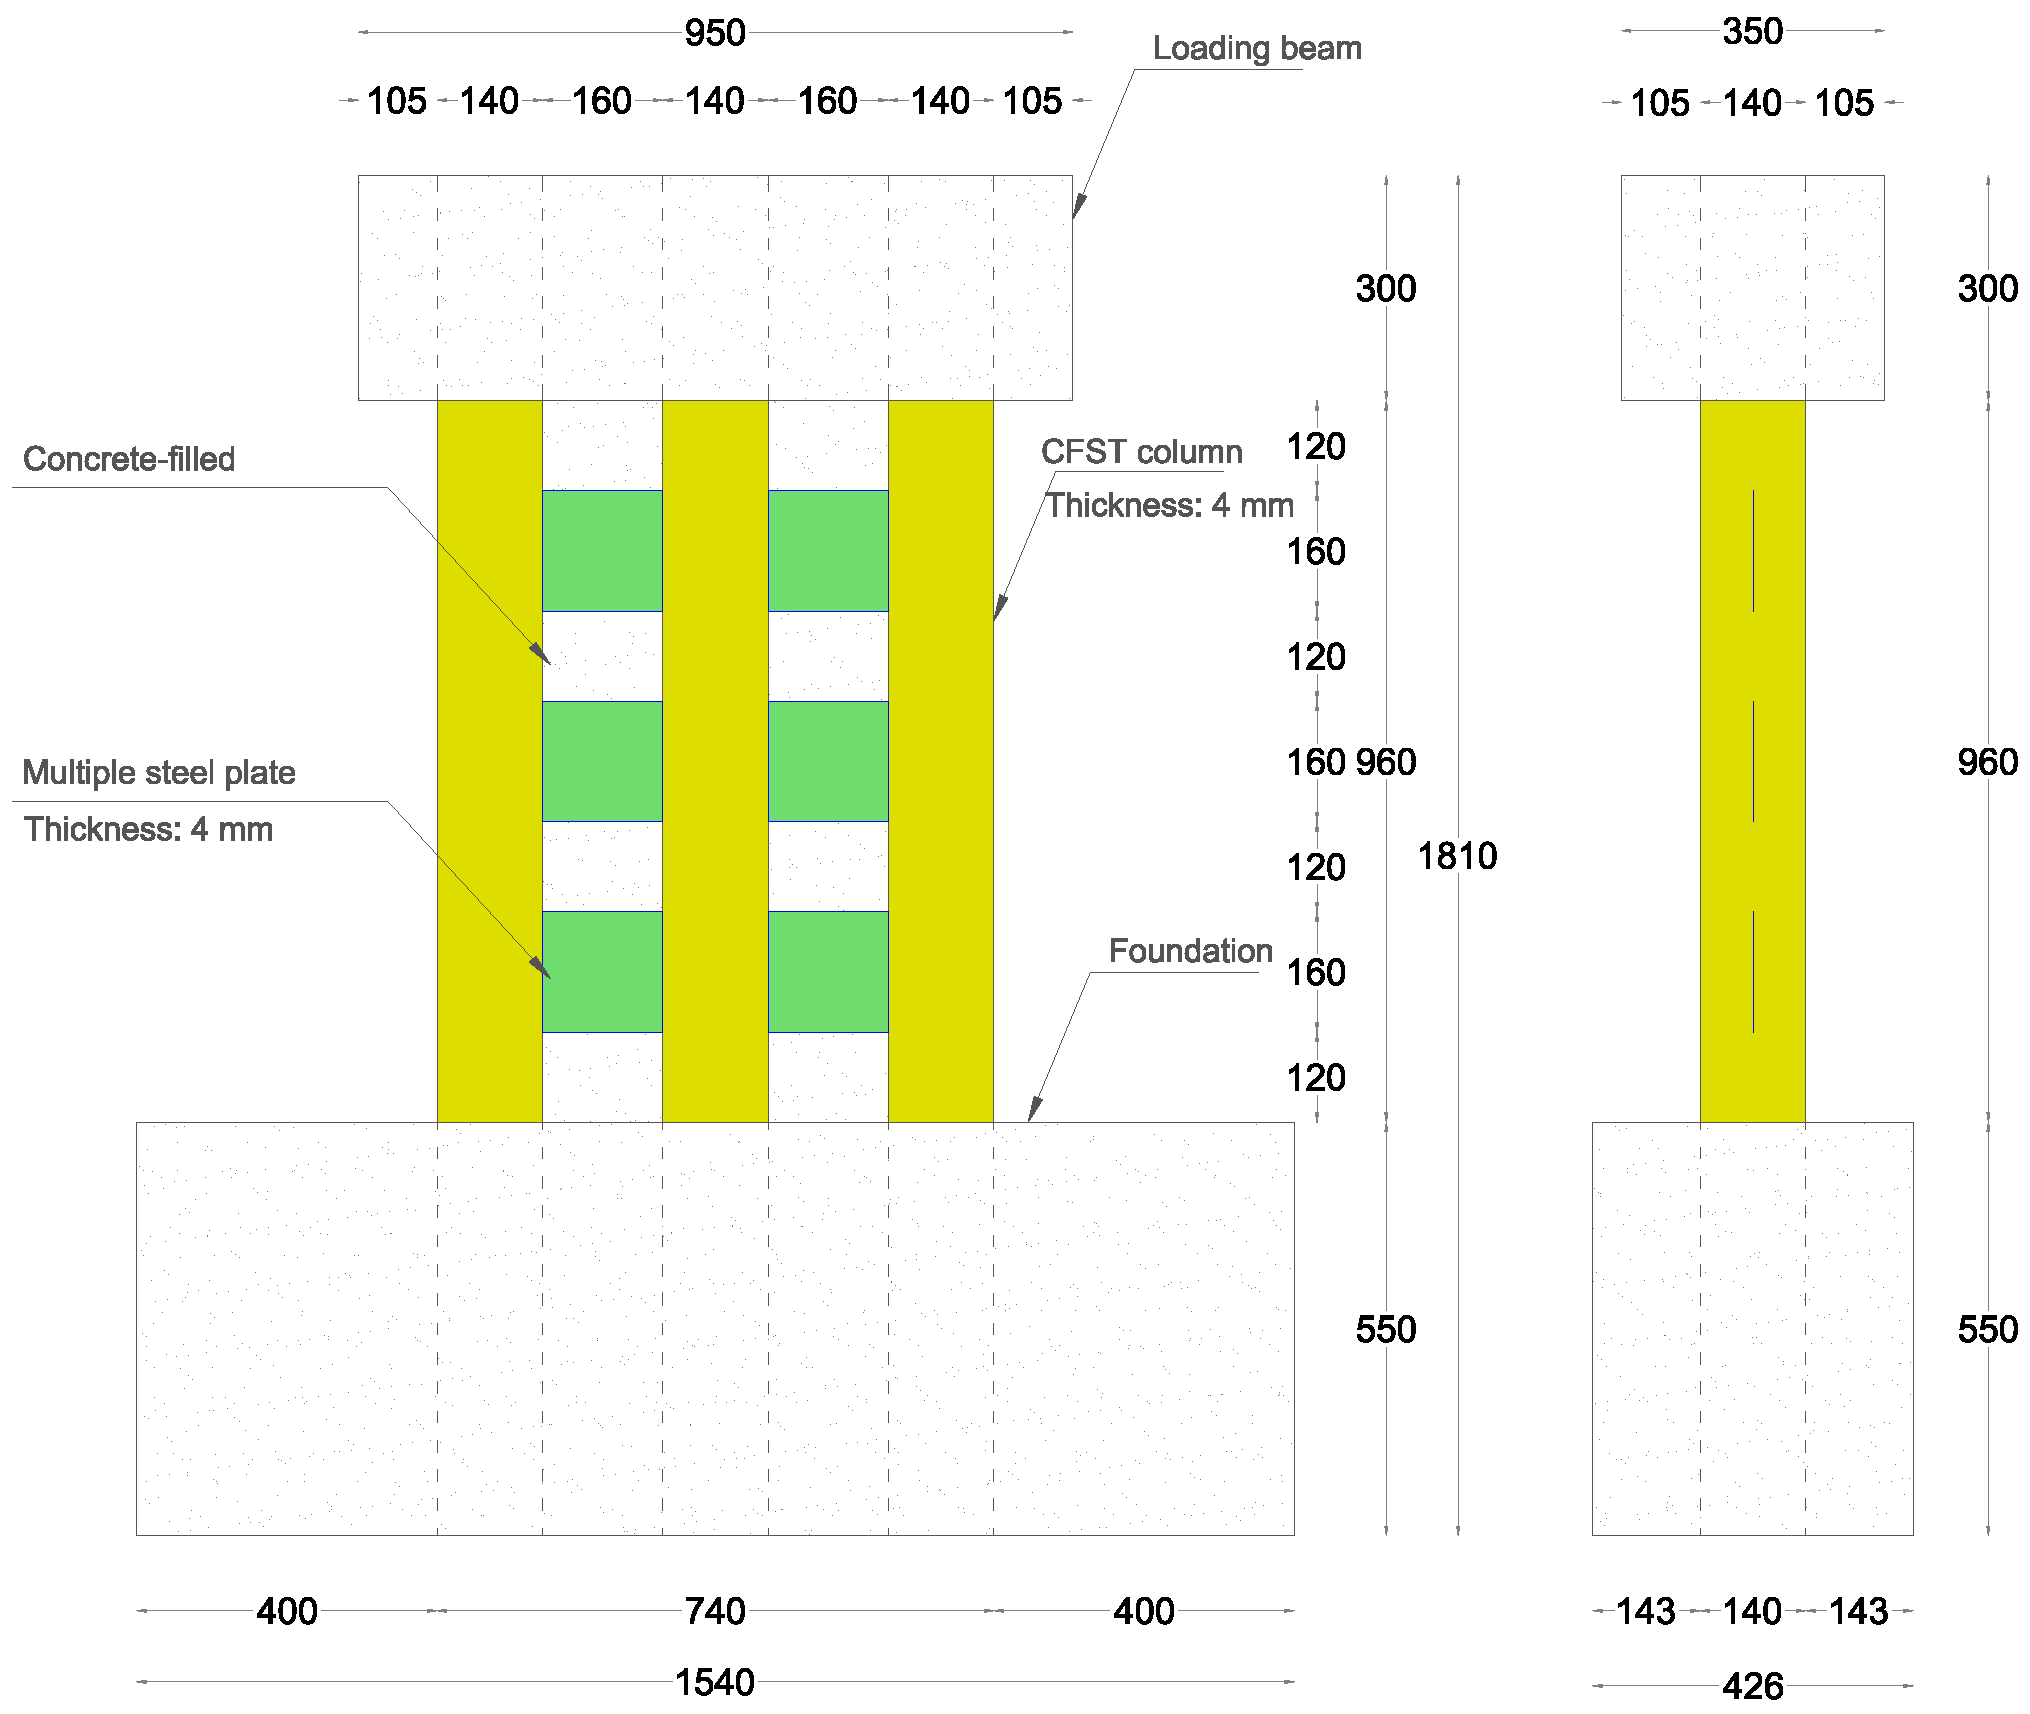
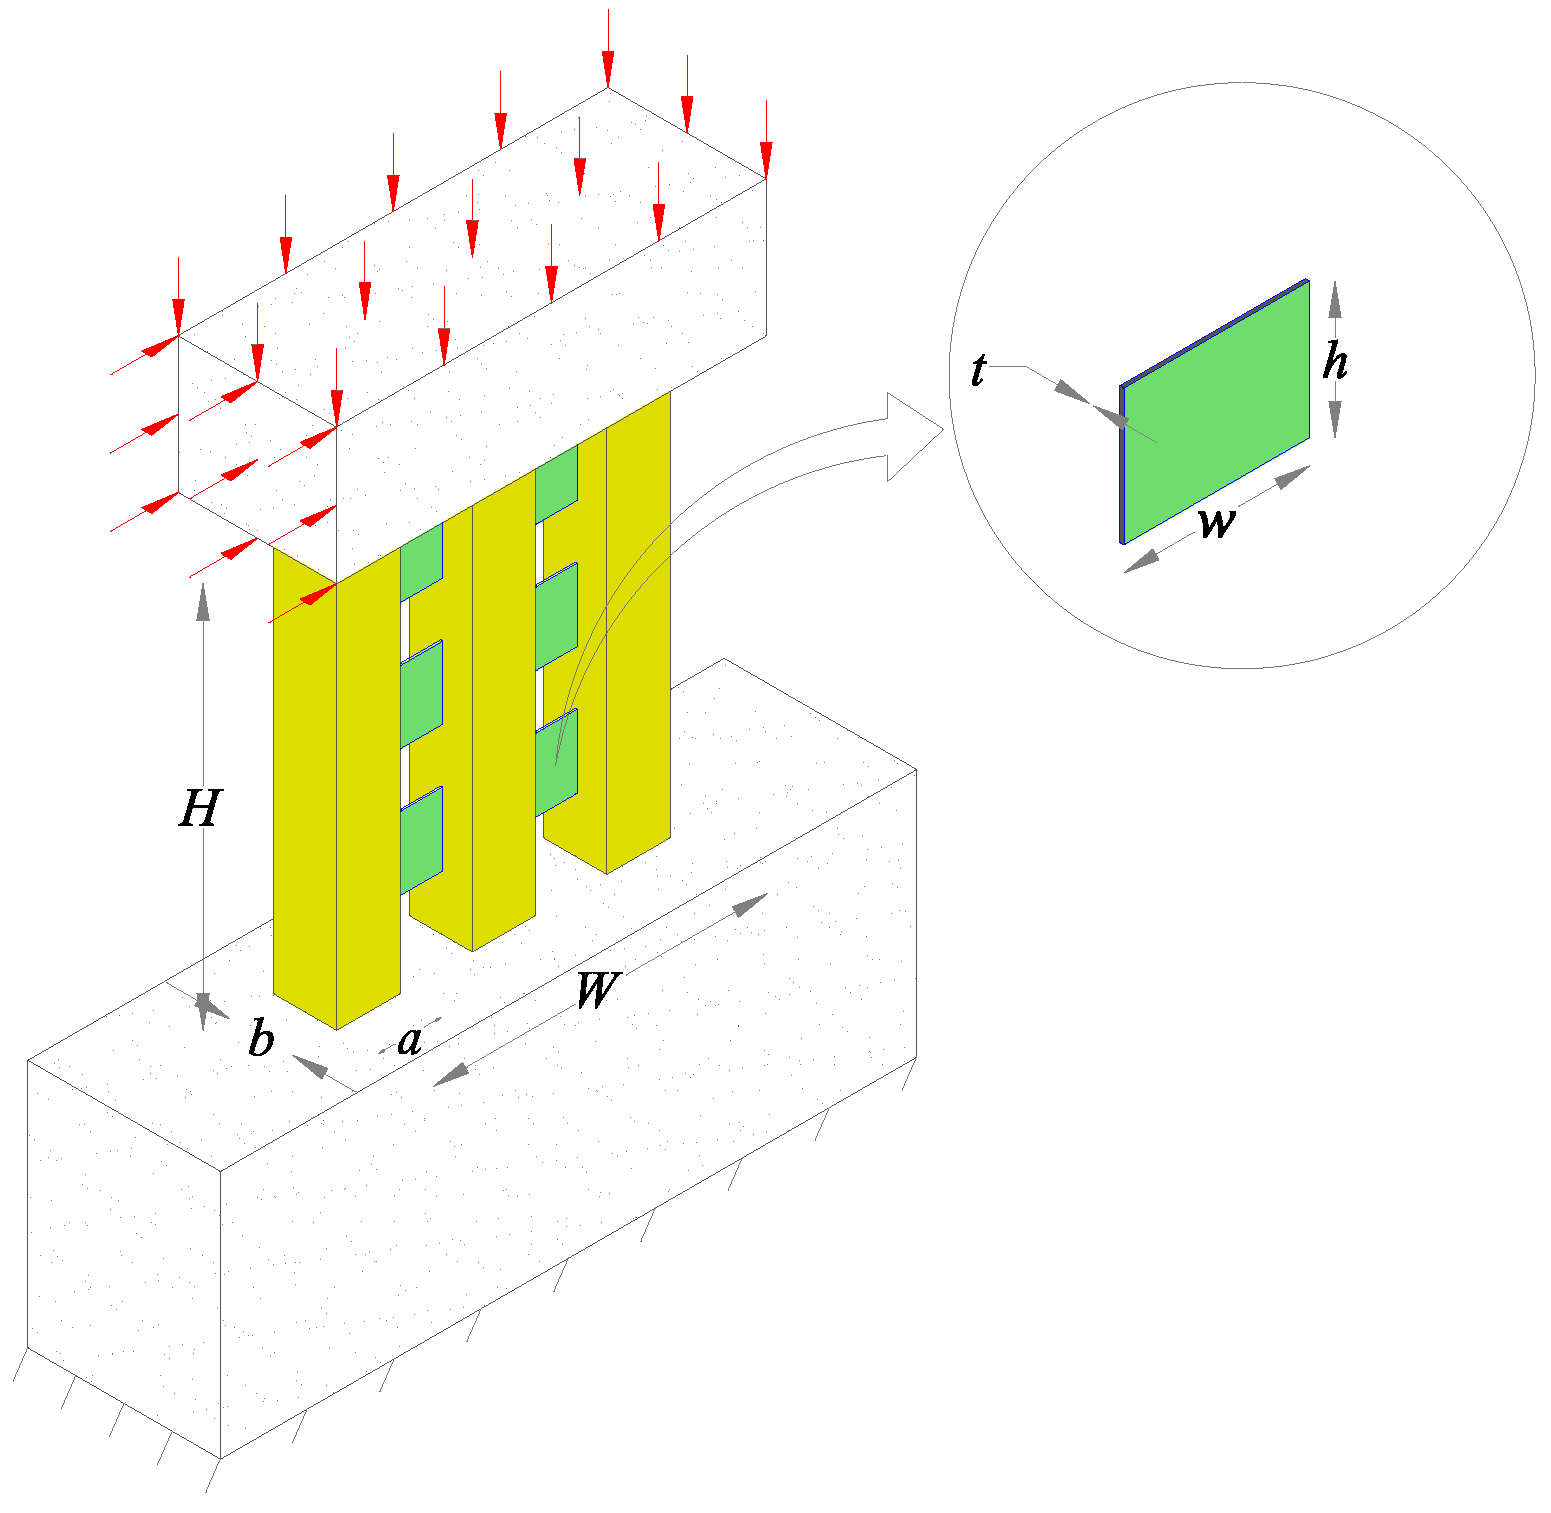
2.1. General Dimensions

In accordance with Qiao et al. [15], the specimen investigated herein consists of a one-fifth scale model. The dimensions and geometry details are shown in Figure 1. The dimensions of the steel–concrete composite shear wall are 960 mm high and 740 mm wide. The cross-section of the CFST column is 140 mm × 140 mm, with a thickness of 4 mm and a total height of 1810 mm. Both ends of each column are fixed at the top of the loading beam and at the bottom of the foundation to ensure appropriate anchorage. The concrete wall thickness is 140 mm. Six infilled 160 mm × 160 mm × 4 mm steel plates are welded to the steel columns and placed uniformly in a 2 × 3 array as shown in Figure 1. The vertical distance between consecutive plates is 120 mm. The dimensions of the loading beam and foundation are 350 mm × 300 mm × 950 mm, and 426 mm × 550 mm × 1540 mm, respectively.

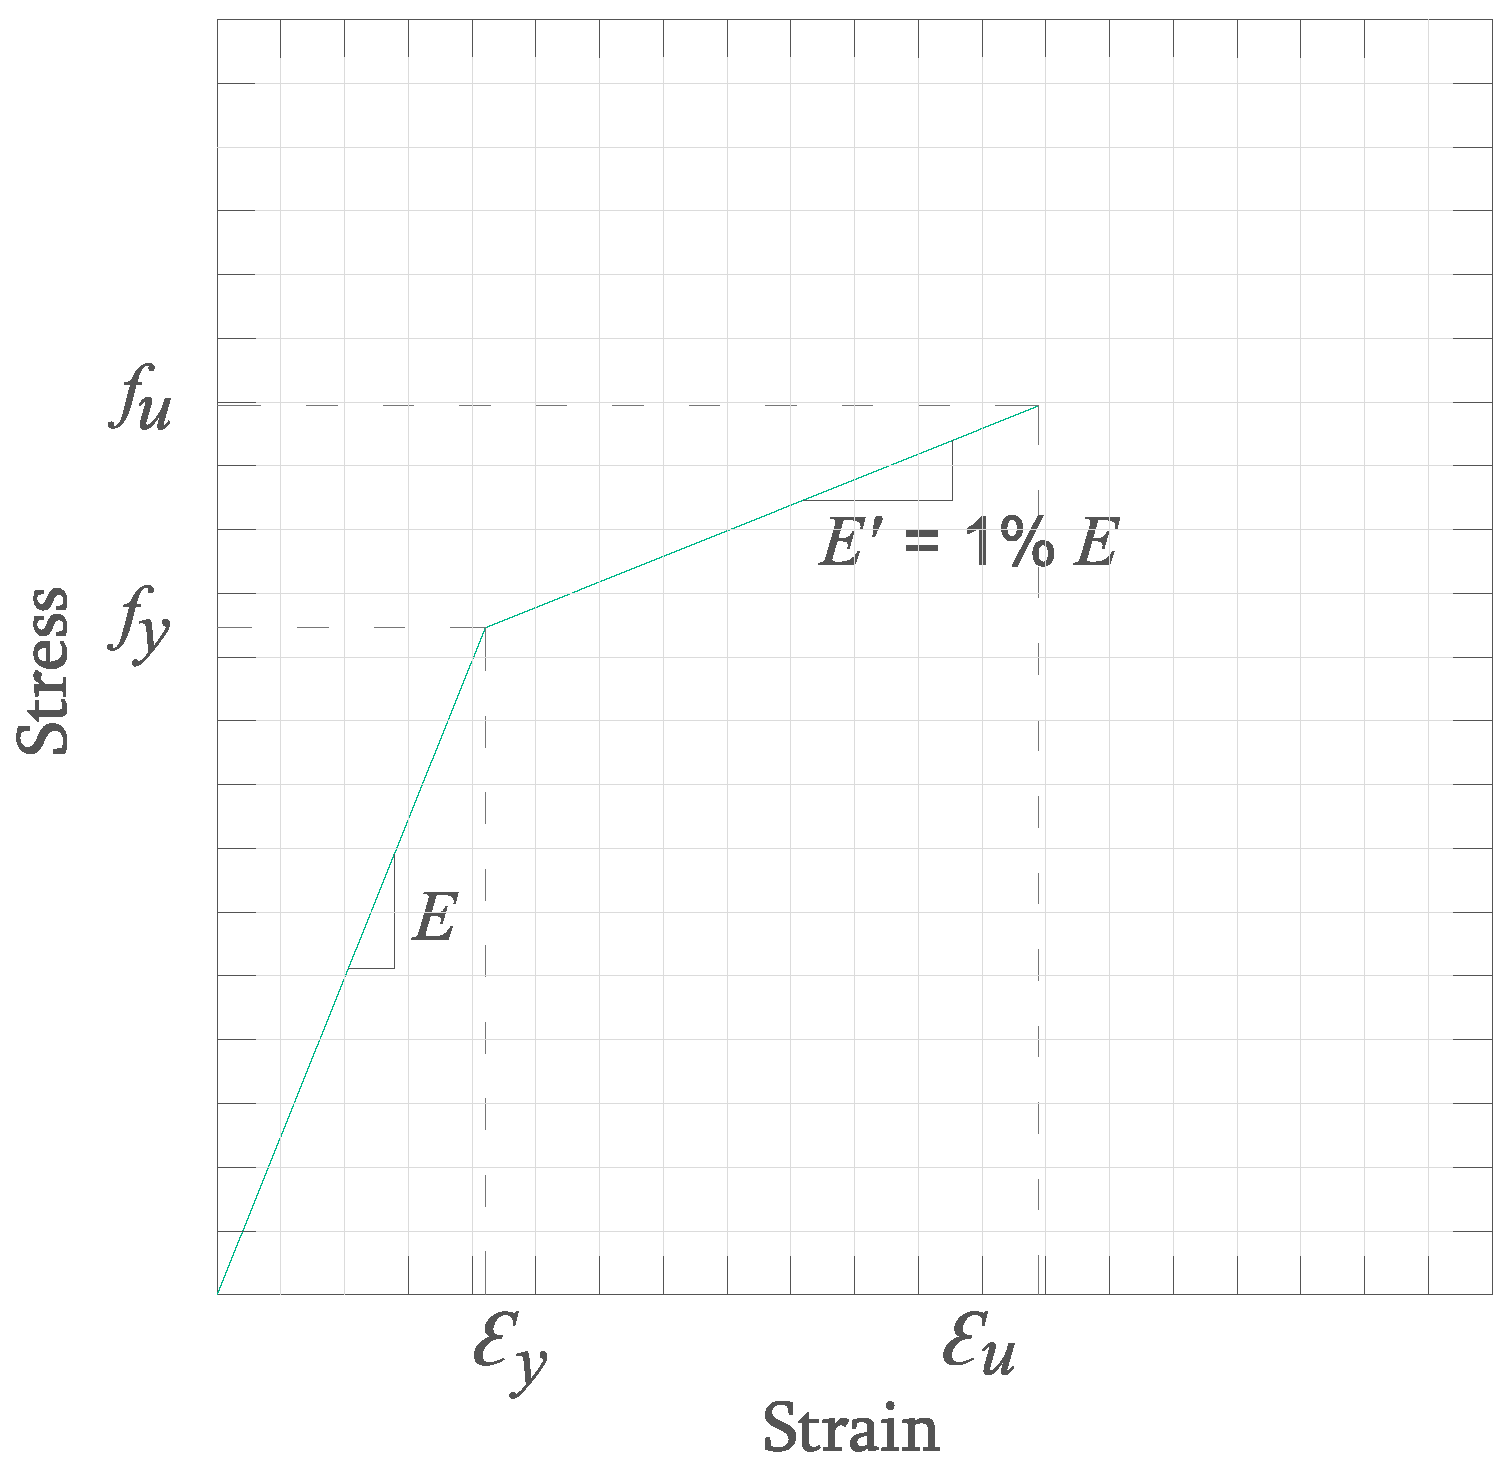
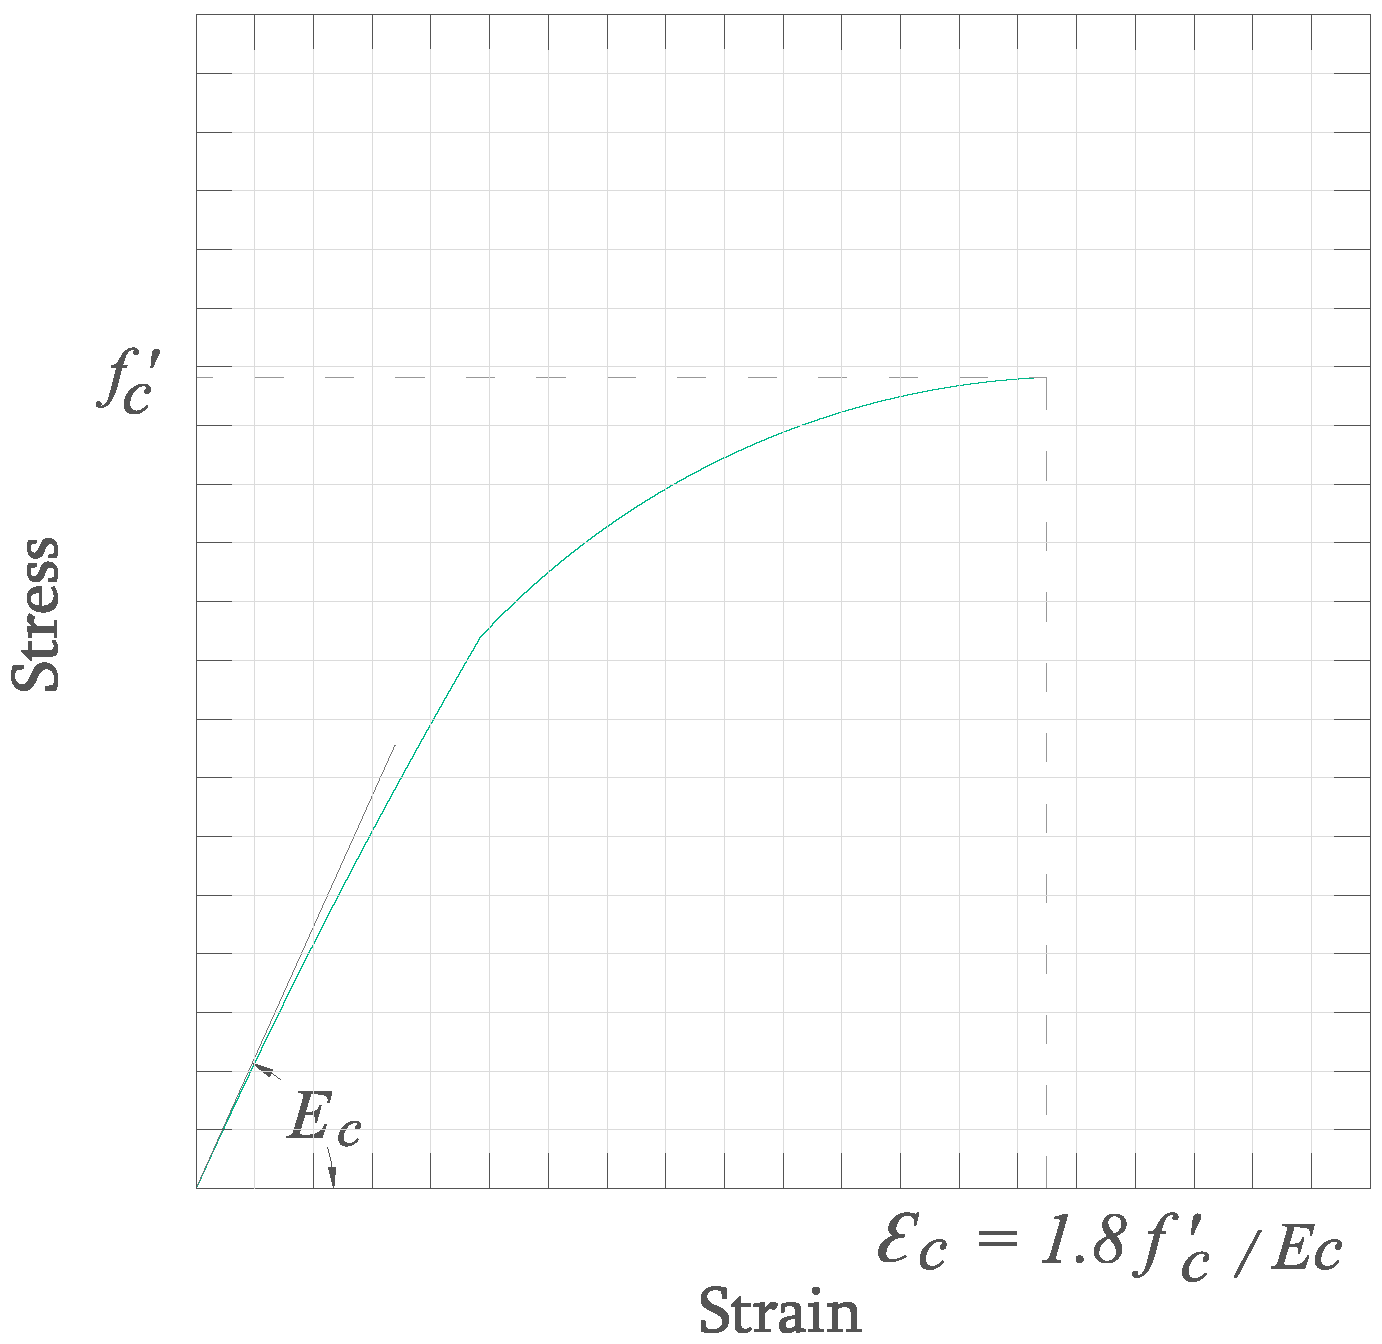
2.2. Material Properties

The following material properties were obtained from Qiao et al. [15] and according to the Chinese code [29]. The steel column has a strength grade of Q345, and the strength of the multiple steel plates is Q235. Table 1 shows the mechanical properties obtained from coupon tests of these two steel grades. Here, f y is the yield strength, f u is the ultimate strength, and E s is the Young’s modulus of the steel.
The stress–strain curve of the steel is shown in Figure 2. The tangent modulus E is assumed to be 1 % of the initial Young’s modulus [30]. In this figure, ϵ y is the yield strain, and ϵ u is the strain at the ultimate strength.
The strength grade of the concrete used in this work is C45 according to the Chinese code [31]. The CFST columns, shear walls, foundation, and loading beam were cast with the same concrete. The cylinder compressive strength of concrete, f c , can be calculated with the following expression [15]:
f c = ( 0.66 + 0.002 f c u 150 ) f c u 150 0.7 f c u 150 ,
where f c u 150 is the compressive strength obtained from 150 mm cubic samples. Therefore, for a nominal cubic compressive strength f c u 150 = 45.3 MPA , the value of f c is 34.4 MPA . Regarding the Young’s modulus of concrete ( E c ), it can be determined according to ACI 318-14 [32] with the following expression:
E c = 4700 f c .
In order to define the concrete compressive stress–strain relationship, the modified Hognestad model [33] is used as shown in Figure 3.

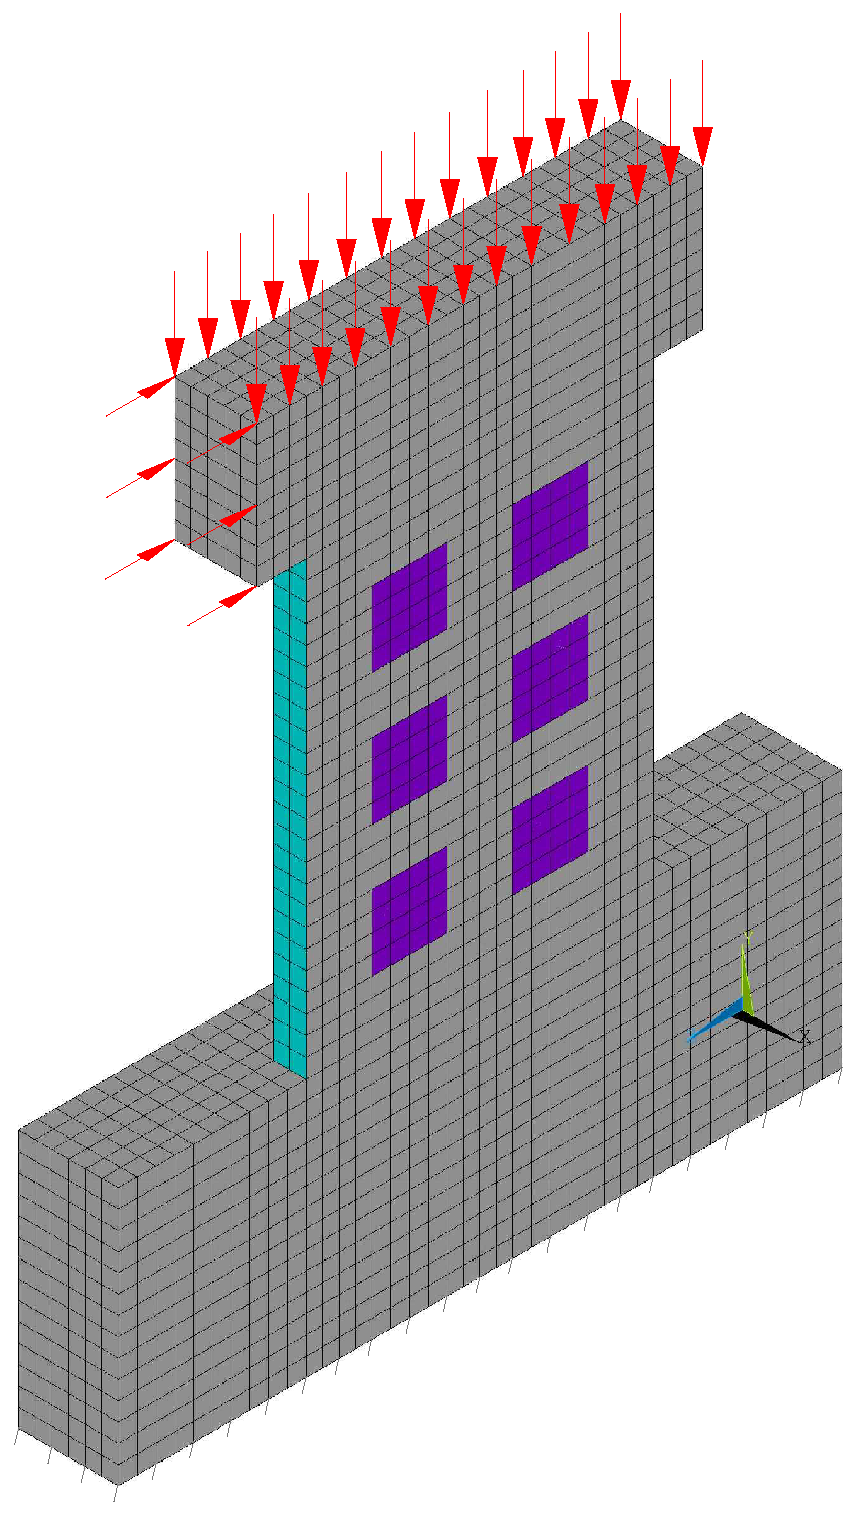
3. Finite Element Modeling

The computational modelling of the C-PSW/CE with CFST columns is carried out using the commercial FE software ANSYS [34]. In order to create the geometry of the multiple steel plates and the columns, 3D 4-node SHELL181 elements were used. To model the concrete contained inside the columns and in the shear wall, 3D 8-node SOLID65 elements were adopted. To define the interaction between concrete and steel, a surface-to-surface contact element was used. The target surface was modelled with 3D TARGE170 elements, and the contact surface was modelled with 3D 8-node CONTA174 elements. That is, contact elements were placed between the steel columns and concrete infill, between steel columns and concrete wall, and between multiple steel plates and concrete wall. A typical finite element mesh is shown in Figure 4. The numerical model contains a total of 17,511 nodes, with 1496 SHELL181 elements, and 15,015 SOLID65 elements.
The constitutive response of steel was modelled with a conventional von Mises elasto-plasticity framework, with isotropic hardening. The constitutive response of concrete was modelled with an elasto-plastic behavior in compression and an elastic perfectly brittle behavior in tension. A failure surface was adopted from the Willam and Warnke model [35]. Here, cracking capabilities in tension were included in the formulation. However, crushing in compression was excluded from the modelling process given the high compressive strength of concrete when compared with its tensile strength. A uniaxial cracking stress of 3.5 MPa was assumed. The present concrete model assumes that, after cracks form, both normal and shear stiffness components are reduced. To model the loss of shear transfer in a cracked surface, a shear transfer coefficient is introduced. Typical shear transfer coefficients vary from 0.0 to 1.0, with 0.0 representing a smooth crack or complete loss of shear transfer, and 1.0 representing a rough crack or no loss of shear transfer [36]. In this work, shear transfer coefficients of 0.2 and 0.7 were chosen for open and closed cracks, respectively. These values proved to be suitable for a reasonable description of the material when subjected to loading and unloading scenarios.
Displacements were restrained at the bottom face of the foundation along the three global directions. A vertical distributed load and lateral displacements were applied to the loading beam. As a first step, a vertical load of 681.4 kN was uniformly distributed on top of the loading beam. Then, a monotonically increasing lateral displacement was applied to the left side of the loading beam as shown in Figure 4.
Large displacement theory was activated through all of the FE analyses. The Newton–Raphson iterative procedure was adopted during the solution of the nonlinear problem. The line search algorithm was selected to accelerate convergence. As the horizontal displacements were applied gradually in time, the static analysis option was chosen for an incremental solution with a time step size of 0.01 . Each computational simulation was carried out until extensive crack formation was detected in concrete, preventing the model to achieve convergence. This state was associated with the maximum shear strength of the structure, prior to display softening in the overall load–deflection curve.
Furthermore, cyclic loads were also applied to the structure in order to investigate the hysteretic response in accordance with the loading programme shown in Figure 5. Here, the cyclic loads were increased gradually up to reaching a maximum drift ratio of 2 % . That is, a maximum displacement of 2 % of the height H t shown in Figure 6.

4. Parametric Analysis

In this research, the variations of five design parameters were investigated in order to study their influences on the shear strength of the composite wall system. These parameters were the thickness t of the embedded steel plates, their height-to-width ratio h / w , the number of plates n, the width a of columns, and the height-to-width ratio H / W of the shear wall. Refer to Figure 6 for details on the geometric parameters studied here.
The choice of such parameters was based on their relevances in the design of a shear wall system. The values of these parameters varied within typical ranges found in structures of this type.
Twenty-four steel–concrete composite shear wall configurations were analysed. The design parameters studied are shown in Table 2. The steel plate thickness t varied from 2 mm to 6 mm. The variation of the height-to-width ratio h / w was carried out in two ways. First, h / w was changed from 0.8 to 1.2, keeping the value of w constant while varying h. Then, h / w was modified again, but keeping h constant while changing w. The number of embedded plates varied in pairs, from 2 to 10. The cross-section of columns was changed by modifying their width a between 120 mm and 160 mm. The height-to-width ratio of the shear wall, H / W , varied between 1 and 1.6. In addition, the structural configurations associated with those general dimensions detailed in Section 2.1 were considered to be the base reference configurations.

5. Numerical Results
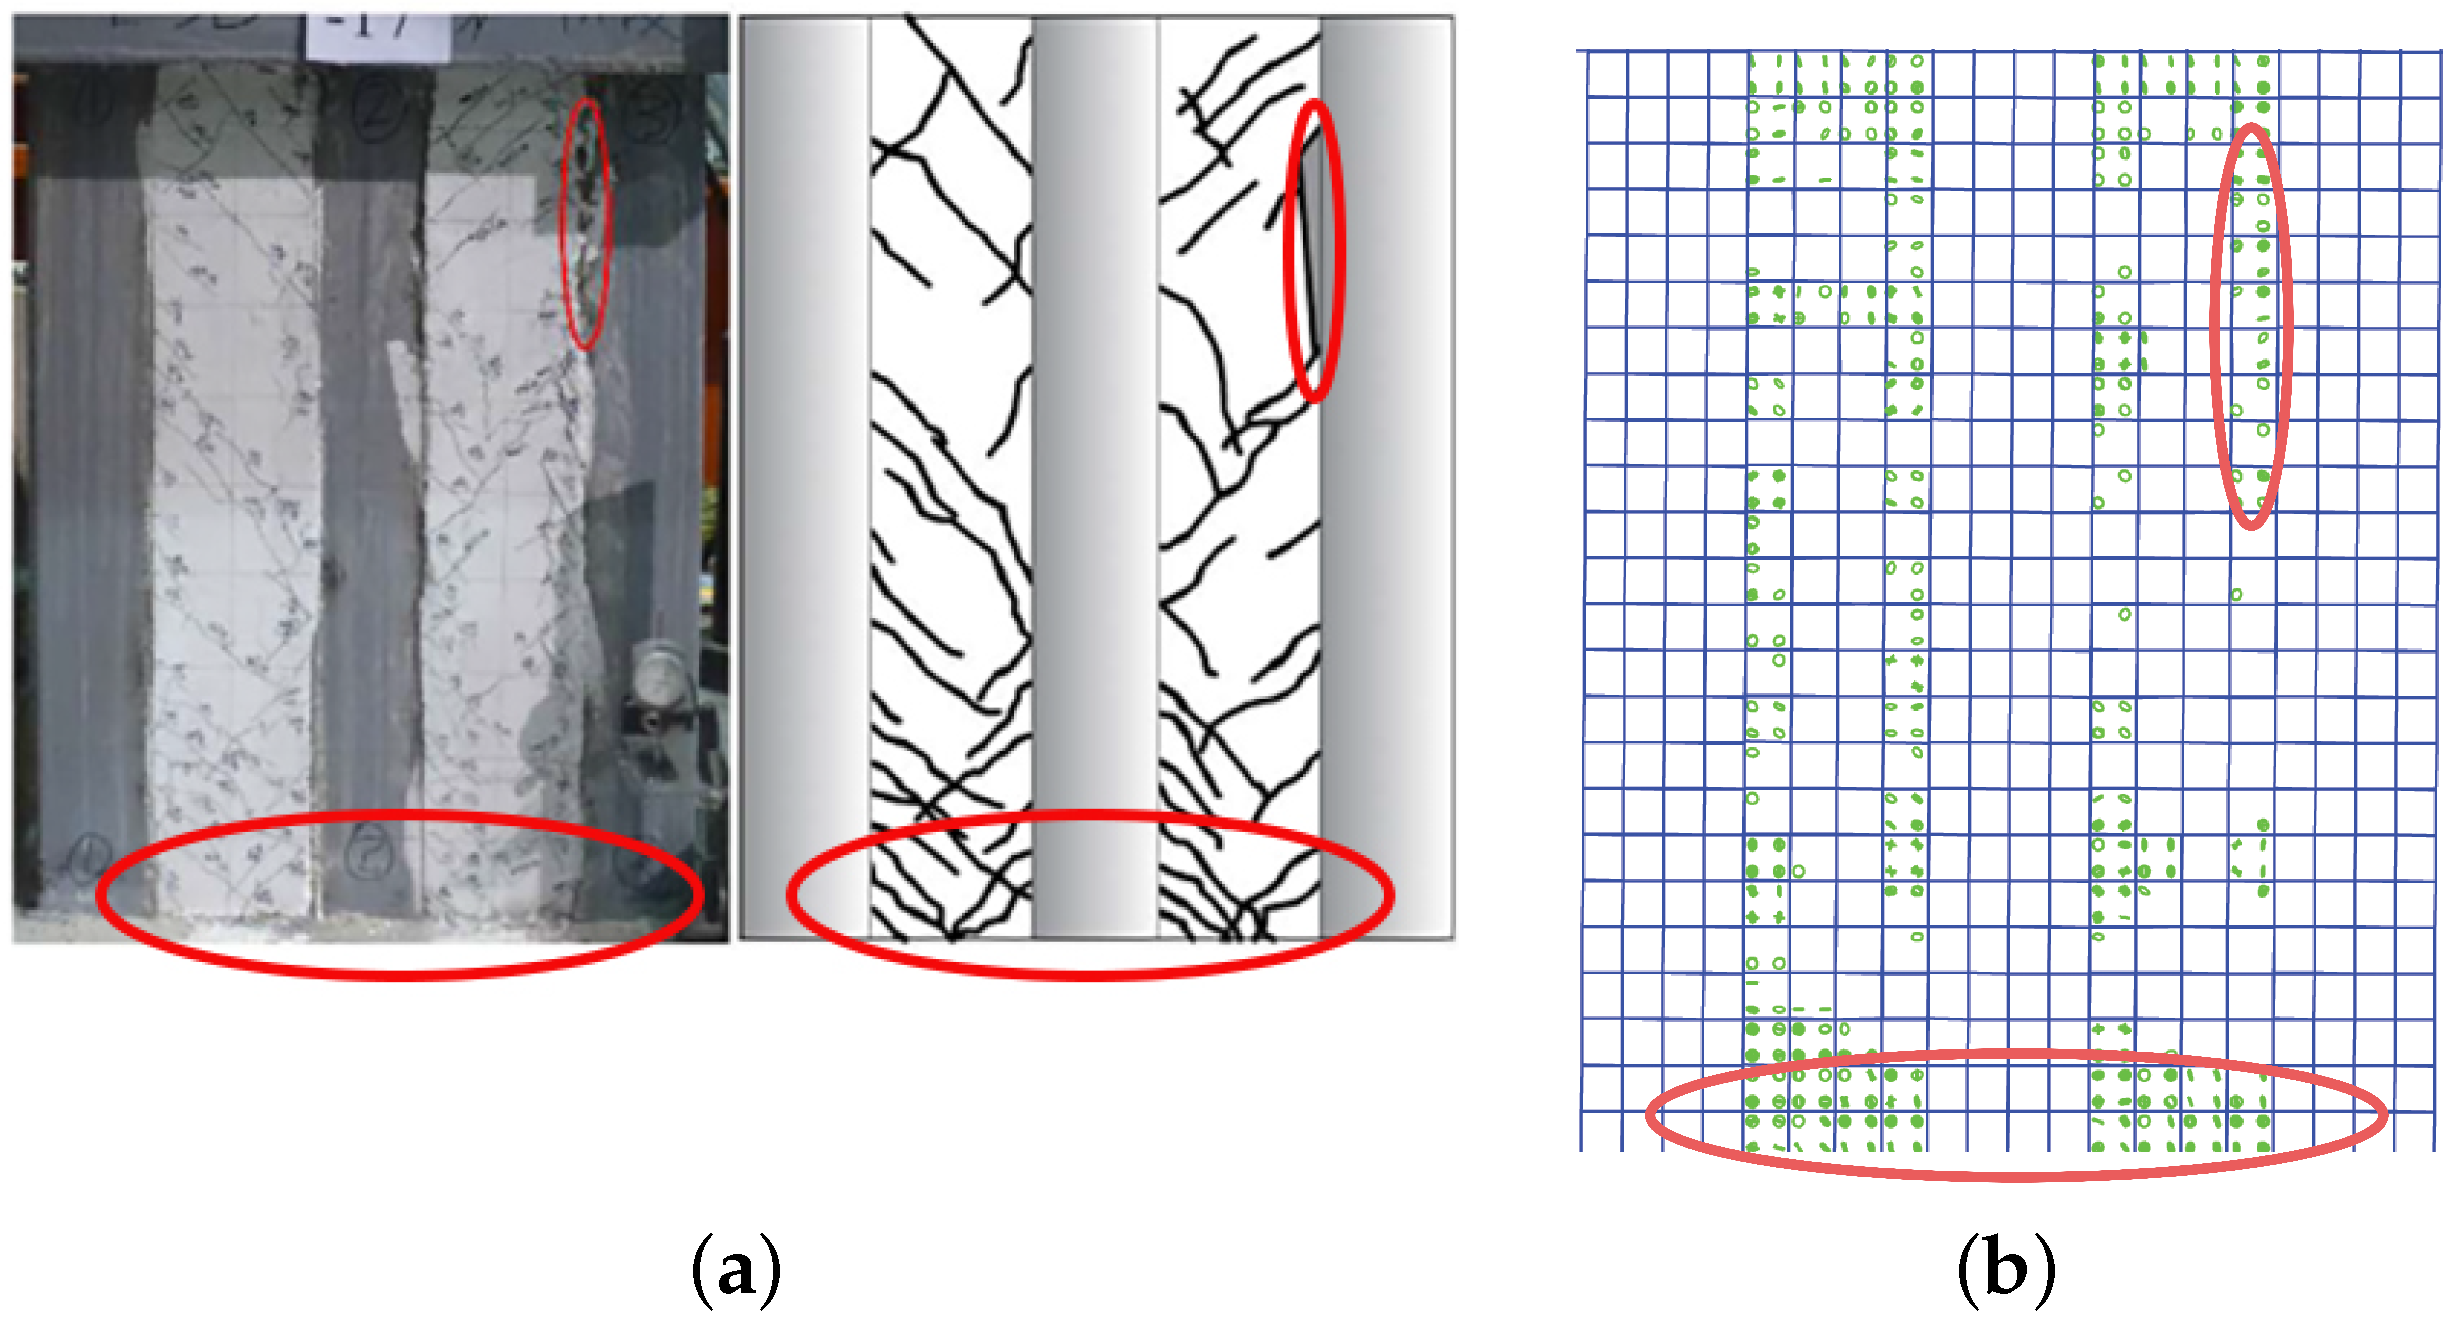
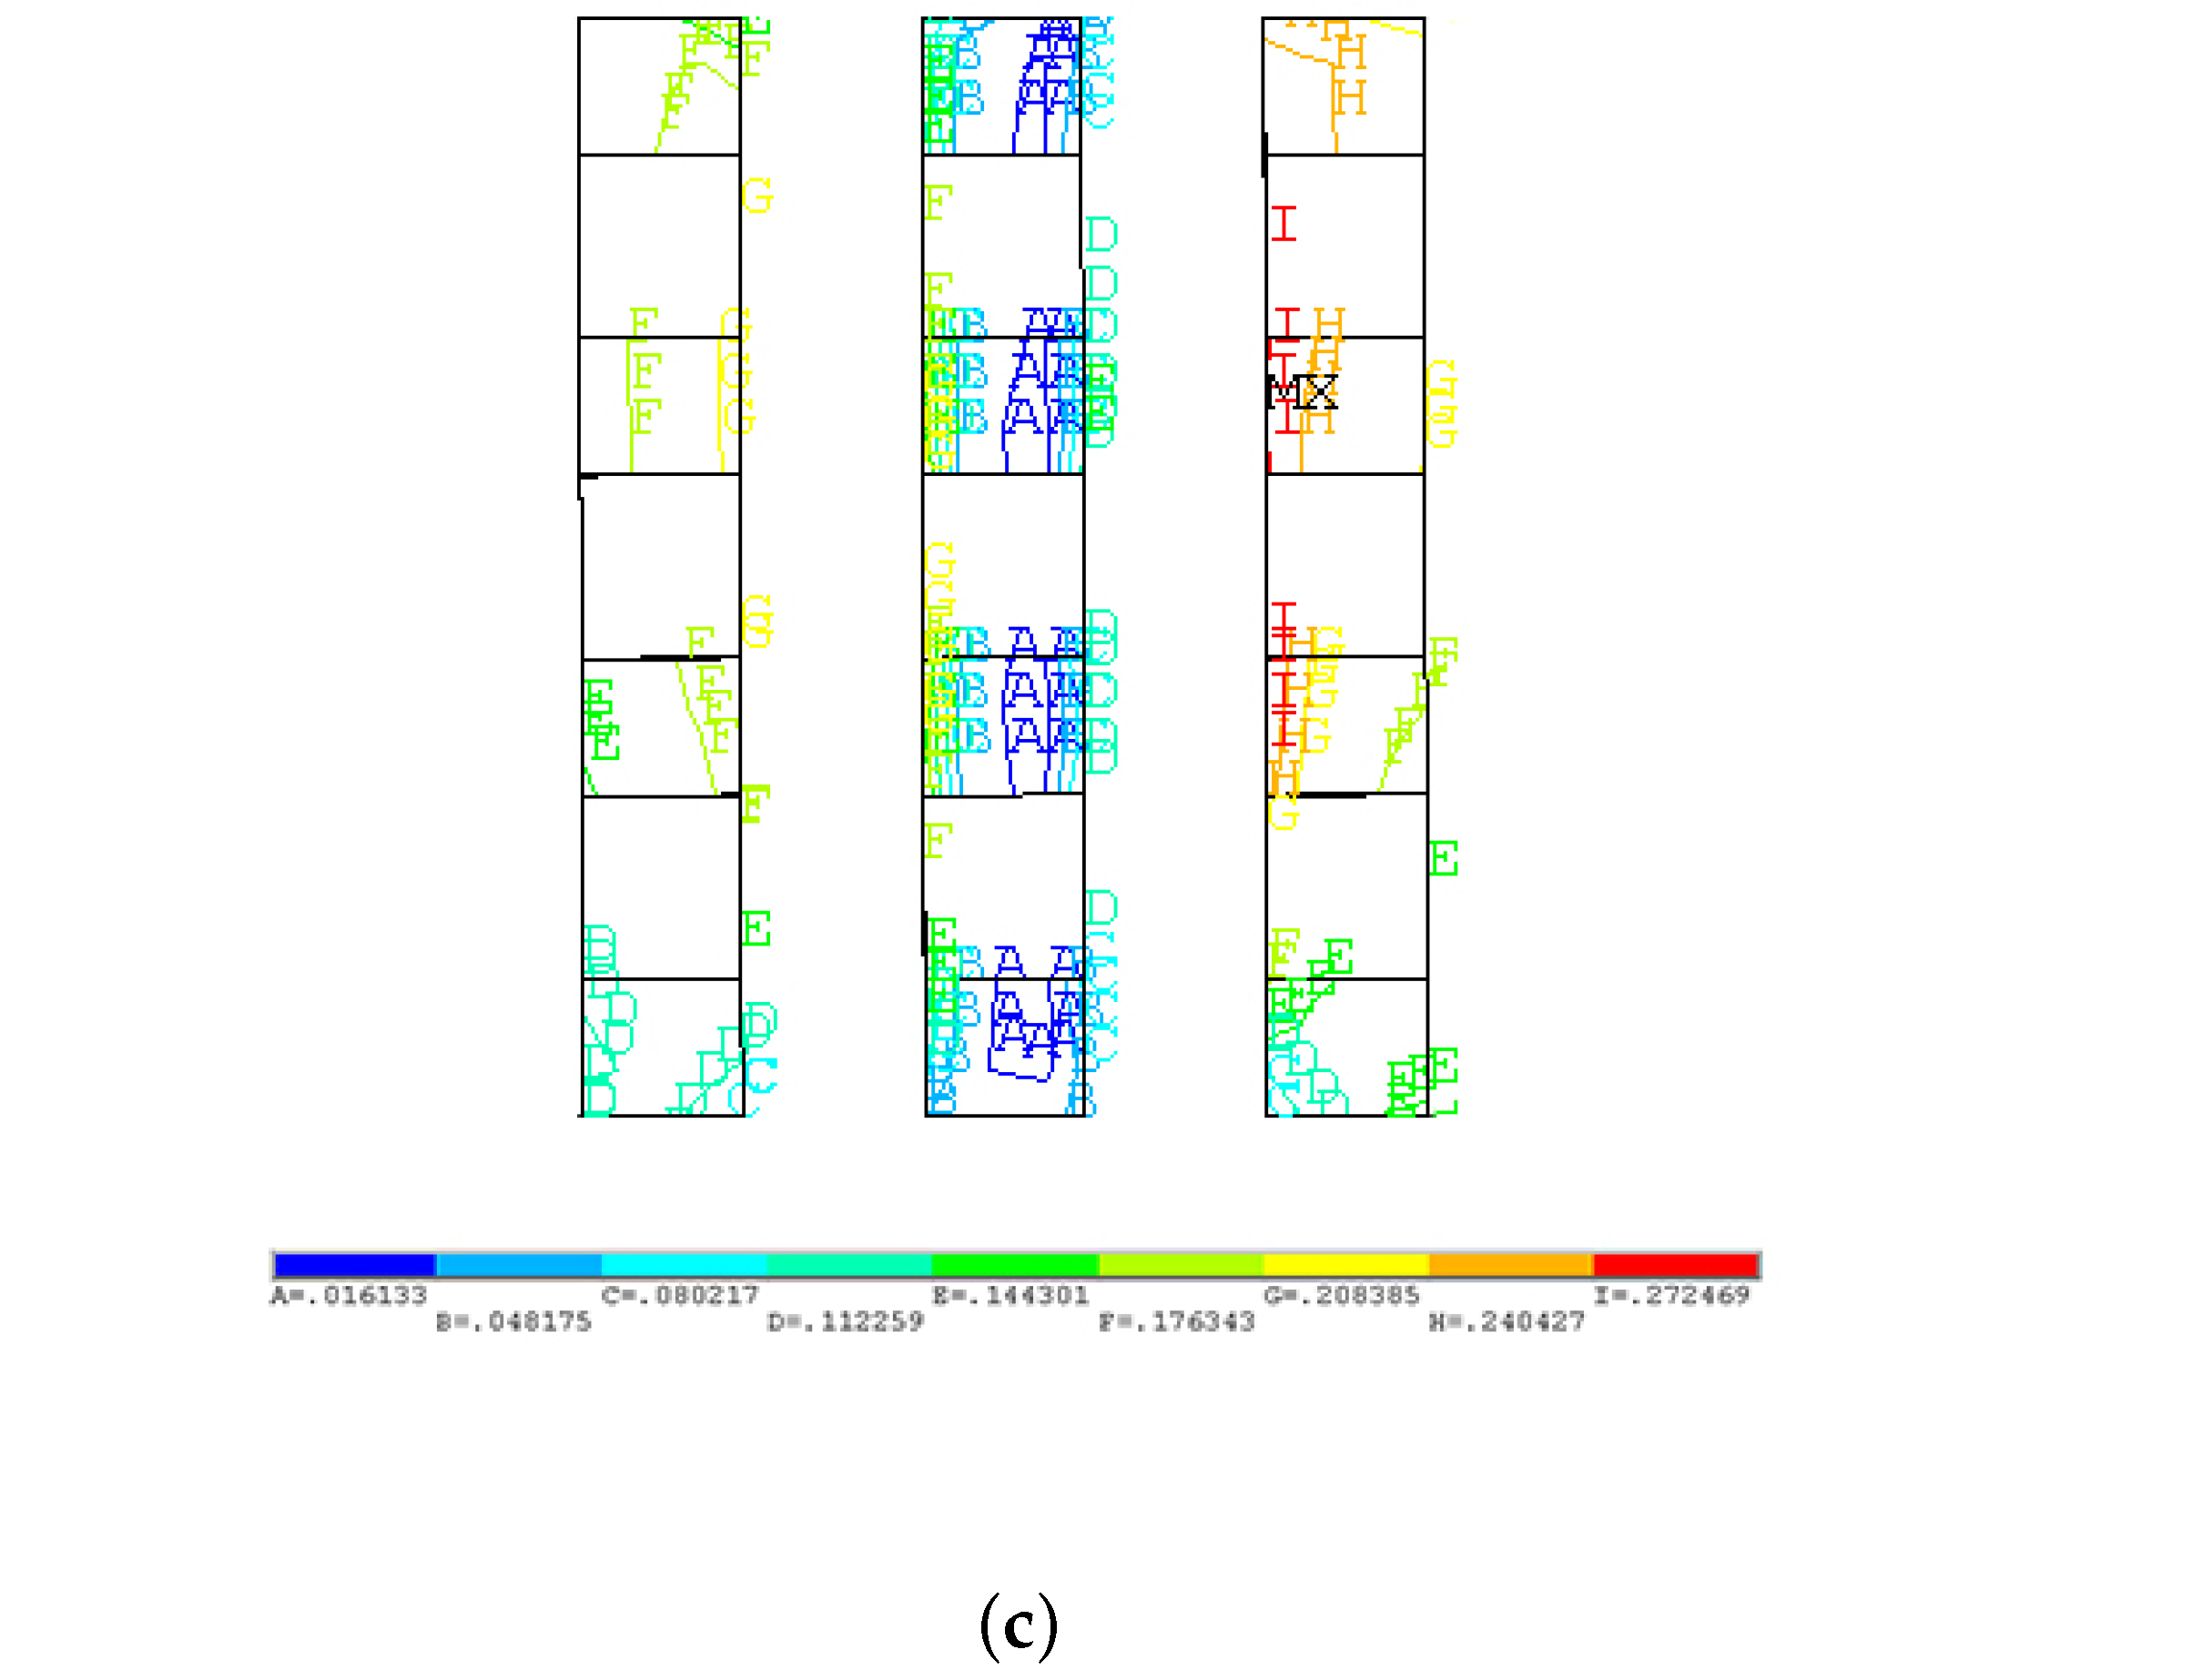
5.1. Validation

In order to validate the present FE modelling strategy, our numerical results are compared with the experimental data reported by Qiao et al. [15] for the corresponding base configurations subjected to cyclic loading. Similar behaviors are found between the experimental tests and the numerical simulations. Table 3 shows the comparison between the main experimental data and our FE predictions. For the present validation, four stages are compared, corresponding to the initial cracking, the first yield point (i.e., the first point where the slope changes significantly), the second yield point (i.e., the second important change of the slope) and the maximum strength of the system.
The corresponding table shows a good agreement between the numerical simulations and the experimental results, particularly for the first three stages, that is, initial cracking, first and second yield points. It is noted that, up to the second yield point, both numerical and experimental curves coincide perfectly. This demonstrates the predictive capabilities of the present model. Nevertheless, the maximum shear strength is not reached by the FE model, given the high number of loading cycles, which is associated with significant and extensive fracturing of concrete.
In addition, the experimental crack pattern shown in Figure 7a is also compared with those cracks predicted by the FE model shown in Figure 7b, revealing a close matching. The main cracked regions are located between adjacent CFST columns, on the lower base next to the concrete foundation and on the top right corner between concrete and the steel column, as shown in red ellipses in the corresponding images. It must be noted that these cracks are produced by contact sliding between concrete and steel as shown in Figure 7c. Here, the model predicts the maximum sliding distance.

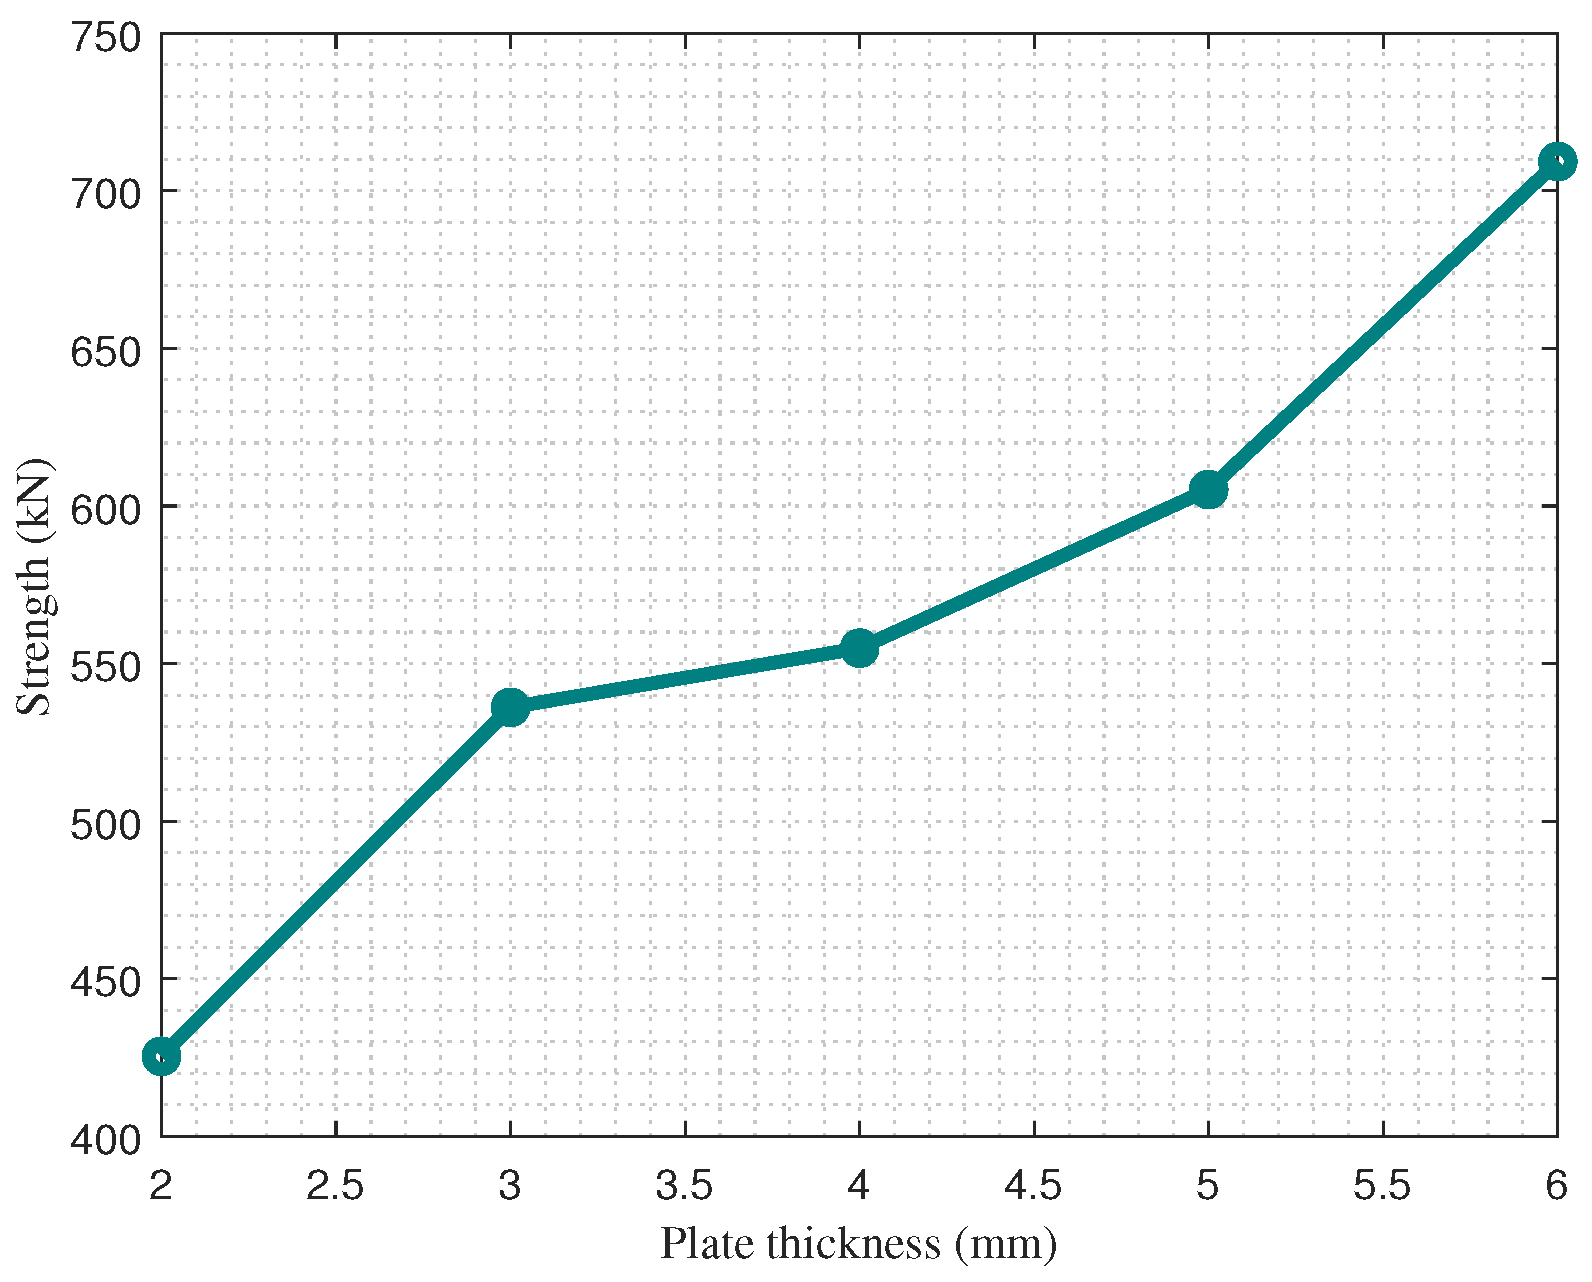
5.2. Effect of the Steel Plate Thickness

Figure 8 shows the variations of the overall shear wall strength for different plate thicknesses. Here, the x-axis depicts the plate thickness t for each configuration. The y-axis is the strength S of the composite shear wall. The five cases analysed here correspond to the CSW-1, CSW-2, CSW-3, CSW-4, and CSW-Base configurations, according to Table 2. For the specimens with thickness ranging from 2 mm to 6 mm , the strength increased from 425 kN to 710 kN, approximately. More specifically, the strengths for the configurations CSW-2, CSW-Base, CSW-3 and CSW-4 were 1.26, 1.3, 1.42, and 1.67 times the strength of configuration CSW-1, respectively. That is to say, by tripling the thickness of the multiple steel plates, the strength of the shear wall system increases by 67%.

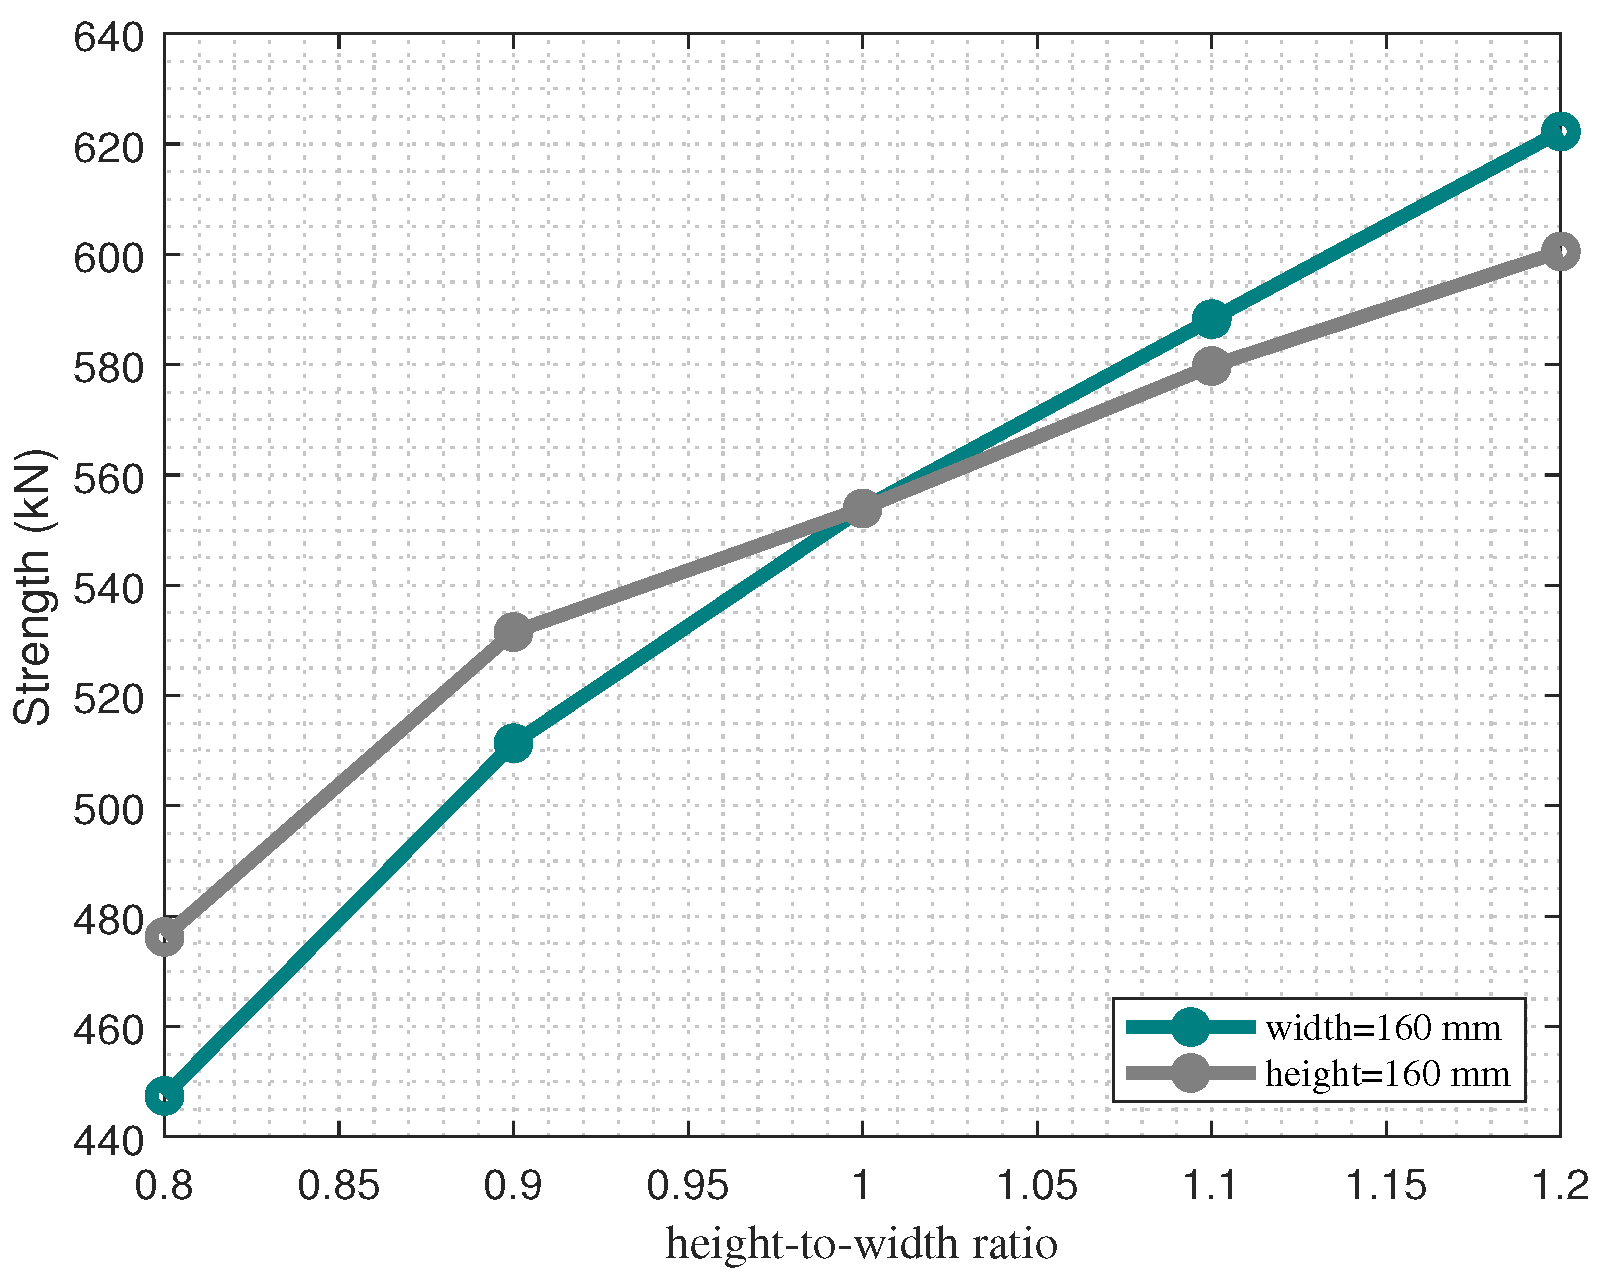
5.3. Effect of the Height-to-Width Ratio of Steel Plates

The influence of different height-to-width ratios, h / w , on the shear wall strength S is shown in Figure 9. The h / w ratio ranged from 0.8 to 1.2 . As mentioned earlier, a first analysis consisted of changing h / w , keeping the value of w constant while varying h. Then, a second analysis consisted of varying h / w , keeping h constant and changing w. The cases analysed were the configurations CSW-5, CSW-6, CSW-7 and CSW-8 for a constant value of w = 160   mm , and the configurations CSW-9, CSW-10, CSW-11 and CSW-12 for h = 160   mm . The base configuration ( h / w = 1 ) was also included in this analysis. As expected, both trends were similar. When h / w increased from 0.8 to 1.2 with w being constant, an increase of 39% of the strength was observed with respect to the strength of configuration CSW-5. When h was kept constant, the strength increased by 26.3% approximately.

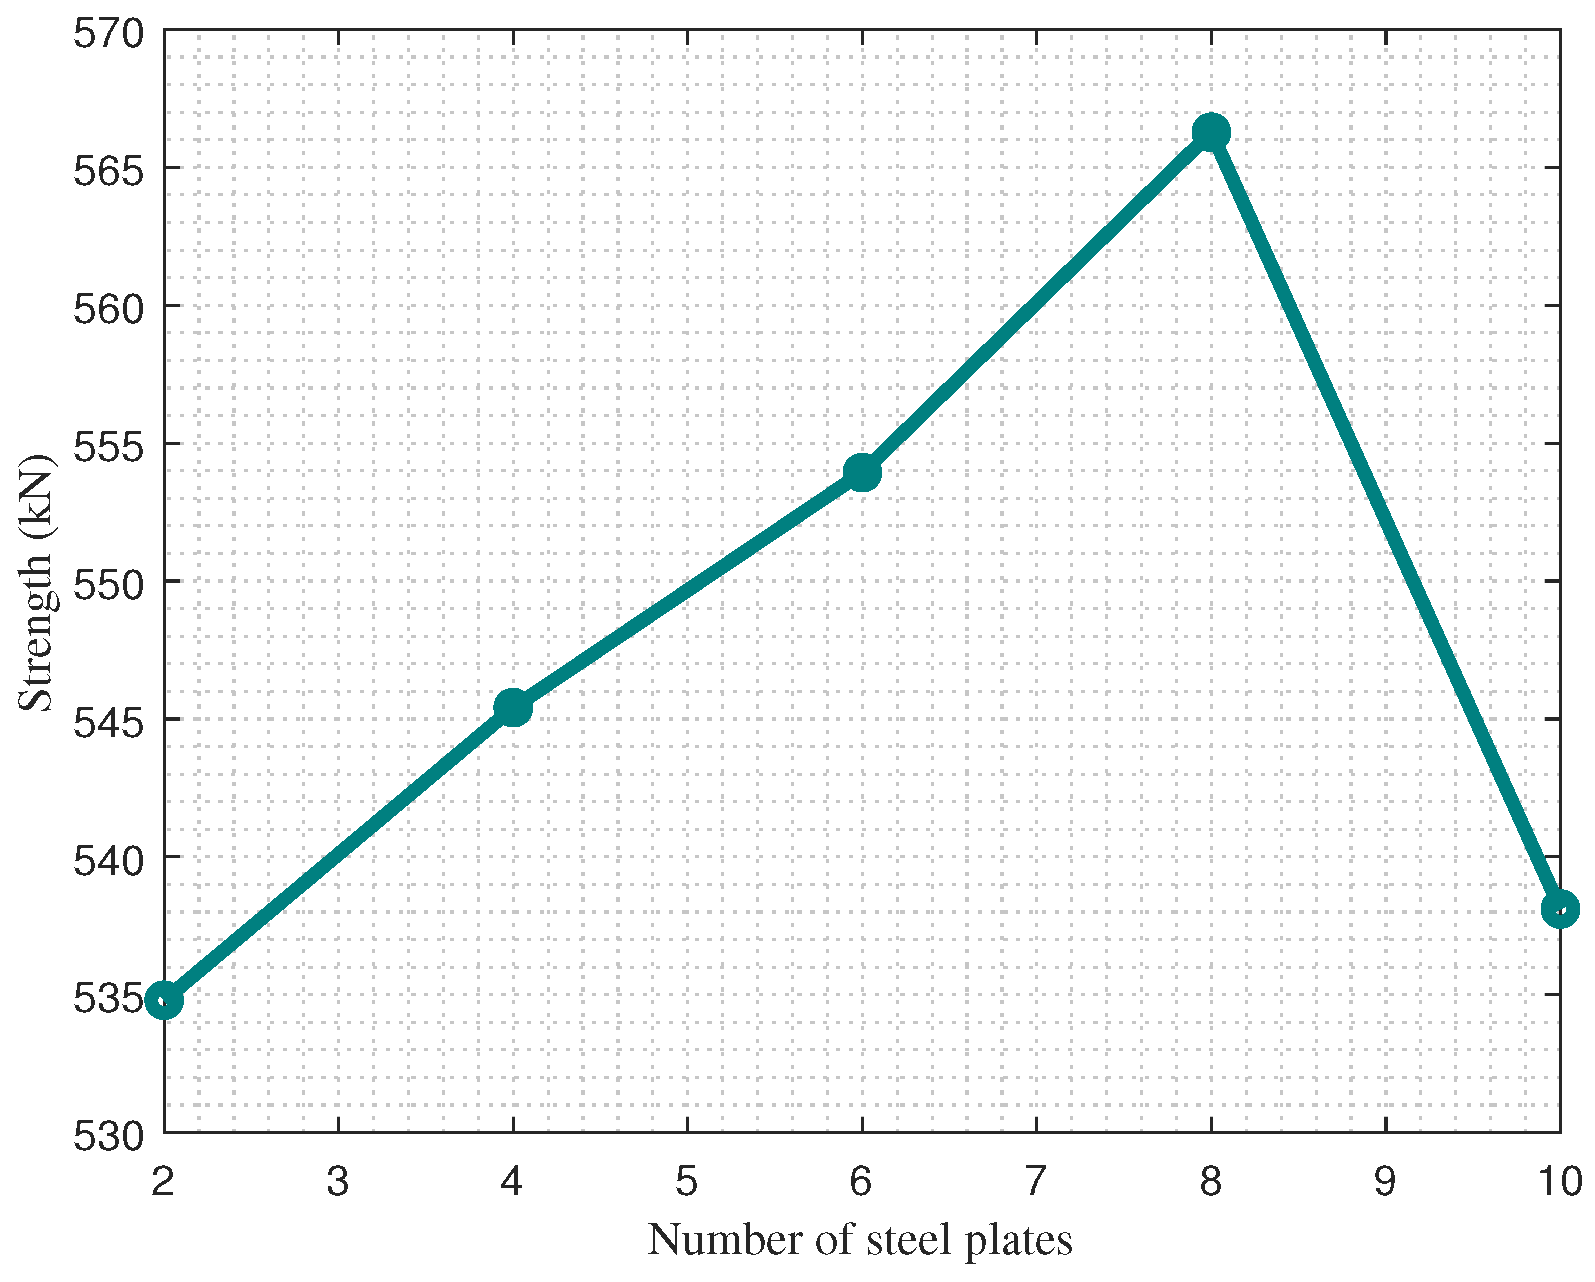
5.4. Effect of the Number of Embedded Steel Plates

Figure 10 shows the influence of the number of steel plates on the shear wall strength. Here, the x-axis represents the number of plates present in the FE model, while the y-axis is the strength S of the composite shear wall. All cases maintain the total weight of steel plates constant. The five cases analysed here are the CSW-13, CSW-14, CSW-15, CSW-16 and CSW-Base configurations, according to Table 2. The strengths of the specimens with n = 2 and n = 4 plates computed numerically were 3.6 % and 1.8 % lower than the strength of the base configuration, respectively. On the other hand, by increasing the number of plates from n = 6 (CSW-base configuration) to n = 8 , the strength increases from 555 kN to 566 kN. By increasing further the number of plates, up to n = 10 plates, the strength of the composite shear wall system decreases to 538 kN approximately. At this point, the behavior of the steel plates tends to be influenced by the effect of local buckling, reducing the shear capacity.

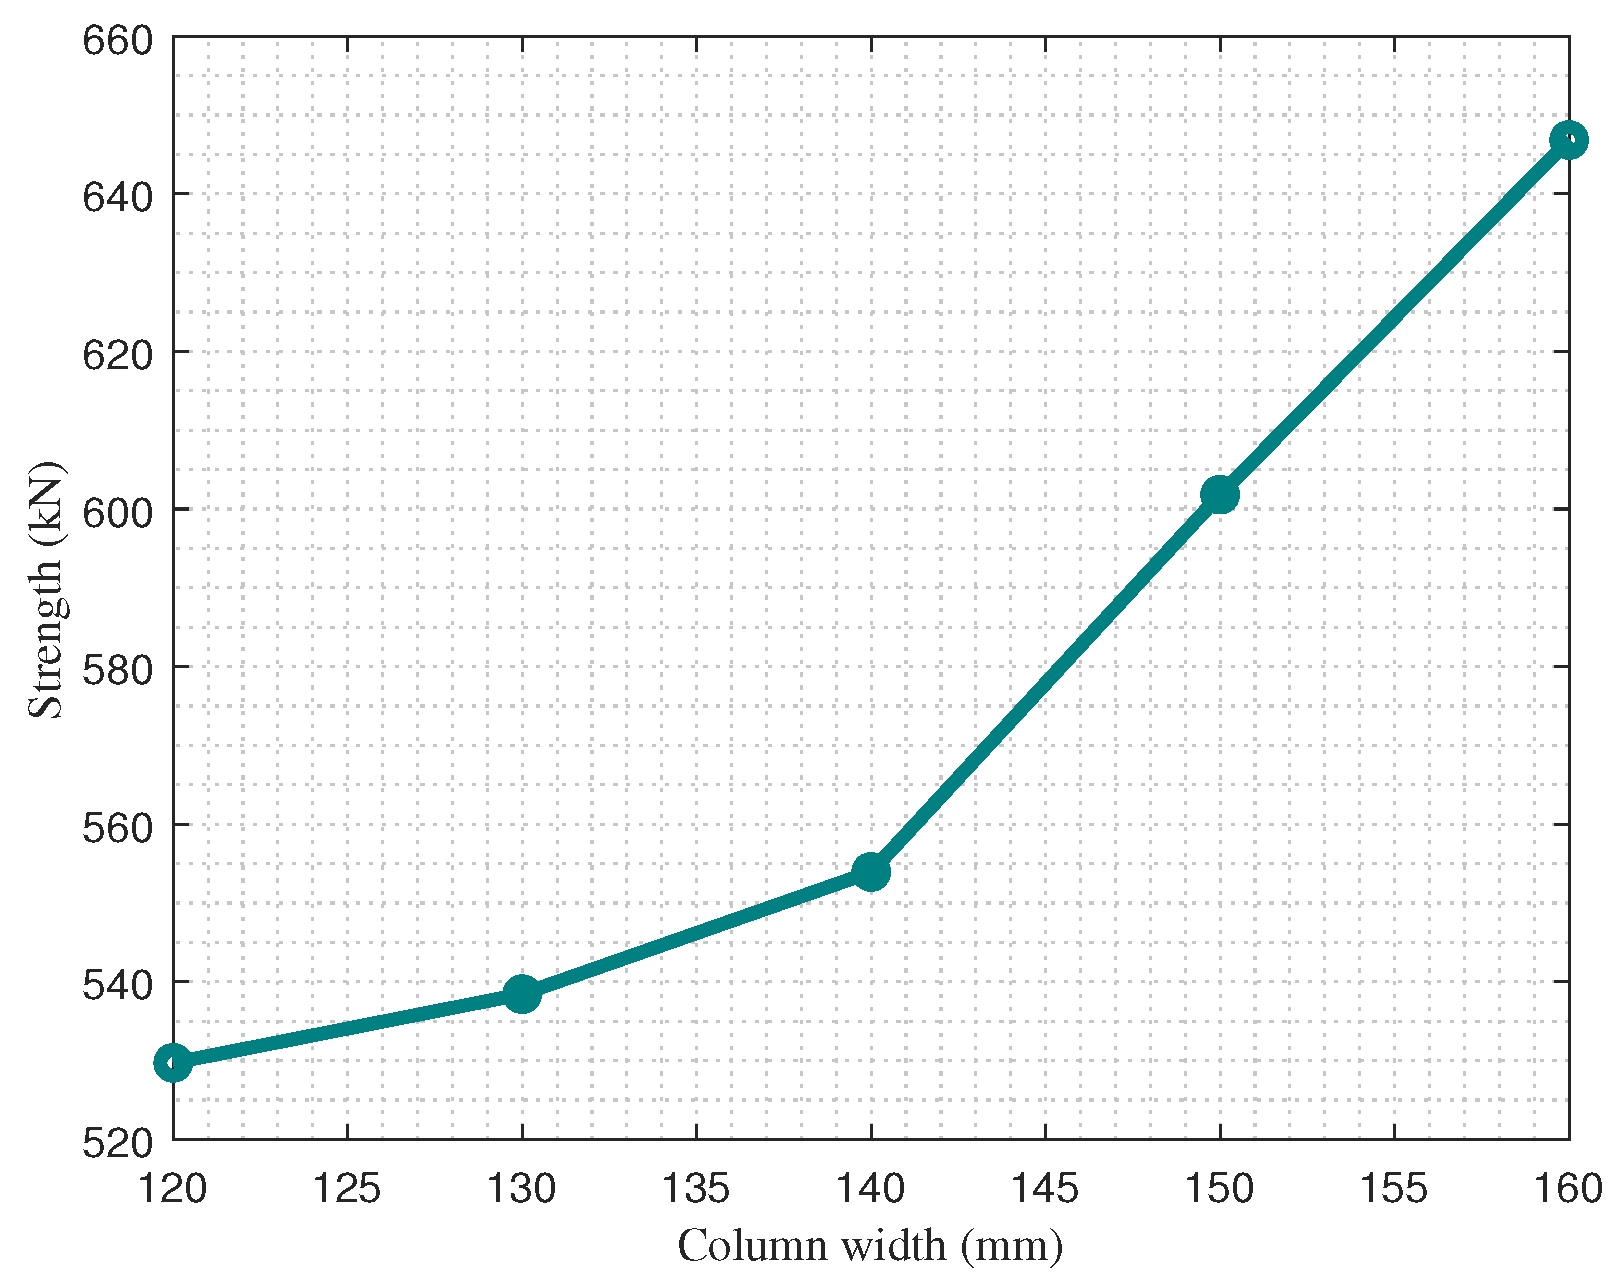
5.5. Effect of the Width of the CFST Columns

Figure 11 shows the strengths of the composite shear wall system for different CFST columns width. In this analysis, the specimens are identified as the CSW-17, CSW-18, CSW-19, CSW-20 and CSW-Base configurations, where a represents the column width. In all cases, the column depth b is held constant. The resulting strengths obtained from the numerical models do not change significantly when the column width ranges from 120 mm to 140 mm (CSW-Base). Here, the strength varies from 530 kN to 554 kN, that is, a 4.3 % increase. However, more significant increments are observed in the strength of the composite shear wall for column widths greater than 140 mm. For example, for a column width of 160 mm, the strength of the system increases up to 647 kN, representing a 17 % increase with respect to the base configuration.

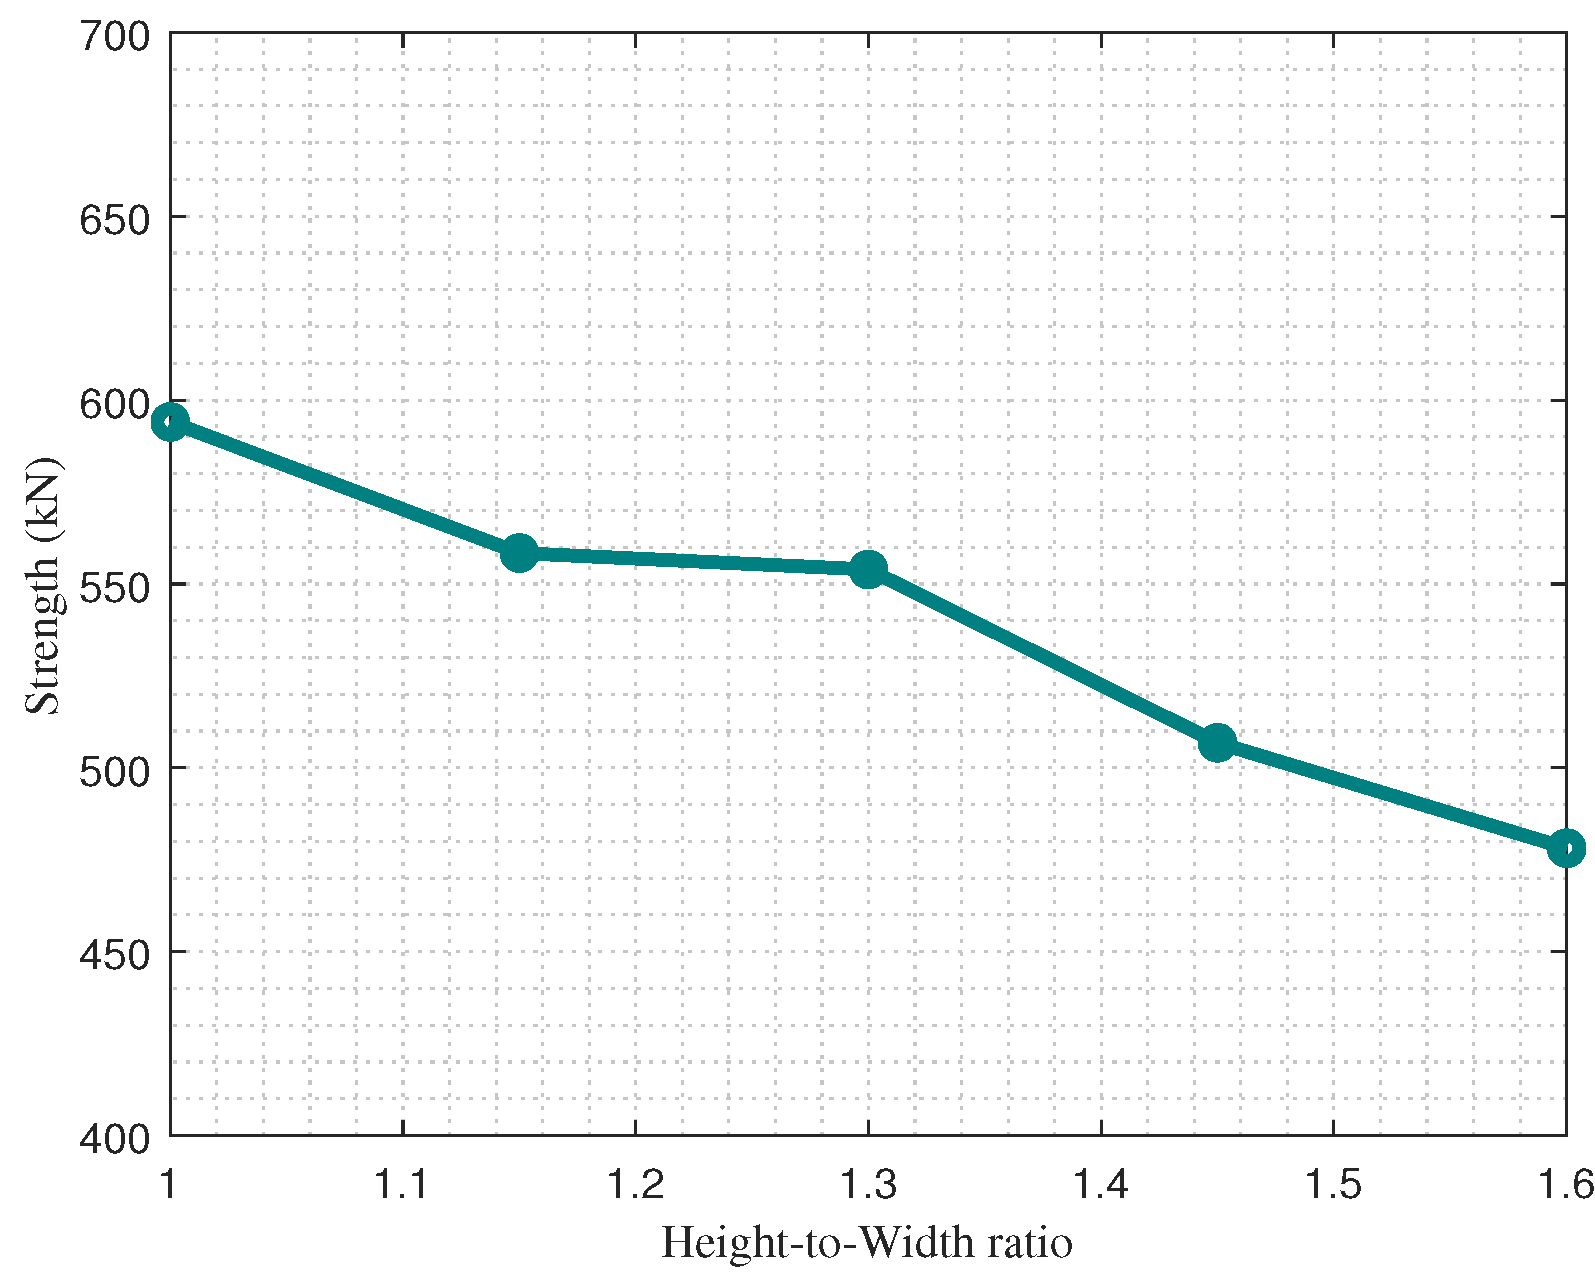
5.6. Effect of the Height-to-Width Ratio H / W of the Shear Wall

Figure 12 shows the strengths for different height-to-width ratios, H / W , of the shear wall. Here, the x-axis represents the height-to-width ratio H / W , ranging from 1.0 to 1.6 , while the y-axis is the strength of the composite shear wall. The five cases analysed here are the CSW-21, CSW-22, CSW-23, CSW-24 and CSW-Base configurations, according to Table 2. The CSW-Base configuration corresponds to the ratio of 1.3 . For the specimens with height-to-width ratio ranging from 1.0 to 1.15 , the strength decreased from 595 kN to 558 kN approximately. The strength of the system remains nearly constant for the specimens with height-to-width ratio ranging from 1.15 to 1.3 . For the specimens with the height-to-width ratio ranging from 1.3 to 1.6 , the strength decreased from 558 kN to 478 kN approximately. More specifically, the strength of the shear wall system decreases by almost 20% when the height-to-width ratio ranges from 1.0 to 1.6 .

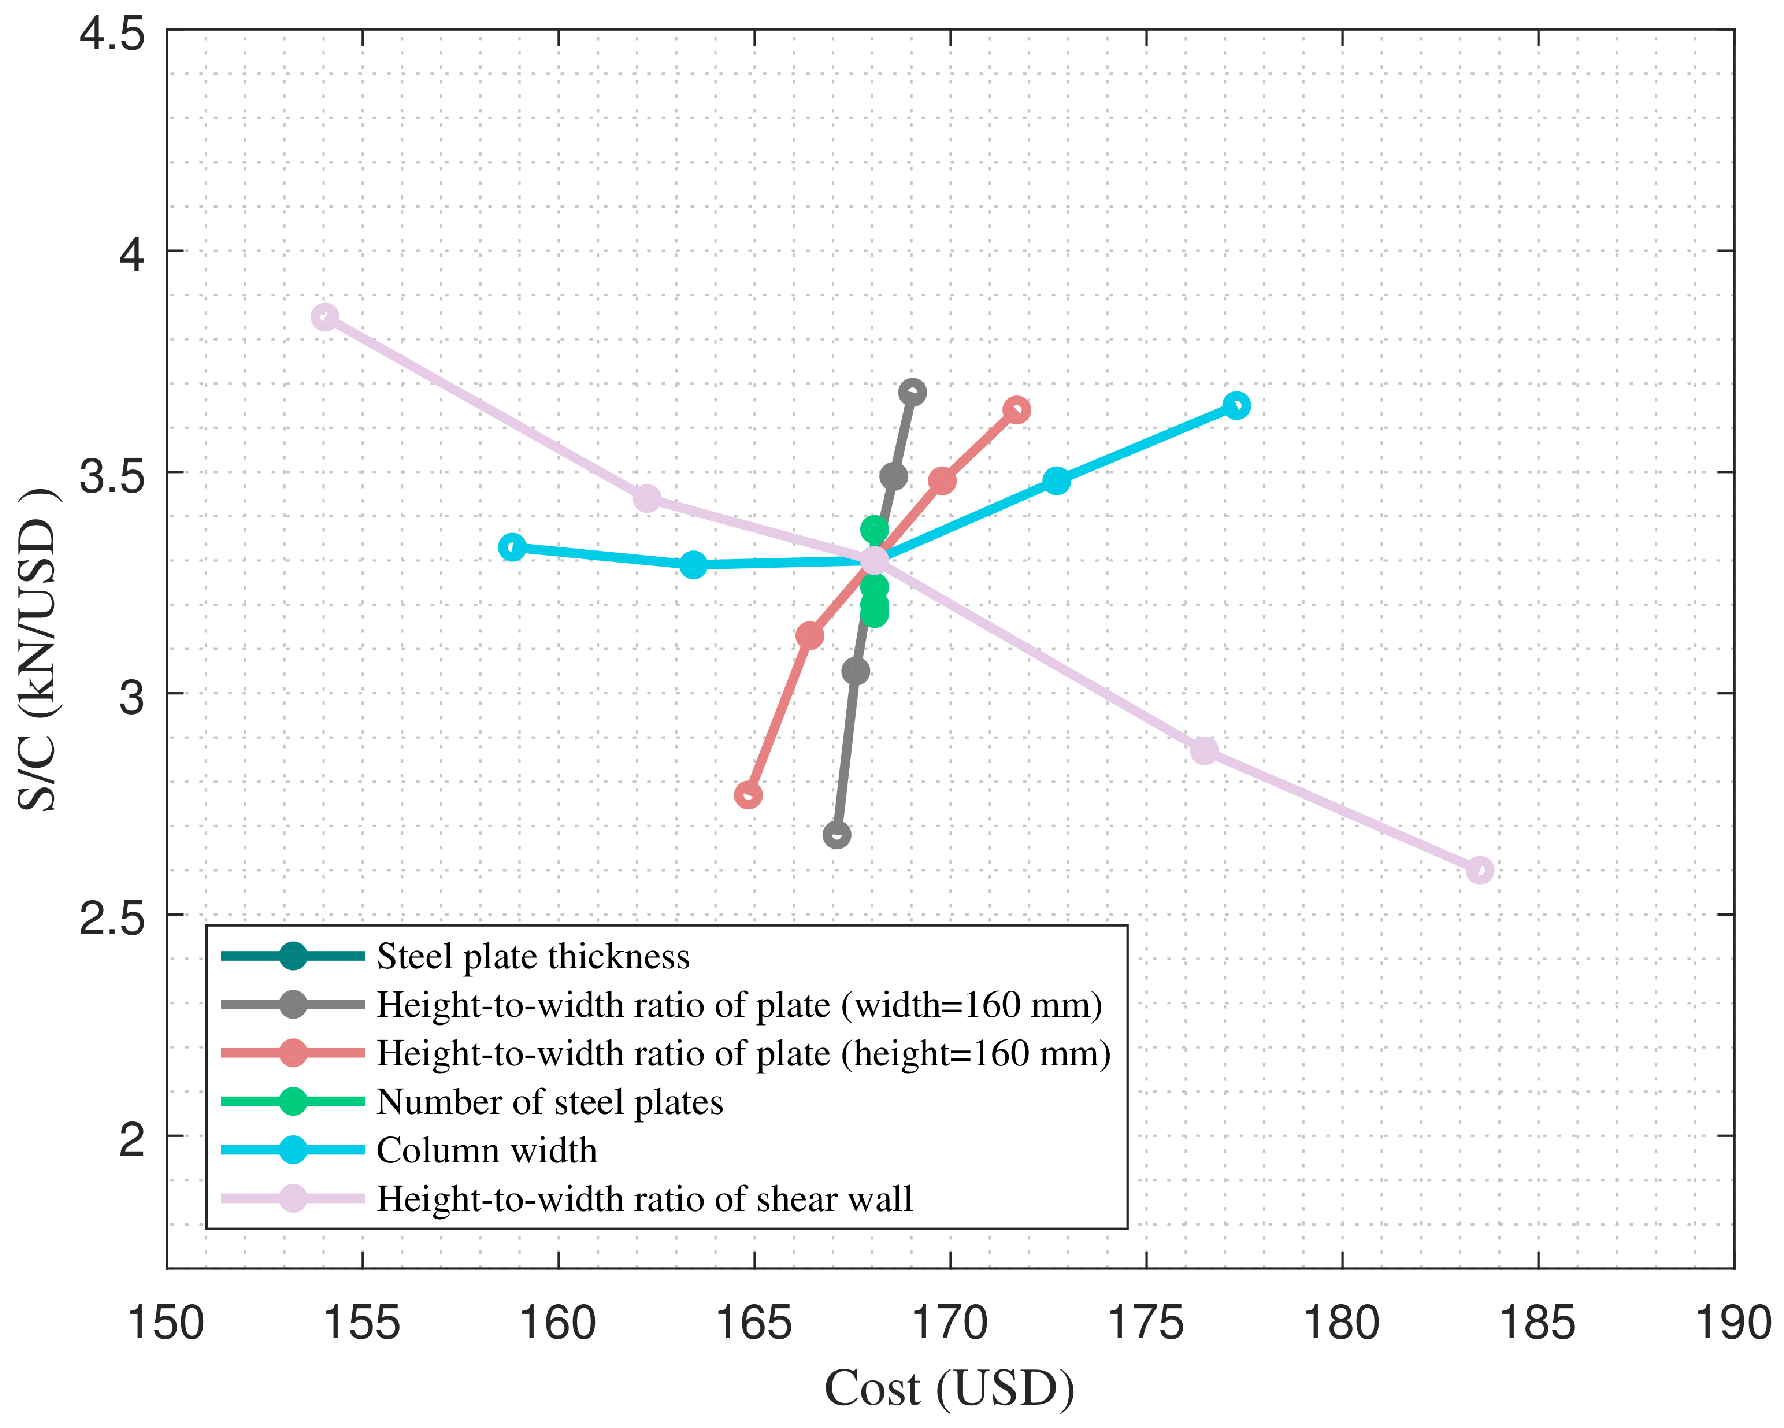
5.7. Costs and Normalised Strengths

As the previous analyses show, the strengths for different configurations, which may be associated with different weights of steel and volumes of concrete leading to different costs, are normalised. Thus, Table 4 shows the total weight of steel structure w s , the total volume of concrete v c , the total cost of structure C, the strength S, and the corresponding normalised strength per unit cost S / C , for each configuration. Here, the cost C was calculated for prices of 1 and 121 USD, for 1 kg f of steel and 1 m 3 of concrete, respectively. It is noted that these unit prices are reference values in the Chilean construction context and may vary from country to country. Nevertheless, the choice of other unit prices will lead to similar conclusions given the small changes observed in the concrete volumes found in Table 4. From the list of values, it can be observed that the configuration CSW-4 shows the maximum normalised strength. That is, for a plate thickness t = 6 mm, the total cost of such a configuration is estimated as 170.47 USD, and the strength reached is 709.3 kN, resulting in a normalised strength of 4.16 kN / USD . In contrast, CSW-1 shows the minimum normalised strength among all of the configurations, with a value of 2.57 kN / USD when the plate thickness is t = 2 mm. Another relevant configuration is the CSW-21, which shows the minimum cost among all of the configurations, with a value of 154.04 USD, and the second highest normalised strength equal to 3.85 kN / USD .
Figure 13 shows the normalised strengths for the costs of individual configurations. The different curves represent the variations of individual design parameters. From this graph, it is observed that the curves associated with steeper slopes show that those parameters which have a greater influence on the normalised strength. A quick inspection of these curves shows that the normalised shear strength is more sensitive to the changes in the number of steel plates than in any other parameter. That is to say, the shear strength S increases much faster than the total cost C when increasing this parameter. On the contrary, the normalised strength is barely influenced by the changes in the width of the CFST columns, particularly for those widths a between 120 mm and 140 mm. This is attributed to the fact that the increment rates of the cost C and the shear strength S are very similar within this range of width values. For greater widths, the strength S increases slightly faster than the cost C, resulting in a steeper slope as shown in Figure 13.

6. Conclusions

In this paper, C-PSW/CE structures with CFST columns were investigated by means of FE simulations. Twenty-five C-PSW/CE configurations were analysed and the influences of several design parameters on their maximum shear strengths were investigated. In general, each parameter showed its own particular behavior and its influence on the structural strength. Such influence was quantified by means of several numerical simulations. The main conclusions obtained from the present research work are summarised as follows:
  • As the plate thickness increased from 2 mm to 6 mm, the shear wall strength increased from 425 kN to 710 kN. That is, by tripling the thickness of the plates, the strength of the shear wall system increased by 67%;
  • By increasing the h / w ratio from 0.8 to 1.2, the shear wall strength increased from 445 kN to 620 kN when w was kept constant, and from 475 kN to 600 kN when h was kept constant. These values represent the increases in the shear wall strength of 39% and 26.3%, respectively.
  • As the number of plates increased from 2 to 8, the overall strength increased nearly linearly from 535 kN to 566 kN approximately, that is, a 5.6% increase. However, the strength decreased abruptly up to 538 kN when 10 plates were considered. This reduction was attributed to the effect of local buckling in the plates.
  • The shear wall strength increased nearly quadratically from 530 kN to 647 kN, approximately, when the column width varied from 120 mm to 160 mm, that is, a 21.7% increase.
  • The shear wall strength decreased from 590 kN to 480 kN approximately, when the height-to-width ratio H / W of the wall increased from 1 to 1.6. This represents a 18.6% reduction.
  • The normalised shear strength per unit cost of structure is more sensitive to the changes in the number of steel plates than in any other parameter studied in this paper. It was the most influencing parameter on the normalised shear strength of the composite wall system among all of the parameters studied here.
  • The normalised strength is barely influenced by the changes in the width of the CFST columns. It corresponded to the least influencing parameter on the normalised shear strength among all of the parameters investigated in this paper.

Author Contributions

Conceptualization, S.J.Y.; Methodology, M.J., E.I.S.F. and S.J.Y.; Software, M.J.; Formal analysis, M.J.; Investigation, M.J. and E.I.S.F.; Supervision, E.I.S.F., S.J.Y., S.A., J.C.P. and C.F.G.; Funding acquisition, E.I.S.F. and S.J.Y. All authors have read and agreed to the published version of the manuscript.

Funding

S.J.Y. acknowledges the financial support from Universidad de Santiago de Chile, Usach, through project N°052018YC, Dirección de Investigación Científica y Tecnológica, Dicyt. E.I.S.F. acknowledges funding coming from the Chilean National Research and Development Agency, ANID, research project Fondecyt Regular 1211767.

Data Availability Statement

Not applicatble.

Conflicts of Interest

The authors declare no conflict of interest.

References

  1. Esmaili, O.; Epackachi, S.; Samadzad, M.; Mirghaderi, S. Study of struc- tural RC shear wall system in a 56-story RC tall building. In Proceedings of the 14th World Conference Earthquake Engineering, Beijing, China, 12–17 October 2008. [Google Scholar]
  2. Lombard, J.; Lau, D.T.; Humar, J.L.; Foo, S.; Cheung, M.S. Seismic strengthening and repair of reinforced concrete shear walls. In Proceedings of the 12th World Conference on Earthquake Engineering, Auckland, New Zealand, 30 January–4 February 2000. [Google Scholar]
  3. Arabzadeh, A.; Soltani, M.; Ayazi, A. Experimental investigation of composite shear walls under shear loadings. Thin-Walled Struct. 2011, 49, 842–854. [Google Scholar] [CrossRef]
  4. Zhao, W.; Guo, Q.; Huang, Z.; Tan, L.; Chen, J.; Ye, Y. Hysteretic model for steelconcrete composite shear walls subjected to in-plane cyclic loading. Eng. Struct. 2016, 106, 461–470. [Google Scholar] [CrossRef]
  5. Guo, L.; Li, R.; Rong, Q.; Zhang, S. Cyclic behavior of SPSW and CSPSW in composite frame. J. Build. Eng. 2012, 51, 39–52. [Google Scholar] [CrossRef]
  6. Wang, R.W.; Cao, W.L.; Yin, F.; Dong, H.Y. Experimental Experimental and numerical study regarding a fabricated CFST frame composite wall structure. J. Constr. Steel Res. 2019, 162, 105718. [Google Scholar] [CrossRef]
  7. Wang, J.J.; Nie, X.; Bu, F.M.; Tao, M.X.; Fan, J.S. Experimental study and design method of shear-dominated composite plate shear walls. Eng. Struct. 2020, 215, 110656. [Google Scholar] [CrossRef]
  8. Huang, S.T.; Huang, Y.S.; He, A.; Tang, X.L.; Chen, Q.J.; Liu, X.; Cai, J. Experimental study on seismic behavior of an innovative composite shear wall. J. Constr. Steel Res. 2018, 148, 165–179. [Google Scholar] [CrossRef]
  9. Zhang, J.; Li, X.; Cao, W.; Yu, C. Seismic behavior of composite shear walls incorporating high-strength materials and CFST boundary elements. Eng. Struct. 2020, 220, 110994. [Google Scholar] [CrossRef]
  10. Wang, W.; Wang, Y.; Lu, Z. Experimental study on seismic behavior of steel plate reinforced concrete composite shear wall. Eng. Struct. 2018, 160, 281–292. [Google Scholar] [CrossRef]
  11. Nie, X.; Wang, J.J.; Tao, M.X.; Fan, J.S.; Bu, F.M. Experimental study of flexural critical reinforced concrete filled composite plate shear walls. Engineering Structures. 2019, 197, 109439. [Google Scholar] [CrossRef]
  12. Lu, X.; Zhang, Y.; Zhang, H.; Zhang, H.; Xiao, R. Experimental study on seismic performance of steel fiber reinforced high strength concrete composite shear walls with different steel fiber volume fractions. Eng. Struct. 2018, 171, 247–259. [Google Scholar] [CrossRef]
  13. Ren, F.; Chen, J.; Chen, G.; Guo, Y.; Jiang, T. Seismic behavior of composite shear walls incorporating concrete-filled steel and FRP tubes as boundary elements. Eng. Struct. 2018, 168, 405–419. [Google Scholar] [CrossRef]
  14. Dong, H.; Cao, W.; Wu, H.; Qiao, Q.; Yu, C. Experimental and analytical study on seismic behavior of steel–concrete multienergy dissipation composite shear walls. Earthq. Eng. Eng. Vib. 2015, 14, 125–139. [Google Scholar] [CrossRef]
  15. Qiao, Y.; Cao, W.L.; Li, X.Y.; Dong, H.Y.; Zhang, W.W.; Yin, F. Seismic behavior of shear walls with boundary CFST columns and embedded multiple steel plates: Experimental investigation. Eng. Struct. 2018, 160, 243–256. [Google Scholar] [CrossRef]
  16. Yan, Y.; Liang, H.; Lu, Y.; Huang, Y. Behaviour of concrete-filled steel-tube columns strengthened with high-strength CFRP textile grid-reinforced high-ductility engineered cementitious composites. Eng. Struct. 2021, 269, 121283. [Google Scholar] [CrossRef]
  17. Qiu, Y.; Wang, Z.; Pan, J.; Hu, F.; Sharma, S.; Deifalla, A.F. Optimal Design of Semirigid Connection Steel Frame with Steel Plate Shear Walls Using Dolphin Echolocation Algorithm. Buildings 2022, 12, 1735. [Google Scholar] [CrossRef]
  18. Ghafar, W.A.; Tao, Z.; Tao, Y.; He, Y.; Wu, L.; Zhang, Z. Experimental and numerical study of an innovative infill web-strips steel plate shear wall with rigid beam-to-column connections. Buildings 2022, 12, 1560. [Google Scholar] [CrossRef]
  19. Majlesi, A.; Asadi-Ghoozhdi, H.; Bamshad, O.; Attarnejad, R.; Masoodi, A.R.; Ghassemieh, M. On the seismic evaluation of steel frames laterally braced with perforated steel plate shear walls considering semi-rigid connections. Buildings 2022, 12, 1427. [Google Scholar] [CrossRef]
  20. Xiong, Y.; Chen, A.; Wu, D.; Zhao, G. Seismic performance of composite shear walls filled with demolished concrete lumps and self-compacting concrete after fire. Buildings 2022, 12, 1308. [Google Scholar] [CrossRef]
  21. Zhang, L.; Han, X.; Chen, X.; Ji, J. Experimental study on the seismic behavior of squat SRC shear walls with high axial load ratio. Buildings 2022, 12, 1238. [Google Scholar] [CrossRef]
  22. Rahnavard, R.; Hassanipour, A.; Mounesi, A. Numerical study on important parameters of composite steel–concrete shear walls. J. Constr. Steel Res. 2016, 121, 441–456. [Google Scholar] [CrossRef]
  23. Epackachi, S.; Whittaker, A.S.; Aref, A. Seismic analysis and design of steel-plate concrete composite shear wall piers. Eng. Struct. 2017, 133, 105–123. [Google Scholar] [CrossRef] [Green Version]
  24. Rassouli, B.; Shafaei, S.; Ayazi, A.; Farahbod, F. Experimental and numerical study on steel–concrete composite shear wall using light-weight concrete. Eng. Struct. 2016, 126, 117–128. [Google Scholar] [CrossRef]
  25. Qi, Y.; Gu, Q.; Sun, G.; Zhao, B. Shear force demand on headed stud for the design of composite steel plate shear wall. Eng. Struct. 2017, 148, 780–792. [Google Scholar] [CrossRef]
  26. Kisa, M.H.; Yuksel, S.B.; Caglar, N. Experimental study on hysteric behavior of composite shear walls with steel sheets. J. Build. Eng. 2021, 33, 101570. [Google Scholar] [CrossRef]
  27. AISC 341; Seismic Provisions for Structural Steel Buildings. American Institute of Steel Construction: Chicago, IL, USA, 2016.
  28. Xie, Q.; Xiao, J.; Xie, W.; Gao, W. Experimental study on hysteric behavior of composite shear walls with steel sheets. Adv. Struct. Eng. 2019, 22, 54–68. [Google Scholar] [CrossRef]
  29. Tong, G.-S.; Rao, Z.-Y. Notional load consistent with Chinese code for design of steel structures GB 50017-2003. Prog. Steel Build. Struct. 2009, 4, 5–14. (In Chinese) [Google Scholar]
  30. Sadowski, A.J.; Rotter, J.M.; Reinke, T.; Ummenhofer, T. Statistical analysis of the material properties of selected structural carbon steels. Struct. Saf. 2015, 53, 26–35. [Google Scholar] [CrossRef]
  31. GB50010-2010; Code for Design of Concrete Structures. China Ministry of Construction: Beijing, China, 2010.
  32. American Concrete Institute (ACI). Building Code Requirements for Structural Concrete (ACI 318-14) and Commentary (318R-14).; American Concrete Institute: Farmington Hills, MI, USA, 2014. [Google Scholar]
  33. Hognestad, E. Study of Combined Bending and Axial Load in Reinforced Concrete Members. Ph.D. Thesis, University of Illinois at Urbana Champaign, College of Engineering, Urbana, IL, USA, 1951. [Google Scholar]
  34. ANSYS. ANSYS Mechanical APDL Theory Reference—Version R1; ANSYS, Inc.: Canonsburg, PA, USA, 2020. [Google Scholar]
  35. Willam, K.J.; Warnke, E.P. Constitutive model for triaxial behavior of concrete. In Proceedings of the International Association of Bridge and Structural Engineering Conference, New Delhi, India, 22–24 January 1974; pp. 174–191. [Google Scholar]
  36. Halahla, A. Identification of crack in reinforced concrete beam subjected to static load using nonlinear finite element analysis. Civ. Eng. J. 2019, 15, 1631–1646. [Google Scholar] [CrossRef]
Figure 1. General dimensions of the shear wall structure investigated in this work, adapted from Qiao et al. [15].
Buildings 13 00187 g001
Figure 2. Idealised stress–strain curve for the steel.
Buildings 13 00187 g002
Figure 3. Modified Hognestad model for concrete [33].
Buildings 13 00187 g003
Figure 4. Typical FE mesh of the shear wall system. Grey, cyan, and purple colours represent concrete, and steel of columns and plates, respectively. Note that, for the sake of clarity, only half of the geometry has been shown here.
Buildings 13 00187 g004
Figure 5. Cyclic loading protocol for the numerical model.
Buildings 13 00187 g005
Figure 6. Geometric parameters investigated in this paper.
Buildings 13 00187 g006
Figure 7. (a) Crack pattern observed experimentally in the structure [15], (b) cracks predicted numerically, and (c) contact sliding distance.
Buildings 13 00187 g007aBuildings 13 00187 g007b
Figure 8. Shear wall strength S for different values of plate thickness t.
Buildings 13 00187 g008
Figure 9. Shear wall strength S for different h / w ratios.
Buildings 13 00187 g009
Figure 10. Shear wall strength S for different numbers of steel plates, n.
Buildings 13 00187 g010
Figure 11. Shear wall strength S for different CFST column widths, a.
Buildings 13 00187 g011
Figure 12. Shear wall strength S for different H / W ratios.
Buildings 13 00187 g012
Figure 13. Normalised strengths for the different costs of configurations. The colour of each curve is associated with the variation of a design parameter as shown in the legend.
Buildings 13 00187 g013
Table 1. Mechanical properties of steel structural components.
ComponentDimensions (mm) f y ( MPa ) f u ( MPa ) E s ( GPa )
Columns 140 × 140 × 4 375508205
Plates 160 × 160 × 4 270401206
Table 2. Design parameters of individual configurations.
Configurationh (mm)w (mm)t (mm)n (-) h / w a (mm) H / W
CSW-11601602611401.3
CSW-21601603611401.3
CSW-31601605611401.3
CSW-41601606611401.3
CSW-5128160460.81401.3
CSW-6144160460.91401.3
CSW-7176160461.11401.3
CSW-8192160461.21401.3
CSW-9160200460.81401.3
CSW-10160 177.8 460.91401.3
CSW-11160 145.4 461.11401.3
CSW-12160 133.3 461.21401.3
CSW-131601604211401.3
CSW-141601604411401.3
CSW-151601604811401.3
CSW-1616016041011401.3
CSW-171601604611201.3
CSW-181601604611301.3
CSW-191601604611501.3
CSW-201601604611601.3
CSW-211601604611401
CSW-221601604611401.15
CSW-231601604611401.45
CSW-241601604611401.6
CSW-Base1601604611401.3
Table 3. Experimental data [15] and FE predictions.
Initial CrackingFirst YieldSecond YieldMaximum Strength
F c (kN) θ c (rad) F y 1 (kN) θ y 1 (rad) F y 2 (kN) θ y 2 (rad) F m (kN) θ m (rad)
EXP.1250.0022800.0034090.0084890.02
FEM114.50.00122800.00323910.006--
Table 4. Costs and normalised strengths.
Configuration w s (kg f ) v c (m 3 )C (USD)S (kN) S C kN USD
CSW-197.890.56165.65425.42.57
CSW-299.100.56166.86536.13.21
CSW-3101.510.56169.27605.23.57
CSW-4102.710.56170.47709.34.16
CSW-599.340.56167.10447.42.68
CSW-699.820.56167.58511.43.05
CSW-7100.790.56168.55588.33.49
CSW-8101.270.56169.03622.33.68
CSW-9101.510.58171.69476.22.77
CSW-10100.820.57169.79531.53.13
CSW-1199.860.55166.41579.83.48
CSW-1299.500.54164.84600.53.64
CSW-13100.300.56168.06534.83.18
CSW-14100.300.56168.06545.43.24
CSW-15100.300.56168.06566.33.37
CSW-16100.300.56168.06538.13.20
CSW-1793.480.54158.82529.73.33
CSW-1896.890.55163.44538.43.29
CSW-19103.740.57172.71601.83.48
CSW-20107.120.58177.30646.83.65
CSW-2188.700.54154.04594.13.85
CSW-2294.500.56162.26558.43.44
CSW-23106.300.58176.48506.82.87
CSW-24112.120.59183.51478.12.60
CSW-Base100.30.56168.06554.93.30
Disclaimer/Publisher’s Note: The statements, opinions and data contained in all publications are solely those of the individual author(s) and contributor(s) and not of MDPI and/or the editor(s). MDPI and/or the editor(s) disclaim responsibility for any injury to people or property resulting from any ideas, methods, instructions or products referred to in the content.

