Article

Application of Scheduling Techniques for Load-Shifting in Smart Homes with Renewable-Energy-Sources Integration

by
Otilia Elena Dragomir
1,2,* and
Florin Dragomir
2,*
1
Academy of Romanian Scientists, 54, Splaiul Independentei, 050044 Bucharest, Romania
2
Automation, Computer Science and Electrical Engineering Department, Valahia University of Târgoviște, 13 Aleea Sinaia Street, 130004 Târgoviște, Romania
*
Authors to whom correspondence should be addressed.
Buildings 2023, 13(1), 134; https://doi.org/10.3390/buildings13010134
Submission received: 3 December 2022 / Revised: 27 December 2022 / Accepted: 31 December 2022 / Published: 4 January 2023
(This article belongs to the Special Issue Renewable Energy in Buildings)

Abstract

:
The general context of this proposal is represented by the energy-efficient smart home that integrates renewable energy sources such as photovoltaic panels. The objective of this article is to minimize the amount of energy consumed from the national energy grid by producer-consumers of energy from renewable sources, in their own smart homes. In order to fulfill this goal, it was necessary to estimate the amount of renewable energy produced on the day-ahead horizon and to schedule the operation of controllable consumers in a smart home. To predict the amount of energy produced, two approaches were used: the first was based on data, and used techniques specific to artificial intelligence, more specifically, multilayer perceptron and radial-basis-function neural networks, and the second was based on models. The accuracy of the short-term prediction horizon of the techniques used was evaluated with quantitative performance indicators so that the most appropriate one in relation to the goal of the article could be selected to be used in the test scenarios. The scheduling of consumer functioning was based on their classification in relation to their ability to be controlled, and on the selection from the peer-reviewed literature of an optimization algorithm which, by load shifting from a smart home, ensured the optimal fulfillment of the objective function. The selected load-shifting algorithm was then integrated into and tested on a real database. The data used were monitored for two representative days, in terms of the amount of energy from renewable energy sources produced and consumed. The load-shifting algorithm proved its effectiveness through the results obtained and which are reported in the article.

1. Introduction

Recent trends in the energy market require prosumers (producers and consumers of energy from renewable energy sources) to take into consideration more complex energy-balance scenarios based on power and load balance, while the integration of large-scale renewable energy sources in the home increases and the number of home appliances introduces a not always predictable electricity consumption. Among the categories of well-known renewable sources, the ones that have experienced considerable development due to their successful integration into homes, are photovoltaic energy sources. The success is largely due to the fact that they can convert the Sun’s energy into electricity without the help of heat engines and with fewer conversion failures.
Prosumers who chose to integrate this type of alternative source into their homes consider a number of factors that decisively influence the amount of green energy produced, among which we can mention: the solar constant at the location, the latitude of the location, the type of climate of the location, the local longitude of the location, the longitude of the standard meridian for the location, and the standard clock-time of the location. If the values of these variables are known, there are different mathematical models [1], called classical methods, with the help of which we can estimate the amount of energy produced from RES. In this framework, the problem can be regarded as time-series forecasting, for which different approaches can be considered [2,3,4,5].
The artificial intelligence techniques [6], include artificial neural networks (NN), such as multilayer-perceptron and feedforward neural-networks [7,8], radial-basis-functions neural networks [9], adaptive neuro-fuzzy inference systems [10], fuzzy-expert systems [11], multi-agent-based hybrid systems [12], convolutional neural networks [13,14], recurrent neural networks [15,16] and restricted Boltzmann machines [17]. Concerning long short-term memory architectures, these are effective in dealing with a variety of highly complex problems [18,19]. The incorporation of additional layers within deep-neural-network [20,21] architectures can significantly improve generalization performance, both for short- and long-term horizons. The main drawback of these highly complex intelligent topologies is the training computational-burden.
Unlike classical estimation methods, predictive models based on artificial-intelligence techniques are based on data. Therefore, a database is needed, resulting from smart-grid monitoring, which allows us to estimate the power generated from RES. The trend in the energy market is not only that of diversifying the sources of energy used in a smart home and estimating the amount of energy produced, but also that of using the energy available efficiently [22].
Household energy efficiency can be achieved mainly in two ways: by reducing total energy consumption or by consumption shifting. Consumption reduction refers to reducing the overall energy load, usually by increasing consumer awareness, shutting down appliances not in use, purchasing energy-efficient devices, or improving home construction and design. On the other hand, consumption shifting is focused on deferring certain loads over time, usually to off-peak periods, taking advantage of local production from renewable energy sources (RES) and off-peak tariffs in a liberalized energy market. Naturally, these two alternatives are not mutually exclusive, and can be employed together.
For determining optimal load-shifting, critical choices need to be made concerning the appliances to be managed, operational constraints of the grid, and the scheduling techniques to be considered. Scheduling is usually conducted over a future time-horizon, for which household demands and electricity generation can be predicted with accuracy. In this case, adequate and representative consumption and energy production from RES profiles are required. In addition, the core of the energy-management problem is intelligent load-shifting, which in an actual European scenario means minimizing energy payment by maximizing the energy from the self-consumption of renewable energy sources [23].
A wide variety of methods and techniques have been proposed in the scientific literature to improve the use of energy from RES through load schedules. These methodologies can generally be grouped into five categories: mathematical optimization, heuristic and metaheuristic methods, model-based predictive control, machine learning, and game-theory approaches [24].
The category of mathematical-optimization-based scheduling techniques includes non-linear programming problems, convex programming problems, and dynamic optimization problems. These techniques are the most popular choice for small and medium-sized scheduling problems addressed by home energy-management-systems. We have revised in our proposal the integration of mixed-integer linear-programming techniques (MILP) with different applications for energy scheduling purposes.
Thus, we have identified Sou, in [25], who proposes mixed-integer linear programming for minimizing the electricity cost in a smart home by assigning constraints such as enforcing uninterruptible and sequential operations for residential controllable loads. On the other hand, Tostado, in [26], uses the MILP for the optimal scheduling of a series of flexible appliances on various days of the week, involving different tariff options.
For example, [27] the authors describe the use of linear programming to schedule the electricity use of an industrial consumer for product manufacturing. For this type of consumer, additional restrictions are added to optimize the scheduling.
Srilakshmi proposes in [28] an approach for an electric vehicle charging/discharging-schedule rate in which the cars are modeled using MILP. The algorithm is used to maximize economic benefit for the prosumers, the owners of electric vehicles, with minimal battery degradation. In this approach, the optimization using MILP yields a definite optimal solution rather than a meta-heuristic optimization solution.
In his work, Koltsaklis [29] determines the optimal day-ahead energy scheduling of all load types for a smart home, through a cost-minimization objective function. The hybrid prediction model combines the k-medoids algorithm for performing the clustering of the training set and for input selection with the computing of the prediction using the Elman neural network.
In the general context of an energy-efficient smart home that integrates renewable energy sources such as photovoltaic panels, the objective of this article is to minimize the amount of energy consumed from the national energy grid by producer-consumers of energy from renewable sources, in their own smart homes. In order to fulfill this goal, it is necessary to estimate the amount of renewable energy produced on a day-ahead horizon and to schedule the operation of controllable consumers in a smart home. In consequence, the smart-prosumer framework, which supposes the smart-home-appliance consumption-classification and power-generation from renewable sources, is discussed in Section 2 of this article. Then, Section 3 introduces the mathematical formulation of the load-shifting algorithm and the principles of scheduling of energy consumption. Section 4 presents the numerical results obtained from a real prosumer database, and underlines the advantages of the proposed approach. Finally, in Section 5, conclusions and future research directions are presented.

2. Energy-Management Framework

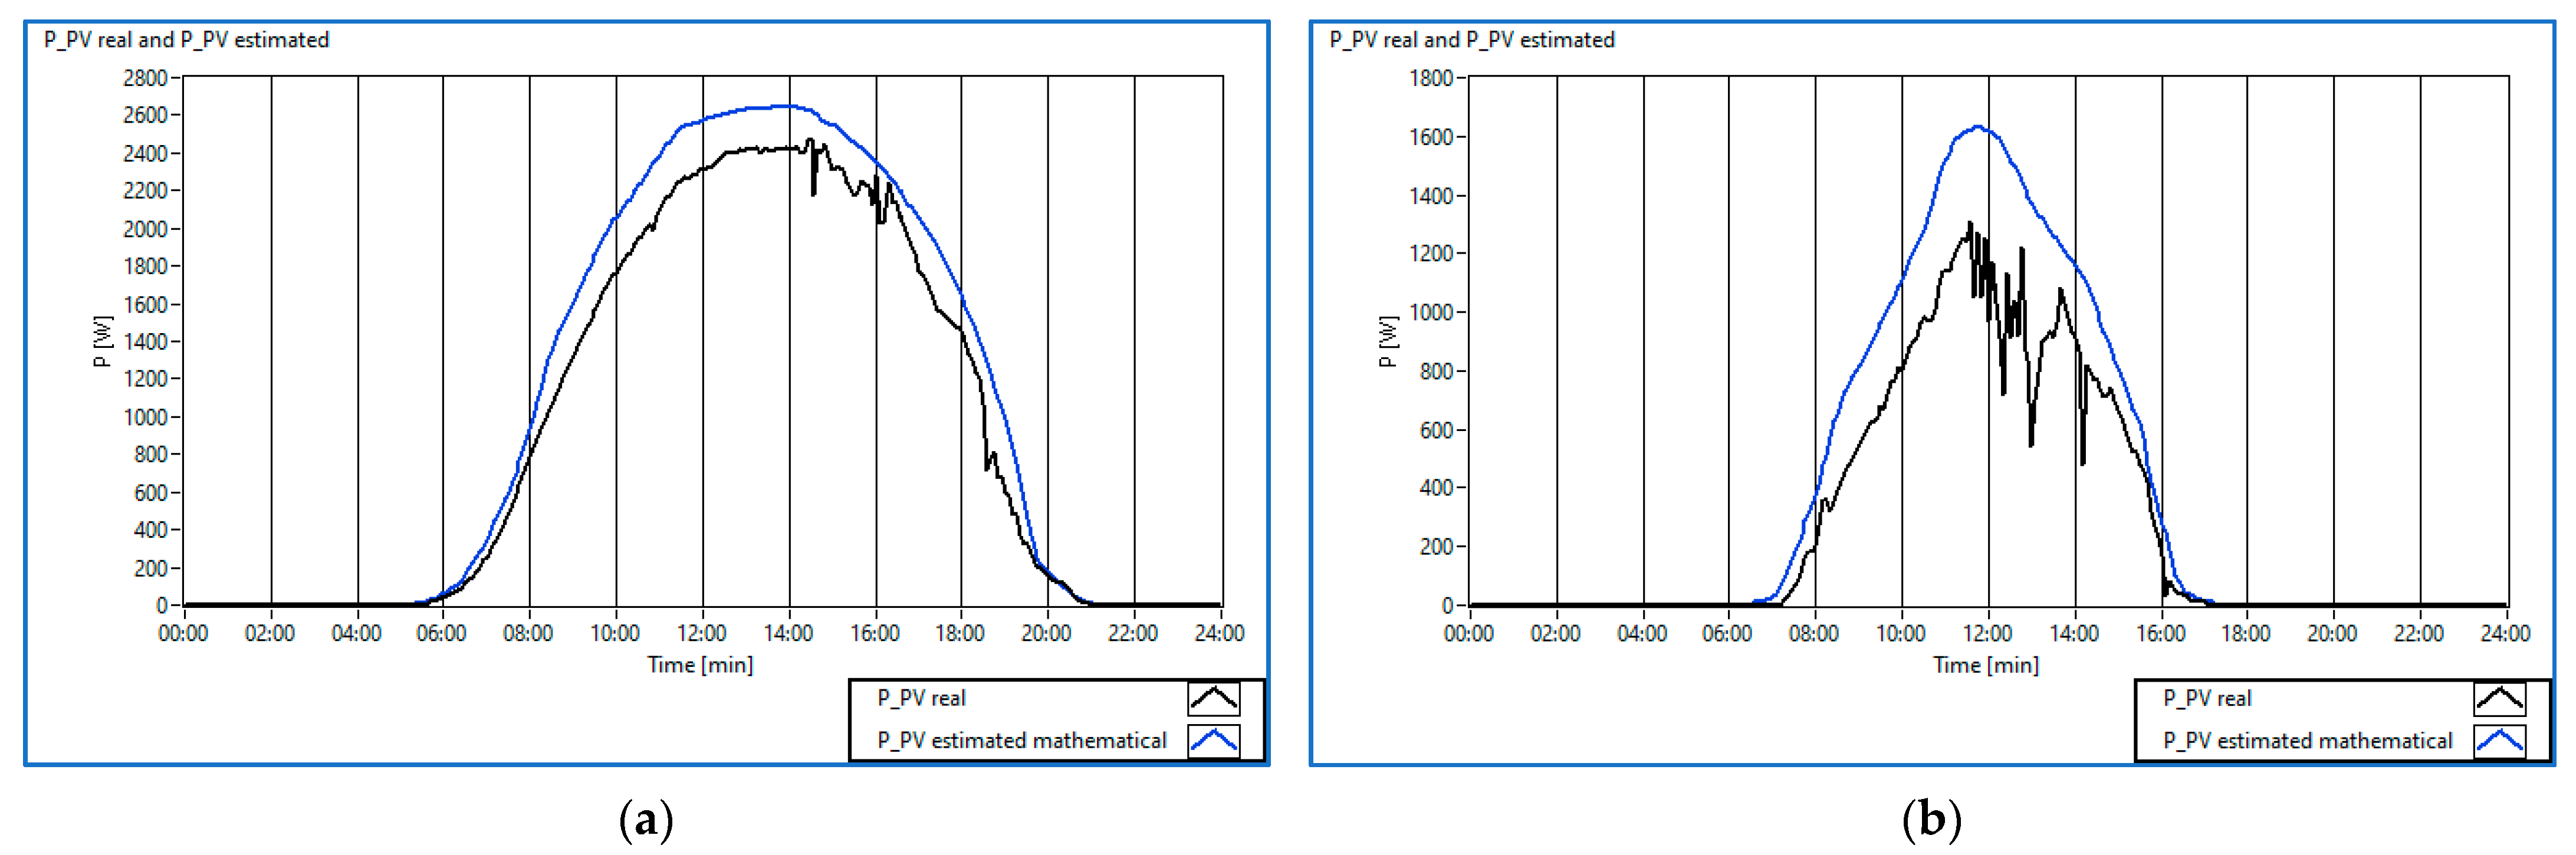
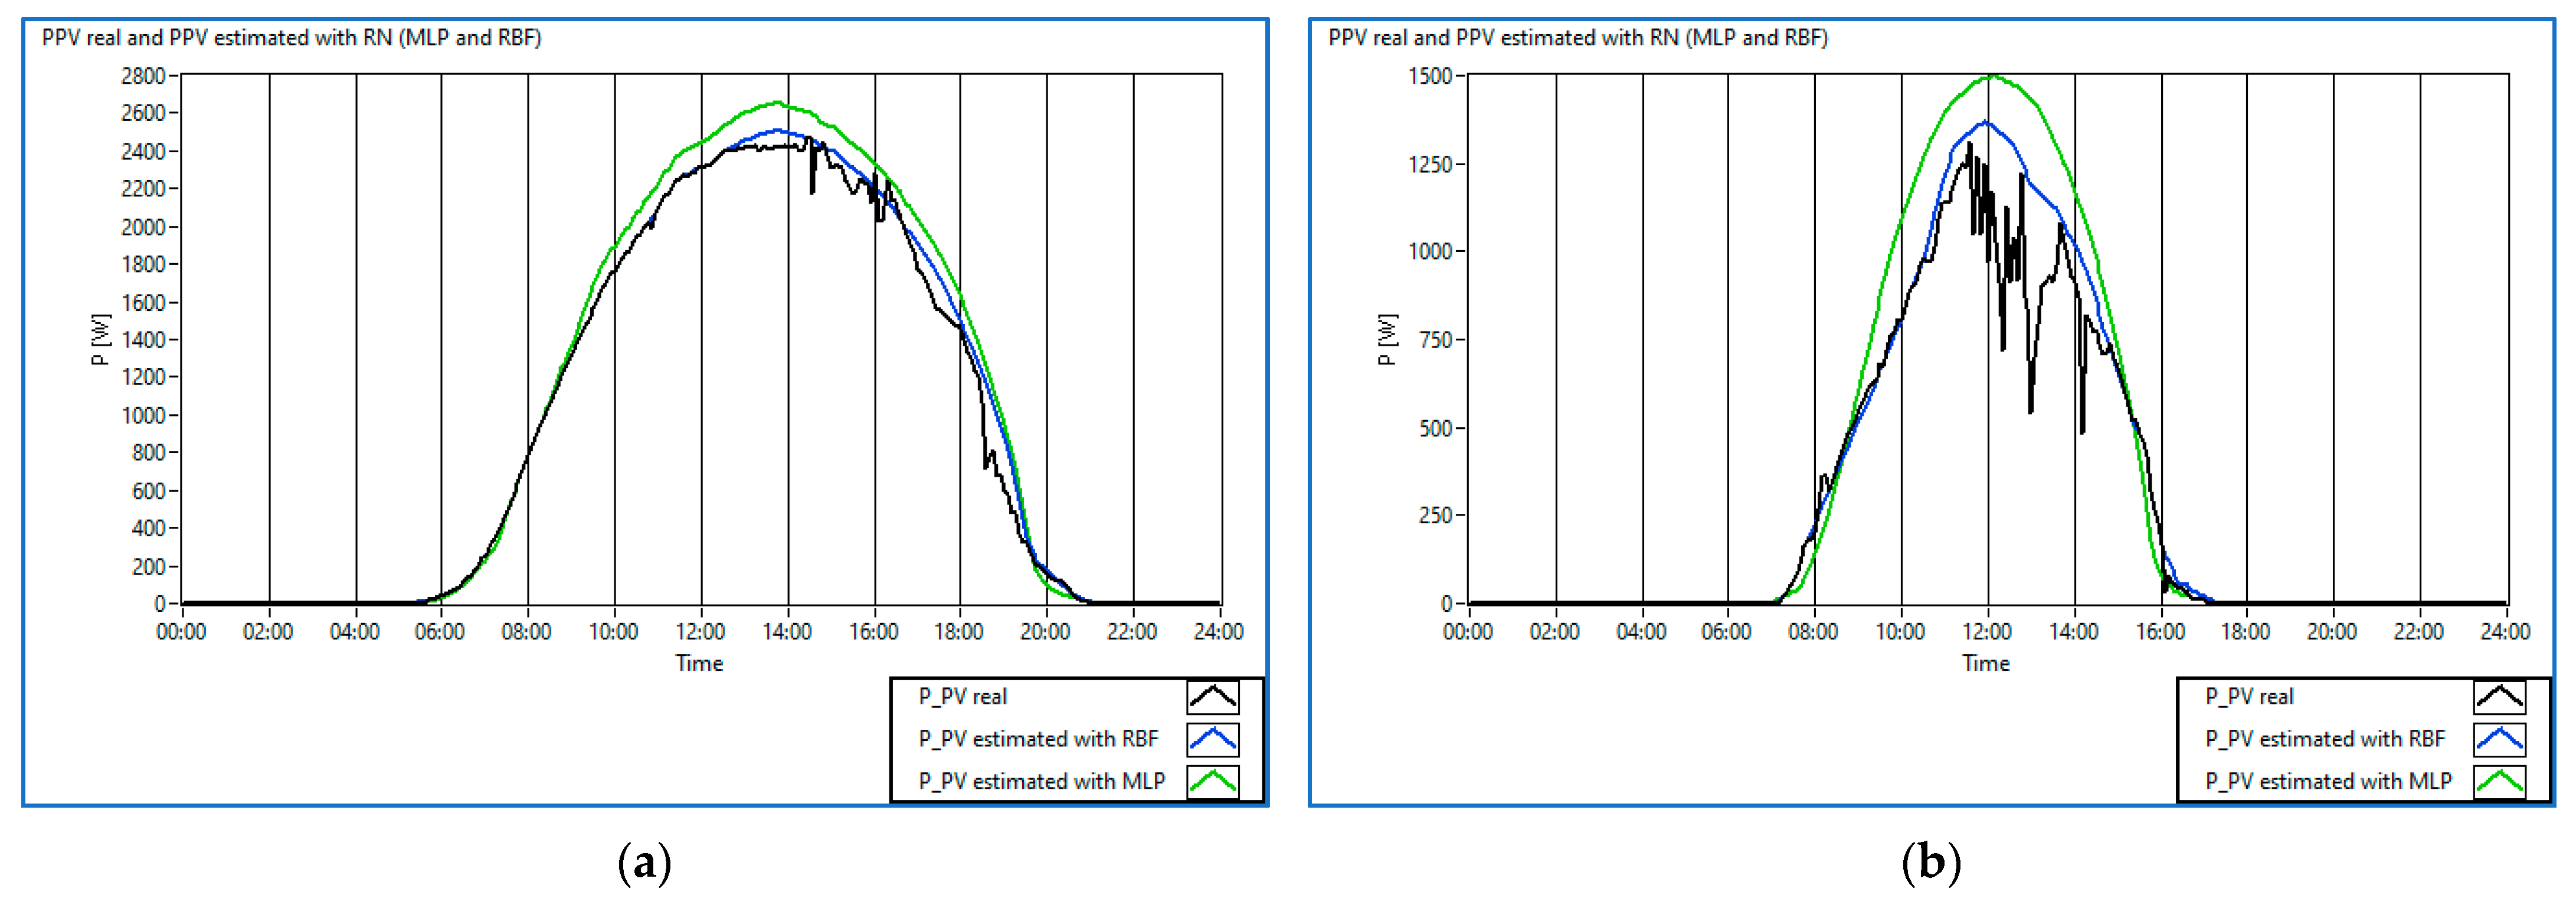
2.1. Photovoltaic Power Generation

In the context of smart homes and new trends oriented towards sustainable development, the use of renewable energy sources (RES) proves to be very promising.
In our approach, firstly this problem of prediction was regarded as time-series forecasting, for which different approaches are considered in the literature [30].
We applied the model proposed by Han [31], to estimate the power generated by the photovoltaic (PV) panels, which is presented in Equations (1)–(5), and which is a function of the solar radiation incident on the modules and the ambient temperature. This method obtains the parameters through meteorological measurements and the panel manufacturer’s manual.
Thus, the power generated from RES (denoted by PPV) is computed as:
P P V = N · F F · V · I
F F = V m p p t I m p p t · V O C I S C
V = V O C K v T c 25
I = r I S C + K i T c 25
T c = T a + r N o t 200.8
where PPV represents the amount of energy produced from RES and N represents the number of PV panels; FF is a dimensionless-form factor; V is the voltage in the PV module; I is the current in a PV cell; Tc represents the PV-panel temperature in degrees Celsius; Ta is the average environment temperature in the period; r is the solar radiation in kW/m2; Not is the nominal operating-cell temperature; Isc is the cell short-circuit current; Ki is a current/temperature coefficient; Voc is the open-circuit voltage of the module; Kv is the thermal-stress coefficient in V/°C; Vmppt is the voltage at the point of maximum power; Imppt represents the current at the point of maximum power.
Additionally, in order to accurately predict the amount of energy produced from renewable sources in the short term, we have designed and tested two neural-network architectures: multilayer perceptron (MLP) and radial-basis function (RBF). MLPs are usually used for performing short-time forecasting, being feedforward neural-network models, able to map sets of input data onto a set of appropriate output. They have multiple hidden layers of neurons, which are fully connected from one layer to the next. On the other hand, the RBF architectures used for performing short-time forecasting have an input layer, one hidden layer and an output layer. The neurons in the hidden layer contain Gaussian transfer-functions, whose outputs are inversely proportional to the distance from the center of the neuron. The characteristics of the proposed NN models are presented in Table 1.

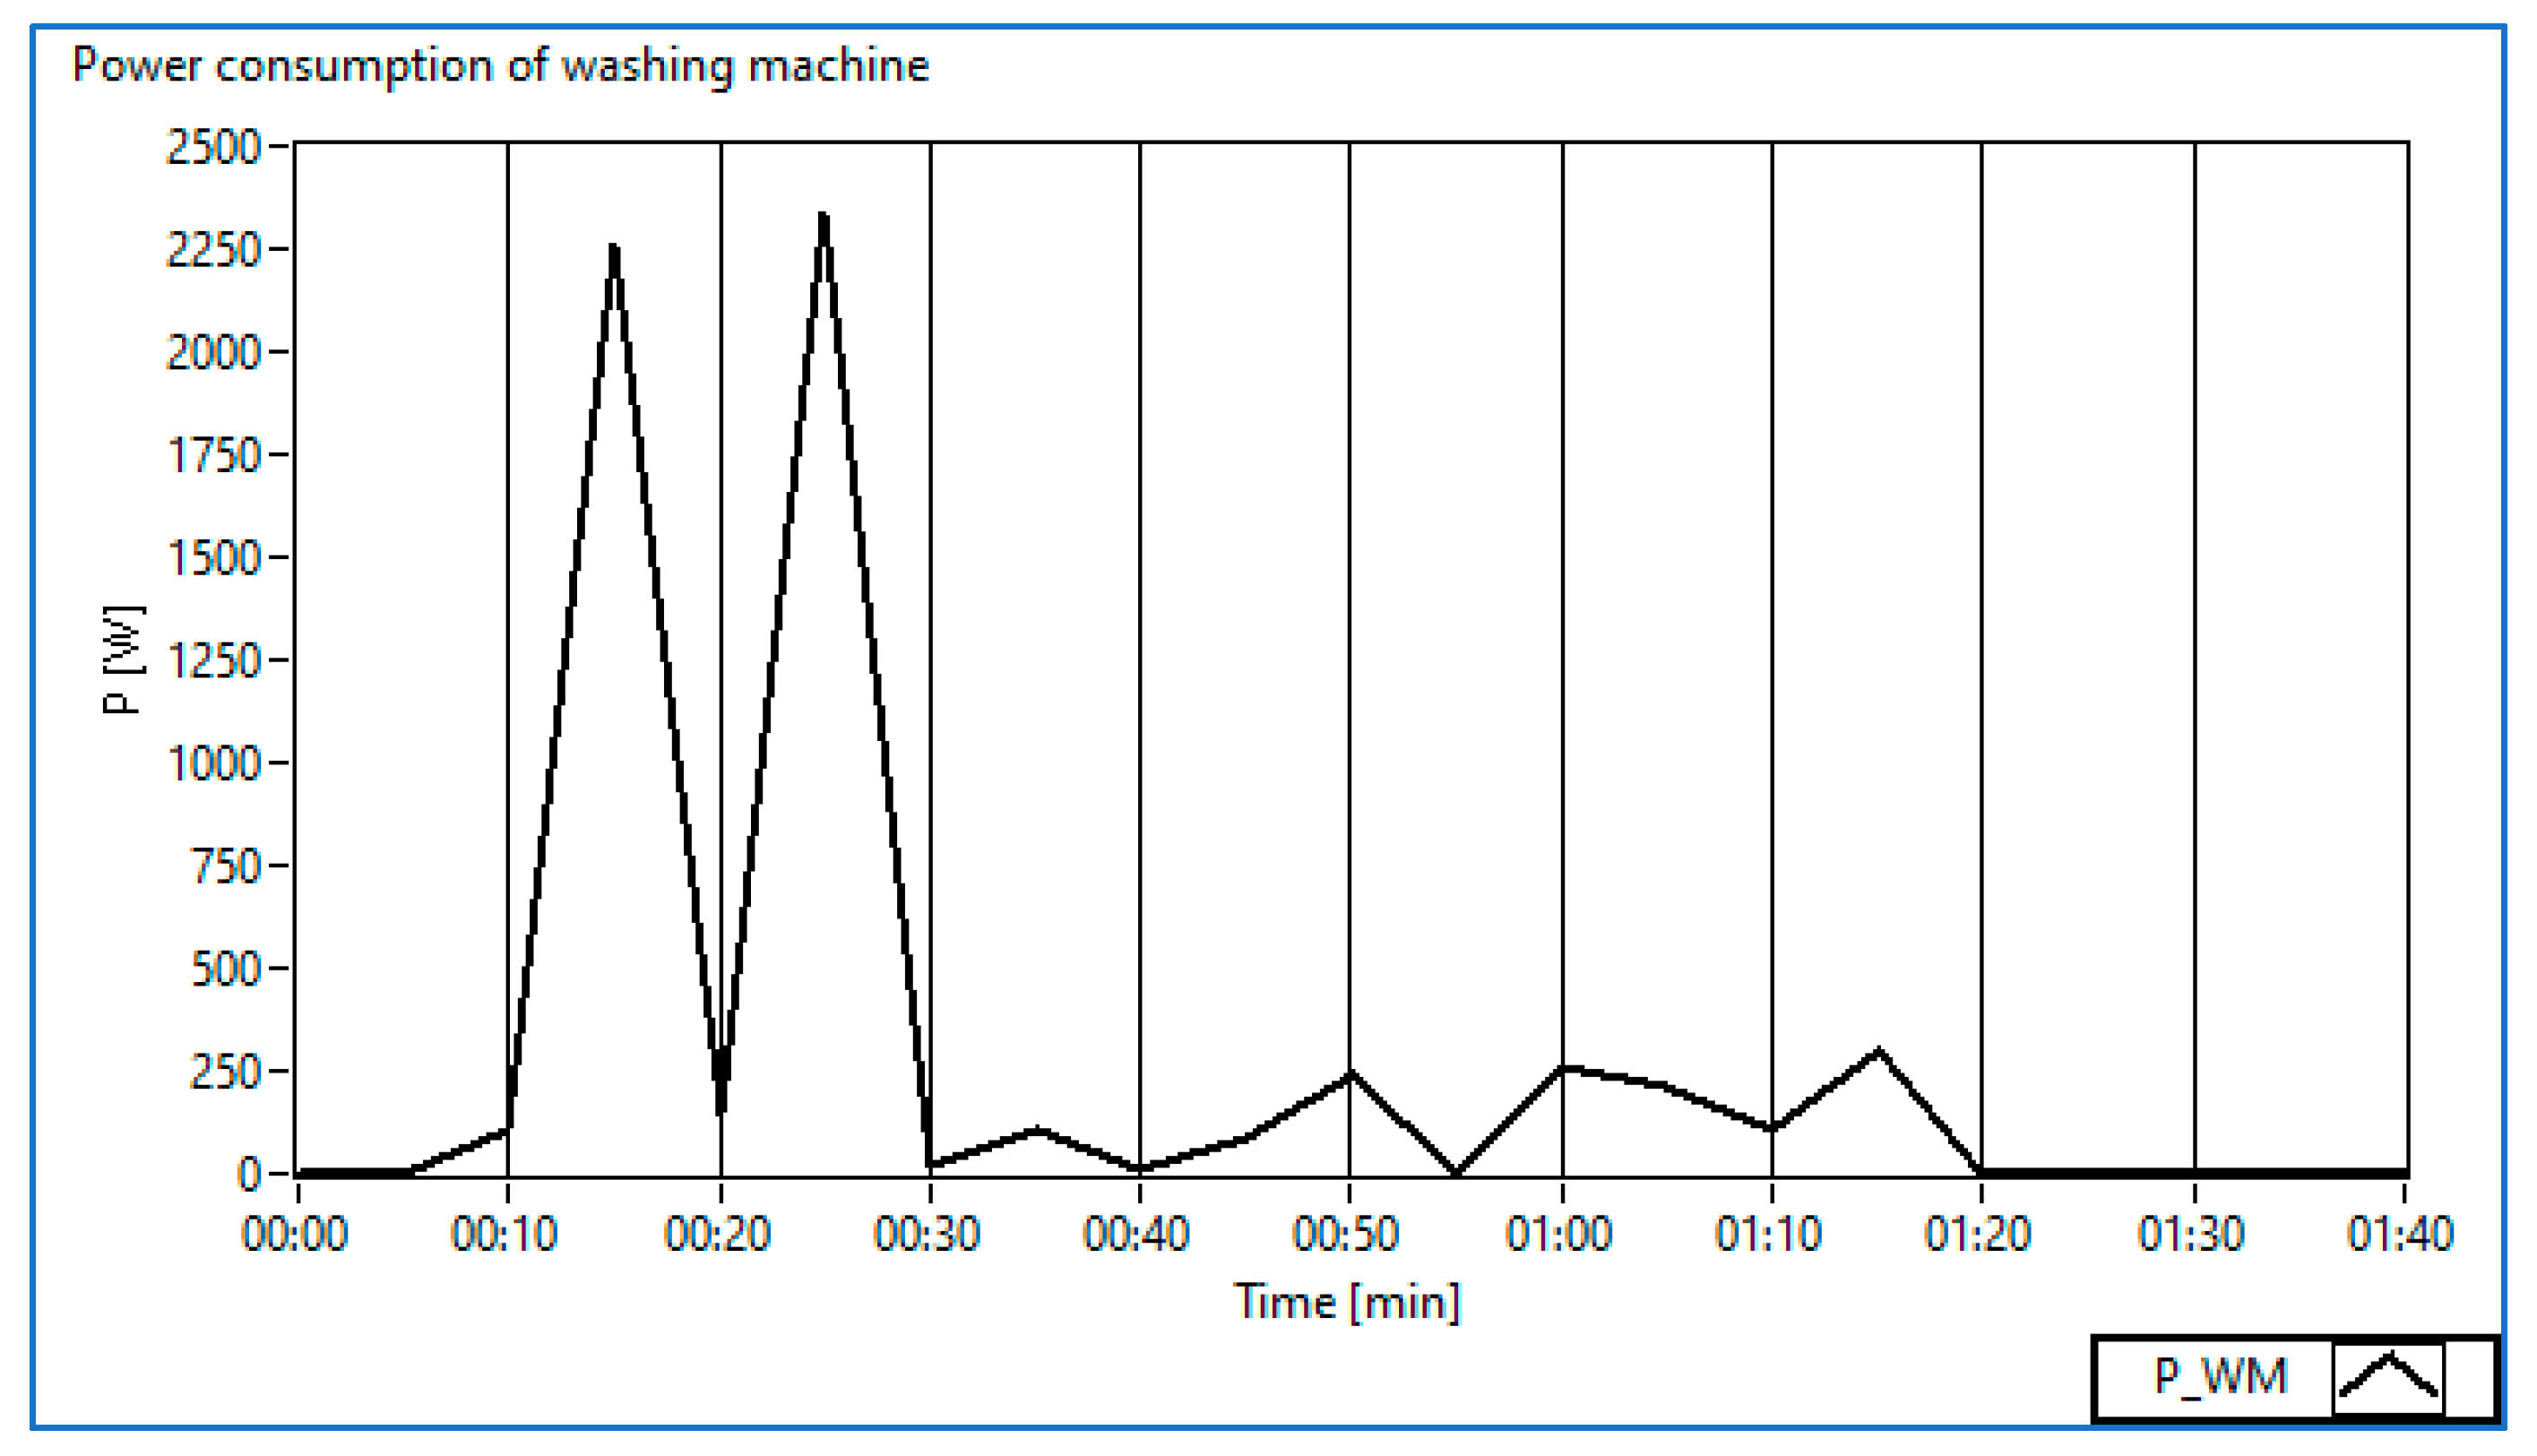
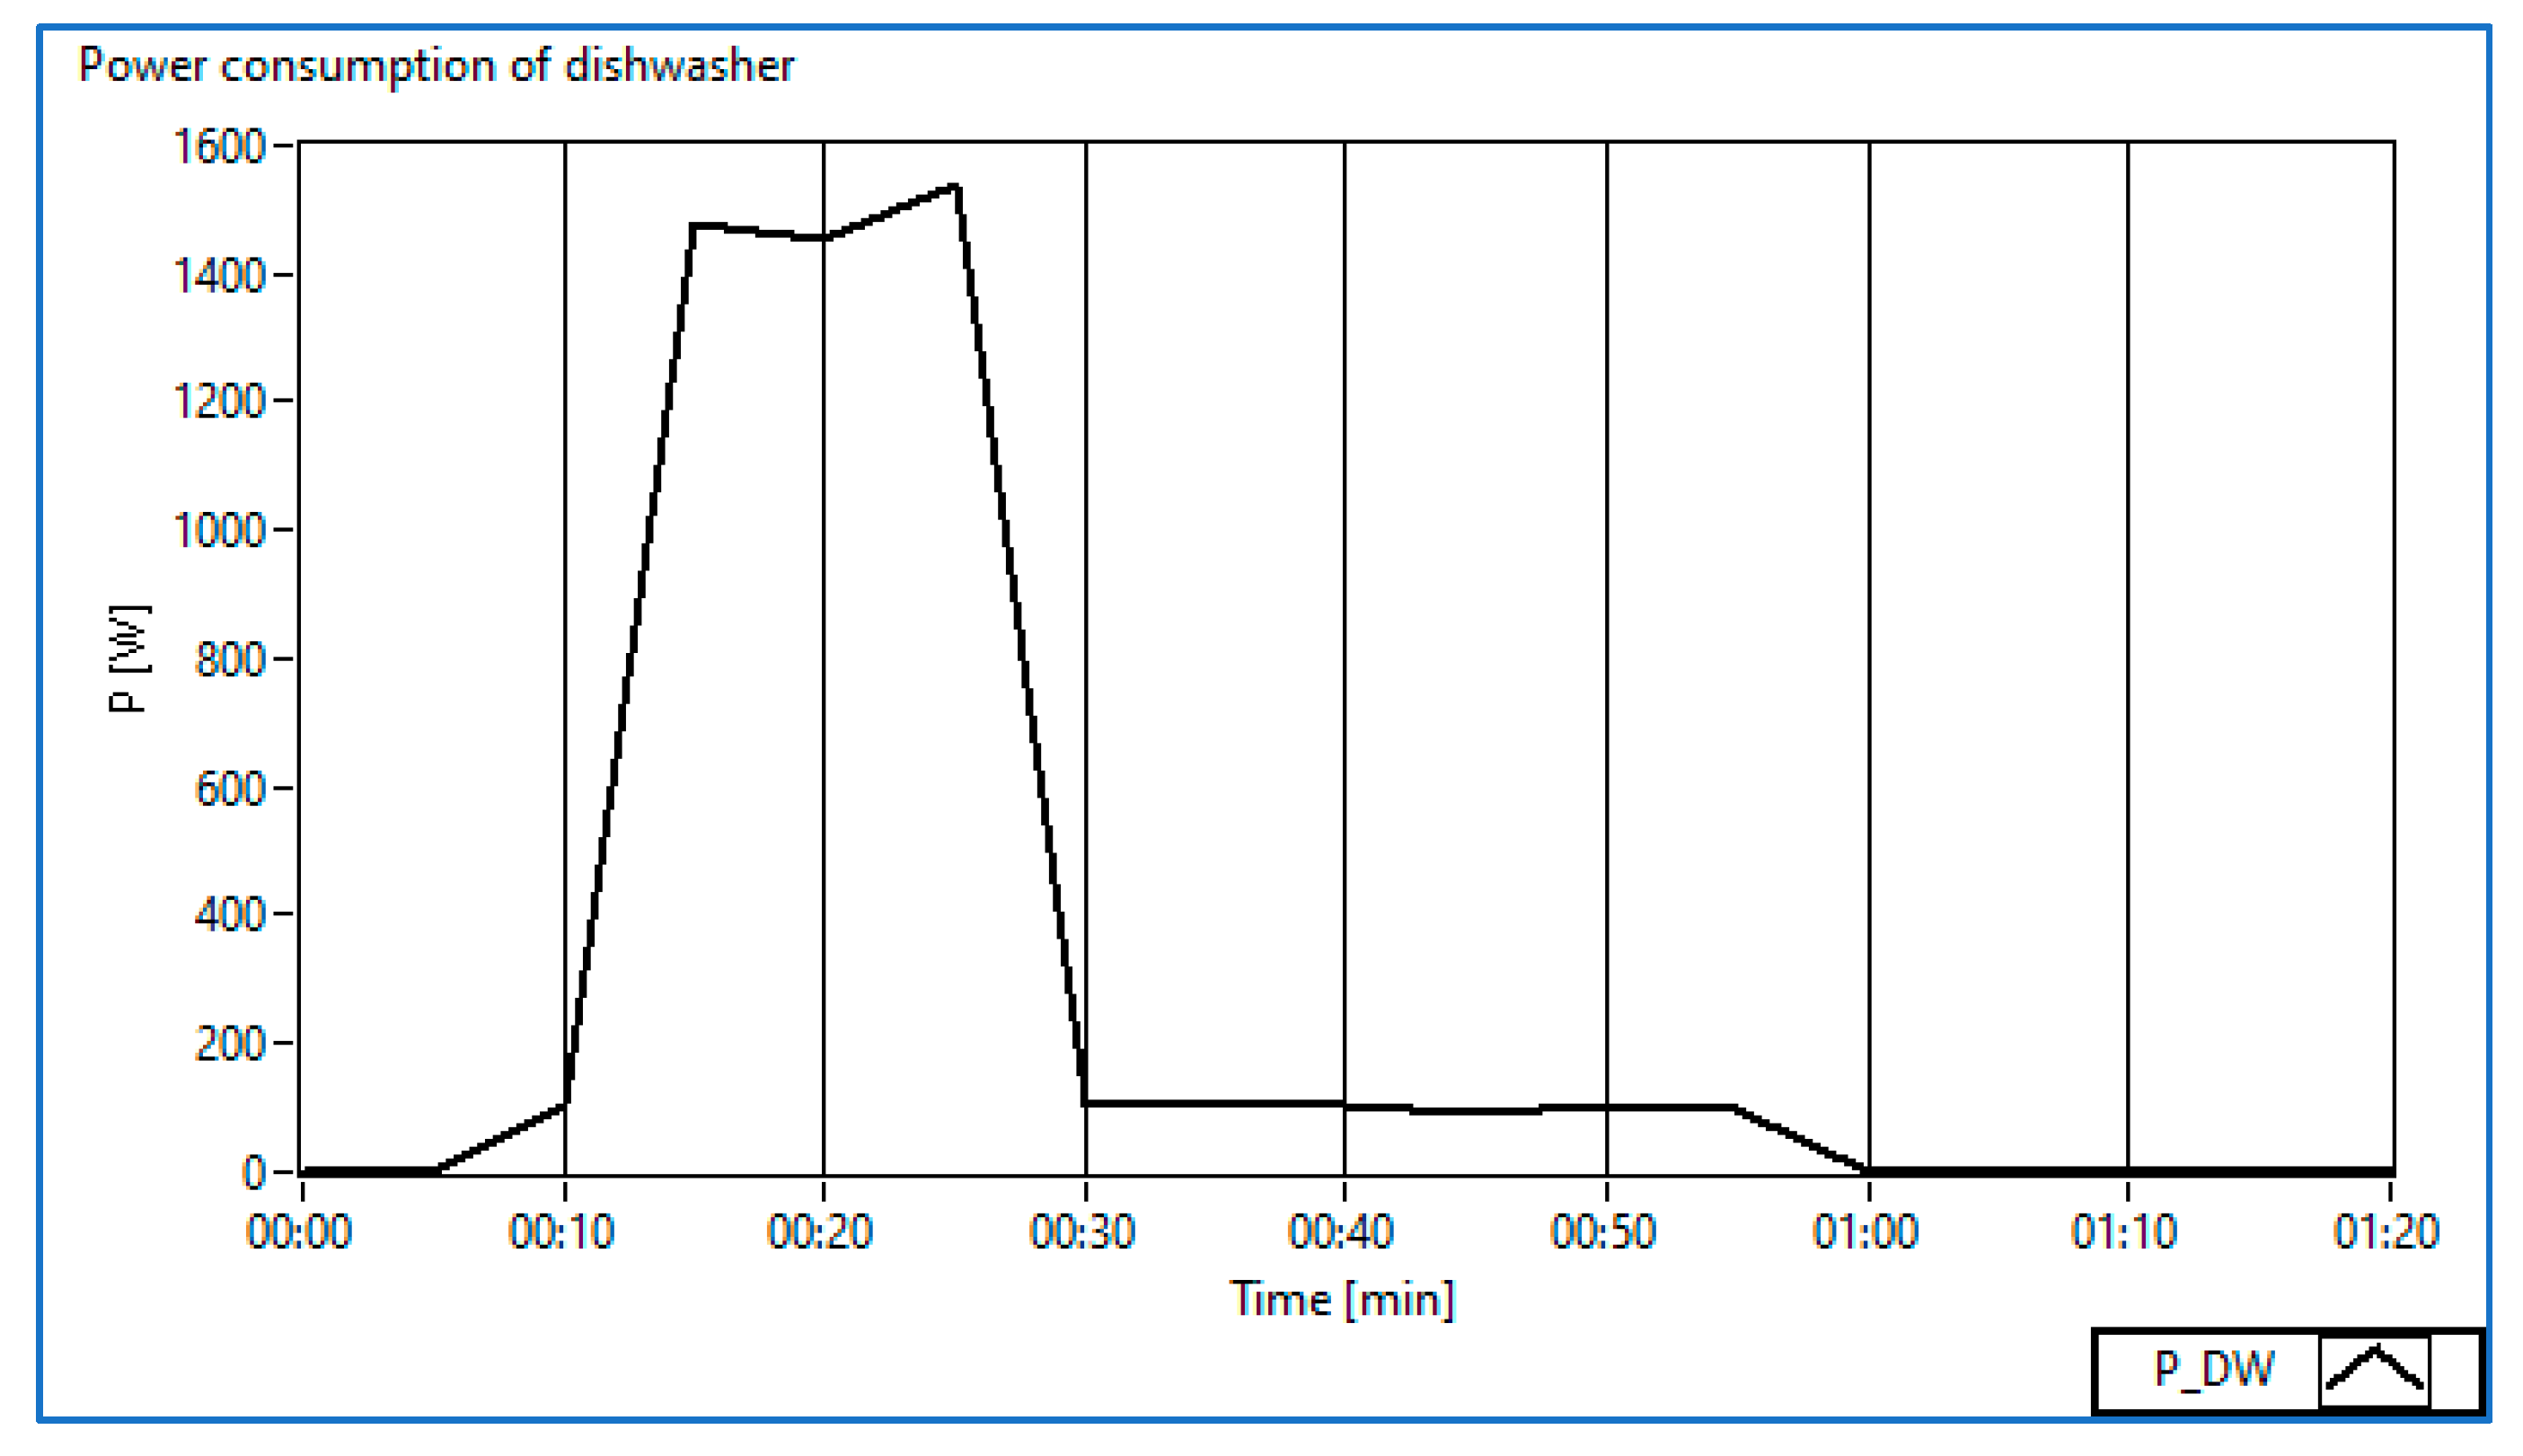
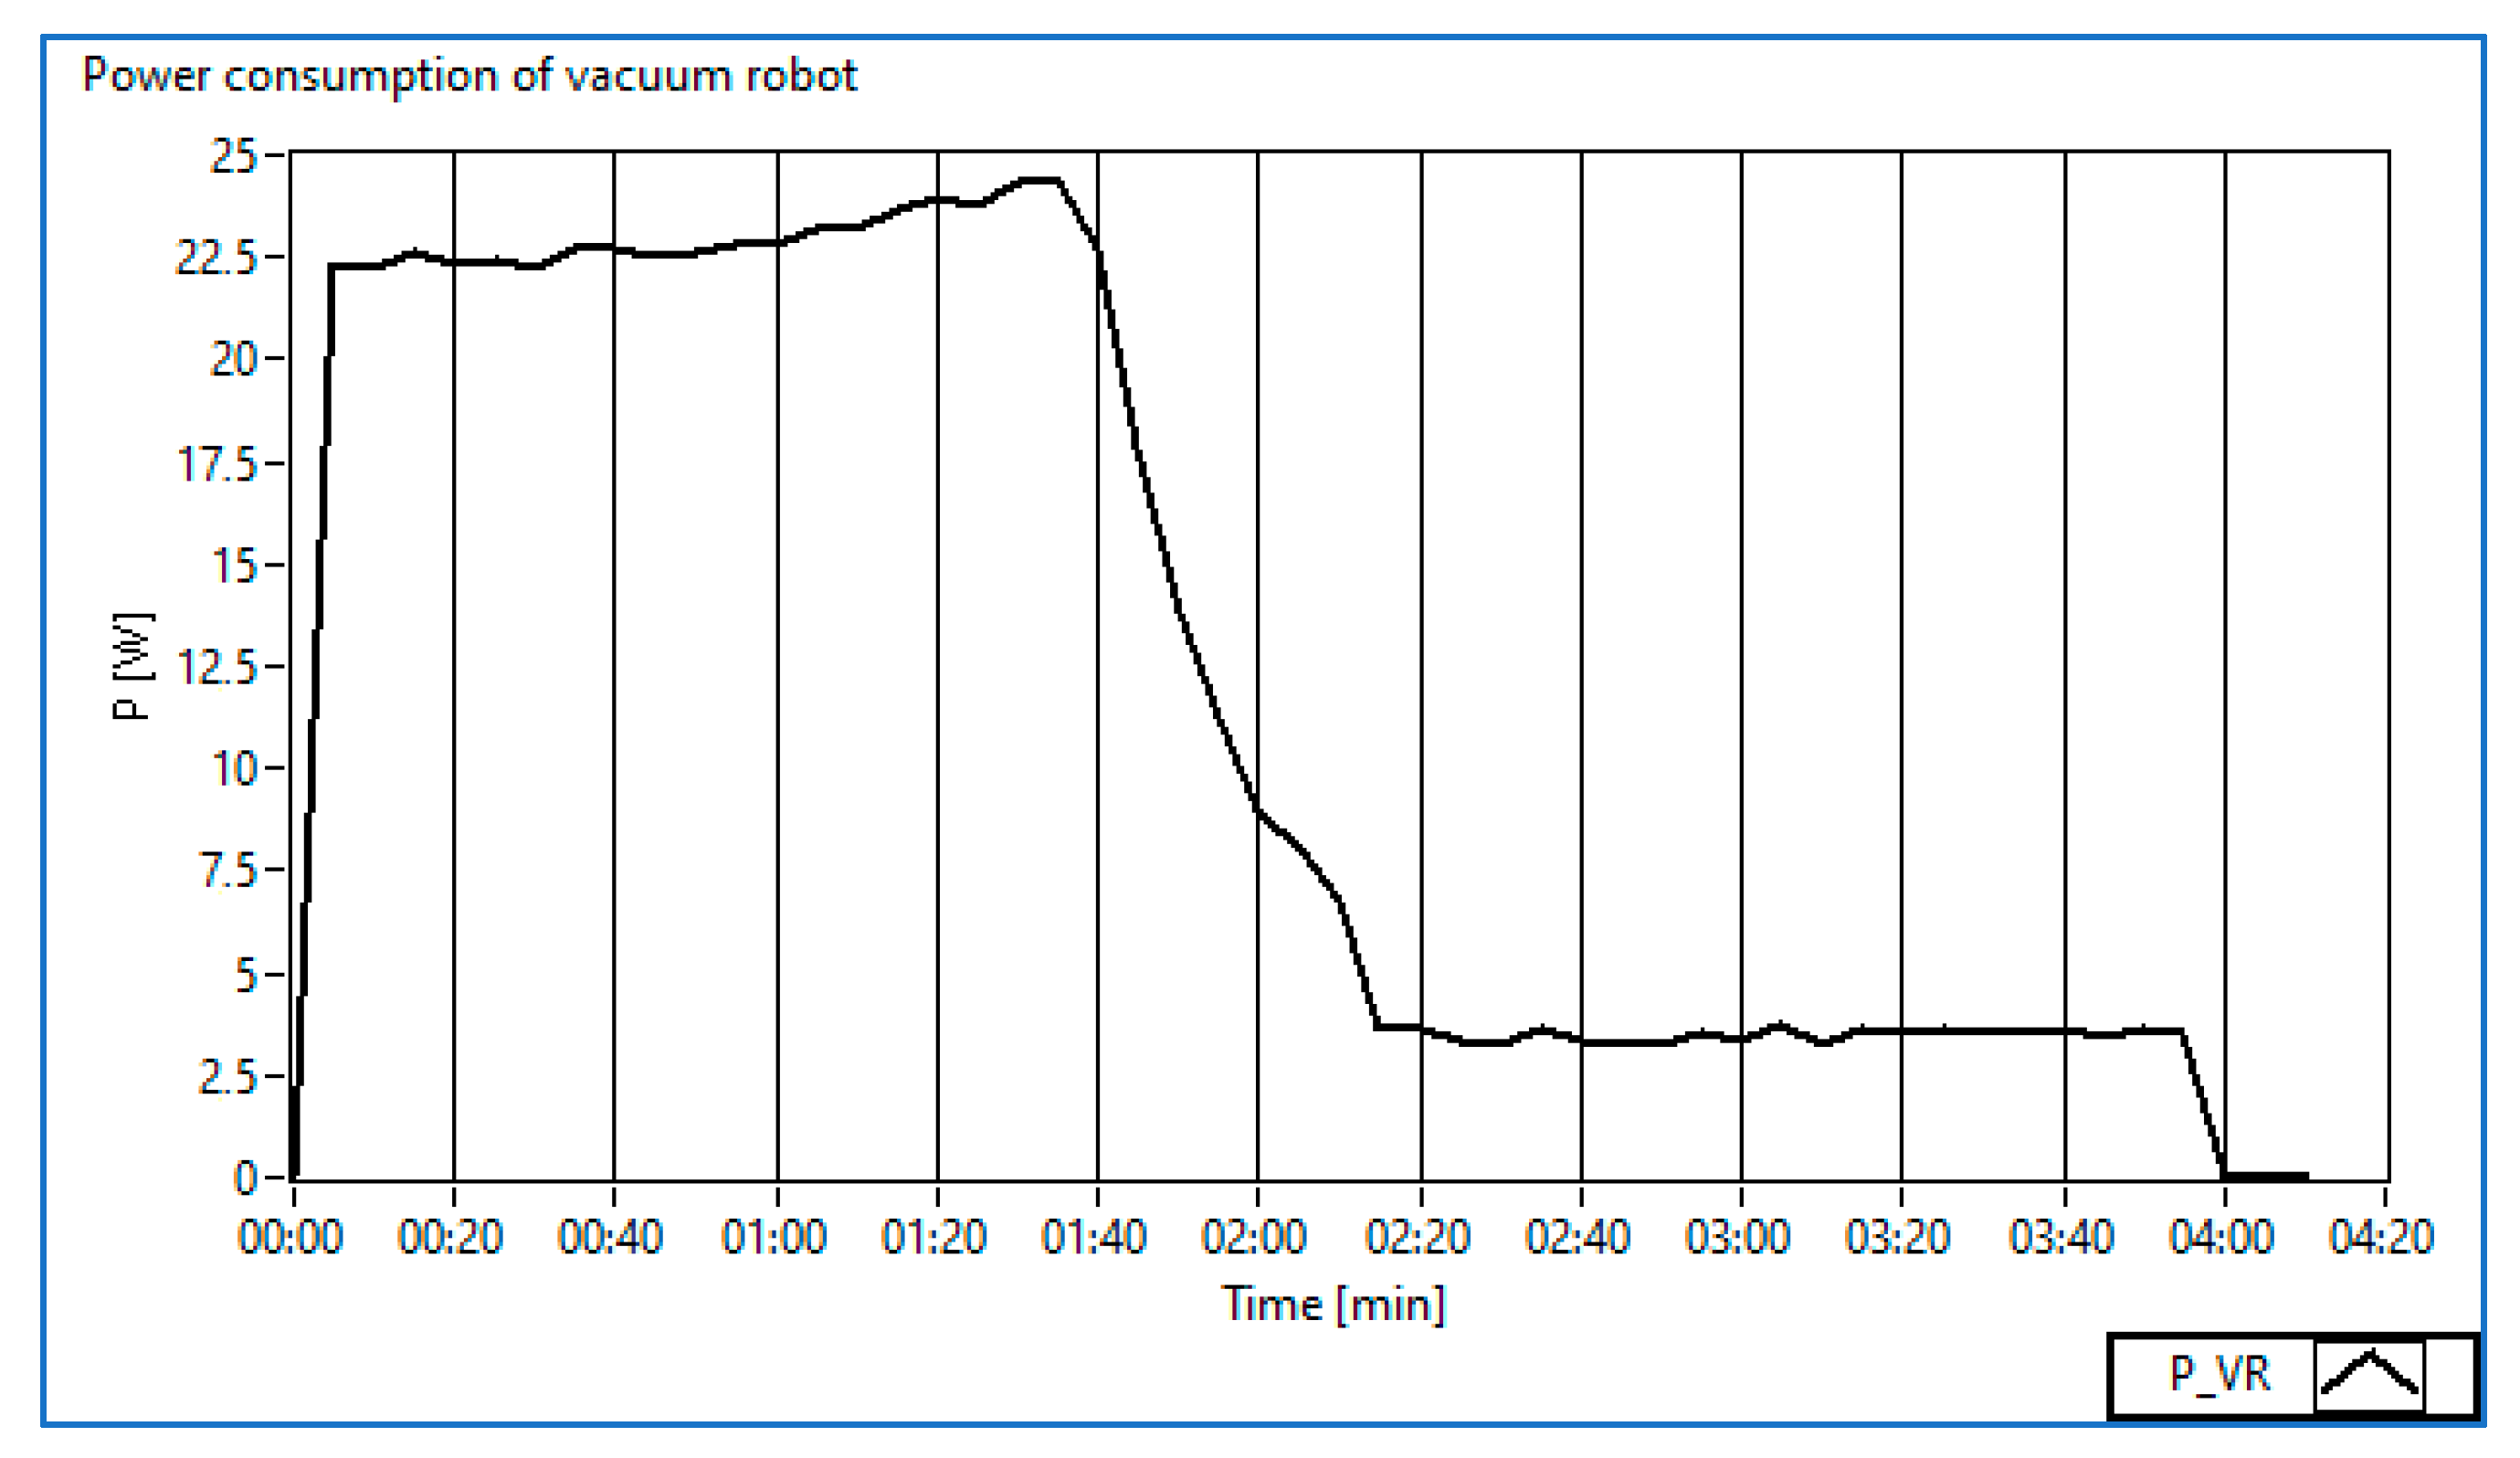
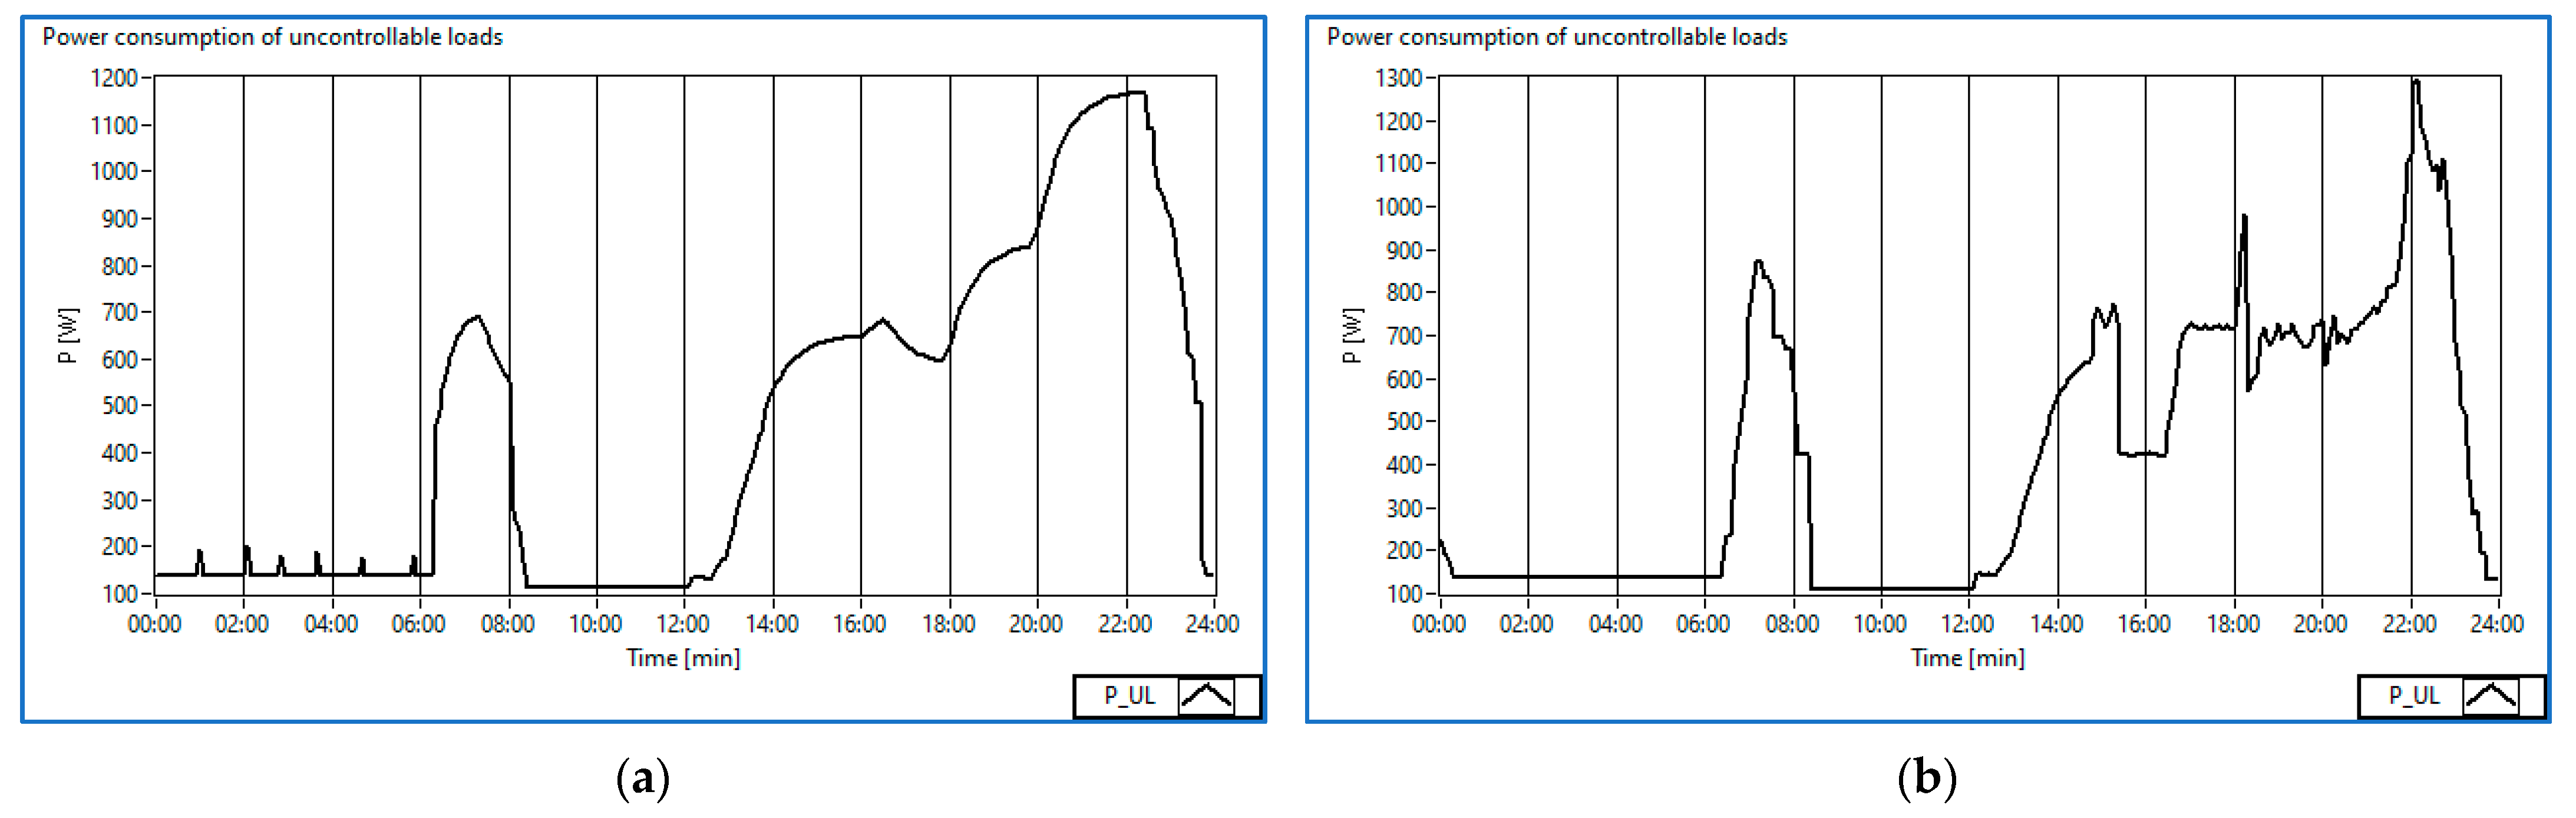
2.2. Home Appliances’ Consumption

In our case, the considered smart home integrates not only a photovoltaic-power contribution and energy exchanges with the national power grid, but also smart loads. These smart loads are household appliances that can be analyzed and modeled, based on the characteristics and usage preferences of prosumers.
In the works [32,33], the smart-home appliances are divided into two categories (see Figure 1): non-schedulable (TCL), e.g., refrigerator, printer, microwave, television andhair-dryer, and schedulable home appliances (ECL), e.g., washing machine, air conditioner, iron, water heater, and electric vehicles. Non-schedulable appliances rely on manual control to complete a task, and are needed only when the users are home. Since the comfort level of users is quite sensitive to the timely services of non-schedulable appliances, their usage would usually not be delayed.
The appliances which can complete a task without any manual control, such as air conditioners and water heaters, are schedulable [34]. These can be further classified into interruptible (controllable) and non-interruptible (fixed) in terms of the continuity of operation time [35]. Generally, interruptible appliances are usually more schedulable than non-interruptible ones. The non-interruptible appliances are constrained by a fixed operation-period called the hold-time [36], and this should be satisfied; namely, the washing-machine operation has to be completed for the task of the dryer to be able to start up.
Koltsaklis, in [24], presents the home appliances with their specific characteristics, including the load-type, and the power consumed (kW). Although it is possible to monitor the electrical consumptions of each appliance in the dwelling, only some appliance categories can be identified as “shiftable loads”. These belong to the category of “periodically used appliances without human interaction” class in the energy-management problem.
The household-energy-management problem includes appliance constraints which are related to how household appliances are modeled, the appliance-model simplicity, and the lack of detailed consumption-profile data for controllable appliances.
The total energy consumed at each time slot, t, by all types of appliances from a smart home can be calculated by Equation (6):
P t o t a l t = P f i x e d t + P c o n t r o l l a b l e t + P T C L s t
where Pfixed is the amount of energy consumed by fixed appliances, Pcontrolable is the amount of energy consumed by controllable appliances and PTCLs is the amount of energy consumed by non-schedulable appliances.
The demand and supply balance is a major concern for prosumers, and is directly affected by consumer behavior, the amount of energy available, and energy tariffs.

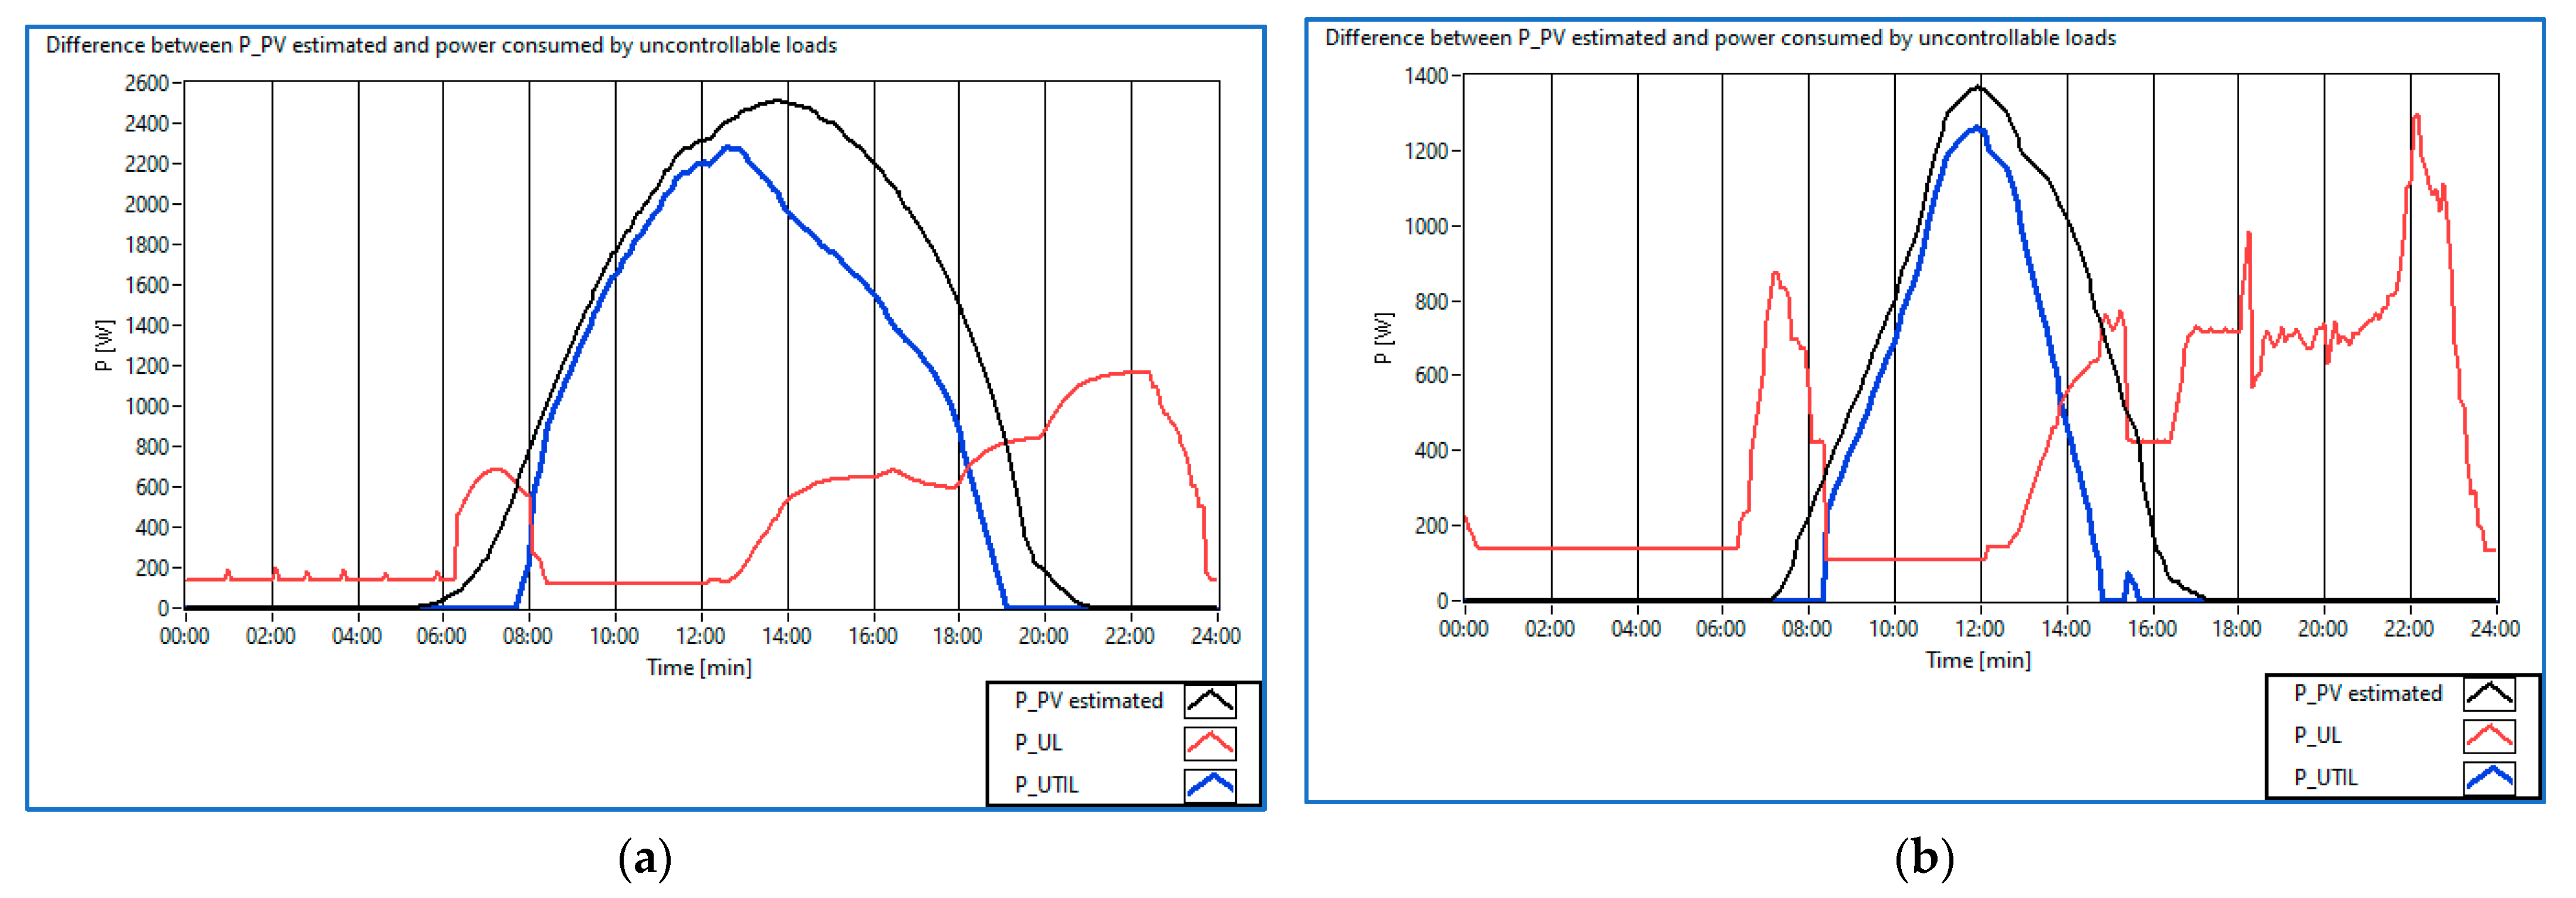
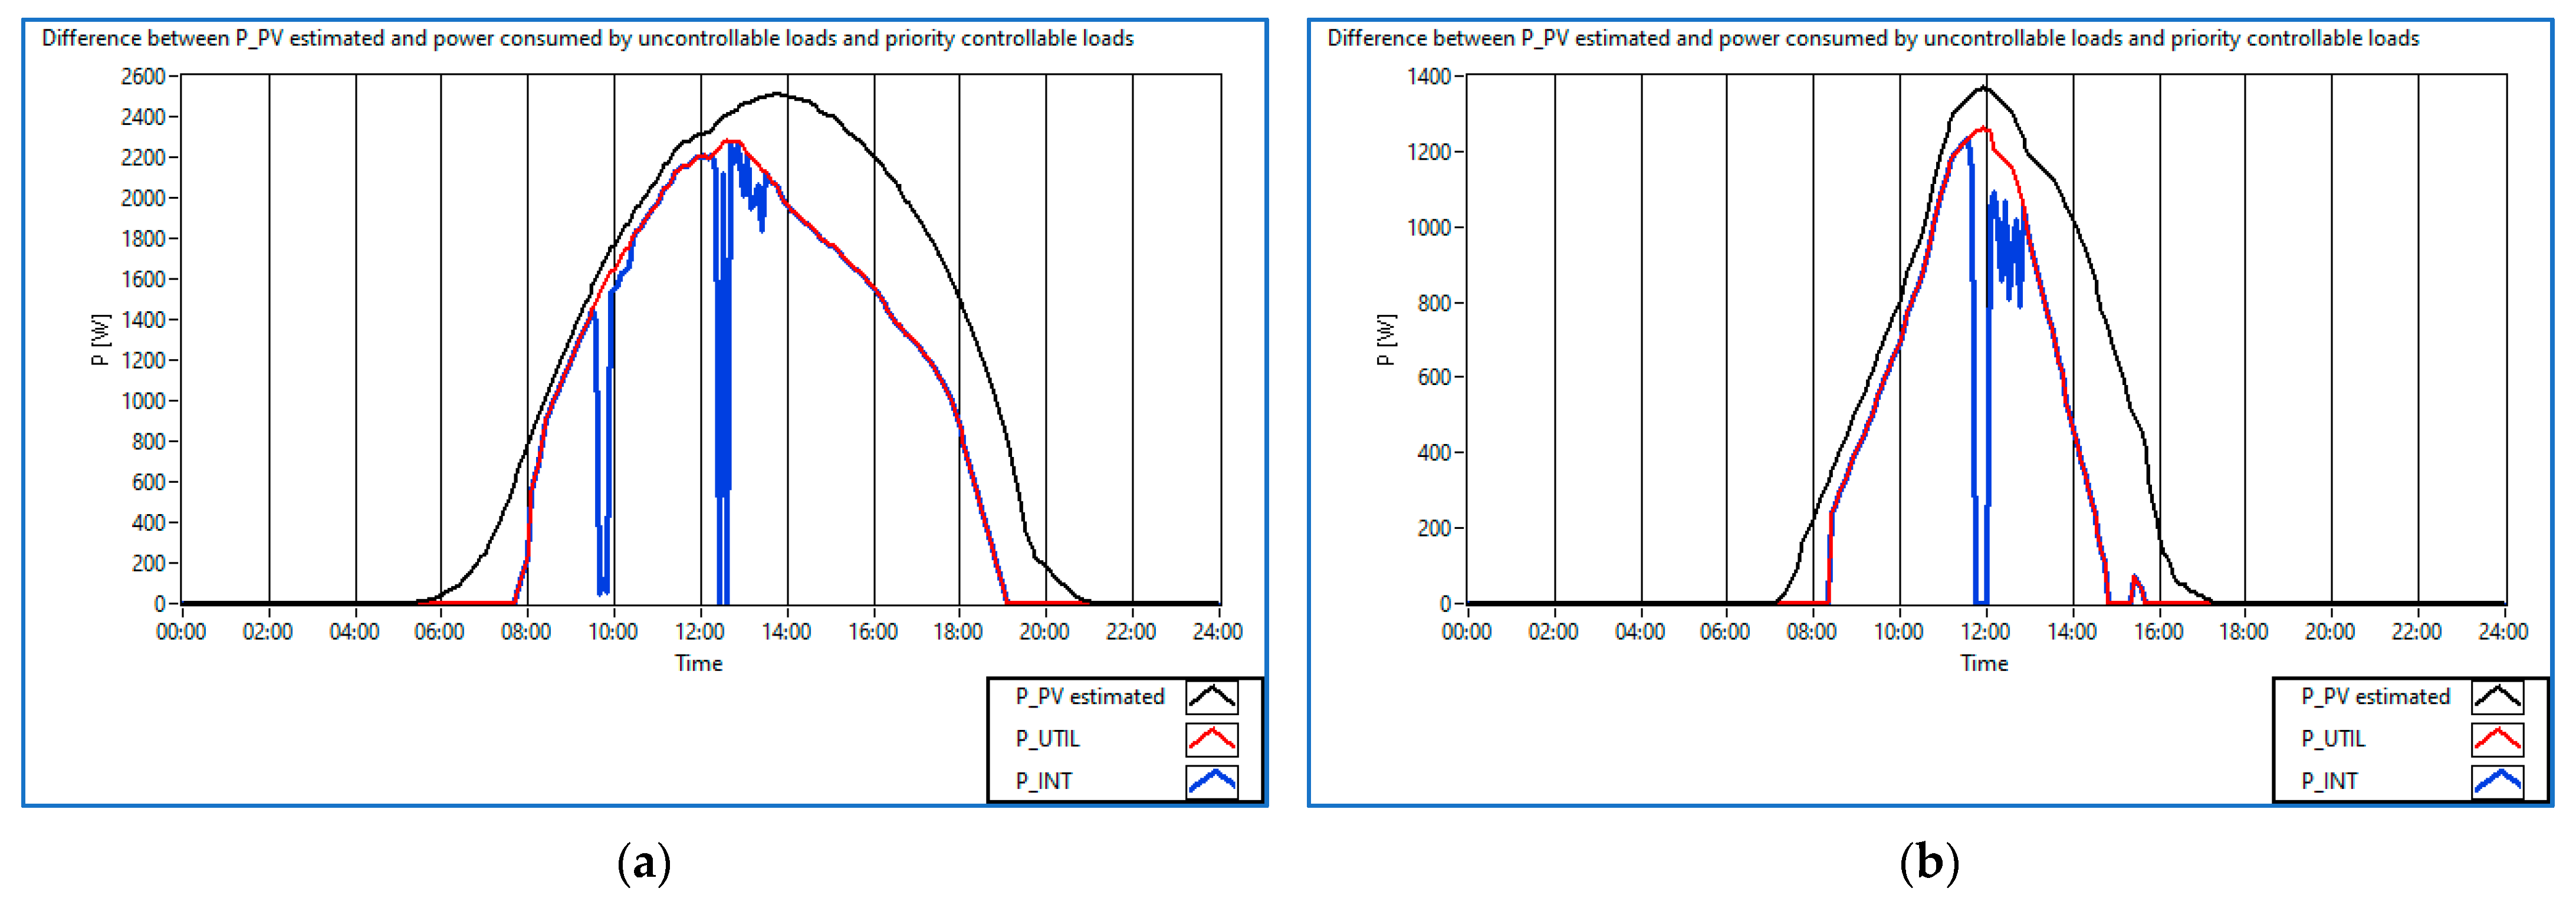
3. Load-Shifting Using Scheduling Techniques

3.1. Scheduling Framework

We will focus in this paper on the first category of deterministic optimization-based methodologies, because our problem formulation can be formalized as a linear optimization-based programming problem.
The class of problems considered in this paper is represented by the scheduling of home-appliance loads to minimize the cost paid by the prosumers for the energy consumed from the national energy grid. This category is a scheduling one, because it involves finding a least-cost schedule to process a set of orders, denoted by I, using a set of dissimilar controlled or uncontrolled home-appliances, denoted by M. The processing of an order, iI, can only begin after the release date, ri, and must be completed at the latest by the due date, di. Order i can be processed on any of the appliances. The processing cost and the processing time of order, iI, on appliance mM are Cim and pim, respectively.
In these terms, the previously stated objectives could be formalized in this way: the main decisions involved in this scheduling problem are the assignment of orders to appliances, the sequence of orders to each appliance, and the start time for all the orders, to minimize the processing cost of all the orders.

3.2. Load-Shifting Algorithm

Since the objective function and constraints in this context are strictly expressed by linear relationships, being binary programming, we have considered mixed-integer linear programming (MILP) [26] as a suitable approach.
In this context, the energy-scheduling problem can be expressed (see Equation (7)) as the minimization of a cost function, given a certain number of electrical tasks, Ntasks, (e.g., the appliance starts) to arrange in NTIME time samples:
min w ,   L ,   C k = 1 N t a s k i = 1 N t i m e w k i L k i C k i
where w k i expresses whether or not a task is running on time, C k i is the energy cost at time i, and L k i is the energy consumed by the task in the time interval, i.
In particular, this minimization problem is subject to the following constrains (Equations (8)–(10)), considering the total power consumed at each time and the absence of interruptions for each task:
  i ¯ k w k i ¯ · L k i ¯ P m a x
  k ¯ w k ¯ i = 1 ,     i :   T s t a r t < i < T e n d
C k ¯ i ¯ = R i   ¯   i f k k ¯ w k i ¯ · L k i ¯ > P P V 0   i f k k ¯ w k i ¯ · L k i ¯ P P V
The shiftable tasks can set w k i to 1, according to a determined policy.
For each shiftable load, k, we consider Equation (11):
J i = P P V ^ i L T O T ^ i
where P P V ^ i is the PV production forecasted at time i, and L T O T ^ i is the average consumption pattern for the considered day of the week. L T O T ^ i is computed by averaging the last 10 days and excluding the power consumed by the shiftable loads.
We then have to find the best timing to start the task minimizing the costs, as Equation (12) shows:
m i n J j L k j i C k j u n d e   j = i , , i + T o p
where L k j is the power consumed by the load at the relative time j, C k j is the energy cost and T o p is the total cycle-time of the load.

4. Determining Optimal Load-Shifting Using Scheduling Techniques

4.1. Test Conditions and Strategy

In this section, the results obtained after the implementation of the load-shifting algorithm in the LabView software are presented.
The energy-consuming appliances considered in the scenarios reported here, selected from those presented in the section dedicated to the home appliances’ consumption, are presented in figures below. The washing machine (Figure 2) and the dishwasher (Figure 3) are considered as being, in our scenarios, priority controllable-consumers, meaning loads whose consumption interval can be established according to the energy produced from RES, but once they are turned on, it is preferable not to turn them off. In addition, they have the ability to be shifted, fully or on a specific operation-cycle (see Table 2 for washing machine), to run at later intervals.
On the other hand, the vacuum cleaner (Figure 4) is an interruptible controllable-consumer, because its consumption interval can be set according to the energy produced, and its operation can be interrupted.
In addition to these controllable consumers, in our case, some uncontrollable consumers chosen for the study, such as room lighting, a hair-dryer and a microwave oven, whose consumption is shown in Figure 5. Two scenarios were considered: scenario 1 for the 31 May 2022 (Figure 5a) and scenario 2 for the 11 November 2022 (Figure 5b).
The considered house has an installed power capacity from photovoltaic-energy sources, of 3.3 kW. The characteristics of the 12 PV panels integrated ino the smart grid, produced by Luxor (ECO LINE P60-275W) are presented in Table 3 The system contains the Huawei SUN2000-3KTL inverter.

4.2. Case Studies and Results

The system was able to meet the energy-load demand from May through August, even with the excess energy which can be stored in the battery system. For this reason, we considered a day in June for scenario 1. From October through April, the PV system was deficient in meeting the energy-load demand. To put in evidence this fact, for scenario 1 we considered a day in June as a reference. More precisely, to build the test scenarios, two representative days for the load and energy produced by RES were considered: the 2 June 2022, and the 12 November 2022.
The data used in the predictions were monitored for solar radiation and ambient temperature. The simulations were run over a 1-day time-horizon, with a time-step of 5 min.
Firstly, considering the mathematical model in Equations (1)–(5), we obtained an estimated profile of the PV power generated by the PV panels in relation to the real PV power monitored. These results are depicted in Figure 6a,b, for both scenarios.
Secondly, similar profiles were predicted with the RN-MLP and RN-RBF architectures proposed in Section 2.1. Figure 7 shows the power-curve forecasted by RN-MLP (green), RN-RBF (blue) and real PV-power (black), for both scenarios.
The performance of the forecasting approaches for different prediction horizons was measured using root-mean-square error (RMSE) and mean absolute percentage error (MAPE) between the predicted values and the real measurements monitored on a grid of PV panels with 3.3 kW installed power. The model with the smallest RMSE and MAPE, for a day-ahead prediction horizon, was the RBF neural network. This profile of the energy generated from RES by RBF-RN was later used in the test scenarios. Table 4 shows the RMSE and MAPE values computed for the RN models and for the regression model (denoted “model”).
The load-shifting MILP algorithm is satisfied by the scheduling approach, firstly by the constraint relating to the uncontrollable-load supply with energy from RES. Thus, Figure 8 presents the PPV estimated by RBF (black), PUL (the power consumed by the uncontrollable loads) (the red line), and PUTIL = PPV − PUL (the difference between the estimated PPV and the power consumed by the uncontrollable-loads) (the blue line), for both scenarios.
The second step of the shifting algorithm simulation consists in supplying the washing machine and dishwasher, which are controllable loads of first and second priority, respectively.
Figure 9 depicts the scheduling of the amount of energy for both scenarios. PPV (the power estimated by RBF) is represented in black, PUTIL (the difference between the estimated PPV and the power consumed by uncontrollable loads) is the red line, and PINT (the difference between the estimated PPV and the power consumed by the uncontrollable-loads and the priority controllable-loads) is the blue line.
In our case: PINT = PPV − PUL − PWM − PDW, where PPV (power estimated with RBF), PINT (between estimated PPV and power consumed by uncontrollable-loads and priority controllable-loads), PFIN = PINT − PP2 (PP2 = sum of all priority controllable-consumers which can be interrupted), PFIN = difference between estimated PPV and power consumed by all loads. In our case: PFIN = PPV − PUL − PWM − PDW − PVR.
The third step of the shifting-algorithm simulation consists in supplying the vacuum-cleaner load, as an interruptible controllable-consumer in which the operation can be interrupted. Figure 10 depicts the amount of energy after the third step of the algorithm for scenario 1 and scenario 2.
In conclusion, the results obtained for the first scenario show that in the first third (the night and the morning period) of the day, more energy is consumed by uncontrollable-loads than produced. In the second third (the afternoon period), more is produced, and in the last third (the evening and the night period), much more is consumed than produced. Figure 11a shows that when we have a surplus of energy consumed compared with the energy generated by the photovoltaic system, then energy will be taken from the national grid (situation 1). When we have a surplus of energy generated by the photovoltaic system, it is preferable to turn on the controllable-loads (situation 2), in both scenarios.
On the other hand, in the case of the second scenario (Figure 11b), due to the weather conditions in November and the significantly reduced amount of energy from renewable sources compared to the case of the first scenario, the periods in which loads must be shifted with the help of the proposed algorithm are more and more difficult to achieve with optimization.

5. Conclusions and Work in Progress

This paper’s goal is represented by the minimization of the amount of energy consumed from the national energy grid by producer-consumers of energy, from renewable sources, in their own smart homes.
Firstly, the general context of smart grids integrating renewable energy sources was defined. Beyond the identification of challenges and opportunities in the field during a bibliographic study, three methods were proposed to estimate the energy produced from renewable sources: two of them were based on MLP and RBF neural networks, and one used linear-regression methods for estimation. The performance of the forecasting approaches was measured using RMSE and MAPE, to find the differences between the predicted values and the real measurements monitored on a grid of PV panels with 3.3 kW installed power. The model with the smallest RMSE and MAPE was the RBF neural network. This profile of the energy generated from RES by RBF-RN was later used in the test scenarios.
The second issue addressed in the article was related to loads from smart homes. They were classified from the point of view of their ability to be controlled, their priority of operation, and the possibility of being interrupted or not while in operation. This preliminary analysis was necessary in view of the objective pursued in the article, of minimizing the amount of energy consumed from the national energy grid by load-shifting using scheduling techniques.
In the third section of the article, the algorithms for load-scheduling in a smart home were reviewed, and the MILP algorithm was selected to be integrated into the particular context of a smart home with an installed power-capacity of 3.3 kW.
In the fourth section of the article, the forecasting methods and the load-shifting algorithm were integrated and tested on a real database. The data were monitored for two days which were representative in terms of the amount of energy from RES produced and consumed, in June and November.
The load-shifting algorithm proved its effectiveness, through the results obtained and which are presented in Section 4.2, mainly in the periods when the amount of energy produced was reduced, due to meteorological conditions.
The limitations of the work reported here are due to the fact that the case study was carried out on a single family-smart-home, whose installed power from renewable energy sources was 3.3 kW, and to the fact that the number of controllable loads selected was limited by this framework.
In addition, the context was established by the national energy strategy, which encourages the installation of photovoltaic panels with an installed capacity of 3.3 kW in family homes, by granting a subsidy for this purpose. Therefore, the major interest is to identify energy-management systems for smart homes that ensure as much as possible a share of the consumption from the homes’ own production.
The proposed framework can be extended with an analysis carried out on a smart home in which there would be, in addition to the production and consumption devices considered in our case study, a storage source of energy produced from renewable sources, such as battery banks. We consider that the influence would be significant, because it would make the prosumers’ participation in the liberalized energy-market more flexible, as it would depend on the energy market price and the amount of available stored energy.
In addition, the work could be improved with a multi-objective optimization approach, by considering an additional criterion, for example, the way in which the degree of consumer comfort is impacted by load-shifting.

Author Contributions

O.E.D. and F.D. conceived the idea of the research, implemented the research, performed the analysis and wrote the paper. All authors have contributed significantly to this work. All authors have read and agreed to the published version of the manuscript.

Funding

This research received no external funding.

Informed Consent Statement

Not applicable.

Data Availability Statement

Not applicable.

Conflicts of Interest

The authors declare no conflict of interest.

References

  1. Bilal, A.-S.; Wongthongtham, P.; Morrison, G.; Coutinho, K.; Al-Okaily, M.; Huneiti, A. Short-term renewable energy consumption and generation forecasting: A case study of Western Australia. Heliyon 2022, 7, e09152. [Google Scholar]
  2. Shahgoshtasbi, D.; Jamshidi, M. Energy efficiency in a smart house with an intelligent neuro-fuzzy lookup table. In Proceedings of the 2011 6th International Conference on System of Systems Engineering, Albuquerque, NM, USA, 27–30 June 2011; pp. 288–292. [Google Scholar]
  3. Severini, M.; Squartini, S.; Piazza, F. Hybrid soft computing algorithmic framework for smart home energy management. Soft Comput. 2013, 17, 1983–2005. [Google Scholar] [CrossRef]
  4. De Angelis, F.; Boaro, M.; Fuselli, D.; Squartini, S.; Piazza, F.; Wei, Q. Optimal home energy management under dynamic electrical and thermal constraints. IEEE Trans. Ind. Inform. 2013, 9, 1518–1527. [Google Scholar] [CrossRef]
  5. Barbato, A.; Capone, A.; Rodolfi, M.; Tagliaferri, D. Forecasting the usage of household appliances through power meter sensors for demand management in the smart grid. In Proceedings of the IEEE International on Conference on Smart Grid Communications, Brussels, Belgium, 17–20 October 2011; pp. 404–409. [Google Scholar]
  6. Voyant, V.; Notton, N.; Kalogirou, S.; Nivet, M.-L.; Paoli, C.; Motte, F.; Fouilloy, A. Machine learning methods for solar radiation forecasting: A review. Renew. Energy 2017, 105, 569–582. [Google Scholar] [CrossRef]
  7. Dragomir, O.; Dragomir, F.; Minca, E. An application-oriented guideline for choosing a prognostic tool. In Proceedings of the AIP Conference Proceedings: 2nd Mediterranean Conference on Intelligent Systems and Automation, Zarzis, Tunisia, 23–25 March 2009; Volume 1107, pp. 257–262. [Google Scholar]
  8. Hernández, L.; Baladrón, C.; Aguiar, J.M.; Calavia, L.; Carro, B.; Sánchez-Esguevillas, A.; Pérez, F.; Lloret, J. Artificial neural network for short-term load forecasting in distribution systems. Energies 2014, 7, 1576–1598. [Google Scholar] [CrossRef] [Green Version]
  9. Dragomir, O.; Dragomir, F.; Minca, E. Forecasting of renewable energy load with radial basis function (RBF) neural networks. In Proceedings of the 8th International Conference on Informatics in Control, Automation and Robotics, Noordwijkerhout, The Netherlands, 28–31 July 2011. [Google Scholar]
  10. Dragomir, O.; Dragomir, F.; Stefan, V.; Minca, E. Adaptive Neuro-Fuzzy Inference Systems as a Strategy for Predicting and Controling the Energy Produced from Renewable Sources. Energies 2015, 8, 13047–13061. [Google Scholar] [CrossRef] [Green Version]
  11. Dragomir, O.E.; Dragomir, F. Decision support system integrating fuzzy logic and expert system for optimization of smart grid functioning. In Proceedings of the International Conference on Control, Decision and Information Technologies (CoDIT 2016), Athene, Greece, 6–8 April 2016. [Google Scholar]
  12. Dragomir, O.E.; Dragomir, F. Monitoring and diagnosis system based on fuzzy- multi agent tools. In Proceedings of the 16th SGEM GeoConference on Energy and Clean Technologies, Book Series: International Multidisciplinary Scientific GeoConference-SGEM, Albena, Bulgaria, 30 June–6 July 2016; pp. 503–509. [Google Scholar]
  13. Hippert, H.S.; Pedreira, C.E.; Souza, R.C. Neural networks for short-term load forecasting: A review and evaluation. IEEE Trans. Power Syst. 2001, 16, 44–55. [Google Scholar] [CrossRef]
  14. Pham, A.-D.; Ngo, N.-T.; Truong, T.; Huynh, N.; Truong, N.-S. Predicting energy consumption in multiple buildings using machine learning for improving energy efficiency and sustainability. J. Clean. Prod. 2020, 260, 121082. [Google Scholar] [CrossRef]
  15. Quiao, R.; Liu, T. Impact of building greening on building energy consumption: A quantitative computational approach. J. Clean. Prod. 2020, 246, 119020. [Google Scholar] [CrossRef]
  16. Khalila, M.; McGough, S.; Pourmirza, Z.; Pazhoohesh, M.; Walkera, S. Machine Learning, Deep Learning and Statistical Analysis for forecasting building energy consumption—A systematic review. Eng. Appl. Artif. Intell. 2022, 115, 105287. [Google Scholar] [CrossRef]
  17. Kusiak, A.; Wei, X. Prediction of methane production in wastewater treatment facility: A data-mining approach. Ann. Oper. Res. 2014, 216, 71–81. [Google Scholar] [CrossRef]
  18. Abdollahzade, H.; Miranian, M.A. Mid-term energy demand forecasting by hybrid neuro-fuzzy models. Energies 2012, 5, 1–21. [Google Scholar]
  19. Al Khafaf, N.; Jalili, M.; Sokolowski, P. Application of deep learning long short-term memory in energy demand forecasting. Eng. Appl. Neural Netw. 2019, 1000, 31–42. [Google Scholar]
  20. Barzola-Monteses, J.; Espinoza-Andaluz, M.; Mite-León, M.; Flores-Morán, M. Energy Consumption of a Building by using Long Short-Term Memory Network: A Forecasting Study. In Proceedings of the 2020 39th International Conference of the Chilean Computer Science Society, Coquimbo, Chile, 16–20 November 2020. [Google Scholar]
  21. Jetcheva, J.G.; Majidpour, M.; Chen, W.-P. Neural network model ensembles for building-level electricity load forecasts. Energy Build. 2014, 84, 214–223. [Google Scholar] [CrossRef]
  22. Zamora, R.; Srivastava, A.K. Controls for microgrids with storage: Review, challenges, and research needs. RSER 2010, 14, 2009–2018. [Google Scholar] [CrossRef]
  23. Sou, K.C.; Weimer, J.; Sandberg, H.; Johansson, K.H. Scheduling Smart Home Appliances Using Mixed Integer Linear Programming. In Proceedings of the 50th IEEE Conference on Decision and Control and European Control Conference (CDC-ECC), Orlando, FL, USA, 12–15 December 2011. [Google Scholar]
  24. Koltsaklis, N.; Panapakidis, I.P.; Pozo, D.; Christoforidis, G.C. A prosumer model based on smart home energy management and forecasting techniques. Energies 2021, 14, 1724. [Google Scholar] [CrossRef]
  25. Sou, K.C.; Kördel, M.; Wu, J.; Sandberg, H.; Johansson, K.H. Energy and CO2 efficient scheduling of smart home appliances. In Proceedings of the 2013 European Control Conference (ECC), Zurich, Switzerland, 17–19 July 2013; pp. 4051–4058. [Google Scholar] [CrossRef]
  26. Tostado-Veliz, M.; Mouassa, S.; Jurado, F. A MILP framework for electricity tariff-choosing decision process in smart homes considering ‘Happy Hours’ tariffs. Int. J. Electr. Power Energy Syst. 2021, 131, 107139. [Google Scholar] [CrossRef]
  27. Daryanian, B.; Bohn, R.; Tabors, R. Optimal demand-side response to electricity spot prices for storage-type customers. IEEE Trans. Power Syst. 1989, 4, 897–903. [Google Scholar] [CrossRef]
  28. Srilakshmi, E.; Shiv, P.; Singh, P. Energy regulation of EV using MILP for optimal operation of incentive-based prosumer microgrid with uncertainty modelling. Electr. Power Energy Syst. 2022, 134, 107353. [Google Scholar] [CrossRef]
  29. Koltsaklis, N.; Panapakidis, I.P.; Christoforidis, G.C.; Knápek, J. Smart home energy management processes support through machine learning algorithms. Energy Rep. 2022, 8, 2352–4847. [Google Scholar] [CrossRef]
  30. Rocha, H.; Honorato, I.; Fiorotti, R.; Celeste, W.; Silvestre, L.; Silva, J. An Artificial Intelligence based scheduling algorithm for demand-side energy management in Smart Homes. Appl. Energy 2021, 282, 116145. [Google Scholar] [CrossRef]
  31. Han, D.; Lim, J. Design and implementation of smart home energy management systems based on ZigBee. IEEE Trans Consum. Electron 2010, 56, 1417–1425. [Google Scholar] [CrossRef]
  32. Huaa, W.; Chenb, Y.; Qadrdanc, M.; Jiangd, J.; Sune, H.; Wuc, J. Applications of blockchain and artificial intelligence technologies for enabling prosumers in smart grids: A review. Renew. Sustain. Energy Rev. 2022, 161, 112308. [Google Scholar] [CrossRef]
  33. Asare, B.; Kling, W.L.; Ribeiro, P.F. Home energy management systems: Evolution, trends and frameworks. In Proceedings of the Universities Power Engineering Conference, Uxbridge, UK, 4–7 September 2012; pp. 1–5. [Google Scholar]
  34. Ahmad, A.; Khan, A.; Javaid, N.; Hussain, H.M.; Abdul, W.; Almogren Azim, N. An optimized home energy management system with integrated renewable energy and storage resources. Energies 2017, 10, 549. [Google Scholar] [CrossRef] [Green Version]
  35. Ruano, A.; Hernandez, A.; Ureña, J.; Ruano, M.; Garcia, J. NILM techniques for intelligent home energy management and ambient assisted living: A review. Energies 2019, 12, 2203. [Google Scholar] [CrossRef] [Green Version]
  36. Chen, Y.; Xu, P.; Gu, J.; Schmidt, F.; Li, W. Measures to improve energy demand flexibility in buildings for demand response (DR): A review. Energy Build. 2011, 177, 125–139. [Google Scholar] [CrossRef]
Figure 1. Classification of smart-home appliances.
Buildings 13 00134 g001
Figure 2. Power consumption (P_WM) during an operation cycle for washing machine.
Buildings 13 00134 g002
Figure 3. Power consumption (P_DW) during an operation cycle for dishwasher.
Buildings 13 00134 g003
Figure 4. Power consumption (P_VR) during an operation cycle for robot vacuum.
Buildings 13 00134 g004
Figure 5. Power consumption (P_UL) for uncontrollable loads: (a) scenario 1; (b) scenario 2.
Buildings 13 00134 g005
Figure 6. PPV real and PPV estimated with mathematical model for: (a) scenario 1; (b) scenario 2.
Buildings 13 00134 g006
Figure 7. PPV real and PPV estimated using MLP and RBF NN for: (a) scenario 1; (b) scenario 2.
Buildings 13 00134 g007
Figure 8. PPV estimated by RBF, PUL, DPPV1 for: (a) scenario 1; (b) scenario 2.
Buildings 13 00134 g008
Figure 9. PPV estimated by RBF, PUTIL, PINT for (a) scenario 1; (b) scenario 2.
Buildings 13 00134 g009
Figure 10. PPV estimated by RBF, PINT, and PFIN for (a) scenario 1; (b) scenario 2.
Buildings 13 00134 g010
Figure 11. Scheduling for load-shifting optimization for: (a) scenario 1; (b) scenario 2.
Buildings 13 00134 g011
Table 1. Characteristics of NN models.
ArchitectureMLP-RN RBF
Number inputs11
Number layers1 hidden layer with 5 nodes
1 output layer with 1 node
1 hidden layer with 5 radbas neurons
1 output layer with purelin neurons
Transfer functionstansig—hidden layer
purelin—output layer
gaussian—hidden layer
purelin—output layer
Performance functionMSEMSE and MAE
Training mode Supervised
Training method Levenberg-Marquardt
Train epochs1000
Initial MSE goal 0.0098
Initial spread 0.02719
Learning rate (lr)
Tolerance (goal)
0.05
10−3
Table 2. Washing-machine power consumption during the operating cycles.
Operating PhaseMin. Power [W]Max. Power [W]Operation Time [min]
Movement27.2210026
Pre-heating53006.6
Heating206.5220059.7
Maintenance11.020019.9
Cooling10.850010
1st rinse10.370010.4
2nd rinse9.970010.3
3rd rinse23.6117019.8
Table 3. Characteristics of PV panels.
Model of PV PanelNo.Characteristics (Per Module)
PnomCInomVnomISCVOCTrefNS
PV, Luxor, 275 W, Polycrystalline12275 W608.77 A31.42 V9.27 A38.58 V25 °C12
Pnom = nominal output power; C = the number of cells; Inom = nominal current; Vnom = nominal voltage; Isc = short-circuit current; Voc = open-circuit voltage; Tref = reference temperature; NS = the number of solar panels connected in series.
Table 4. RMSE and MAPE.
Prediction
Horizon
RMSEMAPE
MLP-RNRBF-RNModelMLP-RNRBF-RNModel
T+10.41860.53250.57250.07180.05790.0598
T+101.13951.2281.2280.26650.28630.4808
T+2010.5153.27583.27581.07570.9150.915
Disclaimer/Publisher’s Note: The statements, opinions and data contained in all publications are solely those of the individual author(s) and contributor(s) and not of MDPI and/or the editor(s). MDPI and/or the editor(s) disclaim responsibility for any injury to people or property resulting from any ideas, methods, instructions or products referred to in the content.

