Article

Impact of a Weather Predictive Control Strategy for Inert Building Technology on Thermal Comfort and Energy Demand

Chair of Building Technology and Climate Responsive Design, TUM School of Engineering and Design, Technical University of Munich, Arcisstraße 21, 80333 Munich, Germany
*
Author to whom correspondence should be addressed.
Buildings 2023, 13(4), 996; https://doi.org/10.3390/buildings13040996
Submission received: 17 March 2023 / Revised: 31 March 2023 / Accepted: 5 April 2023 / Published: 10 April 2023
(This article belongs to the Special Issue Renewable Energy in Buildings)

Abstract

:
The sun’s total radiation alone exceeds the world population’s entire energy consumption by 7.500 times and ignites secondary renewable energy sources. The end energy consumption buildings use for heating amounts to 28% of Germany’s total energy consumption. With the ongoing trend of digitalization and the transition of the German energy supply away from fossil fuels and the consequent political dependency, electric heat pumps and photovoltaic (PV) systems have become increasingly important to the discussion. This has led to an increasing demand for smart control strategies, especially for inert systems such as thermally activated building systems (TABS). This paper presents and analyses a weather predictive control (WPC) strategy using a validated thermodynamic simulation model. The literature review of this paper outlines that the current common control strategies are data intense and complex in their implementation into the built environment. The simple approach of the WPC uses future ambient temperature and solar radiation to optimize the control of the heating, cooling, ventilation, and sun protection system. The thermal comfort and energy demand evaluate the concept. We show that with a WPC for TABS, thermal comfort can improve without increasing the energy demand for the office building in the moderate climate of Munich. Furthermore, this paper concludes that the WPC works more effectively with more thermal mass. This simplified building control strategy promotes the European roadmap goal of climate neutrality in 2050, as it bridges the phenomenon of the performance gap.

1. Introduction

Significant changes are required to meet the EU’s 2050 climate goals, as the building sector globally accounts for over 40% of energy-related carbon emissions and more than one third of energy consumption throughout the construction and operational phases [1]. The new climate protection law, which came into effect in August 2021, increased the targets for climate protection in Germany. The law aims to attain carbon neutrality by 2045 [2]. By 2030, greenhouse gas emissions from the building sector must be 67% lower than they were in 1990. The building sector should therefore emit no more than 72 million tons of CO2 annually by that time [2]. To accomplish this, buildings must undergo energetic renovations [3], which are subsidized by the Federal Government of Germany [2]. In addition to the need for renovation of the building envelope [4,5] and the exchange of oil and gas heating systems, intelligent predictive control strategies for building technology show great potential in terms of energy savings and comfort enhancement [6]. When paired with weather forecast data, model predictive control (MPC) strategies using state-of-the-art or newly introduced artificial neural networks (ANN) can reduce the energy demand while ensuring thermal comfort [7,8]. Both are promising approaches, but they have drawbacks such as the need for sophisticated control software or even digital twins of the buildings, which limits their applicability to high-tech building technology. Nevertheless, these control strategies are optimized to the building’s location and offer a promising approach to reducing energy use and increasing thermal comfort, particularly when implementation is decentralized [9]. Moreover, buildings can be converted into thermal storage for load management using predictive control strategies, which can then be used to offset fluctuations in the electrical energy grid [7,8,10,11,12]. Focusing on inert buildings and their technology, this paper proposes a trade-off between an optimized, intelligent, yet fairly simple approach for universal applicability.
This paper begins by outlining the goal and demonstrating the core possibilities of the concept while accounting for weather information, thermal inertia, and thermal comfort. The methodology also includes a description of the hypothesis and any associated research questions. A comprehensive literature analysis is used to classify the methodology. The idea of weather prediction control is then thoroughly presented, leading to an explanation of the fundamentals and outcomes of the thermal simulation. In order to prepare for a perspective to expand on the potentials of the concept, the results are examined, the initial hypothesis is addressed, and the related research issues are clarified.

1.1. Objective

Three categories of research potential—weather data, thermal inertia, and thermal comfort—form the basis for this study. The characteristics of each topic are briefly discussed in the following subsections, which also reveal each category’s potential for energy savings.

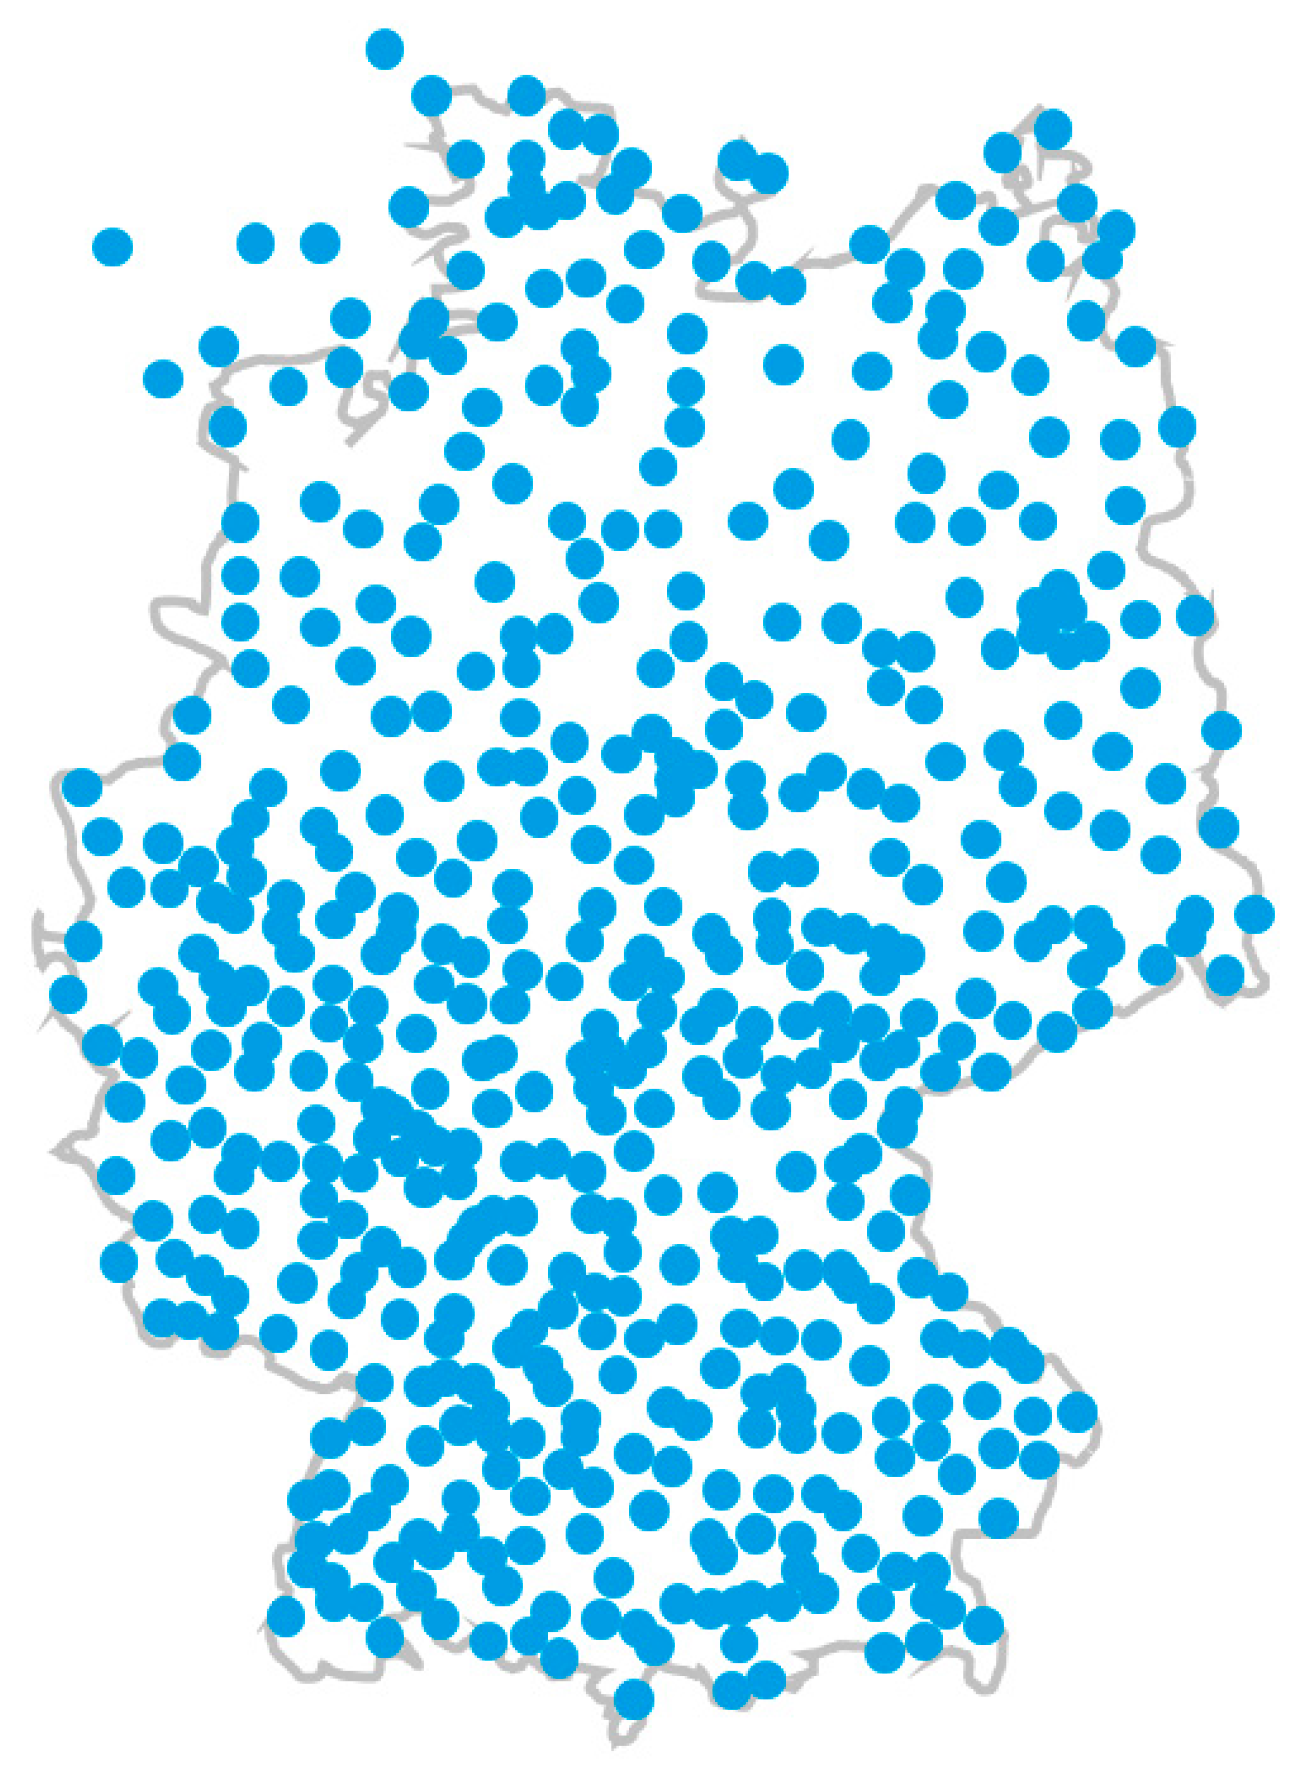
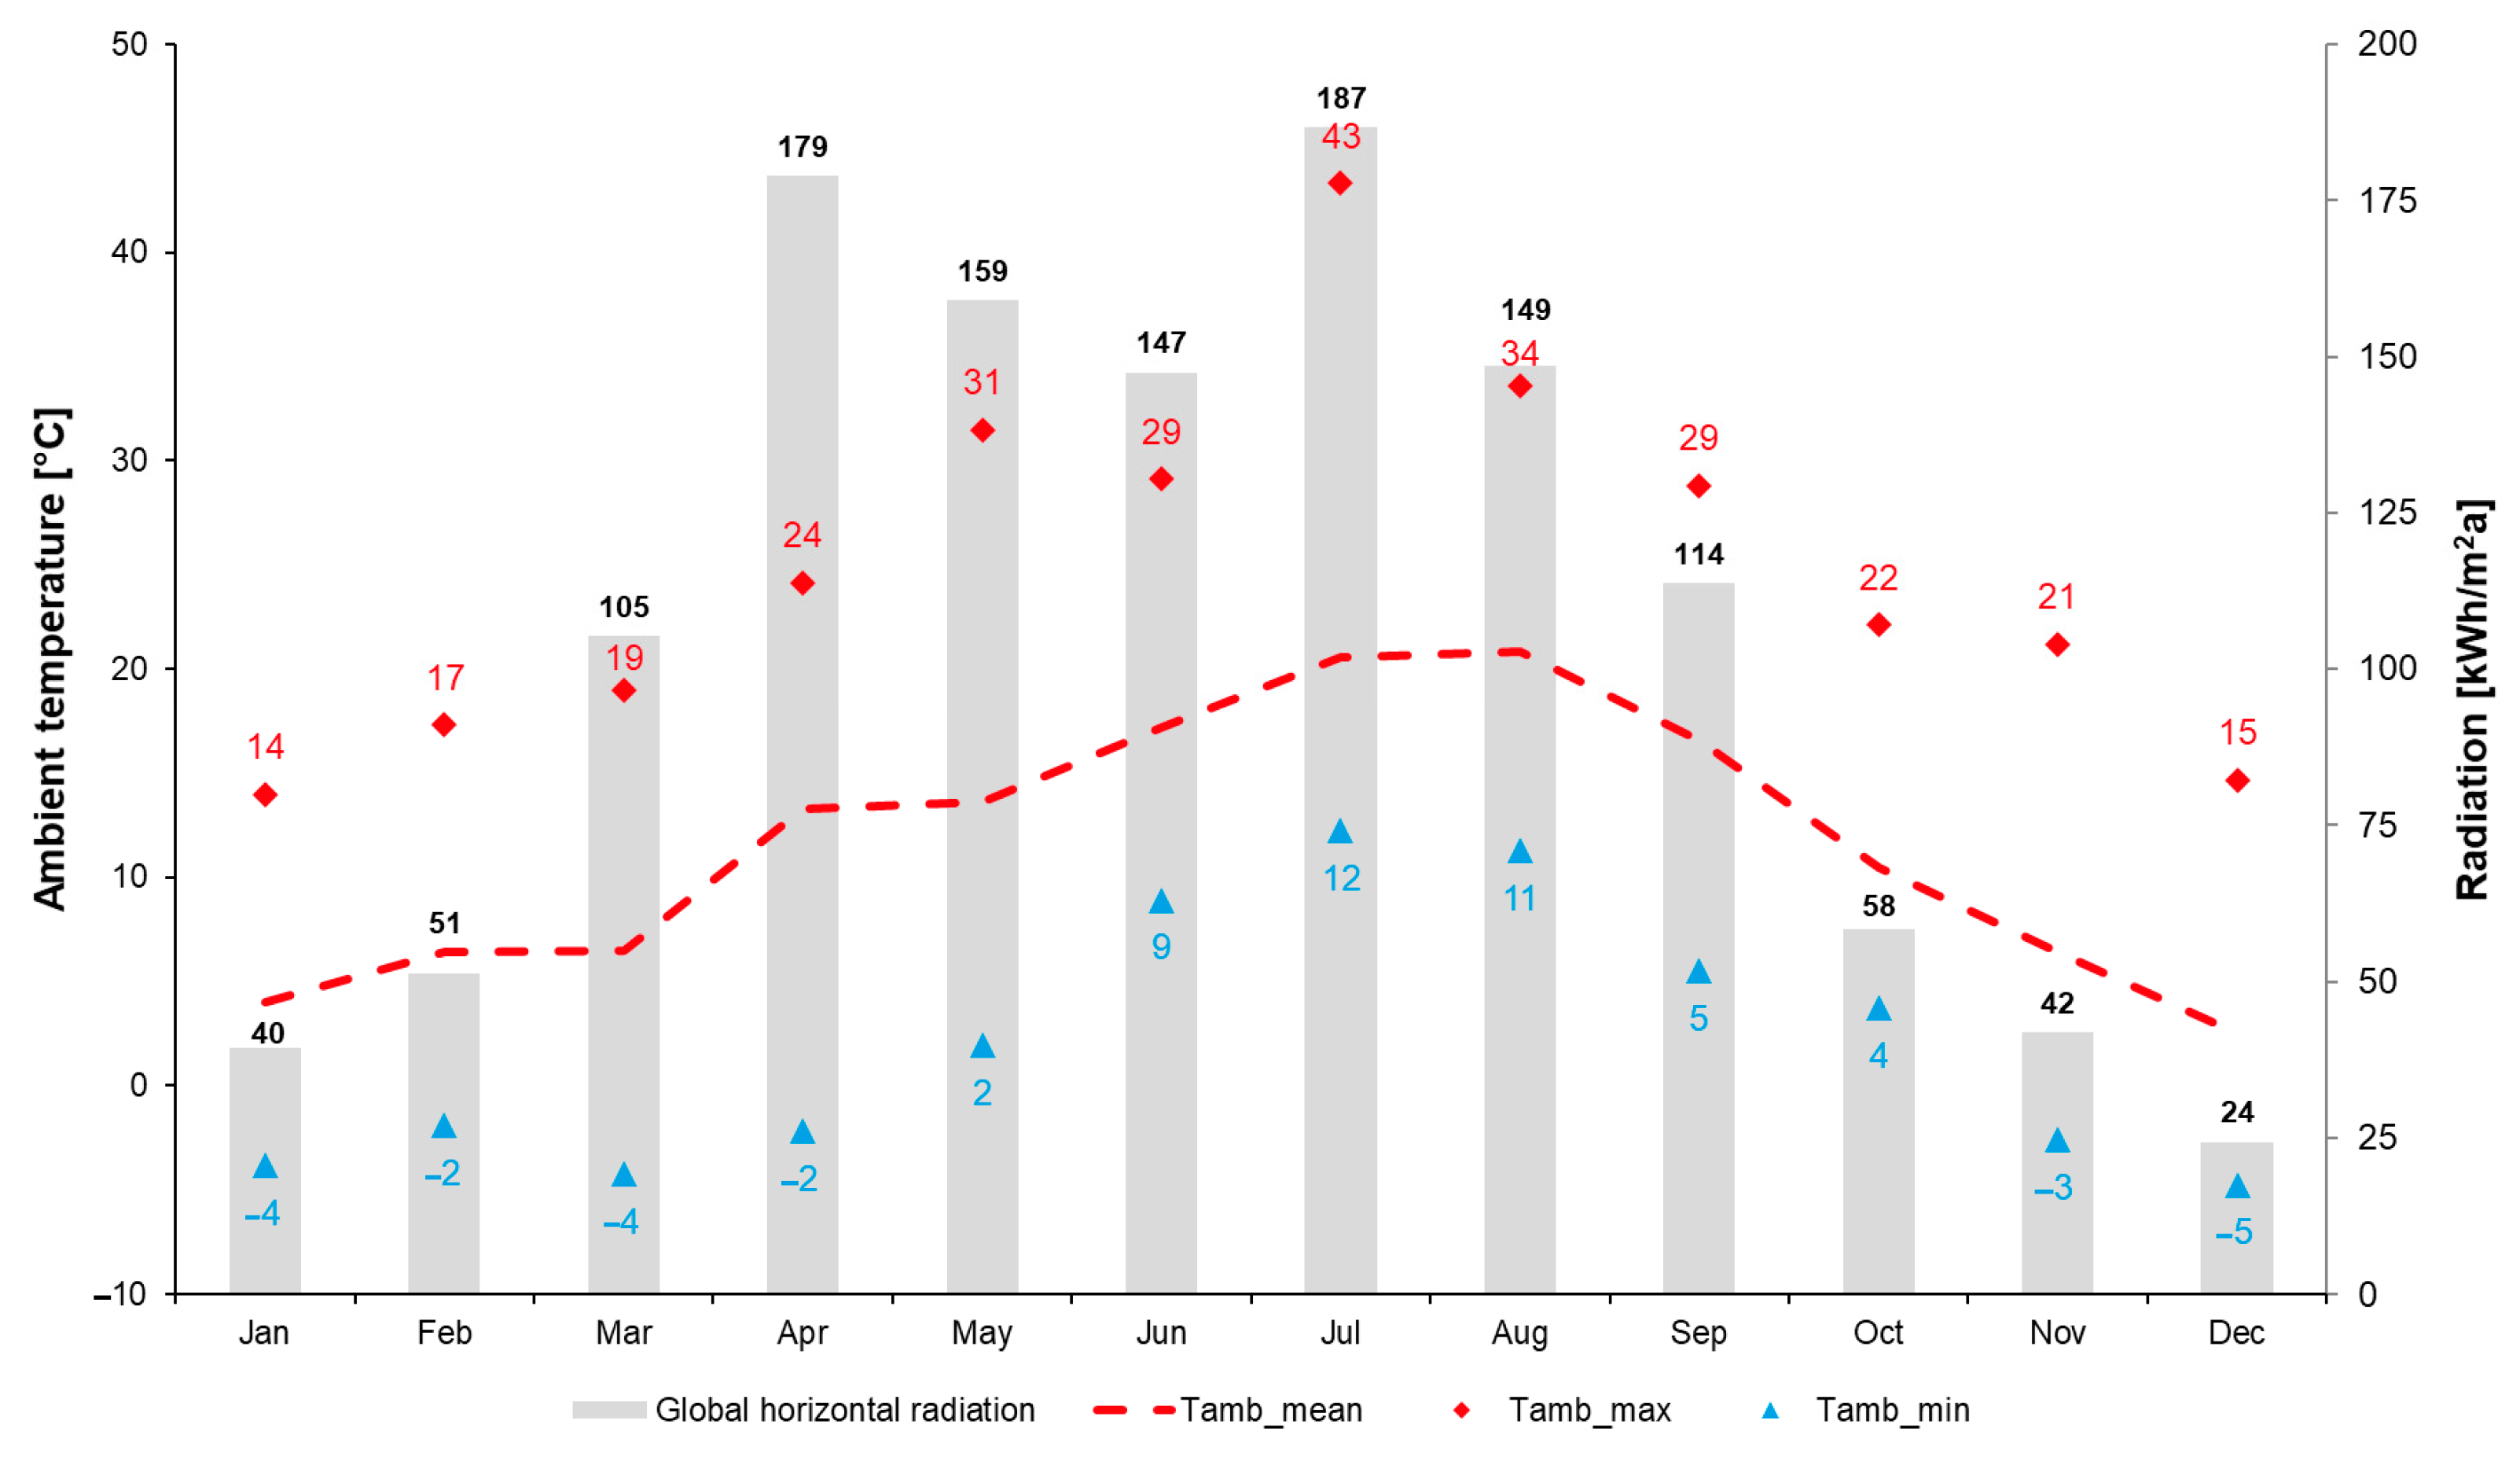
1.1.1. Potential—Weather Data

Along with the increasing occurrence of extreme weather, the world’s temperatures are shifting as a result of ongoing climate change. The primary goal of creating a good architectural concept, according to Hausladen et al., is to adapt the building to the local climate [13]. This procedure of adaptation can be achieved through changes in the thermal envelope, the internal gains or, especially when the building has already been constructed, the implemented building technology. This link to the building technology is necessary to meet the building’s potential energy performance in tandem with the continually changing local weather conditions.
The use of local weather conditions is essential when developing a climate-friendly energy design for a building, not only because of the expanding attention given to these topics due to climate change and the rising cost of energy, but also because of the burgeoning trend of digitization. The gathering of weather data dates back to the early phases of human data generation and is the cornerstone of the complex type of life we have on this planet. With increasingly precise sensors and a very dense global data grid (see Figure 1), it is imperative to use these data sets intelligently to reduce energy use and improve thermal comfort in buildings.
The German Weather Forecasting Agency now uses numerical algorithms to better estimate and interpolate the local weather conditions while taking into account external weather occurrences, which adds to the quality of the already dense grid of weather data [14]. These prediction algorithms give a local weather forecast with a very high probability using various grid sizes and scales. With the aid of these data sets, it is feasible to forecast the local weather for the foreseeable future and to determine the prospective thermal conditions in our structures. This paper assesses if we can reduce energy use and improve thermal comfort by using this data to potentially adapt the buildings’ technology to the location.

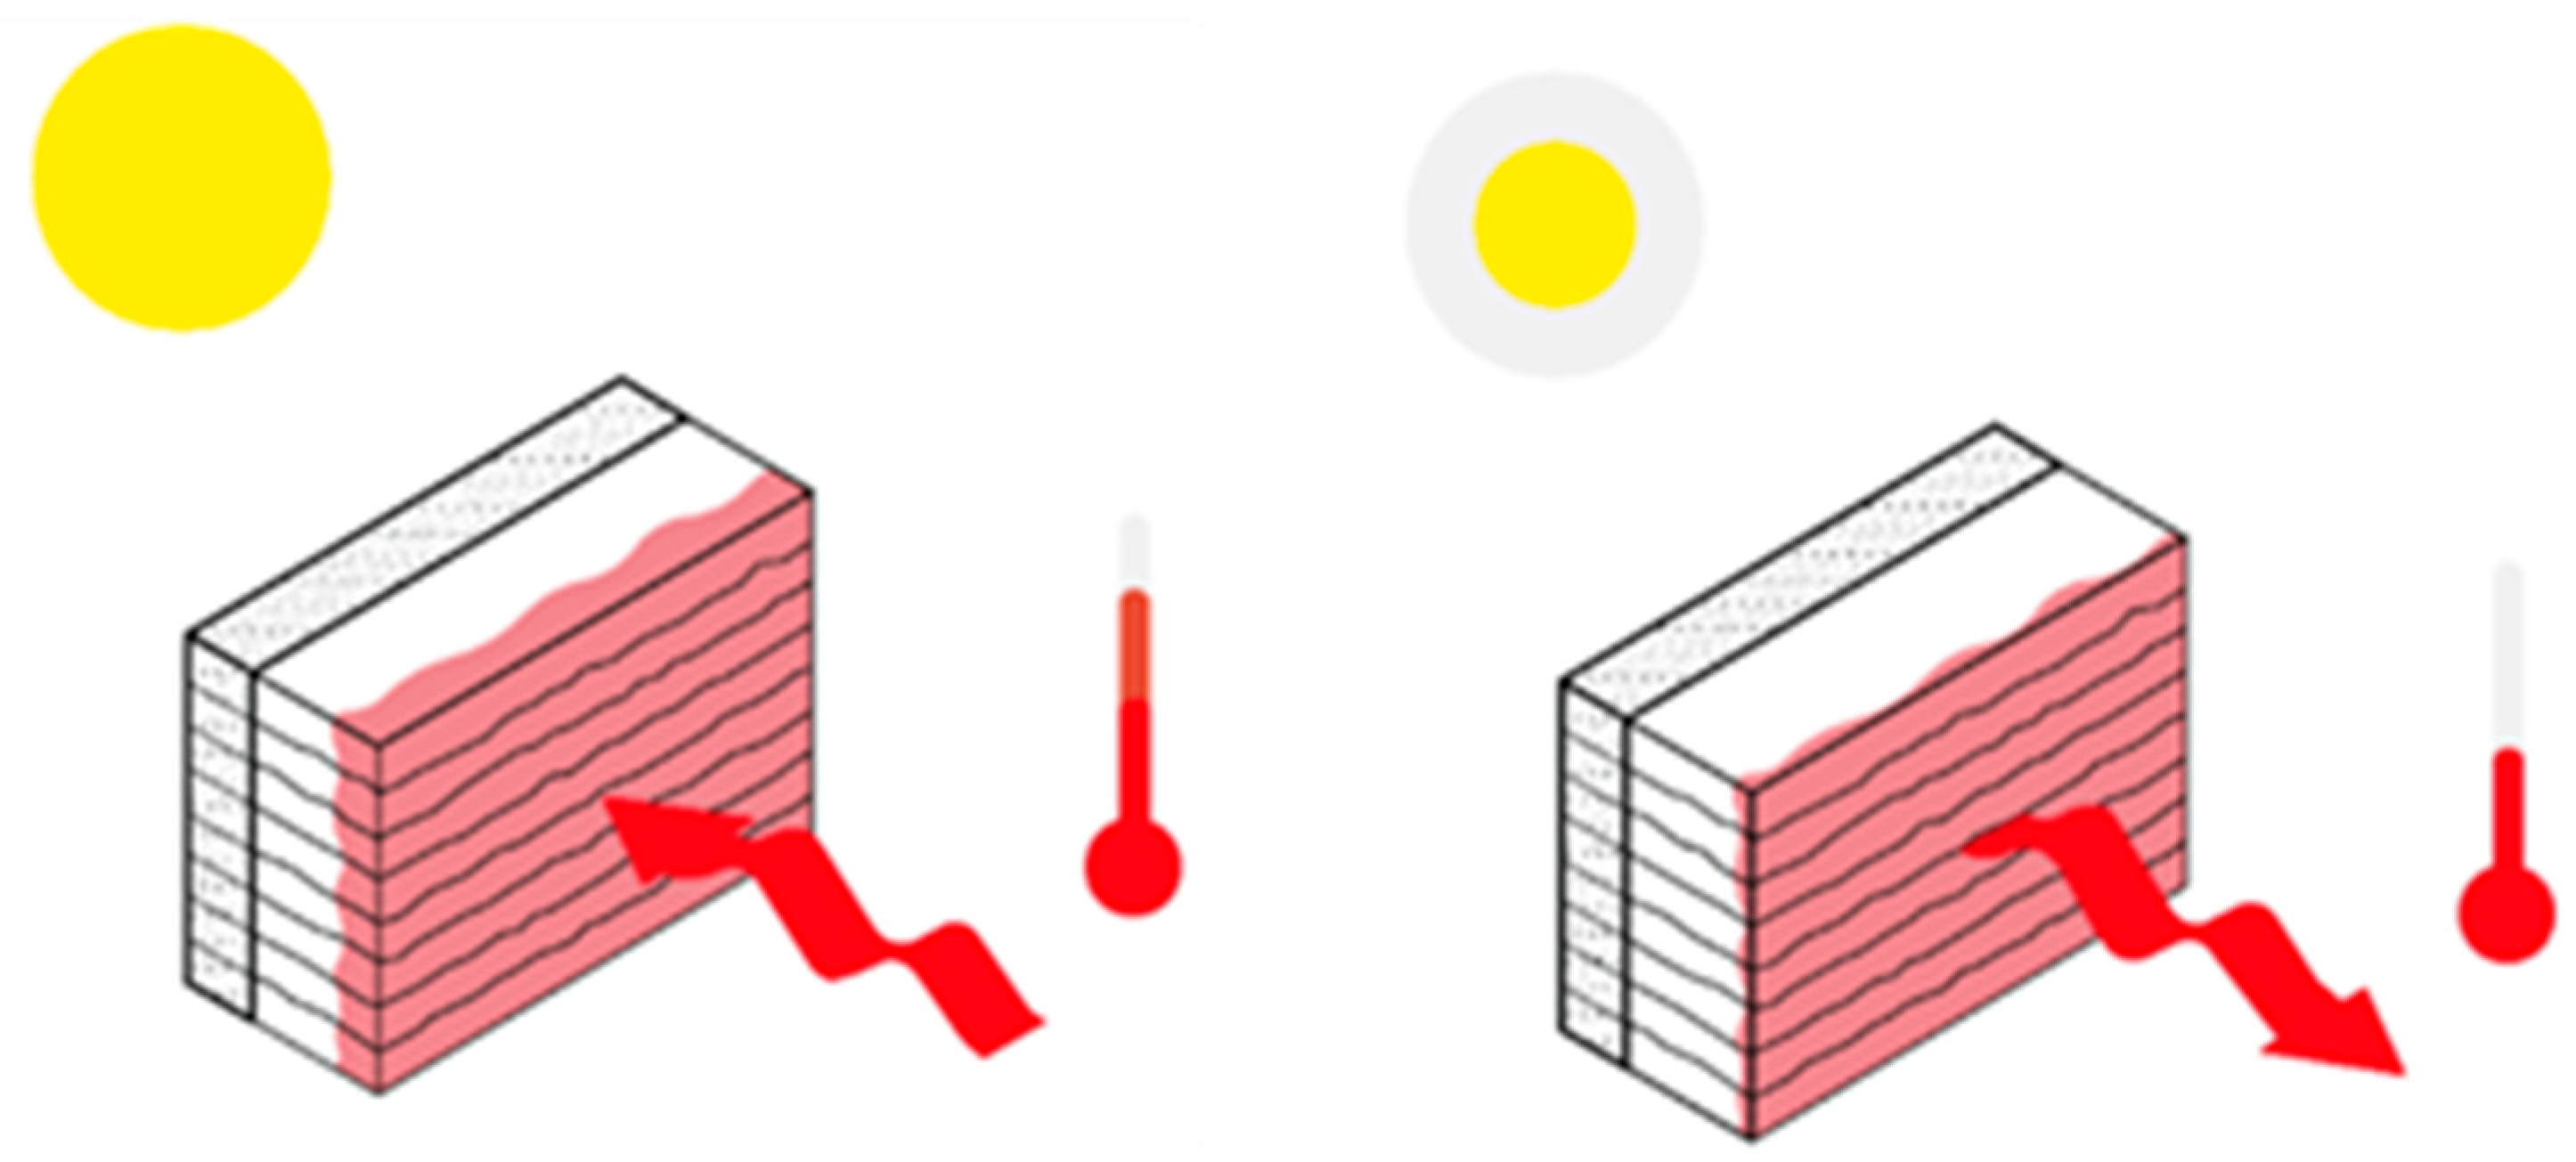
1.1.2. Potential—Thermal Inertia

In the wake of the burgeoning building turnaround, especially in Germany, many western countries are looking for funding opportunities to improve the thermal building envelope. As a result, the government is making significant investments into highly insulated building constructions, through broader access to funding opportunities. In the short term, this results in energy savings in the operation of the building, but in the long term, based on the embodied carbon of the materials, it can negatively impact a building’s energy and CO2 performance [15]. The reaction time needed to adjust the building, also known as thermal mass or time-related thermal inertia, seems to be another important factor in the process of building adaptation. As evidenced by numerous studies, this strategy not only reduces energy use and increases thermal comfort in the environment, but it may also enable load control and turn the building into a component of a larger energy network [7,8,10,11,12].
Thermal mass or effective heat capacity describes the ability of materials to absorb/desorb heat based on temperature changes in a room [16]. As defined in the German Code DIN 4108, thermal mass has a significant impact on the energy consumption of a building. The various construction types are divided into three categories: heavy-, middle- and lightweight constructions. This classification establishes the effective heat capacity in accordance with the net floor area. Constructions are classified as being light if they are less than 50 Wh/(Km2), medium if they are less than 130 Wh/(Km2), and heavy if they are more than 130 Wh/(Km2) [17]. The phrase thermal inertia refers to the rate at which a mass absorbs or loses heat. A building’s thermal inertia can be utilized to reduce energy use and improve thermal comfort in a space [12]. The accompanying Figure 2 illustrates how time-delayed heating and cooling of the material’s surface can create a more balanced and comfortable environment, particularly under conditions of fluctuating temperature in a space. With impending climate change, support for the prevention of overheating in the summer is becoming more and more crucial. This effect can aid in the storage of heat during wintertime.
According to prior research, a building’s thermal mass can be transferred into a component for demand-side management, in addition to being used to save energy and provide thermal comfort [7,8,10,11,12]. Here, the authors not only explain how the building’s performance is greatly influenced by the local weather, but also how people interact with the structure, which makes it possible to use a demand-side management method. With the emerging concept of using heat pump systems in combination with active layers for heating and cooling, especially in temperate/cold climates, the thermal mass of a building can serve as local storage, to convert surplus regenerative electrical energy and support the energy revolution [18]. These studies usually claim to develop smart control strategies for building technology so as to exploit the potentials of thermal inertia.

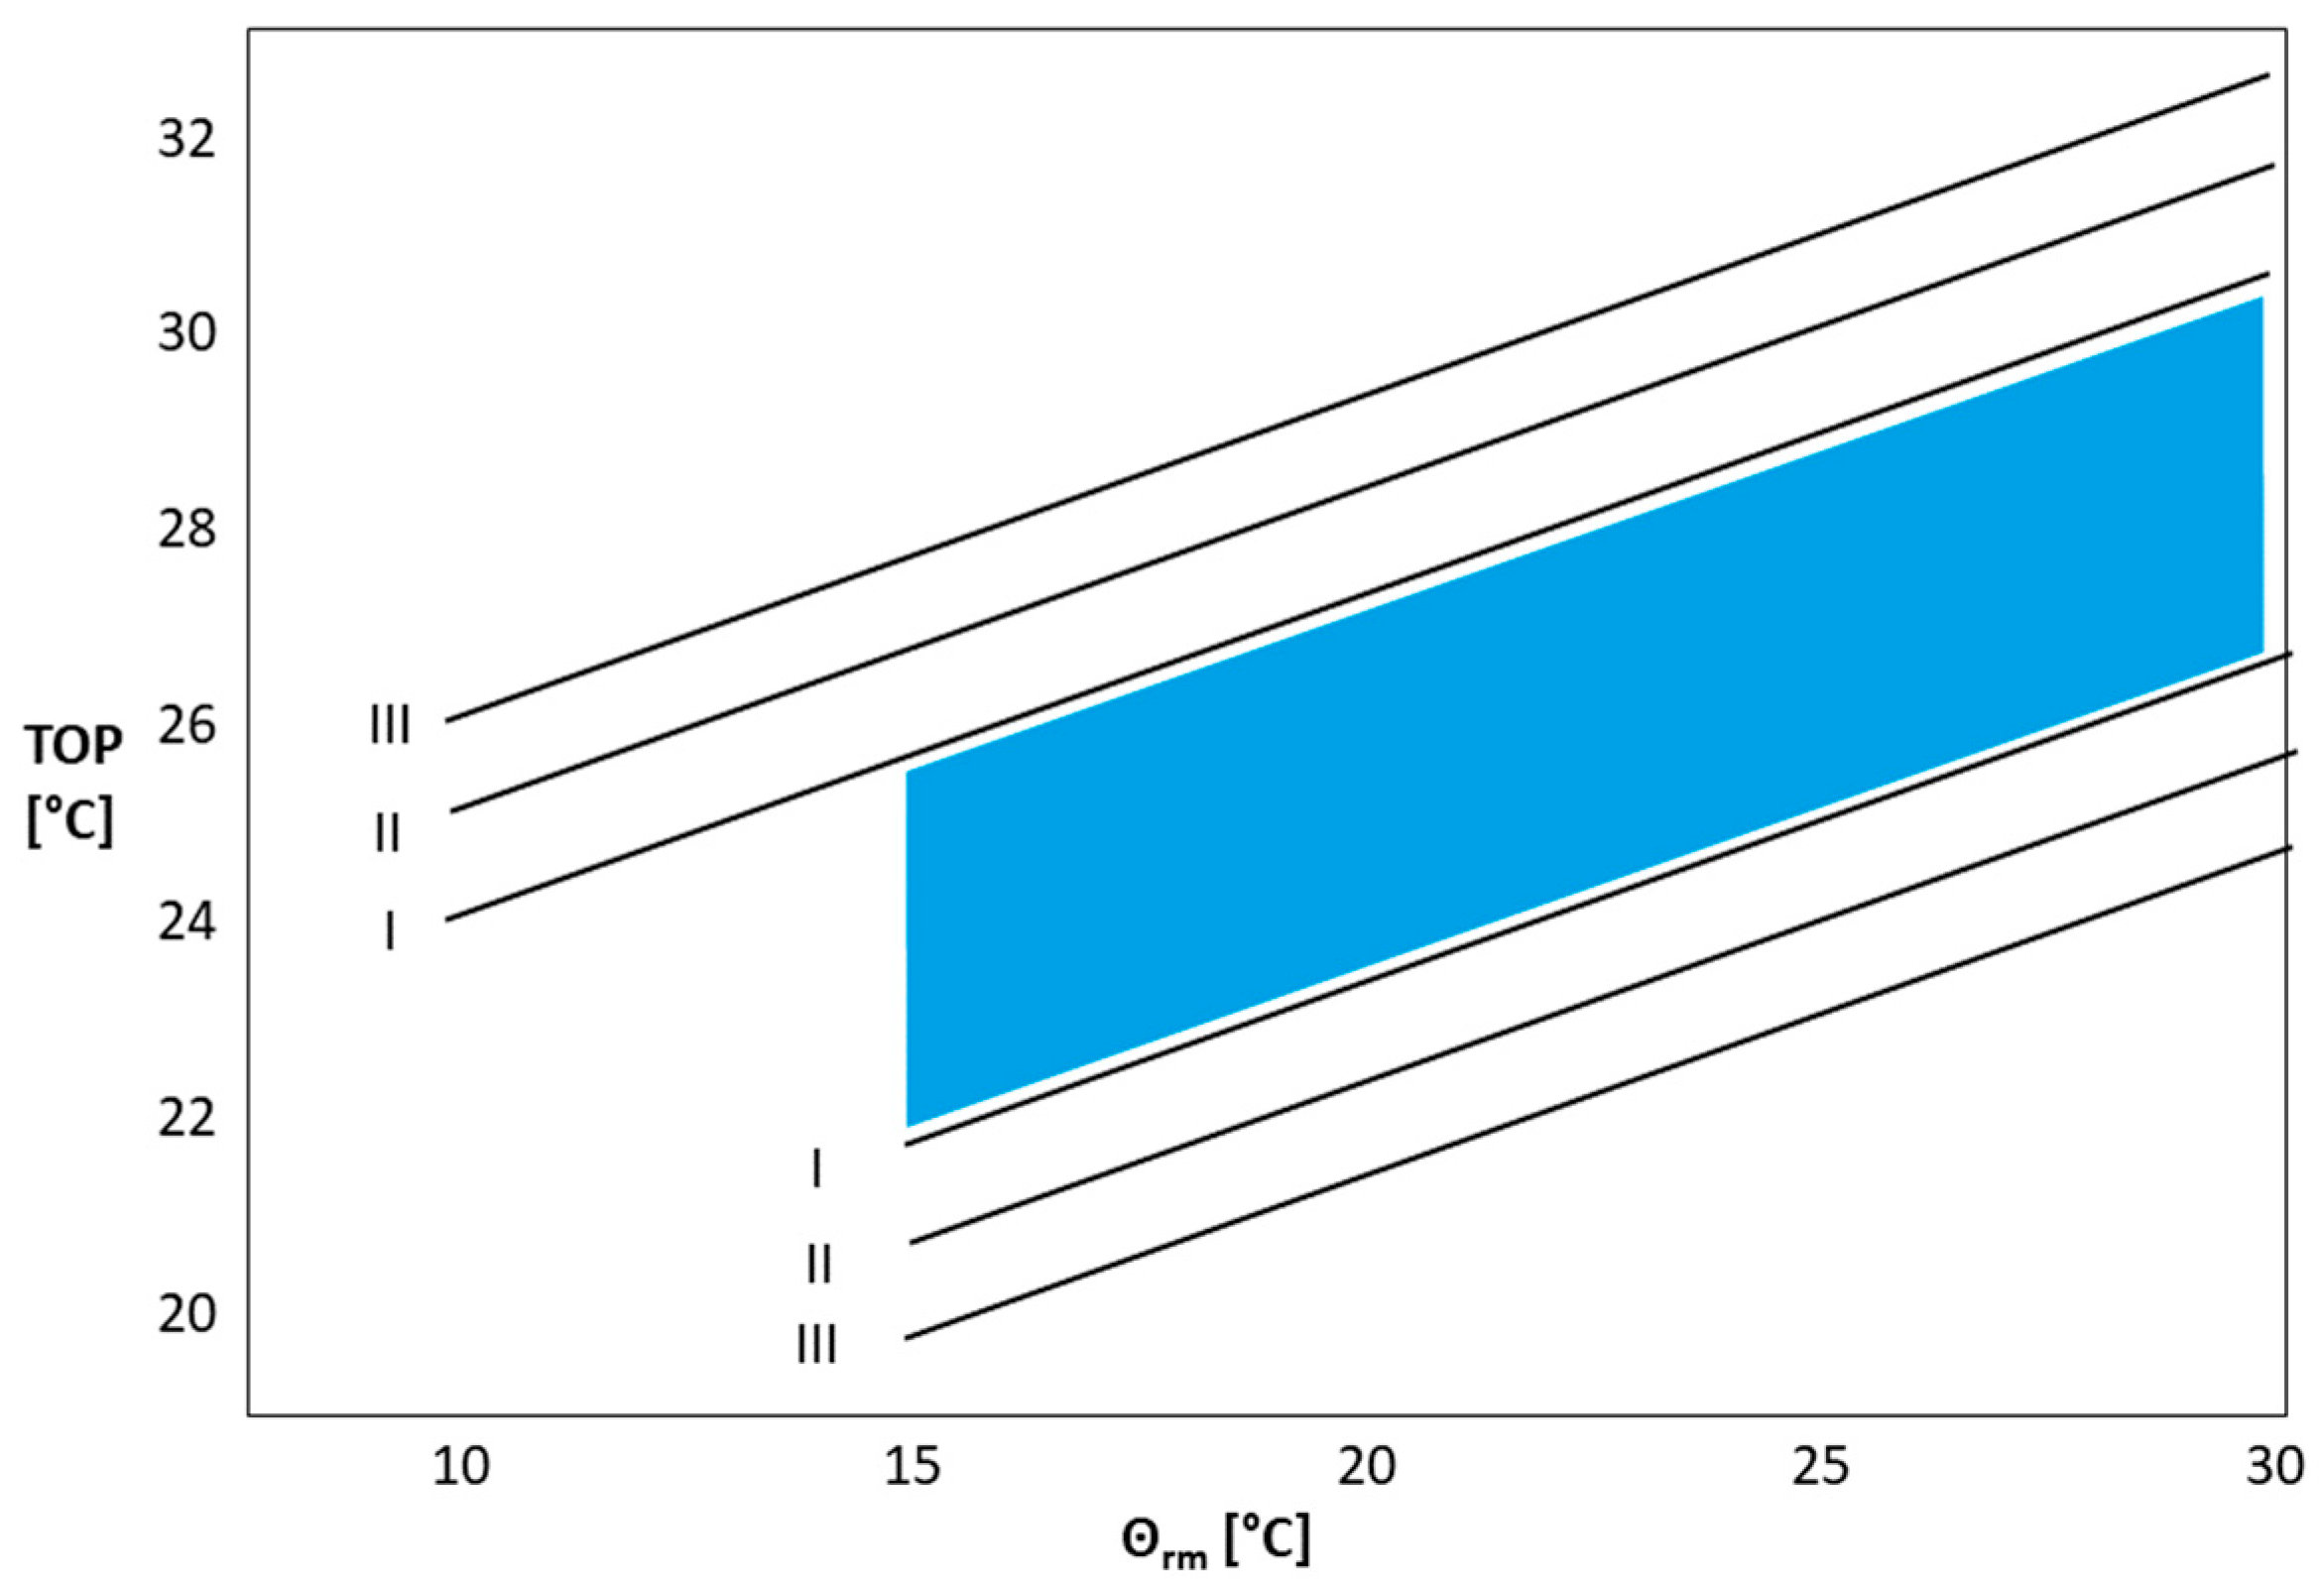
1.1.3. Potential—Thermal Comfort

With the ongoing energy crises in Europe and the overall transition away from fossil fuels, reducing the heating energy demand has become a key question in the building industry. Since 70% of the net energy consumed in households is used for heating [19], the question as to which temperature profiles and ranges are sufficient has become not only a focal point of research, but a political debate.
National and international building codes consist of various parameters and methods to evaluate thermal comfort in a room, most of which rely on either the predicted mean vote (PMV) and percentage of people dissatisfied (PPD), or more simply, on the operative temperature in accordance with the running mean outdoor air temperature (adaptive method). While the PMV/PPD method performs particularly well in static, controlled environments, the adaptive method has been shown to be more accurate in real-world, dynamic environments and when observing human adaptation and expectations [20,21]. This paper therefore utilizes this adaptive method. The operative temperature (Top) is a mathematical temperature that best describes a human’s experience in a room. It is calculated as the equal distribution between the air temperature and the sum of the temperatures of the surrounding surfaces that effect the point of measurement through radiation. The adaptive comfort band of DIN EN 16798-1, with the upper and lower acceptable Top according to three categories of predicted discomfort (Figure 3), graphically illustrates the range for energy savings [22]. It depicts the methodology of evaluating comfort within a range and not only relying on one temperature set point to provide comfortable conditions in an environment. Consequently, as we recognize this flexibility in thermal comfort, we can argue a potential for energy saving by using the built environment as storage and therefore bridge phases from renewable energy excess times to times where there is little to no regenerative energy availability.
Side note by the authors: While this paper investigates thermal flexibility and potential of weather predictive control within the thermal comfort ranges given by the established adaptive method, it should be noted that these category ranges are currently debated in their validity. In such, recent literature assumes wider comfort ranges and more personal flexibility in thermal adaptation to be perceived as more comfortable and potentially healthier in the long run [23,24,25,26,27]. This greater flexibility would also yield a wider range for energy harvesting and would strengthen the concept of a weather predictive control. This is also shown in various studies that question the static and tight conditioning of indoor environments [28,29,30].

1.2. Methodology

This section describes the methodology used with regard to the aforementioned research potentials, as well as the hypotheses that arise and the subsequent research questions. Digital, thermodynamic simulations try to represent the actual physical behavior of a system. An energy improvement of a building system is virtually always attainable with a highly realistic digital duplicate [31]. To analyze the effects of a WPC this paper uses a validated thermal simulation model to evaluate the impact of a WPC on the thermal comfort and the energy demand of an office building in the moderate climate of Munich. The validated simulation model with its building characteristics is based on the Solarstation, a two-room test facility on the roof of the Technical University of Munich. This serves as the foundation for the thermal simulation model in TRNSYS 18, which is powered by the parametric simulation tool TRNLizard and carried out in the graphical programming environment Grasshopper in the software Rhinoceros 7. The thermal simulation model is parametrically adjusted to analyze the specific effects of the WPC.
After the setup and evaluation of the base case models, the WPC strategies developed for heating, cooling, ventilation and sun protection are implemented in the software system using Python, taking into account the future ambient temperatures and future incoming solar radiation. The following hypothesis and the related research problems are addressed by the simulation setup used in this paper:
The energy demand and thermal comfort of a Munich-based office building can be optimized compared to a state-of-the-art control strategy by the simple approach of a weather predictive control of inert buildings.
  • Is it possible to optimize the thermal comfort of a room with a WPC?
  • Is it possible to generate energy savings with a WPC?

1.3. Literature Review

The current state of research into control methods for thermally activated building structures (TABS) is presented in this section. Many publications have defined various methods to govern inert building technology such as TABS, ranging from the early pioneers to the modern advanced control systems. The building structure can be integrated with TABS to serve as energy storage, but there is still room for improvement in the control. The system’s mass flow and supply temperature can both be managed. In general, other building technology systems, such as radiators, are also capable of using an intelligent control strategy, although Amato et al. point out that the hydraulics of radiator systems severely restrict the performance of an intelligent control strategy [32]. The concept of a simple ON/OFF control, a proportional integral derivative control (PID), a weather-dependent control, a model predictive control (MPC), and other intelligent control strategies are introduced in this literature review. The authors also provide a brief overview of the benefits and drawbacks of each individual approach at the end of each subsection.

1.3.1. ON/OFF Control

The ON/OFF controller, which is the most widely used and basic control technology, typically determines when to switch merely based on temperature. The discontinuous room temperature control using a three-position controller is an easy way to operate the TABS. The controlled variable with two established limit values for heating and cooling is typically the room temperature. Hence, the system functions either in the heating mode, with the greatest possible supply temperature, or the cooling mode with the lowest possible supply temperature. A hysteresis is commonly used to avoid any immediate change between switching on and off [33].
This control strategy’s simplicity and minimal data point requirement are advantages. This guarantees a straightforward implementation in practice. According to Tödtli et al. [34], this control method relies on the self-regulation impact of the thermal mass of the building, and many examples demonstrate a discomfort in the thermal zones without taking into account the heat gains in a room or an overall feedback variable from the thermal zones. Additionally, the impact of the building’s location does not affect the thermal performance and can result in excessive energy demands and overheating/overcooling.

1.3.2. Proportional Integral Differential Control

The continuous control strategy is represented by the proportional integral differential controller (PID). It is frequently used for industrial applications due to its ability to take the history and the future behavior of the system into account. In contrast to the three-position controller, the PID controller is a closed-loop system that considers the output as feedback for the following input signal [17]. The tuning of the coefficients plays a key role in determining the performance of the controller.
Studies show that a PID controller outperforms standard ON/OFF controls in terms of the energy demand, but also lead to thermal discomfort [35]. Due to the complexity of the simulated model, it is impossible for the model to be abstracted into a mathematical model, which could be calculated and tuned with the classic control theory. Nevertheless, studies show that neither PID mechanisms nor three-position controllers offer a suitable strategy for controlling TABS [7]. This is because heating and cooling might occur on the same day, which causes a large increase in energy demand. Another issue is that these mechanisms cannot deal with dynamic effects caused by disturbances such as changes in solar radiation, losses through ventilation, and internal loads. Furthermore, tuning PID coefficients is already a complex matter in the digital context of a thermal simulation, and becomes even more complex if transferred to the built environment. This is why PID controllers are very expensive to implement, and therefore are only suitable for large-scale building technology systems that are not representative of the majority of the market.

1.3.3. Weather-Dependent Control

A commonly used control strategy for TABS is the weather-dependent control. In this case, the supply temperatures are chosen depending on the ambient temperatures. The heating or cooling curve is the function that depicts this relationship between supply and ambient temperatures [33]. Figure 4 shows an exemplary heating and cooling curve with the ambient temperature on the x-axis and the target supply temperature on the y-axis. Within a defined neutral zone (here between 12 °C and 15 °C), heating and cooling are deactivated. Apart from the ambient temperature, the supply temperature is further regulated by the room temperature [12]. Another possibility is to control the return temperature depending on the ambient temperature. Functions for the target return temperatures that depend on the outside temperature are set up, similar to how the target supply temperatures are calculated. By taking into account the difference between supply and return temperatures, the main benefit of controlling the return temperature is the inclusion of the thermal conditions of the room (such as internal loads, solar radiation, etc.). The drawback is that when the system is turned off, the return temperature and energy transfer to the zone are unknown [12].
As Bollin and Schmelas [33] and others point out, the main problem with a weather-dependent control is its adaptation to the local weather conditions. The set temperatures are based on experience and outlined in general national guidelines such as the Handbuch der Gebäudetechnologie (English: Guideline for building technology) in Germany [36]. The concept is regional and uncustomizable because the set point temperature needs to be adjusted for local conditions in various climates. A second system to evaluate the thermal comfort conditions of the zones is necessary to guarantee suitable conditions, as there is only indirect feedback about the thermal conditions of a room.

1.3.4. Model Predictive Control

Model predictive control, as a supervisory strategy, considers future disturbances to predict the system’s behavior and to calculate an appropriate reaction of the system to minimize or maximize an objective function [37]. The new state of the system, including the relevant disturbances, is fed back to the MPC as input to optimize the next time step. In the context of building technology, the MPC usually aims to minimize energy demand and costs or enhance thermal comfort. Therefore, weather forecasts and predicted internal gains are taken into account. To achieve an efficient load management while maintaining thermal comfort, a suitable control strategy for energy systems is required. MPC holds potential for controlling it efficiently through prediction of loads, renewable energy generation, and weather forecasts [37].
The research project opticontrol [7,38,39] investigated the effectiveness of a practical application of an MPC strategy using weather forecast data. As a result, the project forms a strategy based on weather forecasts to choose the variables for the subsequent hours. The optimization issue can take into account predictions for internal gains, changeable energy prices, or comfort levels. By implementing the designed MPC strategy in a building, the demand for renewable primary energy is reduced by 17%, and financial costs are also reduced by 17% [7]. Furthermore, they concluded that the investigated buildings were particularly sensitive to the forecast of incident radiation. According to the authors, MPC can also contribute to making buildings more efficient as energy storage systems. Nevertheless, one disadvantage of MPCs is the high computational costs and the great effort needed to model the building and its technology.
Other research projects, including the opticontrol project, have also pointed out that an advanced digital model of the building as well as a data-intensive simulation algorithm must be connected to the control strategy with an MPC. To implement this idea into practice, qualified technical experts and cutting-edge building control systems are needed. This narrows the application of this concept down to large, modern building technology systems and excludes the majority of customers on the market. Furthermore, this high complexity of data and science makes it hard to understand and increases the risk of discomfort or the phenomenon of the performance gap (the gap between the actual real and initially intended design of a building system) [40,41].

1.3.5. Intelligent Control Strategies

Due to the outlined disadvantages of the MPC, researchers around the world are developing alternative control approaches to find the right balance for TABS. One such approach is intelligent control strategies using artificial neural networks (ANN), which enable automatic adaptations to building properties. J.Y.-Lee et al. [42] investigated the potential for improved performance of ANN-based control strategies for radiant floor heating. Predictive control with an ANN avoids overheating the room temperature, while non-predictive control strategies exceed temperature limits [42]. The high adaptability of the neural network offers the possibility of applying it with different boundary conditions. This adaptability is also demonstrated through experiments in real application.
M. Schmelas developed a self-learning algorithm to control TABS in his dissertation [7]. His AMLR algorithm (adaptive multi-level routing algorithm) calculates the amount of energy required by the TABS zone within the next day. The system also makes use of predictions for the daily mean outdoor temperature and global irradiation in addition to the schedule of occupancy. The advantages of the ALMR algorithms are validated with the help of simulation and measurement data from a pilot plant. Compared to standard ON/OFF control strategies, significant energy reductions of up to 41% can be achieved for the heating and cooling case, in terms of avoiding overheating and overcooling [7]. With respect to load management due to the fluctuating renewable energy converters, TABS serve as thermal stores and charging can be switched on or off [7]. In addition, the load shifting leads to a reduction in monetary costs if one assumes dynamic prices. The thermal comfort remains unchanged, or even improves, throughout the improvements in terms of energy savings and load management.
T. Palecek [43] as well as Nagy and Kazmi et al. [44] formulate a deep reinforcement learning algorithm based on ANN to control a heating system of a building more efficiently compared to the commonly used rule-based thermostat solutions. They consequently use a mix of deep learning—which trains an ANN to automatically acquire task-relevant features—and reinforcement learning—a computational method for determining the best course of action for a problem. A neural network, consisting of a set of interconnected neurons, can solve complex problems by automatically recognizing patterns in the provided data sets. T. Palecek used a large number of weather profiles from outside temperatures in Basel between 1985 and 2017 to train an artificial neural network (ANN) to optimize the heating control in form of the supply temperature and the mass flow. Those data points included: current outside temperatures, future and current room set point temperatures, and supply and return temperatures [43]. One part of the concept is to predict how the room temperature will change in the next state and to make decisions about switching the heating on or off depending on the supply temperatures. The study showed that this concept helps to avoid overheating [43].
In his dissertation, J. Jungwirth [8] developed an adaptable building model based on ANN in order to reduce costs. The aim is to shift the operating time for electrical heating and cooling systems according to the electricity tariffs that vary depending on the time and cost. A TABS is implemented in the investigated model, an office building. The increased flexibility of heating and cooling operation reduces monetary costs and meets the requirement of ensuring thermal comfort throughout the simulation period [8]. Assuming fluctuating electricity tariffs, resulting from increased renewable energy generation by the year 2030, the ANN control strategy leads to energy cost savings of around 63% when applied to an exemplary building [8]. The flexible and cost-optimized operation of the TABS with the help of an adaptable model offers great potential for a demand-side management [8].
Even so, the AMLR algorithm from Schmelas [7], the deep reinforcement learning algorithm based on ANN from T. Palecek [43] and Nagy and Kazmi et al. [44], and the adaptable building model based on ANN from J. Jungwirt [8] all require modern building technology systems to perform the optimization in the real built environment. Furthermore, in the training phases of the models, professional equipment is required. This shrinks down the use case to a small share of the market and increases the costs for such a control strategy that a standard office or residential building does not represent a suitable application. Furthermore, users may find the algorithms and data structures difficult to understand due to their complexity, and there is a risk that this will worsen the building’s performance gap, hence increasing energy consumption and/or lowering thermal comfort. This paper attempts to present a more straightforward, intelligent approach that is unaffected by these issues.

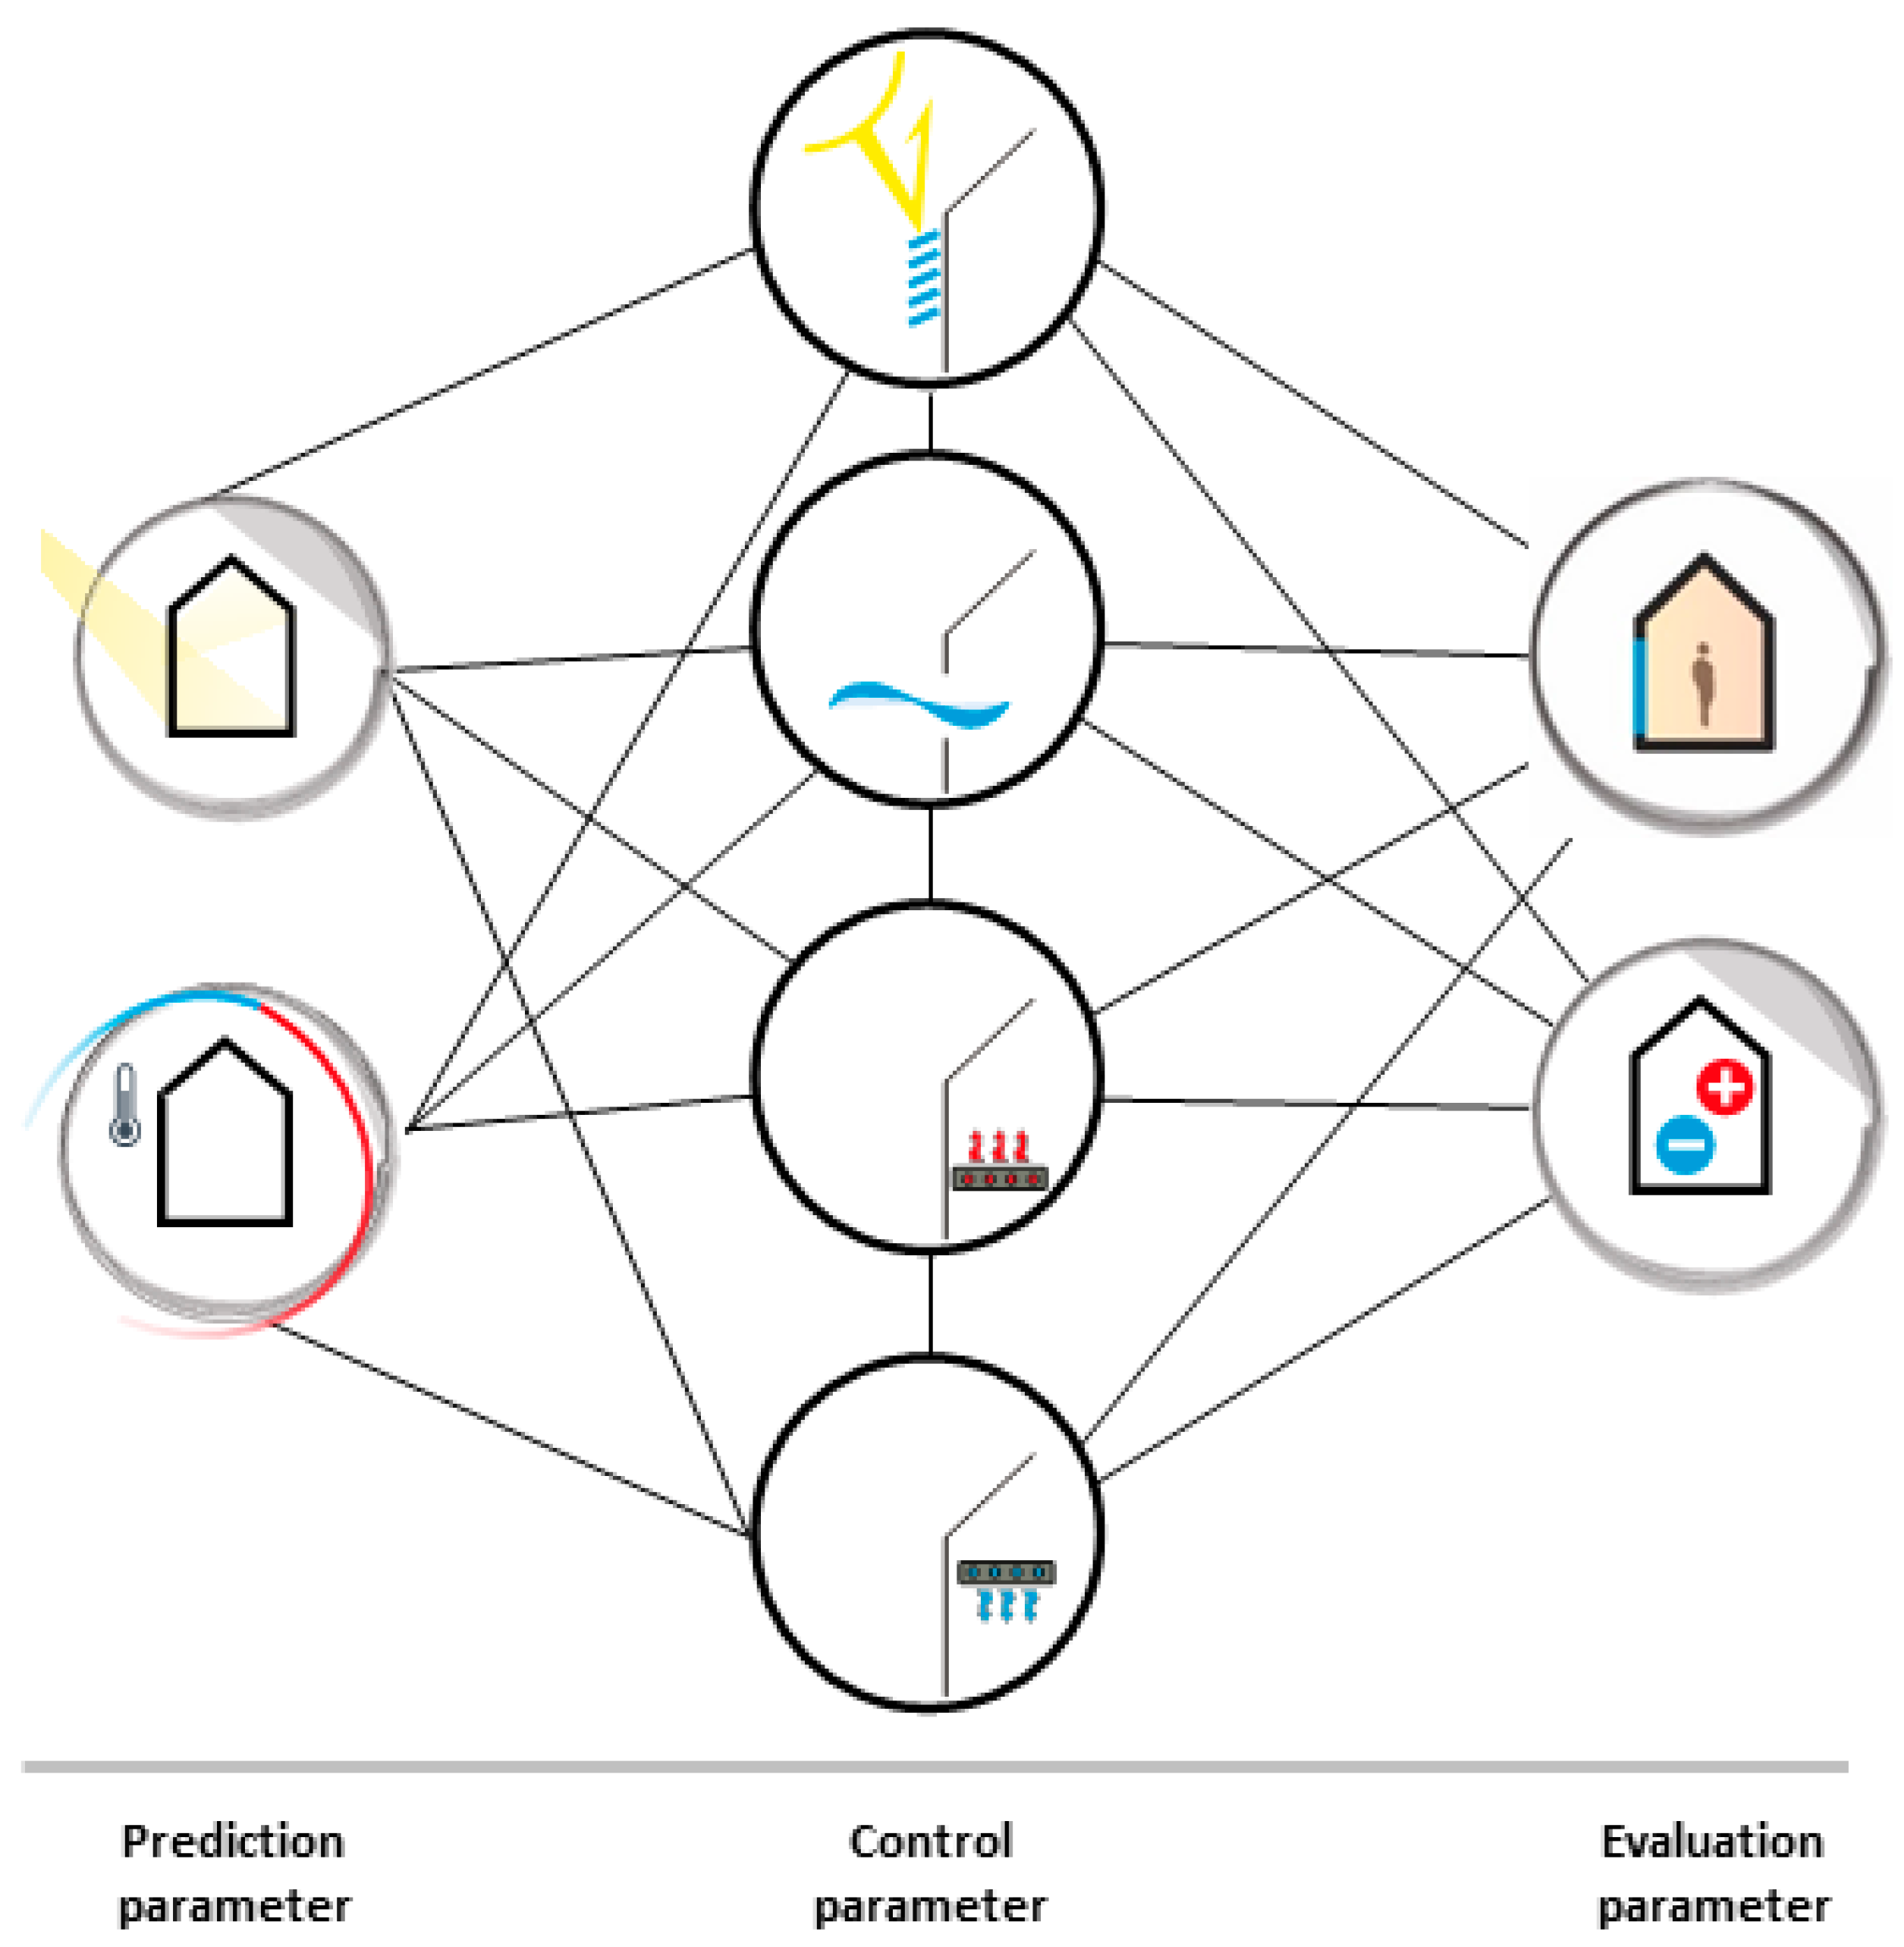
2. Concept for Weather Predictive Control

This section first presents the fundamentals of the concept and targets the key factor of the prediction process. The following subsections then outline the integration of the concept into the control of the heating and cooling, ventilation, and sun protection systems. The literature review presents the need for a simple, intelligent control strategy for TABS. This also forms the baseline for the authors in the case of the development of the weather predictive controls strategy. The strategy has to be simple and straightforward, with no complicated data management, so that its practical implementation is feasible. This means that in practice, a control device such as a Raspberry Pi is connected to the building technology system. This plug-and-play device can download local weather conditions at its forecast using only an internet connection. The weather predictive control strategy takes into account the actual and the future weather conditions so as to adapt the thermal comfort needs of the actual building and, if possible, execute the implemented energy harvesting strategy. Furthermore, the device must work with a feedback signal to constantly adapt the thermal zones and evaluate the thermal comfort in the room. However, the top priority is that the user can control the building technology at any time and override the algorithm suggestions.
Given that local weather conditions around the world can be accessed with an internet connection, the weather predictive strategy is possible regardless of the user’s location. Figure 5 below graphically displays the overall concept of the weather predictive control. The left side of the figure represents the ambient dry bulb air temperature and the solar irradiation from the weather data. These function as the prediction parameters for the concept. The four managed building technology systems are outlined in the middle column: sun protection, ventilation, and heating and cooling system. These systems are the control parameters that use the information generated by the prediction parameters to optimize the control. The thermal comfort and the energy demand represent the evaluation parameters in the right side of the figure. This paper analyses the individual variants according to these evaluation parameters.
Now that we know the overall concept of the weather predictive control, one of the key roles in this concept is the issue of the time step of the prediction: How far into the future should we look? Should we adopt a single or multiple approach and consider only one or several values of the prediction parameters in the future? The prediction approach in this paper relies on the concept of a weighted moving average over the next 24 h, because after 24 h the probability of the same conditions occurring is very high. The weighted moving average is a system that is also used to evaluate thermal comfort according to DIN 4108, since adaptive thermal comfort is defined by the weighted moving average of the past ambient temperature over the indoor temperature, and is therefore quite common in practice. The following Equation (1) describes the prediction approach, where X f u t u r e is the target future value. The values X t time steps t are added up from 1 to 24 h, and weighted according to the weighting factor α with an increasing mathematical power in each time step. This means that time steps closer to the actual time are weighted higher, but all weather conditions over the next few hours will still have an impact on the prediction. Overall, this results in a flattened trend of the predicted value to control the building technology under consideration.
X f u t u r e = 1 a   · t = 1 24 X t   · α t

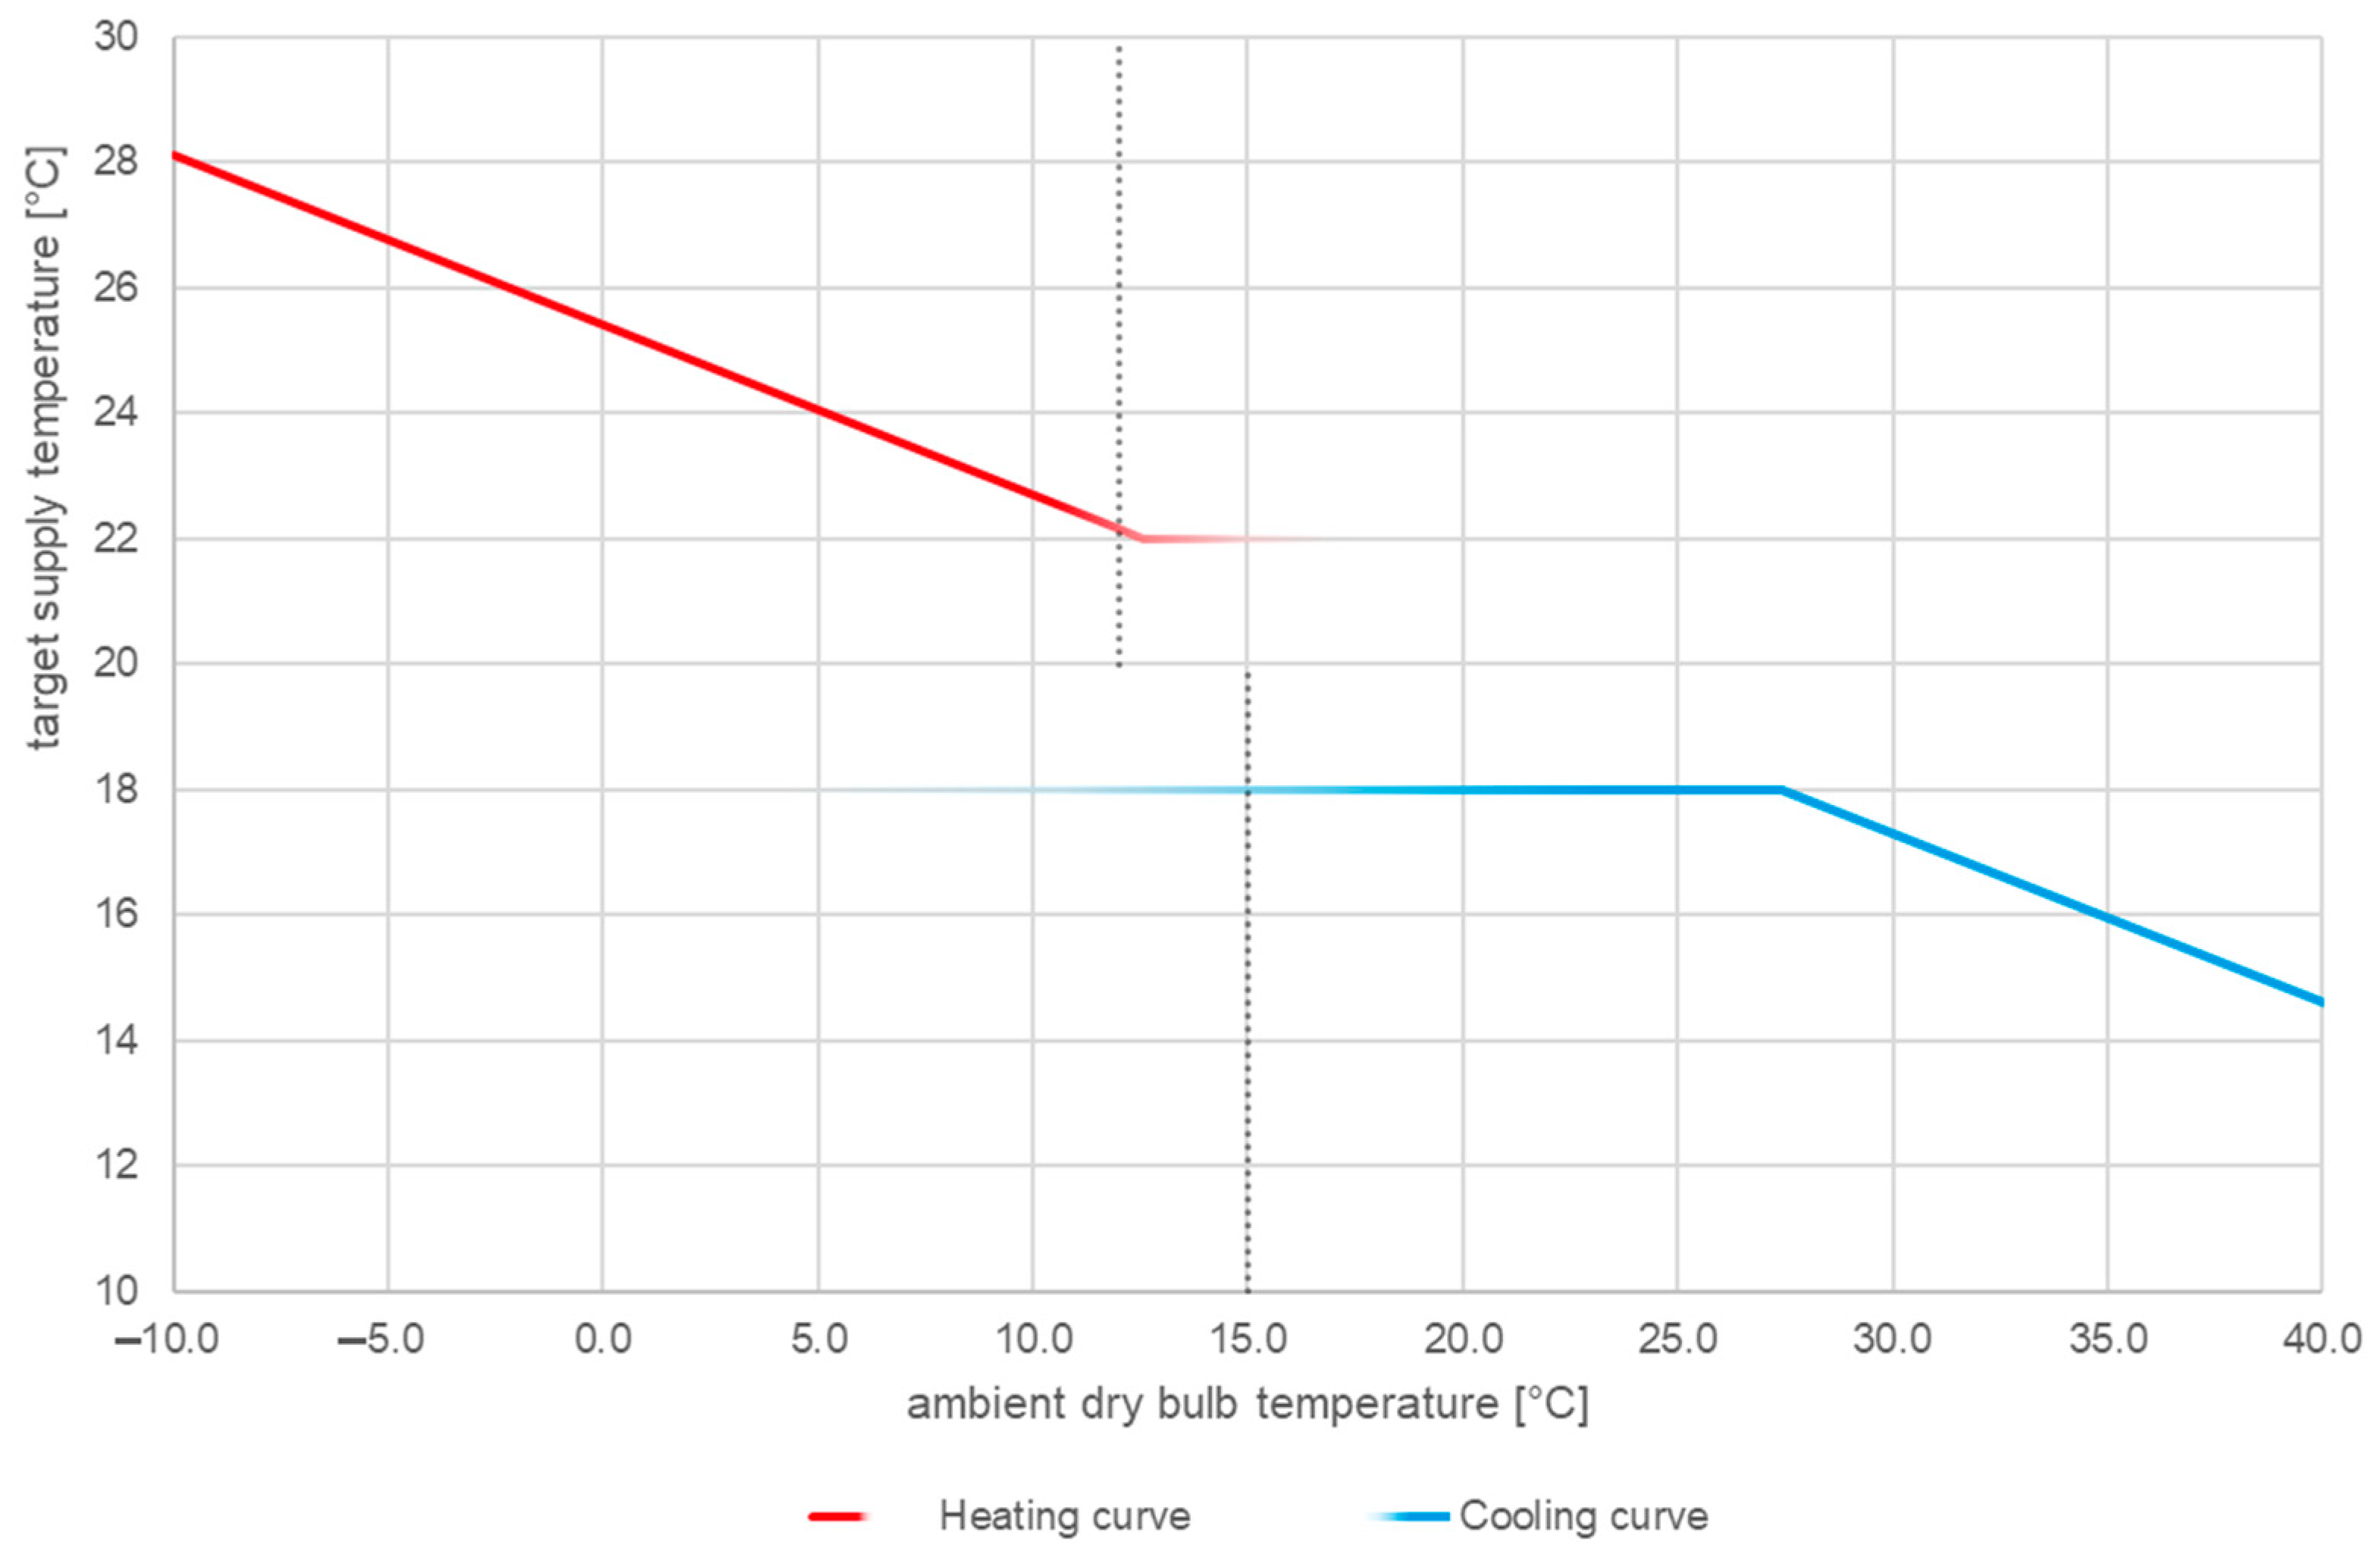
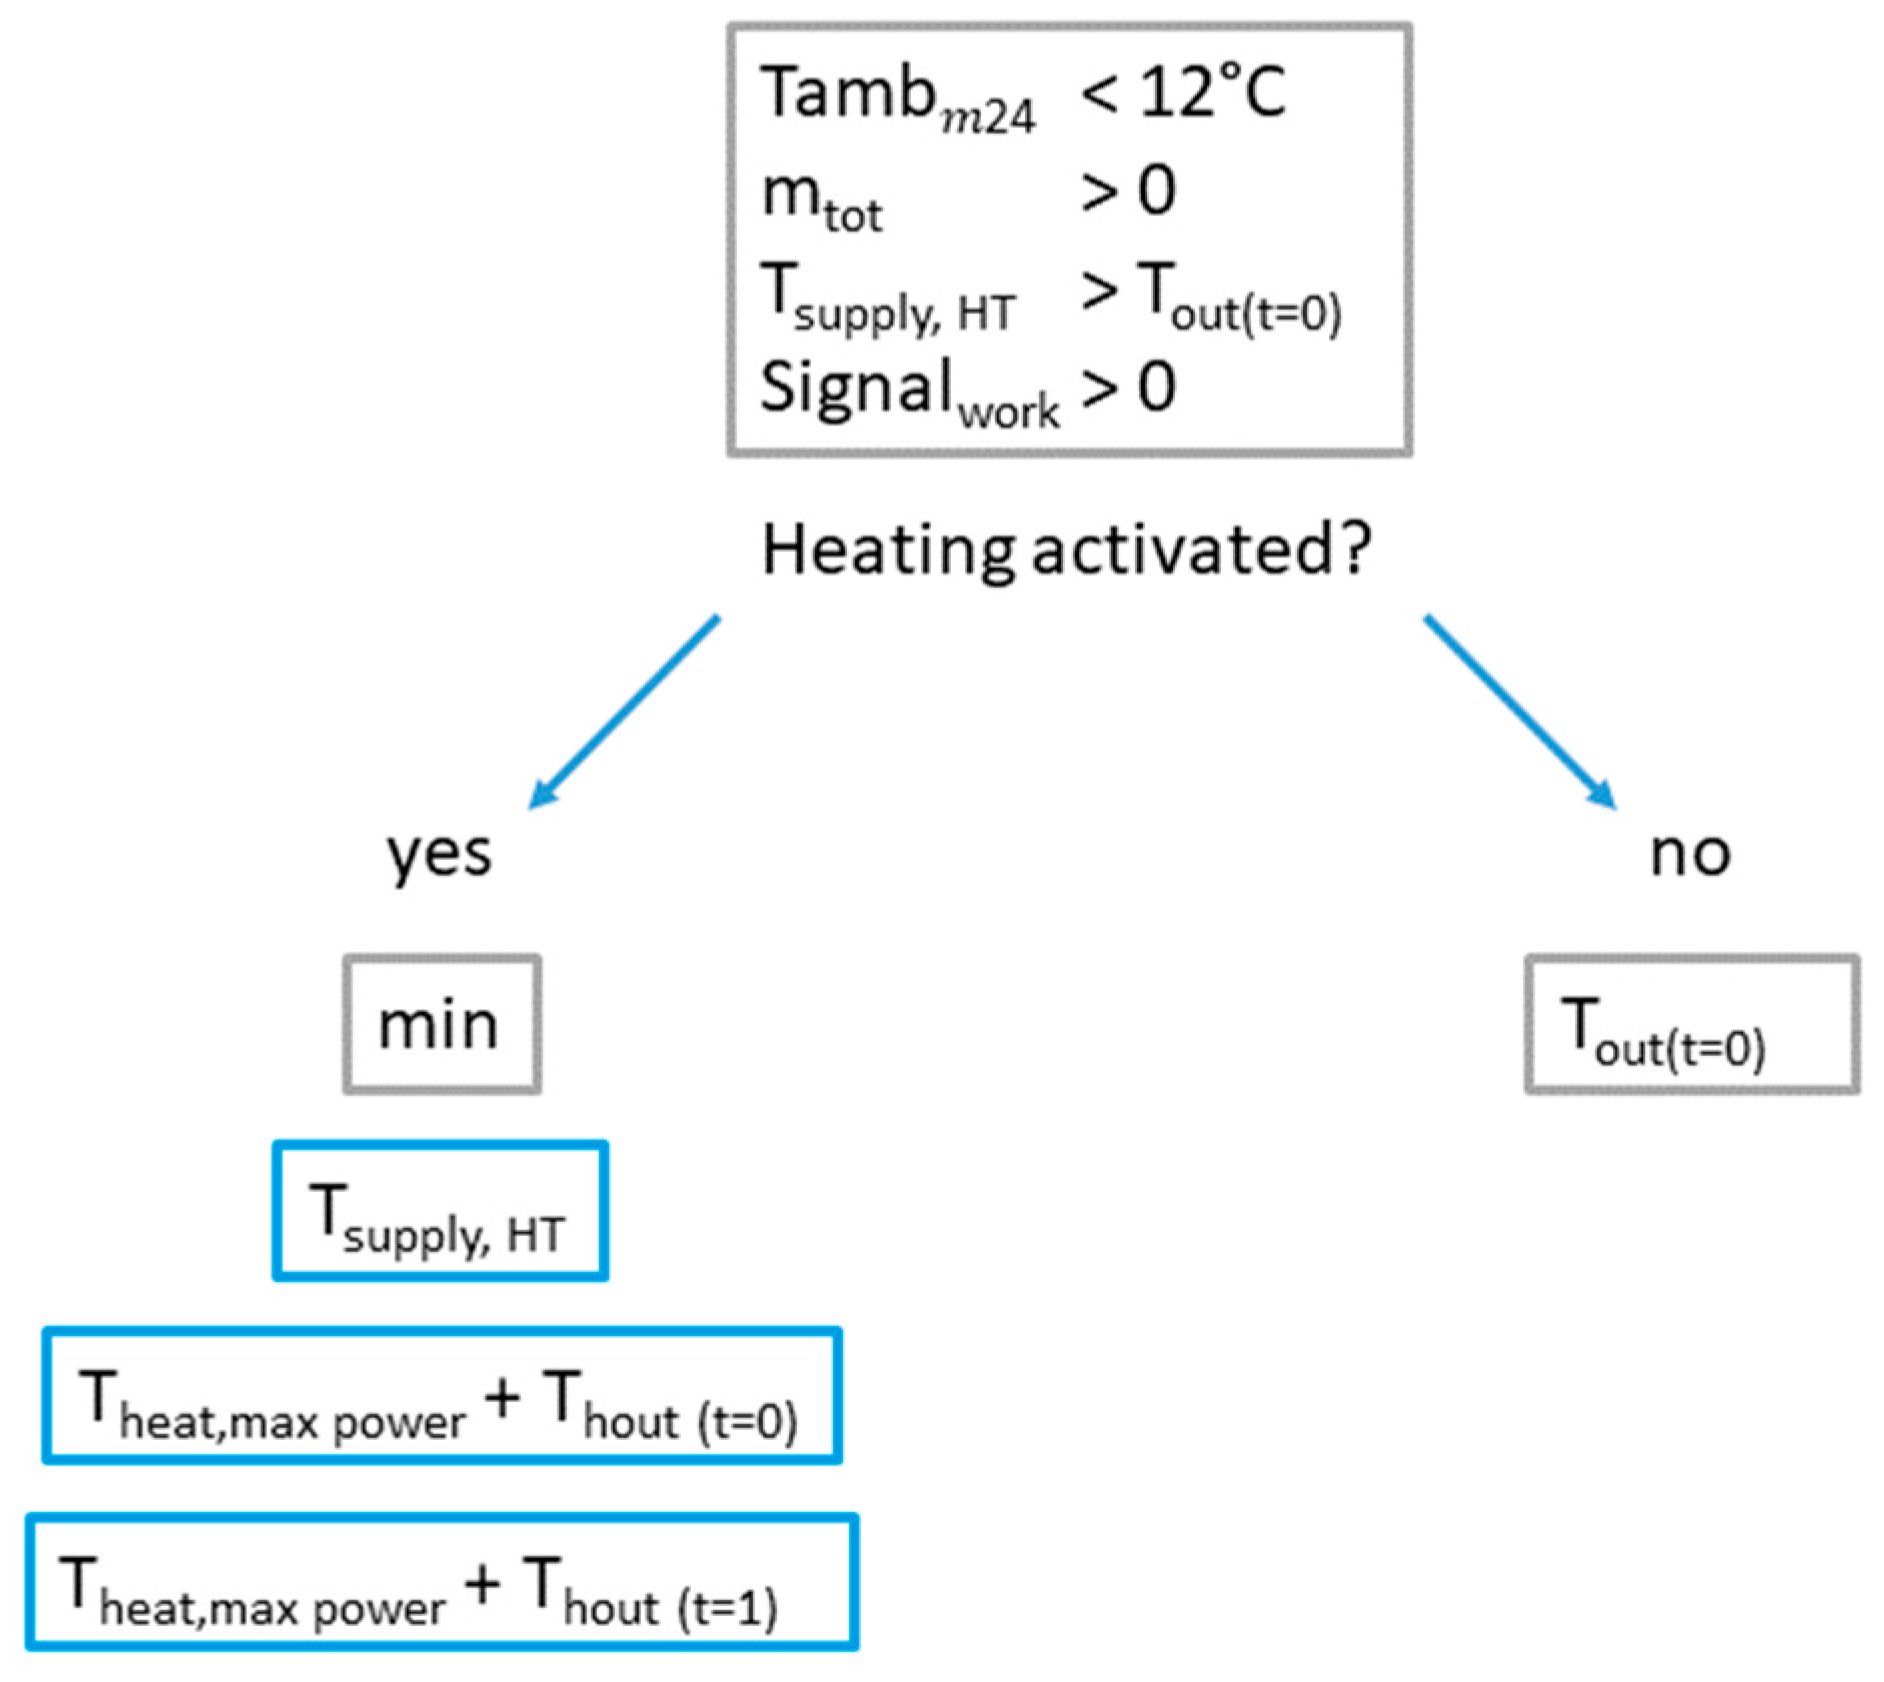
2.1. WPC—Heating and Cooling System

The active layer functions as a heating and cooling system that eventually reaches the desired set point temperature during the active phase. The active layer has different supply temperature settings. Two of them can be adjusted in the user interface. The one for cooling is set to 18 °C, following the recommendation of the Ausbau Atlas [45]. The initial set point temperature for heating is 30 °C. The specific power is assumed to be 40 W/m2 when heating and 50 W/m2 when cooling [45]. The threshold of the average ambient dry bulb air temperature over the last 24 h (Tambm24) determines the season of the year. Temperatures above 15 °C exceed the lower limit and allow for a potential cooling of the system. If the average ambient dry bulb temperature is below 12 °C, the heating mode is activated. Further heating is only possible when the supply temperature is higher than the return temperature (Tout) of the system, and the opposite is true for the cooling mode. In addition to this, the heating and cooling mode are only enabled when users are in the room and thus the working schedule is active. Finally, the heating/cooling process stops when the upper/lower dead band of the hysteresis is reached, according to the comfort band by DIN EN 16798-1 [22]. The following Figure 6 illustrates the control scheme for the heating system. Although it is not shown in this paper, the cooling system’s control mechanism operates in reverse with the indicated, altered thresholds:
Both cases of heating and cooling present an advanced control strategy considering the predicted weather conditions. The operative temperature functions as the control measure. For the WPC, the ambient dry bulb air temperature ( Tamb future ) and the total solar radiation ( Q sol , future ) at a future time step are implemented into the equation of the active layer. These two future parameters are calculated for every time step of the thermal simulation following the principle of Equation (1).
The solar radiation of the future time steps first reduces the supply temperature of the active layer, represented by a calculated temperature difference δ T Qsol , future . The calculation process expressed by a temperature difference of the heat and cold transfer of the medium can be seen in Equation (2):
δ T Qsol , future = Q sol , future m ˙ · c w 3.6
This temperature difference is implemented in the equation of the heating and cooling curve of the supply temperature. This means that in the initial equation, the current ambient dry bulb air temperature (Tamb) is replaced with the Tamb future and subtracted by δ T Qsol , future for the final supply temperatures. The axis interceptions, slopes, and lower limits are determined according to the test curve of the dissertation of Martin Schmelas and the guidelines in the Ausbau Atlas by Hausladen and Tichelmann [7,45]. The heating and cooling curve change as expressed in Equations (3) and (4). Besides the direct decrease in the supply temperatures, the maximum heating and cooling power ( P HT ; P CL ) are also modified depending on the solar gains of the future time steps, outlined in Equations (5) and (6):
T supply , HT = max 25.4 0.27 · Tamb future , 22 δ T Qsol , future
T supply , CL = min 25.4 0.27 · Tamb future , 18 δ T Qsol , future
P HT = max P HT , max Q sol , future , 0
P CL = max P CL , max + Q sol , future , 90
The reduction in power as well as the modified heating and cooling curves are aimed at reducing overall heating and cooling demand while at the same time improving the overall improvement in thermal comfort. The lower part of the adaptive comfort band is used as a reference for heating, and the upper part for cooling, to keep the heating and cooling energy to a minimum [22]. This concept is converted and implemented in the active layer type of the thermal simulation.

2.2. WPC—Sun Shading System

The shading system in this paper and in the norms (e.g., DIN 4108-2 [17] in Germany) are regulated according to the sum of direct and diffuse radiation onto the window surface area. By opening up and closing the shading system, solar radiation can enter the room to generate heat that in the summer periods potentially leads to overheating or the necessity of a cooling system. The shading device studied in this paper is a set of venetian blinds with an fc-value of 0.8. According to the norm DIN 4108-2, the individual irradiation limit onto the window surface depends on the orientation of the room, and in general, a shading system is activated only above an outdoor air dry bulb temperature above 14 °C [17]. For a northeast-to-northwest-oriented room, the shading system of an office building is activated above a threshold of 150 W/m2. For other orientations, the irradiation limit is set to 200 W/m2. The floating future radiation during the following 24 h on the window’s surface area is integrated into the radiation control in this study when it exceeds a threshold of 150 W/m2. The shading control signal considering the weather predictive control is outlined in the following Equation (7):
signal shading =   gt Tamb , 14 · gt rad sur , 200 + gt rad sur , future , 150

2.3. WPC—Ventilation System

J. Hopfe, in her dissertation, points out the sensitivity of computer based models, suggesting that the performance of a model is tightly tied to the ventilation systems and the infiltration [46]. In this study, a natural ventilation system is used in addition to the normal infiltration related to building construction, to promote thermal comfort in the office spaces. An electrical automation to open the windows as well as the manual possibility for the user to open the window is assumed. During the day within the work schedule, the ideal user performs the operation of the window according to the thermal comfort ranges of DIN EN 16798-1 [22], while during the summer period night time and absence of the office users the automation operates the window to perform a potential night time cooling. In general, the standard infiltration and natural ventilation in simulations are represented with the metric of air changes (AC) per hour (air change rate). In this paper it is divided in the following modes: basic infiltration (AC = 0.2), tilted window (AC = 1.5), intermittent opening (AC = 3); and completely open window (AC = 6). Here, again, the air change rate is a simplified concept to represent natural ventilation in a simulation model, which simplifies a complex process of multiple pressure differences into a single value. This leads to a reduction in the quality of the simulation, but a detailed computational fluid dynamic (CFD) simulation would distract from the main focus of the paper.
The following Equations (8)–(11) (for the work schedule) and (12)–(14) (for night ventilation) outline the control strategy for infiltration, the natural ventilation system, and the implementation of the weather prediction. The ventilation concept only follows temperatures and not volatile organic compound (VOC) thresholds in the room, so as to focus only on the energy consumption. In general, the indoor air temperature has to be higher than the ambient outdoor temperature to trigger a cooling. During the work schedule the three ventilation modes are activated according to the indoor air temperature thresholds 23, 25, and 27 °C. As the standards (e.g., DIN 15798) do not recommend specific thresholds, the implementation is based on the authors’ own experience. During the night time, the thresholds are set to 23 and 26 °C for the tilted window and completely open window modes, respectively. In addition to the basic control, additional potential ventilation is activated when future ambient dry bulb temperature is above the thresholds 23, 25, and 27 °C during work hours, or above 23 or 27 °C during the night time mode, resulting in the individual air change rates.
During work hours:
AC work = 0.2 · signal work · lt AC 23 , 1.5 · lt AC 25 , 3 · lt AC 27 , 6
AC 23 = 1.5 · gt Tair , Tamb · lt AC 25 , 3 · lt AC 27 , 6 · gt ( gt Tair , 23 + gt Tamb future , 23 ) , 0  
AC 25 = 3 · gt Tair , Tamb · lt AC 27 , 6 · gt gt Tair ,   25 + gt Tamb future , 25 , 0
AC 27 = 6 · gt Tair , Tamb · gt gt Tair ,   27 + gt Tamb future , 27 , 0  
At night time:
AC night = 0.2 · lt AC night , 23 , 1.5 · lt AC night , 27 , 6 · 1 signal work
AC night , 23 = 1.5 · gt Tair , Tamb · lt AC 27 , 6 · gt gt ( Tair , 23 + gt Tamb future , 23 , 0 )  
AC night , 27 = 6 · gt Tair , Tamb · gt gt ( Tair , 27 + gt Tamb future , 27 , 0 )  

3. Thermal Simulation

To analyze and evaluate the effect of the WPC, a thermodynamic model was set up. The correctness of a digital thermal simulation relies on detailed data implementation and profound expertise with the simulation tool. Thereby a common way to guarantee the correctness of a model is a validation, comparing measured and simulated values. The validated base case model and its local weather conditions, simulation variants, and individual energy and thermal comfort performance outcomes are all presented in the next two sections as the basis for the final discussion and conclusion.

3.1. Base Case Model
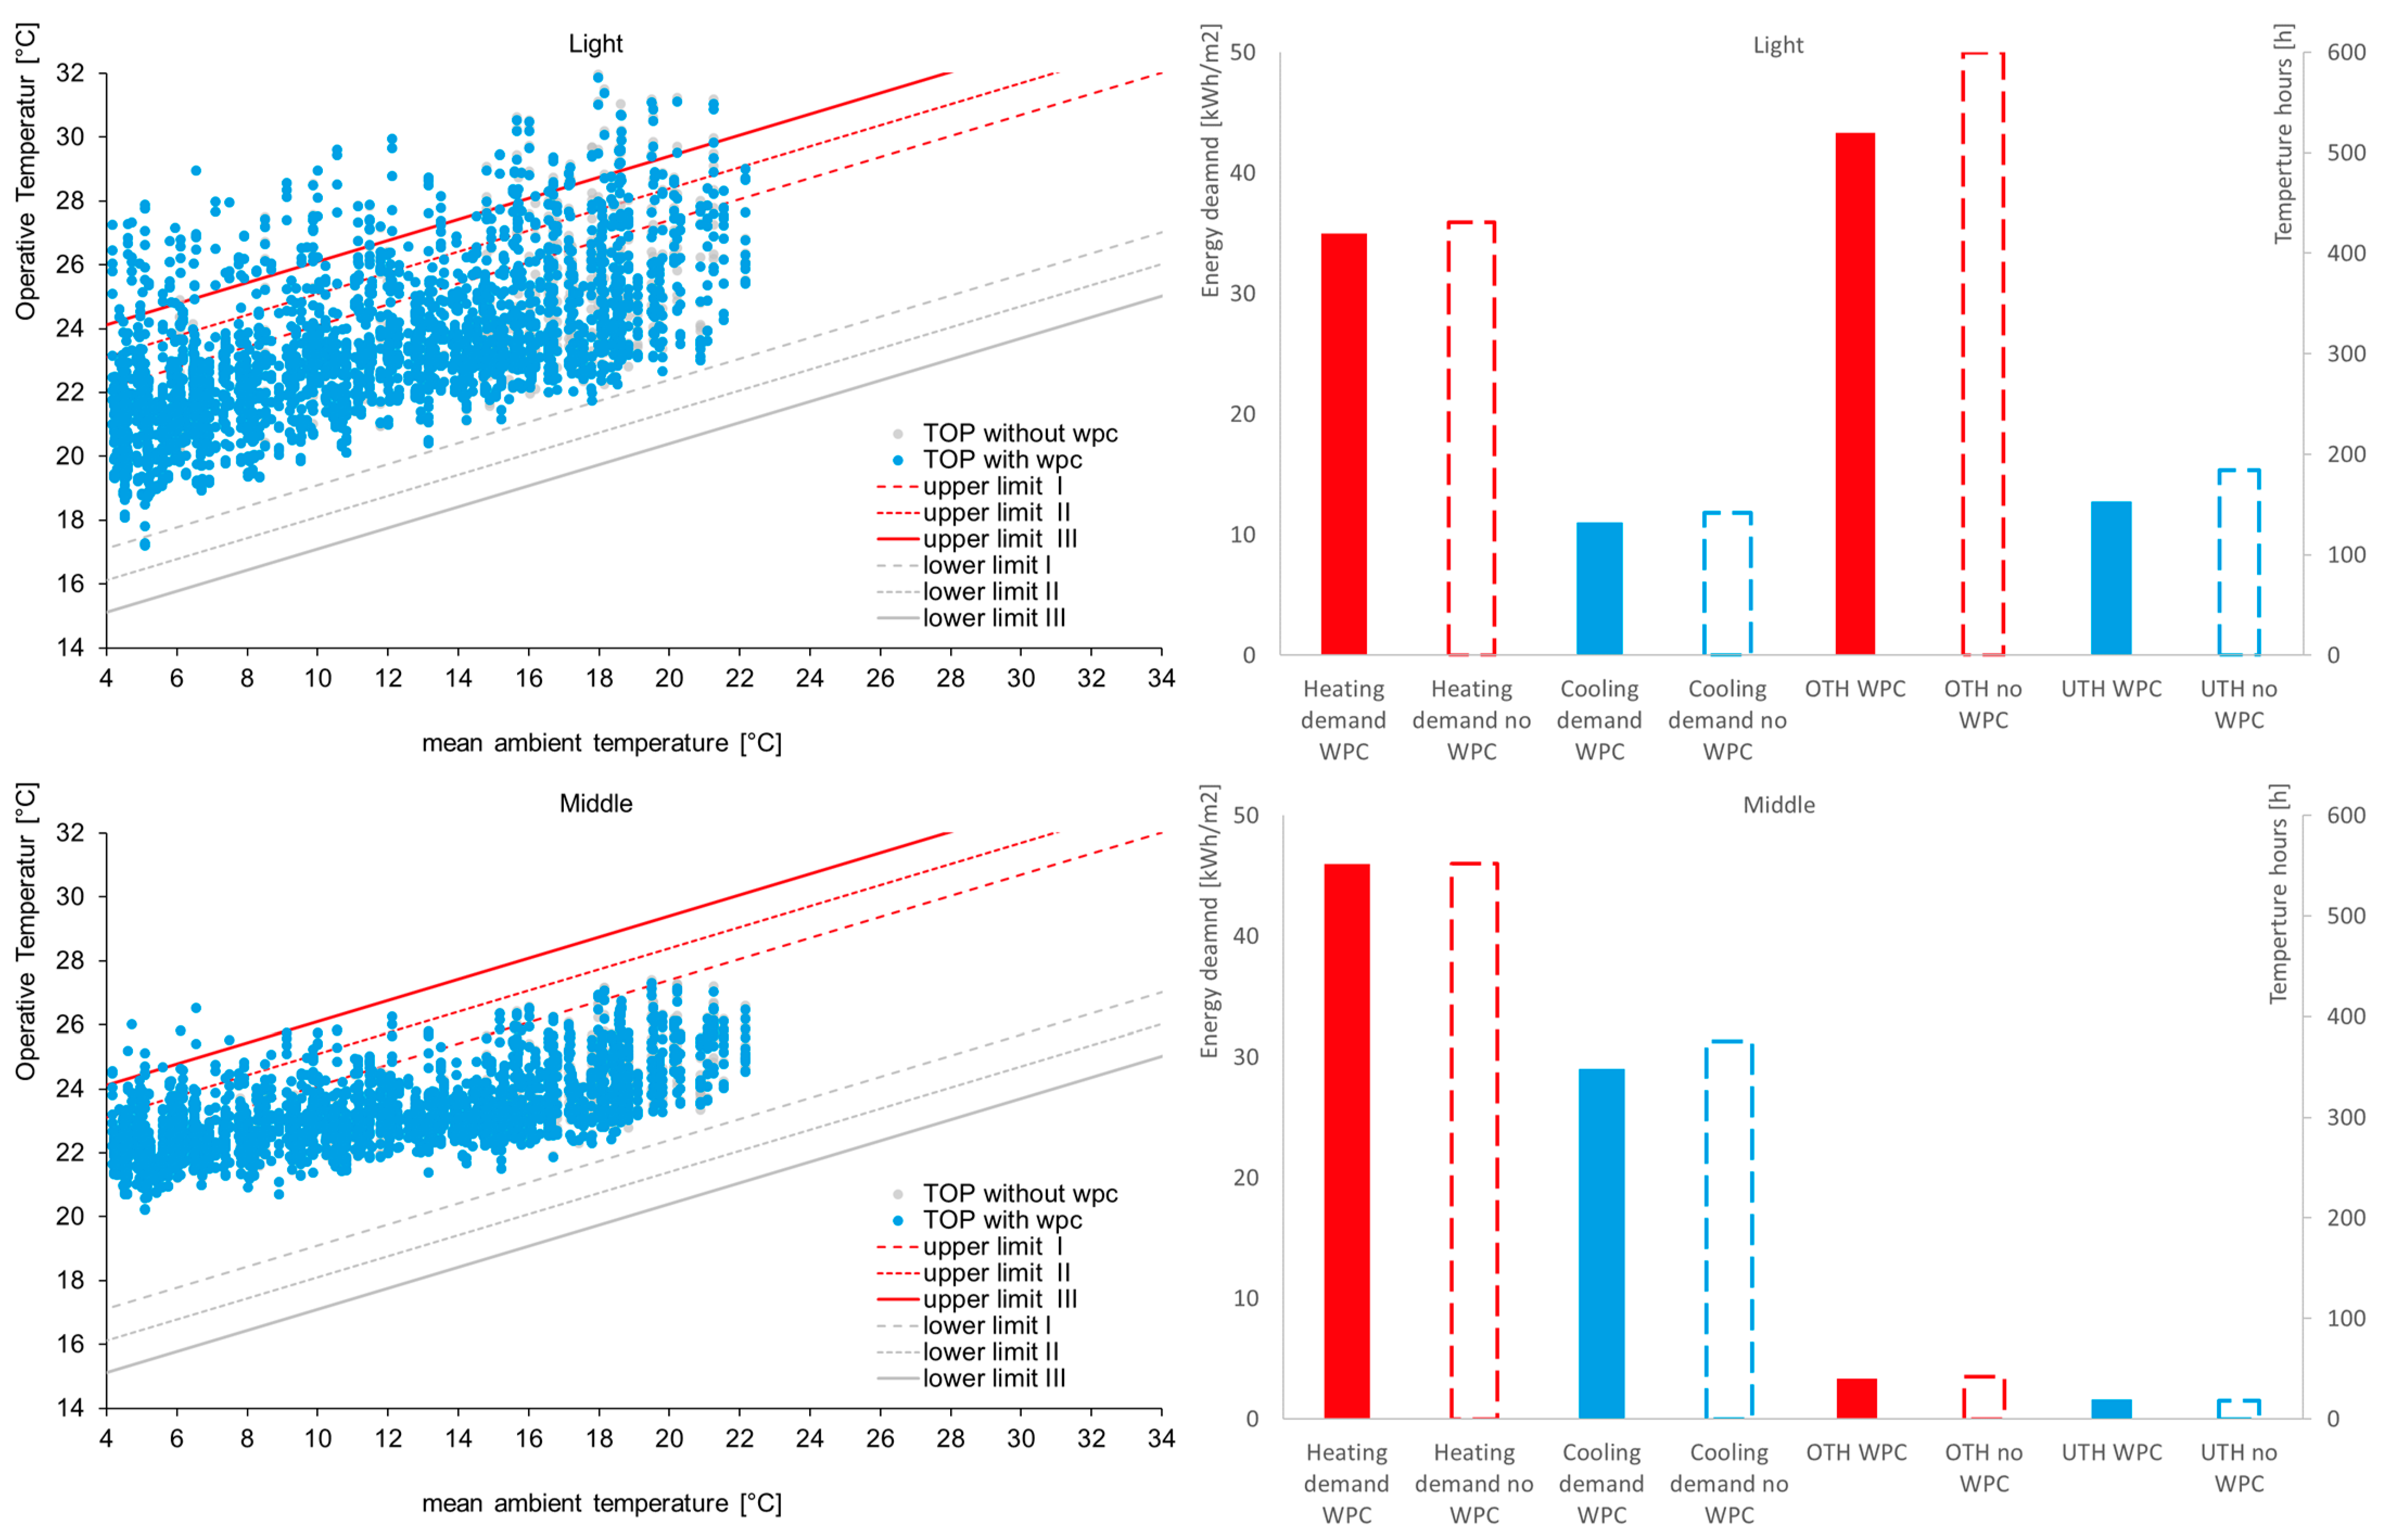
The digital thermal model is created in the software plug-in TRNLizard, a parametric tool for the visual programming environment Grasshopper of the CAD-software Rhinoceros 7. TRNLizard interacts as a communication tool which links building property information to the thermal simulation tool TRNSYS, which performs the actual dynamic thermal simulation. The base case model consists of an in situ measurement test facility of an office room located on a rooftop in the urban environment of Munich. The exposed location, at a height of approximately 28 m above ground, is mainly influenced by the urban Munich weather conditions (48°08′20″, 11°34′30″). The central, main office room has a length of 4.30, a width of 4.30, and a height of 3.30 m. The main orientation, including a large glass façade (window-to-wall ratio of 90%), faces 23° southwest. Venetian blinds function as the shading system, while the windows can be operated manually and automatically. In the thermal simulation, a slab activation acts as the heating and cooling system, representing the TABS. For heating, the supply temperature is 25 °C and 16 °C for cooling. The heating power is about 40 W/m2 and the cooling power is approximately 50 W/m2.
The validation of the thermal model has already been performed and described in detail in a previous study in 2022 by Hepf et al. [47]. Using the ASHRAE guideline 14:2002 and its criteria of the normalized mean bias error, the coefficient of variation of the root mean square error, and the coefficient of determination, it was shown that after adapting the infiltration and the thermal bridges, the thermal model was validated according to the four type weeks [47]. The thermal model data comprises local weather data measured at the test facility and the highly insulated thermal envelope (roof: u-value 0.222 W/(m2K), external wall: u-value 0.175 W/(m2K), floor: u-value 0.266 W/(m2K), internal wall: u-value 0.437 W/(m2K), window: u-value 0.68 W/(m2K)). The thermal bridges are set to 0.1 W/m2K and the basic infiltration air change rate is 0.2 1/h.
Figure 7 shows the global horizontal radiation, the cumulative values on a monthly basis for the ambient temperatures, and the monthly maximum and minimum ambient temperature. In the winter months, the global horizontal radiation and the ambient temperatures are lower than in the summer months. Therefore, the peak of 187 kWh/m2a occurs in July, and the highest average ambient temperature of 20.8 °C was measured in August, whereas the highest maximum temperature of 43.3 °C occurs in July. December is the coldest winter month with the lowest average and a minimum ambient temperature of 2.5 °C. In July and December, the highest and lowest radiation can be observed. The highest radiation and thus the highest cooling energy demand is estimated in the months of July and August, while the highest heating demand is expected to occur in the winter months December and January. In the transition periods, cooling and heating demands can alternate; this gives the WPC the potential to outperform a simple building control strategy.

3.2. Results

To evaluate the effect of the WPC, three simulation variants of light, middle, and heavy construction were each tested with and without the use of the WPC. In the simulation variant without the WPC, standard control algorithms were used. The heating and cooling system uses a common weather-dependent control for the TABS: The ventilation and sun protection system perform similarly to the WPC control, using the actual Tamb instead of the future values. Overall, the simulation variants without WPC already use an advanced control strategy to set the basis for a fair comparison. The characteristics of the heating and cooling energy demand and the over and under temperature hours (OTH; UTH) serve as the evaluation criteria for the thermal comfort performance. The subsequent Figure 8 displays the simulation results. The individual graphs are arranged in rows. The top two figures represent the light-, the second two the middle-, and the bottom two the heavyweight construction simulation variants. On the left hand side, the individual point clouds display the simulation hours in relation to the comfort band, using the operative temperature over the mean ambient temperature during the operational time. The grey point cloud outlines the standard simulation variant whereas the colored values represent the simulation variant with the WPC. The figures on the right outline the annual accumulated simulation results. The left four columns of the graphs correlate with the left y-axis outlining the heating and cooling demand with and without the WPC. The four right columns show the over and under temperature hours, connected to the right y-axis. The simulation variants with the WPC are represented by solid colored columns, while the standard control variants are represented by dashed columns.
The effect of the thermal mass on the energy and comfort performance can be seen in the simulation variants. The simulation variants with the lightweight constructions summarize the highest and excessively high over and under temperature hours, with more than 500 over and more than 150 under temperature hours. This is also visible in the correlated point clouds. This results in a lower energy demand for heating and cooling, which is associated with poorer comfort conditions. No comfort can generally be provided due to the lack of thermal mass. Even in the summer period, the cooling power is not enough to reduce the over temperature hours. The middle and heavyweight constructions fulfill the comfort requirements according to DIN EN 16798-1. Based on this and the increase in thermal mass, the energy demand for heating and cooling rises. This results in almost no over and under temperature hours; this is also visible in the point clouds. Overall it can be said that the higher the mass, the greater the comfort, but also the higher the energy requirement. These results are in line with other studies that analyze the effect of the thermal mass on energy performance and comfort [12,13].
The influence of the weather predictive control is also visible in parts of the results. Already in the light simulation variant, where comfort is not sufficiently provided, the WPC performs slightly better using less energy and resulting in fewer uncomfortable hours (although still too many). The middleweight construction simulation variants show nearly the same performance with and without the WPC. At 29.0 kWh/(m2a) the cooling demand is little less than without the WPC (31.2 kWh/(m2a)). In the heavy construction simulation variants, the cooling energy demand of the WPC is 14% lower (26.8 instead of 30.8 kWh/(m2a)). The energy demand for heating is nearly equal. Except for the cooling demand in the heavy construction, all simulation variants perform nearly alike in terms of energy demand, with or without WPC. Overall, the simulation variants with WPC have slightly lower over and under temperature hours. It is to be noted that the simulation variants without the WPC already show a semi-advanced control strategy that lowers the effect of the WPC as, e.g., a comparison with a standard ON/OFF control, as outlined in the literature review.

3.3. Evaluation

To evaluate the overall hypothesis, we answer our initially proposed research questions:
  • Is it possible to optimize the thermal comfort of a room with a WPC?
Considering the lightweight simulation variant, it is not possible to improve the thermal comfort in the simulated room, as the overall thermal comfort cannot be provided in this simulation variant. Even though the simulation variant with WPC performs better, we see no improvement in the thermal comfort, while the overall performance of the room is uncomfortable. Nevertheless, for the middle and heavy simulation variants, an improvement can be seen. In the middle simulation variant, the heating and cooling demand performs only slightly better, whereas with the heavy simulation variant, the WPC room utilizes noticeably less cooling and slightly less heating energy. Overall, an improvement in thermal comfort can be achieved but is very much dependent on the room’s environment and construction. It seems to indicate that cooling energy especially can be saved with an increased thermal mass.
  • Is it possible to generate energy savings with a WPC?
Only a small amount of energy could be saved by using the WPC instead of the weather-dependent TABS control, throughout all simulation variants. Percentagewise, the energy savings decrease along with increasing thermal mass, but still do not show significant improvements. Neither a decrease in the energetic performance nor a significant increase in energy demand can be seen with the use of a WPC, as it only slightly affects the overall energy performance of the simulated room.
The energy demand and thermal comfort of a Munich-based office building can be optimized compared to a state-of-the-art control strategy by the simple approach of a weather predictive control of inert buildings.
This overall hypothesis statement is therefore believed to partly true, as the energy performance and the thermal comfort are only slightly improved by the weather predictive control. However, in more specific detail, the thermal comfort is technically improved with the WPC while the energy performance does not decrease. The control case with the Munich-based office building narrows down the potentials of the weather predictive control to one location. The overall potential and further prospects for the WPC are summed up in the following section.

4. Discussion

To outline the main findings, this section is divided into subsections dealing with the localization, utilization, and transformation of the weather predictive control potentials. Finally, the limitations of this study are presented to prepare for the final conclusion.

4.1. Location of the Potentials

Smartphones, tablets, and computers are everywhere in modern society, and with them, the infinite possibility to access data. This is also true for weather data and weather forecasts, which people use on a daily basis to prepare themselves for the day. By a somewhat paradoxical contrast, this is not currently the case for buildings, even though their performance is mainly influenced by the local weather conditions. Therefore, the potential for a weather predictive control is unquestioned. For a variety of system configurations, this can bring a huge benefit in the energy and comfort performance of a building, especially when equipped with thermal mass, as shown in this paper. For office buildings with inert building technology, the energy savings and comfort improvement potential are present and already accessible with a simple approach such as the WPC, as outlined in this paper.

4.2. Utilization of the Potentials

Using a weather predictive control generates thermal comfort improvements, especially by reducing cooling energy demand in the summer months, and generates slight annual energy savings for heating. The simple control approach outlines state-of-the-art building technology regulation. This increases with increasing thermal mass of the building, even though there are already some comfort improvements with lightweight constructions. The results of this paper show that locations with a higher demand for cooling energy will increase the potentials of the optimized control strategy. Furthermore, locations with a higher fluctuation when switching between the heating and cooling mode, mainly within the transition periods between summer and winter, will enlarge the potential, as a standard control for TABS does not perform well during these periods.

4.3. Transformation of the Potentials

With ongoing climate change, the increasing fluctuation in power generation caused by the higher share of renewable energies, as well as with the changes in the global energy price fluctuations and uncertainties in the building control, become more frequent. This leads to higher CO2 emissions and energy prices in the operation of the building and increases the demand for local storage systems and smart building control strategies. Smart control strategies are only applicable to the majority of the building stock when the focus of the implementation is on a simple approach and detached from high-tech solutions. In a moderate climate, such as Munich, the effects can already be proven, but further investigation is needed into the holistic effects of the WPC. Various locations, with more extreme weather conditions, a fluctuating energy supply, and different building constructions, can give valuable insight into further potentials for the WPC.

4.4. Limitations

The characteristic data in this paper is based on an in situ test facility with a very exposed location. This single test case limits the statements of this paper. Common office rooms with only one outside façade, which form the majority of office rooms today, are not represented by this paper. Furthermore, the test facility with its vacuum insulation panels represents a very well insulated thermal envelope, and the window properties are of high standard too; this does not represent the current office building stock in countries such as Germany. According to this presumption, the simulation’s ventilation system severely simplifies the complex process of ventilating a room and reduces it to merely the air change rate. This may skew the findings and cause the conclusions to be misleading. To evaluate the simulation results this paper uses the parameters thermal comfort and operational energy of a building but exclude the overall energy performance of a building like, e.g., the grey energy of the building. Additional parameters, e.g., CO2, could increase the statements’ scope. The idea of under- and over temperature hours might also affect the quality of the data in the continuous process of rethinking current thermal comfort models and may result in incorrect conclusions that can be improved in future research. In addition to that, the results of the comparison are rather small, as the WPC was compared with an already advanced control strategy. As the literature review already points out, advanced control strategies such as the WPC outperform ON/OFF control strategies for TABS noticeably.

5. Conclusions

Overall, the simple concept of a weather predictive control using future ambient temperature and future radiation shows an improvement in the energy performance and slight improvements in the thermal comfort for the office building in the moderate climate of Munich. Especially in the summer months, the cooling energy demand can be reduced, in particular in buildings with increased thermal mass. It is further evident that a simple approach such as the WPC, without a huge amount of data or the computational power of an artificial intelligence, can already achieve energy savings. This consequently does not lead to rebound effects, such as an increase in energy consumption or operation costs caused by power-intense calculation algorithms, or the creation of digital twins of the building. This leads to savings that are commonly not considered in the optimization processes. Simple approaches such as trend generation using the logarithmically mitted future average, energy performance, and thermal comfort can be improved. Performing a counter-validation and applying the weather predictive control strategy in the in situ test facility would increase the quality of the data. In addition to that, a detailed representation of the energy supply for heating and cooling would increases the quality of the results. However, in general we consider the following three steps to be vital to increase the future impact of the WPC and to transform the potentials into a broader field:
  • Performing an international study to investigate the potentials in different climates;
  • Applying the concept to other use cases with higher representation in the building market;
  • Introducing a further evaluation parameter, namely CO2, to transfer the potentials to holistic energy balance.

Author Contributions

Conceptualization, C.H., L.O., S.C.K., M.G., D.B. and T.A.; methodology, C.H. and L.O.; software, C.H., L.O. and D.B.; validation, C.H., L.O., M.G. and D.B.; formal analysis, C.H., S.C.K., M.G. and D.B.; investigation, C.H., L.O., S.C.K., M.G. and D.B.; resources, C.H., L.O., S.C.K., M.G., D.B. and T.A.; data curation, C.H. and L.O.; writing—original draft preparation, C.H., writing—review and editing, C.H., L.O., S.C.K., M.G. and D.B.; visualization, C.H., L.O., S.C.K., M.G. and D.B., supervision, T.A.; project administration, C.H. All authors have read and agreed to the published version of the manuscript.

Funding

This research received no external funding.

Data Availability Statement

The data presented in this study are available upon request from the corresponding author.

Conflicts of Interest

The authors declare no conflict of interest.

Nomenclature

Variable and parameters
X future Overall predicted value of parameter(-)
a Weighting factor(-)
X t Value of parameter t time steps ahead(-)
tTime steps ahead(h)
Tambm24Average ambient dry bulb air temperature over last 24 h(°C)
ToutReturn temperature(°C)
T supply , HT Supply temperature heating (°C)
T supply , CL Supply temperature cooling(°C)
mtotTotal mass flow(kg/s)
Q sol , future Solar radiation of a future time step(W/CO2)
Tamb future Ambient dry bulb air temperature at a future time step(°C)
δ T Qsol ,   future Temperature difference caused by incoming solar radiation(°C)
m ˙ Specific mass flow(kg/s)
c w Conversion factor(K J/hm2)
P HT Heating power(W)
P CL Cooling power(W)
Top Operative temperature of a room(°C)
Tair Air temperature of a room(°C)
rad sur Radiation on surface(W/m2)
rad sur , future Radiation on surface in the future(W/m2)
fc-valueReduction factor of a sun protection device(-)
AC Air change rate(1/h)
Abbreviations
TABSThermally activated building structures
DINDeutsches Institut für Normung
PIDProportional integral derivative control
MPCModel predictive control
ANNArtificial neural networks
WPCWeather predictive control
PMVPredicted mean vote
PPDPercentage of people dissatisfied
CFDComputation fluid dynamics
VOCVolatile organic compounds
CADComputer aided design
TRNSYSTransient systems simulation
ASHRAEAmerican society heating, refrigerating and air-conditioningengineers
OTHOver temperature hour
UTHUnder temperature hour

References

  1. International Energy Agency; Global Alliance for Buildings and Construction. 2019 Global Status Report for Buildings and Construction; International Energy Agency; Global Alliance for Buildings and Construction: Paris, France, 2019.
  2. Presse- und Informationsamt der Bundesregierung. Generationenvertrag für das Klima. Available online: https://www.bundesregierung.de/breg-de/themen/klimaschutz/klimaschutzgesetz-2021-1913672 (accessed on 21 December 2022).
  3. Energieeinsparverordnung: Vom 24. Juli 2007 (BGBl. I S. 1519)]; Energieeinsparungsgesetz, Energieeinsparverordnung mit Anlagen, Bekanntmachungen, Landesrechtliche Vorschriften; [Regelungen über Energieausweise]; Textausgabe mit Ausführlichem Sachverzeichnis, 1st ed.; (dtv Beck-Texte im dtv 5775); Dt. Taschenbuch-Verl.: München, Germany, 2008.
  4. Fassbender, E.; Ludwig, F.; Hild, A.; Auer, T.; Hemmerle, C. Designing Transformation: Negotiating Solar and Green Strategies for the Sustainable Densification of Urban Neighbourhoods. Sustainability 2022, 14, 3438. [Google Scholar] [CrossRef]
  5. Fassbender, E.; Claudia, H.; Natalie, M. (Eds.) Multi-Criteria Design and Decision Support for Solar and Green Envelopes: Simplicity vs. Performance. 2021. Available online: https://pure.tudelft.nl/ws/portalfiles/portal/89352805/powerskin_proceedings_2021.pdf (accessed on 15 January 2023).
  6. Severin Beucker, S.H. Einsparpotenziale aus der Optimierung von Heizungsanlagen in Wohngebäuden. Available online: https://www.bmwk.de/Redaktion/DE/Publikationen/Energie/einsparpotenziale-aus-der-optimierung-von-heizungsanlagen-in-wohngebaeuden.pdf?__blob=publicationFile&v=6 (accessed on 21 December 2022).
  7. Schmelas, M. Entwicklung und Evaluierung Eines Adaptiv-Prädiktiven Algorithmus’ für Thermoaktive Bauteilsysteme. Ph.D. Thesis, Universitätsbibliothek Freiburg, Breisgau, Germany, 2017. [Google Scholar] [CrossRef]
  8. Jungwirth, J. Lastmanagement in Gebäuden; Technische Universität München, Diss.: München, Germany, 2015. [Google Scholar]
  9. Schmid, T.; Hepf, C.; Wagner, T.; Meile, S.; Bratoev, I.; Schubert, G.J. Dezentrale MSR: Konzeptentwicklung zur Dezentralen Mess-, Steuer- und Regelungstechnik in Gebäuden im Kontext des Internet of Things = Decentralized MCT: Design of a Decentralized Measurement and Control Technology Concept for Building Services in the Context of the Internet of Things; (Forschungsinitiative Zukunft Bau F 3160); Fraunhofer IRB Verlag: Stuttgart, Germany, 2019. [Google Scholar]
  10. Auer, T.; Hamacher, T.; Wagner, U.; Atabay, D.; de-Borja-Torrejón, M.; Dornmair, R.; Kuhn, P.; Maderspacher, J.; Sänger, F.; Laenge, J.; et al. Gebäude als Intelligenter Baustein im Energiesystem: Lastmanagement-Potenziale von Gebäuden im Kontext der Zukünftigen Energieversorgungsstruktur in Deutschland; (Forschungsinitiative Zukunft Bau F 3054); Fraunhofer IRB Verlag: Stuttgart, Germany, 2017. [Google Scholar]
  11. Hausladen, G.; Auer, T.; Schneegans, J.; Klimke, K.; Riemer, H. Lastverhalten von Gebäuden unter Berücksichtigung Unterschiedlicher Bauweisen und Technischer Systeme—Speicher- und Lastmanagementpotenziale in Gebäuden: Endbericht; (Forschungsinitiative Zukunft Bau F 2920); Fraunhofer IRB Verlag: Stuttgart, Germany, 2014. [Google Scholar]
  12. Dornmair, R.; Atabay, D.; Sänger, F.; de Borja Torrejón, M.; Maderspacher, J. Einfluss von Gebäuden als Wärmespeicher auf das Energiesystem. In 10. Internationale Energiewirtschaftstagung der TU Wien; IEWT: Vienna, Austria, 2017; Available online: https://mediatum.ub.tum.de/doc/1350554/1350554.pdf (accessed on 15 January 2023).
  13. Hausladen, G.; de Saldanha, M.; Liedl, P. ClimaDesign: Lösungen für Gebäude, die mit Weniger Technik Mehr Können, 1st ed.; Callwey: München, Germnay, 2004. [Google Scholar]
  14. Deutscher Wetterdienst. Numerical Methods. Available online: https://www.dwd.de/DE/forschung/wettervorhersage/num_modellierung/01_num_vorhersagemodelle/01a_num_methoden/numerischemethoden_node.html (accessed on 21 December 2022).
  15. Kheybari, A.G.; Alwalidi, M.; Hepf, C.; Auer, T.; Hoffmann, S. A multi-objective evaluation for envelope refurbishments with electrochromic glazing. Results Eng. 2022, 14, 100417. [Google Scholar] [CrossRef]
  16. Energetische Bewertung von Gebäuden: 1–10, 18599 1–10, 2018; Deutsches Institut für Normung e.V.: Berlin, Germany, 2022.
  17. Wärmeschutz und Energie-Einsparung in Gebäuden: 1–11, 4108, 2018; Deutsches Institut für Normung e.V.: Berlin, Germany, 2013.
  18. Hepf, C.; Bausch, K.; Lauss, L.; Koth, S.C.; Auer, T. Impact of Dynamic Emission Factors of the German Electricity Mix on the Greenhouse Gas Balance in Building Operation. Buildings 2022, 12, 2215. [Google Scholar] [CrossRef]
  19. Statistisches Bundesamt, (Destatis). Umweltökonomische Gesamtrechnungen: Energieverbrauch der Privaten Haushalte für Wohnen. Available online: https://www.destatis.de/DE/Themen/Gesellschaft-Umwelt/Umwelt/UGR/private-haushalte/Tabellen/energieverbrauch-haushalte.html (accessed on 30 January 2023).
  20. Rawal, R.; Shukla, Y.; Vardhan, V.; Asrani, S.; Schweiker, M.; de Dear, R.; Garg, V.; Mathur, J.; Prakash, S.; Diddi, S.; et al. Adaptive thermal comfort model based on field studies in five climate zones across India. Build. Environ. 2022, 219, 109187. [Google Scholar] [CrossRef]
  21. de Dear, R.; Brager, G. Developing an Adaptive Model of Thermal Comfort and Preference. Available online: https://escholarship.org/uc/item/4qq2p9c6 (accessed on 5 January 2023).
  22. Energetische Bewertung von Gebäuden—Lüftung von Gebäuden—Teil 1: Eingangsparameter für das Innenraumklima zur Auslegung und Bewertung der Energieeffizienz von Gebäuden bezüglich Raumluftqualität, Temperatur, Licht und Akustik: 1–11, 16798; Deutsches Institut für Normung e.V.: Berlin, Germany, 2022.
  23. Ivanova, Y.M.; Pallubinsky, H.; Kramer, R.; Lichtenbelt, W.V.M. The influence of a moderate temperature drift on thermal physiology and perception. Physiol. Behav. 2020, 229, 113257. [Google Scholar] [CrossRef] [PubMed]
  24. Keith, S.W.; Redden, D.T.; Katzmarzyk, P.T.; Boggiano, M.M.; Hanlon, E.C.; Benca, R.M.; Ruden, D.; Pietrobelli, A.; Barger, J.L.; Fontaine, K.R.; et al. Putative contributors to the secular increase in obesity: Exploring the roads less traveled. Int. J. Obes. 2006, 30, 1585–1594. [Google Scholar] [CrossRef] [PubMed] [Green Version]
  25. Luo, W.; Kramer, R.; de Kort, Y.; Rense, P.; Lichtenbelt, W.V.M. The effects of a novel personal comfort system on thermal comfort, physiology and perceived indoor environmental quality, and its health implications–Stimulating human thermoregulation without compromising thermal comfort. Indoor Air 2021, 32, e12951. [Google Scholar] [CrossRef] [PubMed]
  26. Schellen, L.; Lichtenbelt, W.D.V.M.; Loomans, M.G.L.C.; Toftum, J.; De Wit, M.H. Differences between young adults and elderly in thermal comfort, productivity, and thermal physiology in response to a moderate temperature drift and a steady-state condition. Indoor Air 2010, 20, 273–283. [Google Scholar] [CrossRef] [PubMed]
  27. van Marken Lichtenbelt, W.; Hanssen, M.; Pallubinsky, H.; Kingma, B.; Schellen, L. Healthy excursions outside the thermal comfort zone. Build. Res. Inf. 2017, 45, 819–827. [Google Scholar] [CrossRef] [Green Version]
  28. Kramer, R.; Schellen, H.; van Schijndel, A. Impact of ASHRAE’s museum climate classes on energy consumption and indoor climate fluctuations: Full-scale measurements in museum Hermitage Amsterdam. Energy Build. 2016, 130, 286–294. [Google Scholar] [CrossRef] [Green Version]
  29. Koth, S.C.; Kobas, B.; Bausch, K.; Auer, T. Mitigating climate change through healthy discomfort. IOP Conf. Series: Earth Environ. Sci. 2022, 1078, 12034. [Google Scholar] [CrossRef]
  30. Kobas, B.; Koth, S.C.; Nkurikiyeyezu, K.; Giannakakis, G.; Auer, T. Effect of Exposure Time on Thermal Behaviour: A Psychophysiological Approach. Signals 2021, 2, 863–885. [Google Scholar] [CrossRef]
  31. Christian, H. Energy Optimization of a Geothermal Heat-Pump System through Dynamic System Simulation: A Case Study for the International Airport Calgary. Master’s Thesis, TUM School of Engineering and Design, Chair of Building Technology and Climate Responsive Design, Technical University of Munich, München, Germany, 2018. Available online: https://mediatum.ub.tum.de/node?id=1694272 (accessed on 15 January 2023).
  32. Amato, V.; Hedegaard, R.; Knudsen, M.; Petersen, S. Room-level load shifting of space heating in a single-family house—A field experiment. Energy Build. 2023, 281, 112750. [Google Scholar] [CrossRef]
  33. Bollin, E.; Schmelas, M. TABS—Thermoaktive Bauteilsysteme: Selbstlernendes und Vorausschauendes Steuern mit AMLR; Springer Vieweg: Wiesbaden/Heidelberg, Germany, 2021. [Google Scholar]
  34. Gwerder, M.; Tödtli, J.; Lehmann, B.; Dorer, V.; Güntensperger, W.; Renggli, F. Control of thermally activated building systems (TABS) in intermittent operation with pulse width modulation. Appl. Energy 2009, 86, 1606–1616. [Google Scholar] [CrossRef]
  35. Ulpiani, G.; Borgognoni, M.; Romagnoli, A.; DI Perna, C. Comparing the performance of on/off, PID and fuzzy controllers applied to the heating system of an energy-efficient building. Energy Build. 2016, 116, 1–17. [Google Scholar] [CrossRef]
  36. Pistohl, W. Allgemeines, Sanitär, Elektro, Gas, 7th ed.; (Handbuch der Gebäudetechnik 1); Werner: Köln, Germany, 2009. [Google Scholar]
  37. Thieblemont, H.; Haghighat, F.; Ooka, R.; Moreau, A. Predictive control strategies based on weather forecast in buildings with energy storage system: A review of the state-of-the art. Energy Build. 2017, 153, 485–500. [Google Scholar] [CrossRef] [Green Version]
  38. Oldewurtel, F.; Jones, C.N.; Parisio, A.; Morari, M. Stochastic Model Predictive Control for Building Climate Control. IEEE Trans. Control Syst. Technol. 2013, 22, 1198–1205. [Google Scholar] [CrossRef] [Green Version]
  39. Zhang, X.; Schildbach, G.; Sturzenegger, D.; Morari, M. Scenario-Based MPC for Energy-Efficient Building Climate Control under Weather and Occupancy Uncertainty. In Proceedings of the 2013 European Control Conference (ECC), Zürich, Switzerland, 17–19 July 2013. [Google Scholar]
  40. Van Dronkelaar, C.; Dowson, M.; Burman, E.; Spataru, C.; Mumovic, D. A Review of the Regulatory Energy Performance Gap and Its Underlying Causes in Non-domestic Buildings. Front. Mech. Eng. 2016, 1, 17. [Google Scholar] [CrossRef] [Green Version]
  41. Doda, V. Occupants Mind the (Performance) Gap. Available online: https://issuu.com/climadesign/docs/20171114_brosch_c3_bcre_20cd_202017 (accessed on 15 January 2023).
  42. Lee, J.-Y.; Yeo, M.-S.; Kim, K.-W. Predictive Control of the Radiant Floor Heating System in Apartment Buildings. J. Asian Arch. Build. Eng. 2002, 1, 105–112. [Google Scholar] [CrossRef]
  43. Paleček, T. Controlling a Heating System Using Deep Reinforcement Learning; Bachelor Project, Faculty of Electrical Engineering, Department of Cybernetics, Technical University Prague: Prague, Czech Republic, 2018. [Google Scholar]
  44. Nagy, Á.; Kazmi, H.S.; Cheaib, F.; Driesen, J. Deep Reinforcement Learning for Optimal Control of Space Heating. arXiv 2018, arXiv:Abs/1805.03777. [Google Scholar]
  45. Hausladen, G.; Tichelmann, K. Ausbau Atlas; DETAIL—Institut für Internationale Architektur-Dokumentation GmbH & Co. KG: Munich, Germany, 2009. [Google Scholar]
  46. Hopfe, C.J. Uncertainty and Sensitivity Analysis in Building Performance Simulation for Decision Support and Design Optimization. Ph.D. Thesis, Technische Universiteit Eindhoven, Eindhoven, The Netherlands, 2009. [Google Scholar] [CrossRef]
  47. Hepf, C.; Schmid, T.; Brunet, F.; Auer, T. Validation of a Thermodynamic building Model Based on Weather and Thermal Measurement. In Proceedings of the BauSim Conference 2022: 9 Conference of IBPSA—Germany and Austria, Weminar, Germany, 20–22 September 2022. [Google Scholar] [CrossRef]
Figure 1. Availability of 537 weather stations in Germany (own representation).
Buildings 13 00996 g001
Figure 2. Effect of heating and cooling through thermal mass (own representation).
Buildings 13 00996 g002
Figure 3. Energy saving potential within the adaptive thermal comfort band (own representation based on DIN EN 16798-1 [22]).
Buildings 13 00996 g003
Figure 4. Exemplary heating and cooling curve for TABS (own representation).
Buildings 13 00996 g004
Figure 5. Graphical illustration of the concept and its individual prediction, control, and evaluation parameters (own representation).
Buildings 13 00996 g005
Figure 6. Heating scheme set-up (own representation).
Buildings 13 00996 g006
Figure 7. Cumulative global horizontal radiation and maximum, minimum, and average ambient temperatures per month measured in Munich 2020 (own representation).
Buildings 13 00996 g007
Figure 8. Simulation Results: Left column: Comfort hours with (blue) and without WPC (grey) for a lightweight (top), middle (middle) and heavy (bottom) construction; right column: Heating (red) and cooling (blue) demand and over (red) and under temperature hours (blue) with (solid color) and without (dashed) WPC (own representations).
Buildings 13 00996 g008aBuildings 13 00996 g008b
Disclaimer/Publisher’s Note: The statements, opinions and data contained in all publications are solely those of the individual author(s) and contributor(s) and not of MDPI and/or the editor(s). MDPI and/or the editor(s) disclaim responsibility for any injury to people or property resulting from any ideas, methods, instructions or products referred to in the content.

