Article

Seismic Performance Evaluation of a High-Rise Building with Structural Irregularities

1
Department of Civil Engineering, School of Architectural Engineering, Jinling Institute of Technology, 99 Hongjing Avenue, Jiangning District, Nanjing 211169, China
2
Nanjing Metro Group Co., Ltd., Nanjing 210000, China
3
Department of Civil Engineering and Environmental Management, School of Computing, Engineering and Built Environment, Glasgow Caledonian University, Glasgow G4 0BA, Scotland, UK
*
Authors to whom correspondence should be addressed.
Buildings 2022, 12(9), 1484; https://doi.org/10.3390/buildings12091484
Submission received: 23 July 2022 / Revised: 11 September 2022 / Accepted: 14 September 2022 / Published: 18 September 2022
(This article belongs to the Collection Advanced Concrete Structures in Civil Engineering)

Abstract

:
In this study, the seismic performances of a 14-storey office building in Nanjing, China, due to its plan and vertical irregularities in the structural system, were evaluated using the response spectrum method, elastic time history analysis and elastic–plastic time history analysis. In combination of these three methods, the storey drifts and elastic–plastic states of typical structural members under three levels of earthquakes were determined to verify the robustness of the structural design program. The damage states of typical structural members at some sensitive positions were estimated and evaluated under rare earthquakes. Consequently, all structural members were within the scope of elastic performances under the actions of frequent earthquakes. The maximum displacements and storey drifts satisfied the requirements of the design codes within the scope of elastic or elastic–plastic deformations. The induced damages could reach “moderate damage” states, satisfying the requirements for the expected performances by the codes. The consequences indicated that the design scheme and critical parameters for the building structure satisfied the requirements of seismic performances from the codes.

1. Introduction

Various structural systems have been proposed to provide essential functions and sufficient structural stiffnesses and strengths in construction and service. Worldwide attentions have been attracted to the seismic performances of high-rise buildings for their complications in structural stiffnesses and strengths [1,2,3,4,5]. For high-rise buildings, earthquake is one of the most serious disastrous factors and threatens their structural safety due to its large destructive potential and sudden occurrence. To resist the earthquake actions, various structural systems, e.g., shear-wall structures, connecting structures, frame-core-wall structures, etc., have been developed to achieve the desirable seismic safety of high-rise buildings [6,7,8]. For some high-rise buildings with multiple commercial functions, the first and other lower storeys are frequently designed as shopping malls, traffic passages or the daily reception halls of hotels, and the upper storeys are always designed as office rooms or departments. Therefore, larger spaces and heights are frequently required for these lower storeys, inducing the discontinuity of some vertical structural members. In order to connect the vertical structural members sufficiently, transfer storeys are designed and applied, leading to changes in the vertical load transmission paths and irregular vertical structures with uneven distributions of storey heights, stiffnesses and masses. In addition, some plan irregularities are proposed for the functional requirements of buildings, i.e., excessive concave and convex shapes. Therefore, seismic performances of transfer storeys, i.e., storey drifts, mechanical elastoplasticity, have to be paid more attention to regarding their complications in stress distributions and deformations [9,10].
Theoretical methods for seismic performance evaluations have evolved and are divided into four categories: static theory, response spectrum, dynamic theory and performance-based seismic analysis theory [11,12,13,14,15]. At present, Performance Based Seismic Design (PBSD) has been included in the design codes in various countries to enable satisfaction of the requirements of multiple-level design targets [16,17]. Several key structural parameters, i.e., load-bearing capacity, deformation, velocity and acceleration of floor slabs, energy and damage, have been applied to explore the seismic performances of building structures. At present, deformation ability and load-bearing capacity have been considered as two crucial indicators of seismic performances due to their definite physical indications, making it possible to estimate the elastic–plastic behaviours and damage states of the building structure. At present, multiple-level seismic design targets have been applied in the majority of existing international seismic codes, i.e., Eurocode 8 in Europe, ACI/ASCE in USA and the Chinese Code. To share similar design philosophies and provisions, “three-level” fortification targets are used as the seismic fortification standards in the Chinese seismic design code [18]. For structural design purposes, various parameters are utilised to predict the seismic performances of building structures, such as storey drifts and elastic–plastic load-bearing capacities of typical structural members. Due to different requirements on the elastic or plastic performances under three-level earthquakes, i.e., frequent earthquakes, moderate earthquakes and rare earthquakes, different seismic evaluation methods have been used to predict the seismic performances of building structures. In general, the response spectrum method is used to predict the seismic responses under frequent and moderate earthquakes. To improve the prediction accuracy, elastic and elastic–plastic evaluation methods are used as essential supplements for the response spectrum method.
The main aim of this research was to conduct a case study on the seismic performances of a high-rise building with structural irregularities and transfer storeys. Performance-based seismic evaluation methods were applied to assess the rationality of the structural design scheme. By combining the response spectrum, the elastic time history and elastic–plastic time history methods, the seismic performances of a 14-storey high-rise building was evaluated under three different levels of potential earthquakes. Focused on the seismic performances of the transfer storey, the effect and efficiency of the transfer scheme using strengthened frame beams to transfer the upper-storey wall loading to the lower-storey frame columns were checked and confirmed.

2. Description of the Project

2.1. Scheme of Structural Design

As shown in Figure 1, there are thirteen high-rise buildings connected by a two-storey chassis structure in Qixiashan Depot of Metro Line 6 in Nanjing, China. The two-storey chassis structure was divided into thirteen segments by structural joints, each being connected with one of the thirteen high-rise buildings, respectively. A 14-storey office building, named as G1, was among these buildings and had a total height of 66.35 m.
Figure 2 illustrates the layout of this 14-storey building. As shown in the figure, the building is composed of four main structural parts: the first storey with a height of 9.0 m, the second storey with a height of 5.5 m for parking, the third storey with a height of 6.15 m and the remaining 11 storeys with a storey height of 3.9 m.
A frame structure was utilised to model the first and second storeys of Building G1, and a frame-shear wall structure was utilised to model the remaining storeys of the building. To connect the two different types of building structure, the second storey was treated as the transfer storey by using several strengthened frame beams to distribute the wall loading of the upper storeys to the frame columns in the lower storeys. Plan views of the first and second storeys of Building G1, as well as the standard plan view of the other twelve storeys, are illustrated in Figure 3. The typical geometric dimensions and concrete material grades of the frame structure and frame-shear wall structure are shown in Table 1 and Table 2, respectively. In Table 2, the concrete material grade was described by the standard concrete design strength. For instance, C50 indicated that the standard concrete design strength is 50 MPa. Due to the complexity of the numerical simulation, the interactions between the upper structures and the foundations were not considered in this study.

2.2. Seismic Design Parameters

A seismic fortification intensity of 7.0 degrees was applied, where the basic peak seismic acceleration was 0.10 g and the design earthquake group category was Group 1. In addition, the site category of Class III was applied, where the characteristic periods were 0.45 s for small and moderate earthquakes and 0.50 s for major earthquakes, respectively. The values of the maximum horizontal seismic influence coefficient αh,max were applied as 0.08 for frequent earthquakes, 0.23 for moderate earthquakes and 0.50 for rare earthquakes. The maximum value of the vertical seismic influence coefficient αv,max was applied as 0.65αh,max [16].
The structural irregularities of Building G1 were evaluated and are shown in Table 3. As shown in the table, Building G1 possessed five types of structural irregularities, including torsion irregularity, large eccentricity, concave and convex irregularity, vertical dimension mutation, and vertical member discontinuity. Therefore, seismic evaluations had to be conducted using multiple seismic analysis methods, including the seismic response spectrum method, elastic time history analysis method and elastoplastic time history analysis method. The design objectives of the seismic performances under three seismic categories are shown in Table 4.

2.3. Calculation Procedure

Seismic performance evaluations were conducted and are presented as follows.
(i)
The response spectrum analysis and elastic time spectrum analysis were first carried out using two commercial software packages for comparisons and calibrations. The mode-superposition response spectrum method was used to predict the seismic responses, and the Complete Quadratic Combination (CQC) method was used to determine the vibration modes and obtain the bidirectional seismic responses.
(ii)
According to the seismic-performance design targets of typical structural members, the stresses of the transfer columns and beams were calculated and checked against the requirements of elastic responses under moderate earthquakes and unyieldingness under rare earthquakes. In addition, the stresses of the floor slabs were checked to ensure the integrity of the flooring structures in the moderate earthquakes. If the stresses were larger than the cracking stress, the flooring structures would have to be enhanced.
(iii)
The elastic–plastic time history analysis was carried out to obtain the damage distributions and damage levels of typical structural members, where the storey drifts were calculated under rare earthquakes to verify the anti-collapse capacities by comparing the drift values to the corresponding limit value of 1/120.

3. Seismic Performances under Frequent Earthquakes

3.1. Numerical Models

In the numerical modelling, the beams and columns of the frame structure were simulated using 1D beam elements that sustained axial, bending and shear stresses, and the floors and shear walls were simulated by using 2D shell elements. To ensure the validities of the numerical models, two commercial software packages, PKPM and Midas Building, were used for the structural modelling. The typical parameters of two numerical models are shown in Table 5.

3.2. Response Spectrum Analysis

The results from the response spectrum analysis are listed in Table 6. As shown in the table, the participating masses of all vibration modes from both numerical models were greater than 90% of the total mass, and the numerical results agreed well between the two software packages. It is also shown from the table that all the parameters of the building structure, i.e., the period ratio, shear-weight ratio, stiffness-weight ratio, storey drifts and displacement ratio, satisfied the requirements of the seismic design code [19]. It was noted that the storey drift of the upper storey of the transfer structure was no more than 1.15 times those of the lower storeys. The previous calculation results also showed that the structural design scheme had favourable structural regularity, mechanical uniformity, small torsion deformation and good continuity of stiffness.
Figure 4 presents the shapes of the first three vibration modes of the building structure. As shown in the figure, the first two vibration modes were the bending or translational modes in the X and Y directions, and the third vibration mode was the torsional mode. In addition, as the torsional vibration period was smaller than 0.9 times the first bending vibration period, this structure was not considered to be particularly irregular.
Three parameters for the lowest four storeys, i.e., the lateral stiffness ratio (γst), the equivalent shear stiffness ratio of the transfer storey (γe) and the shear-bearing capacity ratio (γsh), were calculated and are shown in Table 7. As shown in the table, the minimum values of γst and γe were 1.02 and 0.78, both greater than the code recommended values of 0.9 and 0.5, respectively. The minimum value of γsh was 0.81, satisfying the requirement of being larger than 0.65 [17].
Table 8 shows the calculation results of the overturning moments of typical structural members. As shown in the table, the overturning moments of the frame columns were greater than 50% but less than 80% of the total overturning moments of the building structure, so the superstructure could be designed as a frame-shear wall structure.

3.3. Elastic Time History Analysis

The elastic time history analysis method was applied to compare the results with those using response spectrum analysis. In this section, seven ground-motion waves were selected to determine the corresponding structural responses. In these seven waves, there were five natural ground-motion waves and two artificial ground-motion waves. The typical parameters of these seven ground-motion waves are listed in Table 9. As shown in the table, the maximum accelerations of the seven curves were all 35 gal, and the minimum duration was more than 20 s.
Figure 5 illustrates the spectra of the seismic influence coefficients of the seven ground-motion waves. As shown in the figure, the average spectrum curve of the seven waves agreed well with the spectrum curve obtained using the response spectrum analysis recommended by the code [16]. To assess the rationality of each wave, the corresponding periods of the first three vibration modes for each wave were compared with those from the code-recommended spectrum curve, and the variation ratios of the vibration periods were calculated by dividing the corresponding periods by the periods from the code-recommended spectrum curve. The calculation results of the variation ratios of the periods are shown in Table 10. As shown in the table, the variations of the period ratios between the individual waves and the code-recommended spectrum curves were below 20%.

3.4. Comparison Analysis

The shear forces between storeys were calculated by using two methods, i.e., the response spectrum method and the elastic time history method. A method named as Complete Quadratic Combination (CQC) was also used to obtain the characteristic bottom shear forces from the calculation results by using the response spectrum method [20]. Table 11 shows the calculation results of the bottom shear forces in two directions by the two methods. To compare the calculation results between the two methods, the ratios of the bottom shear forces by the two methods were calculated and are listed in the table, i.e., γx in the X direction and γy in the Y direction. As shown in the table, the bottom shear forces calculated by the individual waves were greater than 65% but less than 135% of those calculated by the CQC method. The average values of the bottom shear forces calculated for the seven waves were greater than 80% but less than 120% of the one calculated by the CQC method. The results indicated that all the shear forces between the storeys calculated using the response spectrum method were greater than those calculated using the elastic time history method.

4. Seismic Performances under Moderate Earthquakes

4.1. Horizontal Displacements

The response spectrum method was first used to determine the seismic responses of the building structure under moderate earthquakes, where the maximum seismic influence coefficient and the characteristic period were defined as 0.23 and 0.45 s, respectively. As cracks were allowed to occur under the actions of moderate earthquakes, the structural damping ratio and periodic reduction coefficient of the structural model were assumed as 0.06 and 0.85.
Due to the large scale of the podium building and the small stiffness of the bottom frame structure, the maximum displacements had to be checked under the actions of moderate earthquakes. To consider the influence of the podium building on the displacements of the tower building, two structural models, i.e., the global model with the whole podium building and the local model with part of the podium building, were created to determine the horizonal displacements of the building structure. In the local model, the constraint from the lower storeys on the upper tower buildings was assumed to be fixed for the sufficient stiffness of the lower structures.
The horizonal displacements of the two structural models were determined and are shown in Figure 6. As shown in the figure, the maximum horizonal displacements under moderate earthquakes were determined as 125.3 mm and 119.1 mm by the global and partial models, respectively. In addition, the maximum horizonal displacement occurred near the middle-height storey of the tower building. The calculation results of the horizontal displacements indicated that a seismic joint with a width of 300 mm could satisfy the requirement of structural collision prevention.

4.2. Seismic Performances of the Columns

Under the actions of moderate earthquakes, the bending and shear elastic responses of the transfer columns had to be achieved to prevent premature failure of the transfer columns. The shear elasticity and bending unyieldingness of the vertical components had to be achieved for the frame columns of the podium building and the vertical components of the tower building. The shear-compression ratio was used to verify the shear elasticity by dividing the shear force by the axial compression force. The calculated maximum shear-compression ratios are listed in Table 12. It can be seen from the table that the shear-compression ratios of all typical columns were smaller than the limit values of the code, indicating that shear elasticity of the columns could be achieved.

4.3. Seismic Performances of the Beams and Floor Slabs

The shear and bending elasticities of the transfer beams on the second transfer floor were required under the actions of moderate earthquakes. The shear-compression ratio was used to verify both shear and bending elasticities. Table 12 presents the maximum shear-compression ratios of all transfer beams and shows that the shear and bending elasticities could be achieved, far below the limit values of the code.
Under the actions of moderate earthquakes, the floor slabs sustained larger in-plane stresses, and cracks could happen, seriously inducing the invalidation of the floor slabs and the uneven forces of typical structural members. Therefore, the stresses in the floor slabs had to be checked at typical positions to prevent the occurrence of penetrating cracks. In this section, the floor slabs in the transfer storey and between the 5th and 8th storeys sustained profile changes. Figure 7 illustrates the stress distributions of these floor slabs in the X and Y directions, respectively. As shown in the figure, the normal stresses of the floor slabs in most areas were relatively small, less than the standard value of the concrete tensile strength. Therefore, it could be considered that there were no penetrating cracks in the floor. However, the stress concentrations occurred around the local holes because of the openings on the floor slab, and then the floor slab around the hole was thickened to 350 mm. Meanwhile, the floor slab in this area was reinforced with double-layer bidirectional reinforcing steel bars, and the reinforcing bars were evaluated according to the stress analysis results to ensure that the reinforcement stress in the concrete floor slab would not reach the yield strength under the actions of moderate earthquakes.

5. Seismic Performances under Rare Earthquakes

5.1. Response Spectrum Analysis

Rare earthquakes have extensive destructivity and are multiple times larger than frequent earthquakes [21]. According to the code, the critical structural members of the supporting frames had to satisfy the requirements of shear and bending unyieldingness under the actions of rare earthquakes. Response spectrum analysis was first carried out to determine the seismic responses under rare earthquakes. In the numerical modelling, the mass reduction coefficient of the live load, the structural damping ratio and the characteristic period were defined as 0.5, 0.07 and 0.50, respectively. In addition, the maximum values of the influence coefficient and period reduction coefficient were defined as 0.50 and 1.00, respectively.
As mentioned above, the global and local models were used to calculate the seismic responses of the transfer columns and beams, which are listed in Table 13. As shown in the table, the maximum shear-compression ratios were within the scope of the limit values, indicating that all the structural members could satisfy the seismic performance targets under rare earthquakes. In addition, there were no huge differences between the calculation results from the global and partial models.

5.2. Elastic–Plastic Time History Analysis

The elastic–plastic time history analysis was carried out to verify the collapse resistance of the building structure and the damage levels of typical structural members. The collapse resistance was defined by comparing with the limit value of the storey drift (1/120) recommended by the design code, and the damage situation was estimated by the compression or tensile damage factor of the concrete and the degrees of plastic strains of the reinforcing steel bars [22]. In this section, two natural waves and one artificial wave in two directions were selected to carry out the elastic–plastic time history analysis under the rare earthquakes. The peak ratio between the primary and secondary seismic waves was selected as 1:0.85, the duration of the seismic wave was no less than 5~10 times the first period of the structure and the peak value of the main direction seismic wave was 220 Gal. The parameters of the three indicated ground-motion waves are shown in Table 14.
Figure 8 presents the response spectrum curves of the three selected waves, where the code-recommended response spectrum is also illustrated in the figure. As shown in the figure, the response spectra of the three waves fitted well with the code-recommended response spectrum, indicating that the three ground-motion waves could satisfy the requirements from the design code. The differences of the response spectra were calculated for the first three vibration periods, i.e., T1, T2 and T3, respectively, and are listed in Table 15. It can be seen from the table that the largest difference was −19.75%, where the average differences for T1, T2 and T3 were −0.72%, −4.96% and −7.45%, respectively.
As the shear capacities of the critical structural members were designed using the response spectrum method, bottom shear forces were applied to compare the calculation results from both the response spectrum analysis and the elastic–plastic time history analysis. The comparison results are listed in Table 16. As shown in the table, the calculation results of the bottom shear forces by the elastic–plastic time history method were smaller than those by the response spectrum method, satisfying the design requirements for the seismic performances.
The storey drifts were calculated under the actions of the three indicated earthquake waves and are presented in Figure 9. As shown in the figure, the maximum values of the storey drifts occurred in the 10th and 8th storeys in the X and Y directions, respectively. Table 17 presents the maximum values of the storey drifts under the three indicated earthquake waves. As shown in the table, the biggest storey drifts were 1/142 and 1/151 in the X and Y directions, respectively, which are lower than the code-recommended limit value of 1/120.

6. Conclusions

Under the actions of earthquakes, high-rise building structures with podium buildings suffered from collapse failure or severe damage on the bottom and transfer storeys. In this study, the seismic performances of a 14-storey high-rise building with structural irregularities and transfer floors under frequent, moderate and rare earthquakes were evaluated, and the following conclusions can be drawn.
  • Under the actions of frequent earthquakes, all the structural members were within the scope of elasticity. The horizontal storey drifts were much smaller than the limit values set by the code. The calculation results of the bottom shear forces by the elastic time history method were smaller than those by the response spectrum method. The bottom shear forces calculated for the individual time history curves were larger than 65% but smaller than 135% of those calculated by the CQC method. The average bottom shear forces calculated by using the multiple time history curves were larger than 80% and smaller than 120% of those calculated by the CQC method, which met the requirements of the code.
  • The maximum horizontal displacement under the actions of moderate earthquakes was 125.3 mm and did not occur in the podium building, indicating that the width of the seismic joint could be set as 300 mm [18]. In addition, the bending and shear elasticities of the transfer columns and beams could be reached under the actions of moderate earthquakes. The frame columns in the first and second storeys and the vertical structural members in the third and fourth storeys satisfied the requirements of the shear elasticity and bending unyieldingness.
  • Under the actions of rare earthquakes, the maximum storey drifts were 1/142 and 1/151 in the X and Y directions, respectively, which were much smaller than the code limit of 1/120. Most of the vertical structural members sustained smaller damages than “mild damage” and could reach the expected performance levels, and only a few pillars sustained “moderate damage”. The transfer beams and transfer columns were slightly damaged under rare earthquakes and could reach the expected performance levels. The damage could reach the “moderate damage” states, satisfying the requirements of the expected seismic performances by the code.
  • Various structural schemes were proposed to transfer the upper-storey wall loading to the lower-storey columns. The applied scheme using beam transferring mechanism proved to be effective and efficient for a high-rise building over 50.0 m in the east part of China, where the composite structure combining concrete wall and frame structures is frequently applied and recommended. Consequently, the recommended scheme has made it possible to satisfy the seismic and functional requirements in the building design.
The research could be useful for the design of high-rise buildings with structural irregularities or functional changes, especially in highly seismic regions, and it can be generalised and applied in the design stage of similar types of buildings. In the future, the structural scheme to resist the actions of earthquakes in highly seismic regions has to be researched and discussed. With the increase of the seismic intensity, the applicability of the structural scheme has to be explored and confirmed, and the details of the structural scheme have to be strengthened and enhanced.

Author Contributions

Conceptualization, H.J., Y.S., X.C., S.L. and B.Z.; data curation, H.J., X.C. and S.L.; formal analysis, H.J. and Y.S.; funding acquisition, H.J., Y.S. and B.Z.; investigation, H.J., Y.S., X.C., S.L. and B.Z.; methodology, H.J., Y.S. and B.Z.; resources, H.J., X.C. and S.L.; software, H.J. and Y.S.; supervision, H.J., Y.S. and B.Z.; validation, H.J., Y.S. and B.Z.; visualization, H.J., Y.S. and B.Z.; writing—original draft, H.J., Y.S. and B.Z.; writing—review and editing, H.J., Y.S. and B.Z. All authors have read and agreed to the published version of the manuscript.

Funding

The Jiangsu Natural Science Foundation with Grant No. BK20211003, the Project of the Six Talent Peaks in Jiangsu Province with Grant No. jz-062, the Natural Science Fund for Colleges and Universities in Jiangsu Province with Grant No. 17KJB560004, the Jinling Institute of Technology High-Level Personnel Work Activation Fee to Fund Projects with Grant No. jit-b-201614, and the Jinling Institute of Technology High-level Personnel Work Activation Fee to Fund Projects with Grant No. jit-b-201608.

Data Availability Statement

The data used to support the findings of this study are included within the article.

Acknowledgments

This project is supported by Department of Civil Engineering in the School of Architectural Engineering at Jinling Institute of Technology in Jiangsu Province, China, Nanjing Metro Group Co., Ltd. in Jiangsu Province, China, and the School of Computing, Engineering and Built Environment at Glasgow Caledonian University, Scotland, UK.

Conflicts of Interest

The authors declare that there is no conflict of interest regarding the publication of this paper.

Nomenclature

Frequent earthquakesEarthquakes with 50-year exceedance probabilities of 63%.
Minor damageSome bearing members have slight cracks, and some non-load-bearing members have obvious damage, and no repair or only minor repairs are required.
Moderate damageMost load-bearing specimens have sight cracks, minor load-bearing specimens have obvious cracks, and minor repairs are required.
Moderate earthquakesEarthquakes with 50-year exceedance probabilities of 10%.
Rare earthquakesEarthquakes with 50-year exceedance probabilities of 2% to 3%.
Seismic influence coefficientThe ratio of the maximum ground acceleration to the acceleration of gravity during an earthquake.
Seismic reduction coefficientThe maximum ratio of shear forces between adjacent storeys.
Shear-compression ratioRatio of the average shear stress to the design value of the axial compressive strength of concrete.
Transfer storeyUsed to convert the upper shear wall into the lower frame to create a larger internal space for the lower storey.

References

  1. Yang, T.Y. Assessing seismic risks for new and existing buildings using performance-based earthquake engineering (PBEE) methodology. In Handbook of Seismic Risk Analysis and Management of Civil Infrastructure Systems; Woodhead Publishing Limited: Sawston, UK, 2013; pp. 307–333. [Google Scholar] [CrossRef]
  2. Zhou, C.; Tian, M.; Guo, K. Seismic partitioned fragility analysis for high-rise RC chimney considering multidimensional ground motion. Struct. Des. Tall Spec. Build. 2019, 28, e1568.1–e1568.14. [Google Scholar] [CrossRef]
  3. Xiong, H.; Chen, J.; Ventura, C. Seismic fragility analysis of a high-rise concrete-wood hybrid structural system. In Proceedings of the 17th World Conference on Earthquake Engineering, Sendai, Japan, 13–18 September 2020. [Google Scholar]
  4. Lu, Z.; He, X.; Zhou, Y. Performance-based seismic analysis on a super high-rise building with improved viscously damped outrigger system. Struct. Control. Health Monit. 2018, 25, e2190. [Google Scholar] [CrossRef]
  5. Zhang, S.; Zhou, J.; Hao, Y. Seismic vulnerability analysis of high-rise composite frame concrete tube composite structure. IOP Conf. Ser. Earth Environ. Sci. 2020, 455, 012010. [Google Scholar] [CrossRef]
  6. Jiang, X.; Liu, W.; Yang, H.; Zhang, J.; Yu, L. Study on dynamic response characteristics of slope with double-arch tunnel under seismic action. Geotech. Geol. Eng. 2021, 39, 1349–1363. [Google Scholar] [CrossRef]
  7. Kim, T.-H.; Lee, H.-M.; Kim, Y.-J.; Shin, H. Performance assessment of precast concrete segmental bridge columns with a shear resistant connecting structure. Eng. Struct. 2010, 32, 1292–1303. [Google Scholar] [CrossRef]
  8. Taslimi, A.; Tehranizadeh, M.; Shamlu, M. Seismic fragility analysis of RC frame-core wall buildings under the combined vertical and horizontal ground motions. Earthq. Struct. 2021, 20, 175–185. [Google Scholar]
  9. Jeong, S.-H.; Mwafy, A.M.; Elnashai, A.S. Probabilistic seismic performance assessment of code-compliant multi-story RC buildings. Eng. Struct. 2012, 34, 527–537. [Google Scholar] [CrossRef]
  10. Lee, D.-G.; Choi, W.-H.; Cheong, M.-C.; Kim, D.-K. Evaluation of seismic performance of multistory building structures based on the equivalent responses. Eng. Struct. 2006, 28, 837–856. [Google Scholar] [CrossRef]
  11. Vijayan, V.; Santhi, M.H.; Mohan, R. Seismic performance of high rise buildings with different types of shear wall. IOP Conf. Ser. Mater. Sci. Eng. 2020, 936, 012055. [Google Scholar] [CrossRef]
  12. Georgantzia, E.; Nikolaidis, T.; Katakalos, K.; Tsikaloudaki, K.; Iliadis, T. Dynamic Performance Analysis by Laboratory Tests of a Sustainable Prefabricated Composite Structural Wall System. Energies 2022, 15, 3458. [Google Scholar] [CrossRef]
  13. Akiyama, H. Earthquake Resistant Limit State Design for Buildings; University of Tokyo Press: Tokyo, Japan, 1985. [Google Scholar]
  14. Jankowski, R. Pounding force response spectrum under earthquake excitation. Eng. Struct. 2006, 28, 1149–1161. [Google Scholar] [CrossRef]
  15. Jiang, J. Comparative study on performance-based seismic design method and capacity-based seismic design method. Struct. Eng. 2008, 24, 25–52. [Google Scholar]
  16. FEMA-273; Building Seismic Safety Council. NEHRP Guideline for the Seismic Rehabilitation of Buildings. Federal Emergency Management Agency: Washington, DC, USA, 1997.
  17. NZS 3101; Concrete Structures Standard: Part 1: The Design of Concrete Structures. Standards New Zealand: Wellington, New Zealand, 2006.
  18. GB 50011-2010; Code for Seismic Design of Buildings. Ministry of Housing and Urban-Rural Development of the People’s Republic of China (MHURD-PRC): Beijing, China, 2010. (In Chinese)
  19. JGJ 3-2010; Technical Specification for Concrete Structures of Tall Buildings. Ministry of Housing and Urban-Rural Development of the People’s Republic of China (MHURD-PRC): Beijing, China, 2010. (In Chinese)
  20. Zhou, X.Y.; Yu, R.F.; Dong, L. The complex-complete-quadratic-combination (CCQC) method for seismic response of non-classically damped linear MDOF system. In Proceedings of the 13th World Conference on Earthquake Engineering, Vancouver, BC, Canada, 1–6 August 2004. [Google Scholar]
  21. D’Angela, D.; Magliulo, G.; Cosenza, E. Seismic damage assessment of unanchored nonstructural components taking into account the building response. Struct. Saf. 2021, 93, 102126. [Google Scholar] [CrossRef]
  22. Scislo, L. High activity earthquake swarm event monitoring and impact analysis on underground high energy physics research facilities. Energies 2022, 15, 3705. [Google Scholar] [CrossRef]
Figure 1. 
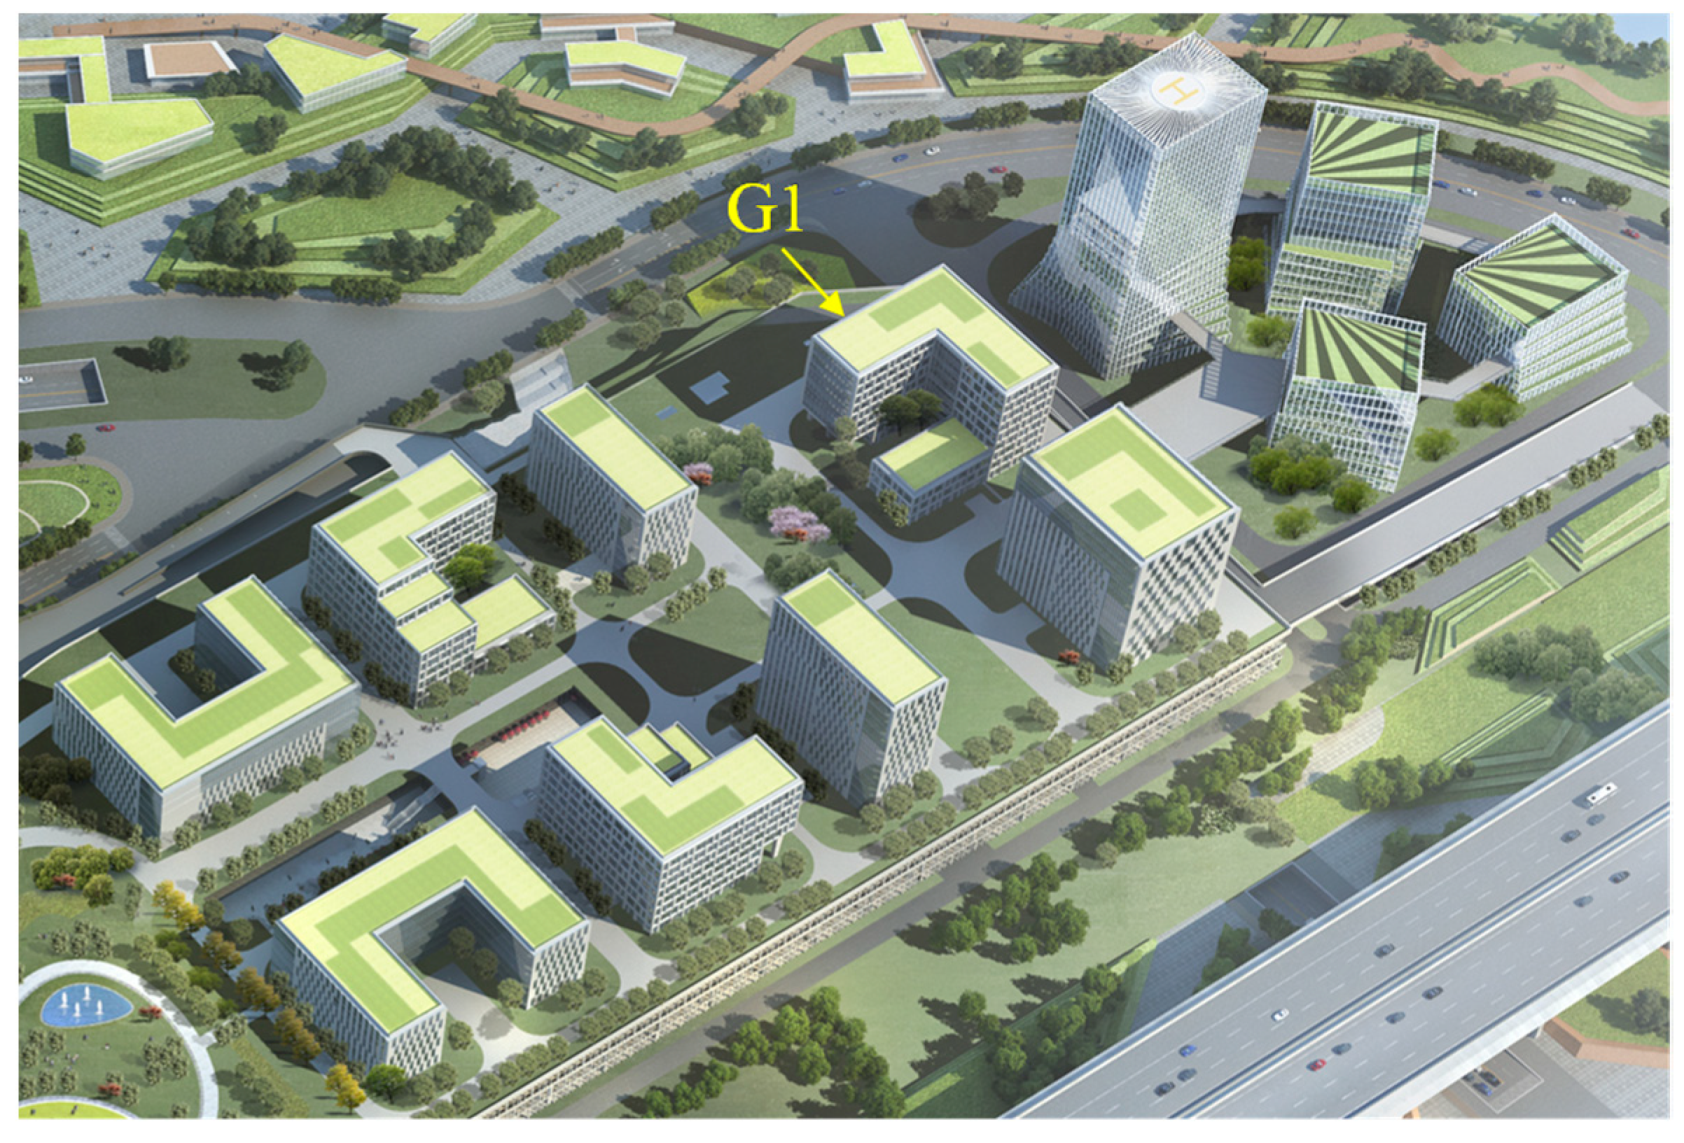
Bird’s eye view of the indicated thirteen high-rise buildings.
Buildings 12 01484 g001
Figure 2. 
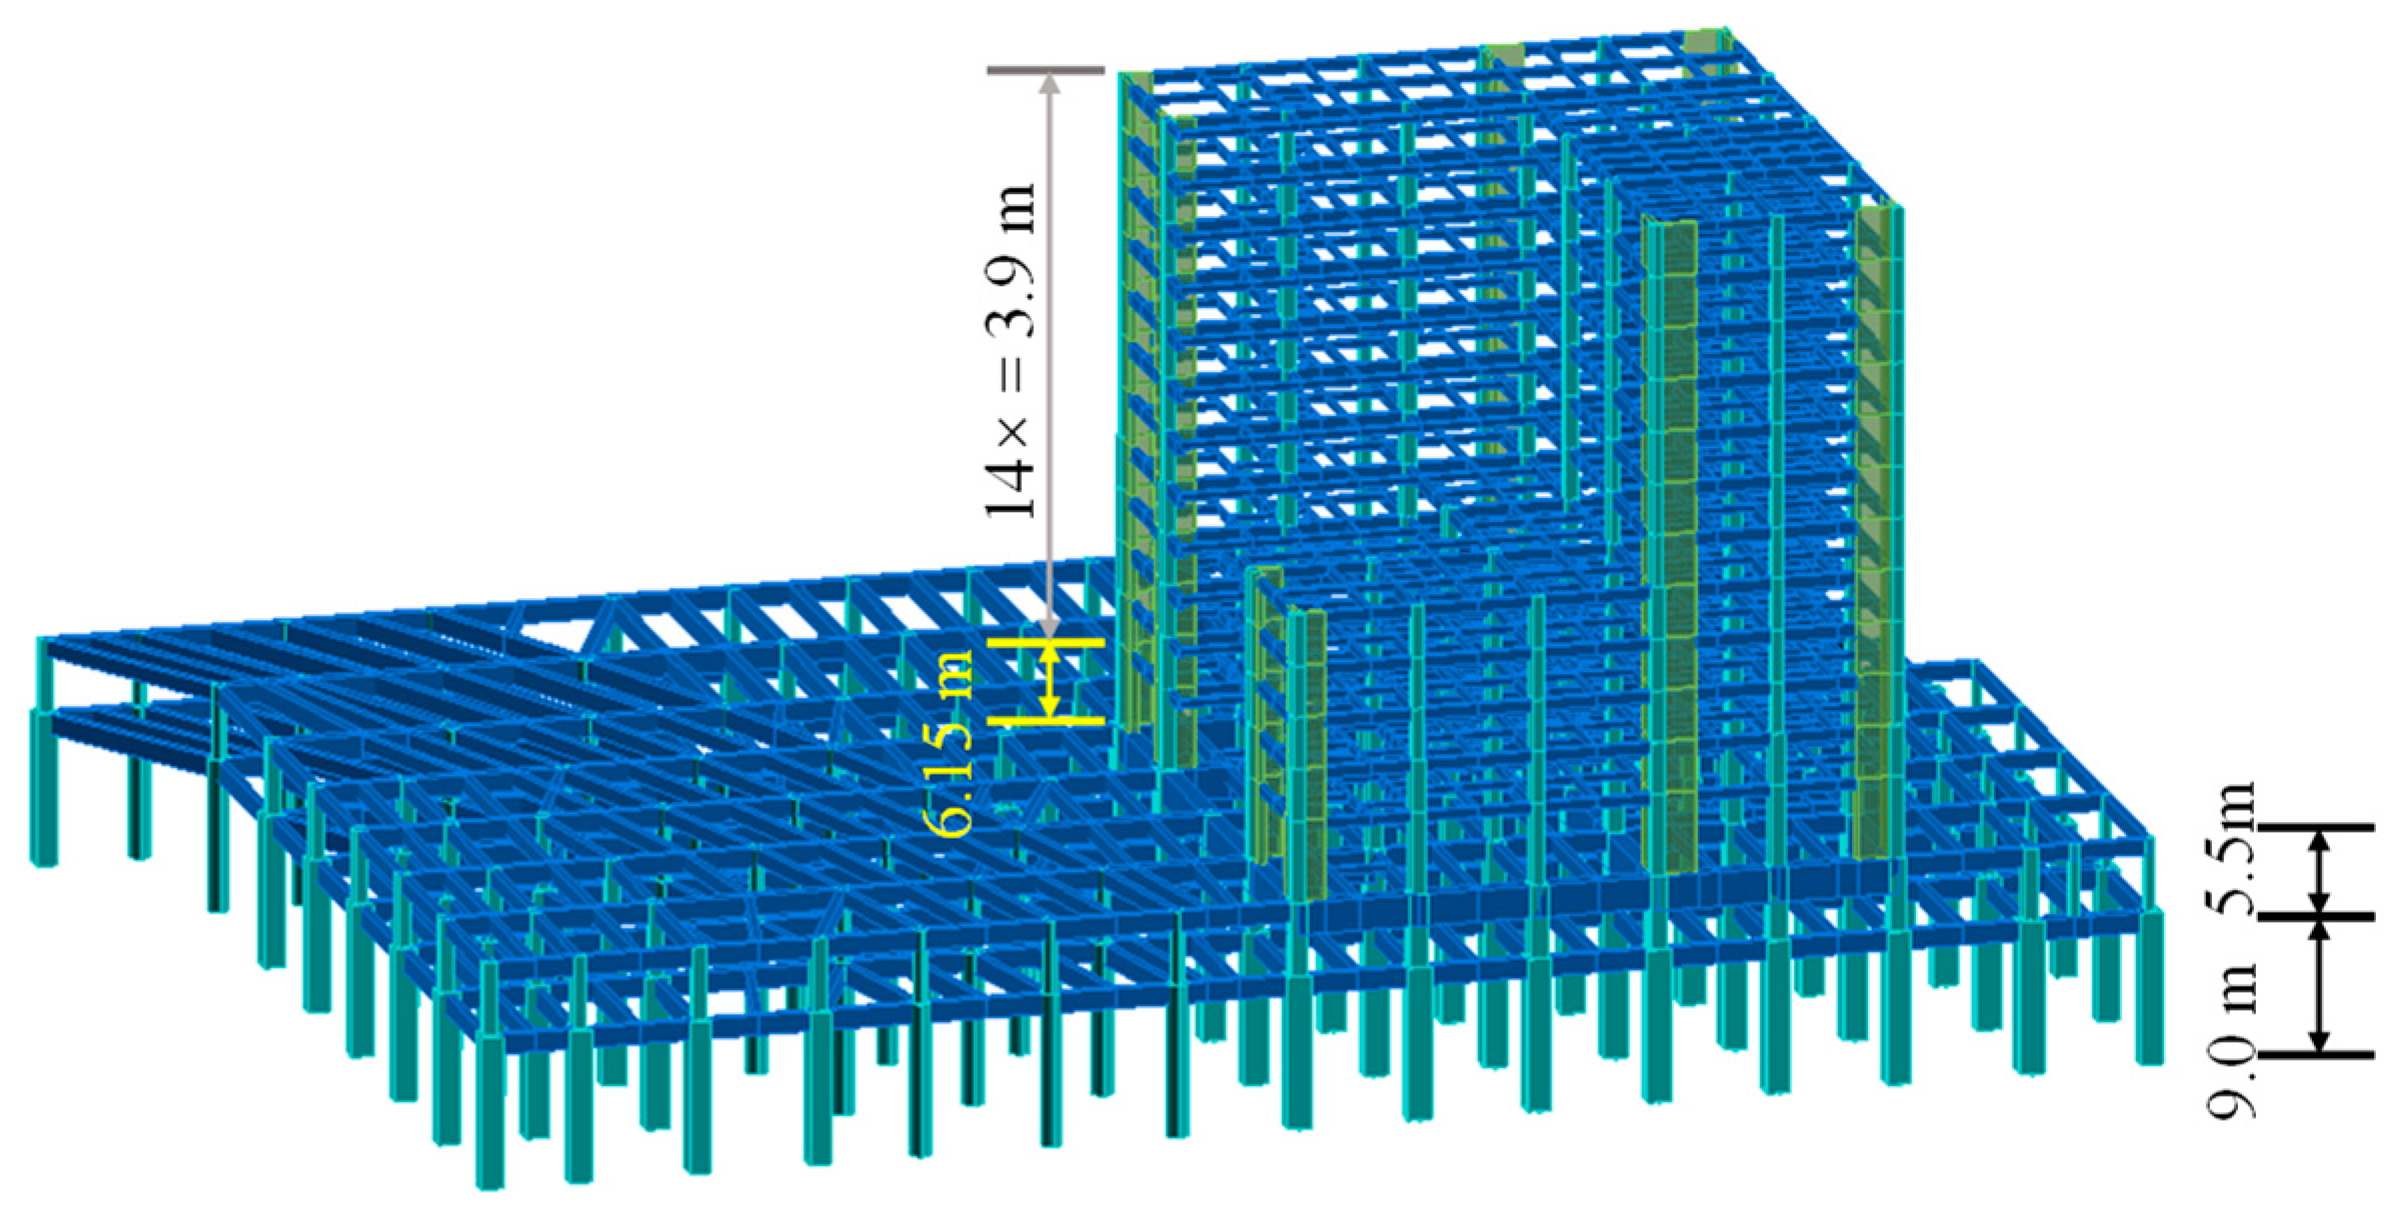
Layout of the 14-storey Building G1.
Buildings 12 01484 g002
Figure 3. 
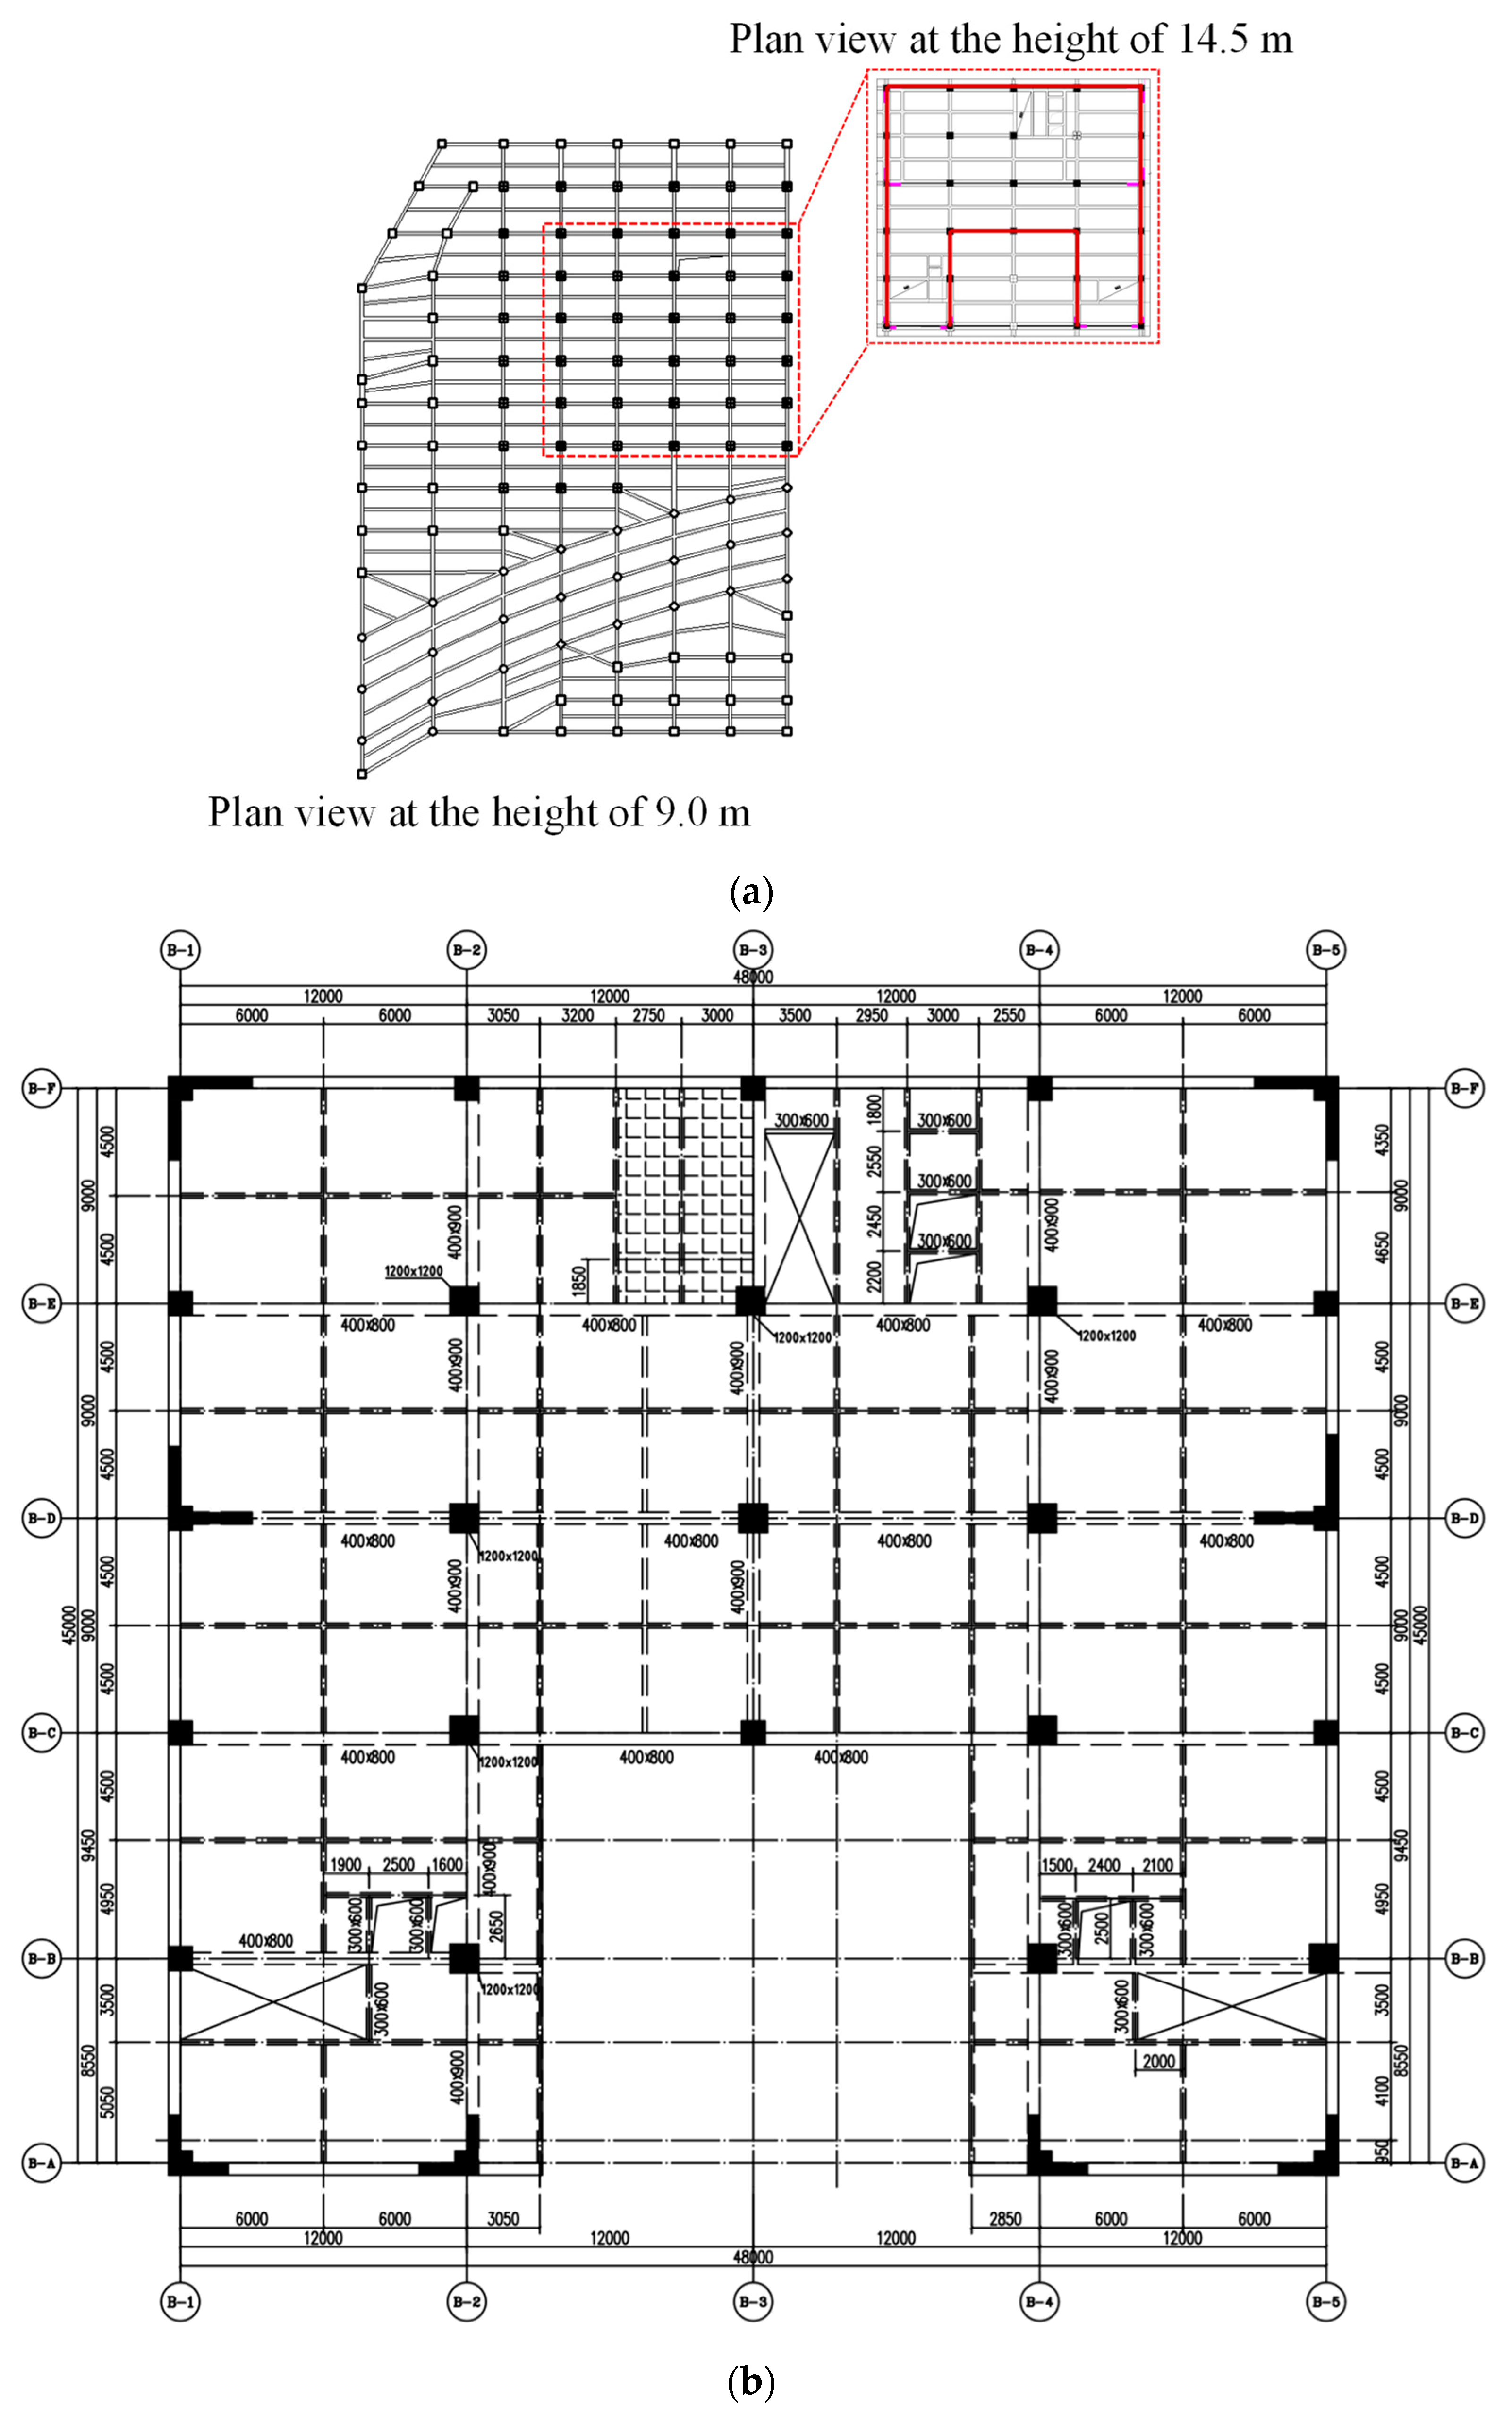
Different plan views of the fourteen-storey Building G1. (a) Plan views at the heights of 9.0 m and 14.5 m. (b) Plan views of other storeys.
Buildings 12 01484 g003
Figure 4. The first three vibration modes. (a) Vibration mode 1. (b) Vibration mode 2. (c) Vibration mode 3.
Buildings 12 01484 g004
Figure 5. 
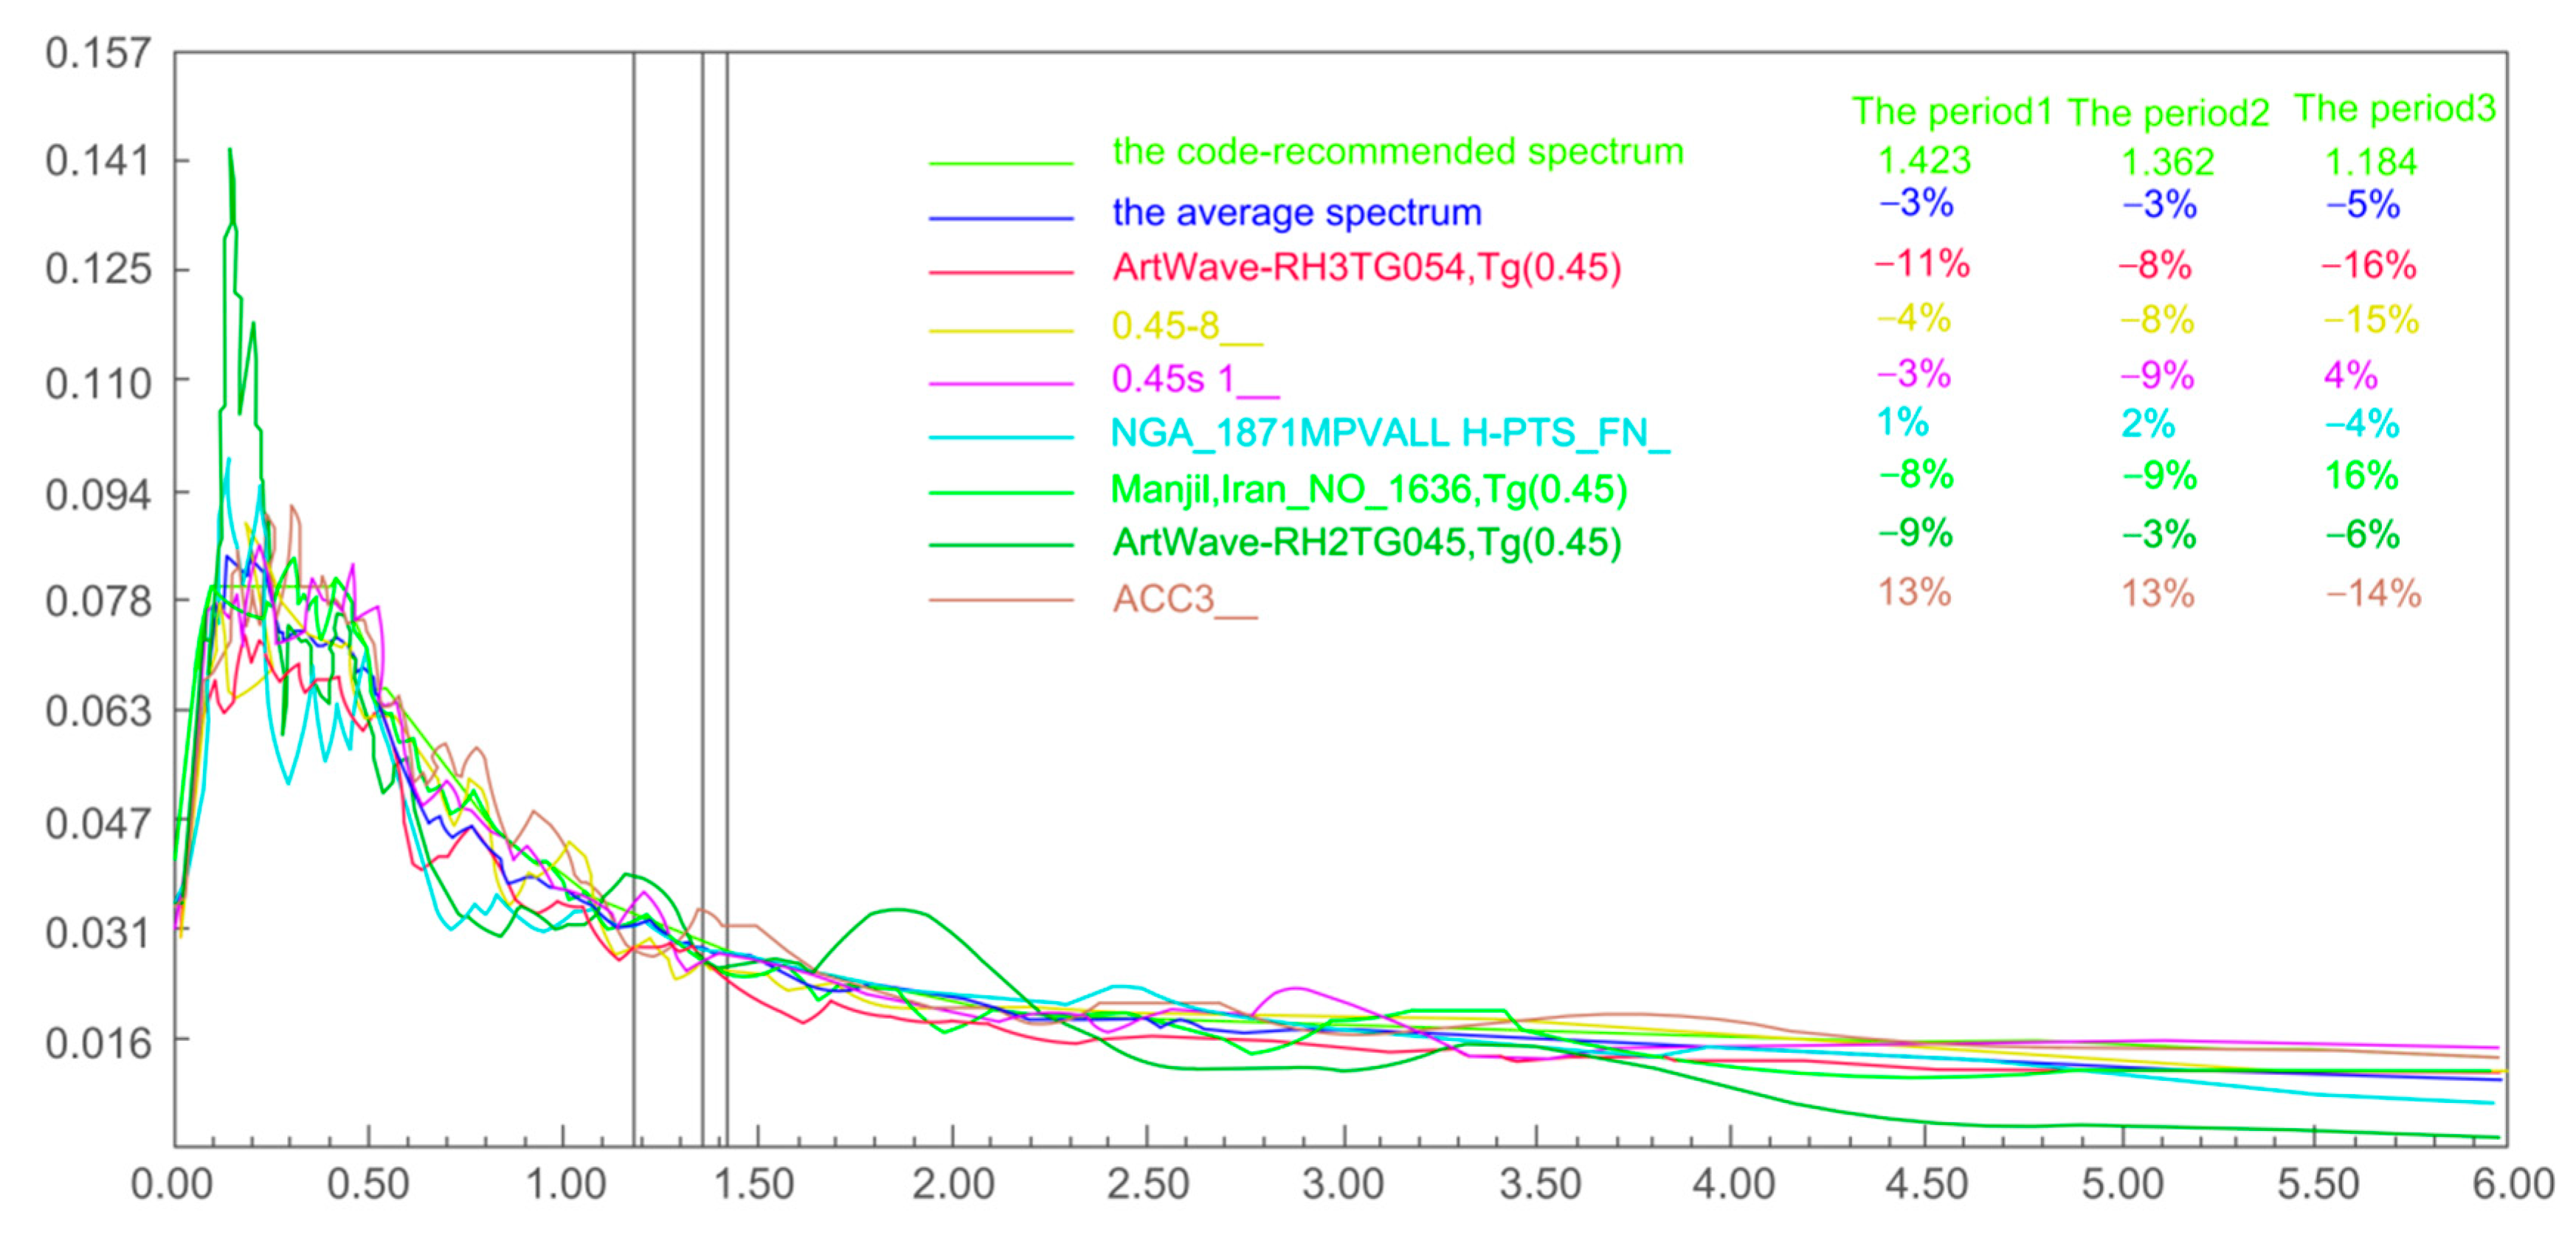
Spectra of the seismic influence coefficients of the seven ground-motion waves.
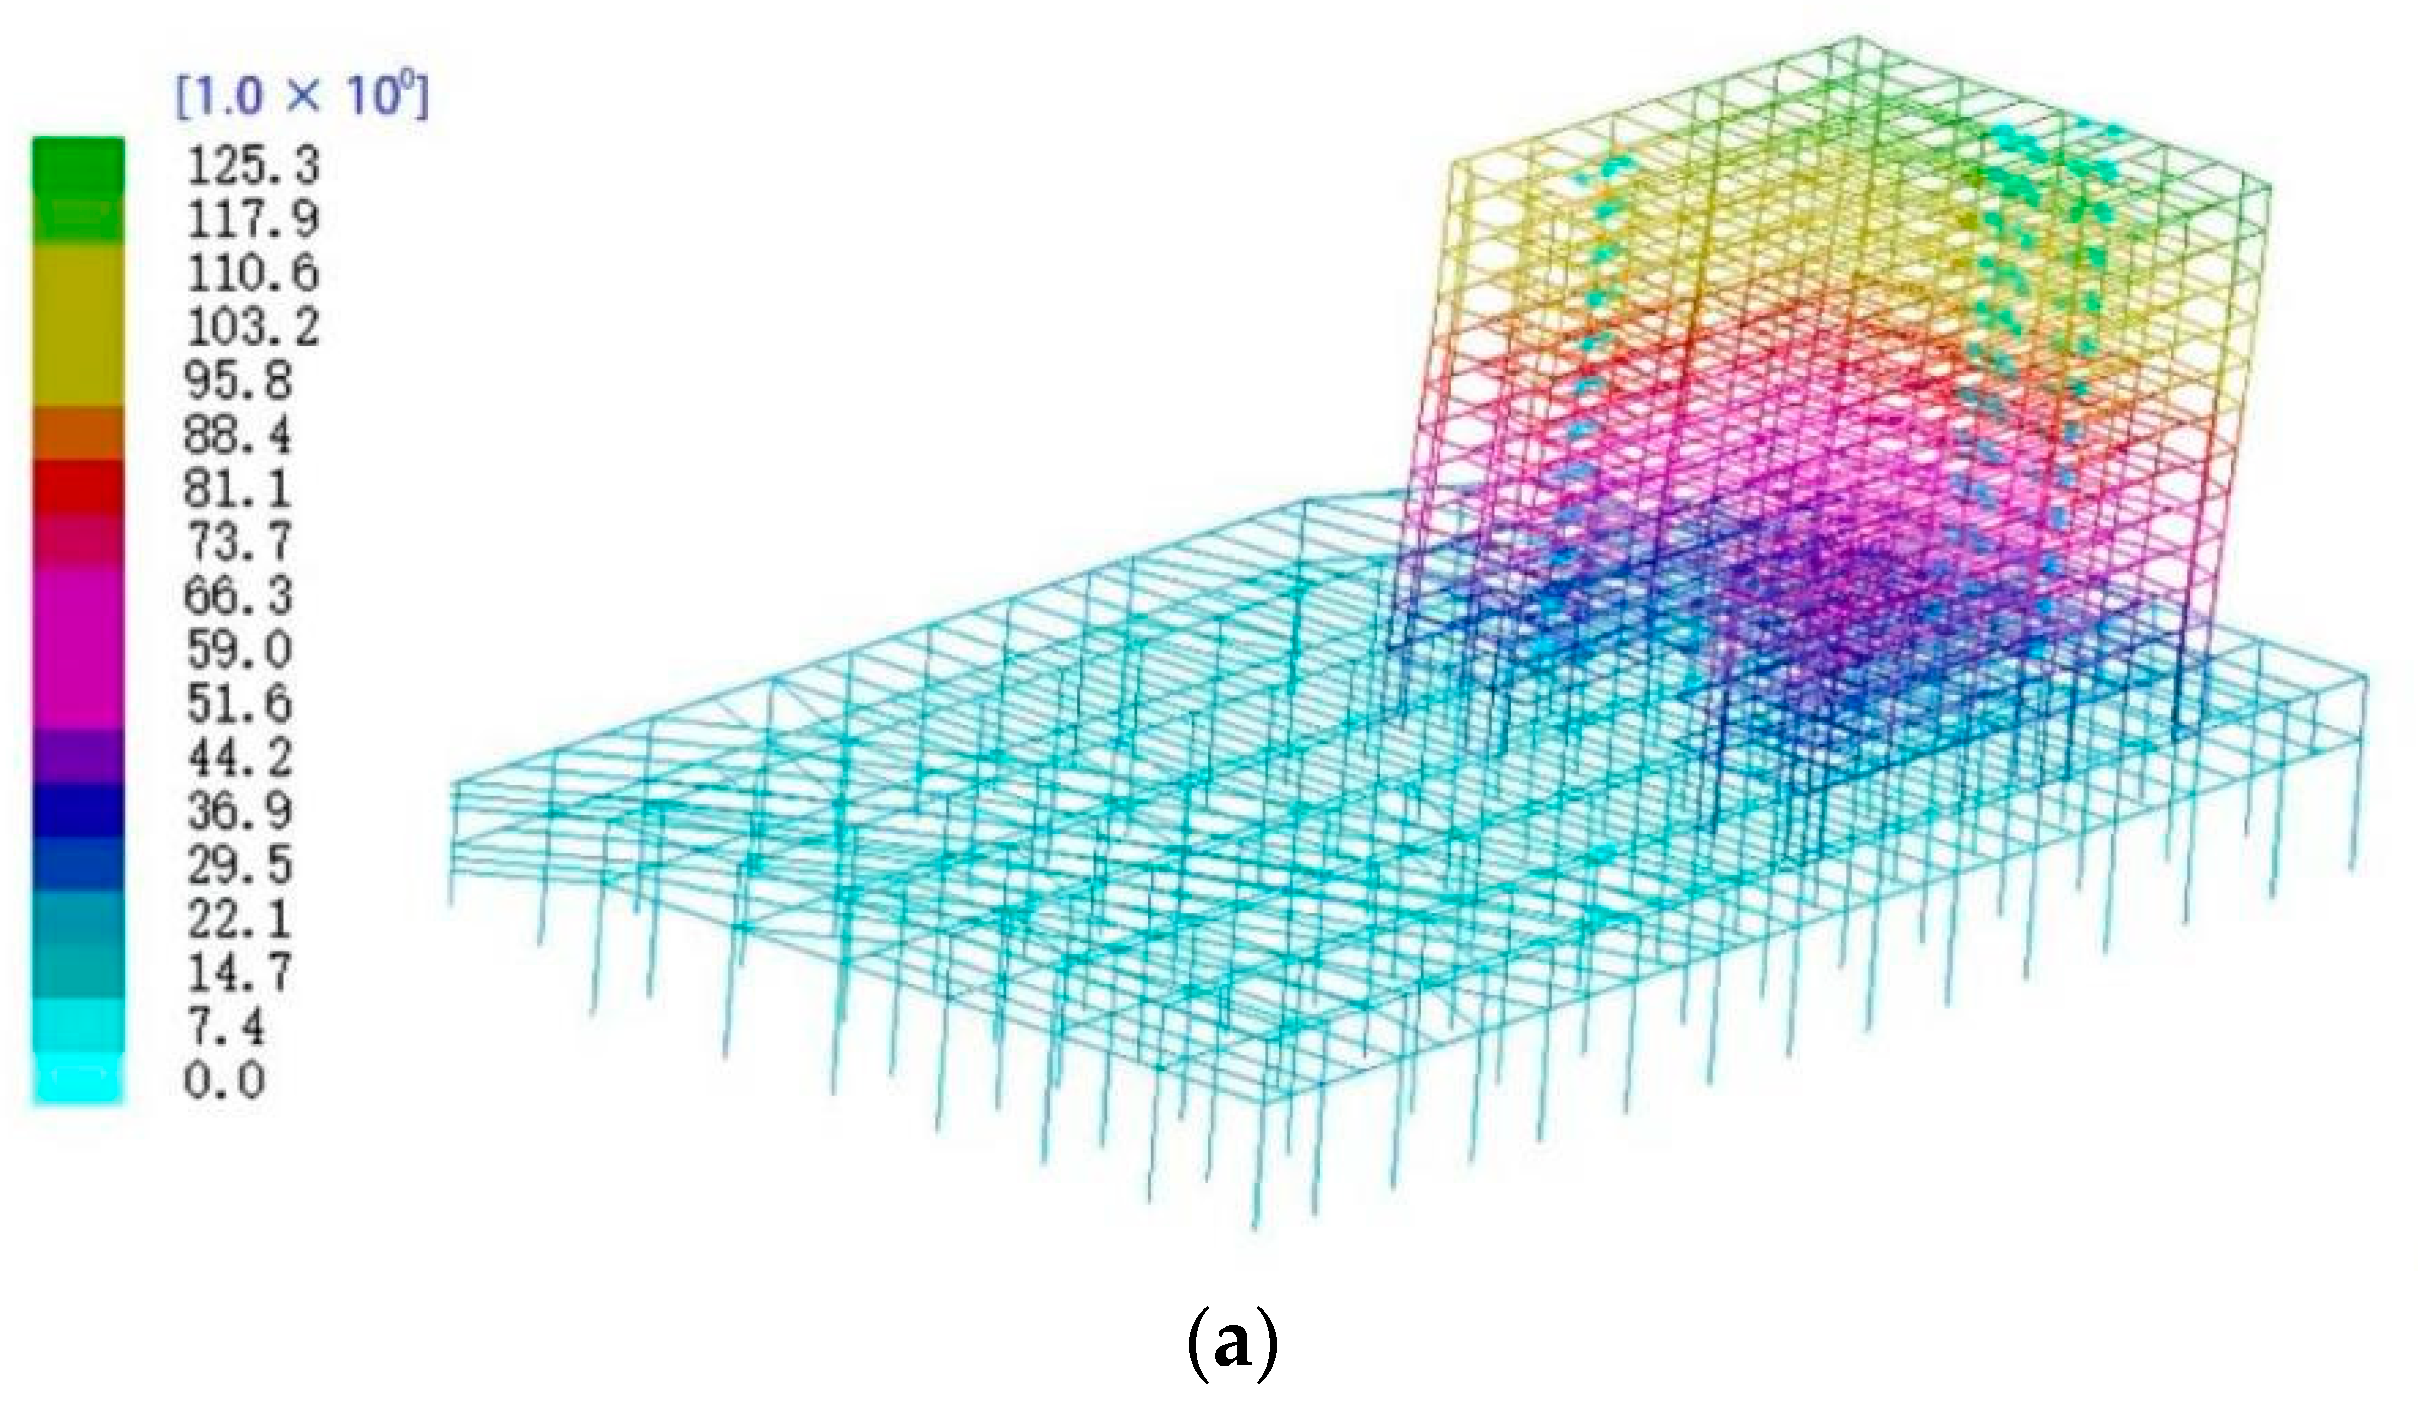
Buildings 12 01484 g005
Figure 6. Horizonal displacements calculated by the global and local scales (unit: mm). (a) Global model. (b) Local model.
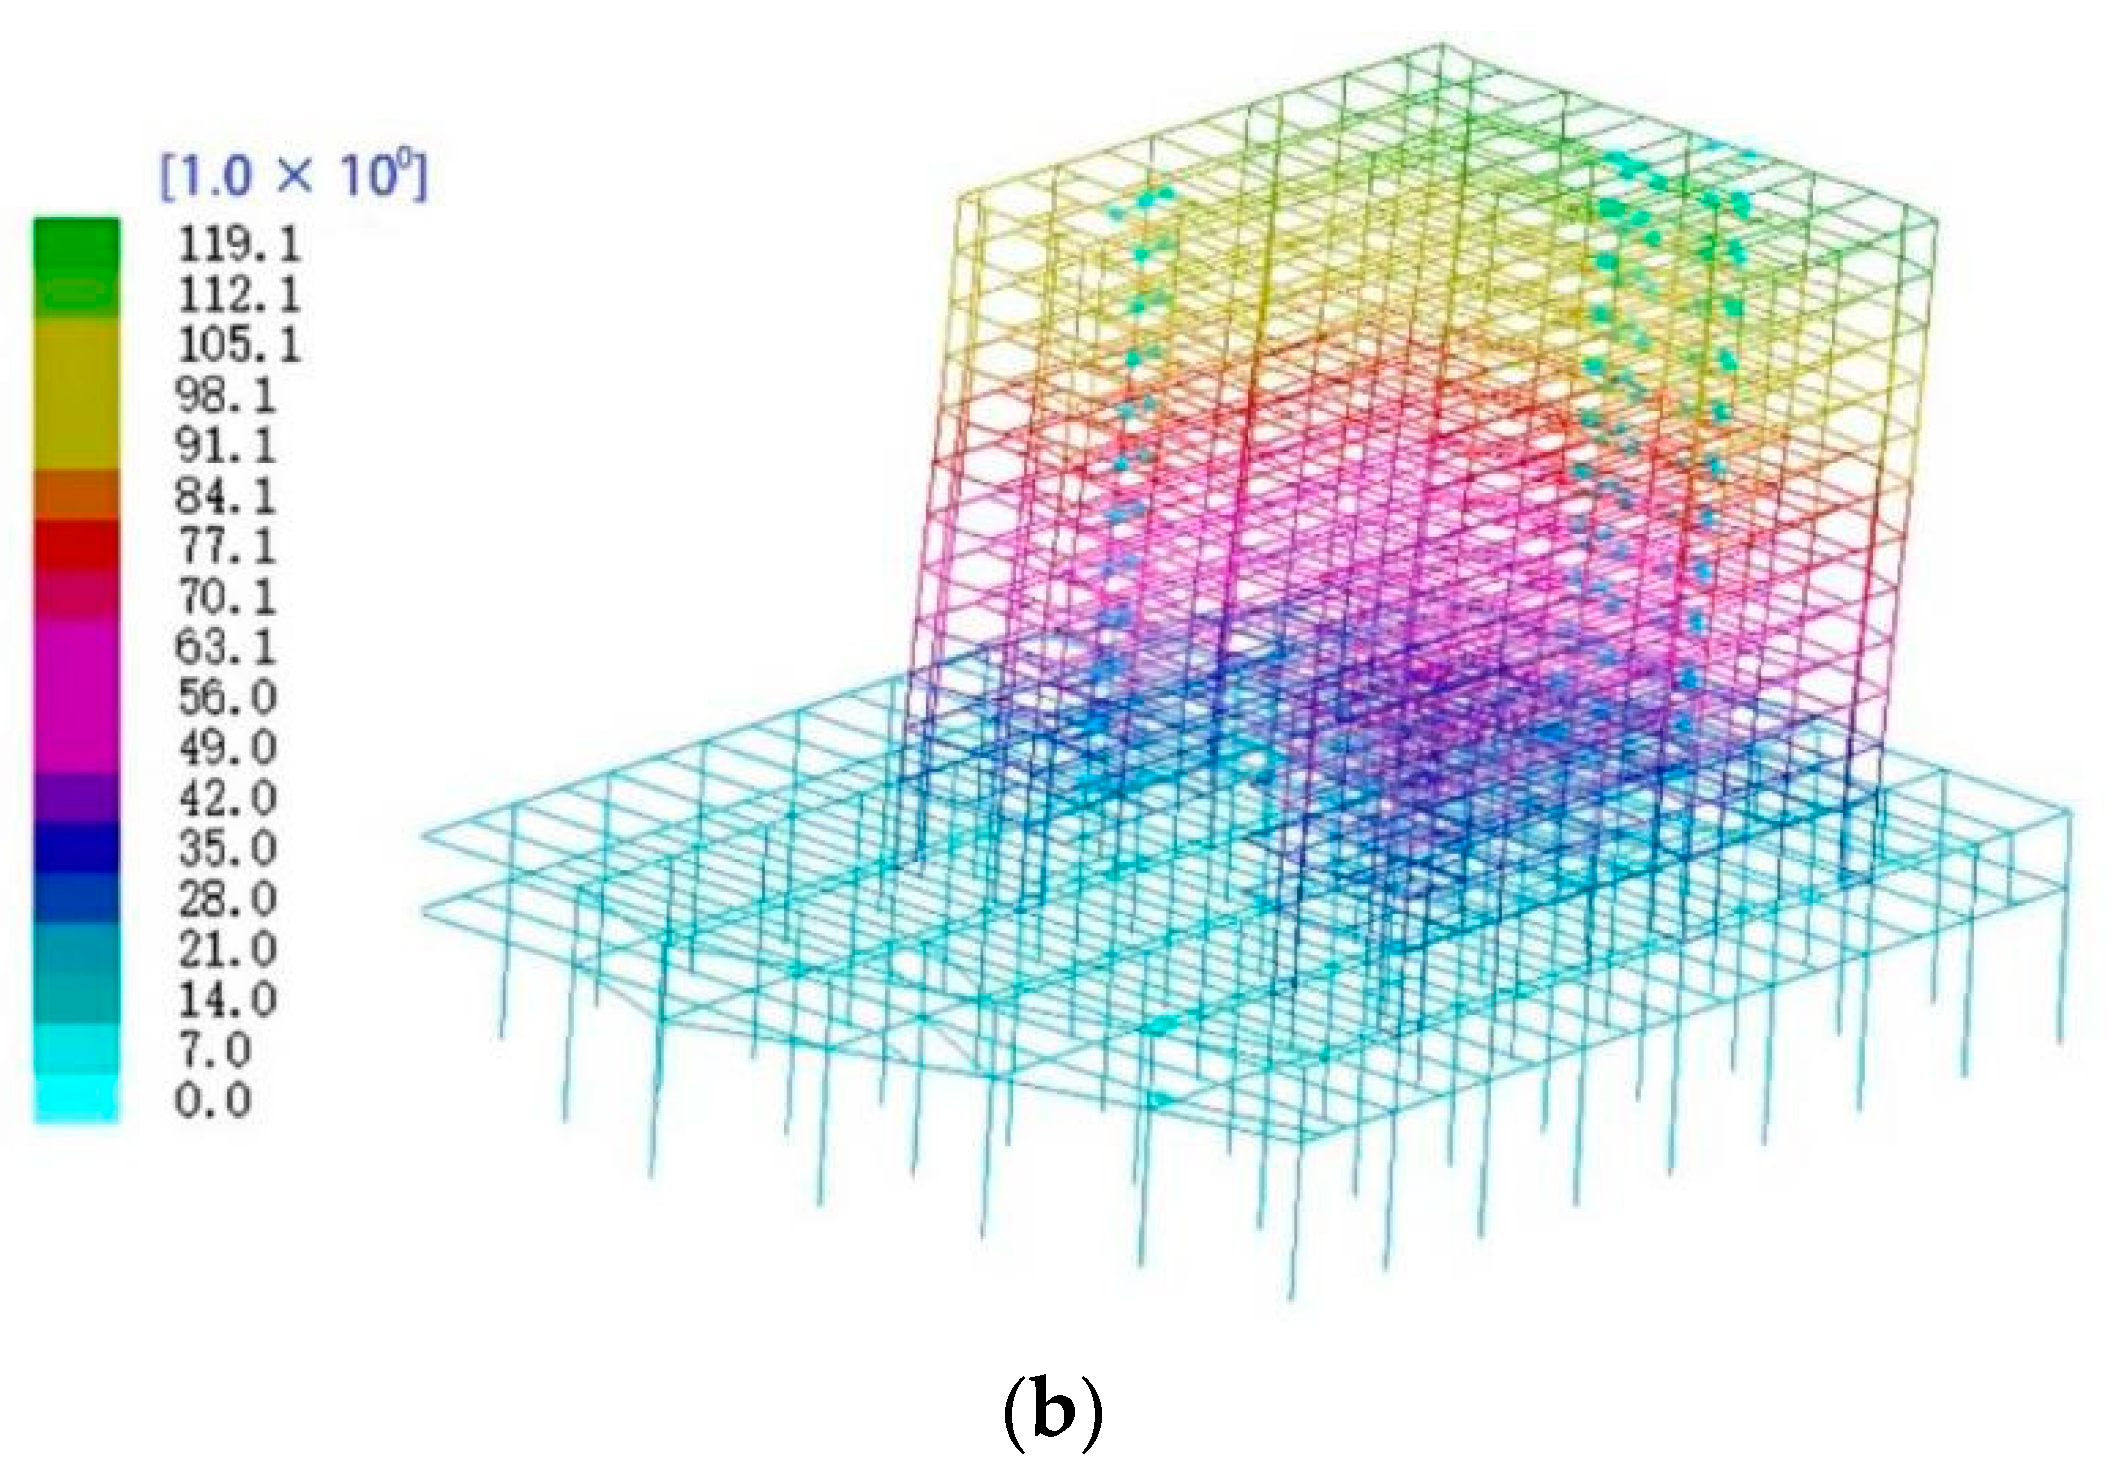
Buildings 12 01484 g006aBuildings 12 01484 g006b
Figure 7. Stress distributions in the floor slabs on the transfer, 6th and 8th storeys (unit: MPa). (a) Transfer storey. (b) The 6th storey. (c) The 8th storey.
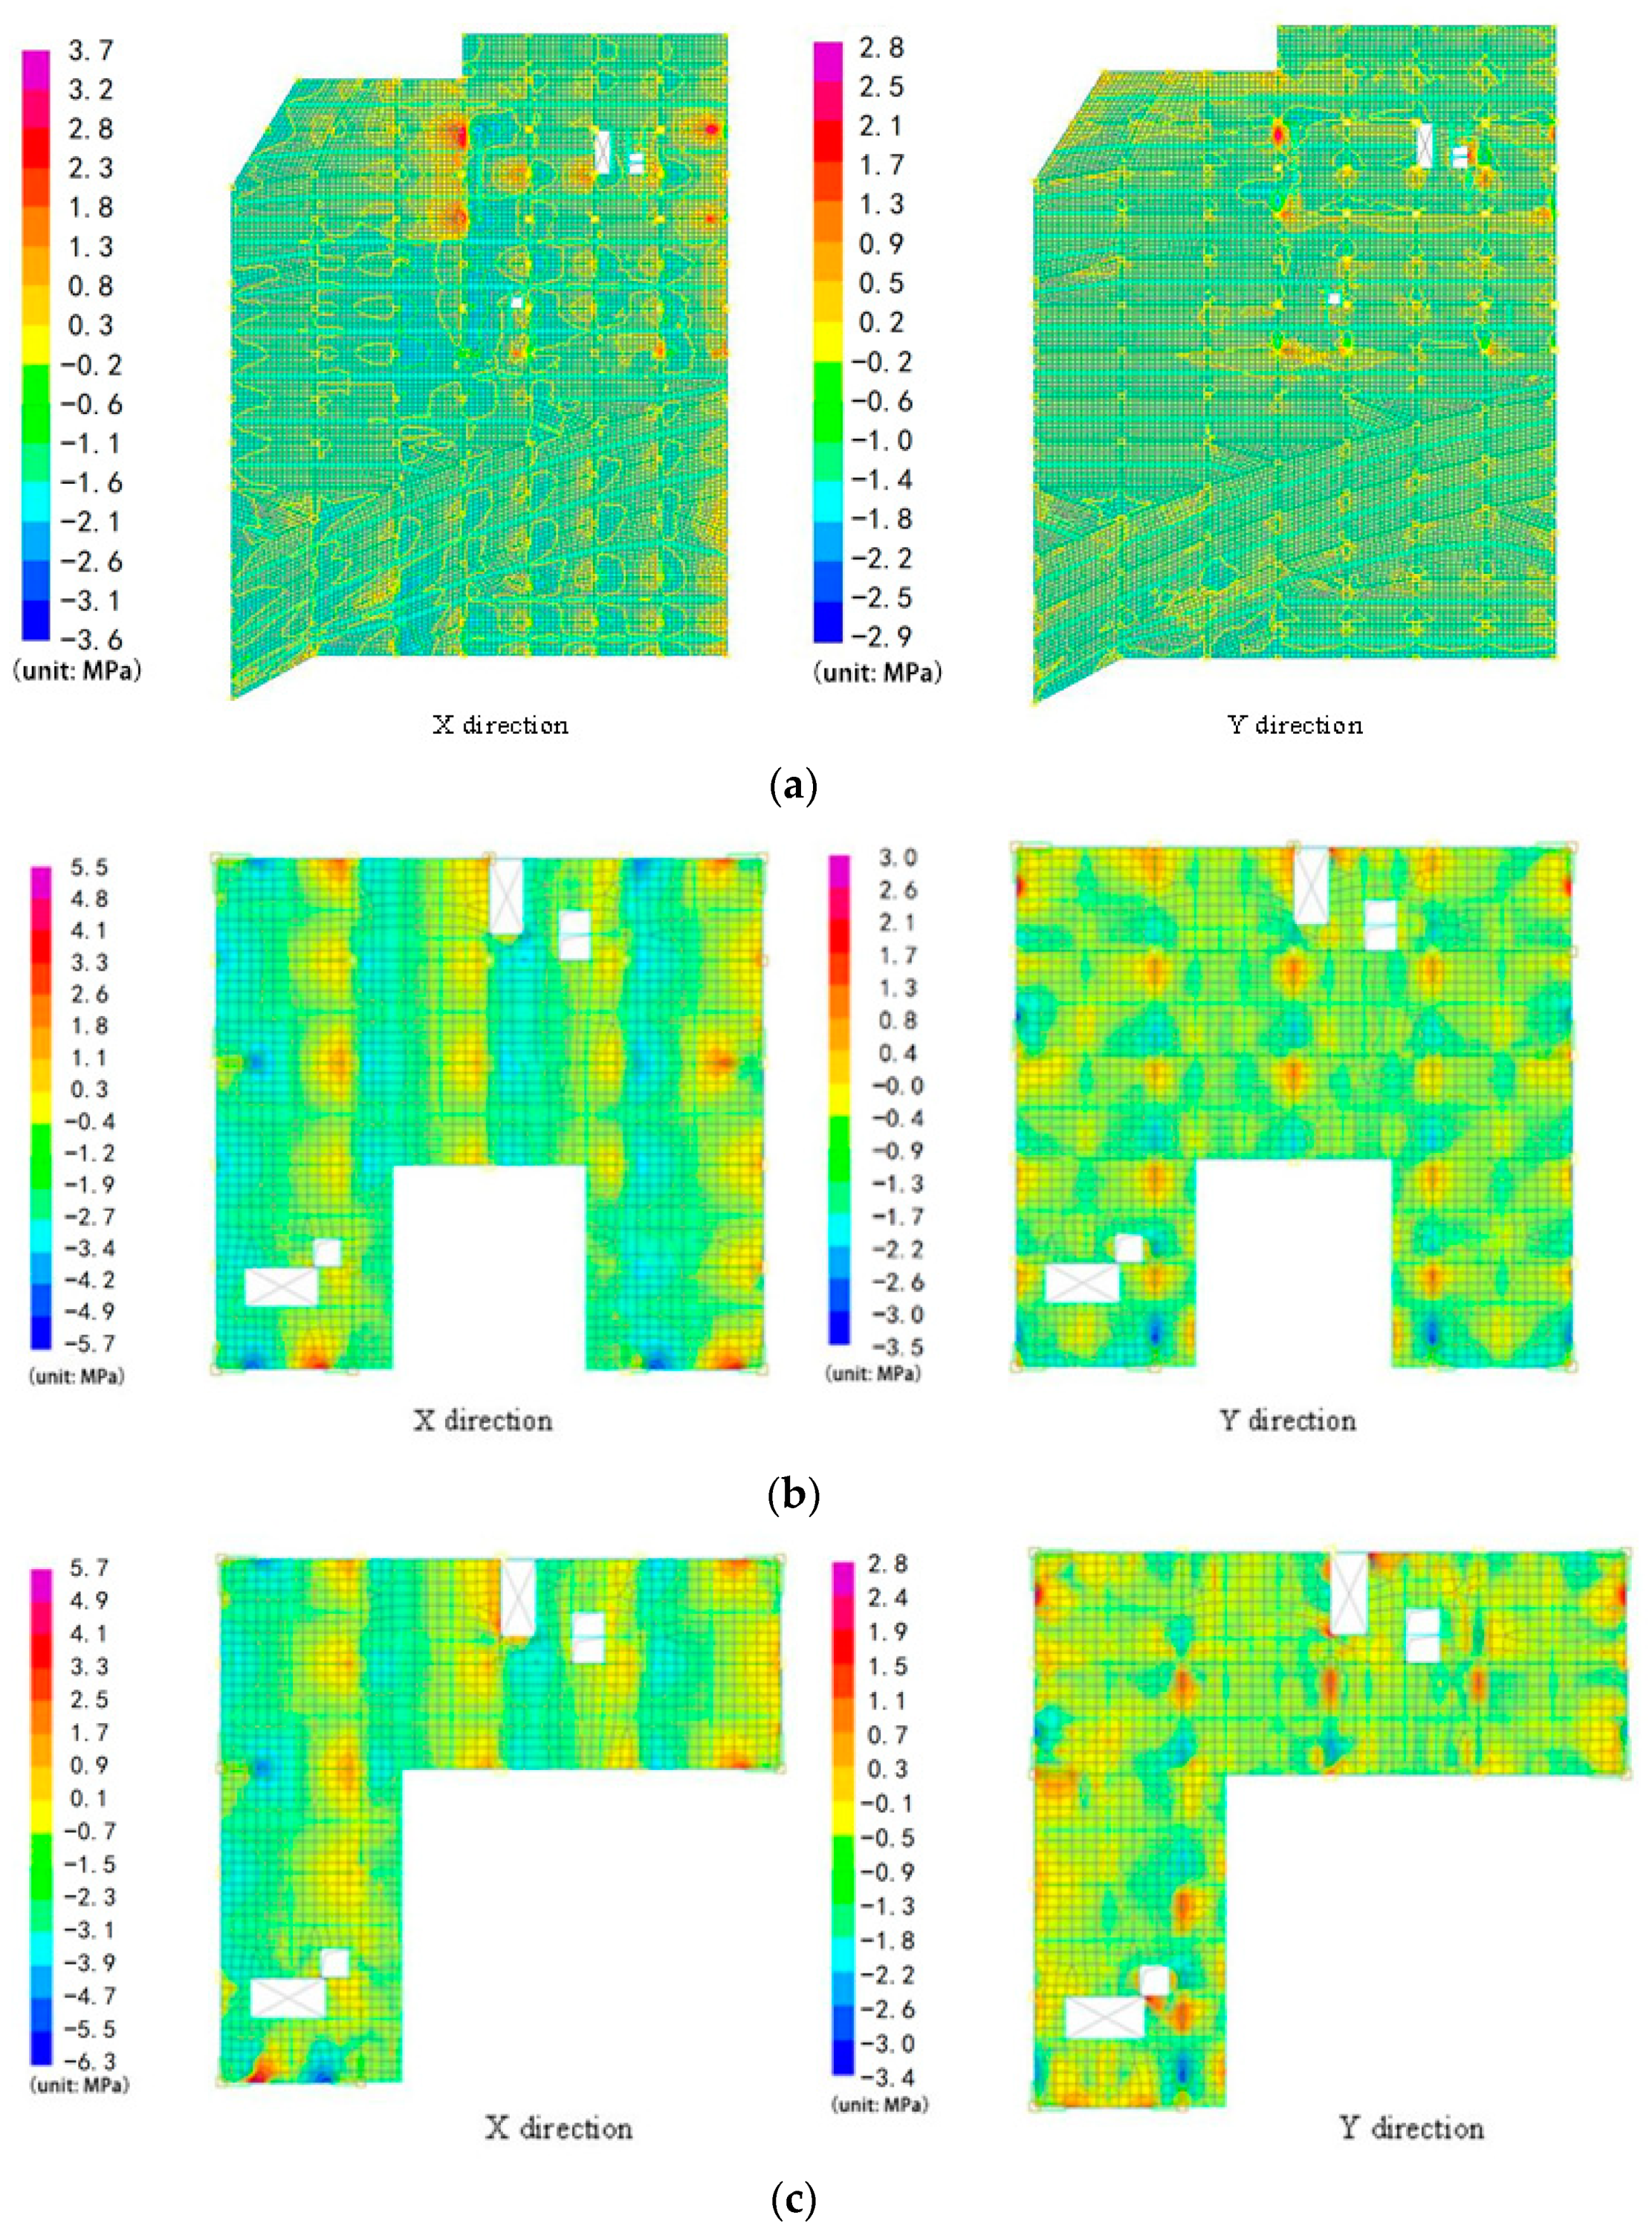
Buildings 12 01484 g007
Figure 8. Response spectrum curves of the three rare earthquake waves. (a) RH4TG045. (b) TH065TG045. (c) 0.45–8.
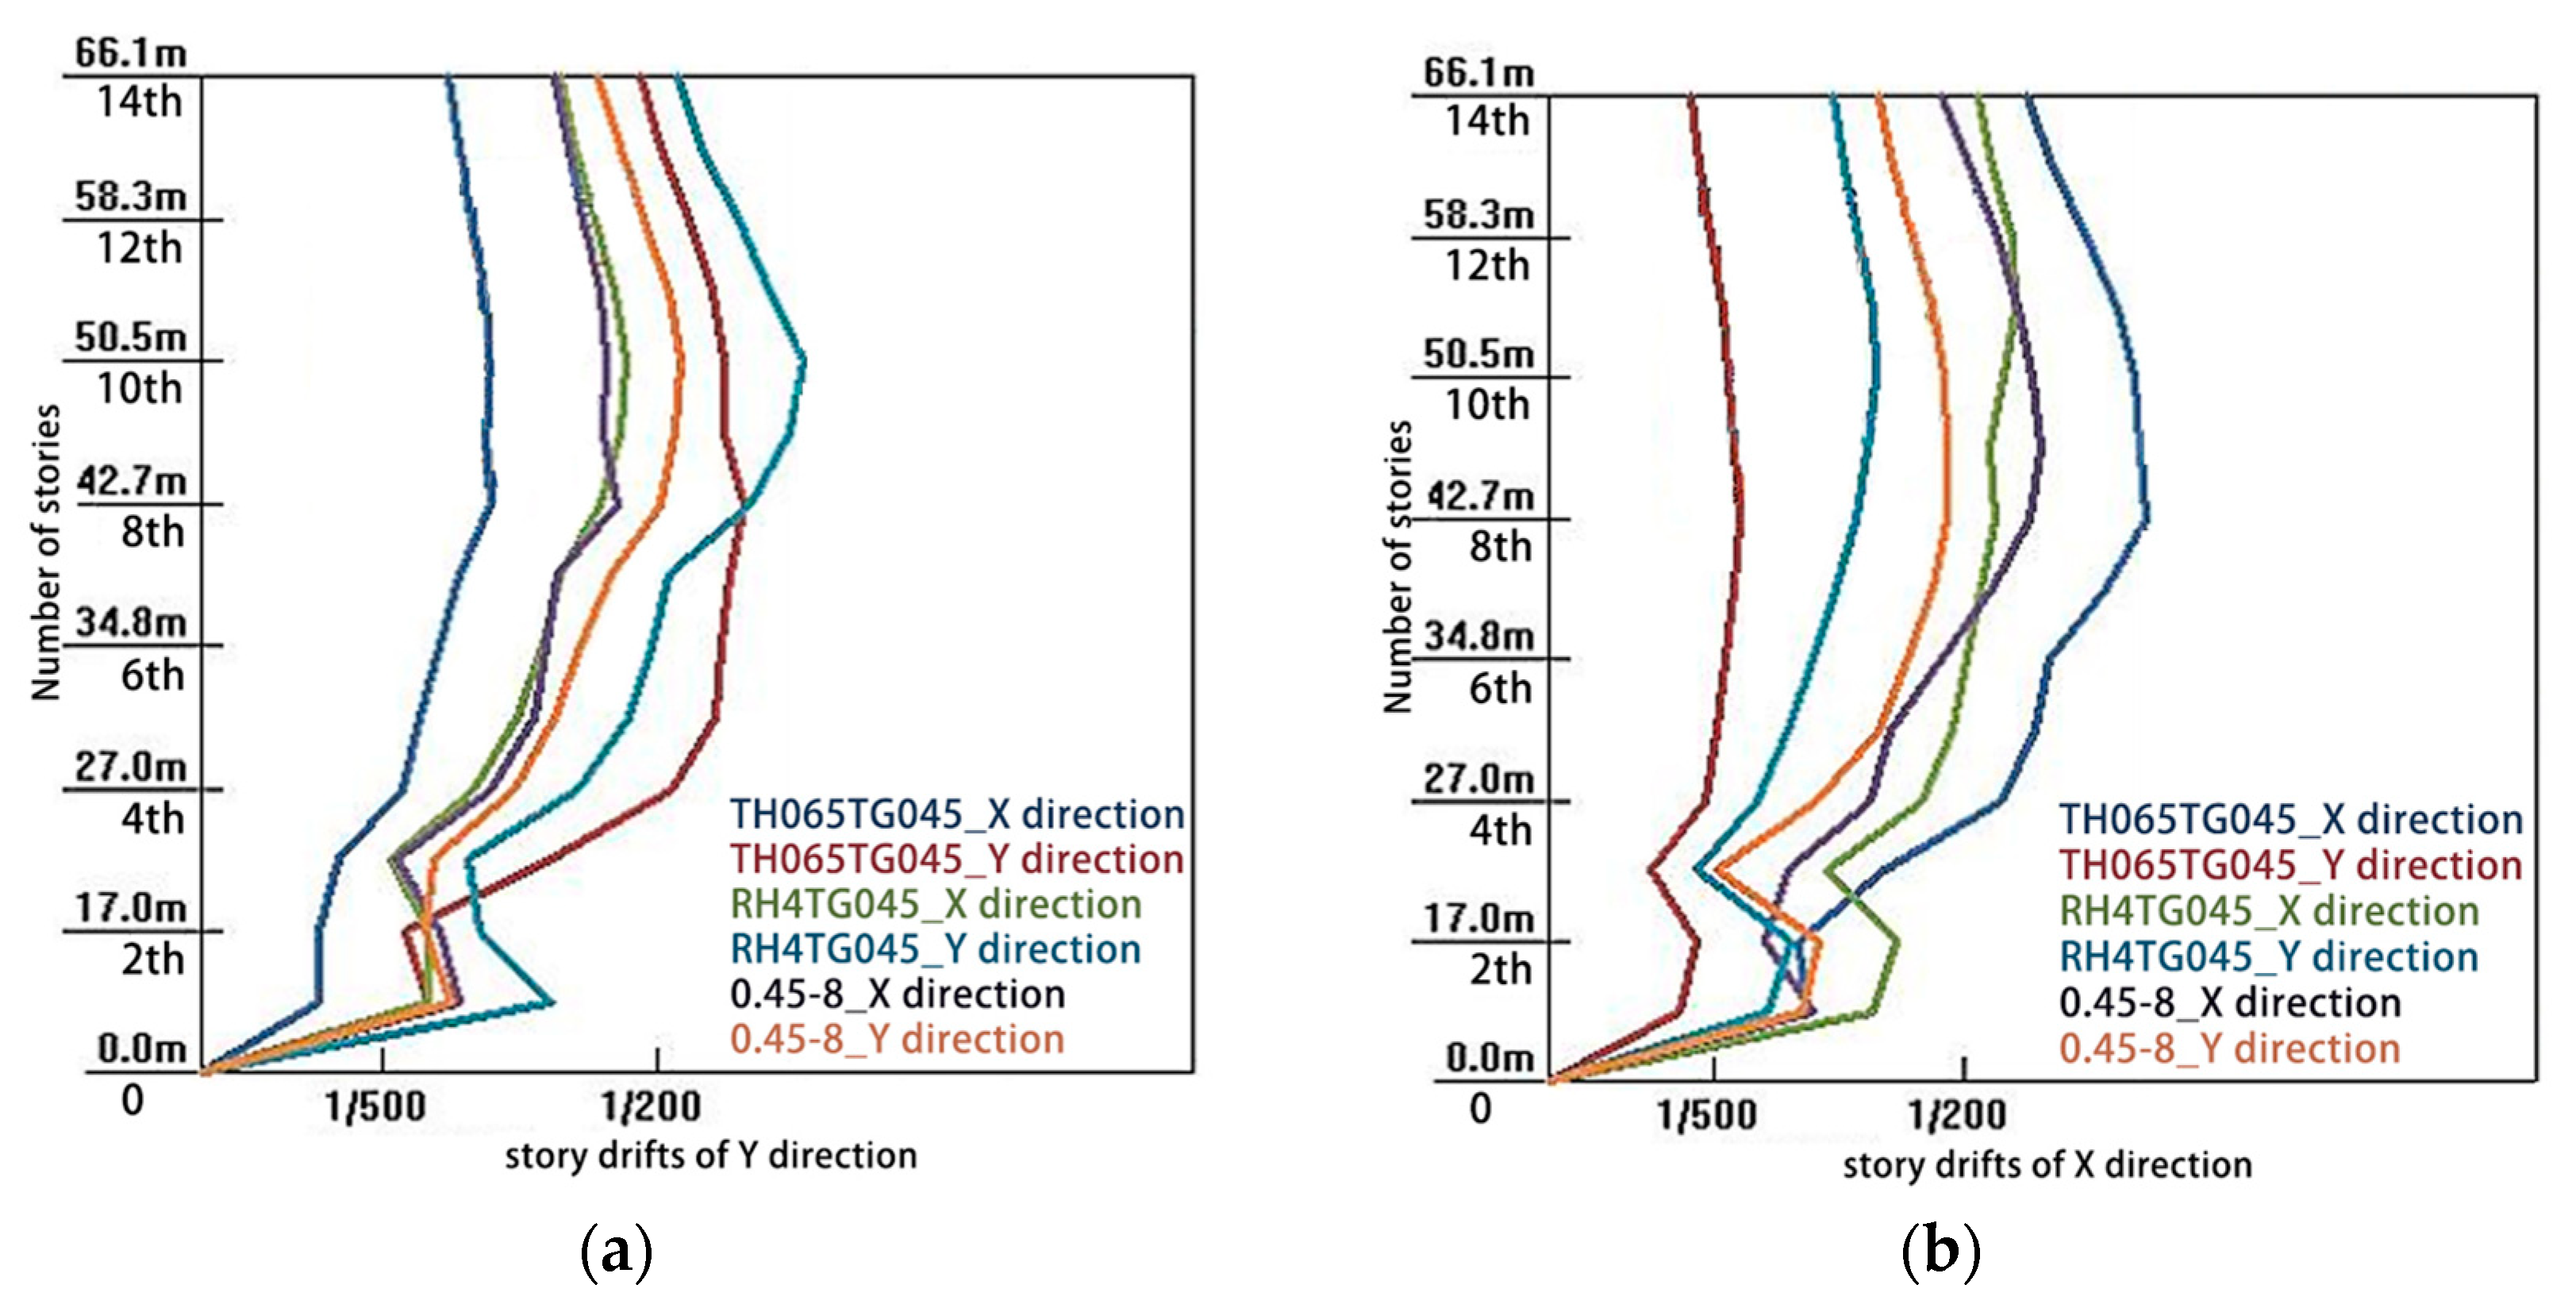
Buildings 12 01484 g008
Figure 9. Storey drifts under the three rare earthquake waves. (a) X direction. (b) Y direction.
Buildings 12 01484 g009
Table 1. Geometric dimensions of typical members of Building G1.
StoreyColumns (mm)Beams (mm)Floors (mm)
11600 × 1800
1600× 1600
600 × 1200
600 × 1500
250
21200 × 1200
900 × 900
1200 × 1200
600 × 1500
250
31000 × 1000400 × 800
400 × 900
130–150
4–141000 × 1000
900 × 900
400 × 800
400 × 900
130–150
Table 2. Concrete grades of different structural members in different storeys.
MembersStoreyConcrete Grade
Columns1–3C50
4–7C45
8–10C40
11–14C35
Walls3, 4C50
5, 7C45
8, 10C40
11, 14C35
Beams and Floors2C35
3C40
4C35
5–14C35
Table 3. The structural irregularities of Building G1.
Types of Structural IrregularitiesDetails of Irregularities
Torsional irregularityThe torsional displacement ratio of the accidental eccentricity was larger than 1.2.
Large eccentricityThe centroid difference of adjacent layers was larger than 15% of the corresponding side length difference.
Concave and convex irregularityThe plane concave–convex size was larger than 30% of the corresponding side length.
Vertical dimension mutationThe indentation of the vertical members was larger than 25% of the overall structure.
Vertical member discontinuityThe upper and lower walls, columns and supports were discontinuous.
Table 4. Design details of the seismic performances under three seismic categories.
Seismic CategoryFrequent EarthquakeDesign EarthquakeRare Earthquake
Structural damageNo damageRepairableNo collapse
Limit of storey drift index1/10001/120
Table 5. Typical parameters of the numerical models.
NameContents
StructureFrame-supported shear wall structure
Earthquake typesHorizontal and vertical earthquakes
Angle of horizontal earthquake action
Design earthquake intensity (acceleration)7 degrees (0.1 g)
Group of design earthquakeGroup 1
Reduction factor of live-load mass0.30
Number of vibration modelsEffective mass coefficient at 90%
Damping ratio0.05
Characteristic period of the ground motion0.45 s
Table 6. Results of the response spectrum analysis.
Software PackagesPKPMMidas Building
Total mass (tonnes)132,359.090134,979.404
PeriodT1 (s)1.52011.5293
T2 (s)1.36351.3840
T3 (s)1.02721.0577
T3/T1 0.680.69
Ratio of the participating massesX direction100%97.31%
Y direction100%96.84%
Shear-weight ratioX direction3.22%3.27%
Y direction3.79%3.79%
Stiffness-weight ratioX direction3.538.05
Y direction4.3711.29
Storey driftUpper storey of the transfer storeyX direction1/15601/1531
Y direction1/22351/2359
Lower storey of the transfer storeyX direction1/10201/1028
Y direction1/11261/1129
Table 7. Calculation values of the parameters γst, γe and γsh.
Storey Numberγstγeγsh
X DirectionY DirectionX DirectionY DirectionX DirectionY Direction
1st/2nd 1.021.040.880.93
2nd/3rd3.312.940.780.833.383.43
3rd/4th1.351.240.810.81
Table 8. Overturning moments of typical structural members and percentage proportions of the total overturning moments in the X and Y directions from the response spectrum analysis.
Storey Number Moments in the Frame Columns (kNm)Moments in the Shear Walls (kNm)
X DirectionY DirectionX DirectionY Direction
148798.5 (109.9%)9048.6 (95.6%)−789.3 (−9.9%)413.0 (4.4%)
1320,030.9 (87.3%)21,515.0 (79.5%)2923.2 (12.7%)5564.4 (20.5%)
1233,231.7 (75.9%)36,448.2 (70.6%)10,562.8 (24.1%)15,169.7 (29.4%)
1148,199.1 (69.3%)53,537.1 (65.4%)21,336.6 (30.7%)28,310.7 (34.6%)
1064,622.6 (65.1%)72,402.2 (62.1%)34,609.0 (34.9%)44,154.3 (37.9%)
982,307.2 (62.4%)92,650.9 (59.9%)49,694.9 (37.6%)61,950.5 (40.1%)
81.0 × 10⁵ (60.1%)1.1 × 10⁵ (58.2%)66,641.0 (39.9%)81,526.4 (41.8%)
71.2 × 10⁵ (60.7%)1.4 × 10⁵ (59.8%)80,414.1 (39.3%)95,603.5 (40.2%)
61.5 × 10⁵ (60.5%)1.7 × 10⁵ (60.3%)96,582.7 (39.5%)1.1 × 10⁵ (39.7%)
51.7 × 10⁵ (59.0%)2.0 × 10⁵ (59.5%)1.2 × 10⁵ (41.0%)1.3 × 10⁵ (40.5%)
41.9 × 10⁵ (57.4%)2.2 × 10⁵ (58.5%)1.4 × 10⁵ (42.6%)1.6 × 10⁵ (41.5%)
32.1 × 10⁵ (53.1%)2.4 × 10⁵ (53.8%)1.9 × 10⁵ (46.9%)2.1 × 10⁵ (46.2%)
23.8 × 10⁵ (67.3%)4.5 × 10⁵ (68.1%)1.9 × 10⁵ (32.7%)2.1 × 10⁵ (31.9%)
18.8 × 10⁵ (82.5%)1.0 × 10⁶ (83.1%)1.9 × 10⁵ (17.5%)2.1 × 10⁵ (16.9%)
Table 9. Overturning moments of typical structural members and percentage proportions of the total overturning moments in the X and Y directions from the elastic time history analysis.
NameTypeDuration (s)Time Interval (s)Maximum Acceleration (gal)
ArtWave-RH1TG045, Tg(0.45)Artificial wave30.020.0235
ArtWave-RH3TG045, Tg(0.45)Artificial wave30.020.0235
NGA_187IMPVALL.H-PTS_FN_Natural wave39.320.00535
0.45s-1Natural wave20.220.0235
0.45–8Natural wave20.020.0235
Big Bear-01_NO_907, Tg(0.43)Natural wave59.010.0135
Manjil, Iran_NO_1636, Tg(0.45)Natural wave60.430.0135
Table 10. Variations in the period ratios of the seven ground-motion waves.
NameVariation Ratios
First Vibration modeSecond Vibration modeThird Vibration mode
ArtWave-RH1TG045, Tg(0.45)−11%−8%−16%
ArtWave-RH3TG045, Tg(0.45)−4%−6%−16%
NGA_187IMPVALL.H-PTS_FN_1%2%−4%
0.45s−1−3%−9%4%
0.45–8−4%−8%−15%
Big Bear-01_NO_907, Tg(0.43)13%13%−14%
Manjil, Iran_NO_1636, Tg(0.45)−8%−9%16%
Average value −3%−3%−5%
Table 11. Calculated shear forces by the CQC and elastic time history methods.
NameX DirectionY Direction
Bottom Shear Force (kN)γxBottom Shear Force (kN)γy
NGA_187IMPVALL.H-PTS_FN_39,654.4393%36,201.2272%
0.45s 1__41,597.5798%45,220.8290%
0.45–8__42,958.20101%54,984.40110%
Big Bear-01_NO_907, Tg(0.43)42,083.8199%51,247.15102%
Manjil, Iran_NO_1636, Tg(0.45)36,770.3486%49,974.16100%
ArtWave-RH1TG045, Tg(0.45)36,231.1985%49,217.2598%
ArtWave-RH3TG045, Tg(0.45)41,480.7497%43,336.8886%
Average value40,110.9094%47,168.8494%
Table 12. Shear-compression ratios of typical structural members.
TypeStoreySection
(mm × mm)
Maximum
Shear-Compression Ratio
Limit Value
Global ModelPartial Model
Transfer column11600 × 18000.040.040.42
Transfer column11400 × 18000.030.030.42
Transfer column21100 × 15000.100.100.42
Transfer column21100 × 12000.080.080.42
Frame column11600 × 18000.040.24
Frame column11600 × 16000.030.24
Frame column2900 × 9000.040.24
Frame column21400 × 14000.120.24
Frame beam21300 × 26000.320.320.42
Frame beam21300 × 24000.200.200.42
Table 13. Maximum shear-compression ratios of the transfer columns and beams.
Structural MemberStoreySection
(mm × mm)
Maximum Shear-Compression RatioLimit Value
Global ModelPartial Model
Transfer column11600 × 18000.040.040.42
Frame column21600 × 18000.100.100.42
Frame column21400 × 14000.100.100.42
Frame column21300 × 13000.090.090.42
Transfer beam21300 × 26000.220.220.42
Transfer beam21300 × 24000.210.210.42
Table 14. Parameters of the three indicated ground-motion waves.
NameTypeDurations
(s)
Interval (s)Maximum Acceleration (gal)
RH4TG045Artificial waves300.02220
TH065TG045Natural waves23.560.02220
0.45–8Natural waves19.880.02220
Table 15. Differences on the first three vibration periods between the response spectrum method and the elastic–plastic time history method.
Name of Earthquake WavesT1T2T3
RH4TG045−3.82%−6.91%−9.78%
TH065TG04513.37%11.78%−15.39%
0.45–8−11.72%−19.75%2.82%
Average value−0.72%−4.96%−7.45%
Table 16. Calculation results of the bottom shear forces.
MethodBottom Shear Forces (kN)
X DirectionY Direction
Response spectrum method228,000267,000
Elastic–plastic time-history methodTH065TG045189,639198,311
0.45–8175,373191,316
RH4TG045186,081257,332
Average value183,697215,653
Table 17. The maximum values of the storey drifts under the three earthquake waves.
Name of Earthquake WavesX DirectionY Direction
RH4TG0451/1781/151
TH065TG0451/1421/168
0.45–81/1691/190
Publisher’s Note: MDPI stays neutral with regard to jurisdictional claims in published maps and institutional affiliations.

