Article

Research on Experimental and Numerical Methods for Mechanical Properties of Lightweight Hollow Precast Utility Tunnels

Key Laboratory of Concrete and Pre-stressed Concrete Structures of Ministry of Education, Southeast University, Nanjing 210096, China
*
Author to whom correspondence should be addressed.
Buildings 2022, 12(9), 1483; https://doi.org/10.3390/buildings12091483
Submission received: 19 July 2022 / Revised: 3 September 2022 / Accepted: 11 September 2022 / Published: 18 September 2022
(This article belongs to the Special Issue Prefabricated Spatial Network Structure)

Abstract

:
In this paper, the mechanical properties of hollow precast utility tunnels are studied by experimental and numerical methods. Through full-scale experiments, the failure modes of ordinary and hollow utility tunnels are studied, and the failure stages of the structures are classified based on the bearing capacity and damage to the structures. The nonlinear finite element model is used to simulate the behavior of the structure, and the optimal design of the structure under load type and the hollow ratio are discussed based on the finite element method. The theoretical calculation method of the bearing capacity for hollow structures in each stage is proposed, and its application scope is discussed. The finite element analysis can effectively predict the mechanical properties of the structure, and the failure of the utility tunnel structure is dependent on the shear bearing capacity. Although hollow design advances the structural damage under point load, the hollow structure has significant advantages under uniform loads or reasonable hollow ratios. It is reasonable to calculate the cracking load considering moment distribution at section centroid and the failure load considering the combined action of flexural and shear stress, but the hollow ratio should be less than 16%. Under reasonable hollow ratio or load conditions, the hollow design has little effect on the bearing capacity of the structure and can reduce the weight, which has practical value for architecture and construction.

1. Introduction

Precast concrete technology can shorten construction time, reduce costs, improve quality, and reduce environmental pollution. The construction method of precast utility tunnels has become the main development method of underground space [1,2]. At present, the reinforcement of utility tunnels depends on the crack width equation. Yi [3] and Garg [4] found that the utility tunnels have much redundancy in flexural bearing capacity, but the shear bearing capacity is relatively insufficient. The utility tunnels have an ultimate bearing capacity that far exceeds the design load. However, as the load increases, the shear failure occurs in the corner area [5]. In order to optimize the design of the utility tunnel structure, researchers proposed the design of an enhanced corner area.
Pan [6] and Wang [7,8] studied the corner area of utility tunnels. They considered that strengthening the corner region could increase the stiffness of the structure and help improve the overall bearing capacity. However, Wu [9] and Yi [3] found that this design does not affect the bearing capacity of the structure when considering the haunch. The above studies also showed that the actual flexural capacity of the structure is much larger than the calculation results. Currently, the design of the utility tunnel is conservative, leading to a large overall weight of the structure. Using integral precast components for construction also faces difficulties in transportation and hoisting and potential safety hazards [10]. The compromise scheme is to use the composite post-pouring method for construction, but this method cannot shorten the construction period of the precast structure [11,12].
For the utility tunnel with a single warehouse structure, the design of a lightweight hollow structure can be used as a reference [13]. The structure designed with this idea is widely used in public constructions such as office buildings [14], roads, and bridges [13,15]. Based on experimental and finite element analysis of hollow beams, Abbass [16] and Al-Maliki [17] found that reasonable design could provide reliable mechanical properties for the perforated structure. However, no research has investigated the lightweight hollow structures for utility tunnels.
This study aims to explore the feasibility of hollow precast lightweight structures for utility tunnels. Based on the theory of concrete structure, the structure of the utility tunnel is designed, and the full-scale model is established for the experiment. The failure mode and mechanical properties of the structure are studied. The experiment was re-conducted using the finite element method to investigate the influence of load type and hollow ratio on the structural and mechanical properties. Based on the finite element calculation results, the calculation methods of cracking load, yield load (failure load), and ultimate load (structural ultimate bearing capacity) of the lightweight hollow structure are derived from the theoretical equations. The equation is extended and discussed by including the conventional structure without hollows as a special case. The rationality of the theoretical calculation method is verified by the experiment results and the finite element calculation.

2. Structural Design

The Nanjing Power Main Line Utility Tunnel Project is selected as the study object. The structural importance coefficient is 1.1. The length, width, and height of the component are 2.9 m, 1.1 m, and 2.45 m [18], respectively. The thickness of the roof and side wall is 250 mm, and the thickness of the bottom plate is 300 mm. The total excavation height is 4.5 m, the thickness of the upper layer is 1.9 m, and without underground water in the deep burial.
The load effect on the structure is calculated according to the Shanghai Technical Code for Municipal Tunnel Engineering [19]. The load combination results considering live loads such as vehicle loads [20] are shown in Table 1.
According to the design load in the table and the Code for Design of Concrete Structures [21], the reinforcement of the structure is designed in this study. The strength of structural concrete is C40, and the reinforcement is HRB400. The thickness of the protective layer of the contact surface between the structure and the soil is 50 mm, the layer without the contact surface is 20 mm, and the maximum allowable width of the crack is 0.2 mm.
The reinforcement of the member should meet the requirements of the following equation:
M f c bx ( h 0 x / 2 ) + f y A s ( h 0 a s )
where M is the design bending moment; f c is the axial compressive strength of the concrete, which is 19.1 MPa; b denotes the section width, which is 1100 mm; x is the height of the cross-sectional pressure zone, which is 114 mm in this equation; h0 represents the effective cross-sectional height, which in this case is 230 mm; f y is the design value of the compressive strength of the reinforcement, which is 360 MPa; A s is the cross-sectional area of the compressive rebar; a s is the distance from the combined force point of the compressive reinforcement to the edge of the cross-section, which is 57 mm.
It is also necessary to limit the maximum crack width of the structure. The reinforcement results obtained according to Equation (1) can hardly meet the crack width calculated by Equation (2). Therefore, the actual reinforcement of the structure is determined by Equation (2):
ω max = α ψ σ E ( 1.9 c + 0.08 d ϱ ) ψ = 1.1 0.65 f tk ϱ σ σ = M 0.87 h 0 A s
where α is the characteristic coefficient of the component force, which is 1.9; ψ represents the strain inhomogeneity coefficient of longitudinal tension reinforcement between cracks, taken as 0.2 when less than 0.2 and 1.0 when greater than 1.0; σ is the equivalent stress of reinforcement; E is the elastic modulus of reinforcement, which is 200 GPa, c is the distance from the outer edge of the longitudinal tensile reinforcement to the edge of the concrete, which is 50 mm or 20 mm, d denotes the equivalent diameter of tensile reinforcement; ϱ is the effective reinforcement rate of longitudinal reinforcement, which is taken as 0.01 when less than 0.01; f tk is the standard value of axial tensile strength of concrete, which is 2.39 MPa, A s is the cross-sectional area of the longitudinal tensile reinforcement.
Transverse distribution of reinforcement and stirrup reinforcement following structural requirements are shown in Figure 1. The reinforcement of the ordinary specimen based on the calculation is shown in Figure 1a. The circular holes of the hollow structure are evenly arranged with a through-hole diameter of 120 mm and a spacing of 200 mm. The reinforcement of hollow structures is identical to that of ordinary structures, and the arrangement is shown in Figure 1b.

3. Research Methods

3.1. Experiment Process

The bending moment is the most important factor in the deformation of utility tunnels under actual working conditions. Therefore, it is necessary to ensure that the bending moment of the control section is as close to the actual situation as possible in the test loading. For this reason, the principle of bending moment equivalence should be ensured when the point load is used in the test instead of uniform load. Through trial calculation, the ratio of the maximum positive and negative bending moment under point load is equal to that under uniform load. As a result, the two dangerous sections can simultaneously achieve the required bending moment load in the loading process [22].
The trial calculation of the roof shows that when the loading point is 1050 mm away from the side wall, the ratio of positive and negative bending moments under the point load is consistent with the uniform load. Since the side wall load is less important under the actual load [23,24], the point load is directly substituted at the position of its resultant load point. The loading position and device are finally determined, as shown in Figure 2. In Figure 2, the bending moments of the roof under different loads are shown.
The roof is loaded at two points, with the jack resting on the distribution beam. The distribution beam is connected to the distribution steel plate through articulated support to ensure the load is perpendicular to the plane. The distribution steel plate ensures the uniform distribution of the load in the longitudinal direction. It is padded with fine sand underneath to avoid friction between the steel plate and the top plate, which affects the test results. The side wall loading reaction beam is placed horizontally and loading steel plates are set on both sides of the structure, achieving uniform load distribution in the longitudinal direction. The jack is placed between the reaction beam and the loading steel plate on the same side. The loading steel plate is connected to the horizontal reaction beam by a steel bar, which is bolted to the reaction beam and the loading steel plate on the opposite side.
The reinforcement and concrete are monitored by placing strain gauges at large strain locations. A total of 20 strain measuring points are set up. For example, the positions and numbers of the strain gauges passed on the hollow specimen are shown in Figure 3. A linear displacement transducer with a range of ±25 mm was used to measure the displacement. It was arranged in the middle of the roof, below the loading point, and at the midpoint of the side wall. In Figure 3, the concrete strain gauges are numbered with C, the reinforcement strain gauges are numbered with S, and the displacement transducers are numbered with D.
Before the experiment, the surface of the component is painted white, and a square grid with a side length of 100 mm is drawn. When the crack appears, the position and direction are recorded by marking along the crack, and the width of the crack is measured with a scale microscope.
The loading is divided into three stages: preloading, formal loading, and failure loading. In the preloading stage, 20% of the standard load was applied at each position. Formal loading applies the load to the standard load of the structure through five loading steps. Each load level is held for 15 min during the loading process, and the load is held for 30 min after reaching the standard load. In the failure loading stage, the load on the side wall does not change. Only the roof load increase, and the loading rate slows until the specimen is destroyed.

3.2. Finite Element Numerical Simulation Method

Based on the experiment, the finite element model is established in ABAQUS software. In order to simulate the failure process of the specimen, the concrete constitutive model adopts the concrete plastic damage model, providing different stress–strain relationships for the nonlinear behavior of concrete in tension and compression [25,26]. The uniaxial elastoplastic reinforcement behavior (tension, compression, and stirrups) is modeled using the Von Mises yield criterion. The specific values of the concrete and reinforcement constitutive model were based on the Code for Design of Concrete Structures [21]. The material behavior is shown as follows: Figure 4a is the concrete compression behavior; Figure 4b is the concrete tension behavior; Figure 4c is the reinforcement.
The finite element model consistent with the actual size is established. Concrete is modeled with C3D8R elements, and T3D2 truss elements are embedded in concrete elements to simulate the reinforcement behavior [27]. The boundary conditions are realized by constraining the displacement on the four sides of the bottom surface in the X, Y, and Z directions, and the boundary conditions can meet the practical engineering needs. The boundary conditions and meshing of the model are shown in Figure 5.
The number of finite elements in the mesh of ordinary utility tunnel is 33,516, and the number of nodes is 38,425. Differently, the number of elements in the hollow utility tunnel case is 39,882, and the number of nodes is 50,105. The mesh size was determined by sensitivity analysis. The results of the roof displacements within the elastic phase of the hollow structure were compared with the theoretical calculations of structural mechanics, as shown in Figure 5d. It can be seen that when the element size exceeds 100 mm, the finite element calculation results have a large error from the theoretical results. Therefore, an element size less than 100 mm is feasible. In addition, it is reasonable to use 50 mm as the mesh size considering the void size in this study ranges from 100–140 mm.

4. Results Analysis and Discussion

4.1. Failure Mode

4.1.1. Crack Distribution

Since the crack mainly develops on the roof during the loading process, the total roof load is used as the parameter to measure the crack development.
When the load was increased from 120 kN to 150 kN, three cracks appeared in the area of maximum bending moment in the roof, and a longitudinal crack appeared in the side wall. At this time, the crack width was 0.01 mm. When the load increased to 200 kN, the roof cracks increased to five, and cracks also began to appear in the tension zone of the roof support. When the load reached 400 kN, the cracks were almost all over the roof, the maximum crack width reached 0.6 mm, and the structural deflection reached 10.9 mm. The deformation limit was exceeded, and oblique cracks appeared near the support. When the load increased to 450 kN, the structure reached its ultimate load, and the roof support was sheared. The distribution of structural cracks is shown in Figure 6.
The cracking load of the hollow specimen was 120 kN, and cracks appeared under the four circular holes between the two loading points and the side walls. When the load increased to 200 kN, new cracks appeared on the side wall and at the bottom of the roof, with a crack width of 0.2 mm. When the load reached 290 kN, inclined cracks appeared on the circular hole between the roof loading point and the roof support, and the crack at the bottom of the roof had a width of 0.4 mm. When the load increased from 290 kN to 300 kN, the roof deflection increased rapidly and exceeded the limit. When the roof load increased to 314 kN, the roof was subjected to shear failure by inclined cracks. The distribution of structural cracks is shown in Figure 7.

4.1.2. Strain and Deformation Analysis

The concrete strain of the ordinary specimen is shown in Figure 8a. It can be seen that under the cracking load, the tensile strain at the cracking position of the concrete is about 100 µε, and the measured value is close to the engineering experience, which proves that the strain measurement is relatively accurate. In addition, there is no significant difference between the positions of the two measuring points of the roof (c1\c2). With the loading method used in the test, the bending moments between the loading points are equal, and the cracking of concrete is mainly affected by the bending moments. Compared with the actual load condition, the test loading causes more structural cracks, and the experimental loading method is prone to cause structural damage than the uniform load situation.
The reinforcement strain of ordinary specimens is shown in Figure 8c. It can be seen that the reinforcement strain changes significantly after the cracking load. When the load is less than 360 kN, there is a linear relationship between the reinforcement strain and the load change. When the strain exceeds 2000 µε, the reinforcement begins to yield, and the slope of the linear relationship between strain and load increases significantly. This change indicates that the moment-controlled section begins to yield at 400 kN of load, resulting in the failure of the structure.
Figure 8b is the concrete strain of the hollow structure. Compared with the ordinary structure, the concrete strain of the hollow structure is greater with more severe changes after cracking. In the experiment, more cracks were observed in the hollow structure, which is consistent with the measurement results. Figure 8d shows the reinforcement strain of the hollow structure, which is consistent with the yielding process of ordinary structural reinforcement. The reinforcement strain increases linearly after cracking, and the slope abruptly changes before shear failure.
The displacement results of the two structures are shown in Figure 9. The mechanical properties before cracking are not significantly different with relatively close cracking loads, but the stiffness of the hollow structure is smaller than that of the ordinary structure after cracking. Based on the strain changes and crack development, the roof part of the ordinary structure first reaches the limit of the flexural bearing capacity and then yields. At this time, the reinforcement in the tension zone has yielded, but the cracks cannot reach the compression area due to the reinforcement in the compression zone [28]. The roof load is transmitted to the corner through the concrete and the reinforcement in the compression zone. With the gradual increase of the load, the concrete between the loading point and the corner zone is sheared and damaged, and the structure experiences shear-compression failure. The failure mode of the hollow is similar to that of the ordinary structure. Since the hollow structure has less shear bearing capacity reserve than the ordinary structure, the damage of the structure can be divided into three sign stages: ➀ cracking—➁ yielding (damage load, with the reinforcement reaching the yield strain as a sign)—➂ failure (ultimate load). Each stage load is shown in Table 2. The bending moment results in the table are obtained according to the method of structural mechanics.

4.2. Validation of the Finite Element Model

The comparison between the structural damage obtained from the simulation results and the experimental cracking is shown in Figure 10.
It can be seen from Figure 10 that the concrete damage position obtained by the finite element simulation is highly consistent with the crack position in the test, indicating that the finite element model can effectively reflect the actual damage and cracking of the structure [29]. The displacement curve of the structure is shown in Figure 11.
The displacement results show that the finite element simulation is accurate for ordinary structures, with the ultimate load error of 0.44% and the ultimate displacement error of 3.36%. For the hollow structure, the finite element calculation makes some errors when approaching the cracking load, and the ultimate bearing capacity error is 1.91%. The error of the limit displacement is 4.42%. This result shows that the finite element model accurately and effectively simulates the actual structure.

4.3. Structural Optimization Design Based on FEM

The experiment result shows that the limit of the bearing capacity of utility tunnels depends on the shear bearing capacity of their roofs [30]. If the shear bearing capacity of the hollow structure roof is optimized, its ultimate bearing capacity can be effectively improved.
In this paper, two methods are proposed using finite element modeling to improve the ultimate bearing capacity of hollow structures.

4.3.1. Effect of Load Type

The load type of the structure has a significant impact on the ultimate shear bearing capacity [31]. For the utility tunnel structure, the ultimate shear bearing capacity of the roof is significantly different with different types of loads. The ultimate bearing capacity of the structure under different loads was investigated using the finite element model, and the results are shown in Figure 12. The ordinate in the figure is the resultant force of the load on the roof. The point load acts the same way as in Figure 5c. The uniform load is a load where the resultant force equals the point load uniformly over the entire top and side areas. According to material mechanics, the maximum shear force on the roof is equal to the same resultant force of the two loads.
The finite element model results show that under the uniform load, the cracking and yield loads of the structure are greater than those under the point load. The shear force under point load has a constant distribution, with a significantly wider maximum distribution than the shear force under uniform load. As a result, there is a decrease in cracking and yield loads of the structure.
Among different structures, the cracking load and the yield load of the hollow structure under the uniform load are increased by 15.71% and 60.08%, respectively. For the ordinary structure, the cracking load and the yield load are also increased by 16.06% and 53.05%, respectively.
The yield load of the hollow structure is more significantly affected by the shear force. When the structural load is transformed into a uniform load, the shear force decreases, resulting in a greater increase in the yield load of the structure than that of the ordinary structure. Notably, the increase in the ultimate bearing capacity of the two structures is quite different [32,33]. For ordinary structures, the ultimate bearing capacity under uniform load is 1.83 times higher than that under point load. For hollow structures, the ultimate bearing capacity is increased by 2.39 times.
Under the uniform load, the hollow structure with a hollow ratio of 16% has 89.75% of the ultimate load capacity of the ordinary structure. When the point load is applied under the same hollow ratio, the ultimate bearing capacity of the hollow structure is only 68% of the ordinary structure, suggesting that the hollow lightweight structure has great potential under the uniform load.

4.3.2. Effect of Hollow Ratio

For concrete subjected to the shearing force, the net cross-sectional area also significantly affects the shear capacity [34]. Under different hollow ratios, the net shear concrete area of the structure is different, resulting in different ultimate shear-bearing capacities.
The finite element method is used to study the mechanical properties of structures under different hollow ratios. The hollow ratio is the ratio of the opening area to the total section area, and it only changes the diameter of the holes, keeping the center point position of the holes unchanged. The displacement curves of the structure under different load types are obtained from the analysis, as shown in Figure 13.
It can be seen that under the same load type, the mechanical properties of the structure slightly vary when the hollow ratio is small. However, with the increasing opening area of the structure, the mechanical properties are weakened significantly. The specific effects of the hollow ratio are shown in Table 3.
The results in Table 3 suggest that the ultimate bearing capacity of the structure is hardly affected when the hollow ratio is less than 11%. Hollow inevitably decreases the cracking load and yield load of the structure. Therefore, the reliability of the hollow structure needs to be demonstrated in areas with independent requirements for cracking characteristics. In addition, when the hollow ratio exceeds 22% under the uniform load, the bearing capacity of the structure decreases significantly, and the hazards caused by hollow far outweigh its advantages. When the hollow rate approaches 16%, the ultimate bearing capacity of the structure is only reduced by 10.52%. Therefore, a 16% hollow rate is economical and reasonable under a uniform load.

4.4. Theoretical Calculation of Structural Bearing Capacity

The above results show that the hollow structure has advantages under proper load conditions and hollow ratio. However, there is no theoretical calculation method for the concrete hollow structure, hindering its design and promotion. For the cracking load of the hollow structure, the theoretical equation for the opening structure is derived based on the Vierendeel truss theory. The failure load (yield load) is obtained by modifying the height of the compression zone. The ultimate bearing capacity of the structure is calculated by referring to the ultimate shear bearing capacity of the concrete structure.

4.4.1. Basic Assumptions and Derivations

The inflection point of the structural moment is assumed to be located on the vertical centerline of the hole. The total shear force of the empty section is distributed to the top and bottom T-sections according to the stiffness, and the equal area of the reinforcement is replaced by the flanges of the T-section [35]. After the section is stressed, the assumption of the plane section is maintained. At this time, the stress of the structure can mainly be expressed in bending and shear, and two cases of bending and shear can be separately considered.
In the case of bending, the internal force of the structural section is shown in Figure 14.
The stress at any point can be solved by Equation (3):
σ m θ = N m θ / A θ M m θ y / I θ
where N m θ = ( M cos θ ) / y 0 , A θ = t θ b + C θ t w , in which t θ = t / cos θ and C θ = ( y 0 / 2 - Rcos θ y 1 ) / cos θ , M m θ = M ( Scos θ y 1 ) / y 0 , in which S = ( t w C θ ( C θ / 2 + t θ ) + bt θ 2 / 2 ) / A θ , I θ = bt θ 3 / 12 + ( S t θ / 2 ) 2 bt θ + t w C θ 3 / 12 + ( S C θ / 2 t θ ) 2 t w C θ .
M : The bending moment at the hole under external load
y 0 : The distance between centroids of top and bottom sections
A θ : The area of a section with an included angle θ
b : Equivalent width of reinforcement layer, which is obtained by homogenizing reinforcement into concrete, according to the principle of area, etc., to ensure As’ = As·Es/Ec. The equivalent thickness is used as the radius of reinforcement.
t w : Concrete layer width
I θ : The moment of inertia of a section with an included angle θ
S : The distance from the centroid to the upper edge of a section with an included angle θ
y : The distance from the calculation point of the section with the included angle θ to the centroid of the section. The downward direction is positive
y 1 : The distance from the centroid of the top section to the top edge
y 2 : The distance from the centroid of the bottom section to the bottom edge
The rest of the symbols are shown in Figure 14. To consider the effect of hole spacing, the calculation model boundary is taken as the midline of the two holes. When an angular section exceeds the midline, the section area and moment of inertia are calculated only to the midline position.
In the case of shear, the shear force is distributed according to the hollow section area concerning Vierendeel truss theory. The half-section area A top and A bot of the cross-section can be obtained by calculation, and the shear force is distributed according to Equation (4):
V t = ( A top / ( A top + A bot ) ) V
Shear forces create shear stresses and moments in the calculated section, as shown in Figure 15. The stress can be calculated according to Equation (5):
σ v θ = N v θ / A θ + M v θ y / I θ
where N v θ = V t cos θ ; M v θ = ( t θ + C θ + r S ) V t sin θ .
In summary, after obtaining the moment stress and shear stress of any point, the plane stress state can be obtained, allowing the stress of the point to be examined.

4.4.2. Stress Distribution and Crack Load

In this section, the above method is verified in terms of cracking load and circumferential stress distribution, and reasonable simplification is made in solving cracking load.
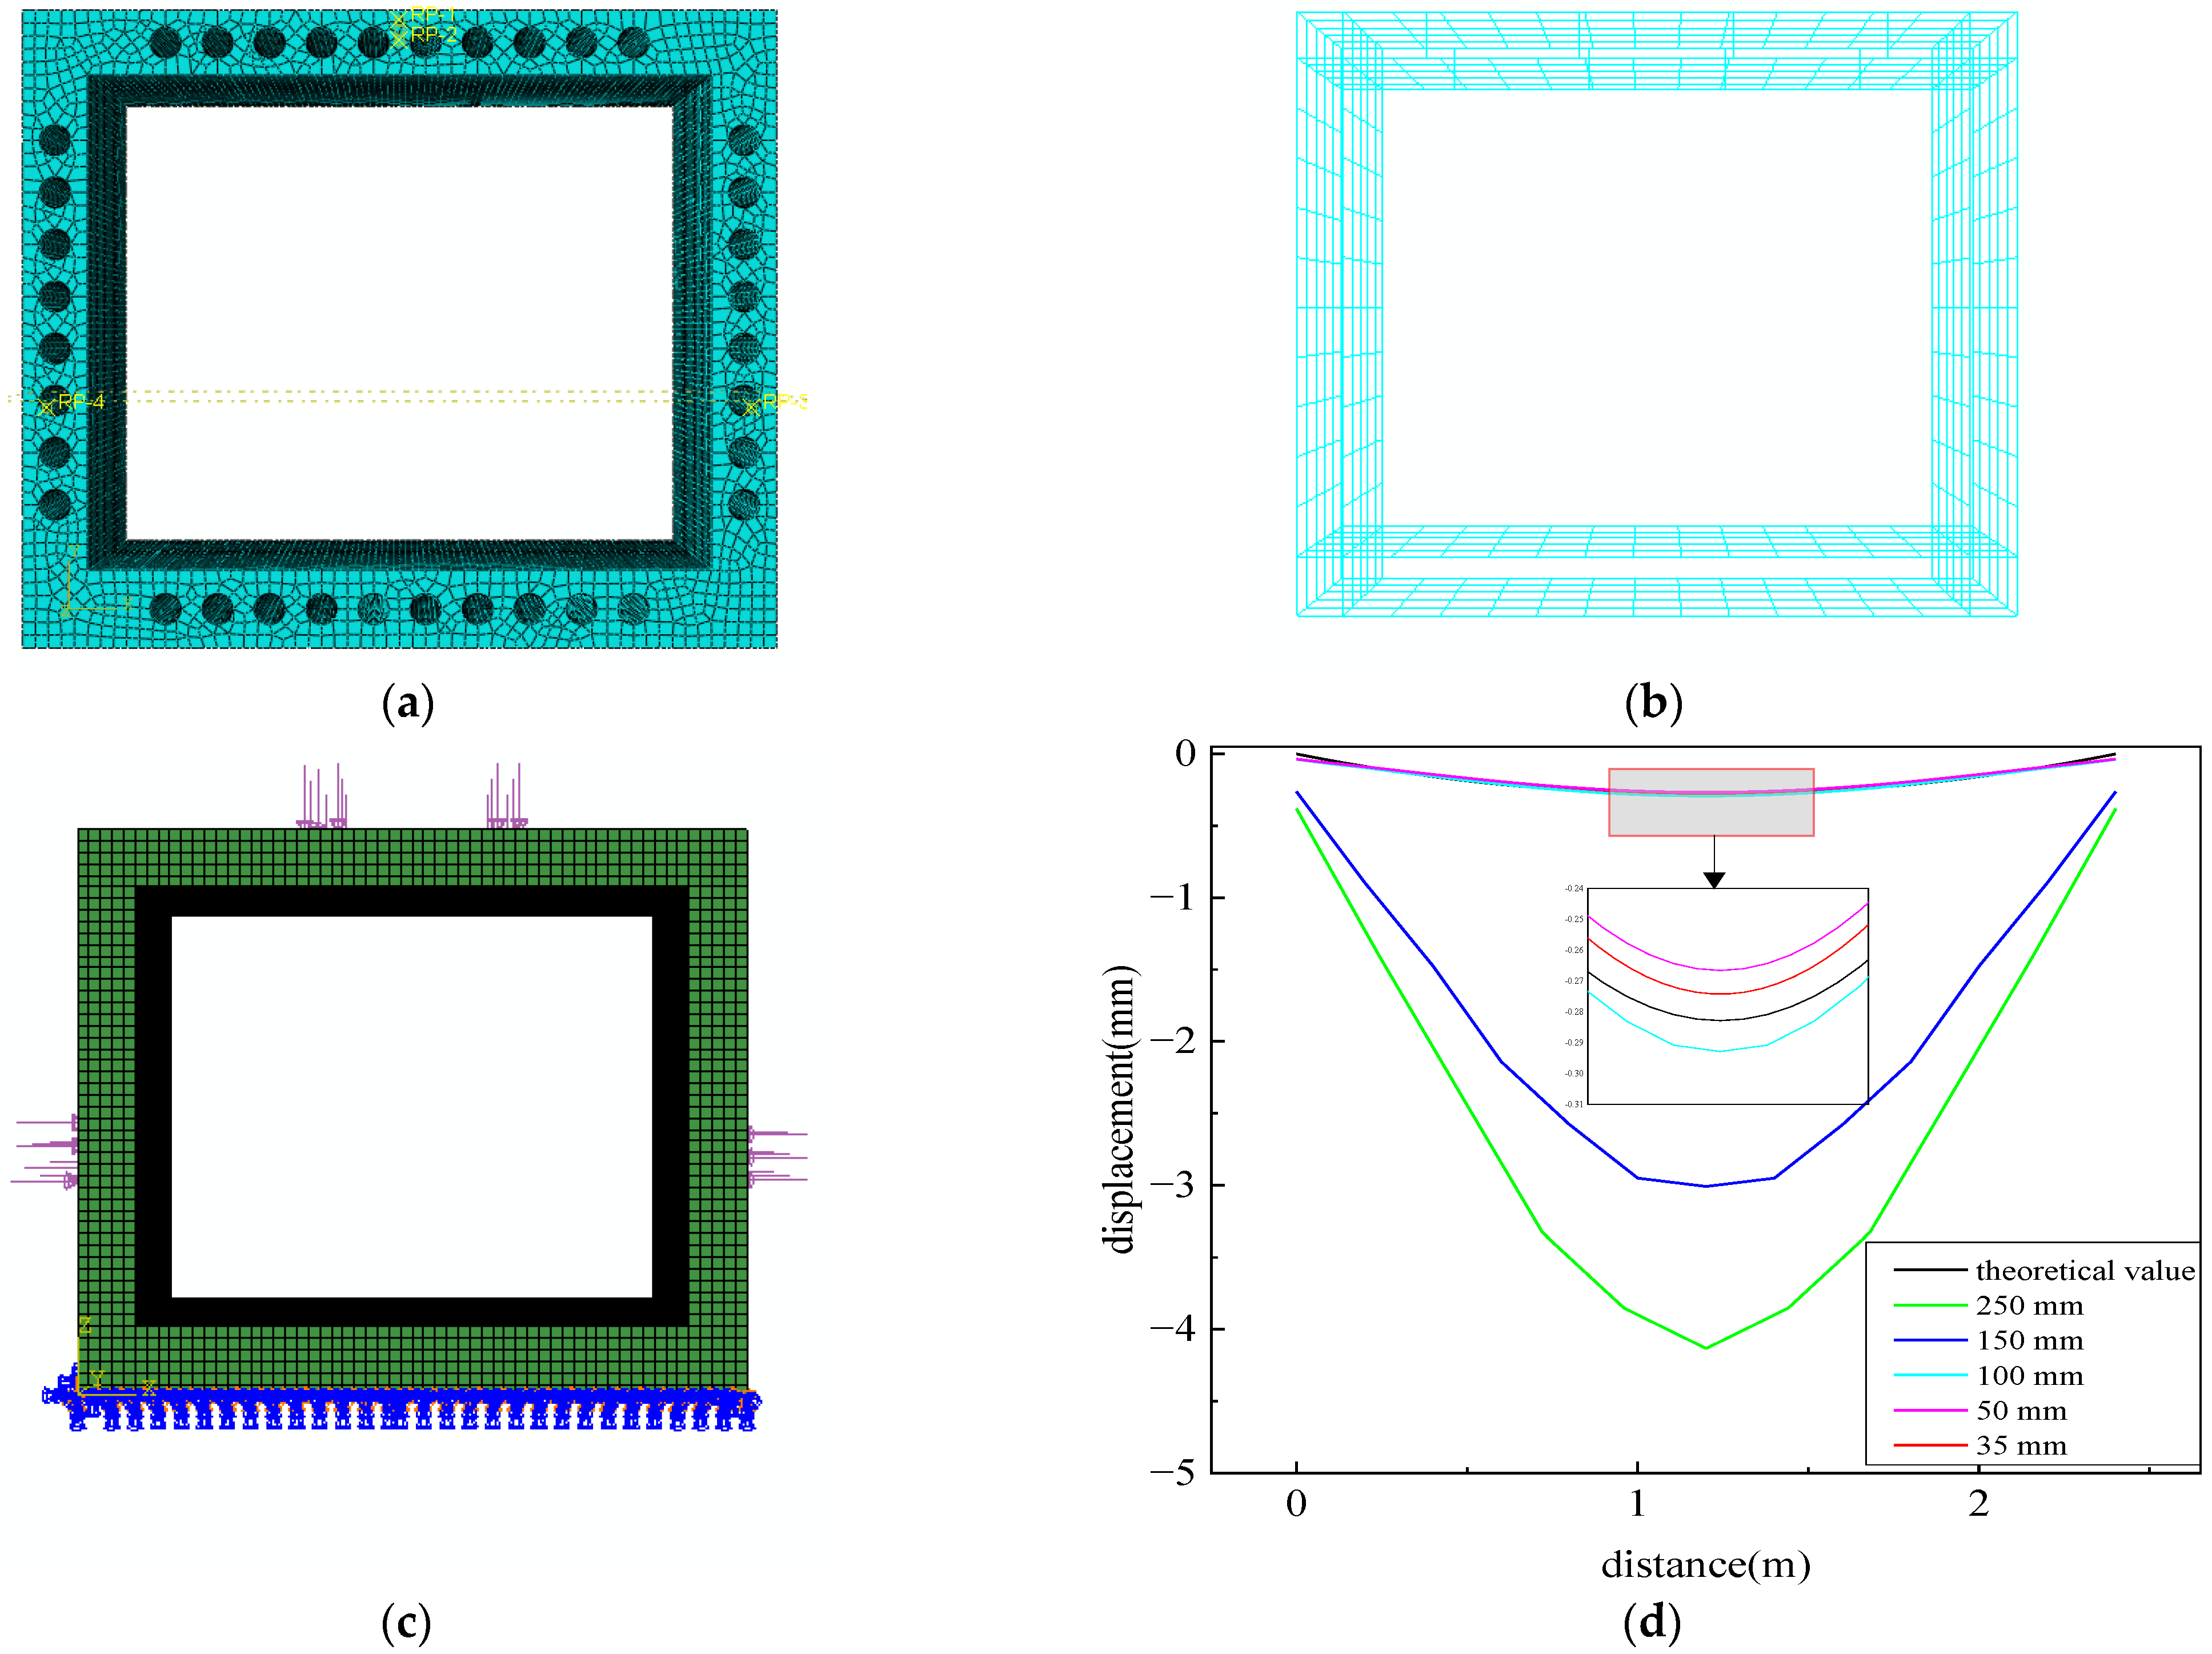
First, the circumferential stress distribution of the central circular hole in the roof of the experimental hollow structure is verified by comparing the finite element results with theoretical solutions.
The theoretical results and finite element analysis results are shown in Figure 16.
The black line in the figure indicates the position of the coordinate axis with zero stress. The compressive stress is inside the coordinate axis, and the tensile stress is outside the coordinate axis. The maximum compressive and tensile stresses obtained by theoretical calculation are −1.26 MPa and 0.54 MPa, respectively; the finite element results are −1.23 MPa and 0.56 MPa, respectively. The difference between the theoretical method and the finite element method is less than 5%, demonstrating the accuracy of the theoretical method in calculating the concrete stress.
When the concrete is not cracked, it bears shear force together with the reinforcement. Due to the large concrete area, the shear stress distributed per unit area is small. In this study, the shear stress does not exceed 8% of the normal stress, which can be ignored in the calculation of the cracking load, and only the bending moment needs to be considered. The cracking moment is calculated using the bending model above, and the cracking load can be calculated by Equation (7):
M = f c A θ y 0
where f c is the design value of concrete tensile strength; A θ is the cross-sectional area of the bottom side of the hollow structure, through which the structures with different hollow ratios can be calculated. The calculation results are shown in Table 4.

4.4.3. Yield Load

The experimental results show that the ultimate flexural capacity of the hollow structure is significantly different from that of the ordinary structure. This difference is due to the height difference in the compression zone of the concrete in hollow structures. According to the static equilibrium conditions, the height of the pressure zone of the two-sided reinforced structure can be calculated by the following Equation (7).
x = ( f y σ s ) A S / f c b
where x is the height of the compression zone, fy is the yield stress of the reinforcement in the tensile zone, σ s is the stress of the reinforcement in the compression zone, AS is the area of the reinforcement, fc is the ultimate compressive strength of concrete, and b is the width of the section. When the height of the compressive zone is less than twice the thickness of the protective layer, the reinforcement in the tensile zone yields and in the compressive zone has not yet reached the yield stress. In this case, the reinforcement stress in the compression zone can be obtained from the finite element calculation results. With the opening diameter as the independent variable and the reinforcement stress in the compressive zone at yield as the dependent variable, the calculation of the stress in the compressive zone can be obtained as follows:
σ s = 0.089 f y × tan ( 2.85 × ( 2 R / H ) )
Furthermore, the ultimate bending moment of the hollow structure can be obtained:
M = f c bx ( h 0 x / 2 ) + σ s A s ( h 0 a s )
where R is the radius of opening; H is the total height of section; h 0 is the distance from the tensile reinforcement to the edge of the compressive concrete; as′ is the distance between the steel bar and the edge of the section. According to Equation (9), the yield bending moment of the hollow structure can be obtained, and the calculation results are shown in Table 5.
The above results show that the error of the cracking and yield loads is less than 15% compared to the experimentally obtained results. The main reason for the error is that the design value of the material is used in the calculation, enabling the mechanical properties of the material to retain the safety margin. The finite element results are based on the standard values of materials. Compared with the experiment results, the finite element results are less safe, making it necessary to use the design value of materials to calculate the load [36].

4.4.4. Ultimate Load

The ultimate load of the structure is determined by the shear bearing capacity, which can be divided into the concrete bearing capacity and the shear steel bearing capacity [37]. The shear bearing capacity is calculated according to the following equation:
V c = α cv f t b w d V s = f yt A v d / s
where V c represents the shear bearing capacity provided by the concrete; α cv is the adjustment coefficient related to the load type, which is 1.75 / ( λ + 1 ) under point load actions; λ is the shear-span ratio estimated according to a / h 0 , which is taken as 3 when λ is greater than 3, and the final α cv is 0.437; f t is the design value of concrete tensile strength; b w is the width of the section; d is the effective height of the section.
V s represents the shear bearing capacity provided by the stirrups, where f yt is the design value of the shear strength of the stirrups, A v is the cross-sectional area of the stirrups, and s is the spacing between the stirrups.
The obtained shear bearing capacity is shown in Table 6.
The shear capacity of the structure is directly calculated by the standard method, and the calculated results are safe because all the material properties in the theoretical equation are the design values [38].

4.4.5. Application of Theoretical Equations

The first two subsections introduce and summarize the calculation methods of the bearing capacity of the hollow structure at each stage. The applicable scope of these calculation methods is discussed in this section.
For the structures with different hollow ratios, the numerical simulation results obtained by the finite element method are compared with the proposed theoretical calculation methods of cracking, yield, and ultimate load. For the structure without a hollow, the equation derived based on the opening structure can be regarded as a special case with zero hollow sizes. The calculation results are shown in Table 7.
The results obtained from the calculation method based on the hollow structure are almost safe, and the error is small compared with the FEM results. The calculation method can be used for the mechanical property estimation of the ordinary structure.
For the cracking load, the calculation method in this paper considers the action of reinforcement by adopting section equivalence. In addition, the bending moment distribution is also considered by adopting section centroid distance, improving the accuracy of the results.
For yield load, when the opening rate is less than 16%, the structural yielding is determined by the yielding of the reinforcement in the tensile zone, but the reinforcement in the compressive zone cannot yield at the same time. Therefore, the yield load of the structure is large. As the diameter of the opening increases, the more load is applied to the reinforcement in the compression zone of the structure. The finite element calculation results showed that the steel bars in the compressive zone also reached the yield stress when the structure yielded at the opening rate of 19%. At this condition the bending moment at yielding of the structure is provided entirely by the reinforcement and the concrete has no role. As the opening ratio increases to 22%, the flexural load capacity at yield of the structure is even less than the bending moment provided by the reinforcement alone. This indicates a compression deformation of the structure at yield that is not consistent with the flat section assumption. Therefore, when steel and concrete act together as a reasonable condition for opening, the opening rate should not exceed 16%.
For the ultimate load, only the bearing capacity of the concrete in the most unfavorable section is considered for the hollow structure. When the hollow size is small, the error is relatively large, while the error decreases rapidly when the hollow size increases. The results indicate that the shear failure of the hollow structure is not the most unfavorable shear of the vertical section. It is the inclined shear consistent with the ordinary structure.

5. Conclusions

The conclusions of this study are as follows:
  • The experiment reveals that the failure mode of the utility tunnels structure is the roof shear failure. The failure of the structure can be divided into three stages: cracking, yield, shear failure. The cracking load is controlled by the bending moment, the yield is regulated by the combination of bending moment and shear force, and the failure is guided by the shear bearing capacity.
  • The finite element model built from the concrete damage model can effectively simulate the mechanical performance, cracking, and failure of the structure.
  • The type of load on the structure has a significant impact on its bearing capacity. The finite element simulation shows that the ultimate bearing capacity of ordinary structures is increased by 183% under the action of uniformly distributed loads, and the ultimate bearing capacity of hollow structures is increased by 239%. These results indicate that the hollow structure is more advantageous under a uniform load.
  • The hollow ratio of the structure has a significant influence on the mechanical properties of the structure. When the hollow ratio of the structure is 11%, the difference between yield load and ultimate load of the hollow structure and ordinary structure is less than 6%, while the cracking load difference is greater than 10%. Therefore, it is safe, economical, and reasonable to apply a hollow ratio below 11% when no special cracking requirements exist.
  • Under the uniform load, the ultimate load of the hollow structure with a hollow ratio of 16% can achieve 89.48% of that of a non-hollow structure, indicating that a structure with up to 16% hollow ratio is economically reasonable.
  • The proposed calculation equation can be extended to the ordinary structure. It can be applied to a structure with similar hollow patterns and sizes and a hollow ratio of up to 19%. If these conditions are not satisfied, the result may be unsafe.

Author Contributions

Conceptualization, W.L. and Y.F.; methodology, Y.F.; software, Y.F.; validation, W.L., Y.F., and N.L.; formal analysis, Y.F.; investigation, Y.F.; resources, Y.F.; data curation, Y.F.; writing—original draft preparation, Y.F.; writing—review and editing, W.L. and N.L.; visualization, Y.F.; supervision, W.L.; project administration, N.L.; funding acquisition, W.L. All authors have read and agreed to the published version of the manuscript.

Funding

This research was funded by THE NATIONAL NATURAL SCIENCE FOUNDATION OF CHINA, grant number 51778143 and A Project Funded by the Priority Academic Program Development of Jiangsu Higher Education Institutions, grand number (CE02-1-51).

Data Availability Statement

The data are available from the first author on request.

Acknowledgments

The authors would like to thank Southeast University.

Conflicts of Interest

The authors declare no conflict of interest.

References

  1. Wang, T.; Tan, L.; Xie, S.; Ma, B. Development and applications of common utility tunnels in China. Tunn. Undergr. Space Technol. 2018, 76, 92–106. [Google Scholar] [CrossRef]
  2. Chu, I.; Woo, S.; Woo, S.I.; Kim, J.; Lee, K. Analysis of Vertical Earth Pressure Acting on Box Culverts through Centrifuge Model Test. Appl. Sci. 2022, 12, 81. [Google Scholar] [CrossRef]
  3. Yi, W.; Yan, L.; Peng, Z. Static Load Test and Finite Element Analysis on Full-scale Model of Utility Tunnel Structure without Axillary Angle. J. Hunan Univ. Nat. Sci. 2019, 46, 1–10. [Google Scholar] [CrossRef]
  4. Garg, A.K.; Abolmaali, A.; Fernandez, R. Experimental investigation of shear capacity of precast reinforced box culverts. J. Bridge Eng. 2007, 12, 511–517. [Google Scholar] [CrossRef]
  5. Ramadan, S.H.; El Naggar, M.H. Field Monitoring and Numerical Analysis of Large-Span Three-Sided Reinforced Concrete Culvert. J. Geotech. Geoenviron. 2021, 147, 1–15. [Google Scholar] [CrossRef]
  6. Pan, Y.; Yi, D.; Wu, W.; Bao, Y.; Guo, R. Mechanical performance test and finite element analysis of prefabricated utility tunnel L-shaped joint. Struct. Des. Tall Spec. Build. 2020, 29, e1748. [Google Scholar] [CrossRef]
  7. Wang, P.; Wang, S.; Alipujiang, J. Calculation and Numerical Analysis of Mechanical Properties of Single Warehouse Utility Tunnel with Different Axillary Thickness. J. Basis Sci. Eng. 2019, 27, 442–452. [Google Scholar] [CrossRef]
  8. Wang, P.; Wang, S.; Khan, M.I.; Zhu, C. Bending mechanics model and value of transverse joints in precast prestressed utility tunnel. J. Asian Archit. Build. 2020, 19, 203–219. [Google Scholar] [CrossRef]
  9. Wu, J.; Xie, Z.; Xu, J.; Jiang, L. Mechanical properties of single-cabin rectangular vertical prefabricated pipe gallery. Chin. J. Appl. Mech. 2020, 37, 1065–1072. [Google Scholar]
  10. Wang, S.; Jierula, A.; Wang, P.; Liu, W. Mechanics Performance Analysis of Precast Rectangle Box Culvert and Damage Prediction of Key Parts. J. Northeast Univ. Nat. Sci. 2018, 39, 260–265. [Google Scholar] [CrossRef]
  11. Kuang, Y.; Peng, Z.; Yang, J.; Zhou, M.; He, C.; Liu, Y.; Mo, X.; Song, Z. Physical and Numerical Simulations on Mechanical Properties of a prefabricated Underground Utility Tunnel. Materials 2022, 15, 2276. [Google Scholar] [CrossRef] [PubMed]
  12. Wang, P.; Wang, S.; Jierula, A.; Liu, W. Numerical Simulation and Analytical Study on Mechanical Behavior of Cast-in-Place Utility Tunnel Joint. J. Northeast Univ. Nat. Sci. 2018, 39, 1788–1793. [Google Scholar] [CrossRef]
  13. Di, J.; Sun, Y.; Yu, K.; Liu, L.; Qin, F. Experimental investigation of shear performance of existing PC hollow slab. Eng. Struct. 2020, 211, 110451. [Google Scholar] [CrossRef]
  14. Derkowski, W.; Surma, M. Prestressed hollow core slabs for topped slim floors–Theory and research of the shear capacity. Eng. Struct. 2021, 241, 112464. [Google Scholar] [CrossRef]
  15. Zhao, Y.; Cao, X.; Zhou, Y.; Wang, G.; Tian, R. Lateral Load Distribution for Hollow Slab Bridge: Field Test Investigation. Int. J. Concr. Struct. Mater. 2020, 14, 22. [Google Scholar] [CrossRef]
  16. Abbass, A.A.; Abid, S.R.; Arna'Ot, F.H.; Al-Ameri, R.A.; Özakça, M. Flexural response of hollow high strength concrete beams considering different size reductions. Structures 2020, 23, 69–86. [Google Scholar] [CrossRef]
  17. Al-Maliki, H.N.G.; Al-Balhawi, A.; Alshimmeri, A.J.H.; Zhang, B. Structural Efficiency of Hollow Reinforced Concrete Beams Subjected to Partial Uniformly Distributed Loading. Buildings 2021, 11, 391. [Google Scholar] [CrossRef]
  18. Shatnawi, A.; Almasabha, G.; Tarawneh, B. Structural Behavior of Concrete Box Culverts under Deep Burial. J. Pipeline Syst. Eng. Pract. 2017, 8, 4–8. [Google Scholar] [CrossRef]
  19. ShangHai CATC. Technical Code for Municipal Tunnel Enginneering; Tongji University Press: Shanghai, China, 2012. [Google Scholar]
  20. Abolmaali, A.; Garg, A. Shear behavior and mode of failure for ASTM C1433 precast box culverts. J. Bridge Eng. 2008, 13, 331–338. [Google Scholar] [CrossRef]
  21. China, M. Code for Design of Concrete Structures: GB 50010-2010; China Building Industry Press: Beijing, China, 2014. [Google Scholar]
  22. Ulger, T.; Okeil, A.M.; Elshoura, A. Load Testing and Rating of Cast-in-Place Concrete Box Culverts. J. Perform. Constr. Facil. 2020, 34, 04020008. [Google Scholar] [CrossRef]
  23. Ramadan, S.H.; El Naggar, M.H. Effect of large-span three-sided culvert configuration on its performance at service and ultimate loading conditions. Tunn. Undergr. Space Technol. 2022, 122, 104346. [Google Scholar] [CrossRef]
  24. Ramadan, S.H.; El Naggar, M.H. Structural performance of a medium-span RC three-sided culvert based on field measurements and numerical analyses. Can. Geotech. J. 2022, 59, 177–190. [Google Scholar] [CrossRef]
  25. Sarikaya, A.; Erkmen, R.E. A plastic-damage model for concrete under compression. Int. J. Mech. Sci. 2019, 150, 584–593. [Google Scholar] [CrossRef]
  26. Daud, S.A.; Daud, R.A.; Al-Azzawi, A.A. Behavior of reinforced concrete solid and hollow beams that have additional reinforcement in the constant moment zone. Ain Shams Eng. J. 2021, 12, 31–36. [Google Scholar] [CrossRef]
  27. Garg, A.K.; Abolmaali, A. Finite-Element Modeling and Analysis of Reinforced Concrete Box Culverts. J. Transp. Eng. 2009, 135, 121–128. [Google Scholar] [CrossRef]
  28. Cattaneo, S.; Crespi, P.; Biolzi, L. Structural Analysis and Design of Reinforced Concrete Bridge Corbels. Appl. Sci. 2020, 10, 6727. [Google Scholar] [CrossRef]
  29. Singh, G.K.; Patel, K.A.; Chaudhary, S.; Nagpal, A.K. Methodology for Rapid Estimation of Deflections in Two-Way Reinforced Concrete Slabs Considering Cracking. Pract. Period. Struct. Des. Constr. 2021, 26, 04021003. [Google Scholar] [CrossRef]
  30. Abolmaali, A.; Garg, A.K. Effect of wheel live load on shear behavior of precast reinforced concrete box culverts. J. Bridge Eng. 2008, 13, 93–99. [Google Scholar] [CrossRef]
  31. Ghahremannejad, M.; Abolmaali, A.; Mandavi, M. Shear Strength of Top Slab of Reinforced Concrete Box Culverts. ACI Struct. J. 2019, 116, 63–74. [Google Scholar] [CrossRef]
  32. Xia, Y.; Langelaar, M.; Hendriks, M.A.N. Automated optimization-based generation and quantitative evaluation of Strut-and-Tie models. Comput. Struct. 2020, 238, 106297. [Google Scholar] [CrossRef]
  33. Xia, Y.; Langelaar, M.; Hendriks, M.A.N. Optimization-based three-dimensional strut-and-tie model generation for reinforced concrete. Comput.-Aided Civ. Inf. 2021, 36, 526–543. [Google Scholar] [CrossRef]
  34. Aminitabar, M.; Kanaani, O.; Eskenati, A.R. Numerical Evaluation of the Opening Effects on the Reinforced Concrete Slab Structural Performance. Shock Vib. 2021, 2021, 1060841. [Google Scholar] [CrossRef]
  35. He, Z.; Liu, Z.; Wang, J.; John, Z. Development of Strut-and-Tie Models Using Load Path in Structural Concrete. J. Struct. Eng. 2020, 146, 06020004. [Google Scholar] [CrossRef]
  36. Geevar, I.; Menon, D. Strength of Reinforced Concrete Pier Caps-Experimental Validation of Strut-and-Tie Method. ACI Struct. J. 2019, 116, 261–273. [Google Scholar] [CrossRef]
  37. Ghahremannejad, M.; Abolmaali, A. Shear Capacity of Reinforced Concrete Box Culverts Compared with AASHTO Shear Equation. J. Bridge Eng. 2019, 24, 04019032. [Google Scholar] [CrossRef]
  38. Moradi, M.; Valipour, H.; Foster, S. Reserve of Strength in Inverted U-Shaped RC Culverts: Effect of Backfill on Ultimate Load Capacity and Fatigue Life. J. Bridge Eng. 2016, 21, 04015051. [Google Scholar] [CrossRef]
Figure 1. Reinforcement of utility tunnel specimens. (a) Reinforcement of ordinary specimens. (b) Reinforcement of hollow specimens.
Buildings 12 01483 g001
Figure 2. Support and loading position. (a) Front view of support and loading position. (b) Schematic diagram of support and loading device.
Buildings 12 01483 g002
Figure 3. Support and loading position. (a) Concrete strain gauges and displacement transducer placement. (b) Reinforced strain gauges placement.
Buildings 12 01483 g003
Figure 4. Constitutive Relations. (a) Concrete compression behavior. (b) Concrete tensile behavior. (c) Reinforcement behavior.
Buildings 12 01483 g004
Figure 5. Mesh and Boundary Condition. (a) Hollow specimen mesh. (b) Reinforcement mesh. (c) Boundary condition of point load. (d) Sensitivity of mesh size.
Buildings 12 01483 g005
Figure 6. Crack distribution of ordinary specimen.
Buildings 12 01483 g006
Figure 7. Crack distribution of hollow specimen.
Buildings 12 01483 g007
Figure 8. Load-strain curve. (a) Concrete of ordinary specimen. (b) Concrete of the hollow specimen. (c) Reinforcement of the ordinary specimen. (d) Reinforcement of the hollow specimen.
Buildings 12 01483 g008
Figure 9. Load–displacement curve of the test.
Buildings 12 01483 g009
Figure 10. Crack distribution. (a) Middle of the roof (ordinary). (b) Side of the roof (ordinary). (c) FEM result (ordinary). (d) Middle of the roof (hollow). (e) Side of the roof (hollow). (f) FEM result (hollow).
Buildings 12 01483 g010aBuildings 12 01483 g010b
Figure 11. Load–deflection curve of FEM. (a) Ordinary specimen. (b) Hollow specimen.
Buildings 12 01483 g011
Figure 12. Effect of load type.
Buildings 12 01483 g012
Figure 13. Effect of hollow ratio. (a) Distribution load. (b) Point load.
Buildings 12 01483 g013
Figure 14. Bend model.
Buildings 12 01483 g014
Figure 15. Shear model.
Buildings 12 01483 g015
Figure 16. Circumferential stress distribution.
Buildings 12 01483 g016
Table 1. Load combination of the utility tunnel.
AreaLength (m)Width (m)Area (m2)Dead Load Standard Value (kN)Standard Live Load Value (kN)Standard Load Combination Value (kN)Load Design Value (kN)
Roof2.91.13.19107.3139.08146.39198.12
Side wall2.451.12.7078.78078.78102.41
Table 2. Test load results.
SpecimenCracking Load (kN·m)Yield Load (kN·m)Failure Load (kN)
Ordinary40.5092.59450
Hollow27.7867.13314
Table 3. Test load results.
Hollow RatioCracking Load WeakeningYield Load WeakeningUltimate Load Weakening (Point Load/Uniform Load)
11%10.80%3.84%1.11%/4.68%
16%19.29%24.62%33.63%/10.52%
22%35.67%43.84%50.44%/36.78%
Table 4. Crack load of the hollow structure.
LoadExperimental Value (kN·m)Theoretical Value (kN·m)FEM Value (kN·m)
Cracking Load27.7823.8231.25
Error--−14.25%12.49%
Table 5. Yield load of the hollow structure.
LoadExperimental Value (kN·m)Theoretical Value (kN·m)FEM Value (kN·m)
Yield Load67.1367.3868.05
Error--0.37%1.37%
Table 6. Ultimate load of the hollow structure.
LoadExperimental Value (kN)Theoretical Value (kN)FEM Value (kN)
Ultimate Load314254308
Error--−19.11%−1.91%
Table 7. Comparison of results.
Hollow RatiosCracking Load (kN·m)Yield Load (kN·m)Ultimate Load (kN)
Theoretical ValueFEM ValueErrorTheoretical ValueFEM ValueErrorTheoretical ValueFEM ValueError
0%31.0238.72−19.89%73.8090.27−18.28%451452−0.22%
11%26.3234.54−23.8%71.0486.80−18.16%287447−35.79%
13%25.3331.39−19.31%69.8881.73−14.5%270369−26.83%
16%24.2531.25−22.4%67.3868.05−0.98%254300−15.33%
19%23.0828.47−18.93%57.4657.87−0.71%237259−8.49%
22%21.8024.91−12.48--50.70--221224−1.34%
Publisher’s Note: MDPI stays neutral with regard to jurisdictional claims in published maps and institutional affiliations.

