Review

Factors That Influence the Quantification of the Embodied Carbon Emission of Prefabricated Buildings: A Systematic Review, Meta-Analysis and the Way Forward

1
School of Civil and Transportation Engineering, Guangdong University of Technology, Guangzhou 510006, China
2
Guangzhou Institute of Science and Technology, Guangzhou 510540, China
3
School of Management, Guangzhou University, Guangzhou 510006, China
*
Author to whom correspondence should be addressed.
Buildings 2022, 12(8), 1265; https://doi.org/10.3390/buildings12081265
Submission received: 23 July 2022 / Revised: 11 August 2022 / Accepted: 16 August 2022 / Published: 18 August 2022
(This article belongs to the Collection Low-Carbon Buildings and Urban Energy Systems)

Abstract

:
Prefabricated buildings and off-site construction are increasingly adopted in modern construction. As one of the most concerning environmental impacts, the embodied carbon emission of prefabricated buildings has been extensively investigated in recent years. Due to the various influencing factors of carbon quantification, such as building characteristics, quantification boundary, emission sources, and quantification methods, no consensus has been reached so far. The impacts of the influencing factors on carbon quantification remain unclear. To fill this gap, this paper provides a systematic review and meta-analysis to comprehensively evaluate the recent research concerning the quantification of the embodied carbon emission of prefabricated buildings. In total, 43 peer-reviewed articles (96 building cases) were screened and analyzed. Twelve influencing factors of embodied carbon quantification have been identified and analyzed to give rise to a synthesized conclusion. The results of the meta-analysis indicated that the embodied carbon emission of prefabricated buildings varied significantly from 26.6 to 1644.4 kgCO2e/m2 in the reviewed literature. The results showed that some of the quantification factors could significantly influence the quantification results, such as the building structure forms, level of prefabrication, type of greenhouse gas considered, and data sources, while some factors have a lesser impact on carbon quantification results, such as the function of the building, quantification methods adopted, quantification tools/software used, and carbon inventory databases applied. The findings of this research provide readers with an in-depth and critical understanding of the quantification of the embodied carbon emission of prefabricated buildings. Research gaps and suggestions for future research are also provided based on the results of this work.

1. Introduction

The prefabrication of buildings has a number of benefits, including a shorter project period, less material wastage, a reduced environmental impact, fewer construction processes, a high automation level, less workmanship and error, etc. It has attracted considerable attention in the research field, owing to its growing adoption in recent decades. In China, as encouraged by government policies, 30% of all new buildings are planned to be built through prefabrication by 2030 [1]. In recent years, the carbon emission of prefabricated buildings has been a consistent focus of research. Numerous studies have been carried out to investigate the carbon emission of prefabricated buildings throughout their life cycles. The question of how to accurately quantify and mitigate the cradle-to-site embodied carbon of prefabricated buildings has been a frequently discussed topic. This is because the embodied carbon of buildings is generated in a relatively short period of time compared to operational carbon. It is a short-term and concentrated type of emission which is difficult to measure due to the complexity of the manufacturing and construction processes.
The existing studies, with different aims, scopes, and methods, have yielded very diverse results in the quantification of carbon emissions due to prefabrication. Many studies have quantified the energy consumption and carbon emission of prefabricated buildings and have proven the achievement of carbon reduction through prefabrication [2,3]. However, other studies have concluded that prefabrication and off-site construction exerted an unsatisfactory effect on carbon reduction [4,5]. The question of how to accurately quantify and thereafter mitigate the cradle-to-site embodied carbon emission of prefabricated buildings is one of the main focuses of the related literature, but the results remain diverse and mixed.
For the reasons given above, some literature reviews (summarized in Table 1) have been conducted to review and criticize the existing knowledge in this field. Boafo et al. (2016) [6] carried out a review and descriptive analysis of the relevant literature considering the degree of prefabrication, types of prefabrication in terms of materials and prefabrication methods, acoustic and seismic performance, and environmental performance of prefabrication buildings. Kamali and Hewage (2016) [7] not only described the benefits and challenges of modular construction, but also summarized environmental assessment issues, such as impact indicators, life cycle phases assessed, methods, and software used. Jin et al. (2020) [8] accomplished a bibliometric analysis of 43 studies summarizing the degree of prefabrication, mainstream off-site constructed applications, and performance indicators. More importantly, Jin et al. (2020) [8] have criticized the mainstream research regarding research methods, life cycle phases, and environmental impact assessment, and suggested future research directions. Hu and Chong (2021) [9] provided a qualitative content analysis of 55 studies focusing on state-of-the-art development for off-site manufacturing’s environmental sustainability. Van Roosmalen et al. (2021) [10] normalized the operational phase carbon emissions of prefabricated facade systems in 49 studies, but further analysis of carbon quantification was not available.
Among the above-mentioned reviews, very few of them acknowledged the variations in carbon emission quantification or attempted to disclose the correlation between the relevant influencing factors and the quantification results. In the meta-analysis conducted by Teng et al. (2018) [11], the variables influencing prefabricated building life cycle carbon emission were investigated. Twelve variables affecting the carbon emission of prefabricated buildings were identified, namely building lifespan, life cycle phase, geographic scale climatic zone, LCA method, research method, function unit, building type, building height, building material, and level of prefabrication. The results of the meta-analysis indicated the inconsistent influences of different variables on carbon emissions and the authors suggested future research directions [11]. In spite of the above efforts, a holistic review and in-depth analysis of the influencing parameters of carbon quantification, such as emission sources, quantification methods, quantification tools/software, carbon inventory databases, data sources, etc., are not available in the existing reviews. Further research on these influencing factors is yet to be carried out.
Therefore, this paper aims to address the abovementioned gaps by investigating the current status of the carbon quantification of prefabricated buildings through a literature review with a specific focus on the cradle-to-site embodied carbon. The objectives of the study are as follows:
  • To carry out a systematic review and meta-analysis of the embodied carbon emission of prefabricated buildings with a focus on carbon quantification;
  • To identify the correlations between different quantification influencing factors and carbon emissions;
  • To propose directions for future research in the existing body of knowledge.
The remainder of this paper is structured as follows. Following this introduction, Section 2 explains the scope and methodology of the present research. Section 3 elaborates the results of the review and meta-analysis. Section 4 further discusses the results and implications. Finally, Section 5 concludes the present research.

2. Methods

2.1. Scope

This research focuses on the carbon emission generated at the early stage of a prefabricated building’s life cycle, i.e., the cradle-to-site embodied carbon emissions. Cradle-to-site embodied carbon refers to the emissions associated with the raw materials’ extraction and processing, semi-finished product manufacturing, component/module prefabrication, transportation, and building construction and assembly. There were several available terminologies for the different life cycle phases in the reviewed studies. To provide comparable data for the meta-analysis, this research defines the cradle-to-site life cycle phases of prefabricated building as follows:
(P1) Raw material extraction and processing—the extraction of raw materials, such as iron ore, limestone, bauxite, silica sand, etc., and the manufacturing of semi-finished products, such as cement, iron and crude steel, aluminum ingot, and glass (including associated transportation);
(P2) Building material production—the production of building materials, such as ready-mixed concrete, rebar, steel sections, aluminum sections, glass, bricks, and tiles;
(P3) Transportation to prefabrication yard—the transportation of building materials from the factory to the prefabrication yard;
(P4) Prefabrication—the manufacturing of prefabricated components or modules, such as reinforced concrete beams and slabs, windows, and modular toilets/kitchens;
(P5) Transportation to construction site—the transportation of prefabricated components or modules from the prefabrication yard to the construction site;
(P6) Building construction and assembly—the onsite construction and assembly of prefabricated buildings.
Other phases of the prefabricated building life cycle (e.g., building operation, maintenance, demolition, disposal, and recycling) are beyond the scope of this review.

2.2. Systematic Review and Meta-Analysis

A systematic review of the literature provides a better understanding and identification of the aims, gaps, and trends of studies and identifies future research directions and improvements. The systematic review in this research follows the guidelines of the Preferred Reporting Items for Systematic Reviews and Meta-Analysis (PRISMA) [12]. A meta-analysis involves the integration of the results of a number of individual studies to draw one overall conclusion [13]. It is a systematic and quantitative method to analyze harmonized research findings. The methodological process of the literature selection is illustrated as a four-phase flow diagram in Figure 1. A detailed explanation of the methodological process is presented in the sections below.

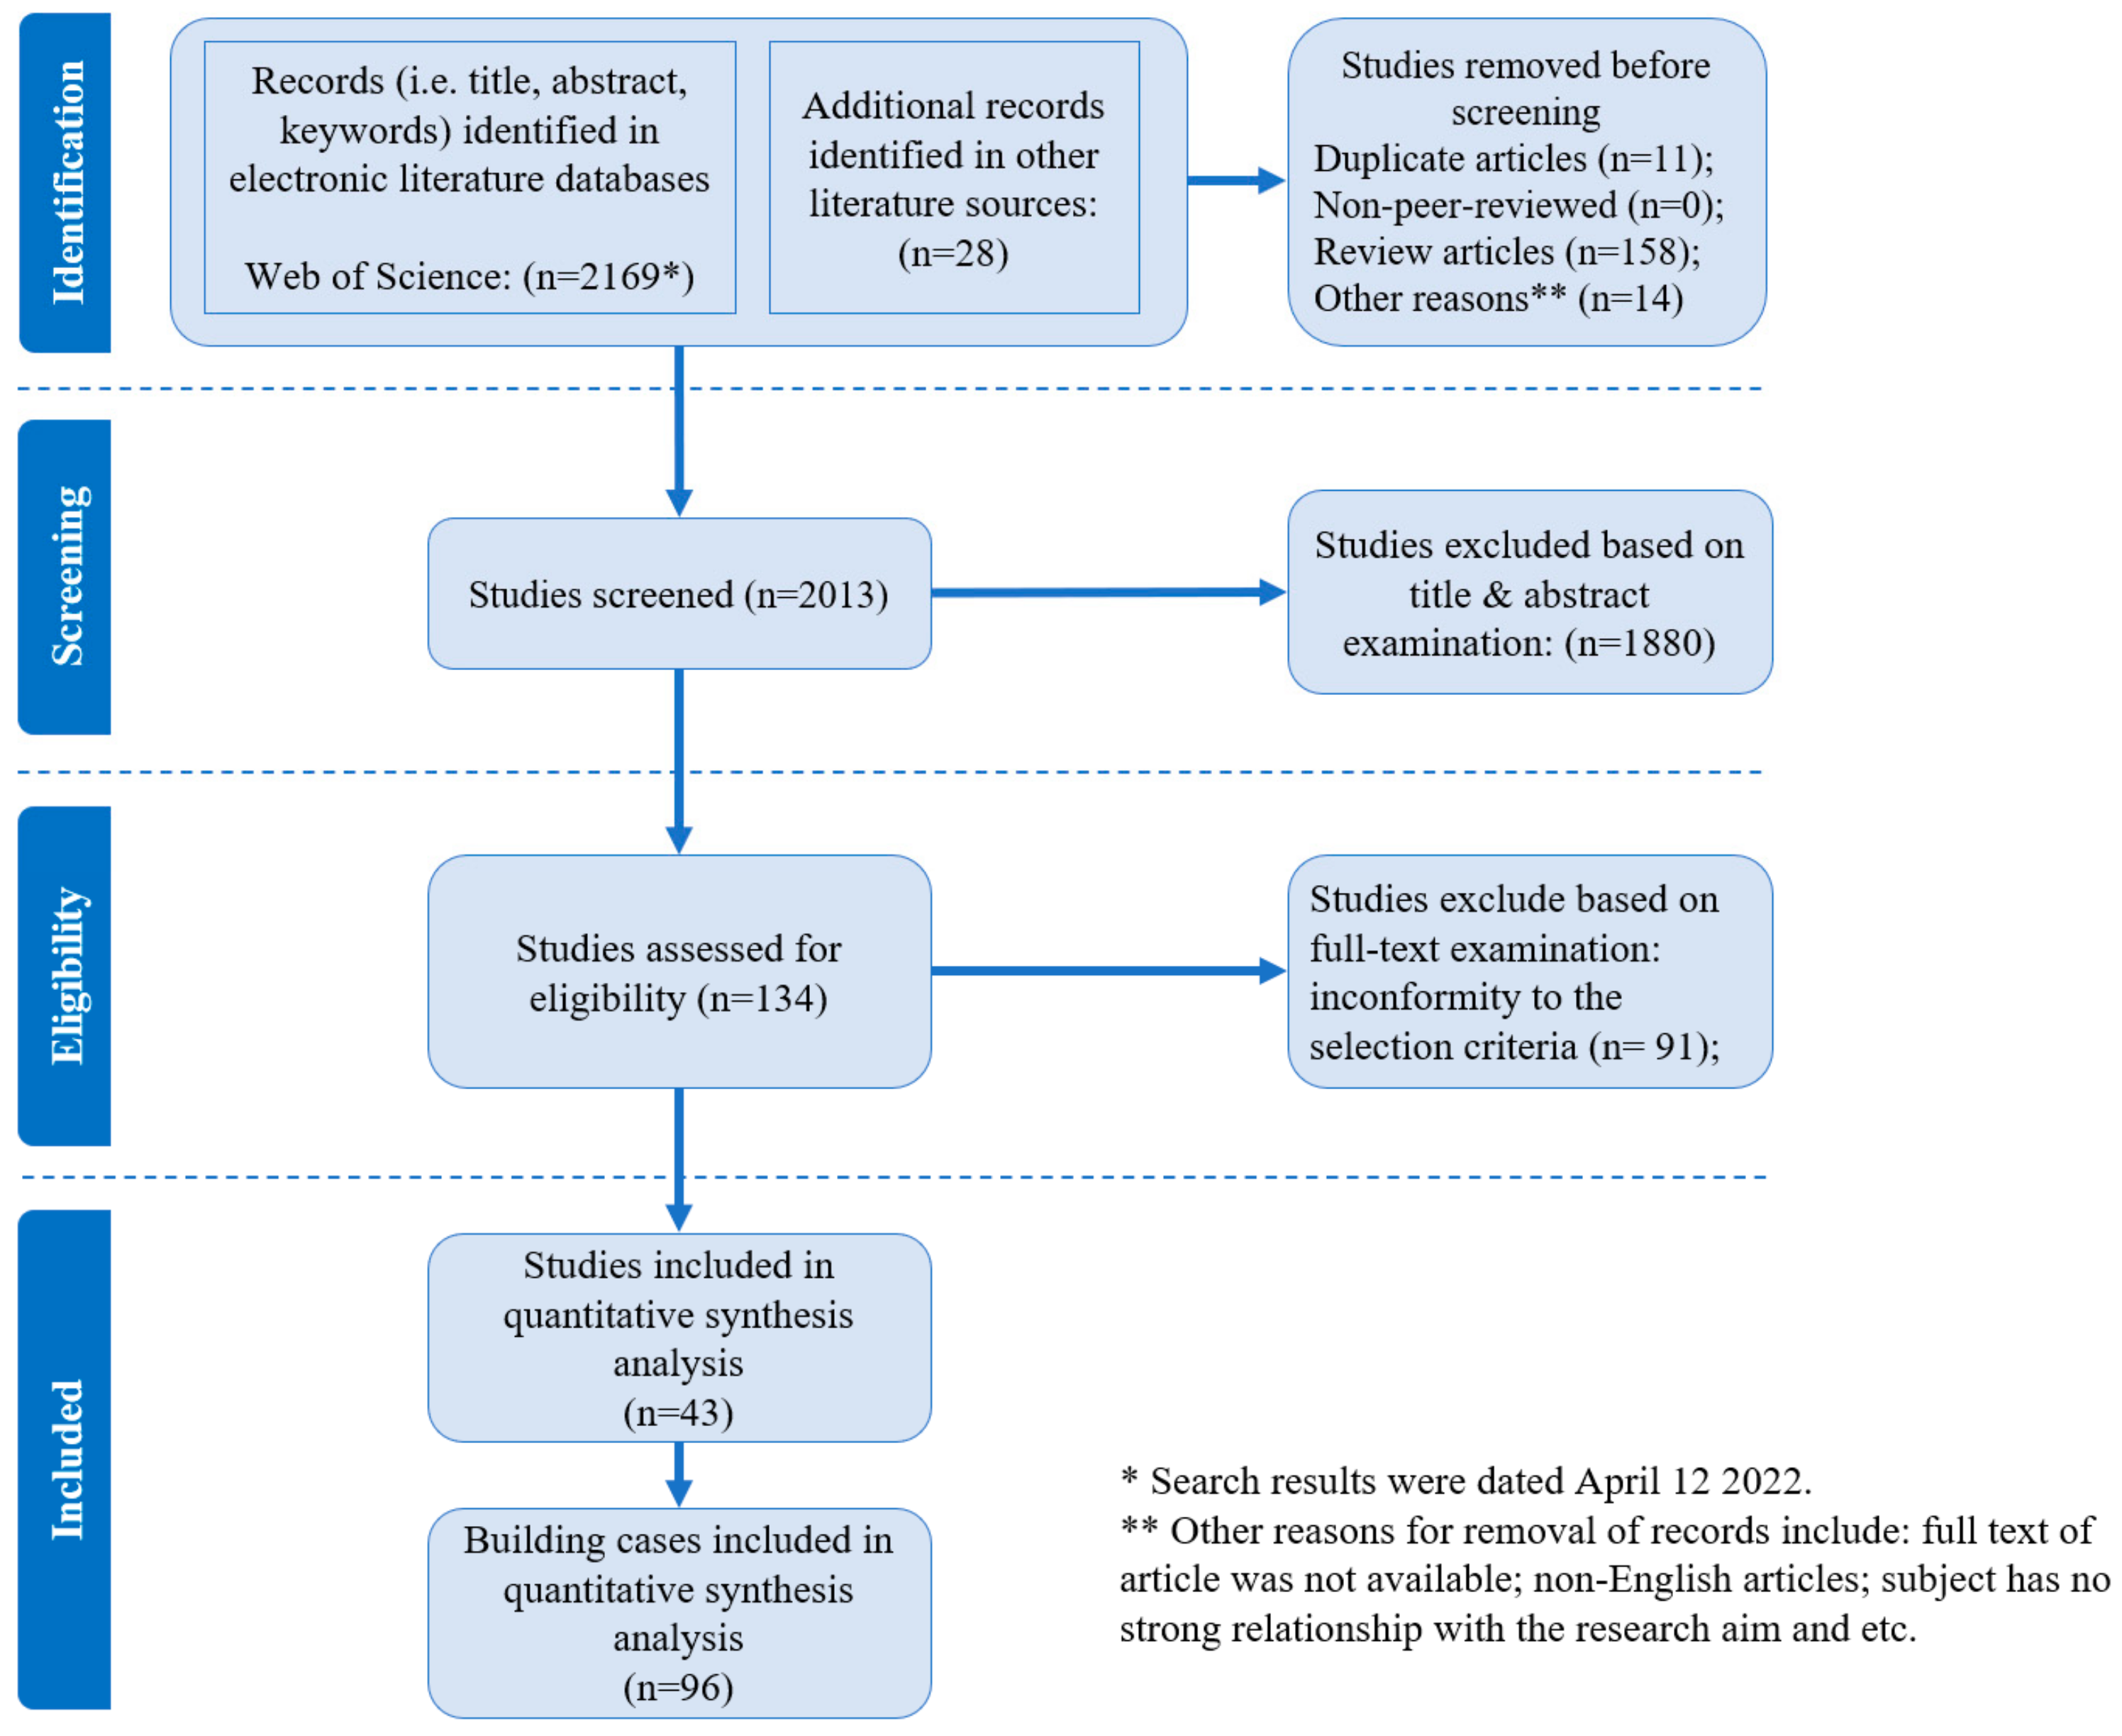
2.2.1. Literature Searching Criteria

Given the rapid development of this research topic, the search was limited to the studies published within the past 10 years (2012–2021, plus the publications available online on the date of search, on 12 April 2022). Only publications in peer-reviewed journals were considered for inclusion, and review articles were excluded. The studies to be included in this review were required to meet the following criteria:
(i)
the selected studies should quantitatively analyze the carbon emission of prefabricated buildings;
(ii)
the selected studies should consider at least one of the life cycle phases listed in Section 2.1;
(iii)
the selected studies should contain necessary information regarding carbon quantification, i.e., building size and type, prefabrication level, life cycle phase, quantification method, carbon emission sources, data quality, etc., to enable the meta-analysis.

2.2.2. Literature Search and Screening Strategy

In this research, the highly recognized academic research database Web of Science (WoS) was considered. The search strategy was to search paper subjects (i.e., article title, abstract, keywords, and keywords Plus) against the query strings, including the following keywords and combinations of keywords, which were combined with Boolean operators:
  • carbon emission;
  • greenhouse gas;
  • prefabricate;
  • fabrication;
  • modular;
  • off-site construction;
  • material;
  • component;
  • building.
As illustrated in Figure 1, the initial search gave rise to 2169 articles from WoS and 28 studies from other search sources, e.g., the reference lists of the read articles. After removing duplicate articles, review articles, non-English articles, etc., the initial screen resulted in 2013 studies. Then, the title and abstract screening and the full-text screening led to 43 valid studies (96 building cases in total) for the subsequent meta-analysis.

2.3. Data Extraction and Normalization

To enable a harmonized comparison and analysis of the reviewed studies, the information and results of the 43 studies were normalized to a set of homogenous parameters, including the basic characteristics of studies (origin country of research, publication year), building characteristics (building size, function of building, etc.), carbon emission sources (types of GHGs), carbon quantification (quantification method, carbon inventory), data quality (data sources), etc. A spreadsheet was used to facilitate the data analysis, and the collected results were analyzed using inferential statistical tools, such as regression lines and box plots to create comparable and conclusive results.
Functional units can significantly affect the results of the carbon emission analysis. The reviewed studies have adopted different functional units when analyzing the carbon emission of prefabricated buildings, such as the building unit area, mass, volume, or prefabricated component/module. Fortunately, the majority of the reviewed cases have normalized the carbon emission in the unit of kgCO2e/m2 building floor area. Therefore, this research was able to compare and analyze the carbon emission harmoniously based on this function unit.

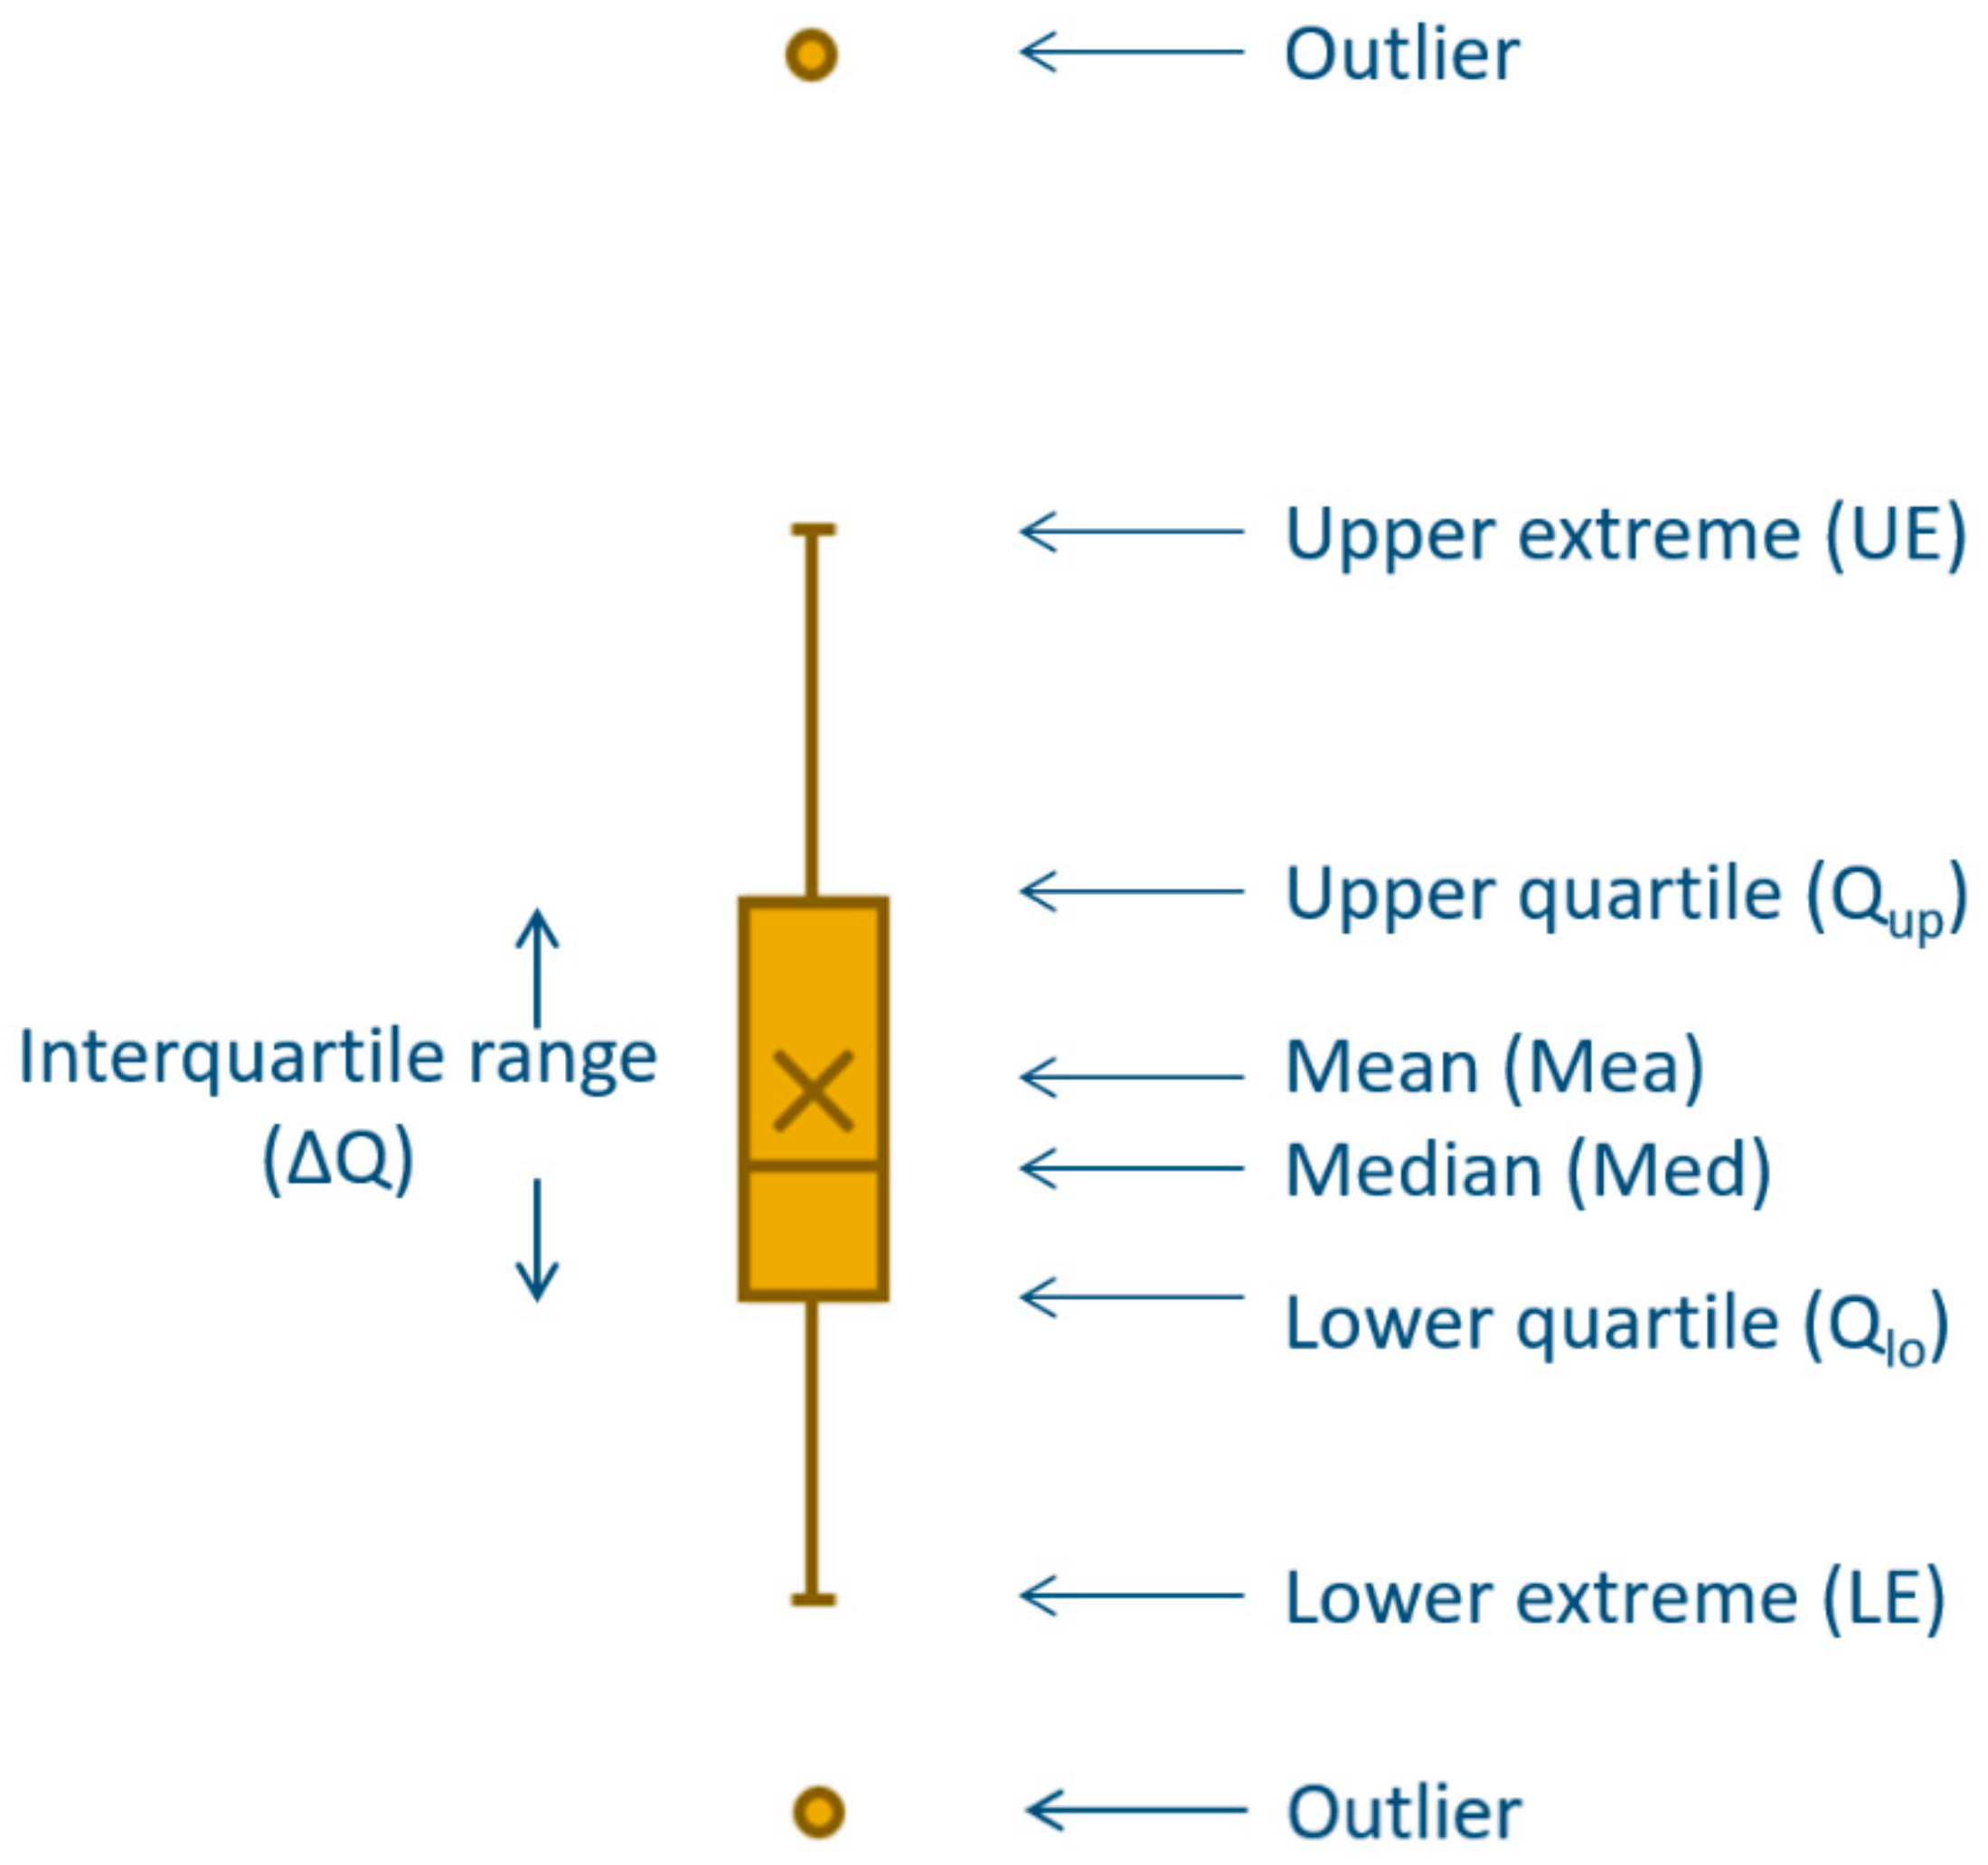
2.4. Statistical Analysis

A box plot was adopted to visualize how the quantification influencing factors affect the embodied carbon of prefabricated buildings. The box plot displays the feature values of the data set, including the upper extreme (UE), lower extreme (LE), upper quartile (Qup), lower quartile (Qlo), median (Med), mean (Mea), and interquartile range (ΔQ = Qup − Qlo). It is an effective method to identify the dispersion and skewness of a data set, and it displays clear visual summaries for statistical analysis [14]. This method was also adopted by Teng et al. (2018) [11] in their meta-analysis. In a box plot, as demonstrated in Figure 2, the inner fence Qlo − 1.5ΔQ~Qup + 1.5ΔQ of the data set was firstly calculated to define the valid range of data set. Then, the feature values were calculated after eliminating the outliers.

3. Analysis and Findings

The overview and the availability of the data of the reviewed 43 studies (96 prefabricated building cases) are summarized in Table A1 of the Appendix A. A statistical analysis of the basic characteristics of the 43 reviewed articles was first performed (Section 3.1), including the research trend across the period (year) studied, and the geographical distribution of publications.
When identifying the influencing factors of carbon quantification, opinions were drawn from some previous reviews listed in Table 1. However, as mentioned in the introduction section, the factors directly related to the quantification process have not been identified before. Therefore, this research further investigated the relevant literature [15,16,17,18] and proposed the factors related to the carbon quantification process, i.e., emission sources coverage, types of GHGs considered, quantification tools/software, carbon inventory databases, data sources, etc. In total, twelve factors that affect the quantification of the embodied carbon of prefabricated buildings have been identified, as shown in Table 2. This review classified the twelve factors into four categories based on their nature and the findings of previous studies (i.e., [11,15,17]), namely building characteristics, emission sources, quantification approaches, and data quality, as listed in Table 2. The standard deviation (SD) of the carbon emission values of the 96 cases was calculated to demonstrate their degrees of dispersion. Then, the carbon emission values of the 96 cases are analyzed against the twelve influencing factors through box plots; these meta-analysis results are further explained in Section 3.2.

3.1. Statistical Analysis of Basic Characteristics of Reviewed Studies

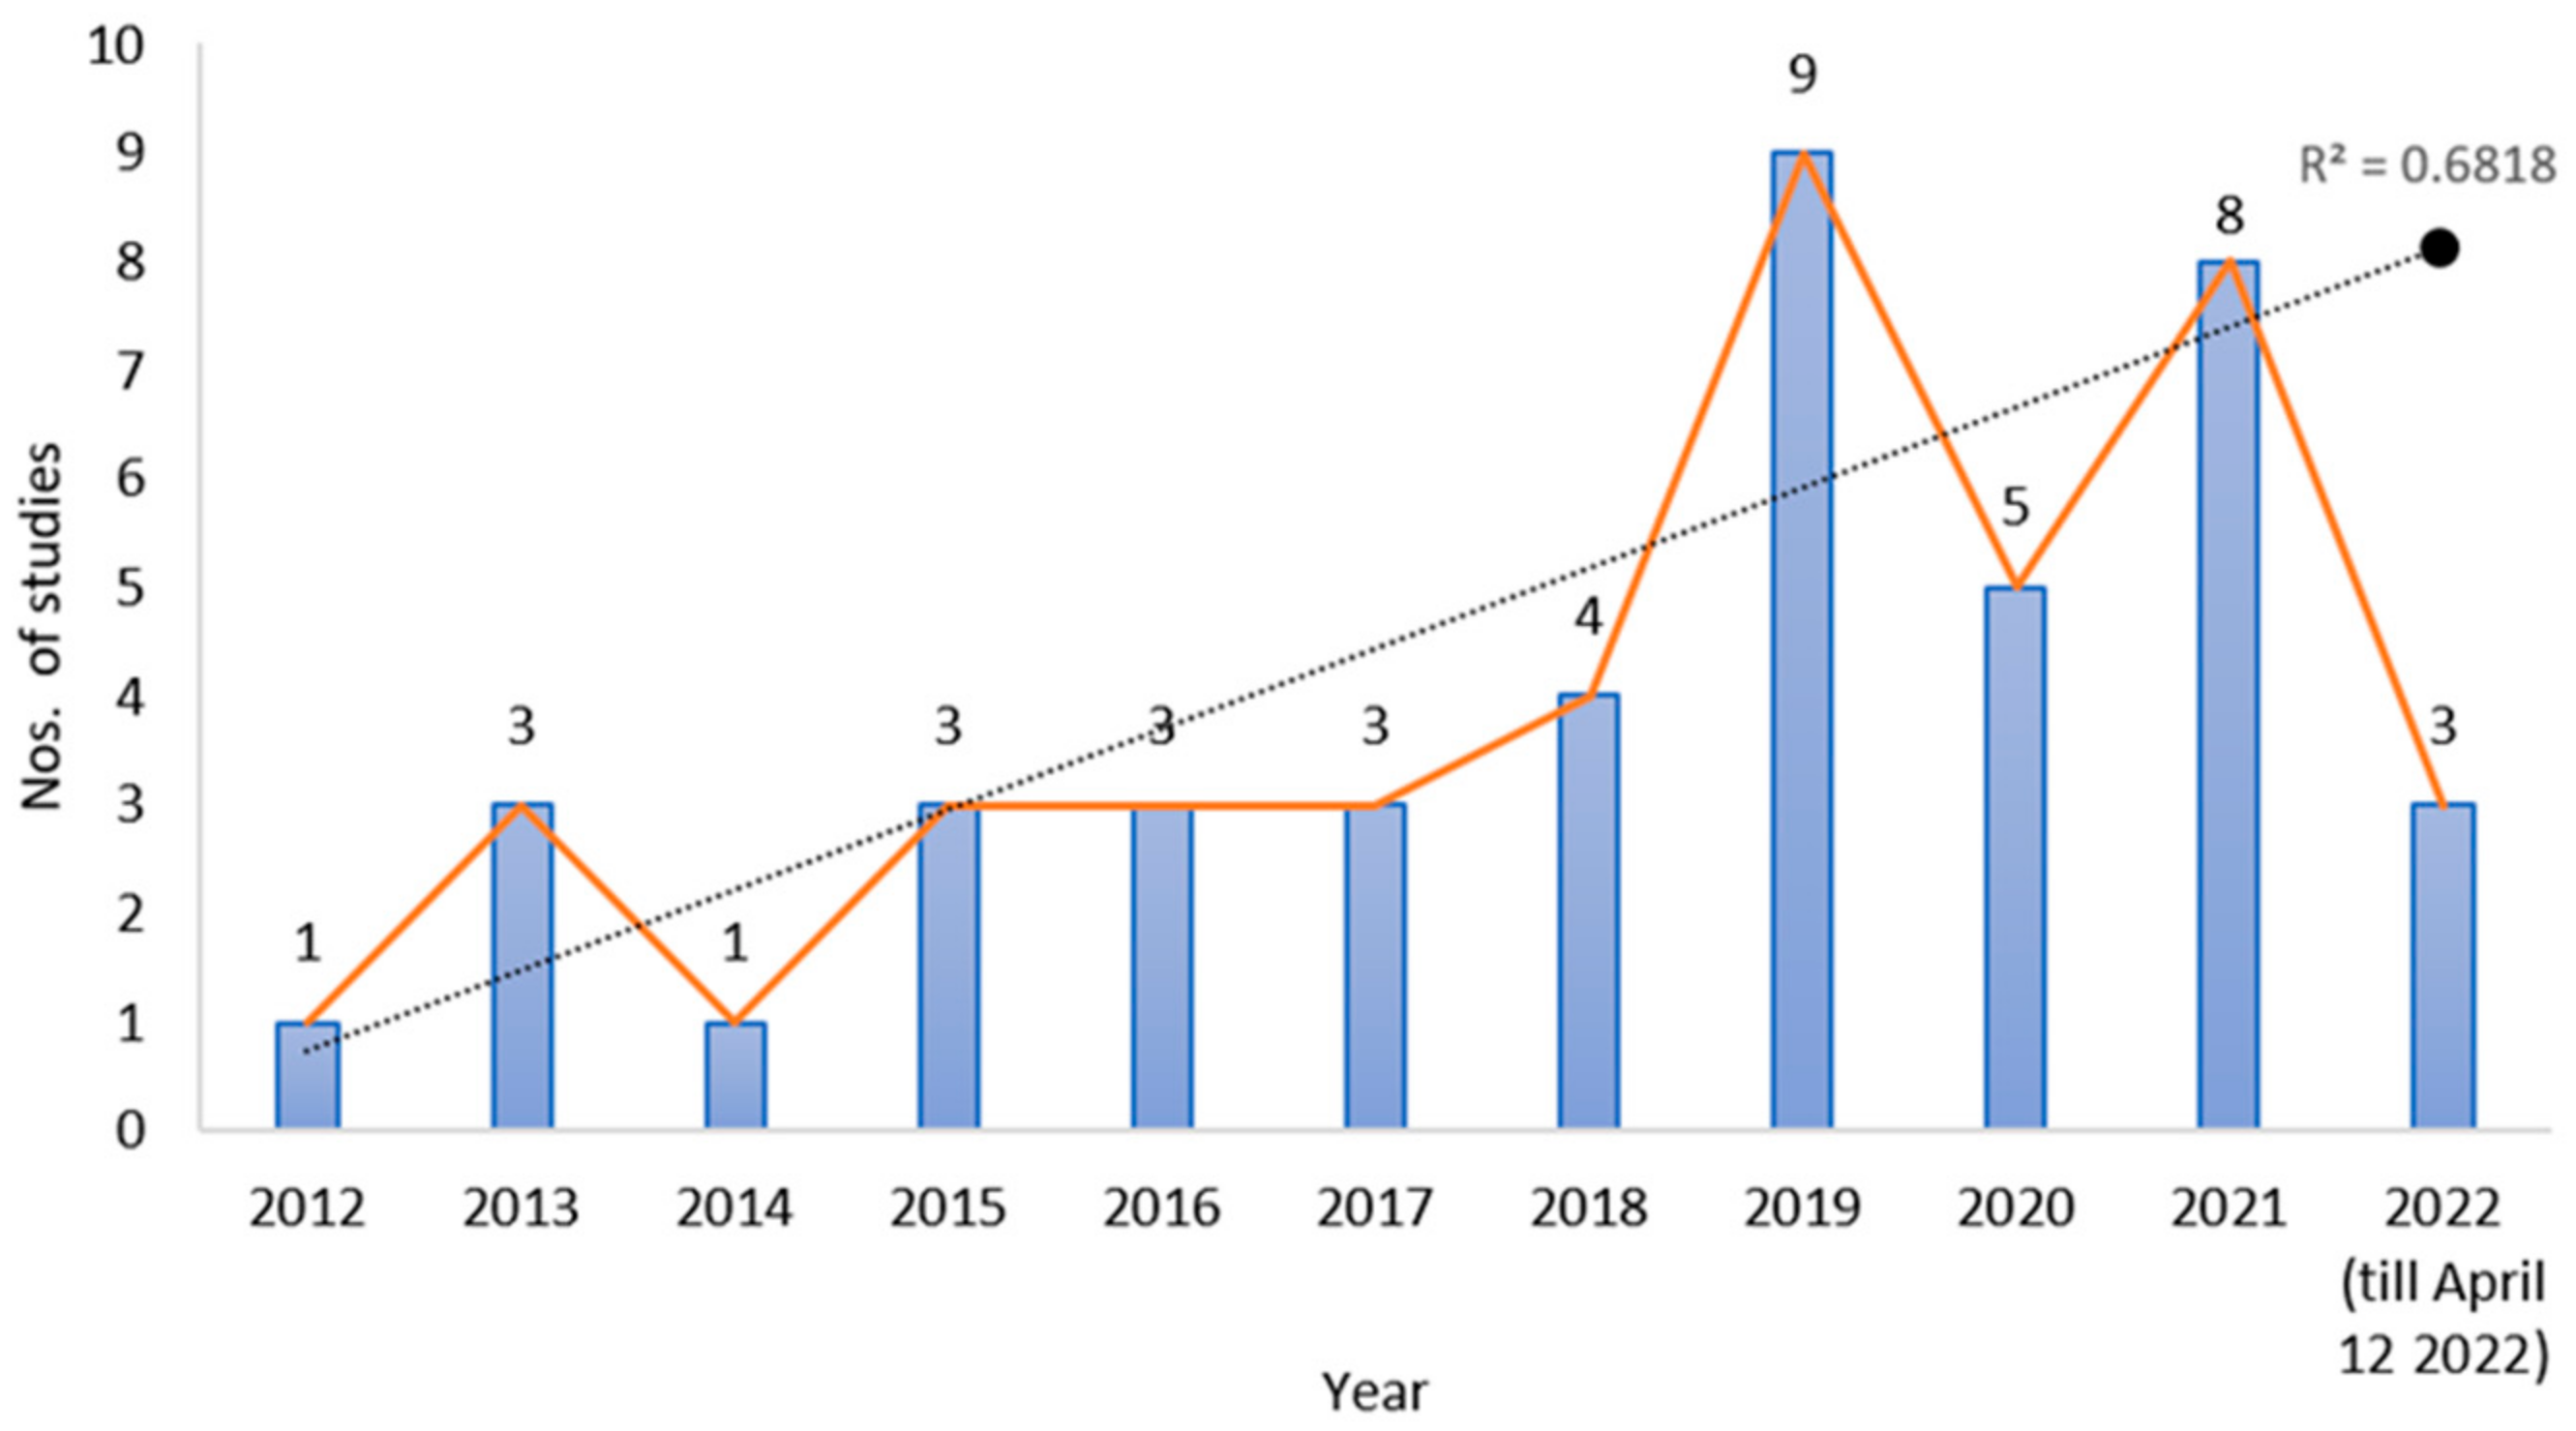
3.1.1. Research Trend across the Period Studied

Figure 3 presents the analysis of the temporal trend of the reviewed literature. There is obvious growing interest in the research subject. The total publications peaked in 2019 and have since slightly decreased; nevertheless, the overall research interest in this subject has increased steadily over the past 10 years. It is predicted that more than eight relevant publications will be published by the end of 2022 in the reviewed literature database.

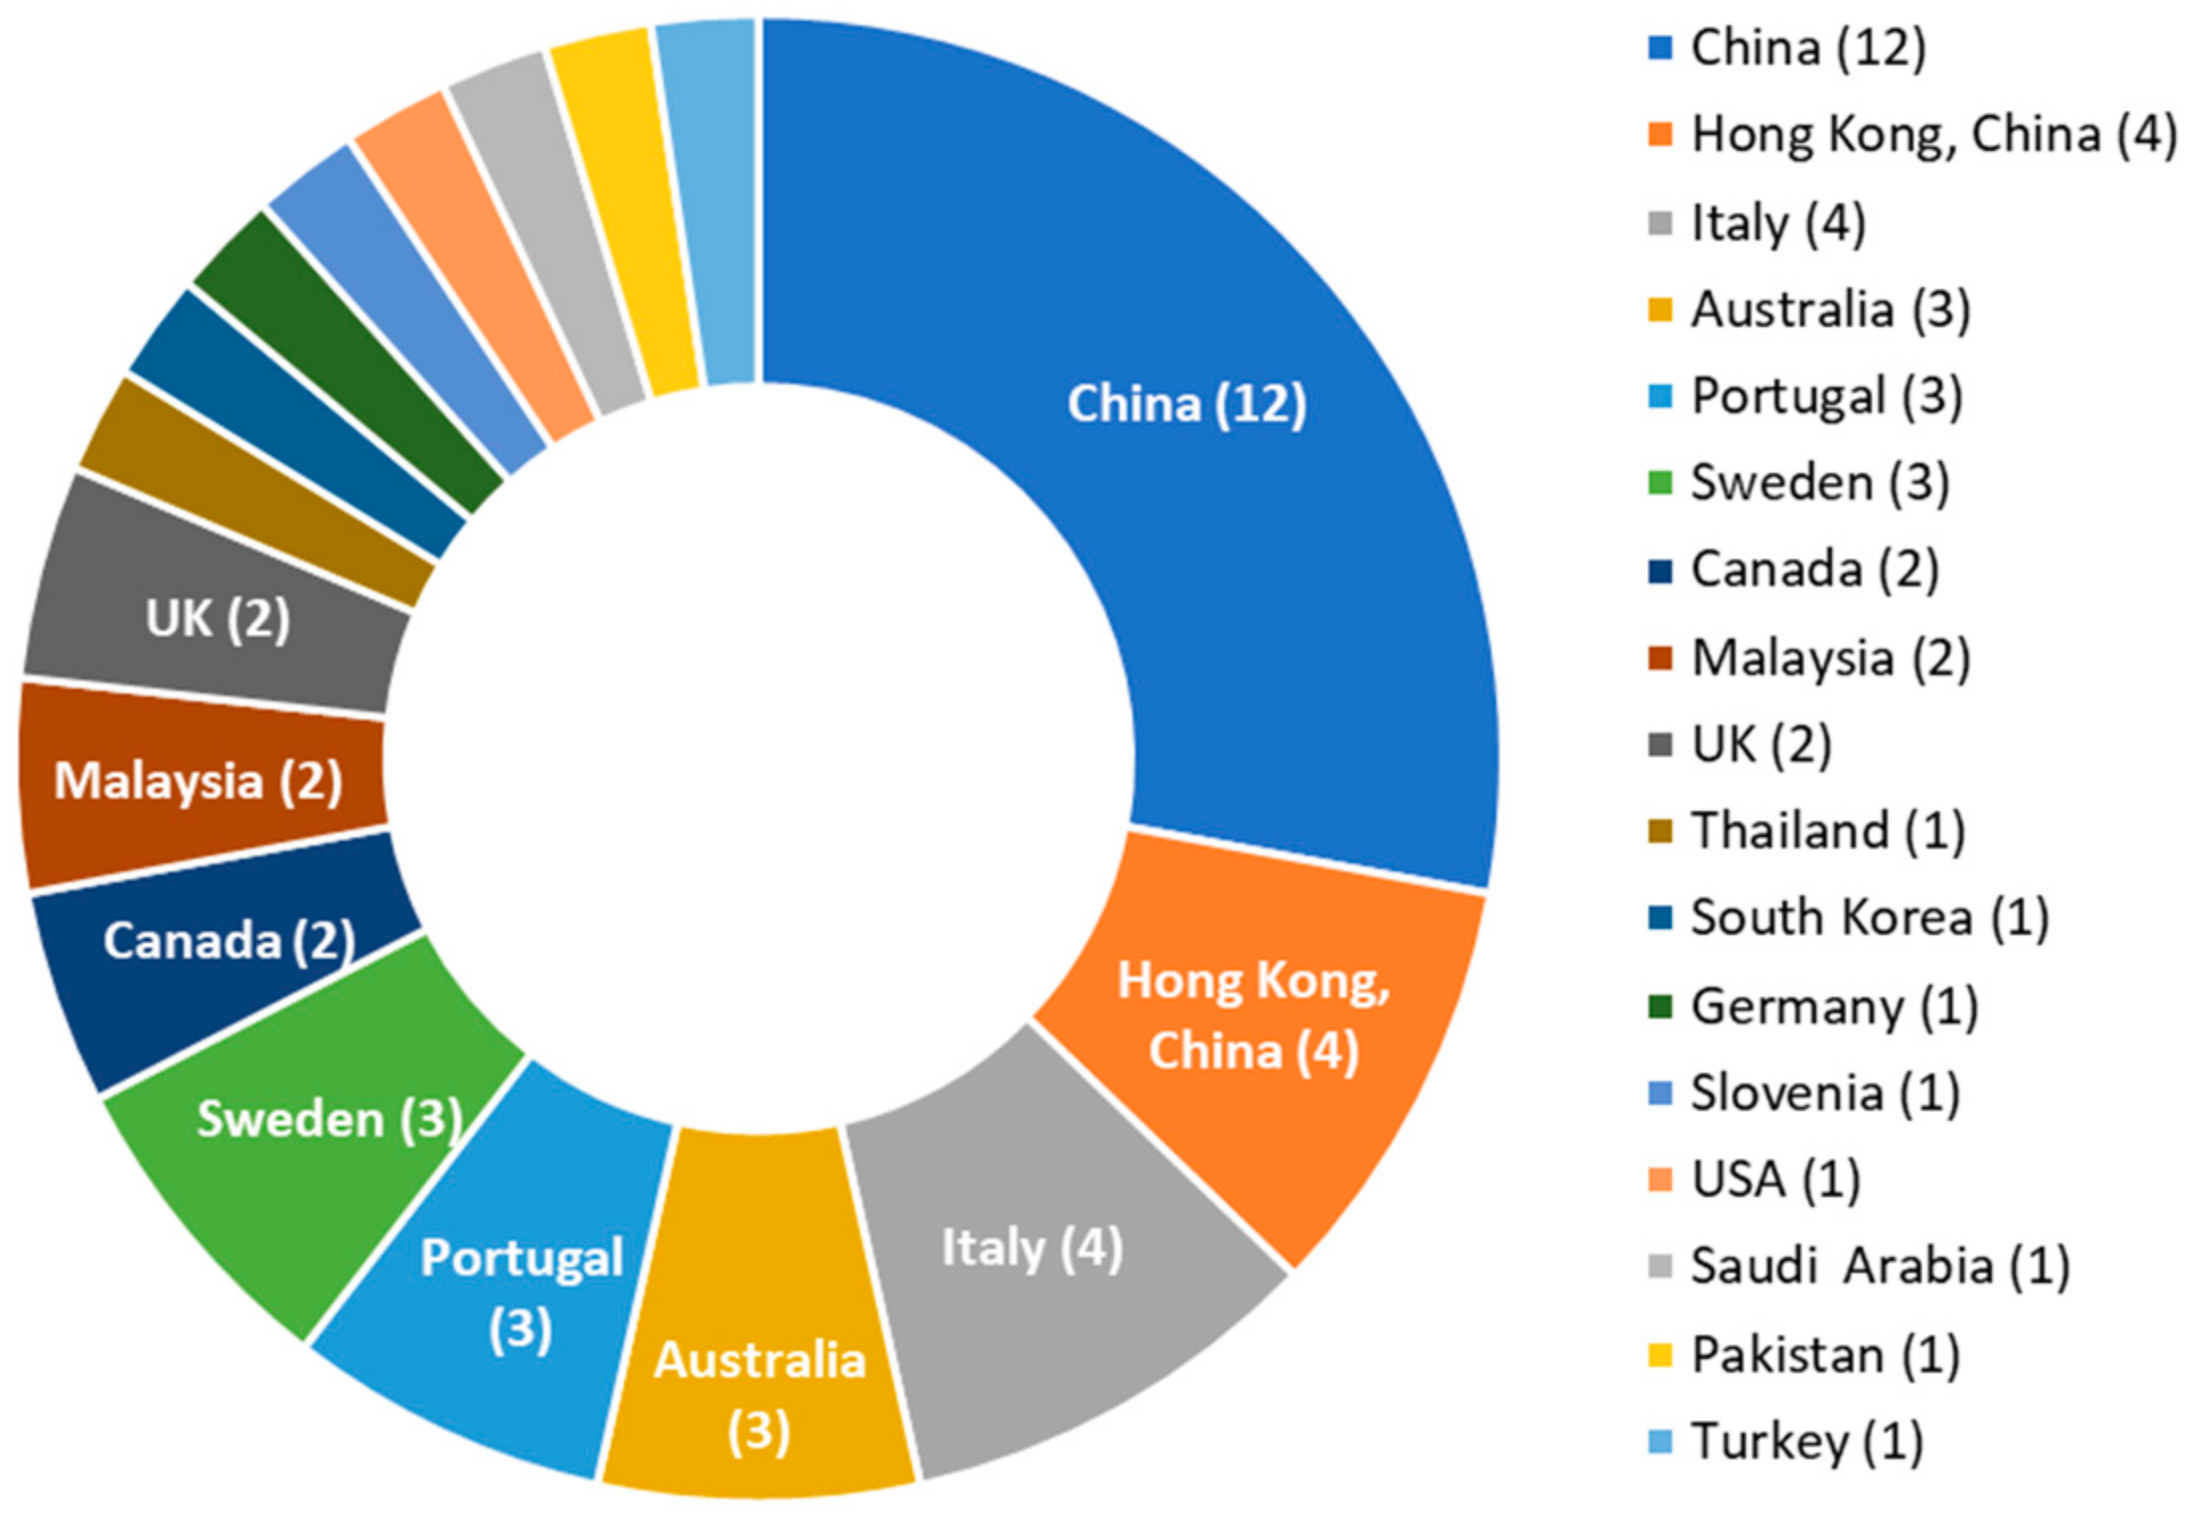
3.1.2. Geographical Distribution of Research Efforts

Figure 4 shows the geographical distribution (countries/regions) of the reviewed studies. It is interesting to observe that almost 40% (16 of 34) of the studies targeted the carbon performance of prefabricated buildings in China (including four studies in Hong Kong, China). China was followed by Italy, where four relevant studies were performed. Australia, Portugal, and Sweden each published three relevant studies. It is not surprising that China leads the research in this field. In the past several years, the volume of new construction in China has been ranked highest in the world, and the Chinese government has strongly promoted carbon reduction through prefabrication and off-site construction [1].

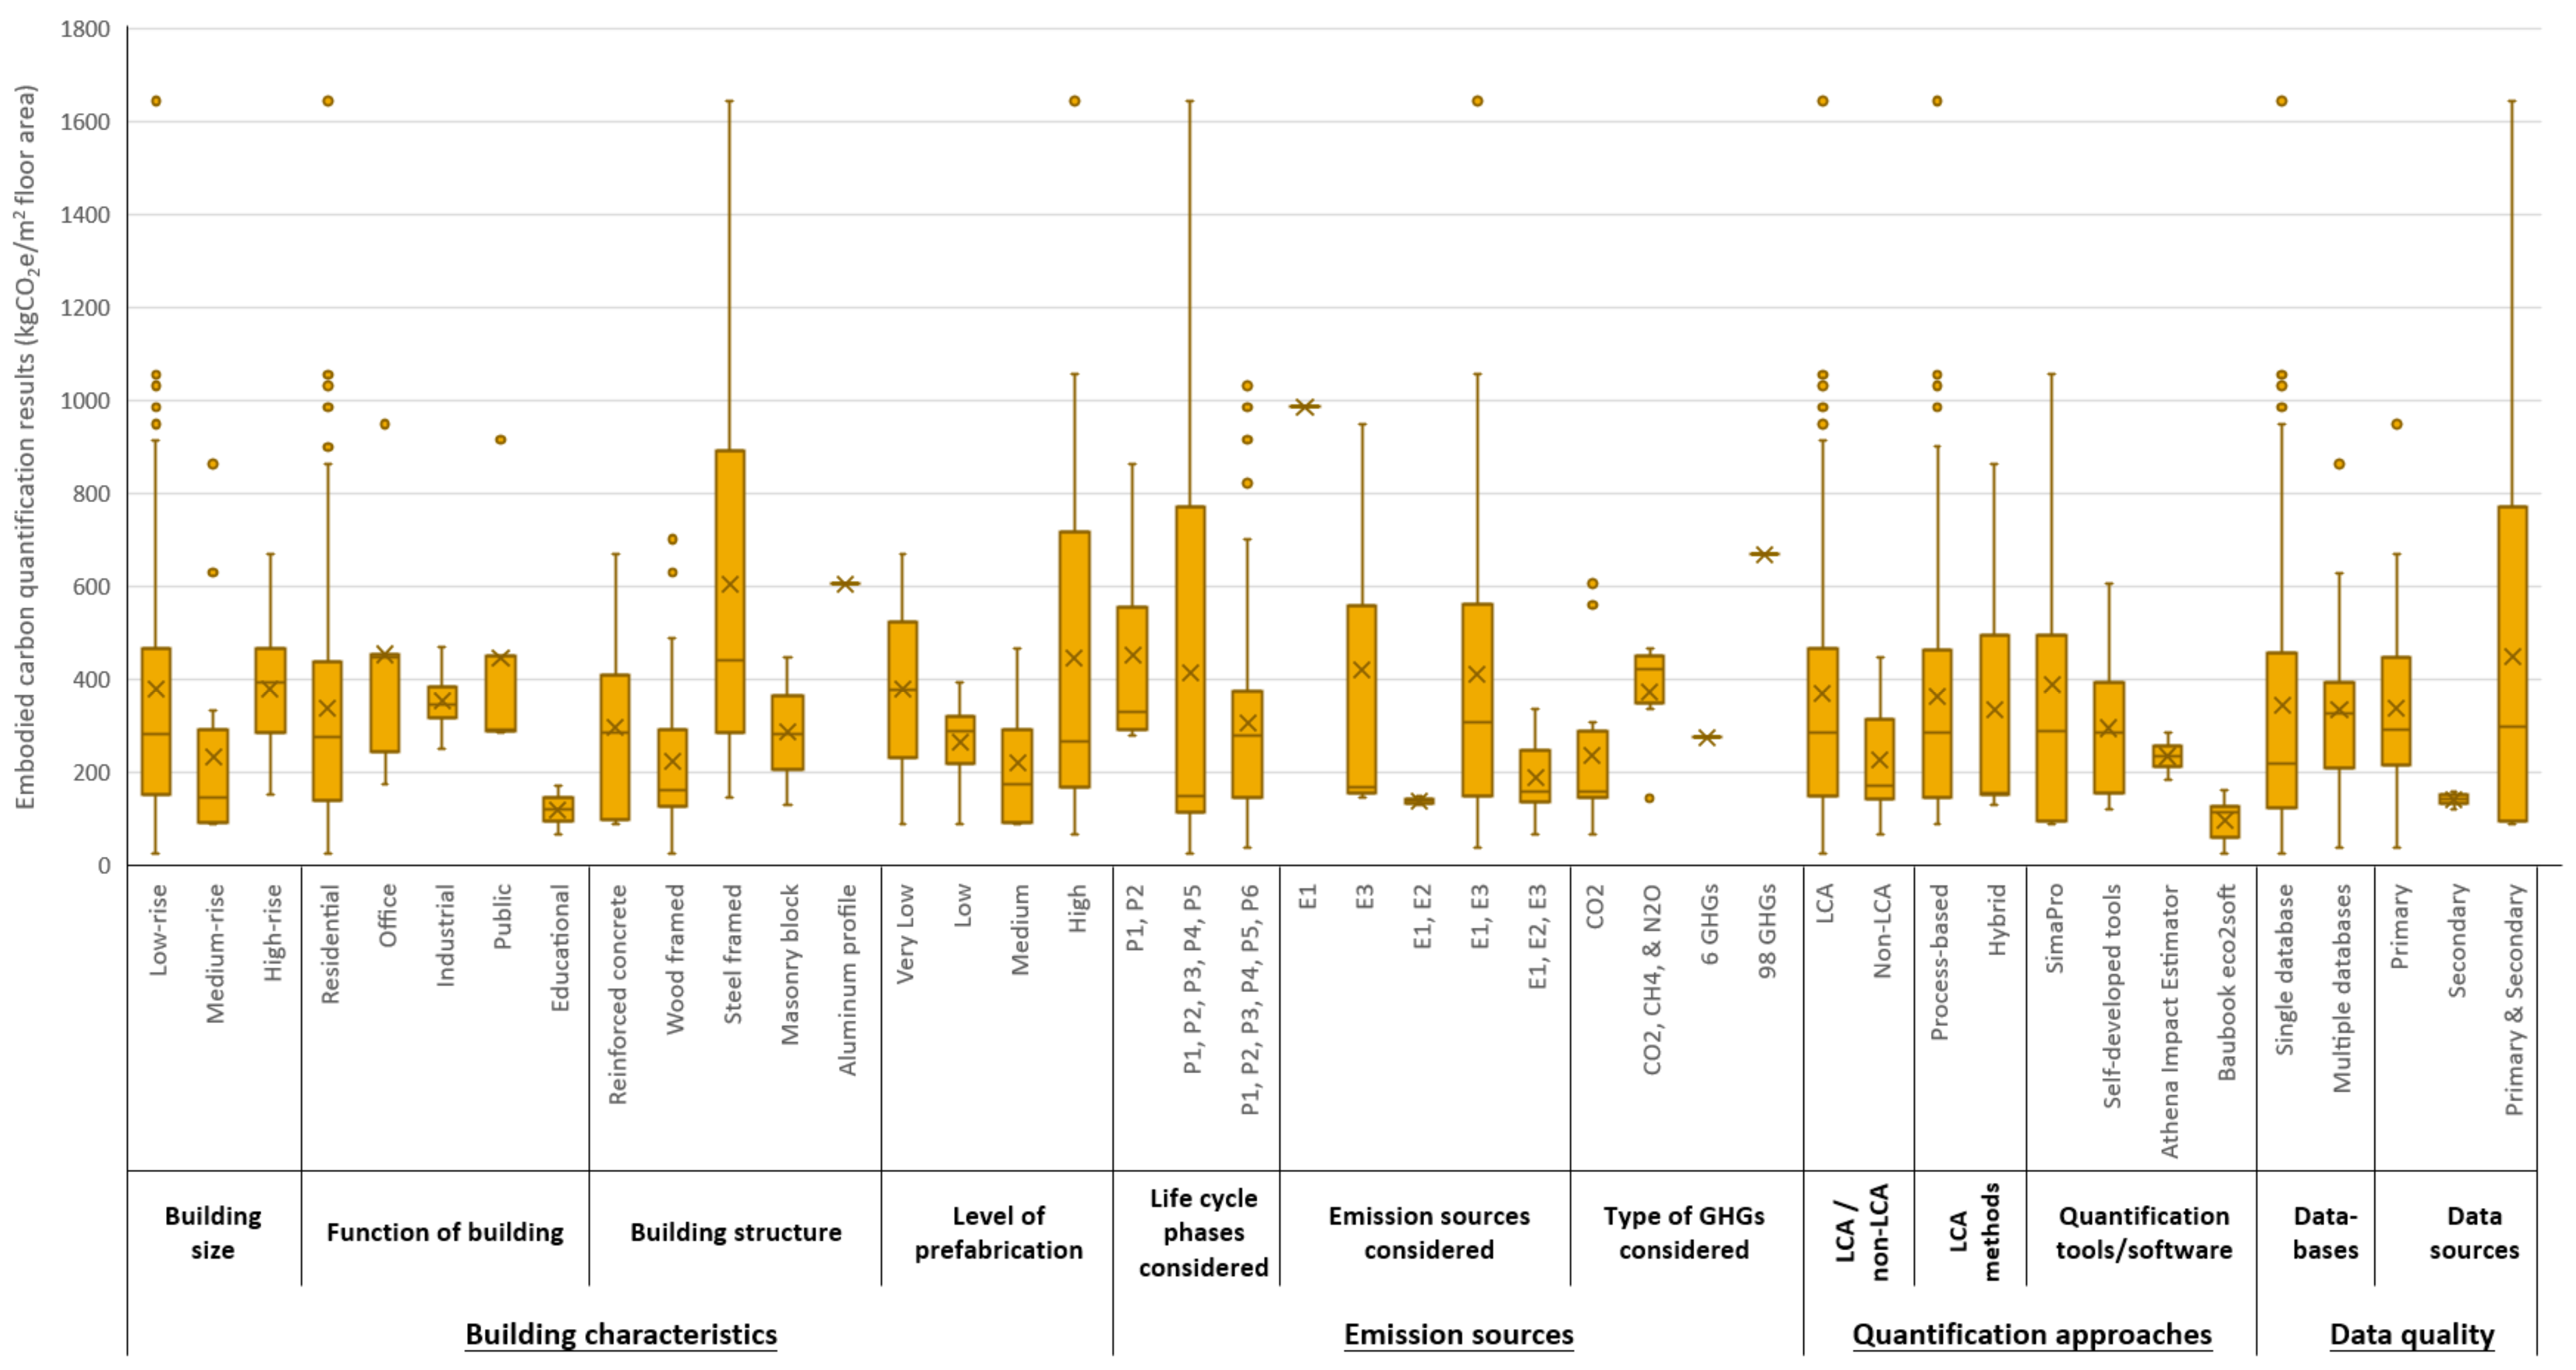
3.2. Meta-Analysis on Embodied Carbon of Reviewed Prefabricated Building Cases

The box plots in Figure 5 indicate that the minimum embodied carbon in all cases was 26.6 kgCO2e/m2 (case 56 in Table A1), and the maximum was 1644.4 kgCO2e/m2 (case 62 in Table A1). The building in case 56 was a three-story wood-frame modular house. The extremely low embodied carbon was due to the reduction in materials, i.e., the bottom plates made of reinforced concrete and thermal insulation materials were largely reduced in this building case. Moreover, this study calculated the carbon sequestration of the roof made of cross-laminated timber, which induced negative carbon emission. For case 62, an off-grid steel-frame house transformed from a shipping container, the high embodied carbon might have been due to the installation of a photovoltaic system and the construction of a prefabricated concrete foundation, which did not typically appear in other similar studies. In spite of the high embodied carbon, the building in case 62 generated very low operational carbon emission as a result of adopting the photovoltaic system.

3.3. Building Characteristics

3.3.1. Building Size

This research classified the building sizes as low-rise (one to five stories), medium-rise (six to ten stories), and high-rise (>10 stories) buildings. As shown in Table 2, more than 65% (62 out of 96 cases) of the building cases were low-rise prefabricated buildings, 21% (20 cases) were medium-rise prefabricated buildings, and 15% (14 cases) were high-rise prefabricated buildings. The SD of the embodied carbon of the low-rise buildings is 216.7 kgCO2e/m2, which is significantly larger than those of medium-rise and high-rise buildings. This is because the SD of low-rise buildings was calculated based on a larger sample size. The box plots in Figure 5 show that the interquartile ranges of the three building sizes do not vary significantly, implying good consistency among the data. However, the box plots in Figure 5 show that the means and medians of the carbon quantification results of the three datasets of building sizes have no discernible rule. For example, the carbon emission neither increases nor decreases with the growth of building height. Therefore, the impact of this carbon quantification factor needs further research.

3.3.2. Function of Building

A total of 84% (81 cases) of the reviewed building cases were residential buildings; the remaining cases included five office buildings, four industrial buildings, four public buildings, and two educational buildings. As observed from the box plots in Figure 5, the means and interquartile ranges of the five building function types are quite parallel, except for the educational buildings, in which only two cases were available. This indicates that the functions of buildings do not have a significant impact on the embodied carbon emission of prefabricated buildings.

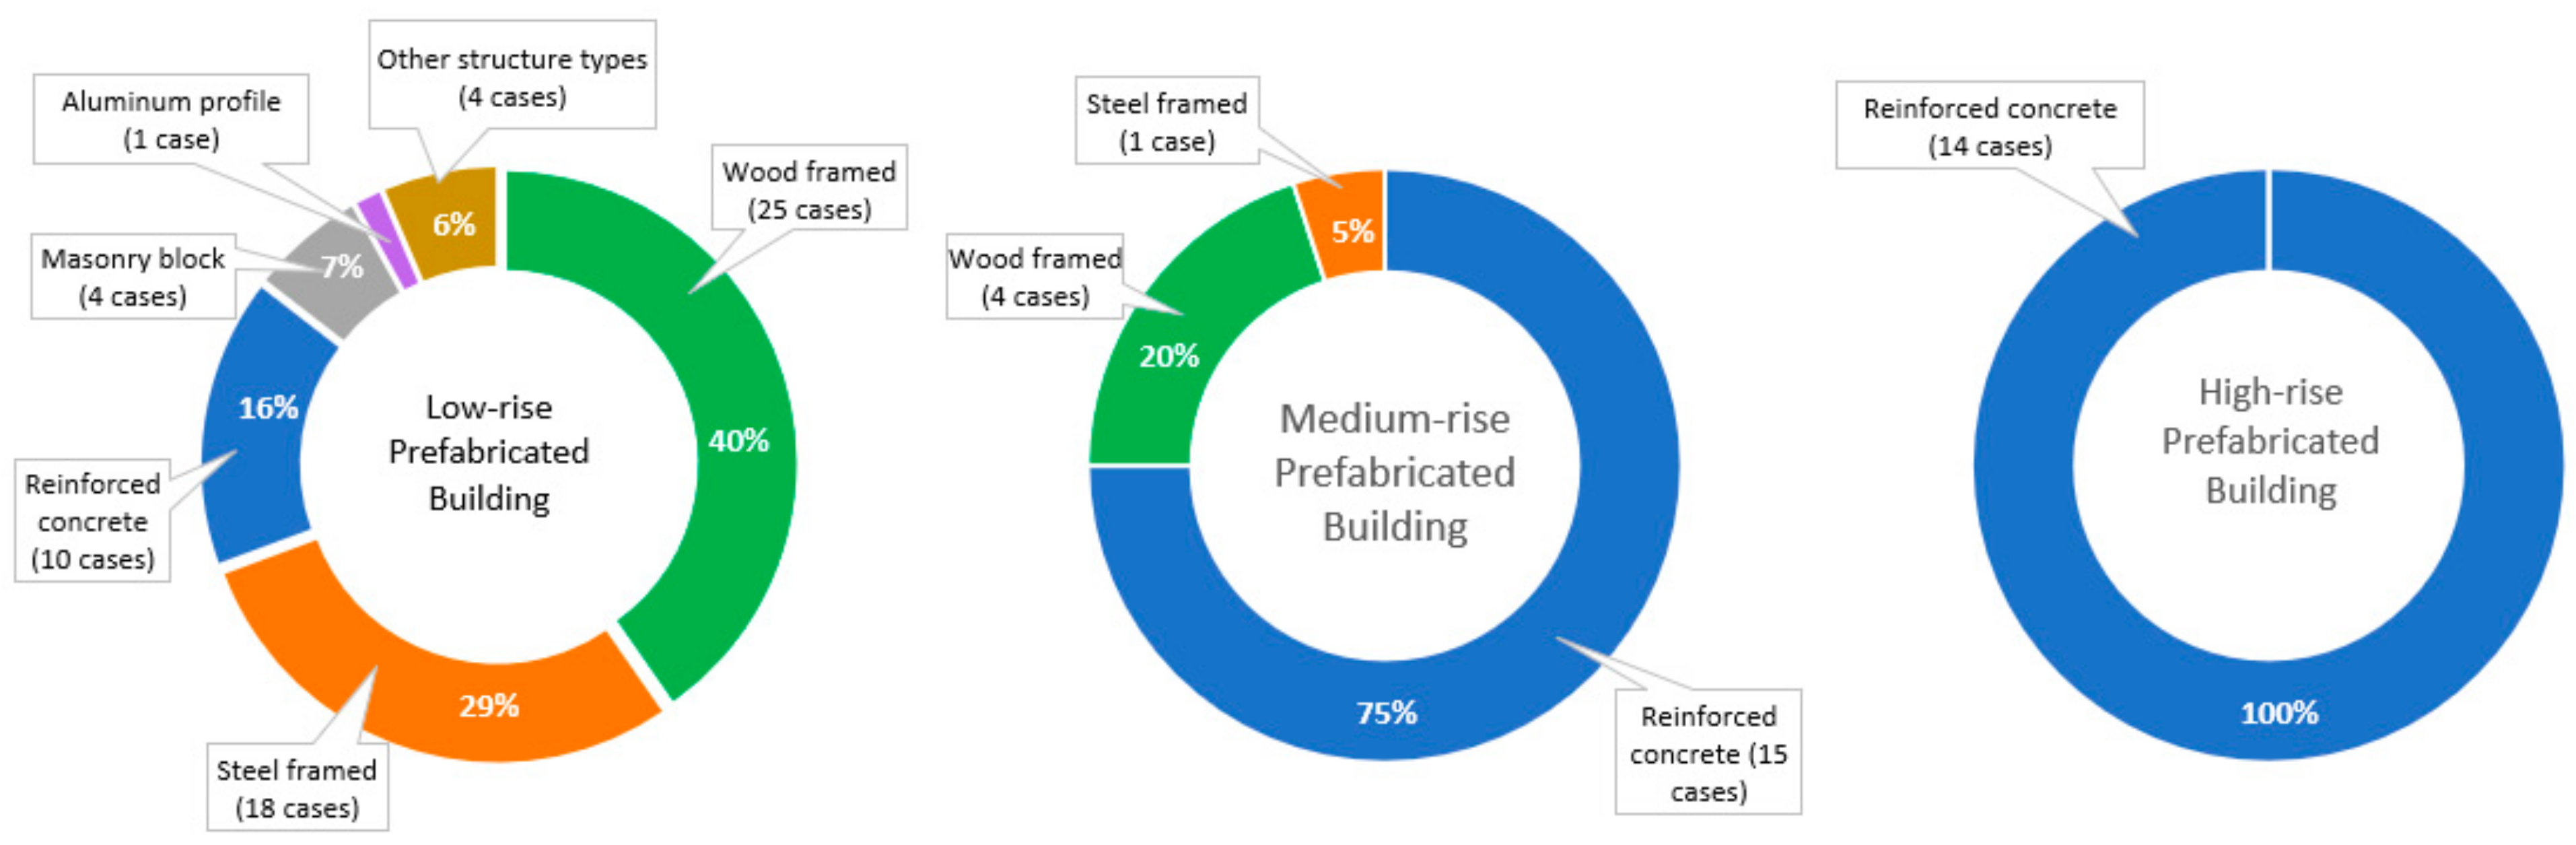
3.3.3. Building Structure Form

As shown in Table 2, in terms of the structural form, 39 (41%) of the prefabricated building cases were reinforced concrete (RC), 29 (30%) were wood-frame, 19 (20%) were steel-frame, four (4%) had a masonry block structure, and one (1%) had an aluminum profile. Moreover, it can be observed from Figure 5 that the prefabricated buildings with a steel frame and aluminum profile had higher embodied carbon than the other structural forms. This is because of the high unit embodied carbon of steel and aluminum materials. One can conclude that the building’s structural materials and forms can significantly affect the embodied carbon of prefabricated buildings.

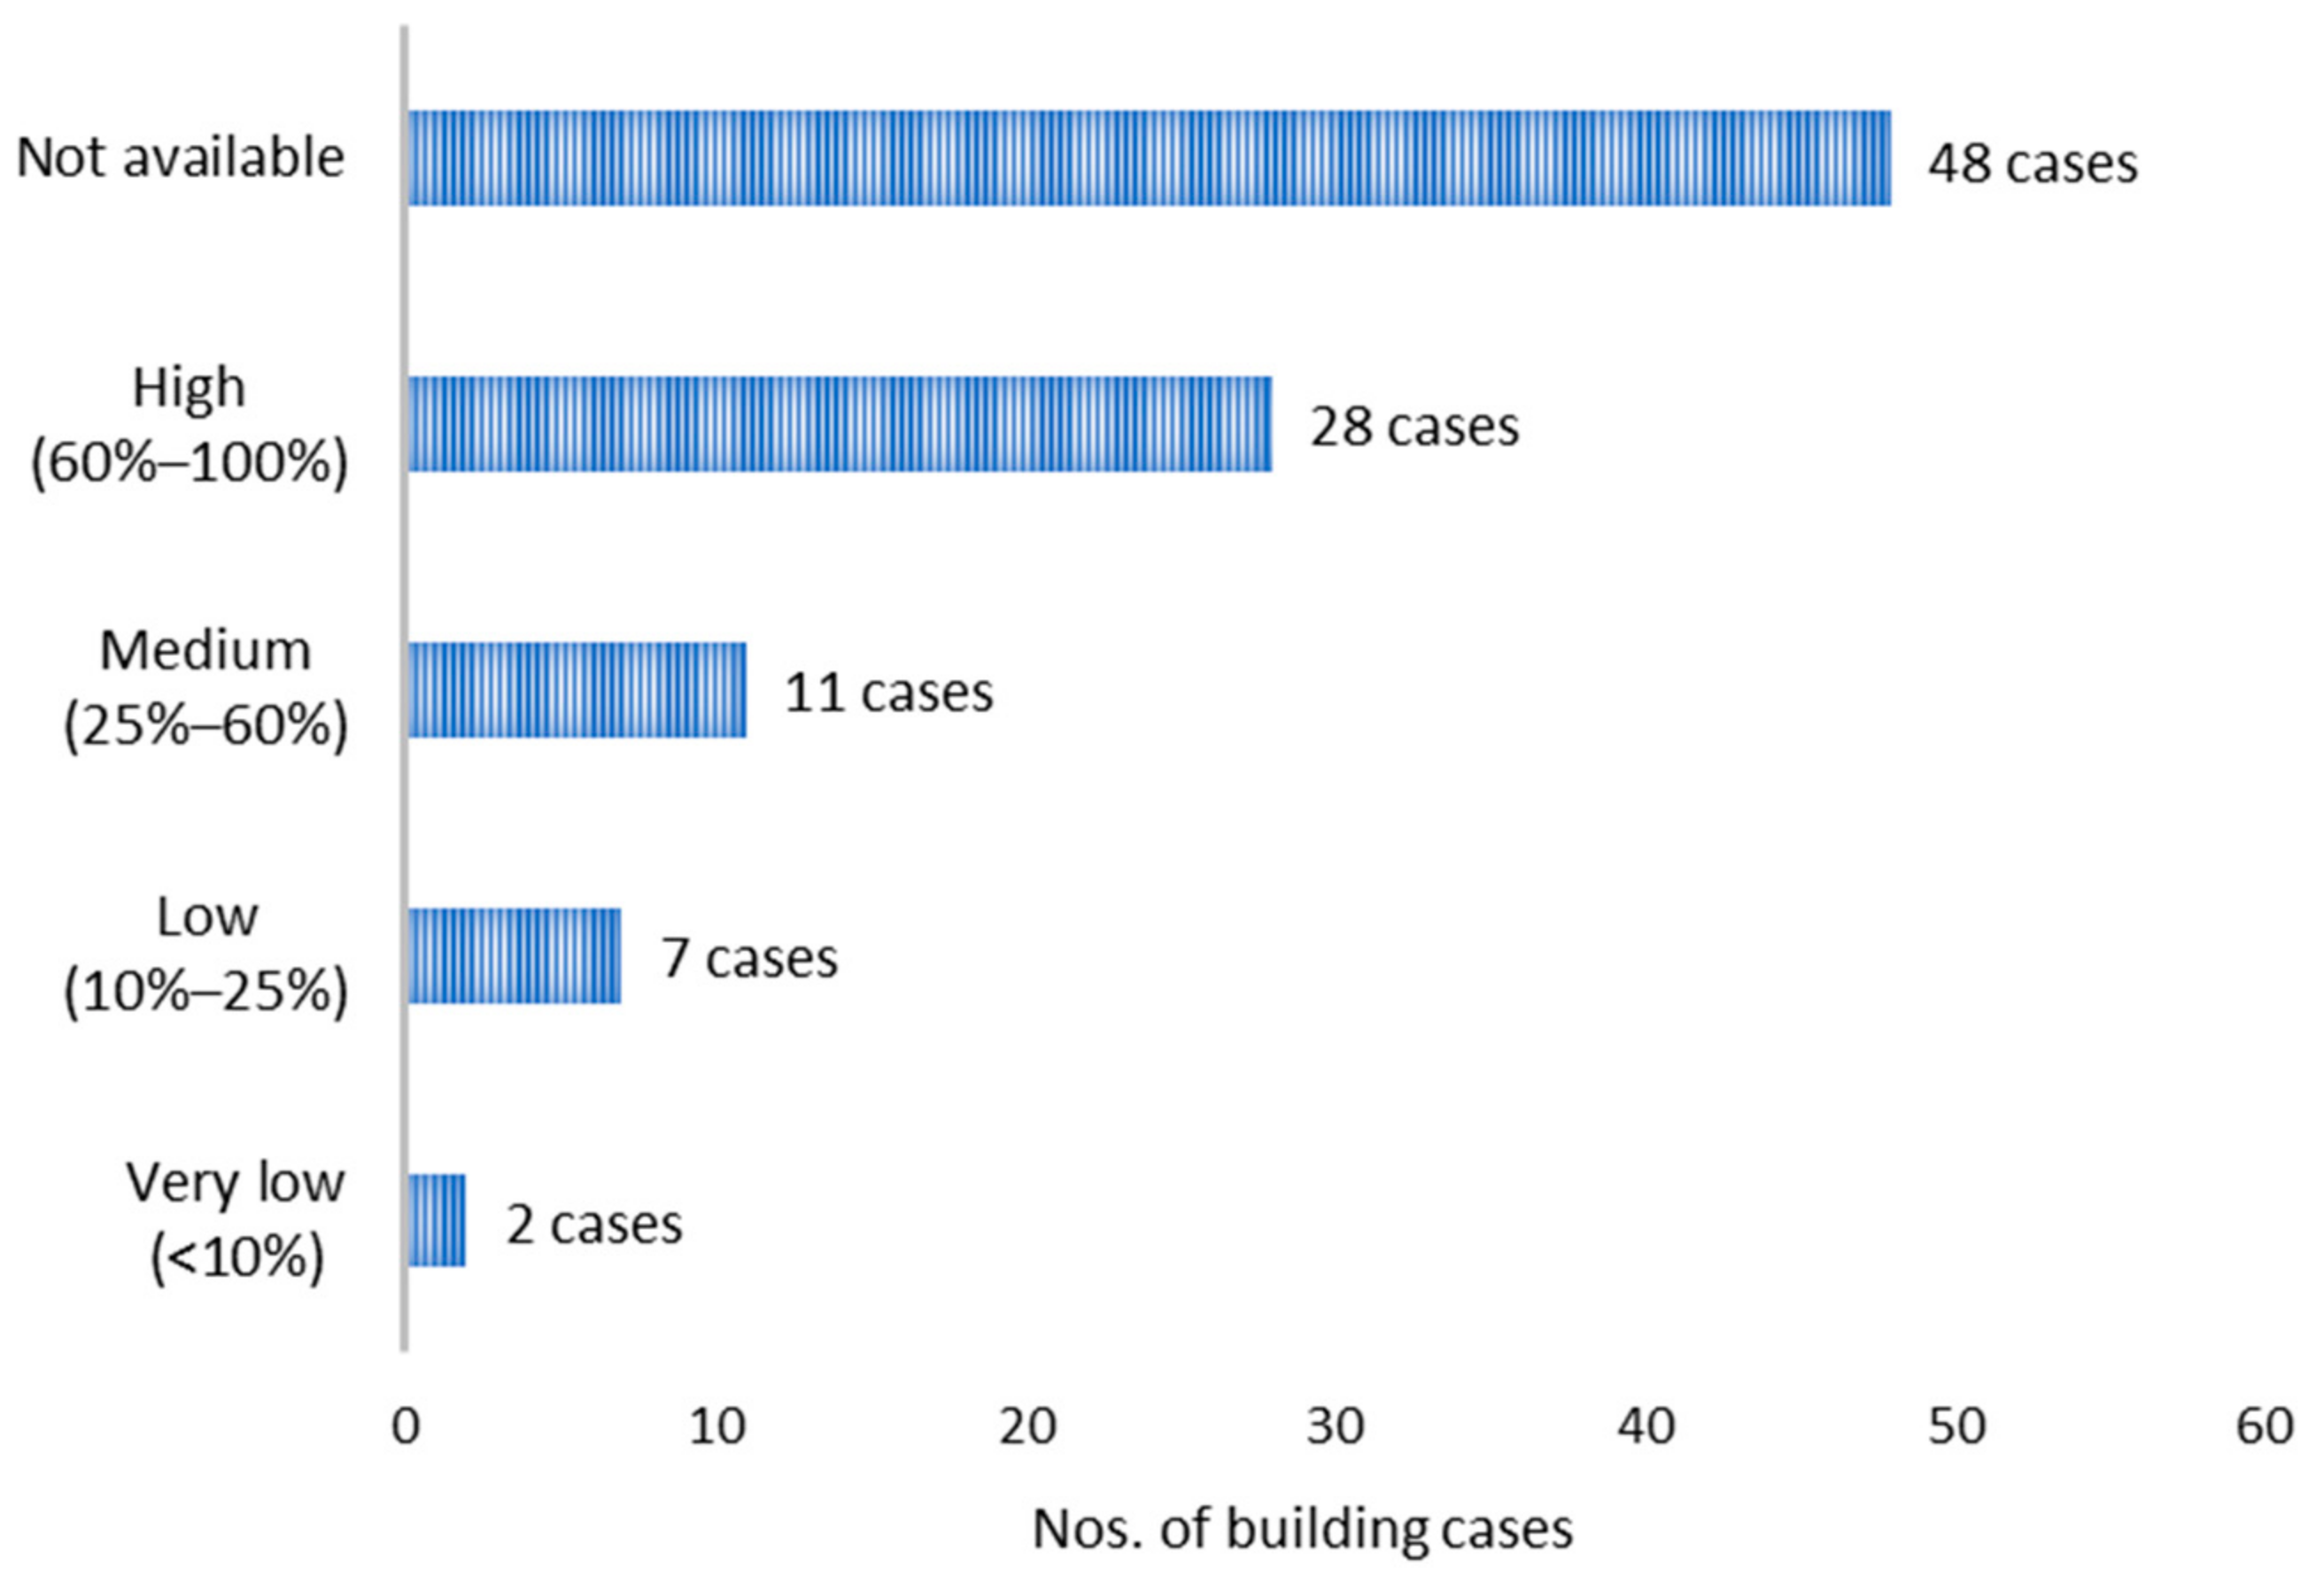
3.3.4. Level of Prefabrication

The level of prefabrication or prefabrication rate of building in this review was defined as very low (<10%), low (10–25%), medium (25–60%), and high (60–100%). As indicated in Figure 6, out of the 96 building cases, only 48 cases provided relevant information on the prefabrication rate. Specifically, two (2%) building cases had a very low level of prefabrication, seven (7%) had a low level of prefabrication, 11 (11%) had a medium level of prefabrication, and 28 (29%) had a high prefabrication rate. It can be observed from Figure 5 that the embodied carbon of a building does not decrease with an increase in the prefabrication rate. Rather, the minimum embodied carbon was obtained when the prefabrication rate reached an optimal value. This finding is in line with the study conducted by Du et al. (2019) [19].
The interquartile range (167.5–718.1 kgCO2e/m2) of high prefabrication rate cases is significantly larger than that of other prefabrication rate cases, indicating lower consistency among the high prefabrication rate cases. This is because of the greater number of high prefabrication rate cases available in the reviewed literature.

3.4. Emission Sources

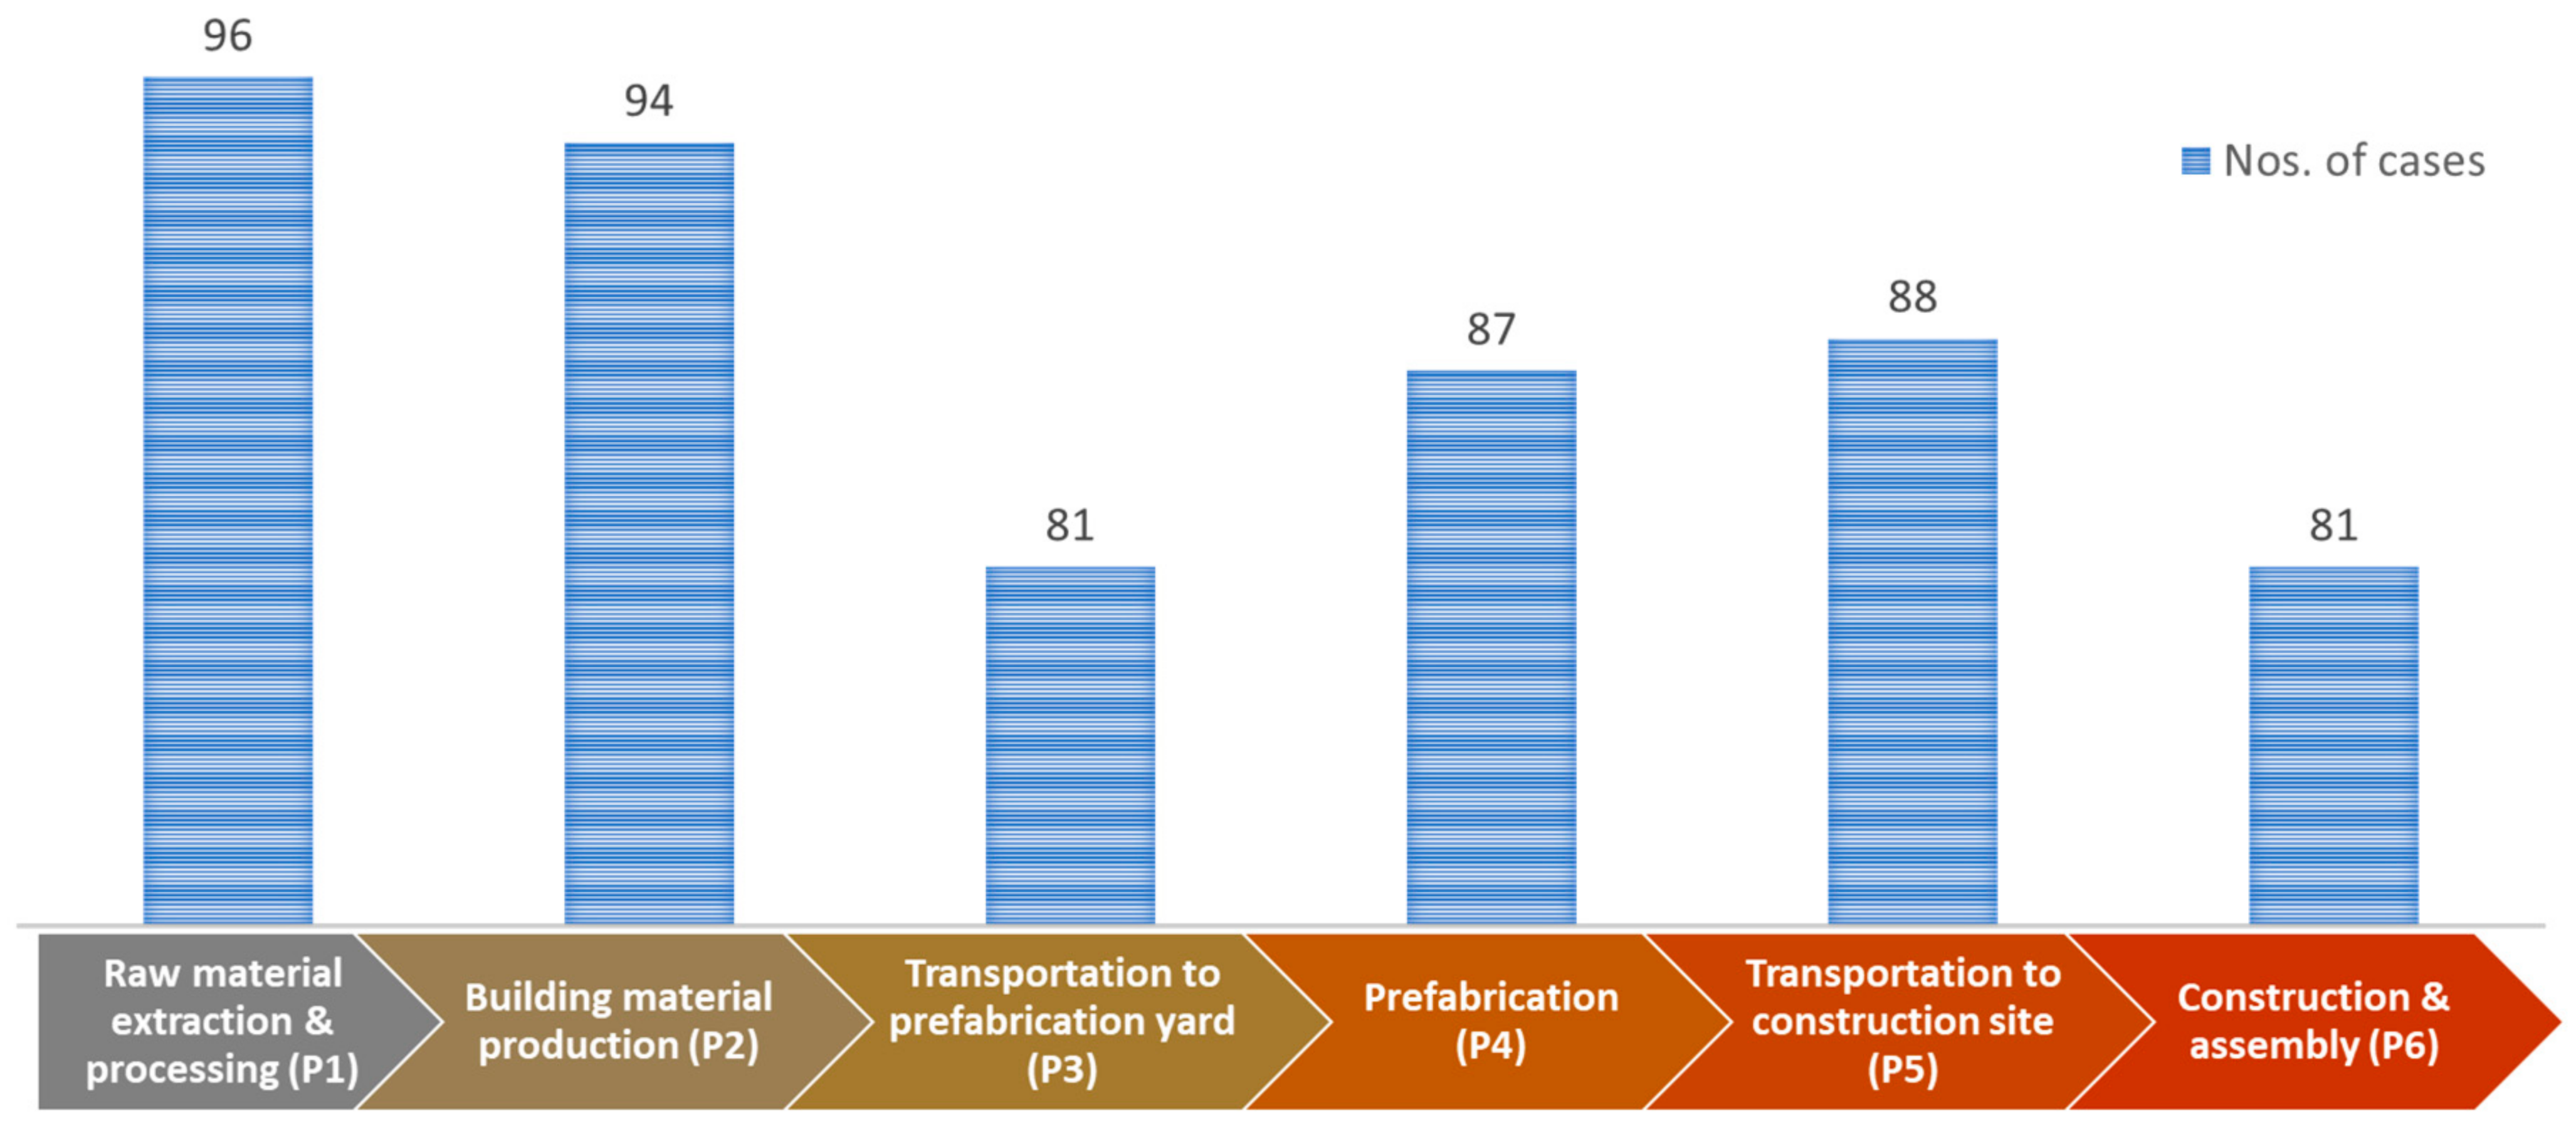
3.4.1. Life Cycle Phases Concerned

As shown in Figure 7, all 96 reviewed cases have been analyzed regarding the carbon emission associated with the raw materials’ extraction and processing (P1). The least studied life cycle phases, namely the transportation of building materials (P3) and prefabricated components/units (P5), were studied in 81 cases. However, as observed in Table 2, only 69 (72%) cases fully covered the cradle-to-site (P1–P6) embodied carbon emission, while 13 cases considered the cradle-to-site entrance gate (P1–P5), six cases considered the material production phases (P1–P2), and eight cases applied other emission boundaries.
Although a larger number of cases (69 cases) was available for the cradle-to-site (P1–P6) emission boundary, they presented a relatively narrow interquartile range (167.5–718.1 kgCO2e/m2) in the box plots (Figure 5), indicating better consistency among the cases. Moreover, one can tell from Figure 5 that the embodied carbon of the reviewed prefabricated buildings did not necessarily increase with the wider inclusion of life cycle phases.

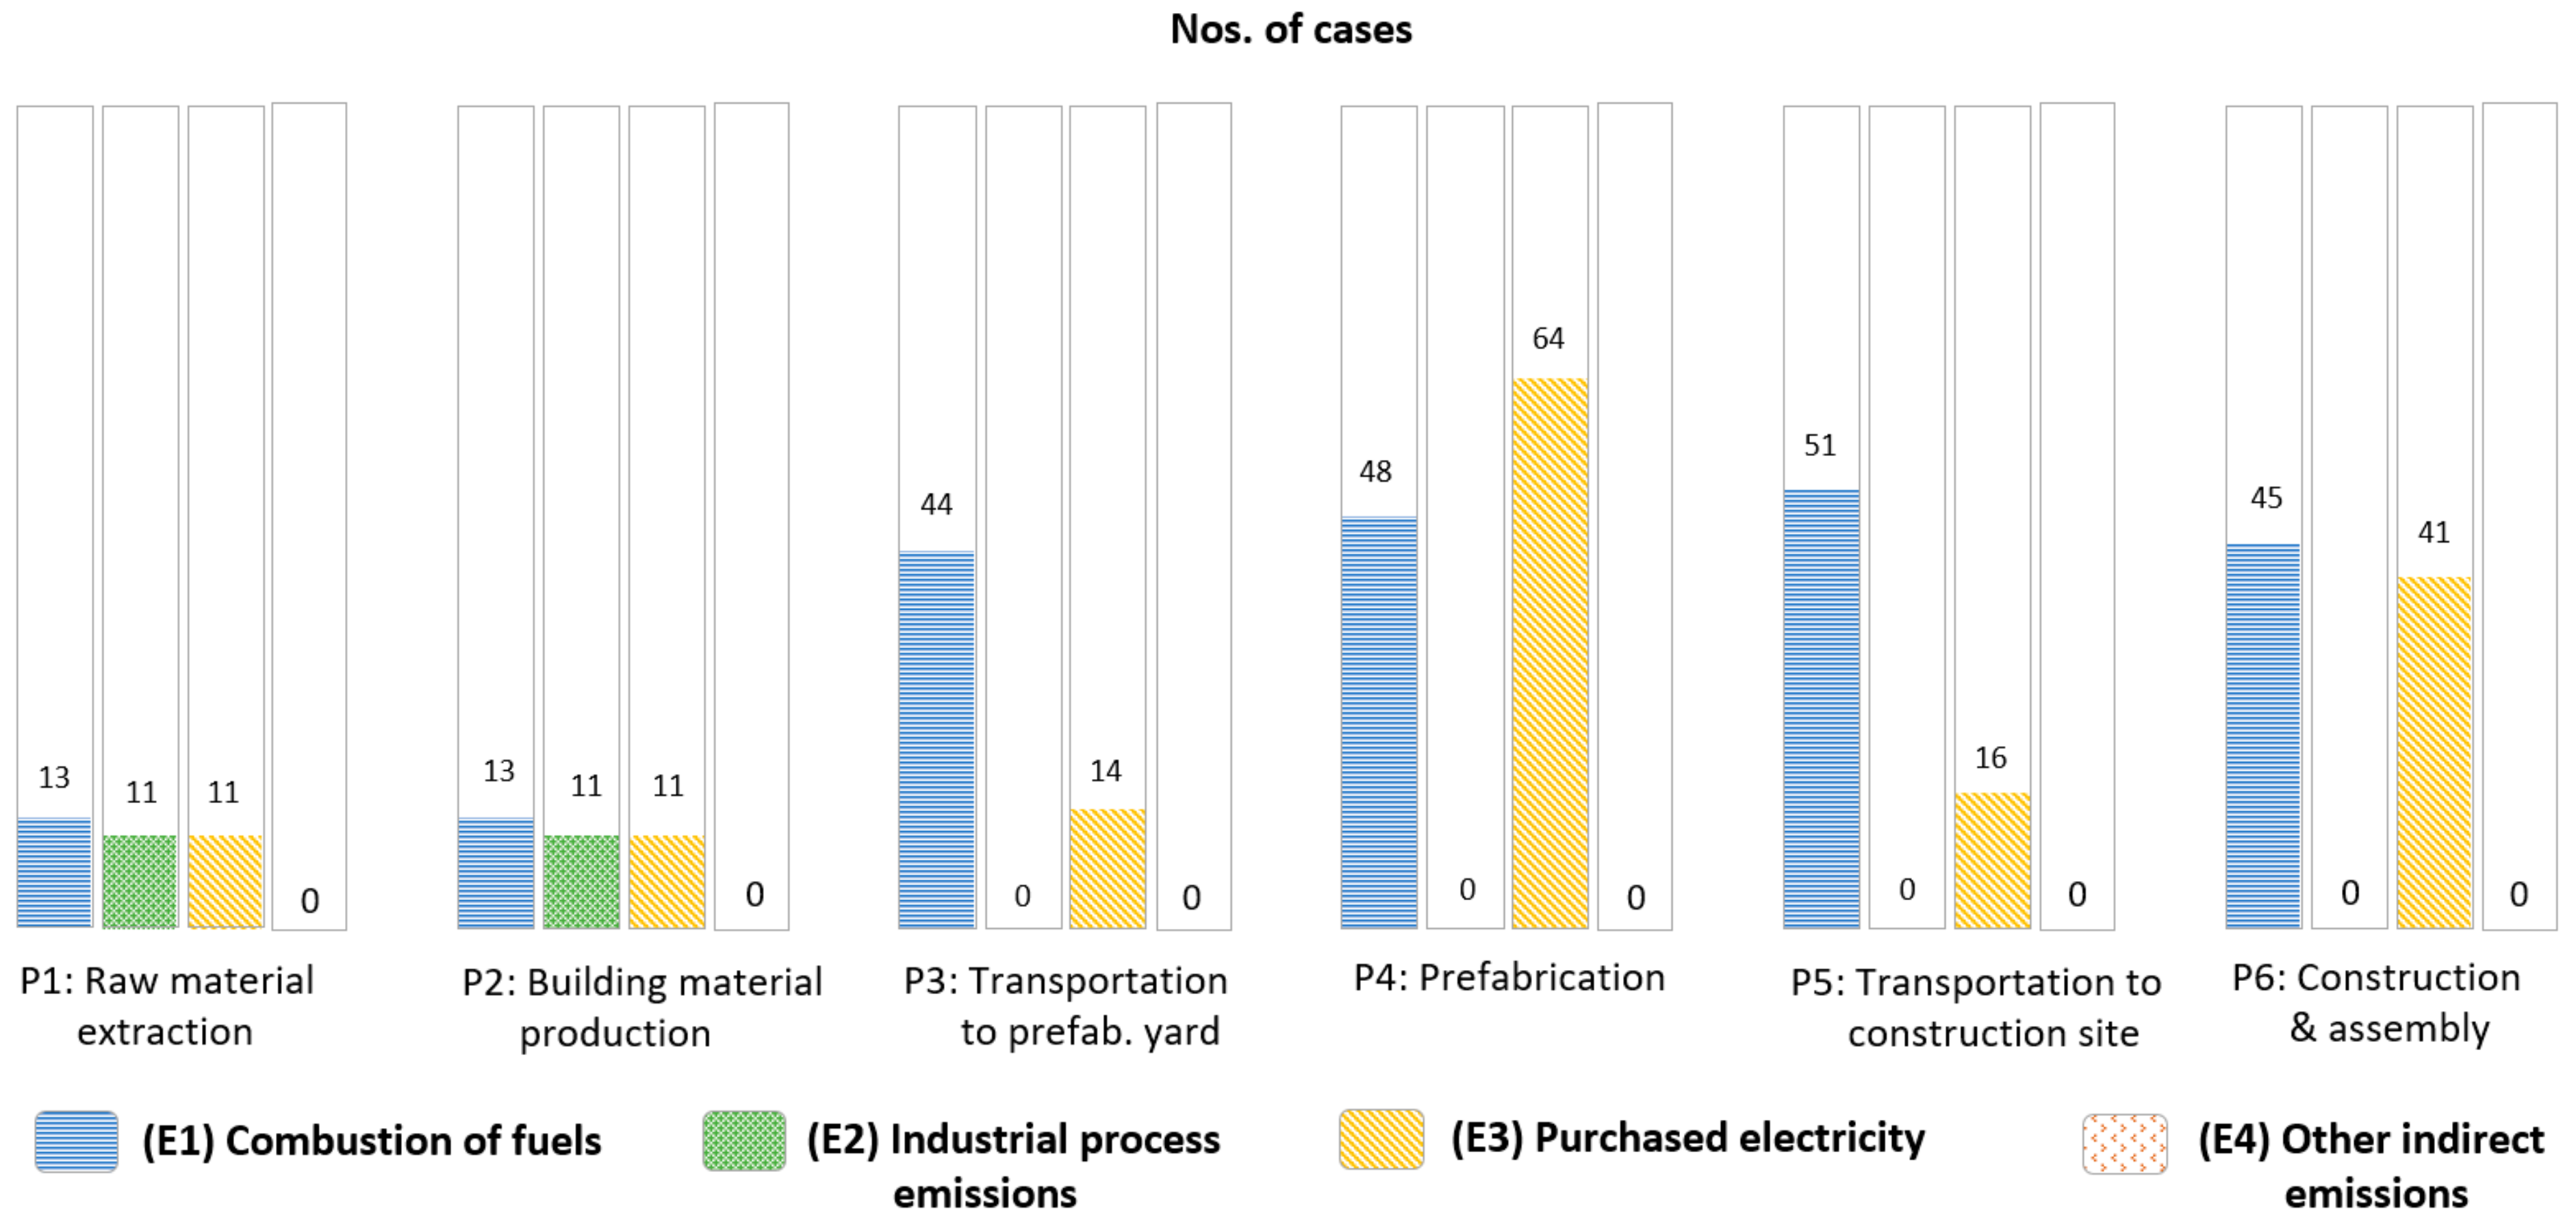
3.4.2. Emission Source Categories

According to the GHG Protocol (WBCSD/WRI The Greenhouse Gas Protocol—A Corporate Accounting and Reporting Standard) [20], the carbon emission sources are categorized into three scopes as below.
Scope 1: Direct emissions—Direct emissions arise from the sources that are owned or controlled by an organization. Examples include the emissions from the combustion of boilers, furnaces, vehicles, etc., owned or controlled by an organization. Direct emissions also include the emissions from chemical processes that take place in the equipment owned or controlled by an organization, such as the oxidation-reduction reactions occurring in the blast furnace in an iron mill.
Scope 2: Purchased electricity—Purchased electricity includes the emissions from the generation of purchased electricity consumed by an organization. Scope 2 emissions physically occur at the facility where the electricity is generated. Examples include the electricity required for vehicles, machinery and equipment, and factory operation.
Scope 3: Other indirect emissions—All other indirect emissions are a consequence of the activities of an organization, but they are derived from sources not owned or controlled by the organization. Examples of scope 3 activities include the production of purchased materials, third-party transportation of purchased materials, and use of sold products and services.
Given the characteristics of building carbon emissions, in this research, the scope 1–3 emissions defined under the GHG Protocol were further categorized into four emission sources:
(E1) combustion of fuels in boilers, furnaces, vehicles, generators (Scope 1);
(E2) industrial process emissions (Scope 1);
(E3) purchased electricity (Scope 2);
(E4) other indirect emissions (Scope 3).
Table 3 lists detailed examples of each emission source in different life cycle stages within the cradle-to-gate boundary.
As shown in Table 2, among the reviewed prefabricated building cases, 72 cases provided relevant information regarding emission sources, while the remaining 24 cases did not. In particular, 2 and 3 building cases only calculated the E1 and E3 emission sources, respectively. Meanwhile, two cases calculated both E1 and E2 emission sources. More than half of the cases (53) covered the E1 and E3 emission sources. Only 12 cases considered E1, E2, and E3 emission sources. No study quantified other indirect emissions (E4).
On the other hand, in the different life cycle phases, the inclusion of various emission sources was different in each reviewed study. Figure 8 shows that, for the (P1) raw material extraction and processing and (P2) building material production, only 13 cases provided relevant information about emission sources, and emission sources E1, E2, and E3 were almost equally considered. For the life cycle phase (P3) transportation of building materials to prefabrication yard, 44 cases calculated the emissions from (E1) combustion of fuels in production facilities, while only 14 cases calculated the emissions from (E3) purchased electricity. This is probably because fewer vehicles were electricity-powered in the reviewed studies. A similar situation appeared in the (P5) transportation of prefabricated components or modules from prefabrication yard to construction site. For the (P4) prefabrication process, 48 cases considered the carbon emission associated with the combustion of fuels, and 64 cases calculated the carbon emission of electricity used in the prefabrication yard. This is because the manufacturing processes in the prefabrication yard, such as concrete casting and curing, rebar cutting and bending, and welding, are powered by both fuels and electricity, with more studies focused on the emissions from electricity. On the other hand, the (P6) construction and assembly stage presented an almost equal focus on the emission sources E1 and E3 (45 and 41 cases, respectively). This is because the construction and assembly stage usually involves construction equipment and machineries powered by both fuels (e.g., crane, lorry, piling equipment, generator, pump) and electricity (e.g., concrete mixer, bending/straightening machine, cutting machine, welder, circular saw, electric hand drill, site office equipment).

3.4.3. Types of GHGs Concerned

The Intergovernmental Panel on Climate Change (IPCC) has identified 98 types of GHGs in the document “2006 IPCC Guidelines for National Greenhouse Gas Inventories”. These GHGs mainly include CO2, methane (CH4), nitrous oxide (N2O), sulfur hexafluoride (SF6), hydro fluorocarbons (HFCs), per fluorocarbons (PFCs), etc. Different raw materials and fuels give rise to different types or combinations of types of GHGs depending on their chemical compositions. However, most of the studies, i.e., 66 out of 96 cases, did not specify the GHG type(s) being considered in the quantification, as shown in Table 2. Specifically, 22 building cases considered only CO2 emission when quantifying the building embodied carbon; six cases have calculated the three major GHGs, i.e., CO2, CH4, and N2O; one building case included the six major GHGs, i.e., CO2, CH4, N2O, SF6, HFCs, and PFCs; and one case considered all 98 GHGs. The box plots in Figure 5 show that the mean, median, upper quartile, and lower quartile of the embodied carbon in cases considering only CO2 are significantly lower than the values for those considering the three major GHGs. This indicates that the coverage of GHGs when conducting carbon quantification will considerably affect the quantification results: the more GHGs covered, the greater the results.

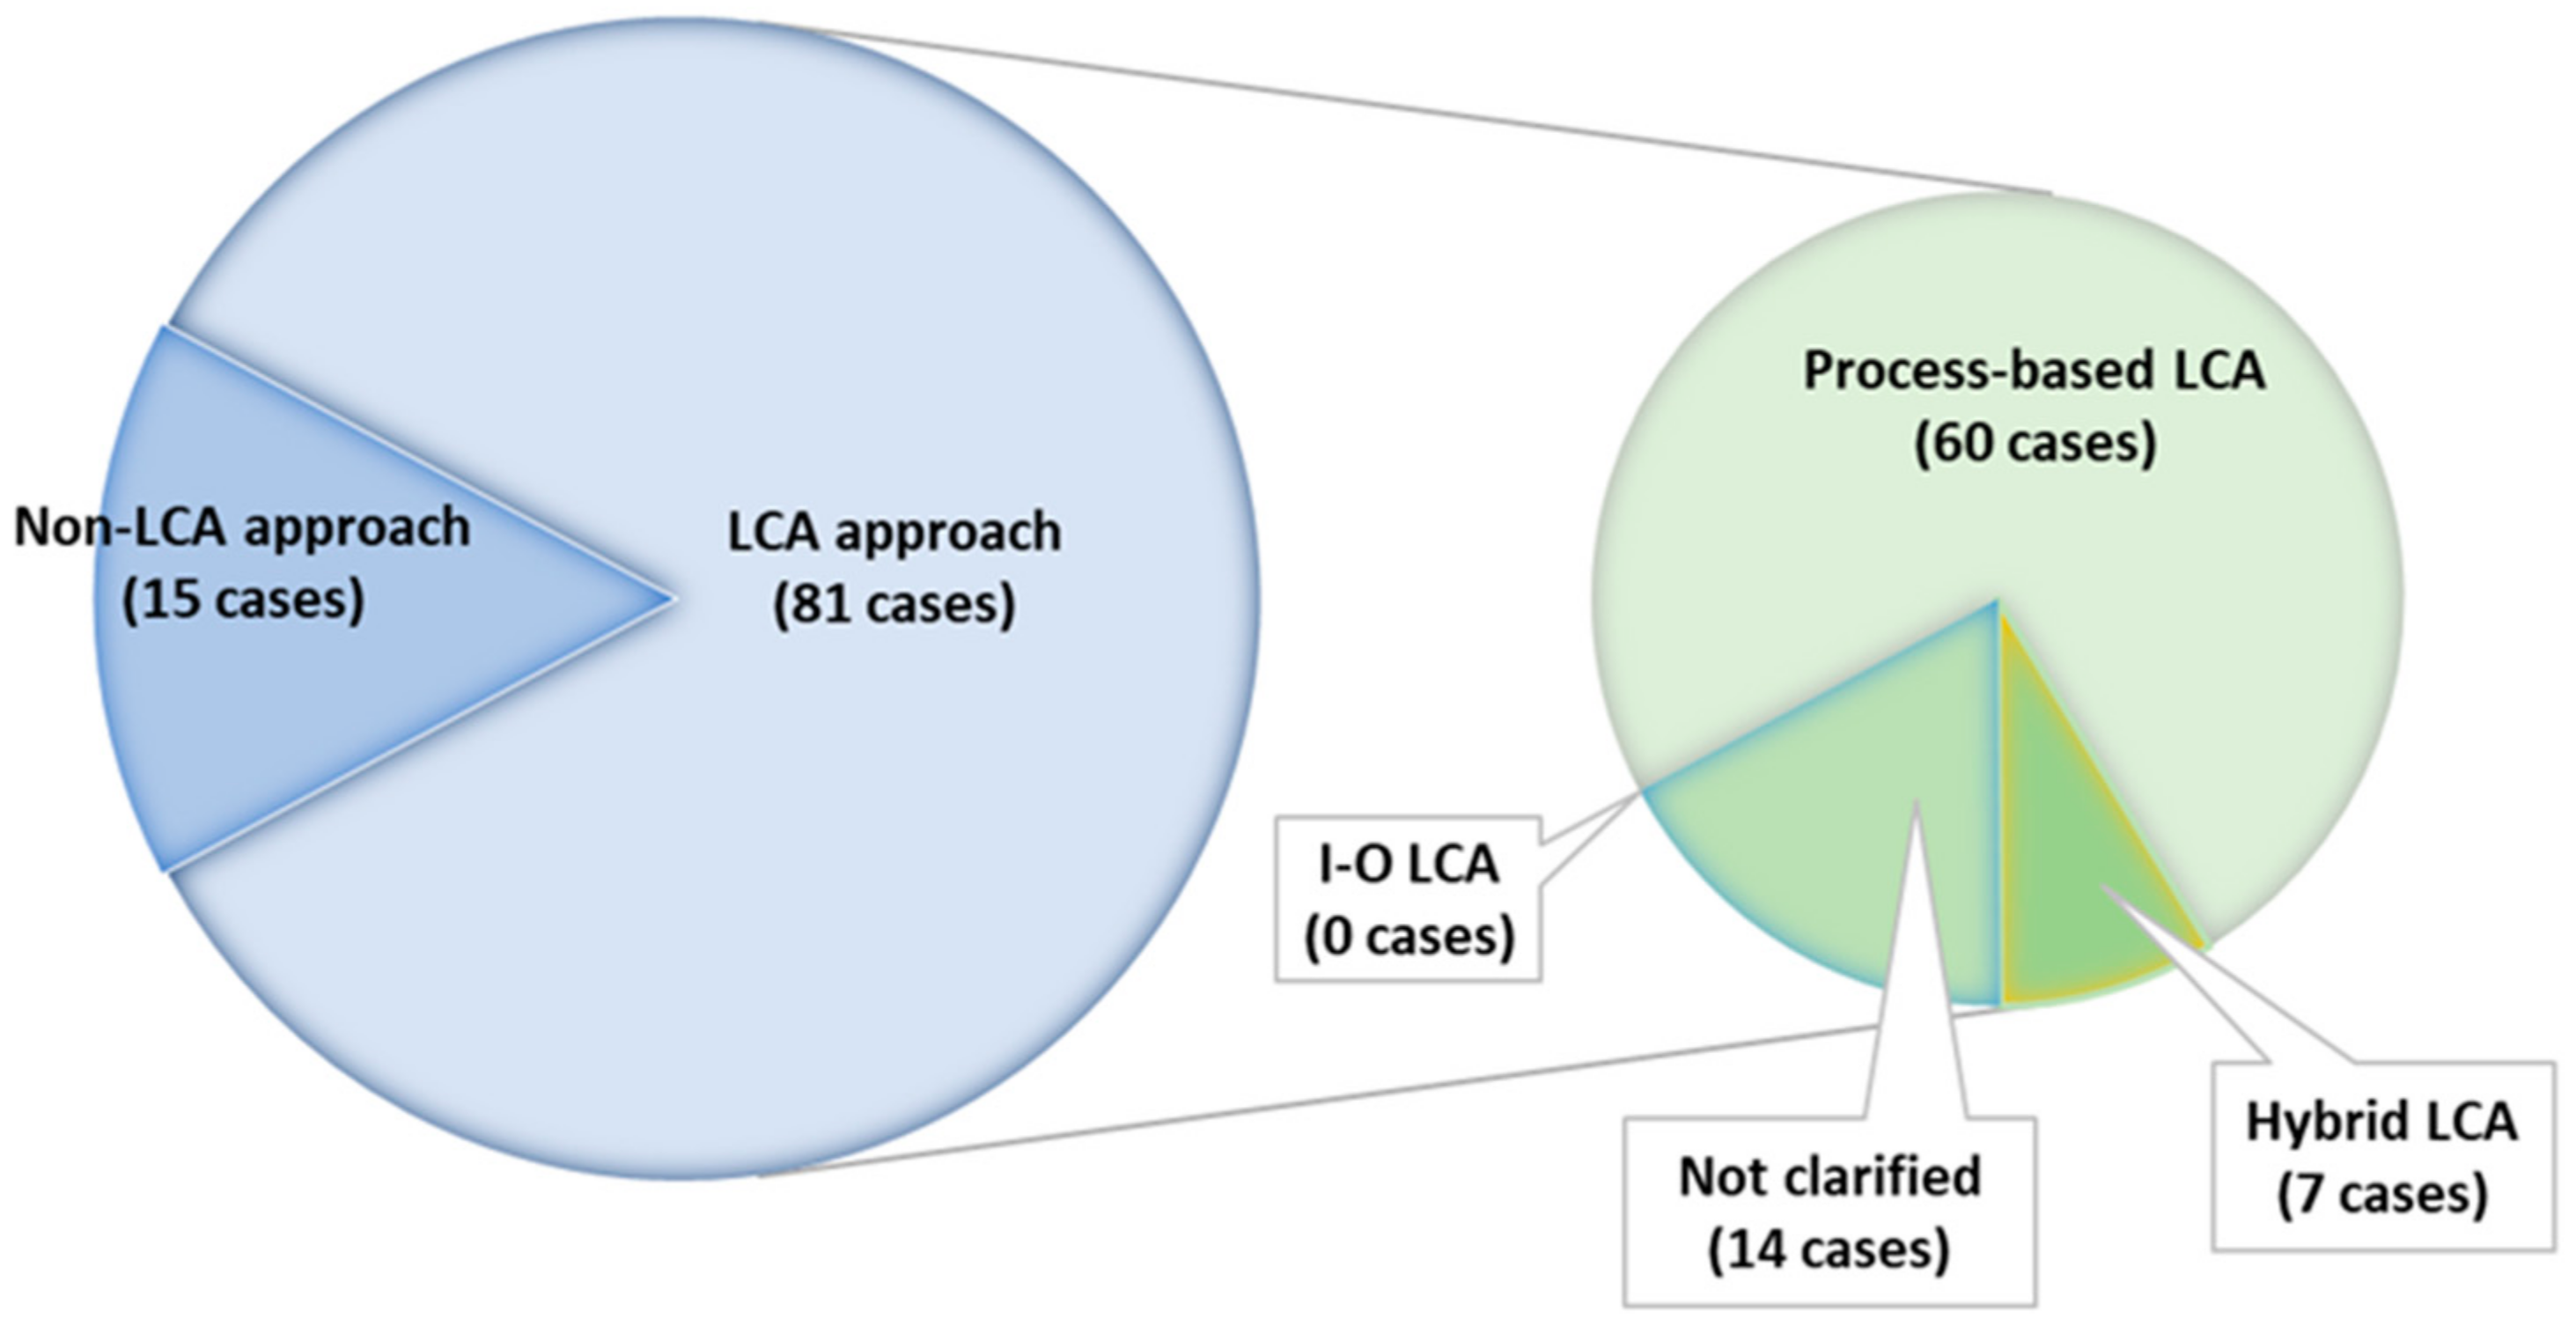
3.5. Carbon Quantification Approaches

3.5.1. Quantification Methods

As indicated in Figure 9, among the 96 reviewed prefabrication building cases, 81 cases quantified carbon emission through life cycle analyses (LCA), and 15 cases adopted non-LCA methods. The LCA method can be classified into process-based LCA, input–output (I–O) LCA, and hybrid (i.e., process-based and I–O) LCA [5]. Among the 81 cases adopting the LCA approach, 60 of them adopted the process-based LCA method, seven adopted the hybrid LCA, none used the I–O LCA, and 14 cases did not specify the LCA methods that were applied.
It was observed that the embodied carbon of building cases using the LCA approach had a wider interquartile range and more outliers, as shown in Figure 5, and had a greater SD, as shown in Table 2, compared to those of the cases that adopted a non-LCA approach. This is because the number of cases using the LCA approach was substantially larger than those cases using a non-LCA approach. Figure 5 also indicates that the embodied carbon results calculated through the LCA approach (Mean: 370.6 kgCO2e/m2) were higher than those obtained with a non-LCA approach (Mean: 227.6 kgCO2e/m2).
Regarding the different LCA methods, i.e., the process-based and hybrid methods, Figure 5 indicates that their interquartile ranges and means (362.5 kgCO2e/m2 and 335.5 kgCO2e/m2, respectively) were quite similar. This implies that the selection of process-based LCA and hybrid LCA methods does not impact the embodied carbon quantification results significantly.

3.5.2. Quantification Tools/Software

As shown in Table 2, 23 building cases did not disclose the quantification tools or software that were applied in the embodied carbon quantification. A considerable number of the reviewed studies adopted LCA software to calculate the embodied carbon. They included SimaPro (36 cases), Baubook eco2soft (5 cases), and Athena Impact Estimator (4 cases). Moreover, 25 cases applied carbon quantification models or equations developed in their studies.
Figure 5 shows the relationship among the carbon quantification tools/software and the embodied carbon results. Due to the very small numbers of cases using Baubook eco2soft and Athena Impact Estimator, they are not discussed here. For building cases that applied SimaPro and self-developed quantification models/equations, they had very similar carbon quantification results, i.e., mean = 289.7 kgCO2e/m2 and mean = 287.3 kgCO2e/m2, respectively. This means that the use of different carbon quantification tools/software has a minor impact on the carbon quantification results. This further confirms that the quantification results of computer software and self-developed models/equations can verify each other well.

3.6. Data Quality

3.6.1. Carbon Inventory Databases

To calculate the embodied carbon emission of prefabricated buildings, the carbon emission of raw materials, building products, fuels, electricity, transportation activities, construction activities, etc., were collected or estimated. This was sometimes achieved by adopting existing carbon inventory databases. All 96 cases adopted either globally recognized databases or regional (country-specific) databases, as shown in Table 4. Among these carbon inventory databases, Ecoinvent was the most frequently used carbon inventory, adopted in 56 cases. This is because Ecoinvent is the embedded carbon inventory of the SimaPro software, which was adopted in a large number of studies. In total, 31 cases adopted a national or regional carbon inventory, including the U.S. Life Cycle Inventory (USLCI) Database, the Malaysia Life Cycle Inventory Database (MYLCID), the European reference Life Cycle Database (ELCD), the Chinese Life Cycle Database (CLCD), the Australian Life Cycle Inventory (AusLCI), etc. The Inventory of Carbon & Energy (ICE) was used in 16 cases.
It is worth mentioning that the ICE, unlike the other carbon inventory databases, is tailor-made for construction materials, such as cement, concrete, steel, aluminum, glass, etc. However, only 16 building cases adopted this database. This is probably because the ICE does not contain the carbon emission factors of fuel, electricity, transportation activities, and construction activities, which are necessary for the carbon quantification of the entire cradle-to-site process.
In the reviewed building cases, 61 of them adopted a single carbon inventory database, while 23 of them used multiple databases. For example, cases 50 and 51 (Table A1) used the emission factors of building materials from USLCI, Athena 2016, Ecoinvent, and ELCD. The mean of the carbon quantification results of cases adopting single and multiple carbon inventory databases were quite similar, i.e., 344.2 kgCO2e/m2 and 335.2 kgCO2e/m2, respectively. However, due to the greater number of cases, the carbon quantification results of the studies adopting a single database contained more outliers and presented a wider interquartile range (125.3–457.5 kgCO2e/m2), as shown in the box plots in Figure 5.

3.6.2. Data Sources

The collection of basic data, e.g., quantities of raw materials, electricity bills, transportation distances, costs of purchased materials, and wastage of materials, is the fundamental element of carbon quantification. The completeness and reliability of these data are crucial for the accuracy of carbon quantification. Ideally, these data should be obtained from reliable first-hand sources (so-called “primary sources”), such as site investigation, on-field surveys (measuring), design documents, questionnaire surveys, and interviews. However, as the activities involved in material manufacturing and building construction are massive and highly complex, the data of every single process unit would be difficult to obtain. Therefore, some research adopted data obtained from secondary sources, such as the literature, previous studies, existing databases, and published and unpublished statistics, when primary data were unavailable.
In this meta-analysis, 34 of the reviewed prefabricated building cases solely applied primary data sources, six cases solely applied secondary data sources, and 32 cases adopted a combination of primary and secondary data sources, as indicated in Table 2. The remaining 24 cases did not provide detailed information on how the basic data for carbon quantification were collected. The box plots in Figure 5 show that the six cases solely applying secondary data sources had a very narrow interquartile range and showed good results for embodied carbon. This is because these six cases (cases 9–14 in Table A1) were all from one individual study. Moreover, with a similar case number, the interquartile range of embodied carbon in cases adopting solely primary data sources (216.8–448.6 kgCO2e/m2) was much narrower than those adopting combined data sources (95.5–770.4 kgCO2e/m2). This means that the 34 studies that solely applied primary data sources had better consistency among their embodied carbon emission and also implies the poorer consistency of secondary data sources.

4. Discussion

4.1. Implication of Building Forms on Embodied Carbon

Given that 65% of the studied prefabricated building cases were low-rise buildings, future research should focus on a greater diversity of building sizes by conducting relevant studies on medium-rise and high-rise prefabrication buildings. Similarly, the results of this review show that residential buildings have dominated the research on the carbon emission of prefabricated buildings. Therefore, more studies should be conducted on other building types, especially industrial, public, educational, hospital, and commercial buildings.
Nearly all of the reviewed studies have concluded that the embodied carbon of materials represented the largest proportion of the embodied carbon of prefabricated buildings [2,21,22]. This review indicates that RC, wood-frame, and steel-frame are the predominant structural forms of prefabricated buildings. Specifically, for the mid-rise and high-rise cases, most of them are RC structured, as shown in Figure 10; for low-rise cases, 40% and 30% of them are wood-frame and steel-frame, respectively. Although steel-frame and aluminum-frame prefabricated buildings have higher embodied carbon due to the greater embodied carbon of metal materials, RC prefabricated buildings are still responsible for the majority of the total carbon emissions because of their high market share. RC is composed of concrete, steel, and other cementitious materials, which are carbon-intensive materials, and they are the main embodied carbon sources for high-rise and mid-rise prefabricated buildings.

4.2. Impacts of Prefabrication Level

As indicated in Figure 6, more studies (28 cases) on embodied carbon quantification have been conducted against buildings with a high prefabrication rate (i.e., 60–100%), while less relevant studies (20 cases in total) have been carried out against those with a lower prefabrication rate (<60%). Therefore, the relevant research field should place more emphasis on buildings with a lower prefabrication rate.
This review also finds that the embodied carbon does not necessarily decrease with an increasing prefabrication rate. As observed from Figure 5, the embodied carbon of a prefabricated building decreases when the prefabrication rate grows from very low to medium (i.e., from 0% to 60%) and reaches the lowest; then, the embodied carbon grows generally with the rise in the prefabrication rate. This is highly in line with the conclusion drawn by Wang et al. (2020) [23]. Moreover, other factors also result in higher carbon emission in prefabricated buildings. For example, the case studies of Mao et al. (2013) [24] and Ji et al. (2018) [15] implied that greater carbon emission was associated with prefabricated buildings compared with conventional buildings, due to the larger amounts of steel reinforcement used in the prefabrication process. It was proven that more embedded steel joint parts for reinforcement were required in prefabricated components for the purpose of onsite assembly with the main building structures [15].

4.3. Implication of Life Cycle Phases and Emission Sources

It is certain that the selection of different system boundaries for carbon quantification will lead to diverse results. This review finds that the existing research did not include a uniformly recognized system boundary for prefabricated buildings’ embodied carbon quantification. The transportation of building materials to the prefabrication yard (P3) and the activities involved in the assembly and construction of building (P6) have been ignored in a number of the reviewed studies, but these activities also generate considerable amounts of carbon emission. This could be due to the complexity of construction activities and the difficulty in collecting specific data from the construction site [25]. Moreover, the carbon emissions of different life cycle phases change in a varying manner with the increasing prefabrication rate. Wang and Sinha (2021) [26] found that the carbon emission of the material preparation phases (P1–P2) and onsite construction phase (P6) decreased as the prefabrication rate increased; in contrast, the prefabrication yard processing (P4) and transportation of prefabricated components (P5) significantly increased as the prefabricated rate increased.
Regarding the emission sources, overall, the coverage of emission source categories in different building cases was very diverse. Theoretically, the more emission source categories are covered, the greater the carbon emissions are. However, this pattern cannot be observed from the box plots in Figure 5. In fact, no discernible rule or relationship between carbon emission value and coverage of emission sources could be identified from the reviewed cases, and this requires further research.
The inconsistent system boundary and emission sources inclusion in carbon quantification will lead to the incomparability of the results of different studies and render them unable to mutually validate each other. More importantly, it will result in carbon leakage and cause difficulty in formulating effective carbon reduction measures for prefabrication and off-site construction.

4.4. Quantification Approaches

Process-based LCA analyzes the components of the building, products, materials, and related production activities, and then calculates the various direct and indirect carbon emission sources. The carbon emission values calculated by this method are accurate and relevant to the actual buildings and products. However, on the other hand, the collection of activity data is labor- and time-intensive. In contrast, I–O LCA uses sector-based financial data to calculate the energy requirements and carbon emissions of industry sectors. It can quickly calculate the total carbon emissions of the building sector and assist decision makers in formulating policies from a macro perspective. However, this calculation method does not enable an in-depth analysis of the production processes of building materials; therefore, it cannot propose specific emission reduction measures for specific processes and technologies [27].
Although the present meta-analysis finds that the selection of different LCA methods (i.e., process-based LCA and hybrid LCA) does not impact the embodied carbon quantification results significantly, it has been suggested by some research that the hybrid LCA method is more accurate than the purely process-based LCA or I–O LCA. This is because the system boundary is more complete in the hybrid LCA method and the specific process data are incorporated [28]. Given that very few of the reviewed cases adopted the I–O LCA method (0 cases) and the hybrid method (7 cases), future research should place more emphasis on these methods.

4.5. Data Availability and Data Quality

According to the GHG Protocol Initiative (2008) [29], the quantification of carbon emission can be categorized into the following three tiers based on the methods of obtaining data.
  • Tier 1 methods estimate emissions by multiplying production data, such as the volume of fuel used or materials produced, by an industry-specific default emission factor. Tier 1 emission factors can be obtained from sector databases or reports, such as IPCC reports.
  • Tier 2 methods require data that are less general, which might be available from national statistical agencies or industry associations. For instance, a Tier 2 emission factor might reflect the typical industrial practices within a specific country, whereas a Tier 1 factor constitutes a global default value.
  • Tier 3 methods require facility- or site-specific data, such as the composition of the fuel combusted at a facility, or the specific types of technologies employed at a facility.
The above three tiers of methods represent different levels of methodological complexity. Tier 1 is the basic method, Tier 2 is intermediate, and Tier 3 is the most demanding in terms of complexity and data requirements. Tiers 2 and 3 are considered to be more accurate and relevant for the carbon quantification of products [30].
However, the selection of data collection methods is highly determined by data availability. In fact, data availability is the fundamental element affecting carbon quantification. It significantly affects the selection of boundaries, quantification methods, and emission source ranges. The unavailability of data is considered as one of the major obstacles to quantifying the embodied carbon of buildings. In the reviewed literature, subject to the data availability, many studies adopted a combination of site-specific data (Tier 3) and existing databases (Tier 1 and 2).
The present review also finds that 24 building cases did not provide detailed information on data sources and inventory analysis. Without this information being provided, it is difficult to ensure the repeatability and verifiability of the carbon quantification process. Disclosure of information and repeatability of carbon quantification/modeling in the existing research field should be further improved.

4.6. Carbon Reduction Measures of Prefabrication

A number of studies have proven that prefabrication and off-site construction may sometimes increase the embodied carbon of buildings due to various reasons [4,19]. Therefore, many of the reviewed studies have provided suggestions on carbon reduction measures for prefabrication and off-site construction. These carbon reduction measures include:
  • Increasing the productivity of equipment and machinery in the prefabrication yard;
  • Better design of the prefabrication supply chain;
  • Applying lean techniques, such as value stream mapping, just-in-time technique, continuous flow, and total productive maintenance;
  • Adopting alternative energy sources;
  • Using low embodied carbon materials and local materials;
  • Adopting reused and recycled materials in prefabrication, etc.
Although abundant suggestions and directions have been provided in the existing studies, almost none of them have quantified the carbon reduction potential of these measures. Only a few studies, such as that by Padilla-Rivera et al. (2018) [31], have analyzed and quantified the carbon reduction potential of four proposed carbon mitigation strategies, namely low-carbon materials, material minimization, reuse and recycling of materials, and local sources and biofuels adoption. With the implementation of all four mitigation strategies, the total cradle-to-site embodied carbon emission of a prefabricated building can be reduced by 38.8% [31].

4.7. Future Challenges and Research Directions of Carbon Quantification of Prefabricated Building

The above findings and discussion reveal nine research gaps in the existing body of knowledge. To fill these knowledge gaps, future research directions are recommended (Table 5).

5. Conclusions

With the growing popularity of prefabrication and off-site construction, the cradle-to-site embodied carbon of prefabricated buildings has been frequently studied. The existing studies, with different aims, scopes, and methods, have resulted in a large disparity in embodied carbon emission results and have not yet been systematically reviewed. The variations in embodied carbon quantification in the existing studies have not been critically analyzed. The present research attempted to disclose the correlation between the relevant carbon quantification influencing factors and the quantification results through a systematical review and meta-analysis of recent studies. This research has identified twelve influencing factors of embodied carbon quantification. The findings of this research showed that some influencing factors (i.e., building structure forms, level of prefabrication, type of greenhouse gases considered, and data sources) have a major impact on the embodied carbon quantification of prefabricated buildings. Therefore, it is not recommended that studies performed with different building structure forms, levels of prefabrication, types of greenhouse gases considered, and data sources are compared or used to verify one another. On the other hand, some influencing factors (i.e., the function of building, quantification methods adopted, quantification tools/software used, and carbon inventory databases applied) do not affect the quantification significantly, which means that studies, including those on the different functions of buildings and adopting different quantification methods, quantification tools/software, and carbon inventory databases, can verify each other. Based on the findings, research gaps in the existing body of knowledge have been identified and suggestions on future research directions have been provided. The suggestions are expected to open up new research opportunities in this research field. This research provides an in-depth understanding of the quantification of embodied carbon of prefabricated buildings and also forms a scientific basis for the future research and development of low-carbon construction.

Author Contributions

Conceptualization, Y.C., Y.Z. and W.F.; methodology, Y.C.; data collection and extraction, Y.C.; data analysis, Y.C.; writing—original draft preparation, Y.Z., W.F., Y.F., A.F.; writing—review and editing, Y.Z., W.F., Y.F., A.F.; graphic editing and formatting, Y.C. and Y.Z. All authors have read and agreed to the published version of the manuscript.

Funding

This research received no external funding.

Acknowledgments

Appreciation is given to the faculty staff of the School of Civil and Transportation Engineering, Guangdong University of Technology for their administrative and technical supports.

Conflicts of Interest

The authors declare no conflict of interest.

Appendix A

Table A1. Overview of reviewed prefabricated building cases and their availability of data for meta-analysis.
CaseRef. StudiesCountryBuilding CasesBuilding CharacteristicsEmission SourcesQuantification ApproachesData Quality
Building SizeFunction of BuildingBuilding StructureLevel of Prefabrica-TionLife cycle Phases ConsideredEmission Sources CategoriesType of GHGs ConsideredLCA/Non-LCALCA MethodsQuantification Tools/SoftwareDiversity of DatabasesData Sources
1Aye et al. (2012) [5]AustraliaMedium-rise Wood framed Residential Building
2Aye et al. (2012) [5]AustraliaMedium-rise Steel framed Residential Building
3Iddon and Firth (2013) [32]UKLow-rise Masonry block Residential Building
4Iddon and Firth (2013) [32]UKLow-rise Wood framed Residential Building
5Iddon and Firth (2013) [32]UKLow-rise Other Residential Building
6Paya-Marin et al. (2013) [33]UKLow-rise Wood framed Educational Building
7Paya-Marin et al. (2013) [33]UKLow-rise Wood framed Educational Building
8Mao et al. (2013) [24]ChinaHigh-rise Reinforced concrete Residential Building
9Dodoo et al. (2014) [34]SwedenLow-rise Wood framed Residential Building
10Dodoo et al. (2014) [34]SwedenLow-rise Wood framed Residential Building
11Dodoo et al. (2014) [34]SwedenLow-rise Wood framed Residential Building
12Dodoo et al. (2014) [34]SwedenLow-rise Wood framed Residential Building
13Dodoo et al. (2014) [34]SwedenLow-rise Wood framed Residential Building
14Dodoo et al. (2014) [34]SwedenLow-rise Wood framed Residential Building
15Cao et al. (2015) [35]ChinaMedium-rise Reinforced concrete Residential Building
16Dong et al. (2015) [36]Hong Kong, ChinaHigh-rise Reinforced concrete Residential Building
17Bonamente and Cotana (2015) [37]ItalyLow-rise Reinforced concrete Industrial Building
18Bonamente and Cotana (2015) [37]ItalyLow-rise Reinforced concrete Industrial Building
19Bonamente and Cotana (2015) [37]ItalyLow-rise Reinforced concrete Industrial Building
20Bonamente and Cotana (2015) [37]ItalyLow-rise Reinforced concrete Industrial Building
21Ji et al. (2018) [15]ChinaHigh-rise Reinforced concrete Residential Building
22Islam et al. (2016) [38]AustraliaLow-rise Other Residential Building
23Bukoski et al. (2016) [39]ThailandLow-rise Steel framed Residential Building
24Bukoski et al. (2016) [39]ThailandLow-rise Steel framed Residential Building
25Bukoski et al. (2016) [39]ThailandLow-rise Wood framed Residential Building
26Bukoski et al. (2016) [39]ThailandLow-rise Wood framed Residential Building
27Atmaca (2017) [40]TurkeyLow-rise Steel framed Residential Building
28Atmaca (2017) [40]TurkeyLow-rise Steel framed Residential Building
29Sazedj et al. (2017) [41]PortugalLow-rise Reinforced concrete Residential Building
30Sazedj et al. (2017) [41]PortugalLow-rise Masonry block Residential Building
31Tumminia et al. (2018) [42]ItalyLow-rise Other Office Building
32Padilla-Rivera et al. (2018) [31]CanadaLow-rise Wood framed Residential Building
33Dong et al. (2018) [43]ChinaLow-rise Aluminum profile Residential Building
34Achenbach et al. (2018) [44]GermanyLow-rise Wood framed Residential Building
35Teng and Pan (2019) [45]Hong Kong, ChinaHigh-rise Reinforced concrete Residential Building
36Sandanayake et al. (2018) [46]ChinaHigh-rise Reinforced concrete Office Building
37Tavares et al. (2019) [21]PortugalLow-rise Steel framed Residential Building
38Tavares et al. (2019) [21]PortugalLow-rise Reinforced concrete Residential Building
39Tavares et al. (2019) [21]PortugalLow-rise Wood framed Residential Building
40Tavares et al. (2019) [21]PortugalLow-rise Steel framed Residential Building
41Iuorio et al. (2019) [47]ItalyLow-rise Steel framed Residential Building
42Dara et al. (2019) [48]CanadaLow-rise Other Residential Building
43Dara et al. (2019) [48]CanadaLow-rise Wood framed Residential Building
44Dara et al. (2019) [48]CanadaLow-rise Steel framed Residential Building
45Dara et al. (2019) [48]CanadaLow-rise Wood framed Residential Building
46Du et al. (2019) [19]ChinaHigh-rise Reinforced concrete Residential Building
47Du et al. (2019) [19]ChinaHigh-rise Reinforced concrete Residential Building
48Du et al. (2019) [19]ChinaHigh-rise Reinforced concrete Residential Building
49Vitale et al. (2019) [49]ItalyLow-rise Steel framed Residential Building
50Pierobon et al. (2019) [50]USAMedium-rise Wood framed Residential Building
51Pierobon et al. (2019) [50]USAMedium-rise Wood framed Residential Building
52Leskovar et al. (2019) [51]SloveniaLow-rise Wood framed Residential Building
53Leskovar et al. (2019) [51]SloveniaLow-rise Wood framed Residential Building
54Leskovar et al. (2019) [51]SloveniaLow-rise Wood framed Residential Building
55Leskovar et al. (2019) [51]SloveniaLow-rise Wood framed Residential Building
56Leskovar et al. (2019) [51]SloveniaLow-rise Wood framed Residential Building
57Teng and Pan (2020) [52]Hong Kong, ChinaHigh-rise Reinforced concrete Residential Building
58Ding et al. (2020) [53]ChinaHigh-rise Reinforced concrete Residential Building
59Satola et al. (2020) [54]ChinaLow-rise Steel framed Residential Building
60Satola et al. (2020) [54]ChinaLow-rise Steel framed Residential Building
61Satola et al. (2020) [54]ChinaLow-rise Steel framed Residential Building
62Satola et al. (2020) [54]ChinaLow-rise Steel framed Residential Building
63Minunno et al. (2020) [55]AustraliaLow-rise Steel framed Office Building
64Minunno et al. (2020) [55]AustraliaLow-rise Steel framed Office Building
65Hao et al. (2020) [56]ChinaHigh-rise Reinforced concrete Office Building
66Pervez et al. (2021) [2]PakistanLow-rise Steel framed Residential Building
67Tavares et al. (2021) [3]PortugalLow-rise Steel framed Residential Building
68Tavares et al. (2021) [3]PortugalLow-rise Wood framed Residential Building
69Zhang and Zhang (2021) [57]ChinaLow-rise Masonry block Residential Building
70Wang and Sinha (2021) [26]SwedenMedium-rise Reinforced concrete Residential Building
71Wang and Sinha (2021) [26]SwedenMedium-rise Reinforced concrete Residential Building
72Wang and Sinha (2021) [26]SwedenMedium-rise Reinforced concrete Residential Building
73Wang and Sinha (2021) [26]SwedenMedium-rise Reinforced concrete Residential Building
74Wang and Sinha (2021) [26]SwedenMedium-rise Reinforced concrete Residential Building
75Wang and Sinha (2021) [26]SwedenMedium-rise Reinforced concrete Residential Building
76Wang and Sinha (2021) [26]SwedenMedium-rise Reinforced concrete Residential Building
77Wang and Sinha (2021) [26]SwedenMedium-rise Reinforced concrete Residential Building
78Wang and Sinha (2021) [26]SwedenMedium-rise Reinforced concrete Residential Building
79Wang and Sinha (2021) [26]SwedenMedium-rise Reinforced concrete Residential Building
80Balasbaneh and Sher (2021) [58]MalaysiaLow-rise Reinforced concrete Residential Building
81Balasbaneh and Sher (2021) [58]MalaysiaLow-rise Reinforced concrete Residential Building
82Li et al. (2021) [59]ChinaHigh-rise Reinforced concrete Residential Building
83Li et al. (2021) [59]ChinaHigh-rise Reinforced concrete Residential Building
84Alshamrani (2021) [60]Saudi ArabiaLow-rise Reinforced concrete Public Building
85Jang et al. (2022) [61]South KoreaMedium-rise Reinforced concrete Residential Building
86Han et al. (2022) [4]ChinaMedium-rise Reinforced concrete Public Building
87Han et al. (2022) [4]ChinaMedium-rise Reinforced concrete Public Building
88Han et al. (2022) [4]ChinaMedium-rise Reinforced concrete Public Building
89Al-Najjar and Dodoo (2022) [62]SwedenMedium-rise Wood framed Residential Building
90Balasbaneh and Marsono (2017) [63]MalaysiaLow-rise Masonry block Residential Building
91Balasbaneh and Marsono (2017) [63]MalaysiaLow-rise Reinforced concrete Residential Building
92Balasbaneh and Marsono (2017) [63]MalaysiaLow-rise Steel framed Residential Building
93Balasbaneh and Marsono (2017) [63]MalaysiaLow-rise Wood framed Residential Building
94Balasbaneh and Marsono (2017) [63]MalaysiaLow-rise Wood framed Residential Building
95Balasbaneh and Marsono (2017) [63]MalaysiaLow-rise Wood framed Residential Building
96Ansah et al. (2021) [64]Hong Kong, ChinaHigh-rise Reinforced concrete Residential Building
Count969696489672309677738472

References

  1. Chang, Y.; Li, X.; Masanet, E.; Zhang, L.; Huang, Z.; Ries, R. Unlocking the green opportunity for prefabricated buildings and construction in China. Resour. Conserv. Recycl. 2018, 139, 259–261. [Google Scholar] [CrossRef]
  2. Pervez, H.; Ali, Y.; Petrillo, A. A quantitative assessment of greenhouse gas (GHG) emissions from conventional and modular construction: A case of developing country. J. Clean. Prod. 2021, 294, 126210. [Google Scholar] [CrossRef]
  3. Tavares, V.; Soares, N.; Raposo, N.; Marques, P.; Freire, F. Prefabricated versus conventional construction: Comparing life-cycle impacts of alternative structural materials. J. Build. Eng. 2021, 41, 102705. [Google Scholar] [CrossRef]
  4. Han, Q.; Chang, J.; Liu, G.; Zhang, H. The Carbon Emission Assessment of a Building with Different Prefabrication Rates in the Construction Stage. Int. J. Environ. Res. Public Health 2022, 19, 2366. [Google Scholar] [CrossRef]
  5. Aye, L.; Ngo, T.; Crawford, R.H.; Gammampila, R.; Mendis, P. Life cycle greenhouse gas emissions and energy analysis of prefabricated reusable building modules. Energy Build. 2012, 47, 159–168. [Google Scholar] [CrossRef]
  6. Boafo, F.E.; Kim, J.H.; Kim, J.T. Performance of Modular Prefabricated Architecture: Case Study-Based Review and Future Pathways. Sustainability 2016, 8, 558. [Google Scholar] [CrossRef]
  7. Kamali, M.; Hewage, K. Life cycle performance of modular buildings: A critical review. Renew. Sustain. Energy Rev. 2016, 62, 1171–1183. [Google Scholar] [CrossRef]
  8. Jin, R.; Hong, J.; Zuo, J. Environmental performance of off-site constructed facilities: A critical review. Energy Build. 2020, 207, 109567. [Google Scholar] [CrossRef]
  9. Hu, X.; Chong, H.Y. Environmental sustainability of off-site manufacturing: A literature review. Eng. Constr. Archit. Manag. 2021, 28, 332–350. [Google Scholar] [CrossRef]
  10. van Roosmalen, M.; Herrmann, A.; Kumar, A. A review of prefabricated self-sufficient facades with integrated decentralised HVAC and renewable energy generation and storage. Energy Build. 2021, 248, 111107. [Google Scholar] [CrossRef]
  11. Teng, Y.; Li, K.; Pan, W.; Ng, T. Reducing building life cycle carbon emissions through prefabrication: Evidence from and gaps in empirical studies. Build. Environ. 2018, 132, 125–136. [Google Scholar] [CrossRef]
  12. Page, M.J.; McKenzie, J.E.; Bossuyt, P.M.; Boutron, I.; Hoffmann, T.C.; Mulrow, C.D.; Shamseer, L.; Tetzlaff, J.M.; Akl, E.A.; Brennan, S.E.; et al. The PRISMA 2020 statement: An updated guideline for reporting systematic reviews. Int. J. Surg. 2021, 88, 105906. [Google Scholar] [CrossRef] [PubMed]
  13. Glass, G.V. Primary, Secondary, and Meta-Analysis of Research. Educ. Res. 1976, 5, 3–8. [Google Scholar] [CrossRef]
  14. Mcgill, R.; Tukey, J.W.; Larsen, W.A. Variations of Box Plots. Am. Stat. 1978, 32, 12–16. [Google Scholar]
  15. Ji, Y.; Li, K.; Liu, G.; Shrestha, A.; Jing, J. Comparing greenhouse gas emissions of precast in-situ and conventional construction methods. J. Clean. Prod. 2018, 173, 124–134. [Google Scholar] [CrossRef]
  16. Pan, W.; Ning, Y. Dialectics of sustainable building: Evidence from empirical studies 1987–2013. Build. Environ. 2014, 82, 666–674. [Google Scholar] [CrossRef]
  17. Pan, W. System boundaries of zero carbon buildings. Renew. Sustain. Energy Rev. 2014, 37, 424–434. [Google Scholar] [CrossRef]
  18. Dixit, M.K.; Culp, C.H.; Fernández-Solís, J.L. System boundary for embodied energy in buildings: A conceptual model for definition. Renew. Sustain. Energy Rev. 2013, 21, 153–164. [Google Scholar] [CrossRef]
  19. Du, Q.; Bao, T.; Li, Y.; Huang, Y.; Shao, L. Impact of prefabrication technology on the cradle-to-site CO2 emissions of residential buildings. Clean Technol. Environ. Policy 2019, 21, 1499–1514. [Google Scholar] [CrossRef]
  20. WRI/WBCSD. The Greenhouse Gas Protocol: A Corporate Accounting and Reporting Standard (Revised Edition); World Resources Institute and World Business Council for Sustainable Development: Washington, DC, USA, 2004. [Google Scholar]
  21. Tavares, V.; Lacerda, N.; Freire, F. Embodied energy and greenhouse gas emissions analysis of a prefabricated modular house: The “Moby” case study. J. Clean. Prod. 2019, 212, 1044–1053. [Google Scholar] [CrossRef]
  22. Omar, W.M.S.W.; Doh, J.H.; Panuwatwanich, K.; Miller, D. Assessment of the embodied carbon in precast concrete wall panels using a hybrid life cycle assessment approach in Malaysia. Sustain. Cities Soc. 2014, 10, 101–111. [Google Scholar] [CrossRef]
  23. Wang, H.; Zhang, Y.; Gao, W.; Kuroki, S. Life Cycle Environmental and Cost Performance of Prefabricated Buildings. Sustainability 2020, 12, 2609. [Google Scholar] [CrossRef]
  24. Mao, C.; Shen, Q.; Shen, L.; Tang, L. Comparative study of greenhouse gas emissions between off-site prefabrication and conventional construction methods: Two case studies of residential projects. Energy Build. 2013, 66, 165–176. [Google Scholar] [CrossRef]
  25. Fufa, S.M.; Skaar, C.; Gradeci, K.; Labonnote, N. Assessment of greenhouse gas emissions of ventilated timber wall constructions based on parametric LCA. J. Clean. Prod. 2018, 197, 34–46. [Google Scholar] [CrossRef]
  26. Wang, S.; Sinha, R. Life Cycle Assessment of Different Prefabricated Rates for Building Construction. Buildings 2021, 11, 552. [Google Scholar] [CrossRef]
  27. Zhang, X.; Wang, F. Analysis of embodied carbon in the building life cycle considering the temporal perspectives of emissions: A case study in China. Energy Build. 2017, 155, 404–413. [Google Scholar] [CrossRef]
  28. Hong, J.; Shen, G.Q.; Mao, C.; Li, Z.; Li, K. Life-cycle energy analysis of prefabricated building components: An input–output-based hybrid model. J. Clean. Prod. 2016, 112, 2198–2207. [Google Scholar] [CrossRef]
  29. The Greenhouse Gas Protocol Initiative. Calculating Greenhouse Gas Emissions from Iron and Steel Production: A Component Tool of the Greenhouse Gas Protocol Initiative. Available online: https://ghgprotocol.org/calculation-tools (accessed on 17 January 2022).
  30. IPCC. 2019 Refinement to the 2006 IPCC Guidelines for National Greenhouse Gas Inventories. Overview. Available online: https://www.ipcc.ch/site/assets/uploads/2019/12/19R_V0_01_Overview.pdf (accessed on 1 July 2022).
  31. Padilla-Rivera, A.; Amor, B.; Blanchet, P. Evaluating the Link between Low Carbon Reductions Strategies and Its Performance in the Context of Climate Change: A Carbon Footprint of a Wood-Frame Residential Building in Quebec, Canada. Sustainability 2018, 10, 2715. [Google Scholar] [CrossRef]
  32. Iddon, C.R.; Firth, S.K. Embodied and operational energy for new-build housing: A case study of construction methods in the UK. Energy Build. 2013, 67, 479–488. [Google Scholar] [CrossRef]
  33. Paya-Marin, M.A.; Lim, J.; Sengupta, B. Life-Cycle Energy Analysis of a Modular/Off-Site Building School. Am. J. Civ. Eng. Archit. 2013, 1, 59–63. [Google Scholar] [CrossRef]
  34. Dodoo, A.; Gustavsson, L.; Sathre, R. Lifecycle carbon implications of conventional and low-energy multi-storey timber building systems. Energy Build. 2014, 82, 194–210. [Google Scholar] [CrossRef]
  35. Cao, X.; Li, X.; Zhu, Y.; Zhang, Z. A comparative study of environmental performance between prefabricated and traditional residential buildings in China. J. Clean. Prod. 2015, 109, 131–143. [Google Scholar] [CrossRef]
  36. Dong, Y.H.; Jaillon, L.; Chu, P.; Poon, C.S. Comparing carbon emissions of precast and cast-in-situ construction methods—A case study of high-rise private building. Constr. Build. Mater. 2015, 99, 39–53. [Google Scholar] [CrossRef]
  37. Bonamente, E.; Cotana, F. Carbon and Energy Footprints of Prefabricated Industrial Buildings: A Systematic Life Cycle Assessment Analysis. Energies 2015, 8, 12685–12701. [Google Scholar] [CrossRef]
  38. Islam, H.; Zhang, G.; Setunge, S.; Bhuiyan, M.A. Life cycle assessment of shipping container home: A sustainable construction. Energy Build. 2016, 128, 673–685. [Google Scholar] [CrossRef]
  39. Bukoski, J.J.; Chaiwiwatworakul, P.; Gheewala, S.H. The Life Cycle Assessment of an Energy-Positive Peri-Urban Residence in a Tropical Regime. J. Ind. Ecol. 2016, 12, 1115–1127. [Google Scholar] [CrossRef]
  40. Atmaca, N. Life-cycle assessment of post-disaster temporary housing. Build. Res. Inf. 2017, 45, 524–538. [Google Scholar] [CrossRef]
  41. Sazedj, S.; Morais, A.J.; Jalali, S. Comparison of environmental benchmarks of masonry and concrete structure based on a building model. Constr. Build. Mater. 2017, 141, 36–43. [Google Scholar] [CrossRef]
  42. Tumminia, G.; Guarino, F.; Longo, S.; Ferraro, M.; Cellura, M.; Antonucci, V. Life cycle energy performances and environmental impacts of a prefabricated building module. Renew. Sustain. Energy Rev. 2018, 92, 272–283. [Google Scholar] [CrossRef]
  43. Dong, L.; Wang, Y.; Li, H.X.; Jiang, B.; Al-Hussein, M. Carbon Reduction Measures-Based LCA of Prefabricated Temporary Housing with Renewable Energy Systems. Sustainability 2018, 10, 718. [Google Scholar] [CrossRef]
  44. Achenbach, H.; Wenker, J.L.; Rüter, S. Life cycle assessment of product- and construction stage of prefabricated timber houses: A sector representative approach for Germany according to EN 15804, EN 15978 and EN 16485. Eur. J. Wood Prod. 2018, 76, 711–729. [Google Scholar] [CrossRef]
  45. Teng, Y.; Pan, W. Systematic embodied carbon assessment and reduction of prefabricated high-rise public residential buildings in Hong Kong. J. Clean. Prod. 2019, 238, 117791. [Google Scholar] [CrossRef]
  46. Sandanayake, M.; Luo, W.; Zhang, G. Direct and indirect impact assessment in off-site construction—A case study in China. Sustain. Cities Soc. 2019, 48, 101520. [Google Scholar] [CrossRef]
  47. Iuorio, O.; Napolano, L.; Fiorino, L.; Landolfo, R. The environmental impacts of an innovative modular lightweight steel system: The Elissa case. J. Clean. Prod. 2019, 238, 117905. [Google Scholar] [CrossRef]
  48. Dara, C.; Hachem-Vermette, C.; Assefa, G. Life cycle assessment and life cycle costing of container-based single-family housing in Canada: A case study. Build. Environ. 2019, 163, 106332. [Google Scholar] [CrossRef]
  49. Vitale, P.; Spagnuolo, A.; Lubritto, C.; Arena, U. Environmental performances of residential buildings with a structure in cold formed steel or reinforced concrete. J. Clean. Prod. 2018, 189, 839–852. [Google Scholar] [CrossRef]
  50. Pierobon, F.; Huang, M.; Simonen, K.; Ganguly, I. Environmental benefits of using hybrid CLT structure in midrise non-residential construction: An LCA based comparative case study in the U.S. Pacific Northwest. J. Build. Eng. 2019, 26, 100862. [Google Scholar] [CrossRef]
  51. Leskovar, V.Ž.; Žigart, M.; Premrov, M.; Lukman, R.K. Comparative assessment of shape related cross-laminated timber building typologies focusing on environmental performance. J. Clean. Prod. 2019, 216, 482–494. [Google Scholar] [CrossRef]
  52. Teng, Y.; Pan, W. Estimating and minimizing embodied carbon of prefabricated high-rise residential buildings considering parameter, scenario and model uncertainties. Build. Environ. 2020, 180, 106951. [Google Scholar] [CrossRef]
  53. Ding, Z.; Liu, S.; Luo, L.; Liao, L. A building information modeling-based carbon emission measurement system for prefabricated residential buildings during the materialization phase. J. Clean. Prod. 2020, 264, 121728. [Google Scholar] [CrossRef]
  54. Satola, D.; Kristiansen, A.B.; Houlihan-Wiberg, A.; Gustavsen, A.; Ma, T.; Wang, R.Z. Comparative life cycle assessment of various energy efficiency designs of a container-based housing unit in China: A case study. Build. Environ. 2020, 186, 107358. [Google Scholar] [CrossRef]
  55. Minunno, R.; O’Grady, T.; Morrison, G.M.; Gruner, R.L. Exploring environmental benefits of reuse and recycle practices: A circular economy case study of a modular building. Resour. Conserv. Recycl. 2020, 160, 104855. [Google Scholar] [CrossRef]
  56. Hao, J.L.; Cheng, B.; Lu, W.; Xu, J.; Wang, J.; Bu, W.; Guo, Z. Carbon emission reduction in prefabrication construction during materialization stage: A BIM-based life-cycle assessment approach. Sci. Total Environ. 2020, 723, 137870. [Google Scholar] [CrossRef] [PubMed]
  57. Zhang, X.C.; Zhang, X.Q. Comparison and sensitivity analysis of embodied carbon emissions and costs associated with rural house construction in China to identify sustainable structural forms. J. Clean. Prod. 2021, 293, 126190. [Google Scholar] [CrossRef]
  58. Balasbaneh, A.T.; Sher, W. Life cycle sustainability assessment analysis of different concrete construction techniques for residential building in Malaysia. Int. J. Life Cycle Assess. 2021, 26, 1301–1318. [Google Scholar] [CrossRef]
  59. Li, X.J.; Lai, J.Y.; Ma, C.Y.; Wang, C. Using BIM to research carbon footprint during the materialization phase of prefabricated concrete buildings: A China study. J. Clean. Prod. 2021, 279, 123454. [Google Scholar] [CrossRef]
  60. Alshamrani, O.S. Integrated LCA-LCC Assessment Model of Offsite, Onsite, and Conventional Construction Systems. J. Asian Archit. Build. Eng. 2021, 1–23. [Google Scholar] [CrossRef]
  61. Jang, H.; Ahn, Y.; Roh, S. Comparison of the Embodied Carbon Emissions and Direct Construction Costs for Modular and Conventional Residential Buildings in South Korea. Buildings 2022, 12, 51. [Google Scholar] [CrossRef]
  62. Al-Najjar, A.; Dodoo, A. Modular multi-storey construction with cross-laminated timber: Life cycle environmental implications. Wood Mater. Sci. Eng. 2022, 1–15. [Google Scholar] [CrossRef]
  63. Balasbaneh, A.T.; Marsono, A.K.B. Strategies for reducing greenhouse gas emissions from residential sector by proposing new building structures in hot and humid climatic conditions. Build. Environ. 2017, 124, 357–368. [Google Scholar] [CrossRef]
  64. Ansah, M.K.; Chen, X.; Yang, H.; Lu, L.; Lam, P.T.I. Developing an automated BIM-based life cycle assessment approach for modularly designed high-rise buildings. Environ. Impact Assess. Rev. 2021, 90, 106618. [Google Scholar] [CrossRef]
Figure 1. Flowchart of literature selection (conformed to PRISMA guidelines).
Buildings 12 01265 g001
Figure 2. Configuration of box plot.
Buildings 12 01265 g002
Figure 3. Temporal trend for the number of published studies regarding the subject (with 2022 forecasted).
Buildings 12 01265 g003
Figure 4. Geographic distribution of the research locations of reviewed studies.
Buildings 12 01265 g004
Figure 5. Box plots for embodied carbon emission of building cases against the twelve influencing factors.
Buildings 12 01265 g005
Figure 6. Level of fabrication of the reviewed prefabricated building cases.
Buildings 12 01265 g006
Figure 7. Life cycle phases concerned in the reviewed building cases.
Buildings 12 01265 g007
Figure 8. Number of cases considering various emission sources in different life cycle phases.
Buildings 12 01265 g008
Figure 9. Number of reviewed building cases adopting different carbon quantification methods.
Buildings 12 01265 g009
Figure 10. Relation between prefabricated building heights and building structural forms.
Buildings 12 01265 g010
Table 1. Previous reviews on the carbon emission (energy consumption) of prefabricated buildings.
LiteratureNo. of Cases ReviewedReview MethodsPrefabrication Type /LevelFocus of ReviewReviewed Content/ParametersComparable Analysis of Carbon Quantification ResultsAnalysis on Energy/Carbon Quantification Method
Boafo et al. (2016) [6]Not availableReviewComponent;
Panelized structure;
Modular structure;
Hybrid structure;
Unitized building
Overall performance of prefabrication
  • Thermal performance
  • Acoustic performance
  • Seismic resistance
  • Energy consumption
  • LCA
Not providedNot provided
Kamali and Hewage (2016) [7]62 + 44Systematic reviewModular buildingLife cycle performance of modular construction
  • Benefits and challenges of modular construction
  • Environmental performance assessment (e.g., impact indicators, assessed life cycle phases, assessment method and software)
Not providedNot provided
Teng et al. (2018) [11]27Systematic review and meta-analysisComponent/material;
Residential unit;
Building as a whole;Building with site; Building and city
Building life cycle carbon reduction potential through prefabrication12 variables of life cycle carbon (lifespan, life cycle stage, geographic scope, climatic zone, LCA method, research method, function unit, building type, building height, building material, level of prefabrication)YesNot provided
Jin et al. (2020) [8]43Systematic review
(Bibliometric analysis)
Prefabricated buildingEnvironmental performance
  • Level of prefabrication
  • Environmental performance indicators
  • Environmental assessment methods
  • Building types
Not providedNot provided
Hu and Chong (2021) [9]55Systematic review
(Content analysis)
Not providedEnvironmental sustainability
  • Environmental sustainability assessment
  • Environmental sustainability strategies
  • Critical environmental sustainability factors
Not providedNot provided
van Roosmalen et al. (2021) [10]49Systematic reviewPrefabricated facadeEnergy saving potential Operational stage energy savingsYesNot provided
Table 2. Twelve influencing factors of embodied carbon quantification of prefabricated buildings.
Category Influencing FactorsLevels/VariablesNumber of Cases (N)%(N)SD (kgCO2e/m2)
Building characteristics Building sizeLow-rise6265%216.7
Medium-rise2021%99.8
High-rise1415%149.5
Function of buildingResidential8184%211.6
Office55%141.7
Industrial44%55.8
Public44%4.9
Educational22%73.8
Building structureReinforced concrete3941%164.7
Wood framed2930%111.2
Steel framed1920%420.3
Masonry block44%159.5
Aluminum profile11%n/a
Other44%n/a
Level of prefabricationVery low (<10%)22%410.9
Low (10–25%)77%106.7
Medium (25–60%)1111%147.3
High (60–100%)2829%395.6
Not specified4850%n/a
Emission sourcesLife cycle phases consideredMaterial production (P1, P2)66%241.0
Cradle-to-site entrance gate (P1, P2, P3, P4, P5)1314%510.5
Cradle-to-site (P1, P2, P3, P4, P5, P6)6972%153.7
Other boundaries88%n/a
Emission source categoriesE1 * (only)22%n/a
E3 * (only)33%457.8
E1, E2 *22%13.4
E1, E35355%274.9
E1, E2, E31213%84.9
Not specified2425%n/a
Types of GHGs consideredCO22223%70.9
CO2, CH4, and N2O66%122.3
CO2, CH4, N2O, SF6, HFCs,
and PFCs
11%n/a
98 GHGs11%n/a
Not specified6669%n/a
Quantification approachesLCA/non-LCALCA8184%245.1
Non-LCA1516%109.5
LCA methodsProcess-based LCA6972%201.1
I-O LCA00%n/a
Hybrid LCA88%281.5
Not specified1920%n/a
Quantification tools/softwareSimaPro3638%367.6
Baubook eco2soft55%54.3
Athena Impact Estimator44%42.4
Self-developed quantification models/equations2526%141.2
Other33%n/a
Not specified2324%n/a
Data qualityDiversity of databasesAdopting single database6164%323.8
Adopting multiple databases2324%196.8
Not specified1213%n/a
Data sourcesPrimary data sources3435%151.4
Secondary data sources66%14.6
Combination of primary and secondary data sources3233%425.4
Not specified2425%n/a
* Notes: (E1) combustion of fuels, (E2) industrial process emissions, (E3) purchased electricity.
Table 3. Examples of various categories of emission sources in different life cycle phases.
(E1) Combustion of Fuels in Boilers, Furnaces, Vehicles, Generators, Etc.(E2) Industrial Process Emissions(E3) Purchased Electricity(E4) Other Indirect EmissionsResponsibility for Carbon Quantification and Reporting
Life cycle phases(S1) Raw material extraction
  • Combustion of diesel in mining machinery
  • Combustion of gasoline trucks, etc.

N/A
  • Electricity consumption of electrical arc furnace (steelmaking)
  • Electricity consumption of machinery and equipment
  • Emissions from purchased materials (e.g., purchased clinkers for cement production)
  • Third-party transportation
Material manufacturer
(S2) Building product manufacturing
  • Combustion of coal and coke in blast furnace (ironmaking)
  • Combustion of coal in kiln (cement clinker production), etc.
  • Calcination of carbonates during cement clinker production
  • Ore reducing reaction during ironmaking
  • Electricity consumption of machinery and equipment
  • Emissions from purchased materials
  • Third-party transportation
Material manufacturer
(S3) Transportation to prefabrication yard
  • Gasoline/diesel combustion of trucks
N/A
  • Power consumption of electro mobiles
N/AMaterial manufacturer/Prefabricator
(S4) Prefabrication
  • Diesel/coal combustion for machinery and equipment
N/A
  • Electricity consumption of machinery and equipment
  • Emissions from purchased materials
  • Third-party transportation
Prefabricator
(S5) Transportation to construction site
  • Gasoline/diesel combustion of trucks
N/A
  • Power consumption of electro mobiles
N/APrefabricator/Constructors
(S6) Construction and assembly
  • Diesel/coal combustion for machinery and equipment
  • Onsite power generation
N/A
  • Electricity consumption of machinery and equipment
  • Emission from purchased materials
  • Third-party transportation
Constructors
Table 4. Carbon inventory databases.
DatabasesNumber of CasesNumber of Studies
Ecoinvent5621
Inventory of Carbon & Energy (ICE)168
Literature159
U.S. Life Cycle Inventory (USLCI) Database43
Malaysia Life Cycle Inventory Database (MYLCID) 82
IPCC Emissions Factor Database32
European reference Life Cycle Database (ELCD)21
Chinese Life Cycle Database (CLCD)21
Australian Life Cycle Inventory (AusLCI)11
GaBi11
Other national/local database(s)148
Not clarified74
Table 5. Knowledge gaps and future research directions in embodied carbon quantification of prefabricated buildings.
GapsFuture Research Direction
Limitations on building types
  • Medium-rise and high-rise prefabricated buildings have been less studied.
  • Future research should focus more on medium-rise and high-rise prefabricated buildings.
  • Few studies have focused on non-residential prefabricated buildings.
  • Future research should be conducted on a larger diversity of building types, especially industrial, public, educational, hospital, and commercial buildings.
  • Existing studies have focused on RC and steel-frame prefabricated buildings.
  • Future research should focus more on the other structural forms, i.e., steel-frame, masonry block structure, and aluminum profile prefabricated buildings.
  • Most of the existing studied cases were high prefabrication level (>60%) buildings.
  • Future research should place more emphasis on lower prefabrication rate buildings (<60%).
Limitation on emission sources
  • Existing studies have inconsistent life cycle boundaries of carbon quantification.
  • Future research is expected to explore a methodological standard for a uniformly recognized boundary definition for embodied carbon quantification.
  • The relationship between embodied carbon and coverage of emission sources is still unclear.
  • Future research is needed to explore the relationship between embodied carbon and coverage of emission sources.
Limitations on quantification methods
  • Very few prefabricated building cases adopted I–O LCA and hybrid LCA.
  • Future research should pay more attention to I–O LCA and hybrid LCA methods.
Limitation on data availability/quality
  • Many studies have not provided information on data sources and inventory analysis.
  • Future research should disclose relevant information on carbon quantification and improve data transparency.
Limitation on carbon reduction measures
  • Existing studies have provided carbon reduction measures for prefabricated buildings without estimating their reduction potential.
  • Future research is suggested to quantitatively analyze the reduction potential of carbon reduction measures.
Publisher’s Note: MDPI stays neutral with regard to jurisdictional claims in published maps and institutional affiliations.

