
Determining Cost and Time Performance Indexes for Diversified Investment Tasks


Department of Building Engineering, Faculty of Civil Engineering, Wroclaw University of Science and Technology, 50-370 Wrocław, Poland
Buildings 2022, 12(8), 1198; https://doi.org/10.3390/buildings12081198
Submission received: 14 July 2022
/
Revised: 28 July 2022
/
Accepted: 4 August 2022
/
Published: 9 August 2022
(This article belongs to the Special Issue Construction Scheduling, Quality and Risk Management)
Abstract
:The aim of the research results presented in the article was to develop a method that enables the analysis and evaluation of deviations at the stage of implementing a construction investment in various construction sectors. The new method was based on the well-known Earned Value Method (EVM). It was assumed that the monitoring of costs and the constant control of the implementation time of construction projects, with the simultaneous analysis of the level of deviations, allows for the consistent management of the investment task. Moreover, it ensures—in the required time—the adoption of appropriate improvement actions, and also enables the quantification of risk during the planning of an investment. The article attempts to prove the validity of the assumption about the necessity of the cyclical verification of the level of deviations in construction projects budget and schedule. Such an approach provides numerous perceptible benefits; such as the precise determination of the size of possible losses; an immediate reaction to risk; and the possibility of making changes at every stage of implementing an investment. On the basis of the analysis of the author’s own research carried out in three research groups of facilities (collective housing; hotels; and commercial and service facilities), an original attempt was made to determine the size of cost and time performance indexes of various investment tasks. The values of these performance indexes were determined, and are presented as quantile images in boxplots.
1. Introduction
1.1. Parameters of the Investment Process
The management of construction investments is a process that includes a number of activities, actions and decisions that are closely related to the investment being implemented, and which aim to achieve utility effects by creating new fixed assets or by increasing existing ones [1,2]. The operational effects of the construction process may include the erection of a new construction object, or the renovation/modernization of an existing object. Proper planning of the entire construction process is a very important activity, and has a direct impact on the achievement of success in when implementing the investment plan [3].
The construction industry is characterized by a high complexity of implemented construction processes. The implementation of construction projects is specific, and also particularly difficult, because each implementation is a unique, complex and dynamic process that consists of several interrelated sub-processes in which various participants of the investment process take part [4].
The implementation of each construction project takes place within specific time and cost parameters in accordance with the established technical and quality requirements. The basic elements that determine the success or failure of a construction project are the time, cost, quality and scope of the investment task [5]. The project management triangle, known as the “Kerzner Triangle”, is a graphical representation of the relationship between the aforementioned elements of the success or failure of an investment. Each investment venture, i.e., each project, requires a balance of these four elements, because they all depend on each other. The budget, schedule, quality or scope of a project cannot be changed without changing at least one of the other elements [6].
1.2. Literature Review
During the implementation of construction projects, a frequent phenomenon is the exceeding of the planned budget and/or the failure to meet the planned deadlines [7,8]. Exceeding the approved budget is often an integral part of the implementation of construction projects, especially those in which unforeseen threats or deviations from the plan may occur [9,10].
Failure to meet the planned time, cost and quality parameters of a construction project may be a consequence of emerging risks or uncertainties [11]. Their occurrence has a negative impact on the project and, in extreme cases, may even lead to the failure of the entire project [12]. Delays, or an increase in the total investment cost, are a problem that is often encountered in the implementation of construction investments. This is despite the use of advanced construction technologies, including system technologies and proven tools that support the management of the construction process [13]. Therefore, monitoring the progress of construction site works during the construction phase is of key importance [14].
Establishing a job breakdown structure is the foundation of planning, and determines the material scope of the project. It includes the elements of the project, which are grouped according to the similarity of their structure and the financial expenditure that is necessary to produce them. In order to facilitate the control of the changing work schedule and the monitoring of a project’s implementation, it is recommended to use computerized project management systems [15]. The regular assessment of the progress of works using IT tools enables the effectiveness of activities on the construction site to be shown, and, at the same time, analyses to be carried out [16,17].
The correct planning of financial flows has a significant impact on the company’s financial liquidity, and also on the achievement of success in the implementation of a given project. Proper planning of financial flows is understood as the correct planning of costs in the implementation phase, and at the stage of submitting offers by contractors [18]. The timely implementation of construction projects, and the reduction in their implementation time, affect the economic efficiency of the investment [19].
This is why it is so important to properly develop the investor’s work and expenditure schedule by including the specific dates of the commencement and completion of the project, appropriate links between tasks, and specific durations of individual tasks and the costs of their implementation [20]. Only a solid work plan, namely a reasonable work and expenditure schedule, can increase work efficiency and enable contractors to properly execute the contract at the lowest cost [21]. Of course, verification of the correctness of the planned costs and investment time only takes place “post factum”, i.e., at the end of the investment, and therefore methods and tools are sought to support the correct planning of a construction project.
During the cost planning phase of a construction project, the cost of construction works should be correctly determined, i.e., the direct costs related to the implementation of works, in addition to other indirect costs, including overheads and expected profit [22]. Unfortunately, exceeding the planned budget and/or time is a very common feature of construction projects, and it is also unlikely that the construction investment will run entirely in accordance with the planned work and expenditure schedule [23,24]. During implementation, the actual progress of works may differ significantly from that specified in the initial plan, and therefore it is also necessary to define the principles of controlling and monitoring the course of the construction project.
The Earned Value Method (EVM) is an extensive group of applied methods for controlling and monitoring the implementation of construction projects. Project management using the Earned Value Method is a well-known management system that integrates the costs, schedule and technical performance [25,26]. The Earned Value Method is a method of measuring the actual progress of the project [27]. It consists of controlling the investment task by periodically comparing the actually completed scope of work with its planned time of completion and the planned cost of implementation in accordance with the adopted planned schedule and budget of the project at the beginning of implementing the task [28,29]. The method takes into account the scope of works that is actually carried out on the construction site, and it enables cost and schedule deviations, performance indicators, project cost forecasts, and the schedule duration to be calculated [30,31]. The Earned Value Method provides early recognition of project performance indexes, which is helpful when planning possible corrective actions [32]. As part of managing the costs of an investment, the costs of the entire project are estimated, its budget is set, the planned costs are compared with the actual costs incurred at various milestones, the remaining costs are estimated, and the final cost estimate is updated. The method enables relatively uncomplicated indicators of cost and schedule deviation, performance parameters, project cost forecasts, and schedule duration to be calculated [33].
The Earned Value Method uses several indicators, such as:
- planned value—PV, also known as the budgeted cost of work scheduled—BCWS;
- earned value—EV, also known as the budgeted cost of work performed—BCWP;
- actual cost—AC, also known as the actual cost of work performed—ACWP;
in addition to the designated deviations and indexes for the above values, namely:
- schedule variance—SV;
- cost variance—CV;
- schedule performance index—SPI;
- cost performance index—CPI;
- estimation at completion—EAC;
- estimated time to complete—ETTC.
The essential indicators of EVM—referred to three S-curves—have been presented in the Figure 1 [33].
Importantly, the PV, AC and EV indicators are a function of time, and can be graphically presented as curves. At the investment planning stage, a PV curve, which presents the budgeted cost of work scheduled, is presented. The other two curves (EV, AC) are determined, during the investment, based on the data that were obtained during its monitoring. These curves are determined at the current moment of the monitoring of the investment, i.e., at the current inspection date.
In some countries, such as the United States, Great Britain, Australia, and South Korea, the use of the Earned Value Method is common and recommended by legal regulations. Moreover, it is not only limited to the construction sector, but is also used in the IT, industrial and manufacturing sectors. Although the method has been implemented by many countries, there are countries, such as Malaysia or India, where the method is not so widely known [34]. The level of awareness of the Earned Value Method, e.g., in Malaysia, is low. Over 80% of participants in the construction process have a very low awareness of the use of this method [35].
In the literature, many works presenting the effective application of the Earned Value Method in real construction projects can be found, e.g., the construction of three airports in Belgium [36], a logistics center in South Korea [37], four collective residence buildings in Indonesia [38], railway infrastructure on the peninsula of Malaysia [39], and a public utility building [40] and a multi-family housing estate in Poland [41].
Due to the conducted research, the classic Earned Value Method has undergone, and is still subject to, constant modifications [36]. The method was extended by the introduction of new parameters and indicators that, according to their authors, were not previously present in the method. These parameters allow for more precise calculations of, e.g., the schedule forecast indicator (SFI) [42]; the stability indicator of forecasting using earned value [43]; the risk performance index (RPI), which takes into account, among others aspects, health and safety, stakeholder satisfaction, or quality [44]; and the impact of unplanned time and cost deviations on the financial liquidity of a construction project [45]. Moreover, they enable the elements of risk analysis during the execution of works; uncertainty conditions [46]; the cost-effectiveness assessment of projects in random implementation conditions [47,48]; time deviations from the schedule (T/S), and deviations from the planned costs (T/C) [41] to be taken into consideration [49].
The application of the classic Earned Value Method relates to cost management, with the method not being widely used to forecast project duration. Although the Earned Value Method allows for the determination of performance indicators for a cost variable (cost performance index) and the project schedule performance (schedule performance index), all the method’s indexes are based on cost values. Recent research trends show an increasing interest in using additional performance indicators to predict the overall duration of a project [50]. An extension of the Earned Value Method is the addition of an element related to Earned Duration Management (EDM). In this method, additional measures, which had not been previously used in the classic Earned Value Method, have been introduced, such as the duration performance index (DPI), the earned duration index (EDI), schedule compliance [51], and the Earned Schedule (ES) index, which is used to calculate the utilization level of the work schedule [52]. Improving the accuracy of project time forecasting can be achieved by extending the classic method and by considering corrective actions that are taken during the progression of a project. The inclusion of corrective actions in the method improves the forecasting accuracy of traditional methods, especially in the middle and late phases of projects. As a result, by implementing corrective actions in the forecasting process, project managers can more accurately predict the final duration of a project [53].
Earned Value Management (EVM) and Earned Duration Management (EDM) are the methods that are used to monitor the performance of a project during its implementation. These methods serve as the basis for forecasting the final project duration and/or project costs. Each modification of classical methods has at least one key weakness [54]. The weakness of these methods is the fact that the calculation, estimation and prediction of the future development trend is based on past progress, i.e., the past that is beyond the control of a decision maker. In each of the methods, past events have a significant impact on the obtained results [55]. Moreover, in the traditional approaches of both Earned Value Management and Earned Duration Management, the performance of a schedule is not measured using a unit of time, but rather in monetary units. Furthermore, it uses information about costs to define the performed schedule. Therefore, the accuracy of both approaches is questionable. The performance of the schedule is not accurately forecasted, which leads to an underestimation of post-completion estimates [56]. Research concerning the application of the proposed methods in the construction industry has shown that these methods (in the classical approach) ignore the variability of the duration of activities, which in turn always results in optimistic deadlines that can be very difficult to meet in real projects [57]. Please note that the volatility in time and cost is unplanned, and is a problem when trying to complete a project on time and according to the budget [58].
2. Methods and Models
2.1. Research Approach
The developed research approach is the result of many years of studies concerning the development of methods and tools for the modeling of multi-criteria processes in construction engineering [59,60,61]. Real-time decision making seems to be well recognized as a deterministic cause–effect event, and is supported by many programs and applications in everyday engineering and managerial work [1,2]. Much more interesting challenges include the analysis of past states that have effects that can be observed in the present, and the current modeling of continuous processes, the effects of which will be visible in the future. When using two-valued logic, in which the premise results in an arbitrary conclusion, the decision is determined by the inference model. Moreover, when such logic is insufficient, it has been noticed that decisions cease to be deterministic, and instead become multivariate. Actions are also undertaken in a multi-variant way, and assume the tracking of circumstances and possible changes during the implementation of the decision. There is no doubt that a real situation is more complicated. It therefore requires a more complex decision-making management process, the precise determination of the cumulative cost curve, and the continuous monitoring of its fitting to the curve of costs that are planned in the investment budget.
2.2. Research Sample
The data for the development of the proprietary research methodology are the result of the author’s own experience and professional work, which involved the provision of the services of the Banking Investment Supervision (BIS) in the years from 2006 to 2022 for banks granting investment loans for private procurement. Over the period of 17 years, together with the BIS team, the author collected and processed cost data by conducting monthly technical and financial inspections at the construction sites of implemented investments. The measurement of the cost and budget of investment tasks was documented in 536 BIS reports: preliminary reports (PR), monthly reports (MR), and final reports (FR). The research covered various construction projects in 8 typologically and quantitatively diverse research samples: collective residence buildings, office buildings, hotels, retail and service parks, logistics centers, health centers, airports, and industrial plants. A summary of the number of cumulative cost measurements in the reports is presented in Table 1.
The research covered basic work and expenditure schedules prepared by investors before the commencement of works, in addition to the author’s results of monthly measurements of incurred and generated costs/amounts of the performed construction works documented in the BIS reports.
2.3. Performance Indexes
The cost performance index (CPIj) is determined for each individual period under investigation j ∊ (1, …, m), where m is the number of accounting periods, which is determined on the basis of the amount of executed works (in financial value) and the actual duration of the analyzed construction project. For each analyzed period j, the cost performance index is calculated as the quotient of the cumulative value of the budgeted cost of work performed (CBCWPj) and the cumulative value of the actual cost of work performed (CACWPj), according to the general formula:
CPIj = CBCWPj/CACWPj
The interpretation of the cost performance index (CPIj) is as follows:
- CPIj < 1—overrunning the budget. This means that the actual cost of work performed is higher than the budgeted cost of work performed, i.e., ACWPj > BCWPj;
- CPIj > 1—not using the budget (savings). This means that the actual cost of work performed is lower than the budgeted cost of work performed, i.e., ACWPj < BCWPj;
- CPIj = 1—the cost of works is as planned (according to the planned budget), which means that the actual cost of work performed is equal to the budgeted cost of work performed, i.e., ACWPj = BCWPj.
The schedule performance index (SPIj) is determined for each individual examined period j ∊ (1, …, m), where m is the number of accounting periods, which is determined on the basis of the amount of executed financial works and the actual duration of the analyzed construction project. For each j-th analyzed period, the schedule performance index is calculated as the quotient of the cumulative value of the budgeted cost of work performed (CBCWPj) and the cumulative value of the budgeted cost of work scheduled (CBCWSj), according to the following formula:
SPIj = CBCWPj/CBCWSj
However, if the number of billing periods determined on the basis of the amount of executed works (in financial value) and the actual duration of the analyzed construction project j is greater than the number of billing periods determined on the basis of the basic work and expenditure schedule i (j > i), the cumulative value of the budgeted cost of work scheduled (CBCWSj) for subsequent billing periods, which are greater than I, is equal to the maximum cumulative value of the budgeted cost of work scheduled (CBCWSi). Interpretation of the schedule performance index (SPIj) is vividly presented in the Table 2 as follows [62]:
- SPIj < 1—delay in the schedule (progress of work is less than planned = work pace is slower than planned). This means that the budgeted cost of work scheduled is higher than the budgeted cost of work performed, i.e., BCWSj > BCWPj;
- SPIj > 1—ahead of schedule (work progress is greater than planned = work pace is faster than planned). This means that the budgeted cost of work scheduled is less than the budgeted cost of work performed, i.e., BCWSj < BCWPj;
- SPIj = 1—works are carried out in accordance with the schedule (progress of works is equal to the scheduled work = pace of work is in line with the planned pace). This means that the budgeted cost of work scheduled is equal to the budgeted cost of work performed, i.e., BCWSj = BCWPj.
3. Research Results
By using the processed data, it is possible to develop boxplots for the analyzed performance indexes. The boxplot is used to present the results and to compare data, and it contains information about the position, dispersion and shape of the data distribution. In order to develop a boxplot, it is necessary to each time determine the following values:
- maximum value—MAX;
- third quartile—Q3;
- median—Me (Q2);
- first quartile—Q1;
- minimum value—MIN.
The graphical interpretation of the boxplot is shown in Figure 2.
Based on the developed plots, it is possible to analyze data in the following areas:
- Position: the position is indicated by the entire boxplot, e.g., the data range can be defined (Min, Max).
- Data dispersion: the longer the plot, the more dispersed the data, i.e., they can have a greater variety of values. Long whiskers are also evidence of distraction—i.e., there are extreme observations (very different from the box);.
- Shape: if the plot looks symmetrical to the median, it can be suspected that the graph is symmetrical. If the box is not evenly divided and/or the whiskers are of different lengths, there is an asymmetric distribution. Whether the asymmetry is right-handed or left-handed can be read from the Max and Min distance from the Median. If one of these distances is significantly greater than the other, there is a right-handed asymmetry (if the Max distance is significantly greater then Me) or a left-handed asymmetry (if the Min distance is greater than Me)
3.1. Cost Performance Index
After carrying out the calculations in accordance with the proposed research methodology, Figure 3 and Figure 4 show the results obtained for all the analyzed construction projects, which were divided into three research groups.
The results for 28 construction projects indicate a high variability in the obtained indexes of budget implementation over time. Depending on the adopted method of conducting construction investments (e.g., general contractors, package contractors), the actual final budget of the investment differed from the scheduled budget value.
Of the analyzed 14 projects, 50% were implemented with their budget exceeding the planned value. For these projects, the cost performance index during the entire implementation period differed from the value of 1 (CPI < 1), which can be seen in Figure 3 and Figure 4.
The largest deviations in the cost performance index can be noted for groups 2 and 3 of the analyzed projects, i.e., for hotel buildings and commercial and service buildings. In group 2, over 88% of projects (8 out of 9 cases) were implemented above the planned budget and, in group, 3–50% of projects (4 out of 8 cases) were implemented above the planned budget.
3.2. Schedule Performance Index
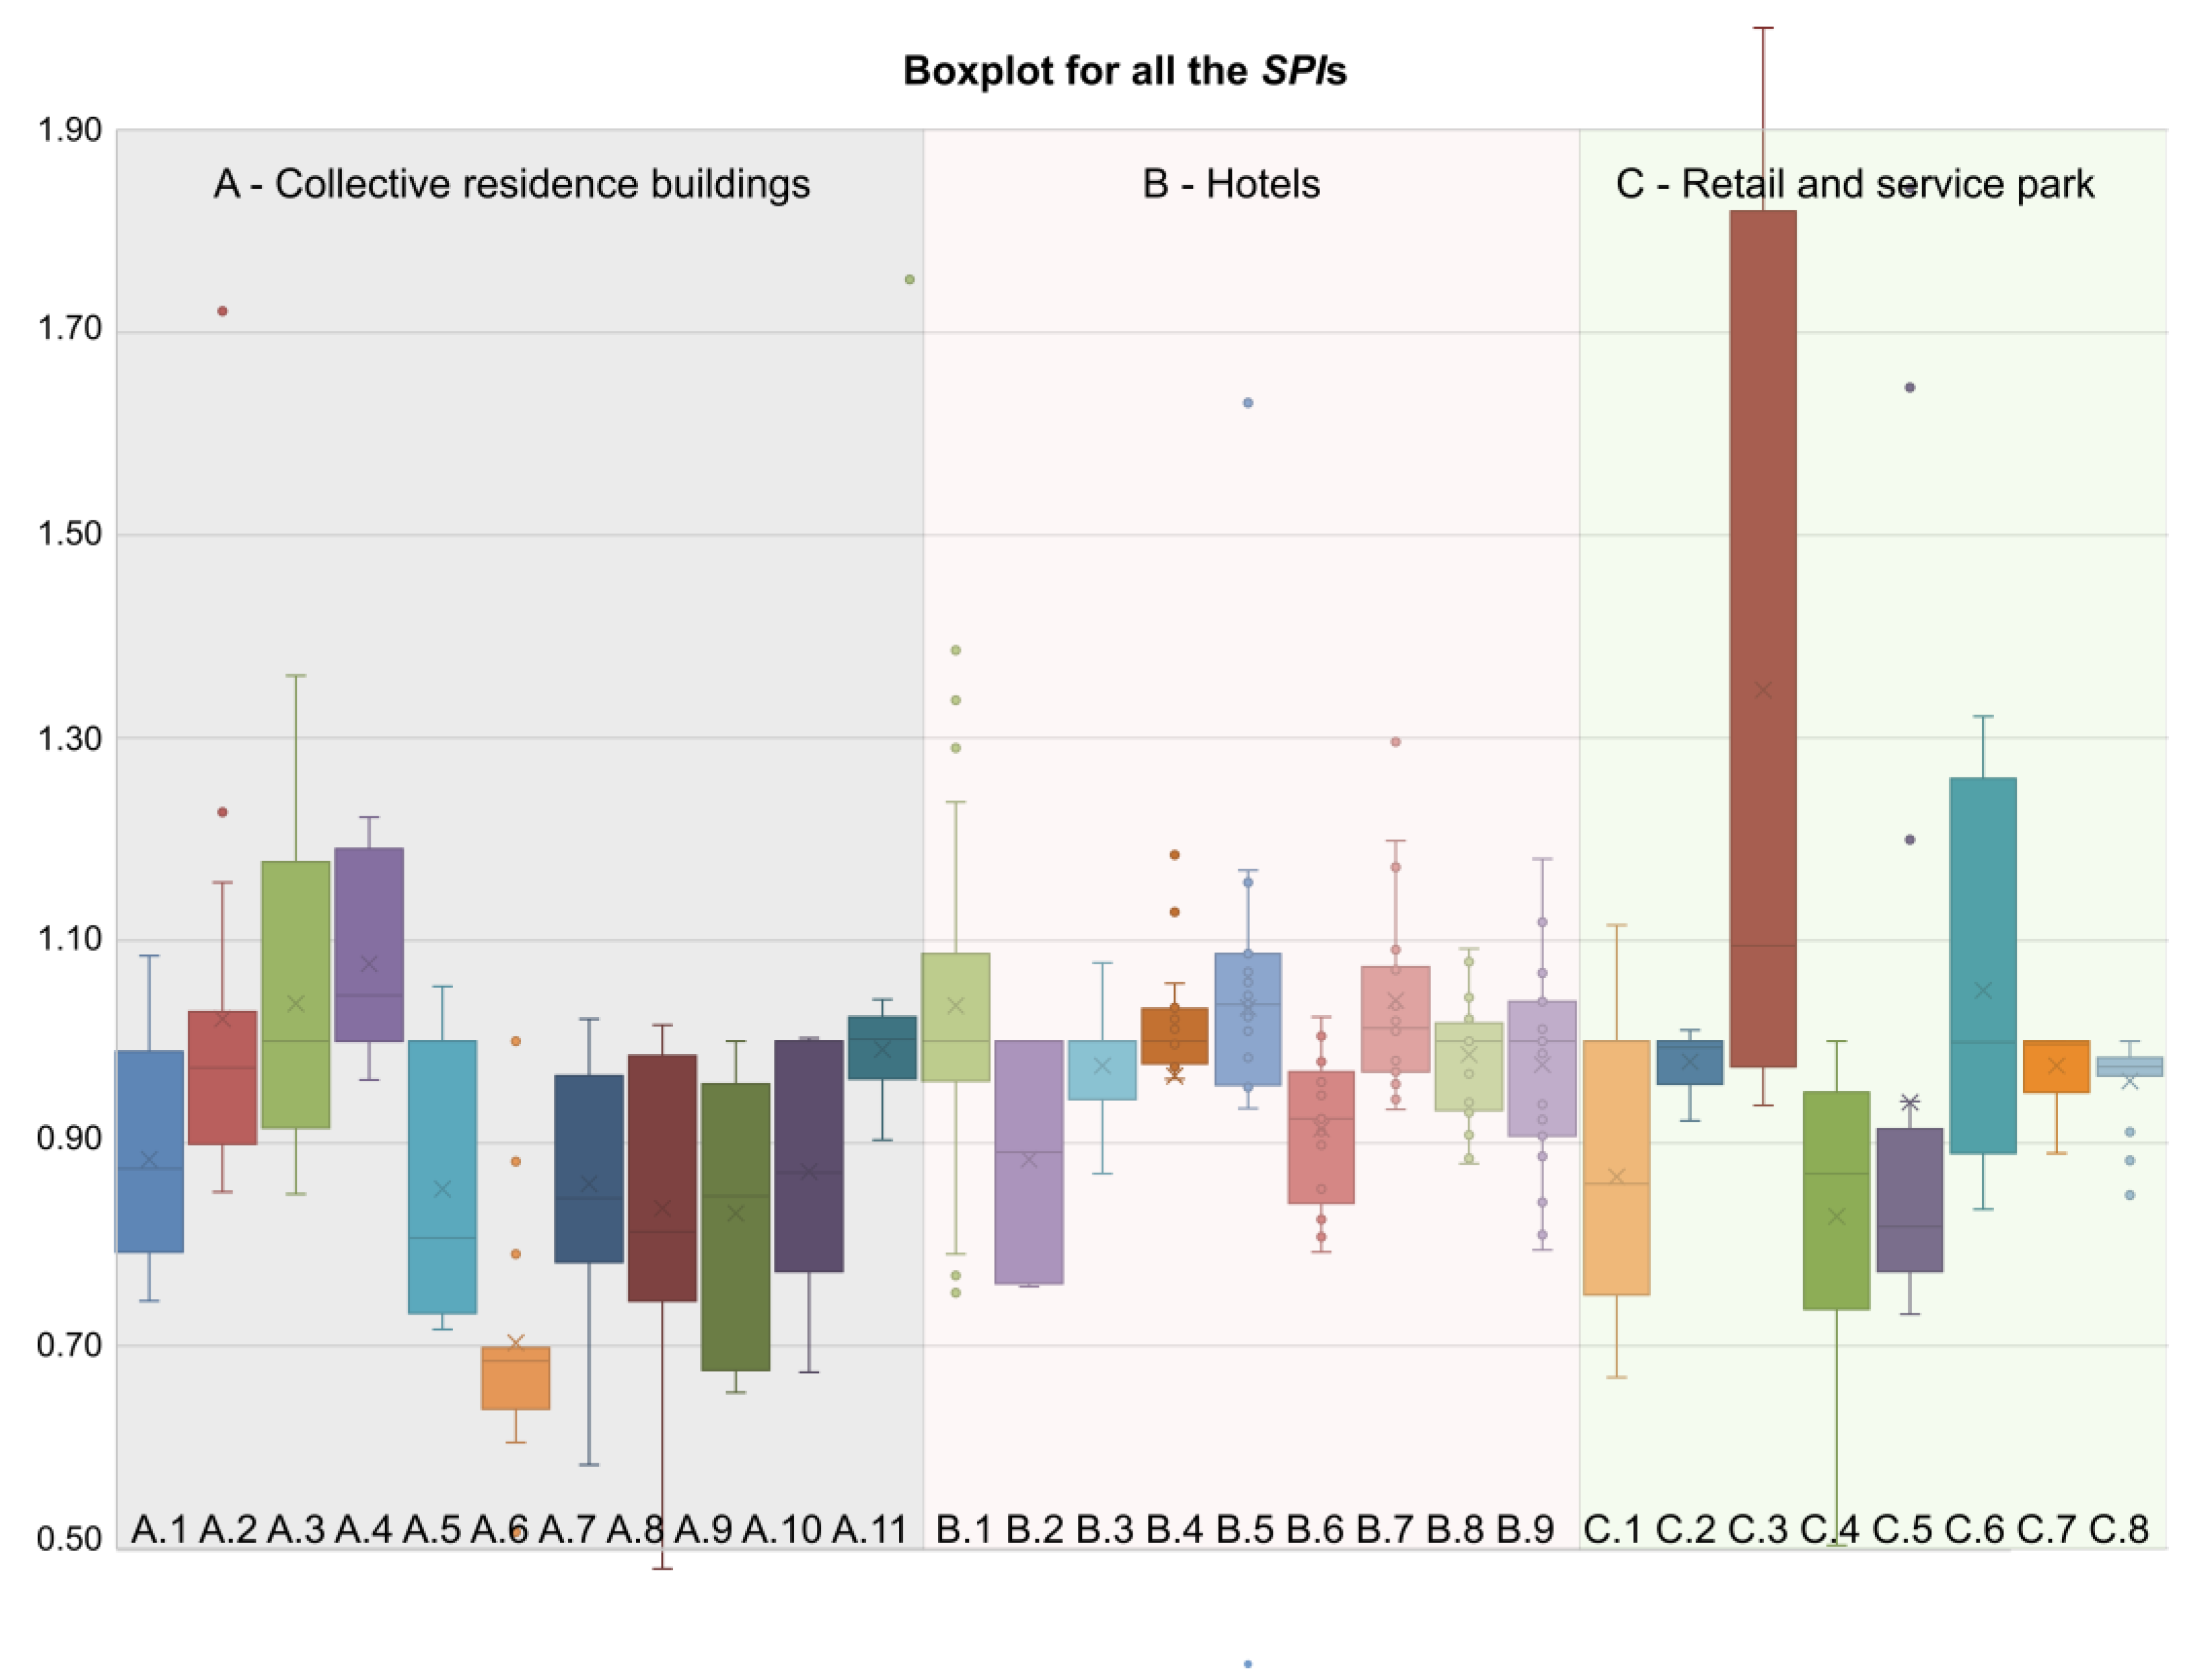
After carrying out calculations in accordance with the proposed research methodology, Figure 5 and Figure 6 show the results obtained for all the analyzed construction investments, which were divided into three research groups.
The analysis of the use of the schedule performance index confirms that the estimated duration stabilizes in the second period, i.e., after about half of the planned time, as shown in Figure 6. The scope of the obtained deviations from the schedule indexes is within an area that is limited from the top and bottom by the power curve trend line.
The planned duration was exceeded in 86% of cases, i.e., in 24 out of 28 of the analyzed investments.
3.3. Simultaneous Assessment of Schedule and Cost Performance Indexes with Regards to Time
Table 3 presents summarized data regarding completed investments in terms of their cost and schedule.
In order to compare the final data (i.e., actual time and actual cost) of the analyzed construction investments, Table 4 shows the obtained estimated schedule and cost performance indexes, which were determined for the planned completion date of the investment according to the baseline schedule, i.e., for the planned time.
The cost and schedule performance indexes that were estimated for the date of the planned completion of the investment did not always correctly describe the actual situation of the analyzed construction investments.
Investments (A.6, A.9, C.1) having the cost performance index CPI < 1 obviously exceeded their budget. In turn, a few projects for which the cost performance index correctly exceeded the value of 1 were also completed with the exceeded budget (e.g., A.11, B.1, B.4-B.9).
Significantly more accurate results were obtained for the schedule performance index. For all the construction investments, except for investment C.6, the estimated index was <1. These investments were completed in a longer time than was planned.
4. Discussion
The Earned Value Method is accessible and provides a relatively accurate assessment of the problem [62]. However, some inaccuracies and problems with its practical use can be noted. An important problem is the quality of the obtained work and expenditure data from the construction site. The method is very sensitive to the entered data. The most critical points of the analyses include the way of classifying costs, in addition to the schedule modifications due to random situations that occur on the construction site [62]. Additional problems that arise during the practical application of the Earned Value Method are, among others, difficulty in the correct and real determination of the percentage progress of the work performed (especially for tasks that were started but not completed at the time of the control), or incomplete data on the actual costs incurred on the day of the inspection. The indicated irregularities may lead to erroneous interpretations of the obtained indexes, and incorrect conclusions about the effects of deviations that are based on these indexes (including the estimated deadlines and costs of the project) [63,64].
As emphasized by the conducted research, the estimated cost and duration are very sensitive to the data that are used in the analysis. In order to obtain the most reliable and realistic estimate of the cost and duration of an investment, analyses should be carried out according to the actual progress of the project. The estimated actual costs and duration are not reliable in the first period of the project, and only stabilize in its second period [65]. In addition, all indexes are calculated in monetary units, including the deviation from the schedule, which makes it difficult to analyze and evaluate the results. If the implementation of the project exceeds the assumed deadline, the method is incorrect and indicates that the project was implemented in accordance with the plan. Moreover, factors influencing the results that were obtained with the use of the method are instability in the construction market and macroeconomic indicators, e.g., inflation, recession, index of material prices and labor costs [66].
The above difficulties have influenced the development of alternative methods that are based on the assumptions of the EVM, which in turn allow for a more reliable forecasting of the total cost and the final end date of projects. This can be done, for example, by estimating the budgeted cost and remaining project duration using an approach based on the division of construction works [67], the use of statistical methods to determine the earned value [68,69], the use of calculus within fuzzy sets [70,71,72], or the use of hybrid artificial intelligence [73].
5. Conclusions
On the basis of the conducted analyses and research, the following detailed conclusions were drawn regarding the three analyzed groups of investment tasks (collective housing, hotels, and retail and service facilities):
- In the case of collective housing buildings (0.2 < t < 0.6; where t is the total duration of the project), the greatest progress was observed in the initial months of their construction. In the third month, there was 20–30% more work performed than was assumed in the case of approx. 40% of investment tasks, and from the 4th month there was a noticeable downward trend in all the curves of the indexes. In almost 50% of the assessed investments, there were negative deviations from the SV schedule, which indicate a delay in works. During one-sixth of the analyzed implementations, the work and expenditure schedules were updated in order to reflect the actual state of affairs.
- There was a very large convergence in cost and time deviation curves in the case of retail and service facilities, and therefore a budget loss of up to 5% over the entire implementation period can be assumed. In the course of implementation, between one-third and one-half of the time, savings of up to 25% can occur. Schedule deviations range from 10% (ahead of schedule) to approx. 30% (delays in the schedule).
- A share of 50% of housing facilities did not exceed their planned budget and completion time, or exceeded it minimally. The remaining 50% exceeded the costs by approx. PLN 2 million, and had delays with regards to implementing the assumed plan, which resulted in losses of approx. PLN 10 million.
- The cost deviation diagrams in all the analyzed groups of facilities show that in the first two quarters of the project duration, the costs were in line with the planned budget in approx. 90% of the analyzed investments. Only in 1/13 of the analyzed investment tasks were the costs significantly lower than assumed. The largest deviations occurred in the third and fourth quarter, where the costs that were incurred in 3/13 tasks were below the investment budget; in the other 3/13, they exceeded this budget. The most financial losses occurred in the fourth quarter and oscillated between PLN 2 and 10 million. The largest number of investments (with a budget oscillating below the planned budget ) occurred in the third quarter, and their value ranged between PLN 1 and 42 million.
- The most time deviations occurred in the third and fourth quarters of all the analyzed groups of objects. Due to the overrunning of time, the analyzed construction investments resulted in delays mostly at the end of the project. Projects that were ahead of schedule from the start of works were below the investment budget, or were within the planned costs without major problems, despite the fact that they had a slight excess of budget in the second phase of the task.
- The above conclusions can be generalized and synthesized in the following form:
- There is a need for reliable verification of achieved values of EVM indexes due to their high sensitivity to entered data.
- The correctness of defining the causes of fluctuations allows for appropriate remedial actions to be taken when there is a risk of exceeding cost and time.
- On the basis of a few simple parameters (EV, PV, AC), and the resulting indexes (CPI, SPI, EAC, ETTC), the actual progress of construction projects can be quickly assessed.
- The analysis of contingency curves allows for the tracking of changes in costs and implementation time, and also for the estimation of the risk of exceeding them (the probability of implementing the project within the planned budget and implementation time).
- The analysis of CV cost deviation and SV time deviation indexes allows for the proper management of investment projects. The obtained values enable the work and expenditure schedule to be properly planned in order to correctly estimate the actual costs and the deadline of investments.
- Exceeding the threshold of 0.7 of the CV index results in a high probability of exceeding the budget. It is similar in the case of the SV index—schedule deviations. However, both of these statements require confirmation using a larger number of studied cases.
- the conducted analyses for three groups of objects show a great similarity in the obtained parameters and indexes. Research indicates that the problem of exceeding the planned budget, and failure to meet the planned deadlines, is common, regardless of the type of investment.
It should be remembered that the analyses and research presented in the article do not constitute a statistically selected research sample, but instead are rather individual research observations. Therefore, the conclusions presented above are not universal for all construction sectors.
Funding
This research received no external funding.
Institutional Review Board Statement
Not applicable.
Informed Consent Statement
Not applicable.
Data Availability Statement
Not applicable.
Conflicts of Interest
The author declares no conflict of interest.
References
- IPMA. IPMA Individual Competence Baseline; IPMA: Amsterdam, The Netherlands, 2015. [Google Scholar]
- Project Management Institute. A Guide to the Project Management Body of Knowledge (PMBOK Guide), 6th ed.; Project Management Institute (PMI): Newtown Square, PA, USA, 2017; ISBN 9781935589679. [Google Scholar]
- Kern, A.; Formoso, C. A model for integrating cost management and production planning and control in construction. J. Financ. Manag. Prop. Constr. 2006, 11, 75–90. [Google Scholar] [CrossRef]
- Hoła, B.; Sawicki, M.; Skibniewski, M. An IT model of a Knowledge Map which supports management in small and medium-sized companies using selected Polish construction enterprises as an example. J. Civ. Eng. Manag. 2015, 21, 1014–1026. [Google Scholar] [CrossRef]
- Mingus, N. Project Management; Alpha Publishing: Dubai, United Arab Emirates, 2001; ISBN 0028642236. [Google Scholar]
- Kerzner, H. Project Management: A Systems Approach to Planning, Scheduling, and Controlling; John Wiley & Sons, Inc.: New York, NY, USA, 2003. [Google Scholar]
- Makesh, S.; Mathivanan, M. Analysis on causes of delay in building construction. Int. J. Innov. Technol. Explor. Eng. 2019, 8, 335–341. [Google Scholar]
- Rachid, Z.; Toufik, B.; Mohammed, B. Causes of schedule delays in construction projects in Algeria. Int. J. Constr. Manag. 2019, 19, 371–381. [Google Scholar] [CrossRef]
- Kowalski, J.; Połoński, M.; Lendo-Siwicka, M.; Trach, R.; Wrzesiński, G. Method of assessing the risk of implementing railway investments in terms of the cost of their implementation. Sustainability 2021, 13, 13085. [Google Scholar] [CrossRef]
- Połoński, M. Management of Construction Investment Process; Wydawnictwo SGGW: Warszawa, Poland, 2018; ISBN 9788375830873. (In Polish) [Google Scholar]
- Miguel, A.; Madria, W.; Polancor, R. Project management model: Integrating Earned Schedule, quality, and risk in Earned Value Management. In Proceedings of the 6th IEEE International Conference on Industrial Engineering and Applications (ICIEA), Waseda, Tokyo, 12–15 April 2019; pp. 622–628. [Google Scholar]
- Guan, X.; Servranckx, T.; Vanhoucke, M. An analytical model for budget allocation in risk prevention and risk protection. Comput. Ind. Eng. 2021, 161, 107657. [Google Scholar] [CrossRef]
- Starczyk-Kołbyk, A.; Kruszka, L. Use of the EVM method for analysis of extending the construction project duration as a result of realization disturbances—Case study. Arch. Civ. Eng. 2021, 67, 373–393. [Google Scholar]
- Duarte-Vidal, l.; Herrera, R.; Atencio, E. Muñoz-La Rivera F. Interoperability of digital tools for the monitoring and control of construction projects. Appl. Sci. 2021, 11, 10370. [Google Scholar] [CrossRef]
- Wieczorek, D. Monitoring of Projects Costs Using Earned Value; Papers and Reports of the Faculty of Management of Gdansk University; Gdansk University: Sopot, Poland, 2006; Volume 1, pp. 551–560. (In Polish) [Google Scholar]
- Połoński, M. Kontrola kosztów realizacji obiektu budowlanego metodą Earned Value. In Inżynieria Przedsięwzięć Budowlanych: Rekomendowane Metody i Techniki; SGGW: Warszawa, Poland, 2015; Volume 1, pp. 23–46. (In Polish) [Google Scholar]
- Anysz, H.; Zawistowski, J. Cost-time control of the progress of construction works using the earned value method using MS Project (in Polish: Kontrola kosztowo-czasowa postępu robót budowlanych metodą wartości wypracowanej z wykorzystaniem programu MS Project). In Principles and Standards of Cost Estimation of Construction Works for Awarding Entities, Investors and Contractors (in Polish: Zasady i Standardy Kosztorysowania Robót Budowlanych Dla Zamawiających, Inwestorów i Wykonawców); Stowarzyszenie Kosztorysantów Budowlanych: Warsaw, Poland, 2017; pp. 71–88. [Google Scholar]
- Leśniak, A.; Kubek, D.; Plebankiewicz, E.; Zima, K.; Belniak, S. Fuzzy AHP Application for Supporting Contractors’ Bidding Decision. Symmetry 2018, 10, 642. [Google Scholar] [CrossRef]
- Jaśkowski, P.; Biruk, S.; Krzemiński, M. Planning repetitive construction processes to improve robustness of schedules in risk environment. Arch. Civ. Eng. 2020, 66, 643–657. [Google Scholar]
- Konior, J. Enterprise’s risk assessment of complex construction projects. Arch. Civ. Eng. 2015, 61, 63–74. [Google Scholar] [CrossRef]
- Lo, W.; Chen, Y. Optimization of Contractor’s S-Curve. In Proceedings of the 24th International Symposium on Automation & Robotics in Construction (ISARC 2007), Kochi, India, 19–21 September 2007; pp. 417–420. [Google Scholar]
- Leśniak, A.; Zima, K. Cost calculation of construction projects including sustainability factors using the case based reasoning (CBR) method. Sustainability 2018, 10, 1608. [Google Scholar] [CrossRef]
- Al-Jibouri, S. Monitoring systems and their effectiveness for project cost control in construction. Int. J. Proj. Manag. 2003, 21, 145–154. [Google Scholar] [CrossRef]
- Love, P.; Wang, X.; Sing, C.; Tiong, R. Determining the probability of project cost overruns. J. Constr. Eng. Manag. 2013, 139, 321–330. [Google Scholar] [CrossRef]
- De Marco, A.; Narbaev, T. Earned value-based performance monitoring of facility construction projects. J. Facil. Manag. 2013, 11, 69–80. [Google Scholar] [CrossRef]
- Abba, W. How earned value got to primetime: A short look back and glance ahead. In Project Management Institute Annual Seminars & Symposium; Project Management Institute (PMI): Houston, TX, USA, 2000. [Google Scholar]
- Zohoori, B.; Verbraeck, A.; Bagherpour, M.; Khakdaman, M. Monitoring production time and cost performance by combining earned value analysis and adaptive fuzzy control. Comput. Ind. Eng. 2019, 127, 805–821. [Google Scholar] [CrossRef]
- Chen, H.; Chen, W.; Lin, Y. Earned value project management: Improving the predictive power of planned value. Int. J. Proj. Manag. 2016, 34, 22–29. [Google Scholar] [CrossRef]
- Konior, J.; Szóstak, M. Methodology of planning the course of the cumulative cost curve in construction projects. Sustainability 2020, 12, 2347. [Google Scholar] [CrossRef]
- Waris, M.; Khamidi, M.; Idrus, A. The cost monitoring of construction projects through Earned Value Analysis. J. Constr. Eng. Proj. Manag. 2012, 2, 42–45. [Google Scholar]
- Bhosekar, M.; Vyas, G. Cost controlling using Earned Value Analysis in construction industries. Int. J. Eng. Innov. Technol. 2012, 1, 324–332. [Google Scholar]
- Khamidi, M.; Khan, W.; Idrus, A. The Cost Monitoring of Construction Projects Through Earned Value Analysis. In Proceedings of the International Conference on Economics and Finance Research (ICEFR 2011), Singapore, 26–28 February 2011; pp. 129–133. [Google Scholar]
- Klinowski, M. Analysis of the Current and Forecast of the Future Realization of the Project on the Basis of Earned Value Method; Research Papers of Wrocław University of Economics; Wrocław University of Economics: Wrocław, Poland, 2014; Volume 335, pp. 105–115. (In Polish) [Google Scholar]
- Sruthi, M.; Aravindan, A. Performance measurement of schedule and cost analysis by using earned value management for a residential building. Mater. Today Proc. 2020, 33, 524–532. [Google Scholar] [CrossRef]
- Chin-Keng, T.; Shahdan, N. The Application of Earned Value Management (EVM) in Construction Project Management. J. Technol. Manag. Bus. 2015, 2, 235–261. [Google Scholar]
- Vandevoorde, S.; Vanhoucke, M. A comparison of different project duration forecasting methods using earned value metrics. Int. J. Proj. Manag. 2006, 24, 289–302. [Google Scholar] [CrossRef]
- Kwon, O.; Kim, S.; Paek, J.; Eom, S. Application of Earned Value in the Korean Construction Industry. J. Asian Archit. Build. Eng. 2008, 7, 69–76. [Google Scholar] [CrossRef]
- Priyo, M. Earned Value Management System in Indonesian Construction Projects. Int. J. Integr. Eng. 2021, 13, 37–45. [Google Scholar] [CrossRef]
- Khamidi, M.; Ali, W.; Idrus, A. Application of Earned Value Management System on an Infrastructure Project: A Malaysian Case Study. Int. Conf. Manag. Sci. Eng. 2011, 8, 1–5. [Google Scholar]
- Połoński, M.; Komendarek, P. Earned value method for operational cost control of civil structure. Metody Ilościowe w Badaniach Ekonomicznych 2011, 12, 279–290. [Google Scholar]
- Przywara, D.; Rak, A. Monitoring of time and cost variances of schedule using simple Earned Value Method indicators. Appl. Sci. 2021, 11, 1357. [Google Scholar] [CrossRef]
- Czemplik, A. Application of earned value method to progress control of construction projects. Procedia Eng. 2014, 91, 424–428. [Google Scholar] [CrossRef]
- Wauters, M.; Vanhoucke, M. Study of the Stability of Earned Value Management Forecasting. J. Constr. Eng. Manag. 2014, 141, 04014086. [Google Scholar] [CrossRef]
- Babar, S.; Thaheem, M.; Ayub, B. Estimated Cost at Completion: Integrating Risk into Earned Value Management. J. Constr. Eng. Manag. 2016, 143, 04016104. [Google Scholar] [CrossRef]
- Przywara, D.; Rak, A. The time-cost analysis of schedule monitoring using the earned value method. Tech. Trans. 2017, 5, 57–66. [Google Scholar]
- Almeida, R.; Abrantes, R.; Romão, M.; Proença, I. The Impact of Uncertainty in the Measurement of Progress in Earned Value Analysis. Procedia Comput. Sci. 2021, 181, 457–467. [Google Scholar] [CrossRef]
- Starczyk-Kołbyk, A. Randomizowana Metoda Identyfikacji Stanu Zaawansowania Robót i Korekty Planu Budowy. Ph.D. Thesis, Wojskowa Akademia Techniczna, Warszawa, Poland, 2019. [Google Scholar]
- Kasprowicz, T.; Starczyk-Kołbyk, A.; Wójcik, R. The randomized method of estimating the net present value of construction projects efficiency. Int. J. Constr. Manag. 2022. [Google Scholar] [CrossRef]
- Dziadosz, A. Zmodyfikowana Metoda Kontroli Stanu Zaawansowania Robót i Oceny Ryzyka Realizacji Przedsięwzięcia Budowlanego. Ph.D. Thesis, Politechnika Poznańska, Poznań, Poland, 2017. [Google Scholar]
- Khamooshi, H.; Golafshani, H. EDM: Earned Duration Management, a New Approach to Schedule Performance Management and Measurement. Int. J. Proj. Manag. 2014, 32, 1019–1041. [Google Scholar] [CrossRef]
- de Andrade, P.; Martens, A.; Vanhoucke, M. Using real project schedule data to compare earned schedule and earned duration management project time forecasting capabilities. Autom. Constr. 2019, 99, 68–78. [Google Scholar] [CrossRef]
- Ballesteros-Pérez, P.; Sanz-Ablanedo, E.; Mora-Melià, D.; González-Cruz, M.; Fuentes-Bargues, J.; Pellicer, E. Earned Schedule min-max: Two new EVM metrics for monitoring and controlling projects. Autom. Constr. 2019, 103, 279–290. [Google Scholar] [CrossRef]
- Martens, A.; Vanhoucke, M. Integrating corrective actions in project time forecasting using exponential smoothing. J. Manag. Eng. Vol. 2020, 36, 423–471. [Google Scholar] [CrossRef]
- Vanhoucke, M.; Vandevoorde, S. A simulation and evaluation of earned value metrics to forecast the project duration. J. Oper. Res. Soc. 2007, 58, 1361–1374. [Google Scholar] [CrossRef]
- Khodabandehlou, A.; Parvishi, A.; Taghifam, R.; Lofti, M.; Taleii, A. Integrating Earned Value Management with risk management to control the time-cost of the project. Bus. Eng. 2017, 7, 114–119. [Google Scholar]
- Sackey, S.; Lee, D.; Kim, B. Duration Estimate at Completion: Improving Earned Value Management Forecasting Accuracy. J. Civ. Eng. 2020, 24, 693–702. [Google Scholar] [CrossRef]
- Ballesteros-Pérez, P.; Elamrousy, L. On the Limitations of the Earned Value Management Technique to Anticipate Project Delays; Abdul-Malak, M., Khoury, H., Singh, A., Yazdani, S., Eds.; Responsible Design and Delivery of the Constructed Project; ISEC Press: Fargo, North Dakota, 2018; ISBN 978-0-9960437-5-5. [Google Scholar]
- Ballesteros-Pérez, P.; Sanz-Ablanedo, E.; Soetanto, R.; González-Cruz, M.; Larsen, G.; Cerezo-Narváez, A. Duration and cost variability of construction activities: An empirical study. J. Constr. Eng. Manag. 2000, 146, 04019093. [Google Scholar] [CrossRef]
- Konior, J. Monitoring of construction projects feasibility by Bank Investment Supervision approach. Civ. Eng. Archit. 2019, 7, 31–35. [Google Scholar] [CrossRef]
- Konior, J.; Szóstak, M. The S-curve as a tool for planning and controlling of construction process-case study. Appl. Sci. 2020, 10, 2071. [Google Scholar] [CrossRef]
- Szóstak, M. Planning the time and cost of implementing construction projects using an example of residential buildings. Arch. Civ. Eng. 2021, 67, 243–259. [Google Scholar]
- Dziadosz, A.; Kapliński, O.; Rejment, M. Usefulness and fields of the application of the Earned Value Management in the implementation of construction projects. Bud. Archit. 2014, 13, 357–364. [Google Scholar] [CrossRef]
- Czarnigowska, A. Earned value method as a tool for project control. Bud. Archit. 2008, 3, 15–32. [Google Scholar] [CrossRef]
- Czarnigowska, A. Monitoring of project progress using the Earned Value. Przegląd Bud. 2009, 80, 50–55. [Google Scholar]
- Ziółkowska, A.; Połoński, M. Application of the EVM method and its extensions in the implementation of construction objects. Eng. Struct. Technol. 2015, 7, 189–196. [Google Scholar] [CrossRef]
- Bagherpour, M.; Khaje Zadeh, M.; Mahmoudi, A.; Deng, X. Interpretive structural modeling in Earned Value Management. J. Civ. Eng. Manag. 2020, 26, 524–533. [Google Scholar] [CrossRef]
- Howes, R. Improving the performance of Earned Value Analysis as a construction project management tool. Eng. Constr. Archit. Manag. 2000, 7, 399–411. [Google Scholar] [CrossRef]
- Lipke, W.; Zwikael, O.; Henderson, K.; Anbari, A. Prediction of project outcome. The application of statistical methods to earned value management and earned schedule performance indexes. Int. J. Proj. Manag. 2009, 27, 400–407. [Google Scholar] [CrossRef]
- Chen, Z.; Demeulemeester, R.; Bai, S.; Guo, Y. A Bayesian approach to set the tolerance limits for a statistical project control method. Int. J. Prod. Res. 2020, 58, 3150–3163. [Google Scholar] [CrossRef]
- Salari, M.; Bagherpour, M.; Reihani, M. A time-cost trade-off model by incorporating fuzzy earned value management: A statistical based approach. J. Intell. Fuzzy Syst. 2015, 28, 1909–1919. [Google Scholar] [CrossRef]
- Salari, M.; Khamooshi, H. A better project performance prediction model using fuzzy time series and data envelopment analysis. J. Oper. Res. Soc. 2016, 67, 1274–1287. [Google Scholar] [CrossRef]
- Hajali-Mohamad, M.; Mosavi, M.; Shahanaghi, L. Optimal estimating the project completion time and diagnosing the fault in the project. Dyna Rev. Fac. Nac. Minas 2016, 83, 121–127. [Google Scholar] [CrossRef]
- Yaseen, Z.; Ali, Z.; Salih, S.; Al-Ansari, N. Prediction of risk delay in construction projects using a hybrid artificial intelligence model. Sustainability 2020, 12, 1514. [Google Scholar] [CrossRef]
Figure 1.
Basic indicators of the Earned Value Method.

Figure 2.
The graphical interpretation of the boxplot.

Figure 3.
Boxplot of the cost performance index for the analyzed construction projects. “×”—median (Me), circles—single measurement.
Figure 3.
Boxplot of the cost performance index for the analyzed construction projects. “×”—median (Me), circles—single measurement.

Figure 4.
Cost performance index over time for the analyzed construction projects.

Figure 5.
Boxplot of the schedule performance index for the analyzed construction investments. “×”—median (Me), circles—single measurement.
Figure 5.
Boxplot of the schedule performance index for the analyzed construction investments. “×”—median (Me), circles—single measurement.

Figure 6.
Schedule performance index with regards to time for the analyzed construction investments.
Figure 6.
Schedule performance index with regards to time for the analyzed construction investments.


Table 1.
Summary of the number of cumulative cos measurements in the BIS reports.
| Construction Group/Sector | Amount | Measurement Period | PR | MR | FR |
|---|---|---|---|---|---|
| A. Collective residential buildings | 14 | 2006–2020 | 14 | 169 | 6 |
| B. Office buildings | 4 | 2008–2020 | 4 | 55 | |
| C. Hotels | 9 | 2013–2020 | 9 | 93 | 8 |
| D. Retail and service parks | 8 | 2008–2018 | 8 | 97 | 8 |
| E. Logistics centers | 2 | 2017–2020 | 2 | 8 | 2 |
| F. Health centers | 1 | 2011–2012 | 1 | 10 | 1 |
| G. Airports | 1 | 2011–2015 | 1 | 35 | |
| H. Industrial plants | 1 | 2018–2019 | 1 | 4 | 1 |
| Total number of PR—MR—FR reports | 40 | 471 | 26 | ||
| Total number of all reports | 536 | ||||
Table 2.
Interpretation of the Earned Value Method indexes.
| Cost Performance Index (CPIj) | ||||
| CPIj < 1 | CPIj = 1 | CPIj > 1 | ||
| Schedule performance index (SPIj) | SPIj < 1 |
Budget overrun (−) Schedule delay (−) | Compliance with the budget (0) Schedule delay (−) | Budget savings (+) Schedule delay (−) |
| SPIj = 1 | Budget overrun (−) Compliance with the schedule (0) | Compliance with the budget (0) Compliance with the schedule (0) | Budget savings (+) Compliance with the schedule (0) | |
| SPIj > 1 | Budget overrun (−) Ahead of schedule (+) | Compliance with the budget (0) Ahead of schedule (+) | Budget savings (+) Ahead of schedule (+) | |
Table 3.
Data characterizing the analyzed investment projects.
| No | Investment Symbol | Scheduled Time | Actual Time | Actual Time/Scheduled Time | BCWS | ACWP | ACWP/BCWS |
|---|---|---|---|---|---|---|---|
| 1 | A.1 | 13 | 16 | 1.23 | 17,002,557.00 | 17,002,557.00 | 1.00 |
| 2 | A.2 | 14 | 16 | 1.14 | 12,580,200.00 | 12,580,200.00 | 1.00 |
| 3 | A.3 | 14 | 16 | 1.14 | 15,231,003.00 | 15,231,003.00 | 1.00 |
| 4 | A.4 | 7 | 8 | 1.14 | 1,093,948.99 | 1,093,949.02 | 1.00 |
| 5 | A.5 | 14 | 15 | 1.07 | 19,432,197.00 | 19,432,197.00 | 1.00 |
| 6 | A.6 | 13 | 15 | 1.15 | 14,389,720.00 | 14,684,668.35 | 1.02 |
| 7 | A.7 | 16 | 22 | 1.38 | 16,971,000.00 | 17,358,600.00 | 1.02 |
| 8 | A.8 | 18 | 18 | 1.00 | 8,517,838.00 | 8,517,838.00 | 1.00 |
| 9 | A.9 | 15 | 22 | 1.47 | 17,133,356.00 | 17,755,635.76 | 1.04 |
| 10 | A.10 | 17 | 22 | 1.29 | 9,846,580.14 | 9,882,087.53 | 1.00 |
| 11 | A.11 | 18 | 18 | 1.00 | 20,267,522.78 | 21,111,078.31 | 1.04 |
| 12 | B.1 | 22 | 34 | 1.55 | 42,313,695.00 | 58,646,384.15 | 1.39 |
| 13 | B.2 | 5 | 6 | 1.20 | 19,420,387.66 | 18,739,239.41 | 0.96 |
| 14 | B.3 | 15 | 17 | 1.13 | 14,670,506.00 | 15,811,877.84 | 1.08 |
| 15 | B.4 | 14 | 16 | 1.14 | 18,772,396.15 | 22,234,333.17 | 1.18 |
| 16 | B.5 | 13 | 16 | 1.23 | 19,397,717.04 | 22,687,867.32 | 1.17 |
| 17 | B.6 | 16 | 19 | 1.19 | 27,548,670.90 | 28,453,408.93 | 1.03 |
| 18 | B.7 | 19 | 19 | 1.00 | 48,739,724.74 | 50,467,311.37 | 1.04 |
| 19 | B.8 | 19 | 24 | 1.26 | 36,608,045.94 | 39,958,136.38 | 1.09 |
| 20 | B.9 | 27 | 27 | 1.00 | 42,023,393.72 | 42,549,046.61 | 1.01 |
| 21 | C.1 | 13 | 15 | 1.15 | 135,000,000.00 | 157,112,077.84 | 1.16 |
| 22 | C.2 | 10 | 13 | 1.30 | 65,000,000.00 | 65,000,000.00 | 1.00 |
| 23 | C.3 | 10 | 11 | 1.10 | 16,000,000.00 | 16,708,000.00 | 1.04 |
| 24 | C.4 | 20 | 24 | 1.20 | 186,518,999.02 | 184,491,999.00 | 0.99 |
| 25 | C.5 | 11 | 17 | 1.55 | 17,440,000.00 | 15,450,152.00 | 0.89 |
| 26 | C.6 | 6 | 6 | 1.00 | 1,230,000.00 | 1,079,890.40 | 0.88 |
| 27 | C.7 | 13 | 16 | 1.23 | 52,000,000.00 | 51,999,999.75 | 1.00 |
| 28 | C.8 | 17 | 19 | 1.12 | 39,409,285.00 | 35,880,604.91 | 0.91 |
Table 4.
Schedule and cost performance indexes for the planned completion date of the investment in accordance with the baseline schedule.
Table 4.
Schedule and cost performance indexes for the planned completion date of the investment in accordance with the baseline schedule.
| No | Investment Symbol | CPI | ACWP/BCWS | SPI | Actual Time/Scheduled Time |
|---|---|---|---|---|---|
| 1 | A.1 | 1.00 | 1.00 | 0.82 | 1.23 |
| 2 | A.2 | 1.00 | 1.00 | 0.90 | 1.14 |
| 3 | A.3 | 1.00 | 1.00 | 0.94 | 1.14 |
| 4 | A.4 | 1.00 | 1.00 | 0.96 | 1.14 |
| 5 | A.5 | 1.00 | 1.00 | 0.89 | 1.07 |
| 6 | A.6 | 0.98 | 1.02 | 0.79 | 1.15 |
| 7 | A.7 | 1.06 | 1.02 | 0.91 | 1.38 |
| 8 | A.8 | 1.00 | 1.00 | 1.00 | 1.00 |
| 9 | A.9 | 0.93 | 1.04 | 0.71 | 1.47 |
| 10 | A.10 | 1.00 | 1.00 | 0.87 | 1.29 |
| 11 | A.11 | 1.00 | 1.04 | 1.04 | 1.00 |
| 12 | B.1 | 1.00 | 1.39 | 0.75 | 1.55 |
| 13 | B.2 | 1.00 | 0.96 | 0.79 | 1.20 |
| 14 | B.3 | 1.05 | 1.08 | 1.03 | 1.13 |
| 15 | B.4 | 1.00 | 1.18 | 1.06 | 1.14 |
| 16 | B.5 | 1.00 | 1.17 | 1.06 | 1.23 |
| 17 | B.6 | 1.00 | 1.03 | 0.98 | 1.19 |
| 18 | B.7 | 1.00 | 1.04 | 1.04 | 1.00 |
| 19 | B.8 | 1.00 | 1.09 | 1.02 | 1.26 |
| 20 | B.9 | 1.00 | 1.01 | 1.01 | 1.00 |
| 21 | C.1 | 0.96 | 1.16 | 1.01 | 1.15 |
| 22 | C.2 | 1.11 | 1.00 | 0.98 | 1.30 |
| 23 | C.3 | 0.99 | 1.04 | 0.99 | 1.10 |
| 24 | C.4 | 1.00 | 0.99 | 0.98 | 1.20 |
| 25 | C.5 | 1.17 | 0.89 | 0.74 | 1.55 |
| 26 | C.6 | 1.03 | 0.88 | 0.91 | 1.00 |
| 27 | C.7 | 1.11 | 1.00 | 0.96 | 1.23 |
| 28 | C.8 | 1.06 | 0.91 | 0.85 | 1.12 |
Publisher’s Note: MDPI stays neutral with regard to jurisdictional claims in published maps and institutional affiliations. |
© 2022 by the author. Licensee MDPI, Basel, Switzerland. This article is an open access article distributed under the terms and conditions of the Creative Commons Attribution (CC BY) license (https://creativecommons.org/licenses/by/4.0/).
Share and Cite
MDPI and ACS Style
Konior, J. Determining Cost and Time Performance Indexes for Diversified Investment Tasks. Buildings 2022, 12, 1198. https://doi.org/10.3390/buildings12081198
AMA Style
Konior J. Determining Cost and Time Performance Indexes for Diversified Investment Tasks. Buildings. 2022; 12(8):1198. https://doi.org/10.3390/buildings12081198
Chicago/Turabian StyleKonior, Jarosław. 2022. "Determining Cost and Time Performance Indexes for Diversified Investment Tasks" Buildings 12, no. 8: 1198. https://doi.org/10.3390/buildings12081198
Note that from the first issue of 2016, this journal uses article numbers instead of page numbers. See further details here.