1. Introduction
The traditional structural design is based on the concept of providing sufficient rigidity to the structures against earthquake loads by using shear walls, frames, and/or frames reinforced with steel braces. However, those methods may lead to large shear forces and accelerations in rigid structures and large floor displacements in flexible structures. Therefore, the structural and non-structural elements might be severely damaged under major earthquakes [
1]. The transfer of horizontal and vertical loads affecting the buildings to their foundations is very important from the building safety perspective. The studies in the literature have shown that the earthquake performance of irregular buildings is poorer than that of regular buildings. Therefore, the seismic design codes propose that the design and construction of irregular buildings should be avoided due to their low seismic response to earthquakes [
2,
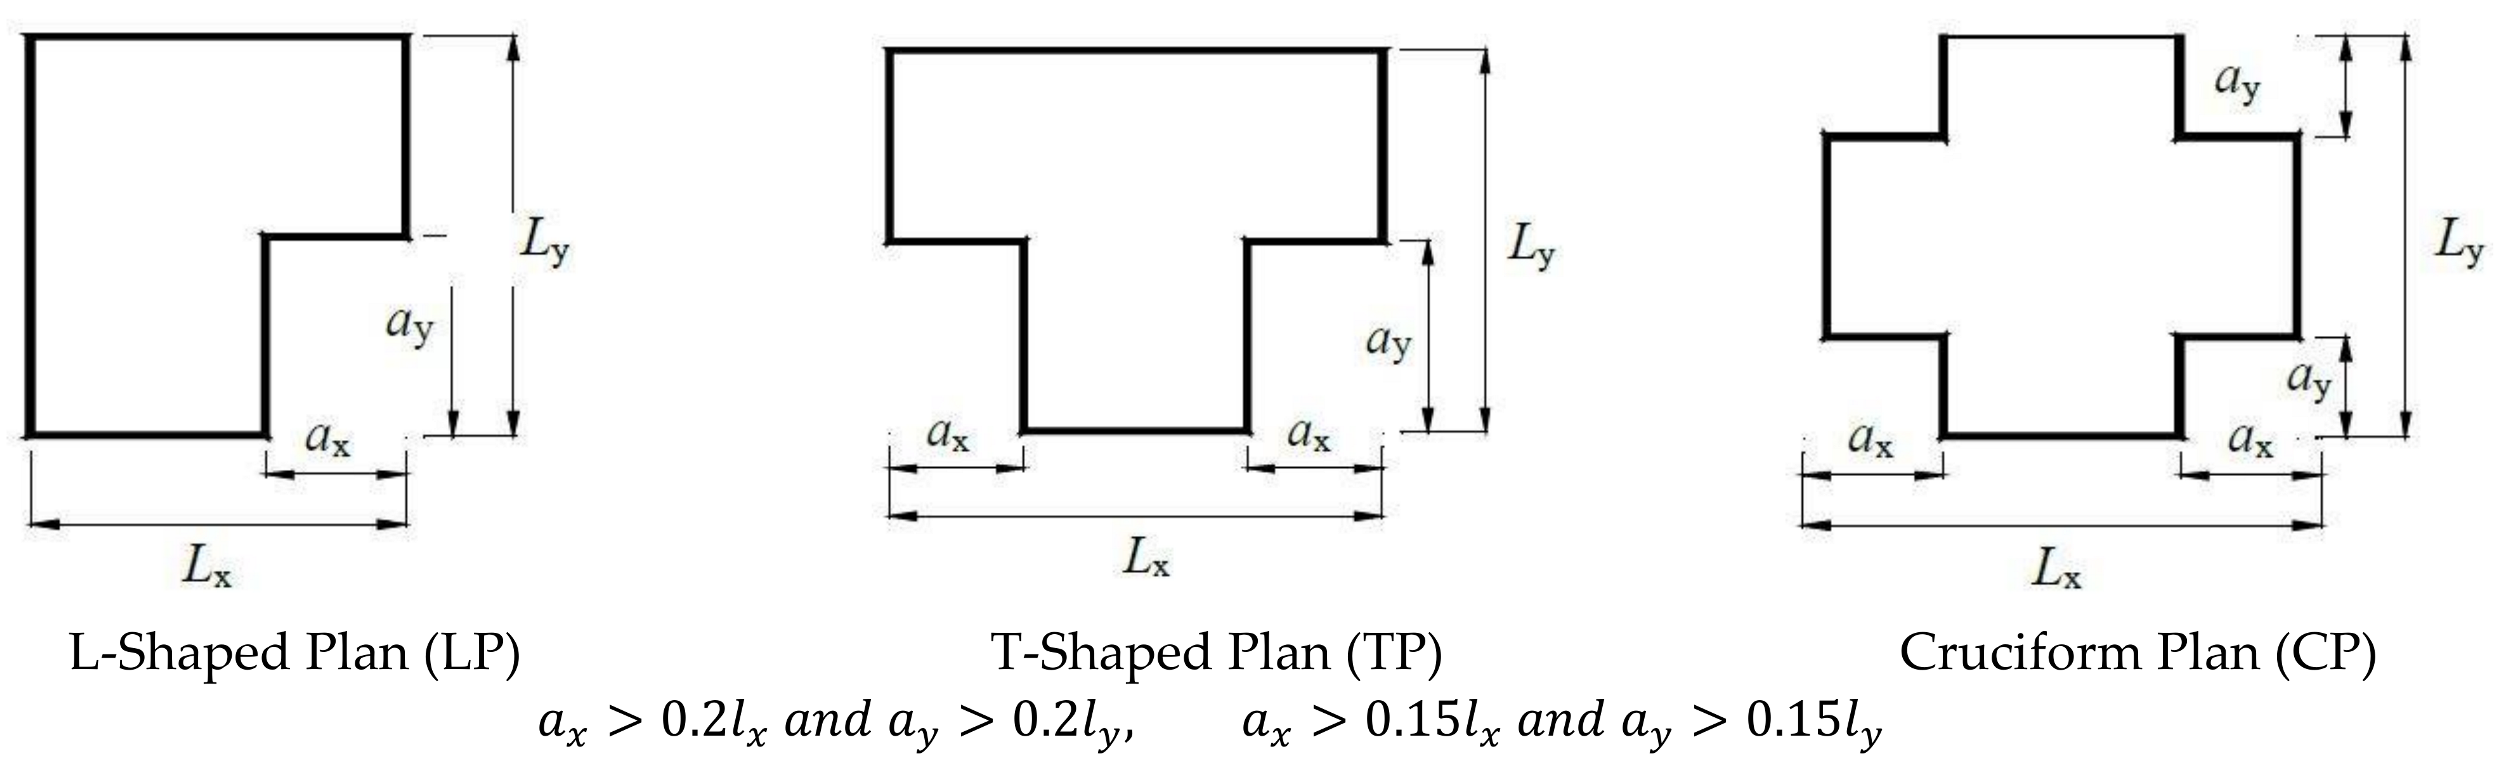
3]. One of these irregularities is re-entrant corner irregularity which is defined in design codes as both plan projections of the building beyond a re-entrant corner are greater than a predefined value (0.15 [
2] or 0.20 [
3]) of the plan dimension of the structure in the given direction (
Figure 1). Many reinforced concrete (RC) structures, designed especially for residential buildings occupancy class, include such irregularities due to architectural reasons or functional requirements. In those buildings, additional stresses occur at the locations where a change in geometry exists. Thus, larger shear forces and moments occur at the intersection of the main body and the projection in the structures with plan irregularities [
4]. In recent studies on irregularities in reinforced concrete structures, the determination of floor accelerations and displacements, as well as the determination of the performance of reinforced concrete structures and structural elements, has been the subject of investigation [
5,
6,
7].
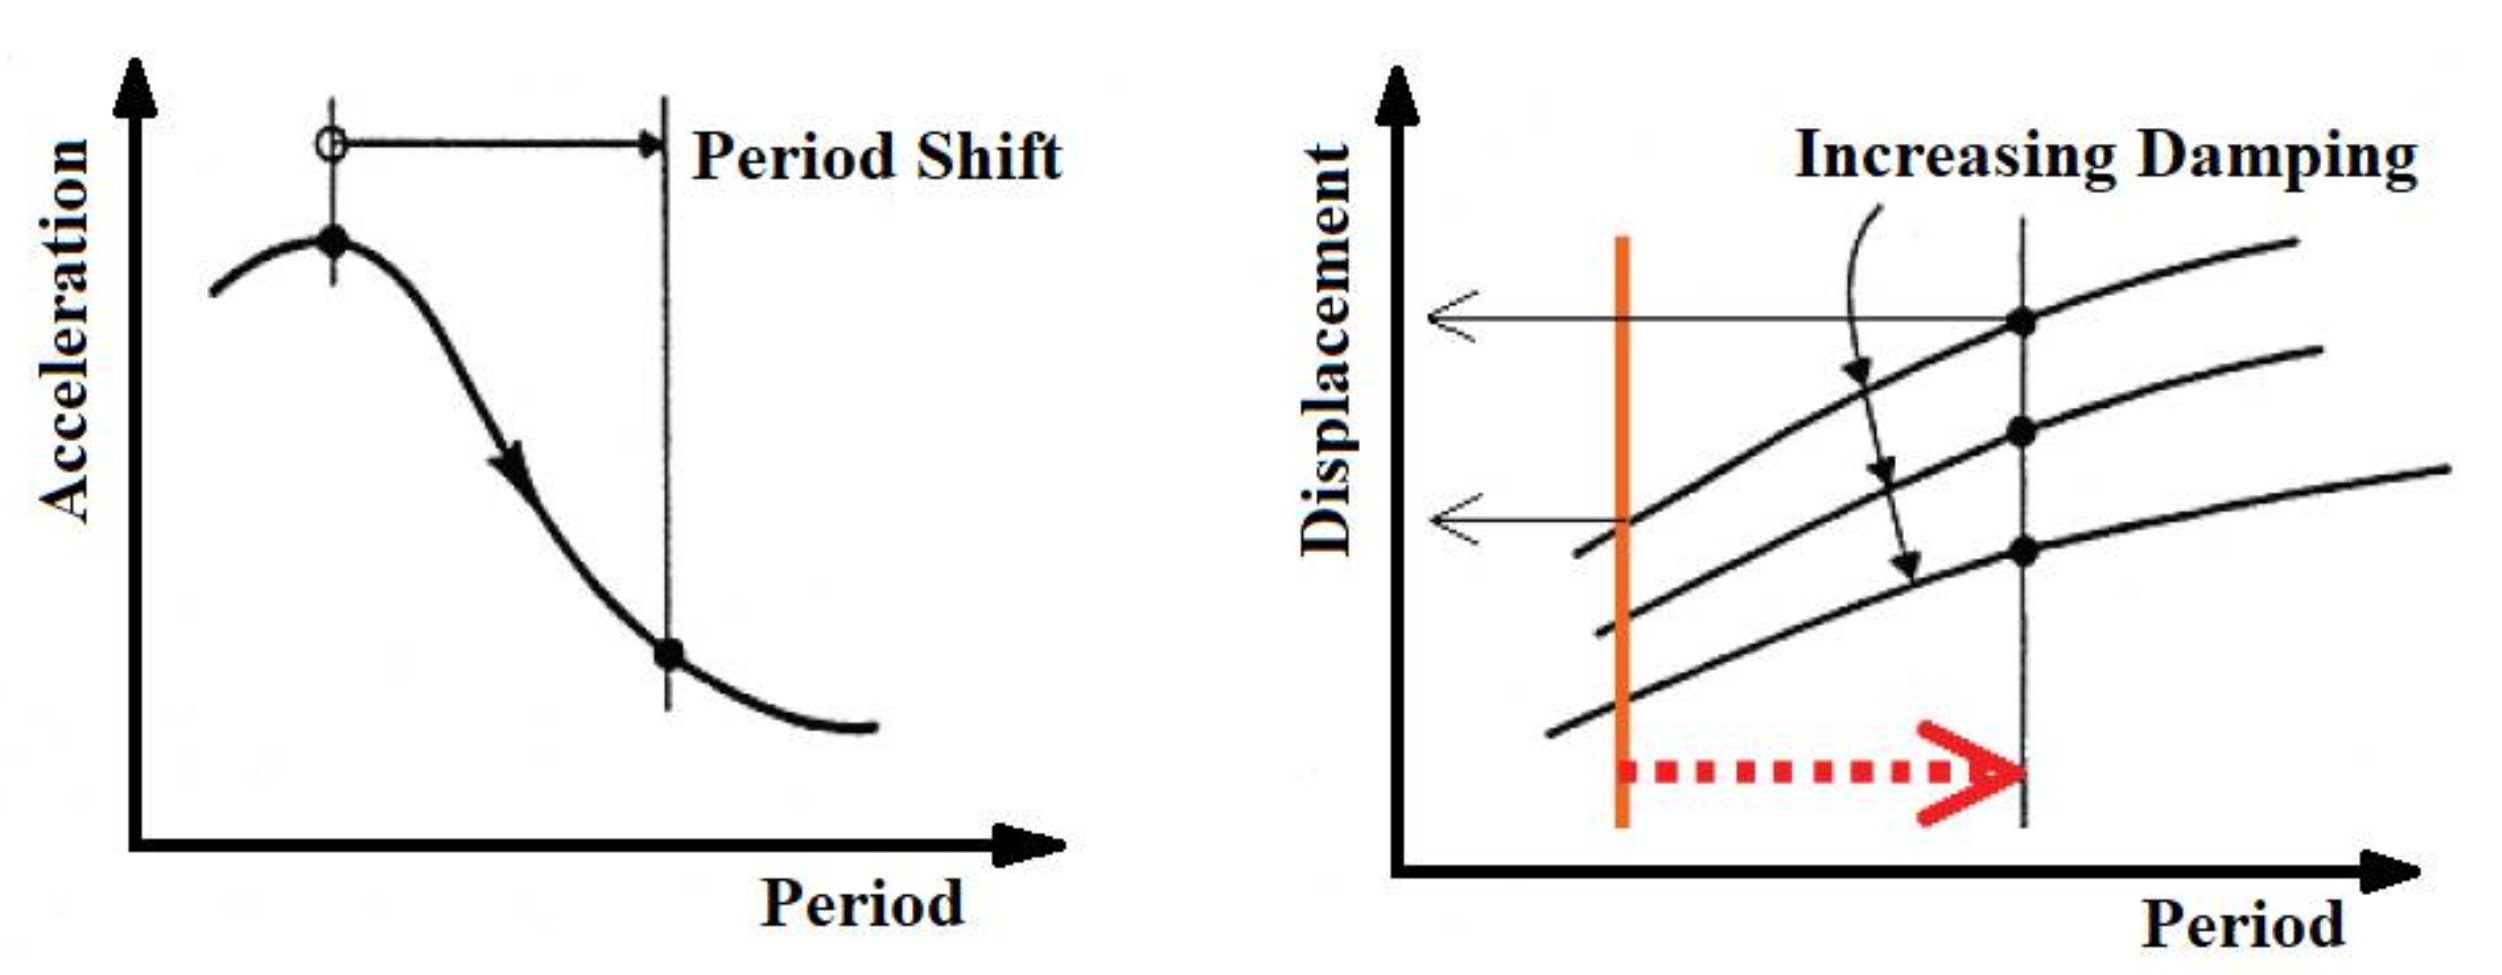
Unlike traditional design approaches, the seismic isolation technique is one of the passive control systems used to protect structural and non-structural elements against the destructive effects of earthquake forces and to improve the structure’s response during earthquakes. This means that the isolation period of the structure is extended, and the accelerations, shear forces, and relative story drifts affecting the structure are reduced [
8]. Those effects can be successfully ensured when the vibration period of the structure is increased significantly. The change in acceleration, damping, and displacement depending on the period increase is shown in
Figure 2 schematically for a seismically isolated structure.
The most commonly used isolation units are lead rubber and friction pendulum bearings [
10]. The aim of the isolation units is to increase the period of a structure while reducing its floor accelerations and relative floor drifts and to result in a deformation that is less than in conventional structures [
8]. The effectiveness of the isolation units to protect structural and non-structural elements was tested and verified by many studies in the literature [
11,
12,
13]. Several experimental and theoretical studies were carried out on lead rubber bearings as well. In most of the theoretical studies, the force–displacement relationship not representing strength loss (deterioration) was considered for the isolation units [
14,
15,
16,
17]. Upper Bound (UB) and Lower Bound (LB) analyses, defined as boundary analyses, are recommended in the codes for the dynamic analyses of isolation units. The strength deterioration is not taken into account in those analyses [
2,
3]. However, it was proposed in the experimental studies that strength deterioration occurs in lead rubber bearing (LRB) stemming from heating in the lead core due to cyclic behavior [
10]. The analytical model, developed to determine the force–displacement relationship obtained from experimental studies, was verified in the studies by Kalpakidis and Constantinou [
17,
18] and Ozdemir [
19].
Some of the studies in the literature modeling the strength deterioration due to the temperature increase in the lead core, and determining the maximum isolator displacement and strength are presented here. Ozdemir et al. [
20] investigated the maximum displacement and maximum force in the isolation unit on seismically isolated bridges by using the near field earthquake records. In the study, the analyses taking into account the strength deterioration as well as boundary analyses were carried out. Ozdemir [
21] observed the maximum displacement, occurring in the isolation system using earthquake record sets representing different soil classes, by considering different periods and characteristic strength ratios. Moreover, Ozdemir and Bayhan [
22] carried out dynamic analyses for isolation units where strength deterioration is taken into account, using near-field earthquake records containing pulse-type. The displacement and strength of the isolator caused by the heating effect were compared with the boundary analyses. Ozdemir and Dicleli [
23] observed the maximum displacement and force occurring in the isolation system using near-field earthquake records with different characteristics by considering the strength deterioration.
The studies considering the strength deterioration caused by heating in the lead core due to cyclic motion and investigating the superstructure response are very limited in the literature. One of the initial studies considering the strength deterioration using the Two-Degrees-of-Freedom (2-DoF) model was performed by Kalpakidis et al. [
24]. Two different structures with seismic isolators without any irregularity were investigated by Arguc et al. [
25]. The examined structures consist of three-story steel and 20-story reinforced concrete structures. The reactions occurring in the superstructure were investigated by considering the strength deterioration due to heating in the lead core. The obtained results were compared with the boundary analyses in which the strength deterioration was not considered. Moreover, a seismically isolated hospital building was investigated by Ozdemir and Avsar [
26]. In the study, the results of the boundary analysis were compared with the ones in which the strength deterioration was taken into account. Kanbir et al. [
27] analyzed a regular four-story seismically isolated RC structure under earthquake excitations by three different finite element programs and compared the results in terms of acceleration and displacement. Four- and nine-story regular 3D reinforced concrete structures with seismic isolators were investigated by Kanbir et al. [
28] by non-linear analysis considering the strength deterioration in the lead core.
Moreover, there are some studies in the literature examining the effect of seismic isolators on the superstructure behavior in structures with plan irregularities. Disarno et al. [
29] evaluated the reliability of linear and nonlinear dynamic analyses for seismically isolated irregular buildings. For this purpose, a multi-story RC hospital building including 327 high-damping rubber bearings was investigated by spectral and time history analyses. Mazza and Mazza [
30] observed the superstructure behavior under the influence of near-field earthquakes in a six-story RC structure with L-shaped plan irregularity, using a friction pendulum isolator. Cancellara and De Angelis [
31] studied two different base isolation systems in a multi-story RC structure with an irregular plan. Nonlinear dynamic analysis was performed for seismically isolated structures. In the study of Mazza [
32], elastomeric and sliding base-isolation systems were used in a five-story reinforced concrete structure with an irregular plan for seismic retrofitting. Different soil properties were investigated using near-field earthquakes. In the structures retrofitted with seismic isolators, the distribution of story drift became more regular, and the damage to structural elements was reduced. Habib et al. [
33] researched the regular and irregular reinforced concrete structural models with seismic isolators exposed to pulse-like earthquakes with low and high PGA/PGV ratios. Meral [
34] investigated the effects of friction pendulum isolators on the seismic behavior of reinforced concrete buildings. For this purpose, four-story building models with no irregularities and with heavy overhangs, short columns, and soft story irregularities were examined by the time history analysis.
In the literature, the bilinear force–displacement relationship not considering the strength deterioration is used in the analysis of seismic isolated structures with plan irregularities. According to the best knowledge of the author, there is no study in the literature that takes into account the strength deterioration in structures with plan irregularities due to the temperature increase in the lead core. Therefore, the aim of this study is to examine the effect of plan irregularity on the behavior of seismically isolated reinforced concrete structures. For this purpose, the eight-story prototype RC building models, with or without plan irregularities, with an isolated- and fixed-base at 32 m in height were created and analyzed. First of all, a 3D, eight-story, regular reinforced concrete reference building model (R) was designed in accordance with the Turkish Building Earthquake Code 2018 (TBEC-2018). Then, Cruciform plan (C), T-Shaped plan (T), and L-Shaped plan (L) models containing irregularities were created by modifying the reference model. The lead rubber bearings (LRB) were also considered in the study. Temperature included (TI) analyses which take into account the strength deterioration due to heating caused by cyclical movement in the lead core, as well as boundary analyses recommended by the codes (LB and UB), were also carried out for the seismically isolated structures. Modeling the strength deterioration in the force–displacement curves of isolators subjected to cyclic loading is very important in TI analysis. By modeling the strength deterioration, the behavior of the seismic isolator is represented by the actual behavior instead of the representative models used for boundary analyses. In the study, the nonlinear response history analysis (NRHA) was carried out using OpenSees [
35] and ETABS [
36] structural analysis programs under the influence of 11 different scaled earthquake records with specific characteristics. The strength deterioration due to heating in the lead core in a lead rubber bearing under cyclical motion was considered for the first time by this study, specifically for structures with an irregular plan. By this means, seismic isolator and superstructure behaviors can be obtained accurately as a result of non-linear dynamic analyses to be carried out to determine the behavior of the seismically isolated structure. The structures with plan irregularities, which were taken into account in the analyses, were examined by considering the isolation period (T
iso = 3.0 s) and the characteristic strength ratio (Q/W = 0.100). The non-linear behavior was taken into account for the superstructure by defining fiber hinges to columns and beams for both fixed and isolated-base structures. Moreover, non-linear behavior was considered at the isolation level in structures with seismic isolators. Thus, displacement, acceleration, story drift ratio, base shear ratio, roof displacement, roof drift ratio, and fiber hinge results of buildings with or without plan irregularities were investigated comparatively. Ultimately, this study makes a significant contribution to the literature by considering the strength deterioration due to cyclic motion in reinforced concrete lead rubber bearing structures with or without plan irregularities.
2. Analytical Model
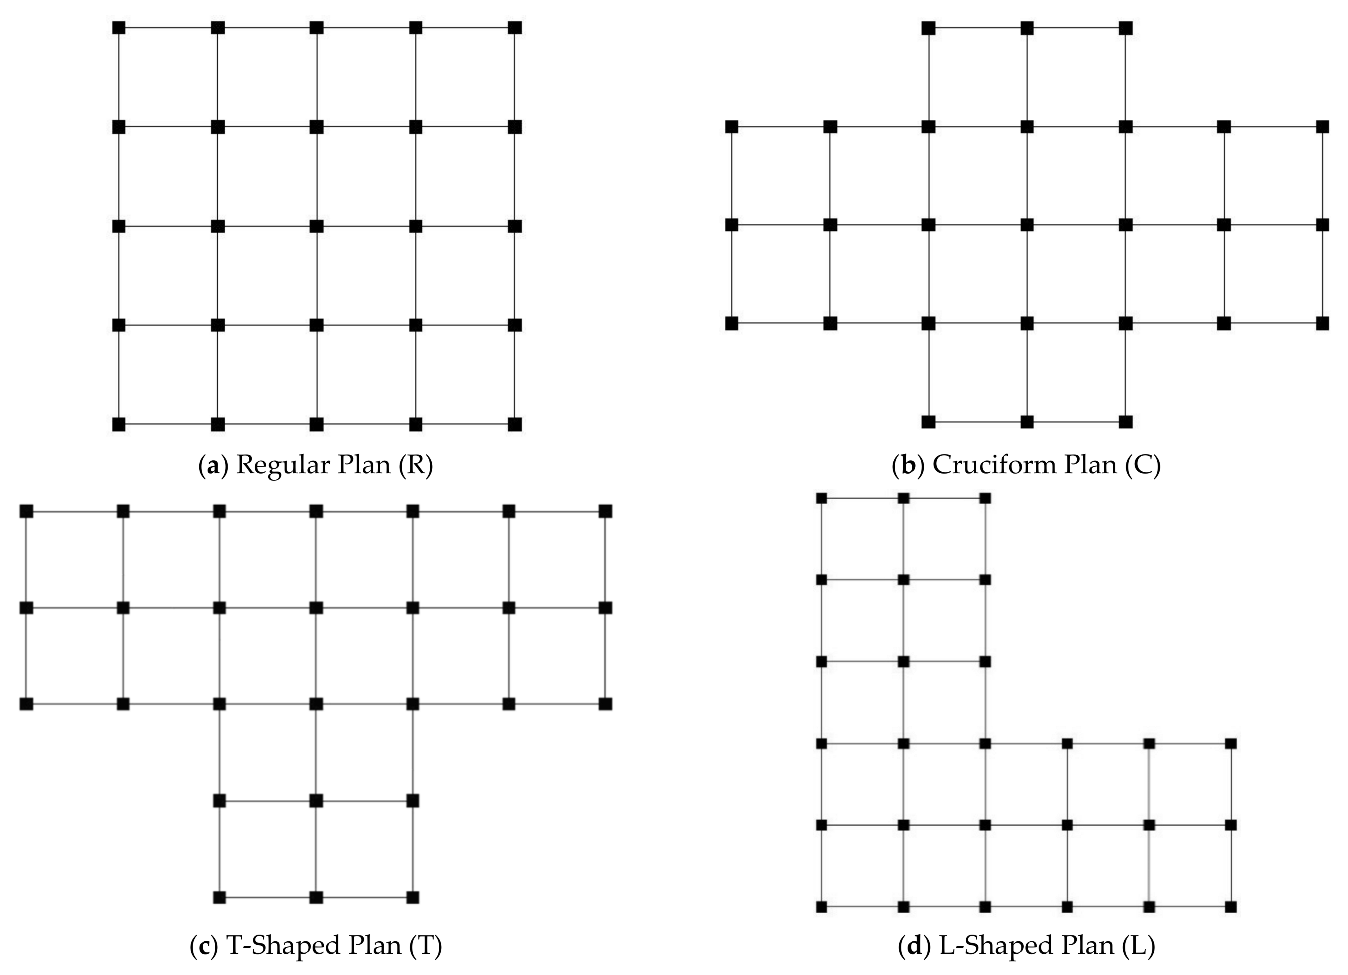
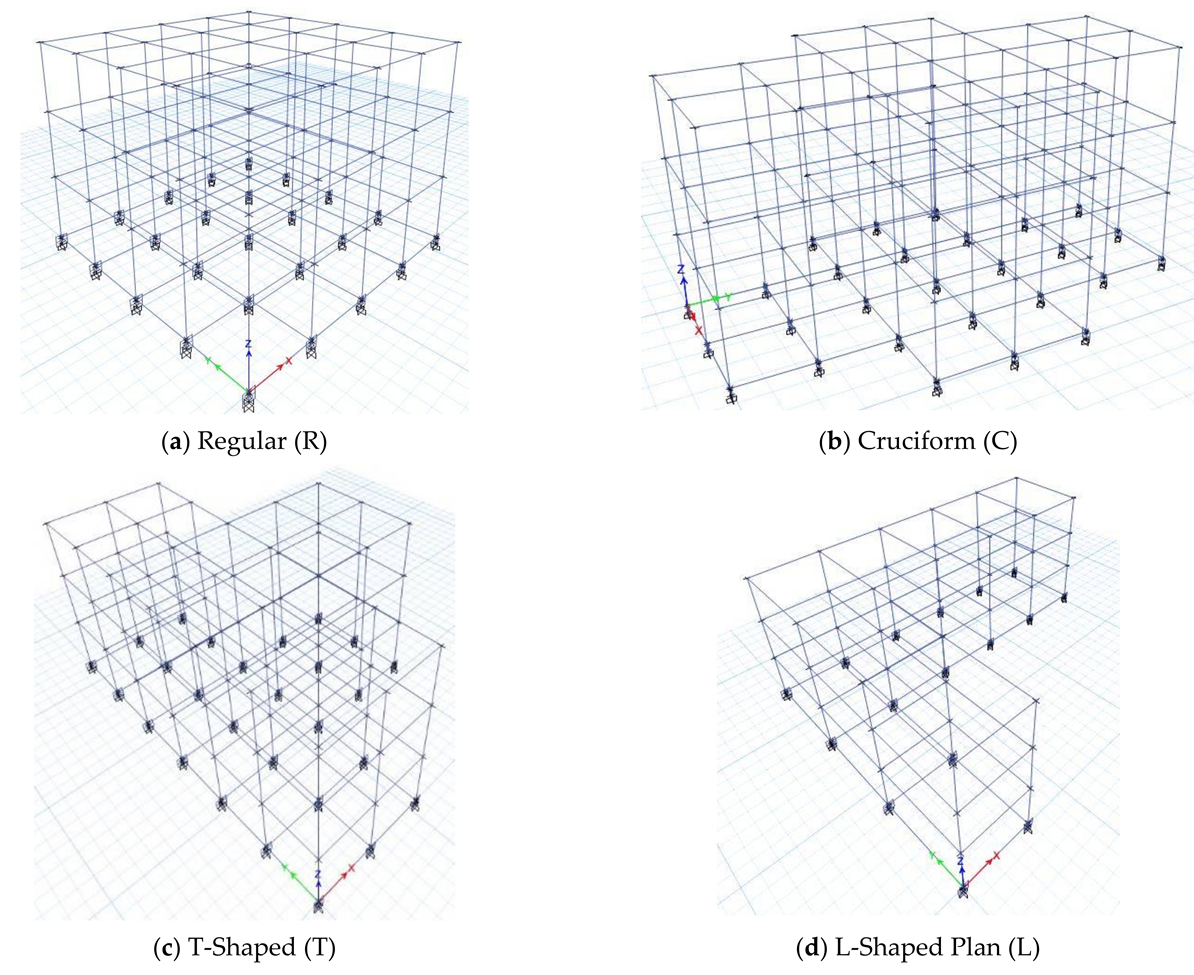
The buildings examined within the scope of the study were designed for residential buildings’ occupancy class. The structures with the three different plan irregularities and one regular reinforced concrete reference building were modeled as having a fixed and isolated base. As stated above, the regular structure is called R, and the irregular buildings are named C, T, and L. The plan and 3D views of the buildings are given in
Figure 3 and
Figure 4, respectively. The material properties of the building were assumed as 30 Mpa (C30) for compressive strength of concrete and 420 Mpa (B420C) for yield strength of reinforcement. The elastic behavior of the superstructure is expected for seismically isolated structures in the design codes [
2,
3]. For this reason, the nonlinear behavior of structural elements such as columns and beams was examined in the study, and it was also checked if they remain within their elastic limits [
3]. Additionally, the nonlinear behavior was considered for the isolation units. The investigated structures have eight floors with a 4 m floor height and a total height of 32 m. The plan area was kept the same for all buildings. Although they have different numbers of bays in both orthogonal directions (x and y), their bay spacing is considered constant as 6 m. In the load-bearing system, all column sections are 70 × 70 cm, beam sections are 40 × 60 cm, and the floor thickness is 20 cm. In order to satisfy ductile behavior for the columns, the longitudinal reinforcement ratio was assumed as 1.24%, and the stirrup spacing was chosen as 100 mm. The reinforcement was chosen as 16Ø22 for columns. The columns and beams were modeled using frame elements. The slabs were not included in the models, but both slab weights and the loads on them were distributed to the beams surrounding the slabs. A rigid diaphragm was defined at every story and isolation level in the models. The dead and live loads on the slabs were considered as 5.0 kN/m
2 and 2.0 kN/m
2, respectively. The weight of the infill wall, assumed to be on the beams, was taken as 6.45 kN/m [
37]. In the center, side, and corner columns, axial loads due to the live and dead loads take different values accordingly, and the properties of the isolation unit change. However, in this study, it is assumed that equal axial loads occur in all isolators in order to use a single type of isolation unit and not to affect the seismic isolator behavior. Therefore, the value of 1290 kN applied to each isolator was kept constant. In order to ensure that value, the slab thickness on the isolation unit was selected at different heights for different models (R, C, T and L) to provide rigid behavior. All dead loads and 30% of live loads were taken into account in the weight calculation of the structure. The stiffness contribution of infill walls to the buildings was neglected for all models.
OpenSees, which is an open source structural analysis program [
35], and ETABS [
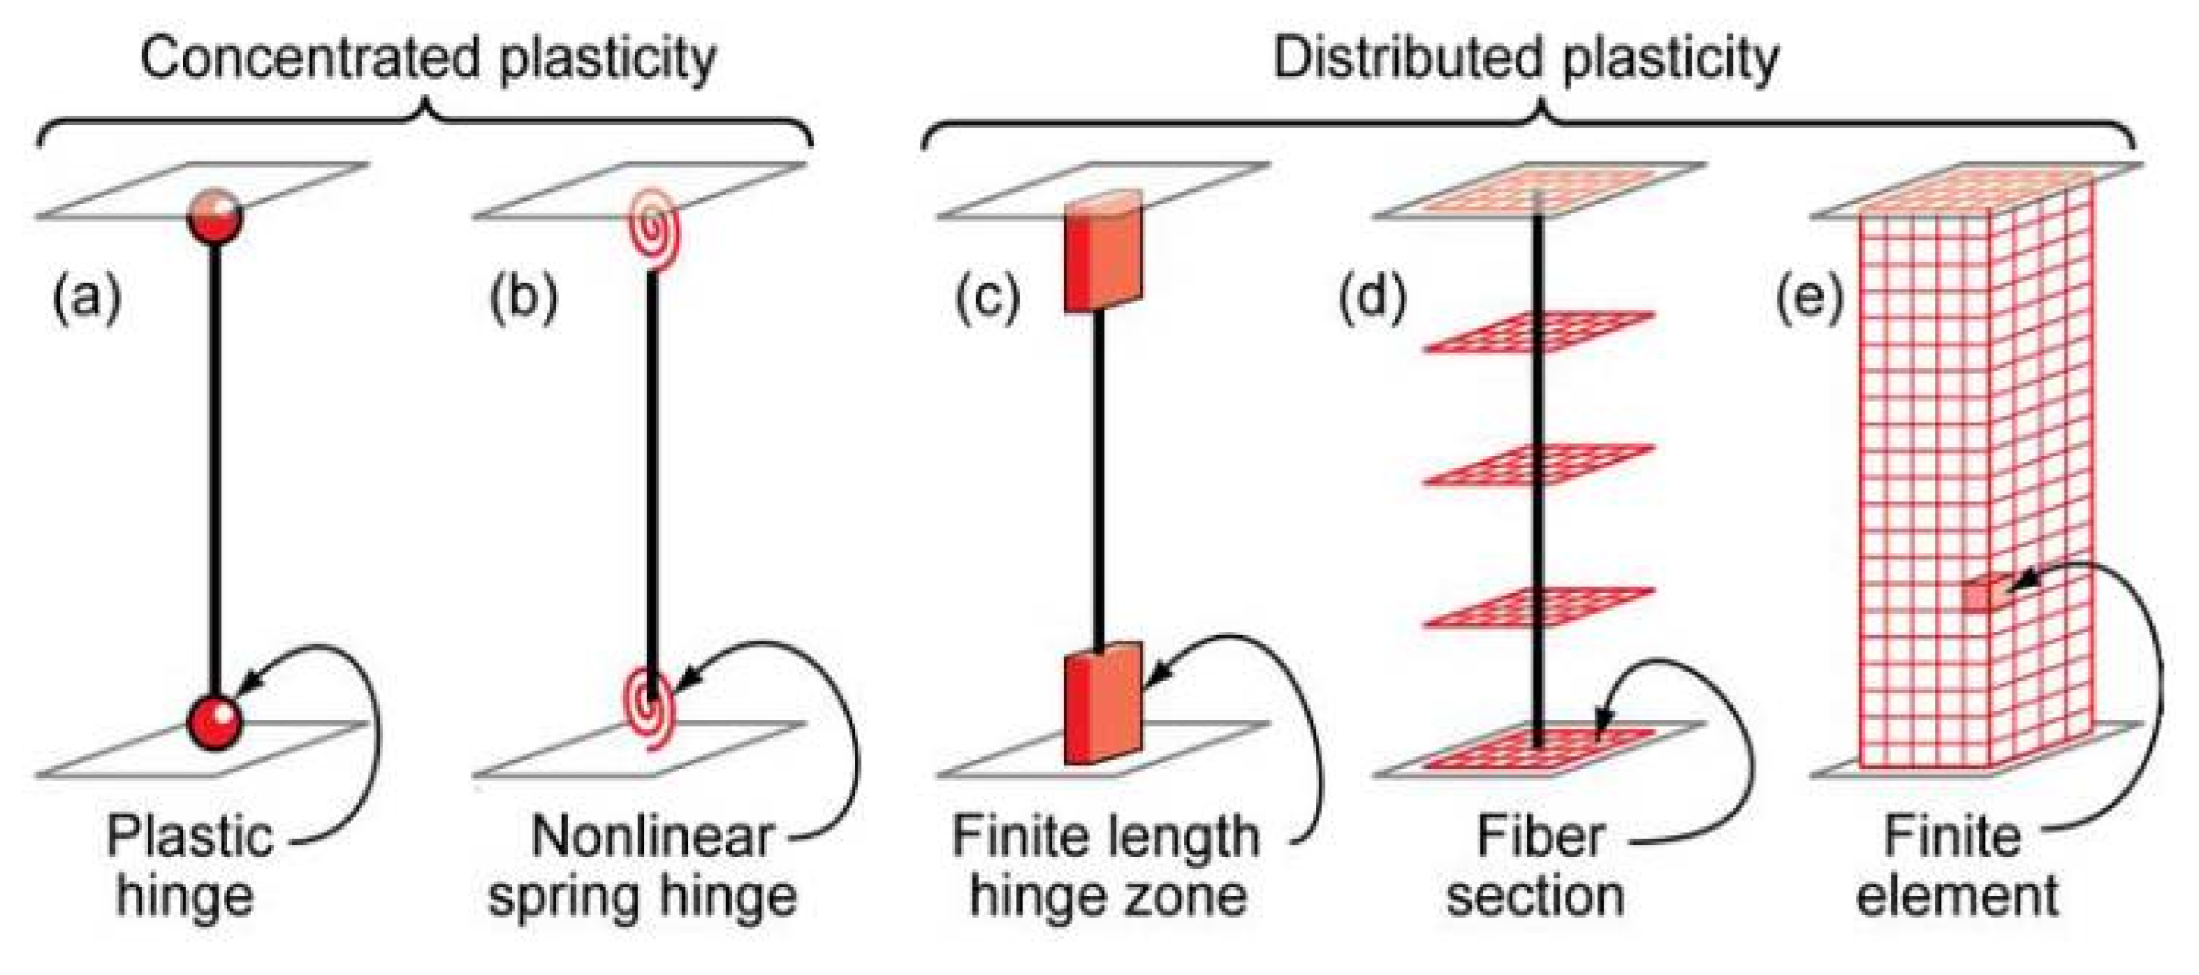
36] finite element software were used for the analysis of all structures. The dynamic analysis of model structures with fixed and isolated bases, which were created by using fiber hinges used for columns and beams, were carried out by ETABS structural analysis program. However, since the strength degradation in LRB models due to heating in the lead core because of its cyclic motion cannot be simulated with ETABS structural analysis program, dynamic analyses of seismically isolated models were conducted using OpenSees. For this reason, the dynamic analysis results obtained from both analysis software are presented under the Analysis Results and Discussions part of the study to show their compatibility. There are two main approaches to modeling the nonlinear behavior of structural system elements: lumped and distributed plasticity (
Figure 5). The distributed plasticity approach automatically considers the moment–rotation relationship and plastic axial stress for each fiber. Therefore, it gives more accurate results than the lumped plasticity approach [
38]. In this study, nonlinear fiber hinges, one of the distributed plasticity approaches given in
Figure 5c, were used. The fiber hinge length defined to both end regions of columns and beams was taken as half of the section height of the relevant structural element in the given direction [
3]. The damage states of the columns and beams depending on the strain both on concrete and reinforcement were evaluated according to the acceptance criteria calculated with respect to TBEC-2018. The determining acceptance criteria for the concrete and reinforcement are given in
Table 1. In
Table 1. LD, MD and SD represent Limited Damage, Moderate Damage, and Severe Damage, respectively. The bending stiffnesses considered in the dynamic analysis were determined by using the effective section stiffness factors given in TBEC-2018 as 0.70 and 0.35 for columns and beams, respectively [
3]. The modal periods obtained from the modal analysis for regular (R) and irregular (C, T, and L) structures with fixed bases are reported in
Table 2 as well.
3. Properties of Lead Rubber Bearings
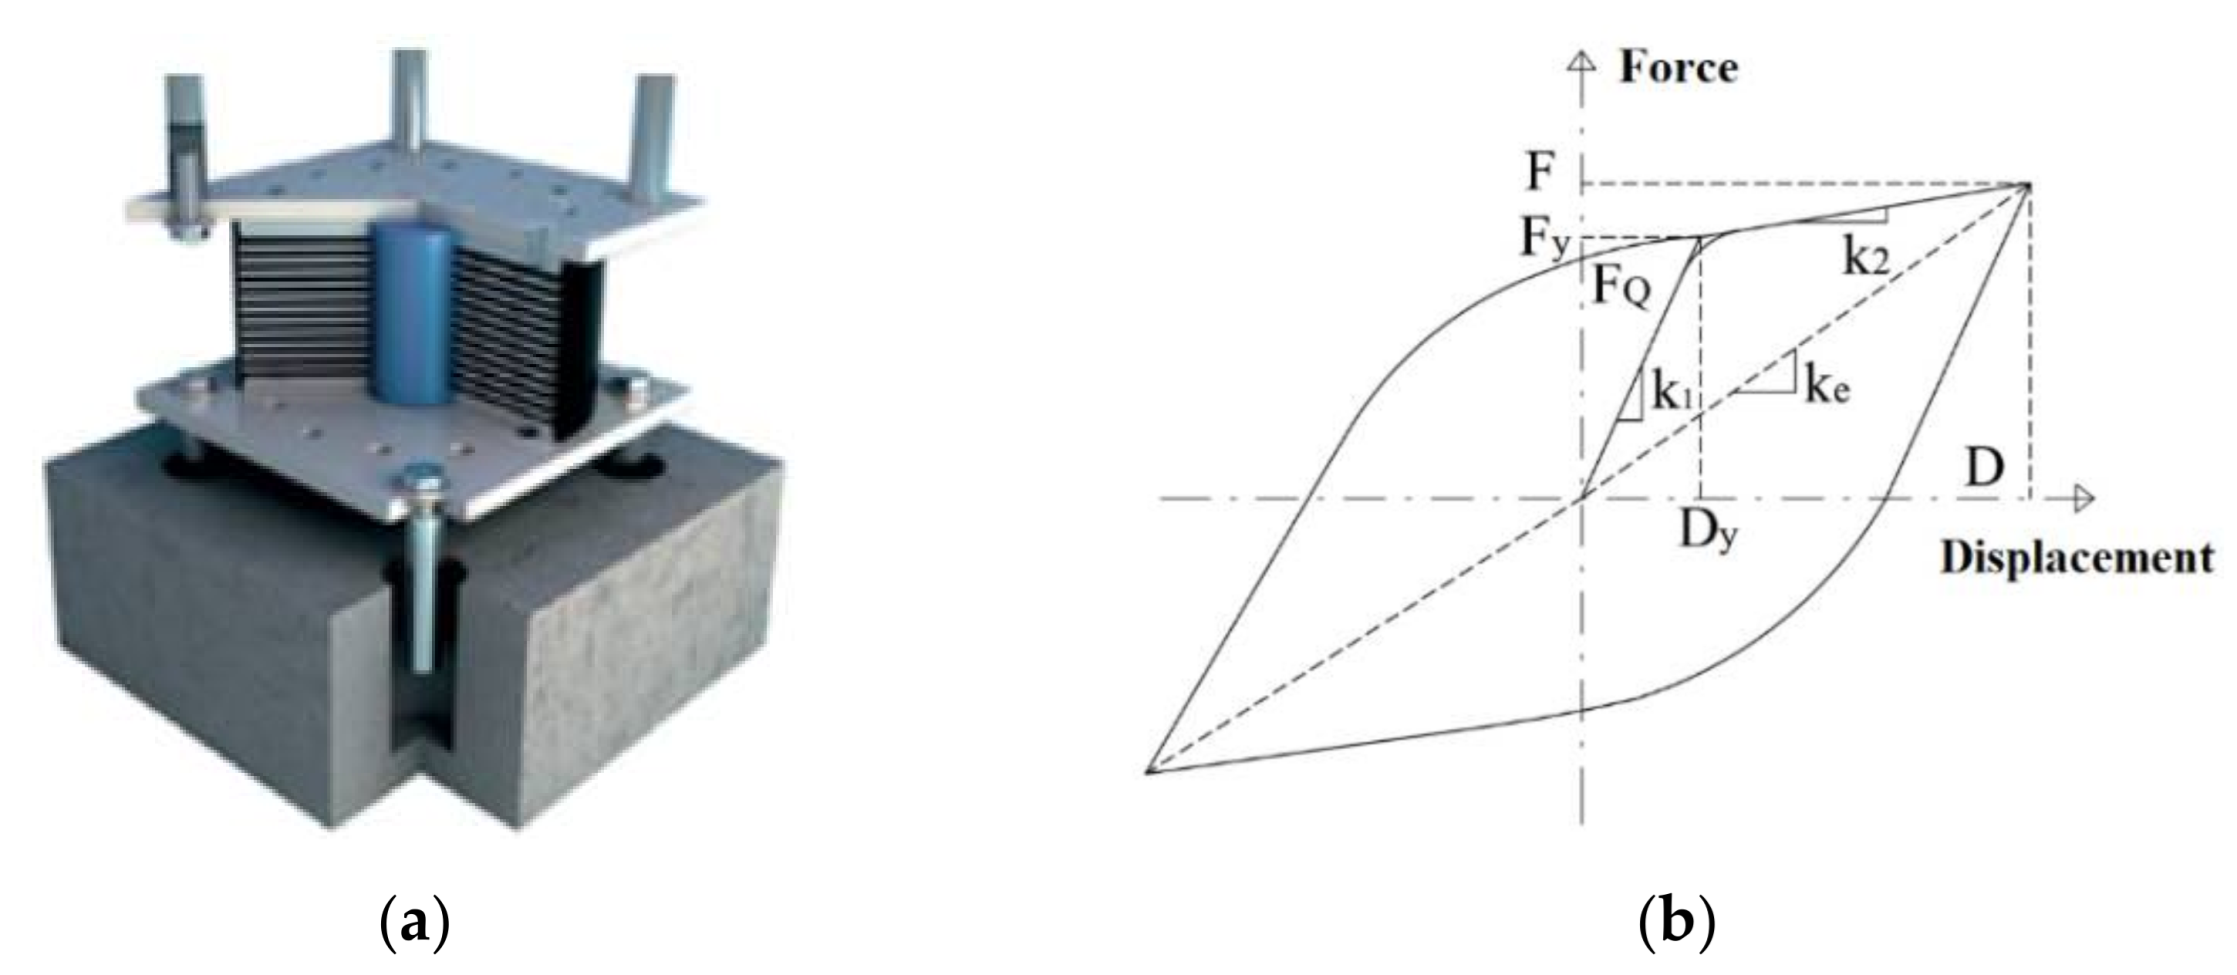
The boundary analyses (LB and UB) are widely used to model isolator units for the analysis of seismically isolated structures. In this case, the isolation units are determined by the nondeteriorating force–displacement relationship. In the boundary analysis, the lower and upper bound values specified in the specifications are used in order to take into account the effects of aging, environmental effects, loading speed, and heating. The maximum displacement for the isolation unit is determined by the lower bound values under the influence of the maximum considered earthquake (MCE), and the maximum force and acceleration acting on the superstructure are determined by the upper bound values under the influence of the design basis earthquake (DBE). The lead rubber bearings used in the study, and the idealized force–displacement relationship for those isolators for boundary analysis are given in
Figure 6a,b, respectively.
In
Figure 6b, k
1 is the initial (elastic) stiffness, k
2 is the post-yield stiffness, D
y is the effective yield displacement, F
y is the effective yield strength, F
Q is the characteristic strength (expressed as Q in this study) where D is the maximum isolator displacement, F is the horizontal force corresponding to the maximum isolator displacement, and k
e is the effective stiffness corresponding to the maximum isolator displacement [
2,
3]. In order to determine the lower bound yield stresses (
) of the isolation units, the average of the first three cycles of the experimental results performed on the isolation unit is taken. However, the values obtained from the first loop are used for upper-bound yield stresses (
). The yield stresses (
) for lower bound analyses were taken as 10 MPa [
25,
40]. The relationship between the lower bound and upper bound yield stresses was determined as (
= 1.35
) as proposed by Constantinou et al. [
9]. The use of isolators with different properties in corner, edge, and center columns is technically and economically necessary. However, within the scope of this study, it is assumed that there is a rigid slab above the isolation level and that the sum of the superstructure and assumed rigid slab weight is equally distributed over all isolators. For this reason, it is assumed that the isolator properties are the same depending on the axial load corresponding to the corner, edge, and center columns. The properties of the isolation units are presented in
Table 2. In
Table 2, W represents the weights of regular (R) and irregular (C, T, L) structures. T
FB and T
IB represent the period for fixed- and isolated-base structures, respectively. In addition, k
1 and k
2 represent the initial (elastic) and post-yield stiffnesses of the isolation unit, respectively.
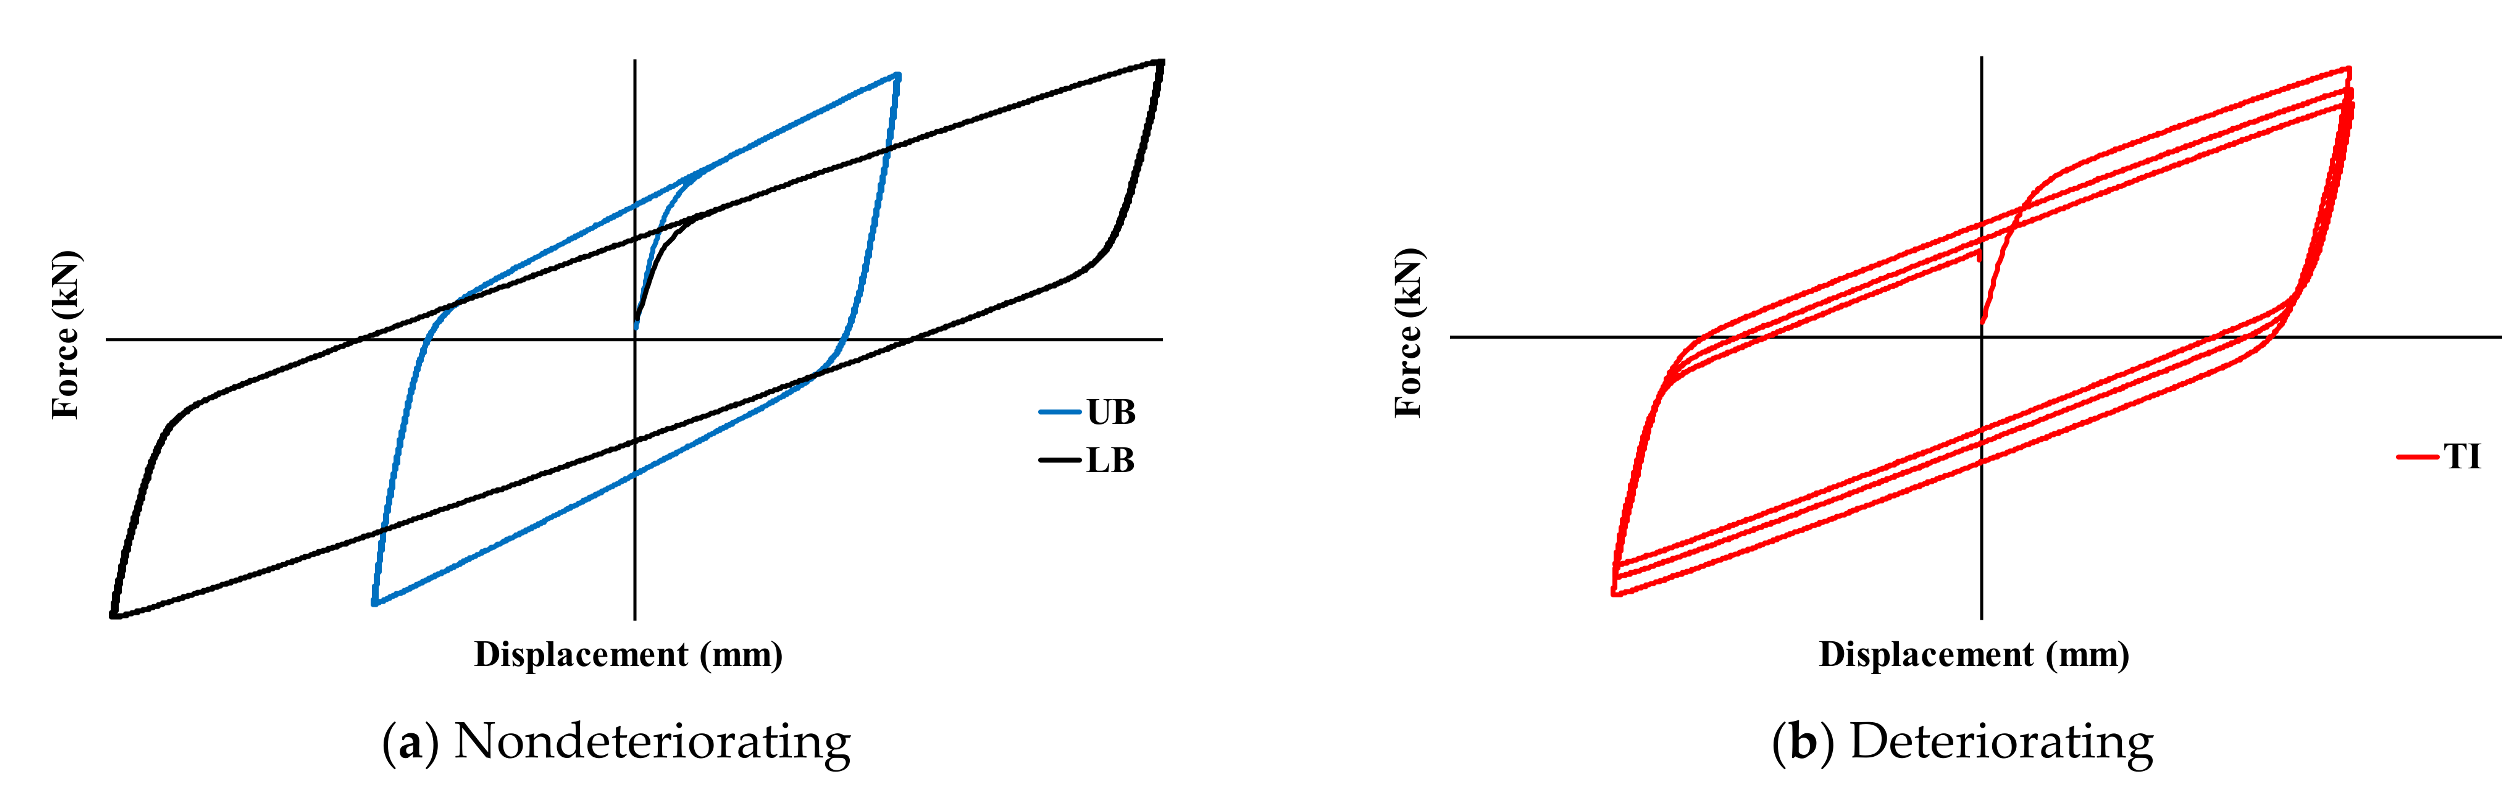
In the codes [
2,
3], the force–displacement relationship of the isolation units is represented by bilinear curves (
Figure 7a) that do not show any strength deterioration. However, the experimental studies in the literature have deduced that strength deterioration is observed in isolation units due to cyclic motion (
Figure 7b) [
10]. Some coefficients are given in the codes to determine the lower and upper bound values in order to take into account aging, environmental effects, loading speed, and heating effects. Studies in the literature have shown that the most effective one of the above-mentioned reasons causing the strength deterioration that may occur in an isolator is the temperature increase in the lead core [
10,
21,
41] (
Figure 7b). An analytical model was developed and verified by (Kalpakidis and Constantinou) [
17,
18] to determine the strength deterioration due to temperature increase. In this study, the strength deterioration occurring in the isolation units due to the temperature increase in the lead core because of the cyclic motion was also taken into account by using that analytical model. The yield stress value used for the upper bound was considered as the initial yield stress for the analyses in which the strength deterioration was taken into account [
17].
The yield stress of the lead, which determines the strength of the isolator in the horizontal direction, was proposed by Kalpakidis and Constantinou [
17,
18] as a function of the lead core temperature (Equations (1)–(4)). In Equation (1),
(
TL) represents the temperature-dependent yield stress of lead,
shows the initial yield stress of lead, and
TL is the total temperature in the lead core.
E2 is a constant number. The instantaneous temperature increase predicted to occur in the lead core of a lead rubber bearing subjected to bidirectional excitation is defined in Equation (2). In the equation, both the material and geometrical properties of the lead rubber bearing are used. For example, the parameters given as
and
represent the radius of the lead core used in the isolator, the total thickness of the steel plates, and the height of the isolator, respectively.
ṪL represents the instantaneous temperature change in the lead core,
Zx and
Zy are unitless parameters, and
Ůx and
Ůy show the velocity at which the isolator is exposed in both horizontal directions as well. Moreover,
are the density, specific heat, height, and radius of the lead core,
, the thermal conductivity of the steel plates, the thermal expansion coefficient of the steel plates, the total steel plate thickness,
t+ dimensionless time, and
F a parameter of dimensionless time, respectively [
28].
4. Selection and Scaling of Earthquake Ground Motions
In the present study, nonlinear response history analysis (NRHA) was carried out for reinforced concrete regular and irregular structures. Real earthquake records were selected for the analyses by considering the maximum considered earthquake (MCE) and design basis earthquake (DBE), which have a probability of exceeding 2% and 10% in 50 years, respectively. The horizontal elastic design spectrums were obtained for both earthquake levels by using the Turkey Earthquake Hazard Map developed by AFAD [
42]. Thus, horizontal spectra of the building in accordance with TBEC-2018 were obtained depending on its coordinates, earthquake level, and local soil type. It was assumed that the buildings are located in the province of Istanbul, Turkey, and to be built in the ZD soil class. According to TBEC-2018, the number of ground motion records for NRHAs must be at least 11, and the number of records taken from the same earthquake must not exceed three.
The parameters such as moment magnitude, distance to the fault rupture, and soil properties, etc., are considered for the selection of earthquake records. Within the scope of the study, the moment magnitude (M
W) of the earthquake records was chosen between 6.5 and 7.6, the distance to the fault rupture (R) was assumed as less than 20 km, and the shear wave velocity (V
S) value was considered between 180 m/s and 360 m/s for the ZD soil class. Eleven earthquake record pairs used in the analyses were selected through the Pacific Earthquake Engineering Research Center (PEER) database [
43]. The selected earthquake records and their properties are reported in
Table 3. PGA, PGV, and PGD given in
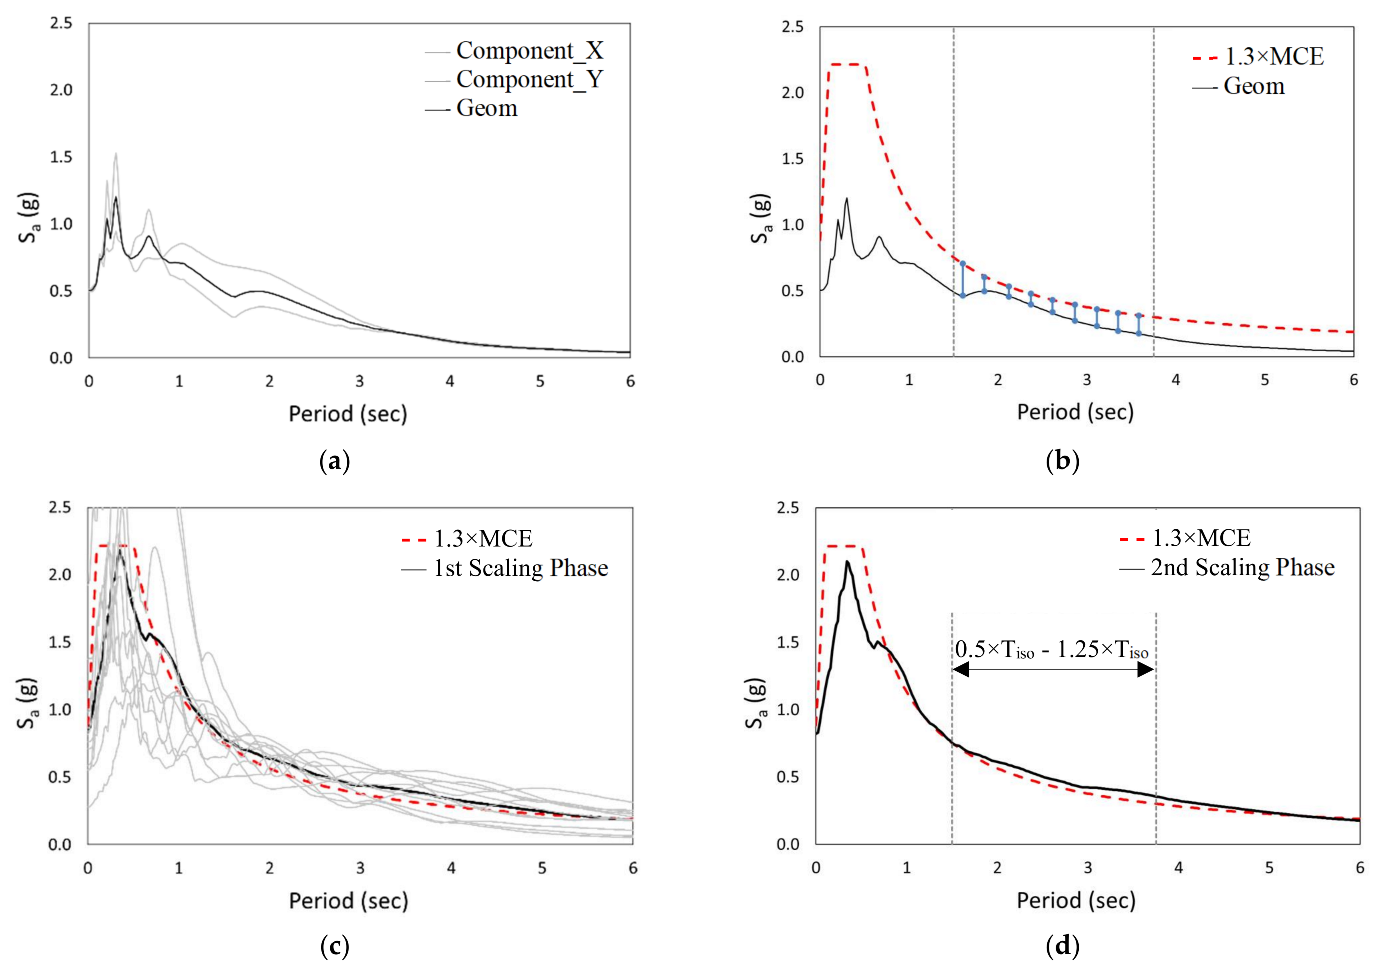
Table 3 represent peak ground acceleration, peak ground velocity, and peak displacement, respectively. The records were also scaled using the geometric mean scaling method. This method was first proposed by Somerville et al. [
44] and developed by Huang et al. [
45]. In the method, the spectrum curves of the two horizontal components of the selected records are obtained, and a single spectrum curve is formed by taking their geometric mean (
Figure 8a). Afterward, an error ratio is calculated for all earthquakes to show consistency between the generated spectrum curves and the design spectrum (
Figure 8b). In the first step of the scaling method, the error is calculated in order to ensure compatibility between the resultant spectrum curve and the design spectrum curve suggested by the code. This error is expressed as ε and is defined as the sum of the squares of the difference between the spectrum curves. Thus, the first scale factor that will minimize the error is determined. Later, a resulting single spectrum curve of 11 earthquakes is obtained by taking the average square root of the sum of the squares of the spectrum curves (SRSS) created using the first scale coefficient. The scaling is carried out once again depending on the criterion of being more than 1.3 times the design spectrum in the relevant period range (0.5T
iso–1.25T
iso) (
Figure 8d). The scale factor to be applied to each earthquake record is determined by multiplying the two scale factors calculated in the previous phases [
45].
Figure 8 shows the steps of the geometric mean scaling method. It was suggested in the literature that the scale factors used for scaling earthquake records in NRHAs should be between 0.5 and 2 [
46]. Moreover, the obtained scale factors for each earthquake record are given in
Table 3. It should also be noted that both horizontal components of earthquake records were scaled with the same scale factor.
5. Analysis Results and Discussions
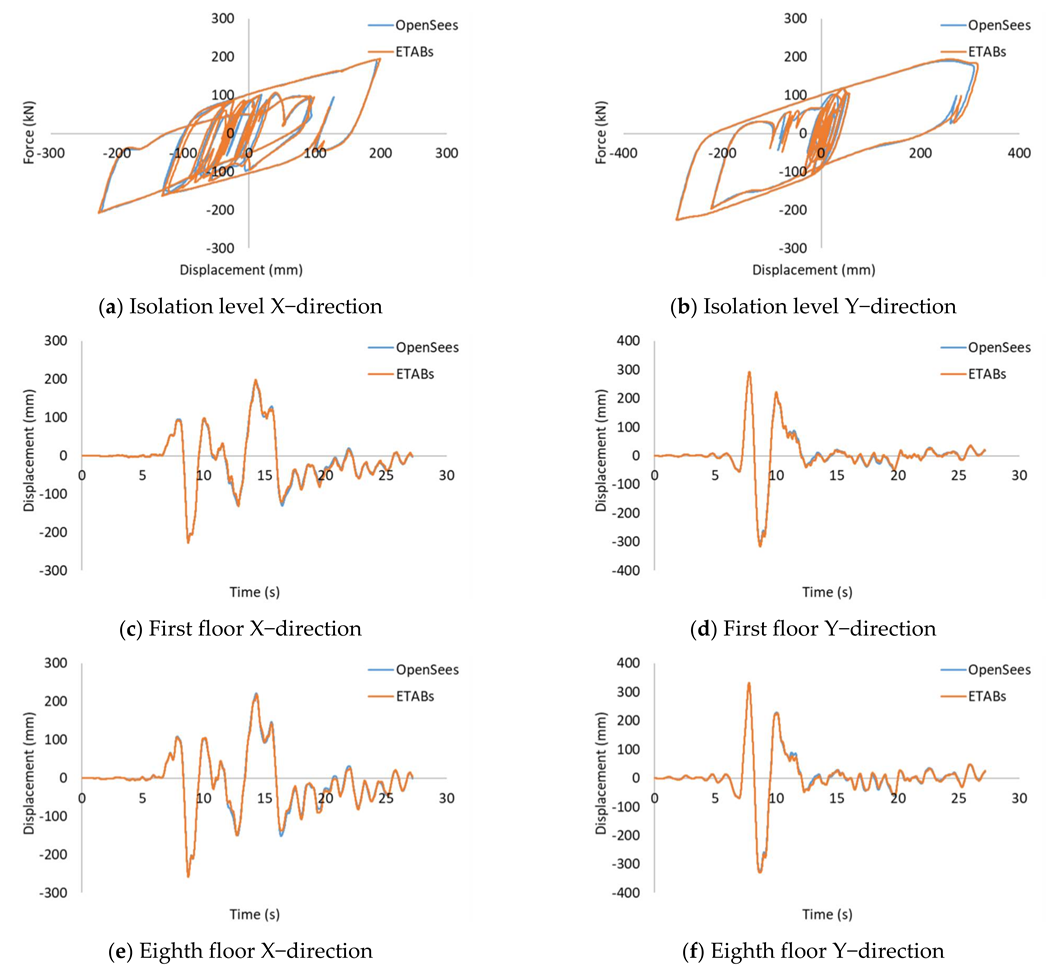
In the study, firstly, the NRHA results are illustrated in
Figure 9 to ensure the compatibility of nonlinear response history analyses performed using OpenSees [
35] and ETABS [
36] structural analysis programs. Since the strength deterioration of the seismic isolator due to heating in the lead core cannot be simulated via ETABS [
36], a force–displacement curve was chosen for the behavior of the seismic isolator, which does not take into account the strength deterioration under cyclic motion. The purpose of performing these analyses is to check whether the structural responses obtained under bidirectional earthquake effects, in which both horizontal components of an earthquake record were applied simultaneously, are similar.
Figure 9a,b depict the force–displacement curves of the seismic isolators at the isolation level in the X and Y directions obtained from both analysis programs. In
Figure 9c–f, the variation of the first- and eighth-floor displacement values throughout the analysis is presented in order to compare superstructure responses. As can be seen in the figures, the force–displacement data and floor displacements in both the X and Y directions match successfully. As a result, it was proven that the seismic isolated building models created with the OpenSees [
35] and ETABS [
36] structural analysis programs have sufficient accuracy.
A total of 440 NRHAs were carried out using OpenSees and ETABs programs in order to determine the effect of superstructure irregularity on building behavior. The results obtained from the analyses are presented below. The boundary analyses (LB-UB) in which the strength deterioration is not taken into account in seismically isolated structures, and where the analysis results where the strength deterioration is taken into account (TI) are examined comparatively. The story displacements, story accelerations, and relative story drifts were investigated to determine the structural responses occurring at the superstructure and isolation level. The floor displacement and acceleration values were calculated by taking the maximum value of the square root of the sum of the squares of the results obtained simultaneously in both directions for any earthquake recording. Then, the average of the maximum values obtained similarly from 11 earthquakes was taken. The seismic behavior of isolated-base and fixed-base regular and irregular reinforced concrete buildings were compared to the damage states of beams and columns and to the demand parameters such as floor displacement, floor accelerations, base shear forces, roof and story drift. Afterward, the base shear forces were divided by the building weight and named as “base shear ratio”, roof displacements were divided by the height of the building and called as “roof drift ratio”, and displacements between floors were divided by floor height and referred as to “story drift ratio” in order to simplify the comparisons.
5.1. Floor Displacements
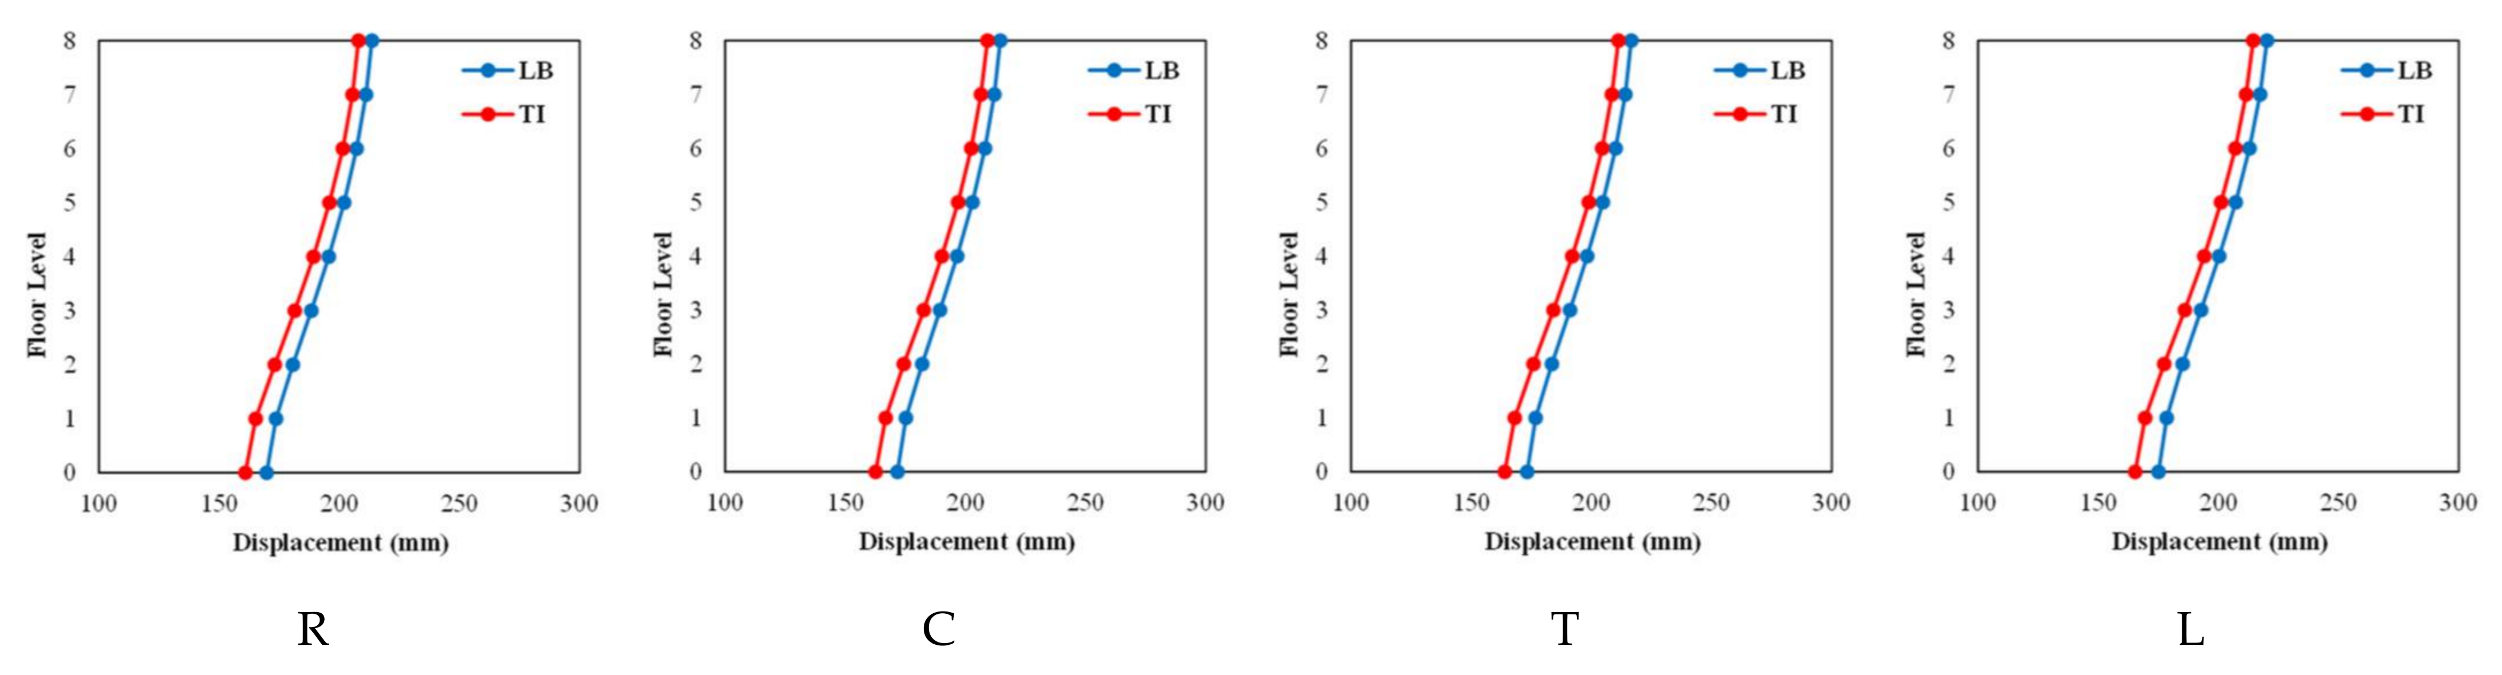
The displacement results obtained at each story level of the regular (R) and irregular (C, T, and L) isolated structures are illustrated in
Figure 10 for LB and TI analyses. The displacement difference determined from the LB and TI analyses at the isolation level is slightly higher than the displacement difference obtained from the building’s top floor. While this difference between LB-TI is 2.5% for the upper floor, it is around 5% on the isolation level. Displacement results were obtained as quite close for all structural models. This comparison is also presented in
Figure 11a for R, C, T, and L models with seismic isolators using the TI analysis results since it represents the actual behavior of the isolator. As can be seen in
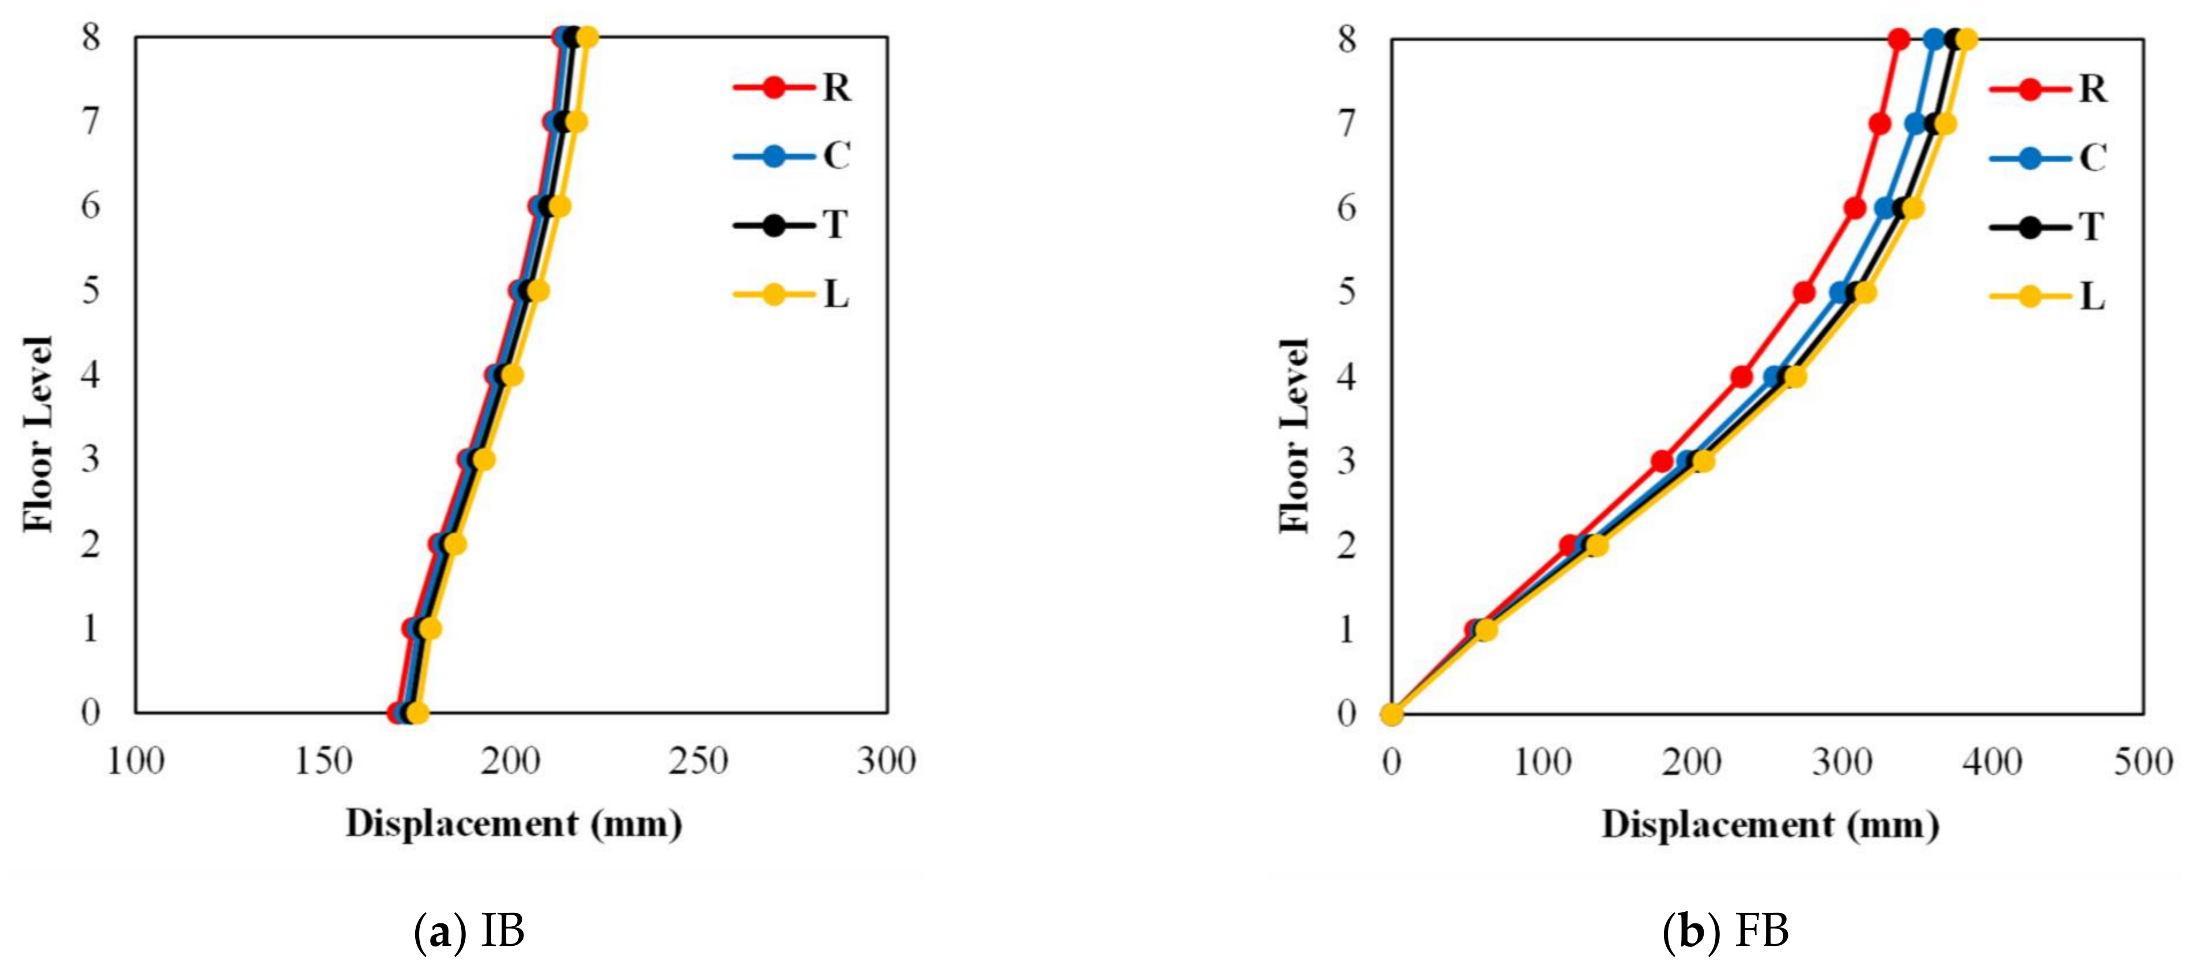
Figure 11a, there was a slight increase in the displacement values with the increase in the structural irregularity. Most of the displacement occurred at the isolation level. However, the superstructure can be made more rigid to create less displacement difference between floors. In
Figure 11b, the displacement results obtained from the fixed-base structure models are given. If it is compared to the reference structure (R), the displacement values obtained at each floor become more apparent and grow with the increase in the irregularity of the structure. Moreover, the displacement data at the isolation level and the roof floor are depicted in
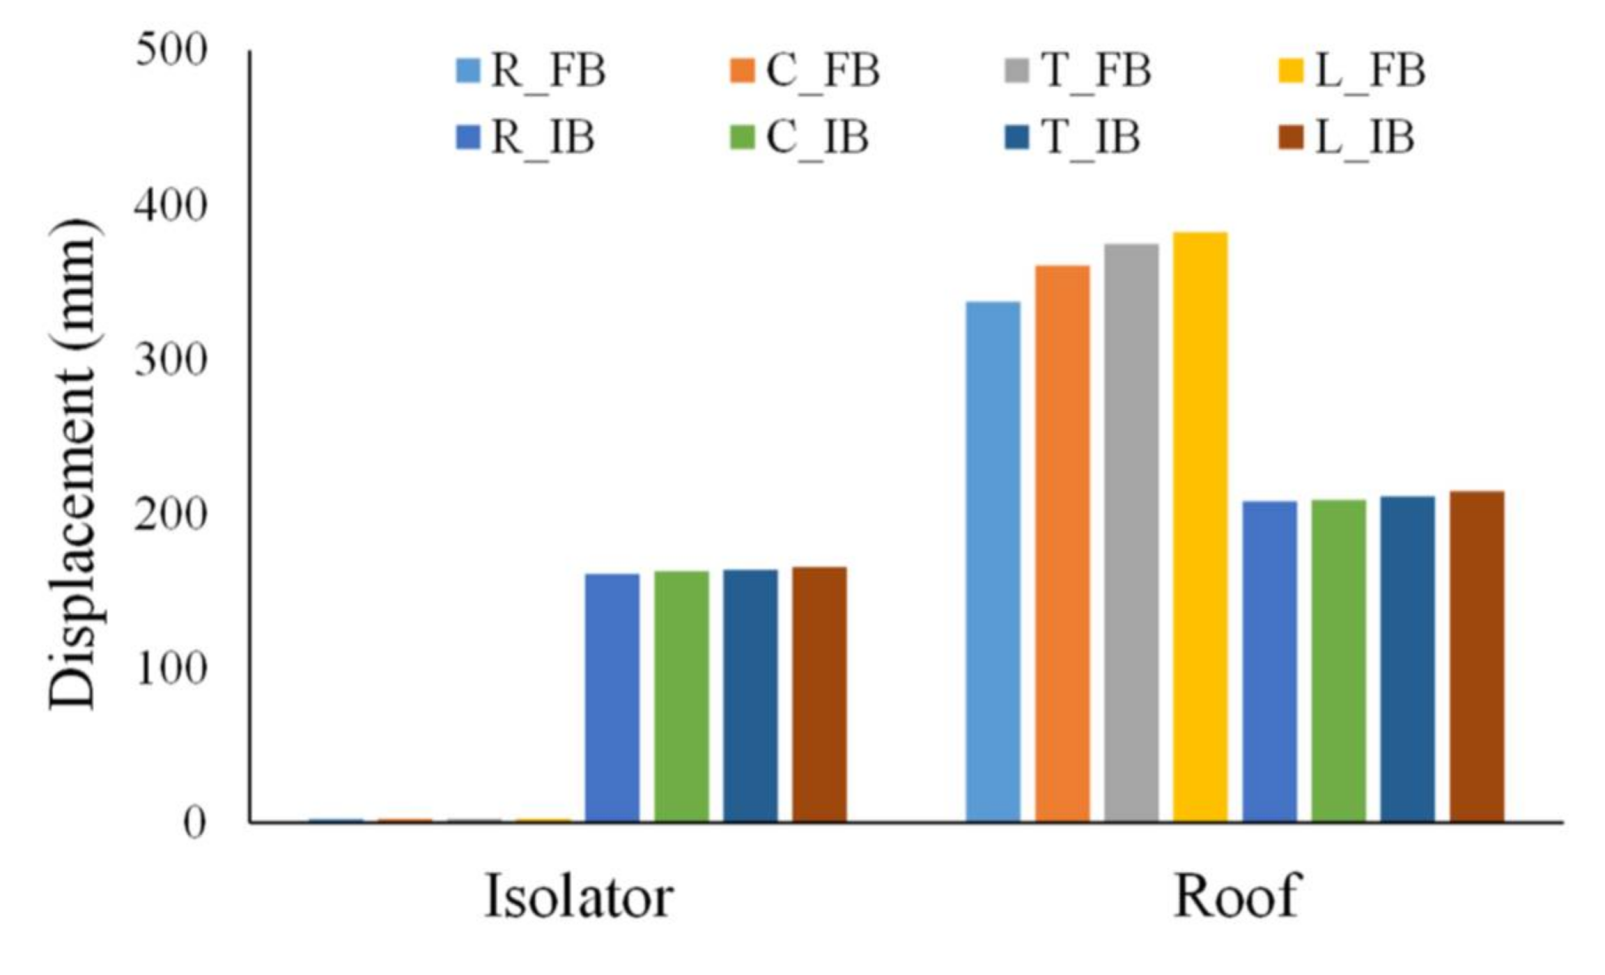
Figure 12 for all models with an isolated and fixed base. In
Figure 12, while the displacement value is zero in the fixed-base structure at the base level, it is 160–165 mm at the isolation level in the building with seismic isolators. In addition, the displacement values determined for the structures with a fixed base and an isolated base at the roof level are 340–380 mm and 209–214 mm, respectively.
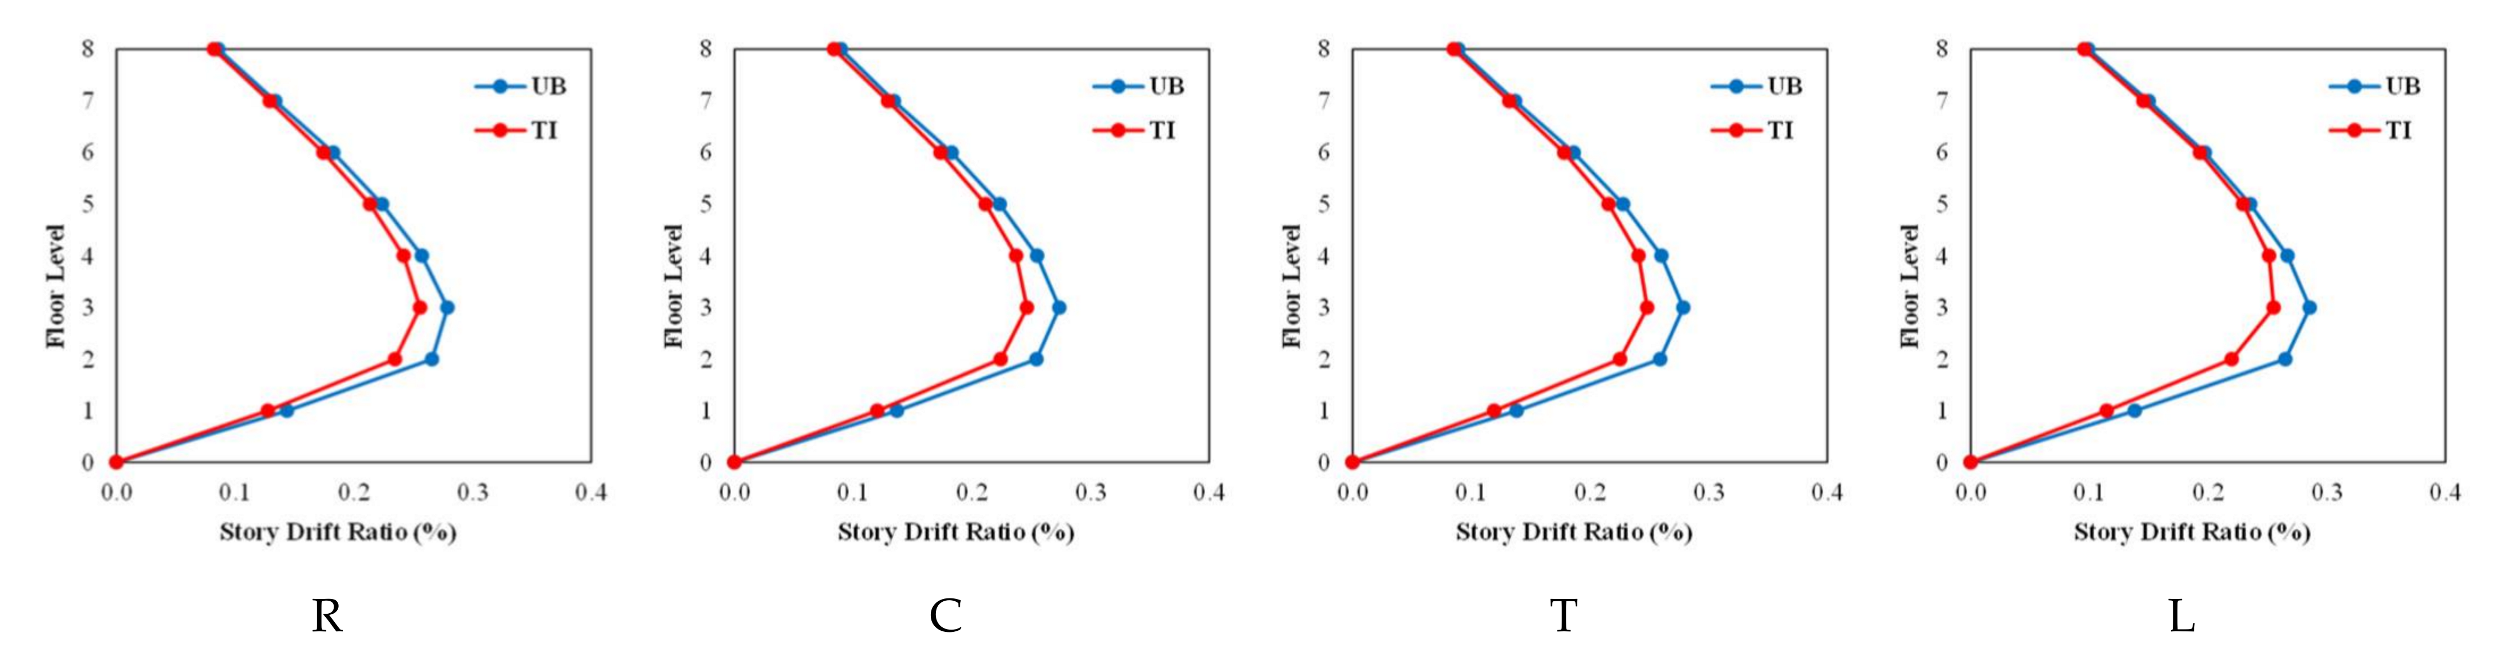
5.2. Story Drift Ratios
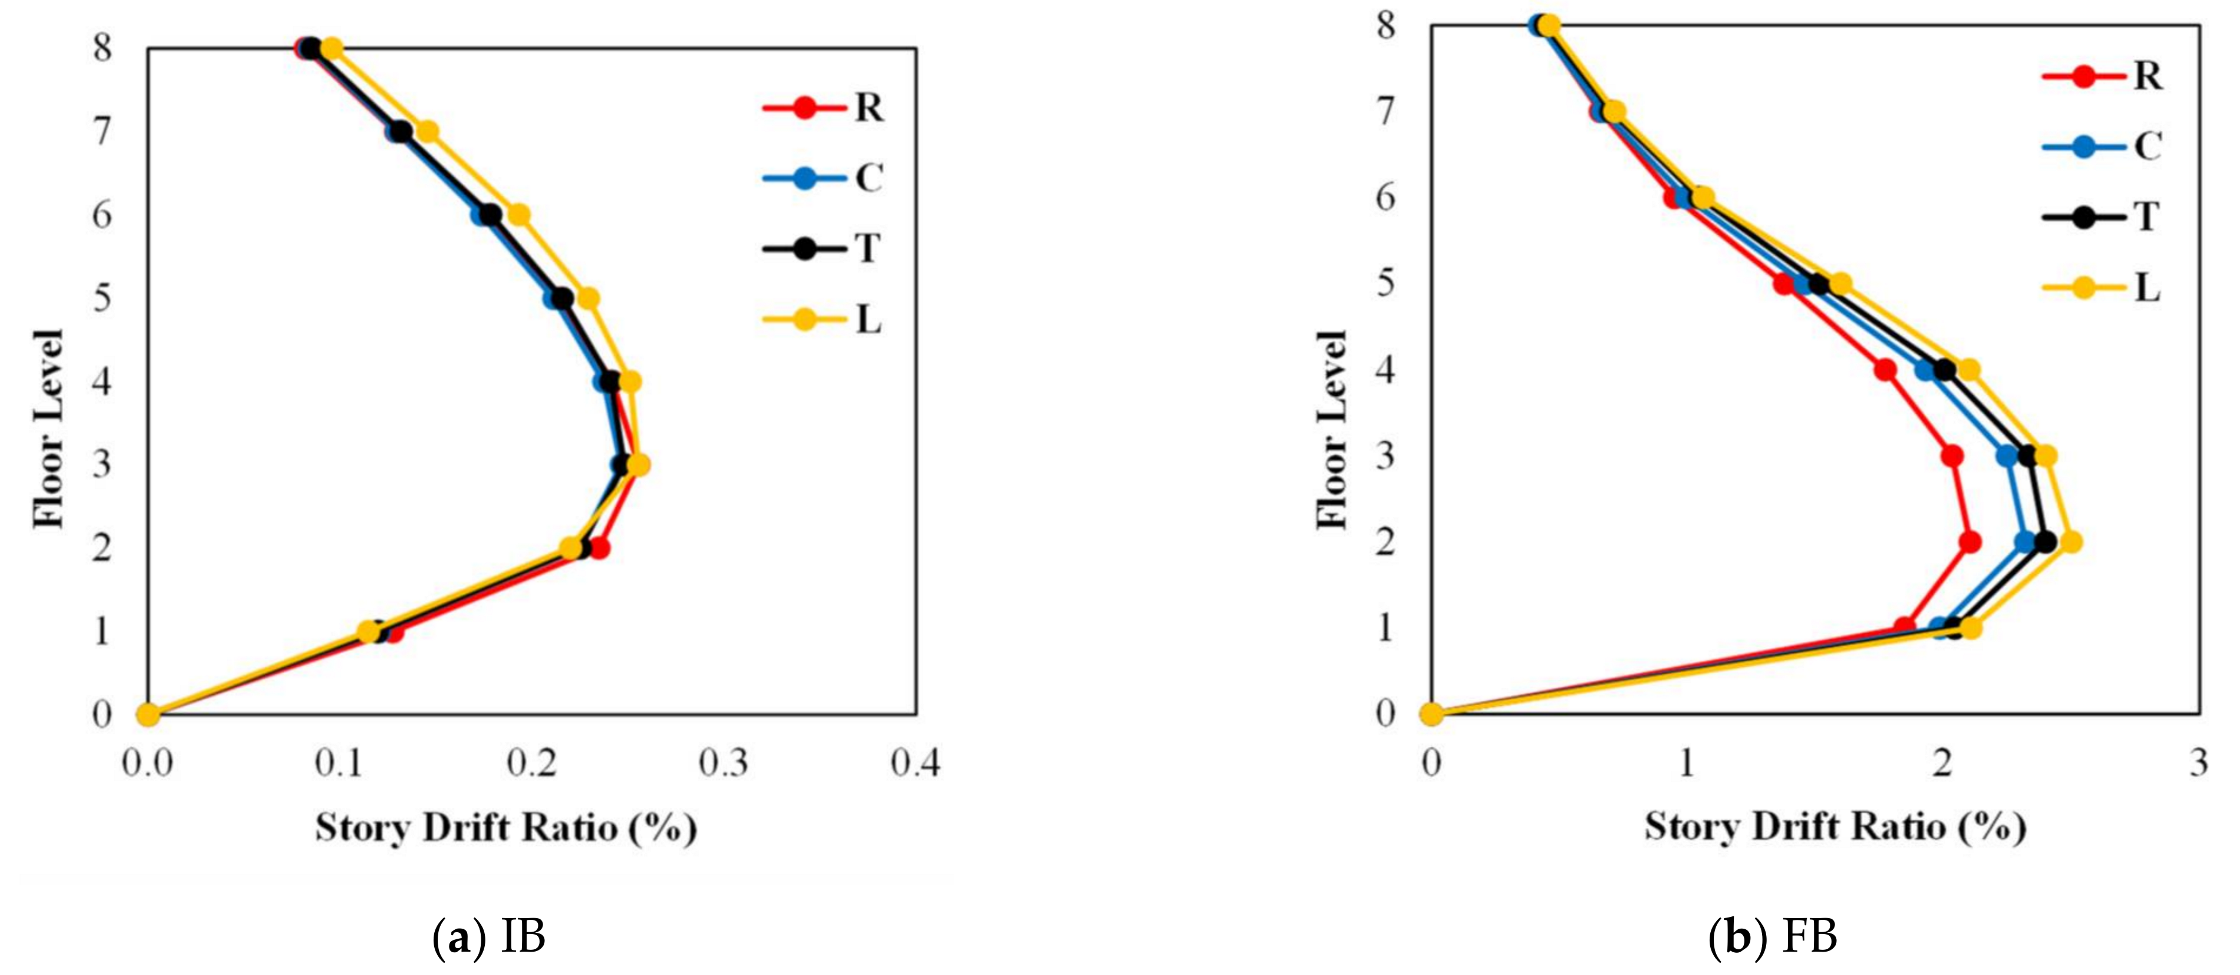
The story drift ratio results were obtained by taking the difference between the displacements obtained at each floor level and a lower floor, and by dividing it by the floor height. The story drift ratio results obtained using UB and IT analysis are presented in
Figure 13. It can be seen in
Figure 13 that the story drift ratios obtained from the TI analyses are less than the results obtained from the UB analyses. While the maximum story drift ratio difference between UB and TI for the reference model ® was 13%, the difference was obtained as 14%, 16%, and 20%, respectively, due to the increase in irregularity in C, T, and L models. That difference reaches its highest value at the second floor level for all models. The maximum of the story drift ratio results obtained for all models from the TI analyses was determined as 0.25%. That value stays under 0.50%, which is the immediate occupancy performance level given by the TBEC-2018. This comparison is presented in
Figure 14a for R, C, T, and L seismically isolated models using the TI analysis results representing the actual behavior of the isolator. It is apparent in
Figure 14a that there was a slight increase in the story drift ratios with the increase in the structure irregularity. In
Figure 14b, the story drift ratio results obtained from the fixed-base building models are given. With the increase in the structural irregularity, the results of the story drift ratio obtained at each floor increase compared to the reference structure (R). While the maximum story drift ratio was obtained for the reference (R) model as 2%, it was determined as 2.3%, 2.4%, and 2.5% for the C, T, and L models, respectively. Those values determined for irregular structures (C, T, and L) exceed the 2% value given by the codes.
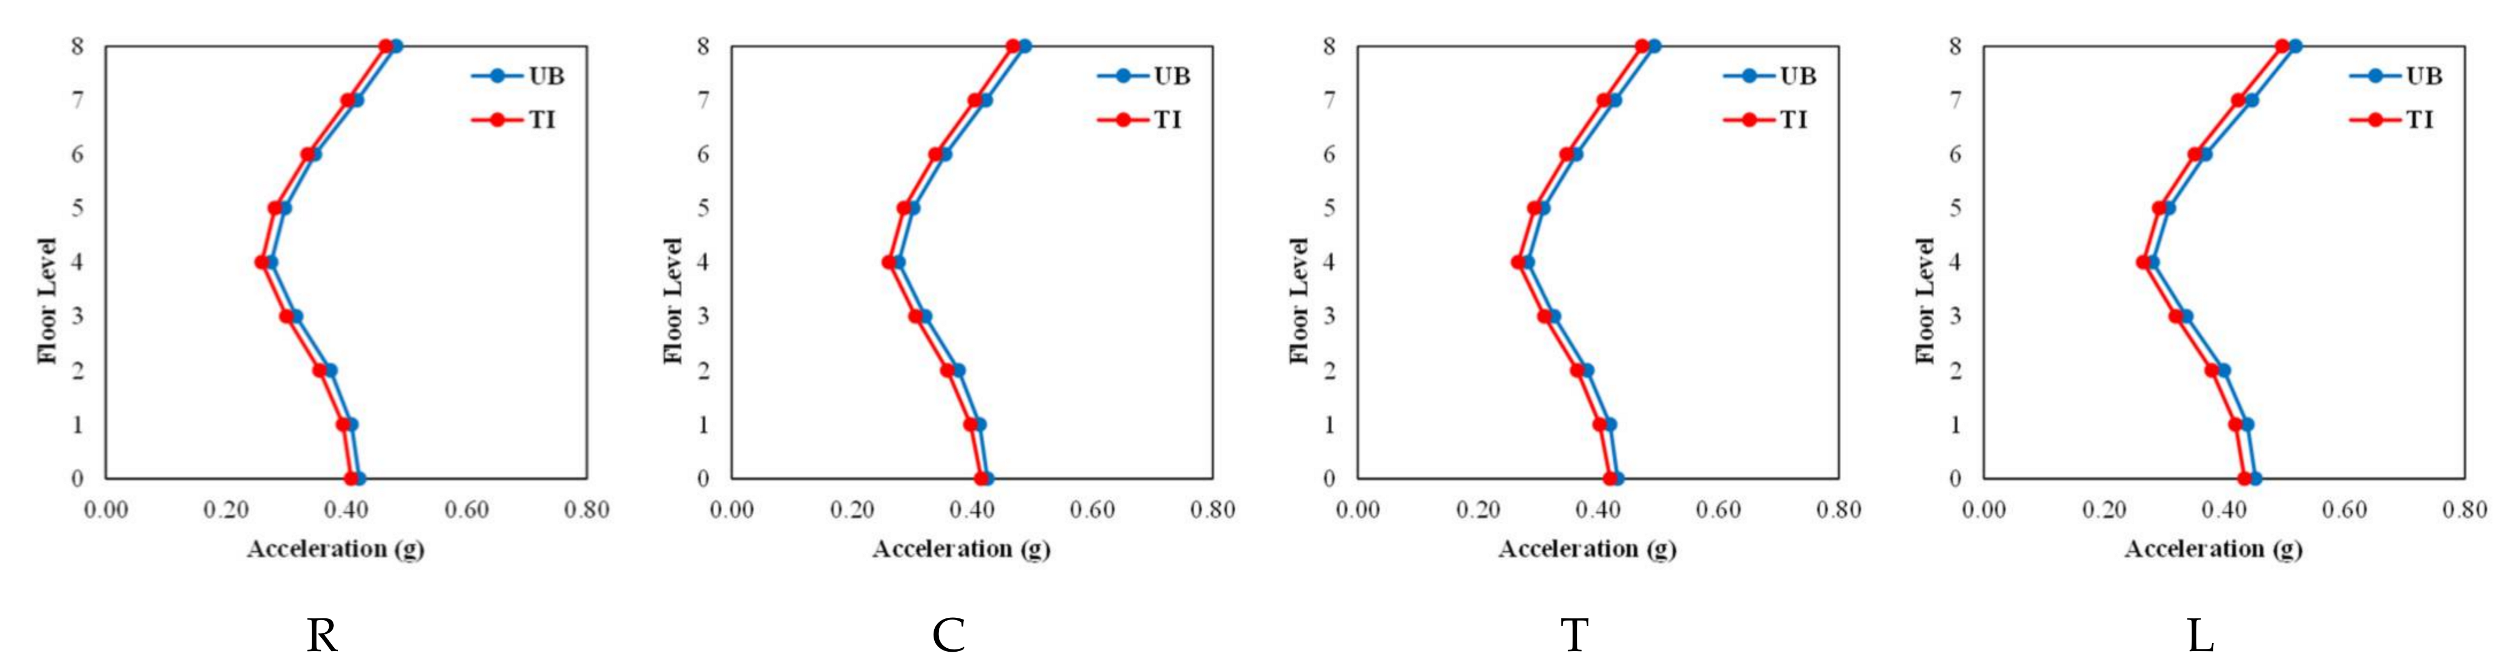
5.3. Floor Accelerations
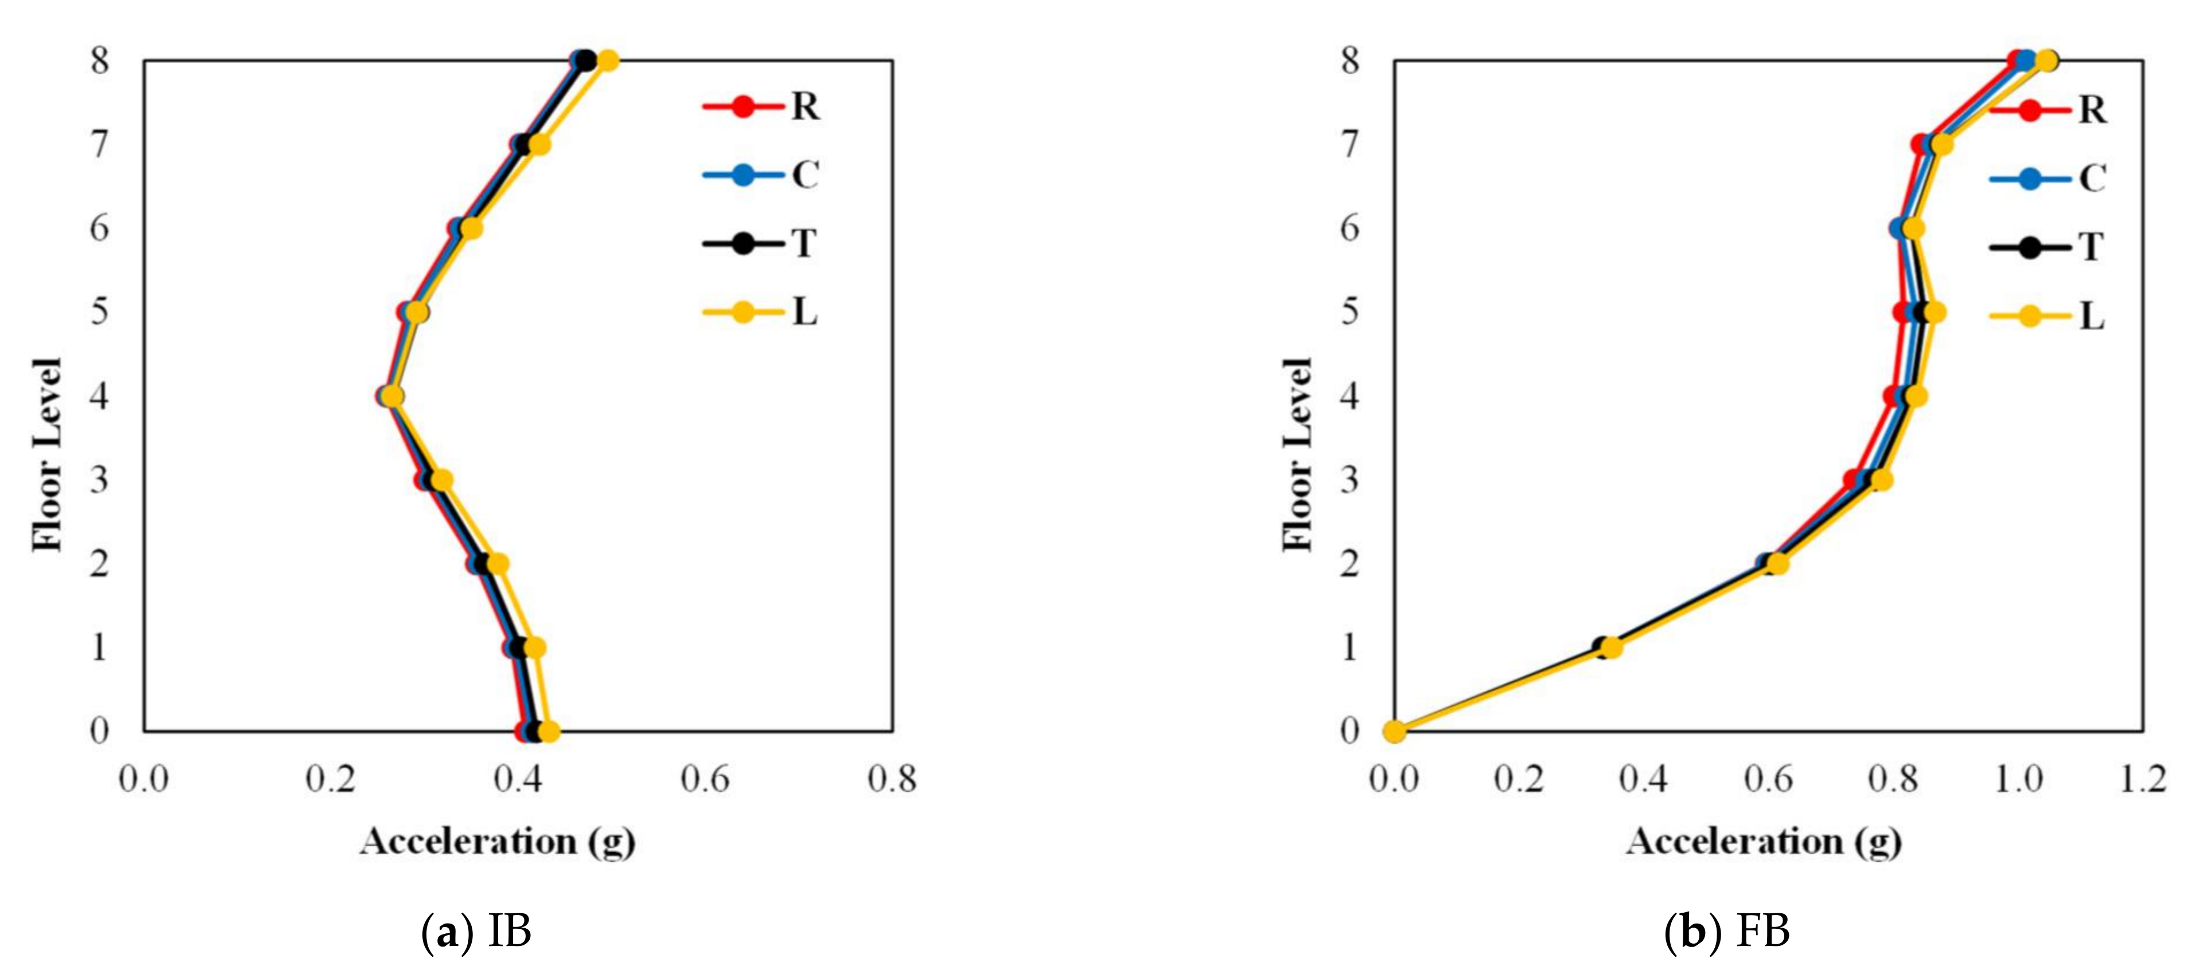
It is a fact that earthquakes demand a greater acceleration from rigid structures and a higher displacement from flexible structures. For this reason, fewer acceleration values occur in building models with seismic isolators, which are more flexible than fixed-base structures. The acceleration data obtained at each floor level of the R, C, T, and L models with seismic isolators are shown in
Figure 15 for UB and TI. While the acceleration results obtained from both analyses (UB and TI) seem very close, the acceleration values obtained from the TI analyses were slightly less than the UB analyses. The difference in acceleration values obtained in the UB and TI analyses at the isolation level and the top floor was around 3% in all models with seismic isolators. However, this difference was about 6% at the fourth-floor level. Since it represents the actual behavior of the isolator, this comparison is presented in
Figure 16a using the TI analysis results for R, C, T, and L models with seismic isolators. As can be seen in
Figure 16a, there was a slight increase in the acceleration values with the increase in the irregularity of the structure. In
Figure 16b, the acceleration data obtained from the fixed-base structure models are presented. The acceleration values obtained for each floor increase compared to the reference structure (R) with the increase in the irregularity of the structure. The acceleration values obtained from the analysis results are slightly higher than the ones expected from seismic isolated structures. In order to reduce the acceleration values in the superstructure, it is necessary to increase the isolation period and decrease the characteristic strength ratio. However, in this study, both the isolation period and the characteristic strength ratio values were kept constant and determined as 3.0 s and 0.100, respectively. Acceleration values of around 1.0 g were obtained at the top of the fixed-base structures, and this value gradually increases from the ground. Nevertheless, the acceleration value in seismic isolated structures was 0.4 g at the isolation level, 0.25 g at the middle of the structure, and 0.5 g at the top of the structure. The acceleration values obtained from the fixed-base structures are as twice that of the structures with seismic isolators.
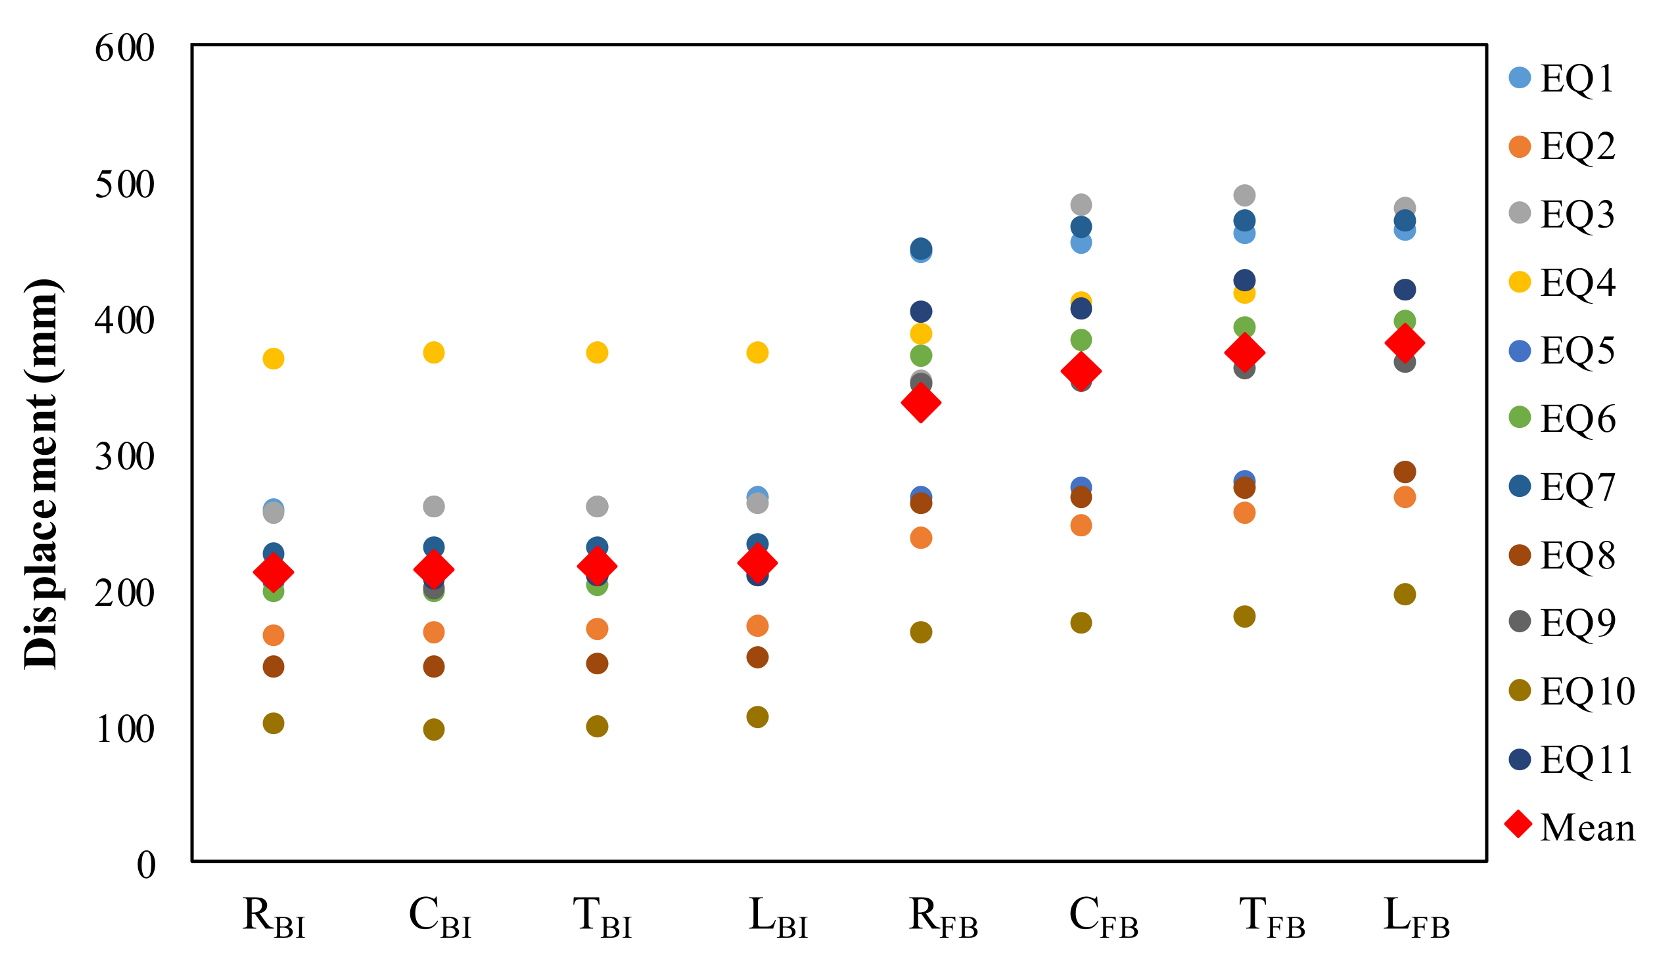
5.4. Roof Displacement and Roof Drift Ratio Results
The roof displacement values obtained from all earthquake records for all building models with isolated and fixed bases are presented in
Figure 17. In the figure, the horizontal axis shows the models with isolated and fixed bases, and the vertical axis denotes the roof displacement. Moreover, the mean values as well as the data obtained from all earthquake records are depicted in
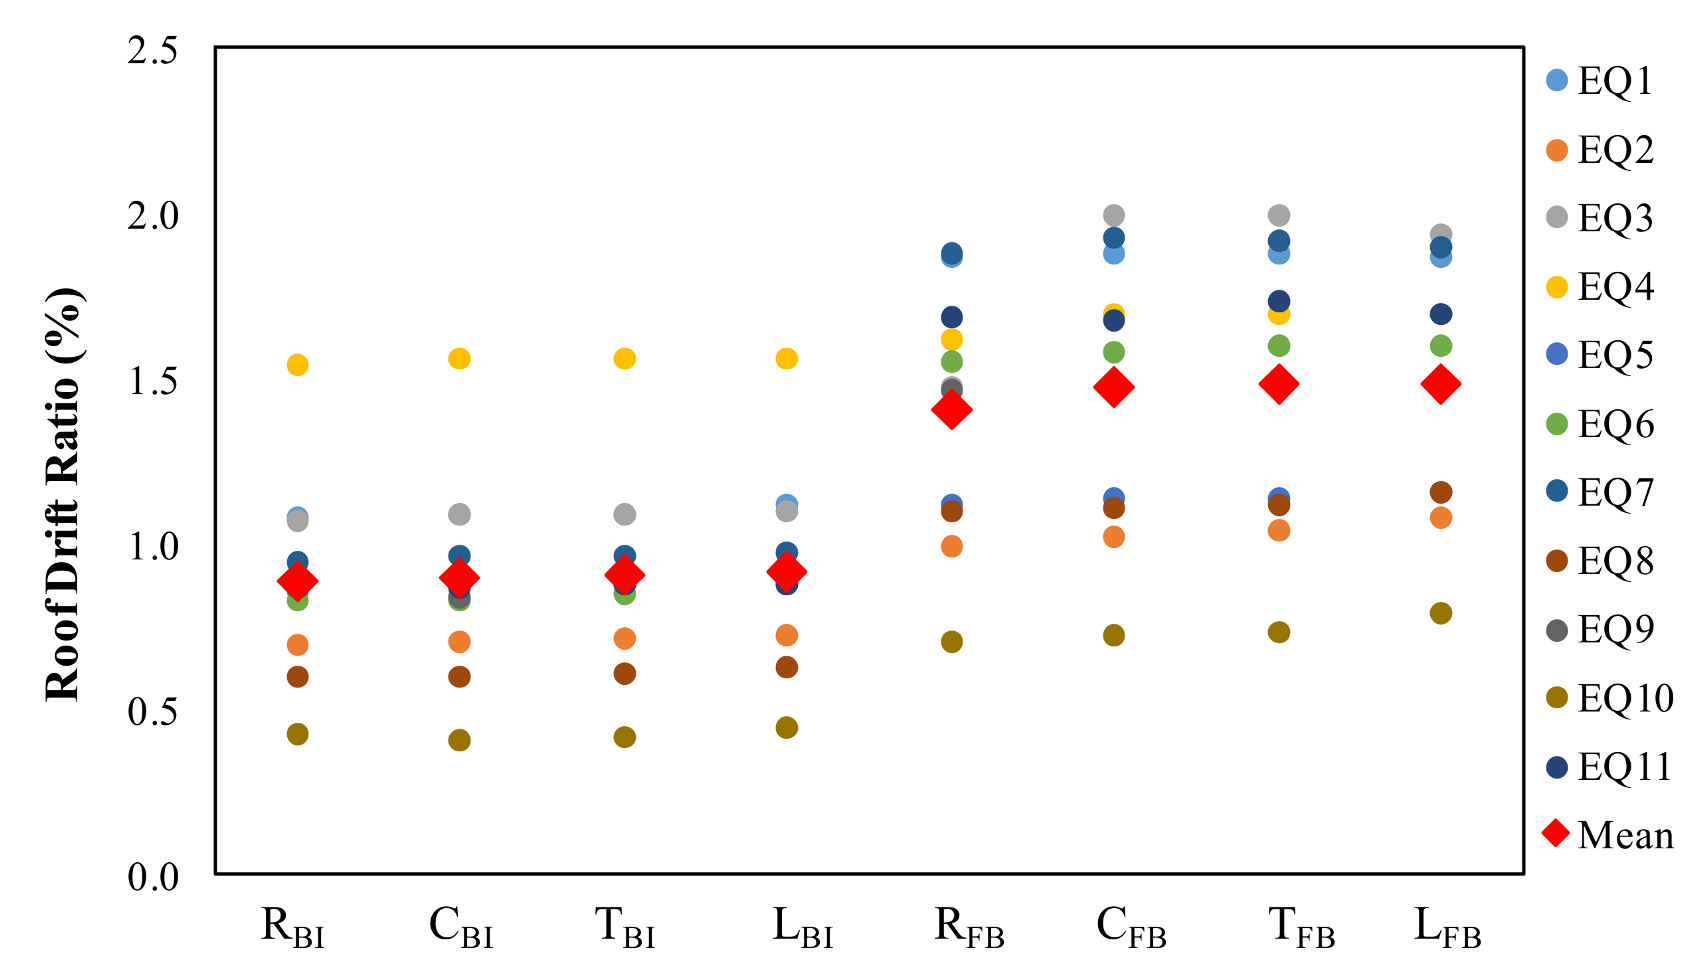
Figure 17. For models with seismic isolators, those data include results from the TI analyses because they represent actual behavior. The maximum displacement values obtained from the top of the structure for the models with seismic isolators were determined between 209–214 mm, and the maximum displacement values obtained from the top of the fixed-base structures were determined as 340–380 mm. The roof drift ratio results, obtained by dividing the roof displacement results by the total building height for all building models, are presented in
Figure 18. Here, the horizontal axis shows the isolated and fixed-base models, and the vertical axis represents the roof drift ratio results. When the average values are examined, the roof drift ratio results are around 0.9% for models with isolated bases, while they are around 1.55% for models with fixed bases.
5.5. Base Shear Ratio
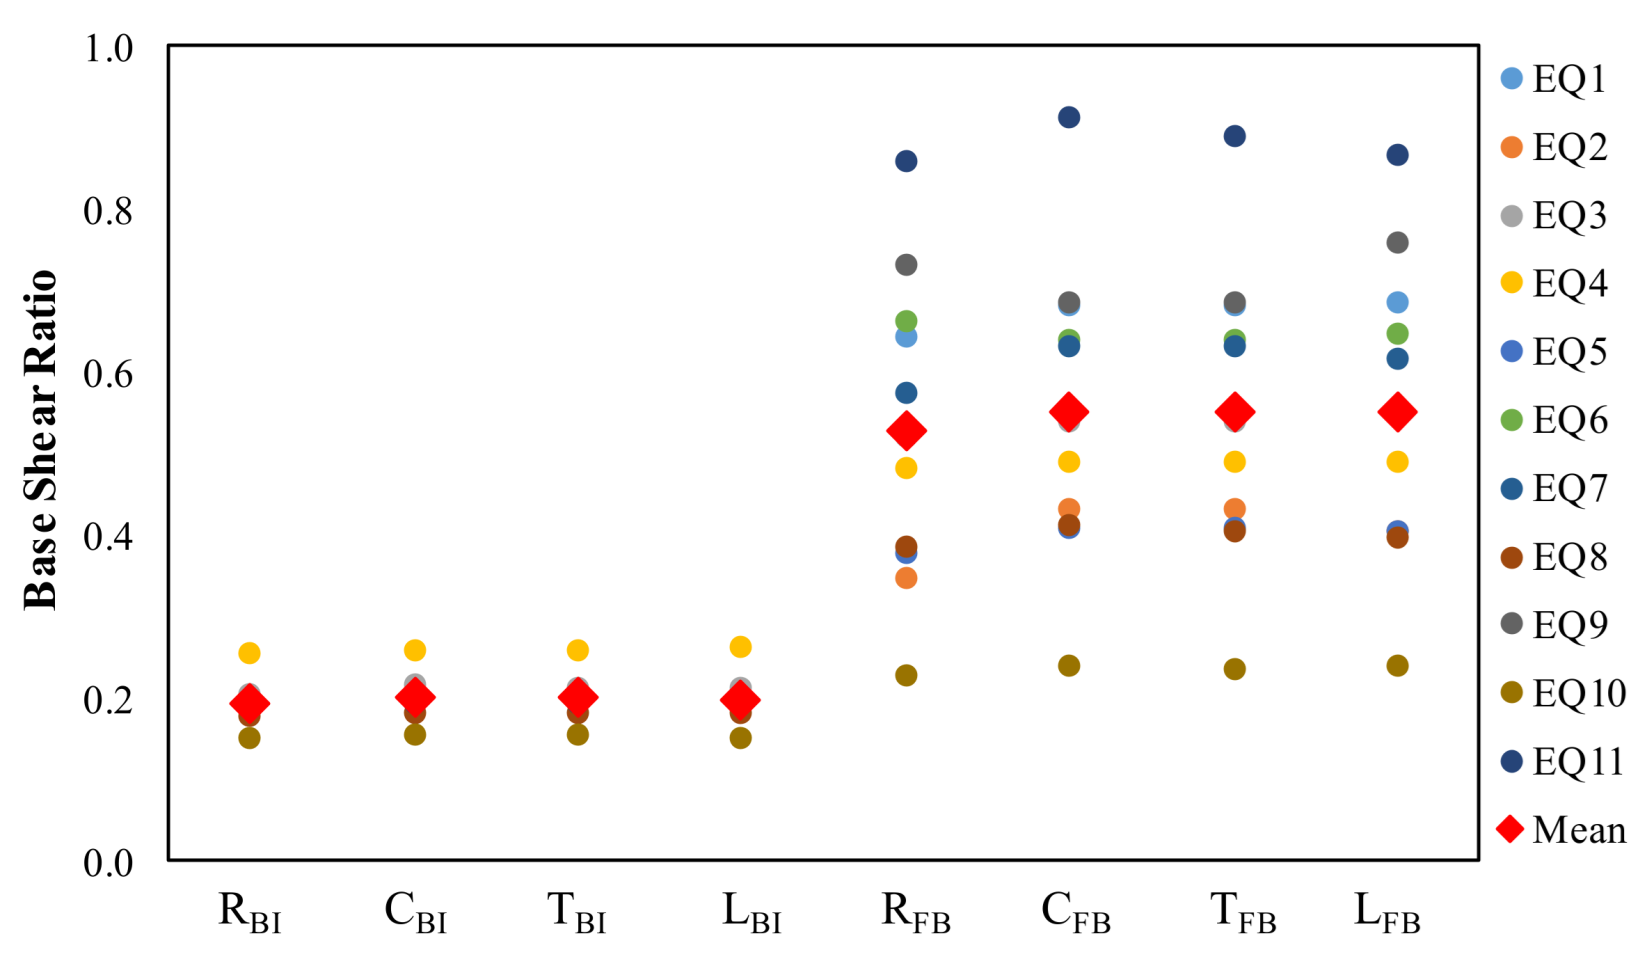
The base shear ratio results obtained by dividing the base shear force values obtained from all earthquake records by the building weight for all building models are presented in
Figure 19. Here, the horizontal axis denotes the isolated- and fixed-base models, and the vertical axis shows the base shear ratio results.
Figure 19 also presents the mean values as well as the data obtained from all earthquake records. When the average values are examined, the base shear ratio results are around 0.2 and 0.55 for isolated- and fixed-base models, respectively. Lastly, in the models with the fixed base, the shear forces were more than twice that of the models with the isolated base.
5.6. Fiber Hinge Results
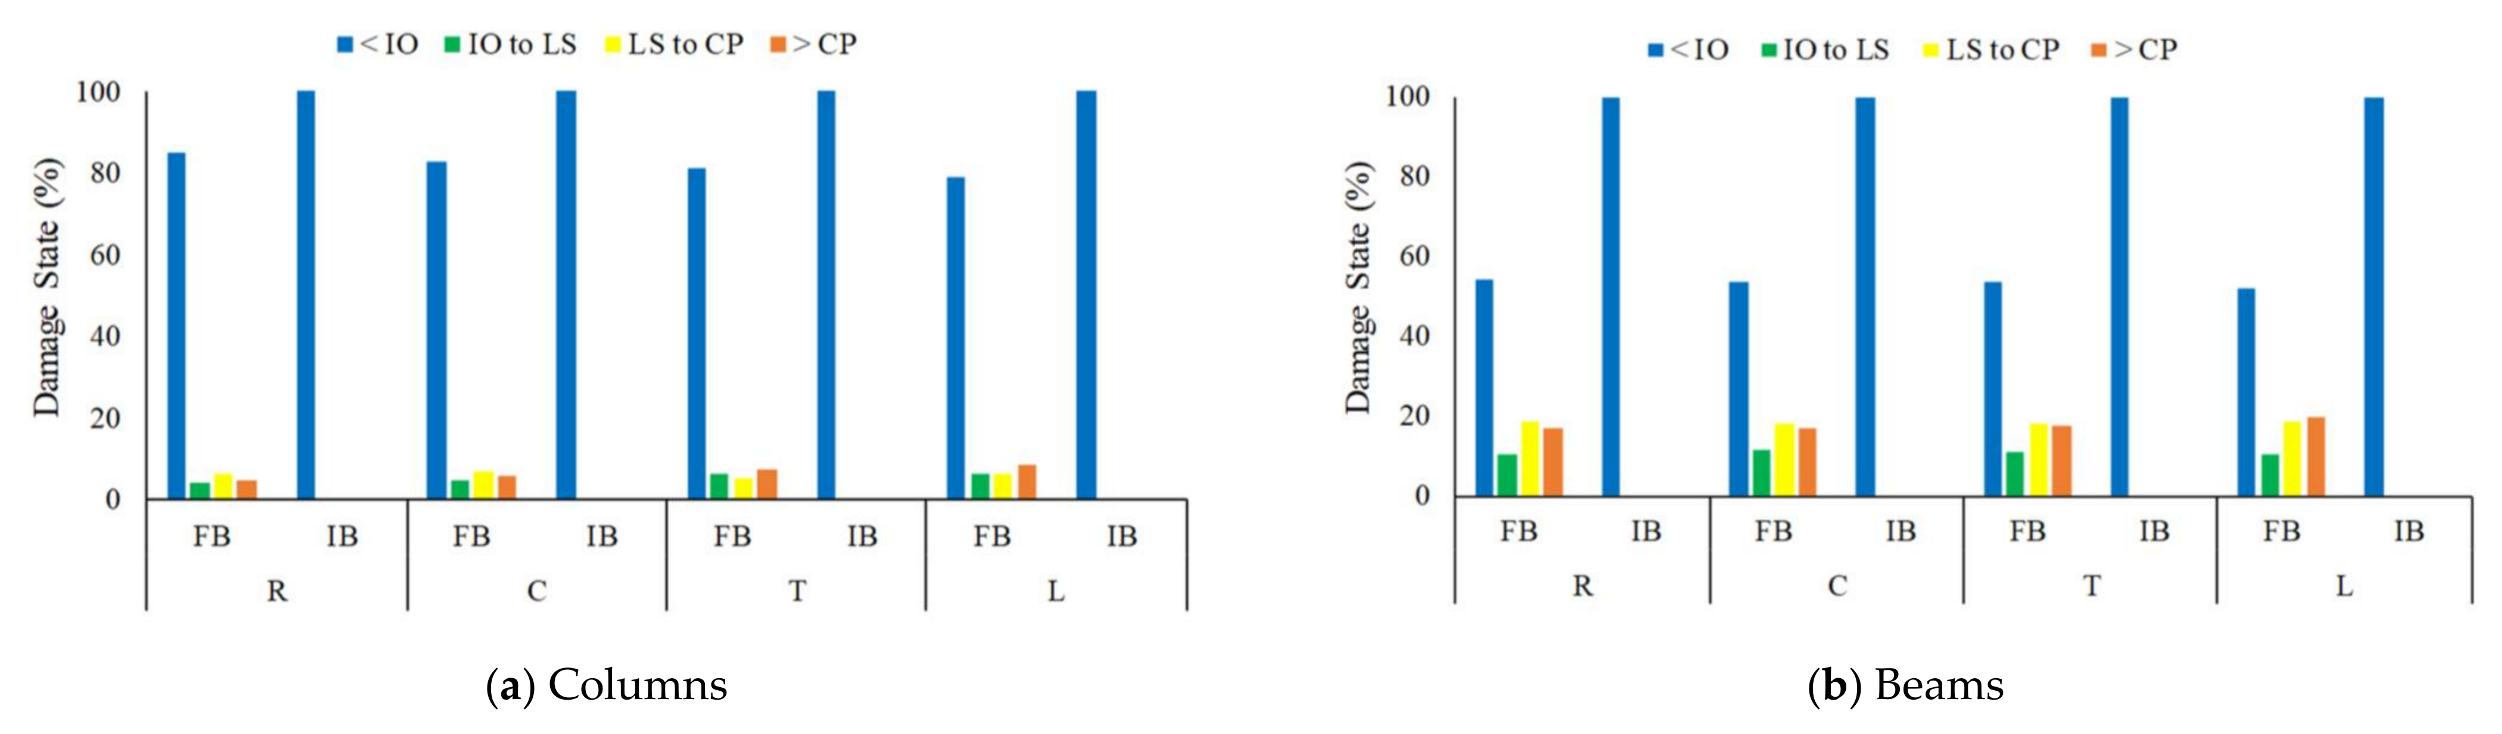
The hinge states of the structural elements under the effect of earthquakes give significant information about the performance of the structures. The damage mechanisms of the isolated and fixed-base building models were determined using earthquake records selected within the scope of the study. In order to determine the damage mechanisms of the isolated and fixed-base building models, the damage percentages of the columns and beams were obtained and are presented in
Figure 20. The IO (Immediate Occupancy), LS (Life Safety), and CP (Collapse Prevention) expressions given in
Figure 20 represent the damage limits defined for columns and beams. The number of damaged elements in columns and beams increases with the increase in irregularity in the fixed-base building models. Accordingly, while 85% of the columns stayed in the elastic region in the reference model (R), this value was determined as 83%, 81%, and 80% for the C, T, and L building models, respectively. Similarly, while 55% of the beams remained in the elastic region in the reference model (R), this value was observed as 54%, 54%, and 52% for the C, T, and L building models, respectively. Finally, it was determined that the damage mechanisms for columns and beams stayed within elastic limits, as was expected in the superstructure of the seismically isolated building models.


