Article

Development of Quality Assessment Criteria for Burnt Clay Bricks of Different Ages Based on Ultrasonic Pulse Velocity Test

1
Department of Civil Engineering, University of Engineering and Technology, Lahore 54890, Pakistan
2
Civil and Environmental Engineering Department, King Abdulaziz University, Jeddah 22254, Saudi Arabia
3
Faculty of Engineering, Cairo University, Giza 12613, Egypt
*
Author to whom correspondence should be addressed.
Buildings 2022, 12(8), 1069; https://doi.org/10.3390/buildings12081069
Submission received: 26 May 2022 / Revised: 18 July 2022 / Accepted: 20 July 2022 / Published: 22 July 2022

Abstract

:
Burnt clay bricks are widely used as a construction material in Pakistan, and their testing for quality confirmation is frequently needed for new and old bricks used in existing structures. The destructive testing methods are time-consuming and not always feasible for testing the bricks used in existing structures. The current study investigated the feasibility of using the ultrasonic pulse velocity (UPV) test as a non-destructive technique to assess the quality of both new and old bricks in masonry structures. A relationship was developed after performing the UPV test followed by a compression test on burnt clay brick samples of five different ages acquired from different sources. The acquired brick samples ranged from new to a century old. Consequently, as a novel contribution, brick quality assessment criteria based on UPV were proposed according to which a UPV value greater than 3000 m/s represents an excellent first-class brick whereas a UPV value lower than 2000 m/s shows a second-class brick. Further, the effectiveness of the UPV test to assess the compressive strength of old bricks was demonstrated with a case study of a 100-year-old masonry structure. The research concluded with the remarks that the compressive strength of bricks can be assessed with reasonable accuracy using the UPV test. The developed quality assessment criteria can be used to quickly check the quality of new and old burnt clay bricks.

1. Introduction

Burnt clay bricks have largely been used in ancient construction practices and their use is still frequent in building construction nowadays. Currently, 82.5 billion bricks are being produced in Pakistan annually from more than 18,000 brick kilns and 90% of these bricks are used for domestic consumption [1]. As a construction material in Pakistan and many regions around the world, burnt clay bricks are commonly used to construct residential buildings of three to four storeys high. Not only is the burnt clay brick the common construction material for new construction, but for old structures, it has been a major material of construction in Pakistan, and 62.38% of the total built environment in Pakistan is currently comprised of burnt clay bricks [2]. Historically, other than their use in the construction of residential, religious, and defense structures, burnt clay bricks have been in use as a construction material for bridges, culverts, soling of roads, brick flooring, and lining of water channels.
Locally, the bricks have been manually manufactured in brick kilns by laborers and their properties are largely dependent on human factors, the type of clay, and the temperature of the brick kiln [3,4]. This leads to the available bricks in the local market having different properties and quality [5], for which testing of these bricks is generally needed to ensure the required quality. Testing of the new bricks is also needed to ensure the specification requirements. For this purpose, destructive testing of the bricks in material testing laboratories is one option, but this is a time- and resource-consuming option [6,7] and does not remain useful where a quick selection of required quality bricks is needed among several available options. Moreover, the available destructive techniques are generally not suitable for the existing structures [8], especially for the heritage masonry structures, which often have significant heritage value, and acquiring brick samples from these structures for destructive testing is not possible. To avoid the lengthy standard process of the compression test for the bricks and the issue of the availability of test samples for the existing masonry structures, non-destructive testing (NDT) is a useful option that can quickly assess the quality of new as well as existing brick samples [9].
Several NDT techniques such as visual inspection, core cutting [10], rebound hammer (RH) [11], XRD analysis [12], laser testing methods (LM) [13], infrared spectrometry [14], and ultrasonic pulse velocity (UPV) testing [11,15,16] have been developed over the years for testing both concrete and masonry structures. These techniques have been mainly used for concrete [6,17]; however, they can provide an idea about the strength and quality of bricks and masonry without any serious damage in a very short time. This study limits its research radar to the UPV test because of the simplicity and user-friendly nature of the test, the possibility of testing the brick as an individual unit as well as when it is part of a structure, the possibility of testing a brick unit when only one of its faces is exposed by using indirect transmission, and, more importantly, due to its wide-spread acceptance and the availability of relevant equipment and expertise in the local construction industry as compared to the other NDT techniques.
The UPV test is based upon the material’s density and elastic properties, which are directly related to the material’s strength and quality. Several research studies have been conducted on the utilization of the UPV test for checking the quality of bricks and for predicting their compressive strength. Many researchers have exercised the UPV test on different sorts of bricks available in their regions. From region to region, bricks vary in shape, size, constituents of raw materials, and method of preparation. In 2012, Aliabdo et al. [17] tested building stones and two types of brick (burnt clay bricks and lime sand bricks) with a Schmidt hammer and UPV test. The relationship between non-destructive test results and the compressive strength of bricks and stones was investigated. In this regard, both linear and non-linear models were proposed. It was suggested that linear models offer results close to reality, and they concluded that the evaluation of brick masonry using a Schmidt hammer and UPV test in a combined test method was more reliable than using these techniques alone. In a similar study, Brozovsky [11] concluded that the combination of non-destructive techniques (UPV and Schmidt hammer) can provide more reliable results. A combination of the UPV test and rebound hammer method was referred to as SonReb. Calcium silicate bricks were tested. Combined non-destructive testing came out to be a bit more accurate than sole NDT testing. In another study, Brozovsky et al. [18] used the UPV test to evaluate the strength of bricks in historic structures in the Czech Republic. When the direct transmission of UPV was not possible, a semi-direct transmission was used. They concluded that the difference in UPV values in these two transmission versions ranges from 3 to 5%. Koroth et al. [6] assessed the durability of burnt clay bricks using the UPV test. Durable and non-durable bricks were identified in this way. Experimental results were validated using a different set of bricks. Bricks with a UPV less than 1000 m/s were referred to as non-durable bricks. In another study conducted in 2019, Noor-e-Khuda and Albermani [19] investigated the mechanical properties of clay masonry units using the destructive and UPV tests. Fifty-two bricks from different sources in Australia were tested, and it was concluded that the UPV test can successfully differentiate between old and new bricks. In 2017, Dizhur et al. [4] assessed both the mechanical and physical properties of vintage burnt clay bricks using non-destructive techniques along with XRD analysis. The relationship between the non-destructive technique and compressive strength was explored. Brick samples were collected from 11 different field sites. An apparent porosity test, Schmidt hammer test, XRD analysis, scratch test, modulus of rupture test, modulus of elasticity test, and a UPV test were performed on all samples. They concluded with a good performance of the Schmidt hammer and UPV tests with the hindrance of the need for surface preparation for these tests. Mesquita et al. [20] applied the UPV test for the NDT of ancient clay brick walls using the indirect transmission of UPV and found the UPV test to be useful for the health assessment of walls. Vasanelli et al. [21] tried to develop the UPV and compressive strength of bricks’ relationships using the cross-validations procedures to take the advantage of the simplicity of the UPV test for predicting the compressive strength of bricks. In another study, Ozkan and Yayla [22] established a correlation between the physical properties and UPV value of samples of brick-making clay, fired at temperatures varying between 850 and 1100 °C. They found the existence of a relationship between the physical properties and UPV values of the fired clay samples. Similarly, in a recent study, Araujo et al. [23] performed destructive and non-destructive tests on historical Brazilian clay bricks and concluded that the UPV can be successfully used for the physical and mechanical characterization of the Brazilian historical clay bricks. Other than burnt clay bricks, the UPV test has also been used for assessing the compressive strength of different types of masonry units, such as earth blocks [24,25], adobe bricks [26], autoclaved aerated concrete units [27], etc.
The research studies mentioned above prove the usefulness of the UPV test for ascertaining the quality of masonry and for determining the compressive strength of new as well as old bricks. Burnt clay bricks, historically as well as currently, are widely being used as a construction material in Pakistan. There is also a common practice of reusing the bricks obtained from the dismantling or upgrading of old masonry structures. A review of the literature shows that the studies developing the correlations between the UPV value and the brick compressive strength have been mainly limited to Europe [23], and there is a lack of research on developing a relationship between the compressive strength of the burnt clay bricks and their UPV value, especially for southeast Asia where burnt clay brick is a widely used construction material. Moreover, there is no quality assessment criterion based on UPV value that can be directly used for assessing the quality of the bricks of different ages or during the selection of new bricks. Hence, the current study aims at developing a relationship between the compressive strength of bricks, which can be used as a quick and easy way of distinguishing different classes of bricks (first, second). To achieve the intended purpose of NDT, UPV tests were performed on different brick specimens of different ages and from various sources to find out their strength and determine a strength evaluation criterion for the bricks used in existing structures. The limitations of this study are the use of standard size bricks only and not investigating the effect of moisture content and porosity of the bricks.
The content of this paper is as follows. Firstly, the materials and methods used are discussed in detail. Then, the results of using both the UPV and compression tests are presented for bricks of different ages collected from different sources, and correlations between UPV and compressive strength are drawn. Based on the results, quality criteria for assessing the first-class bricks based on the UPV test are presented. Lastly, the effectiveness of the developed correlations is proven with the help of a case study of a 100-year-old building.

2. Materials and Methods

In this study, first-class brick samples of different ages were acquired and tested using both UPV and compression testing to develop relationships for assessing the compressive strength of bricks based on UPV value. Moreover, the limiting values of UPV are proposed to categorize bricks based on the UPV value.

2.1. Materials

Burnt clay brick samples were collected from seven sources (three sources of new bricks and four sources of old bricks). A total of sixty possibly first-class new bricks were collected from three local brick kilns (20 bricks from each kiln). A total of 30 old bricks were collected from four different existing structures (7 bricks from a 25-year-old building, 10 bricks from a 35-year-old building, 8 bricks from a 75-year-old building, and 5 bricks from a 100-year-old building). These bricks were collected from different parts of Lahore city from old buildings going through renovation works. The number of brick samples for old bricks depended upon how many bricks were allowed to be studied by the owner of the building. The bricks were cleaned and the attached mortar from the surface was removed. All the bricks had a nominal size of 228 mm × 114 mm × 75 mm, which has been the common brick size since the British colonial period. However, the actual size of these bricks was measured and used for the calculation of density, UPV, and compressive strength. For this purpose, three independent readings along each of the three dimensions of the brick were taken and their average was used. Table 1 shows the details of all the test specimens, including their dimensions and density values. The density of the bricks was determined as per ASTM C 67 [28]. The bricks were firstly dried in a ventilated oven at 110 °C for 24 h. After drying, the bricks were allowed to gradually cool to room temperature. The bricks were then weighed using a 0.5 g accuracy weighing balance and the density was calculated by dividing the weight of the bricks by the volume calculated by multiplying the average dimensions of the bricks, as mentioned earlier.

2.2. Methods

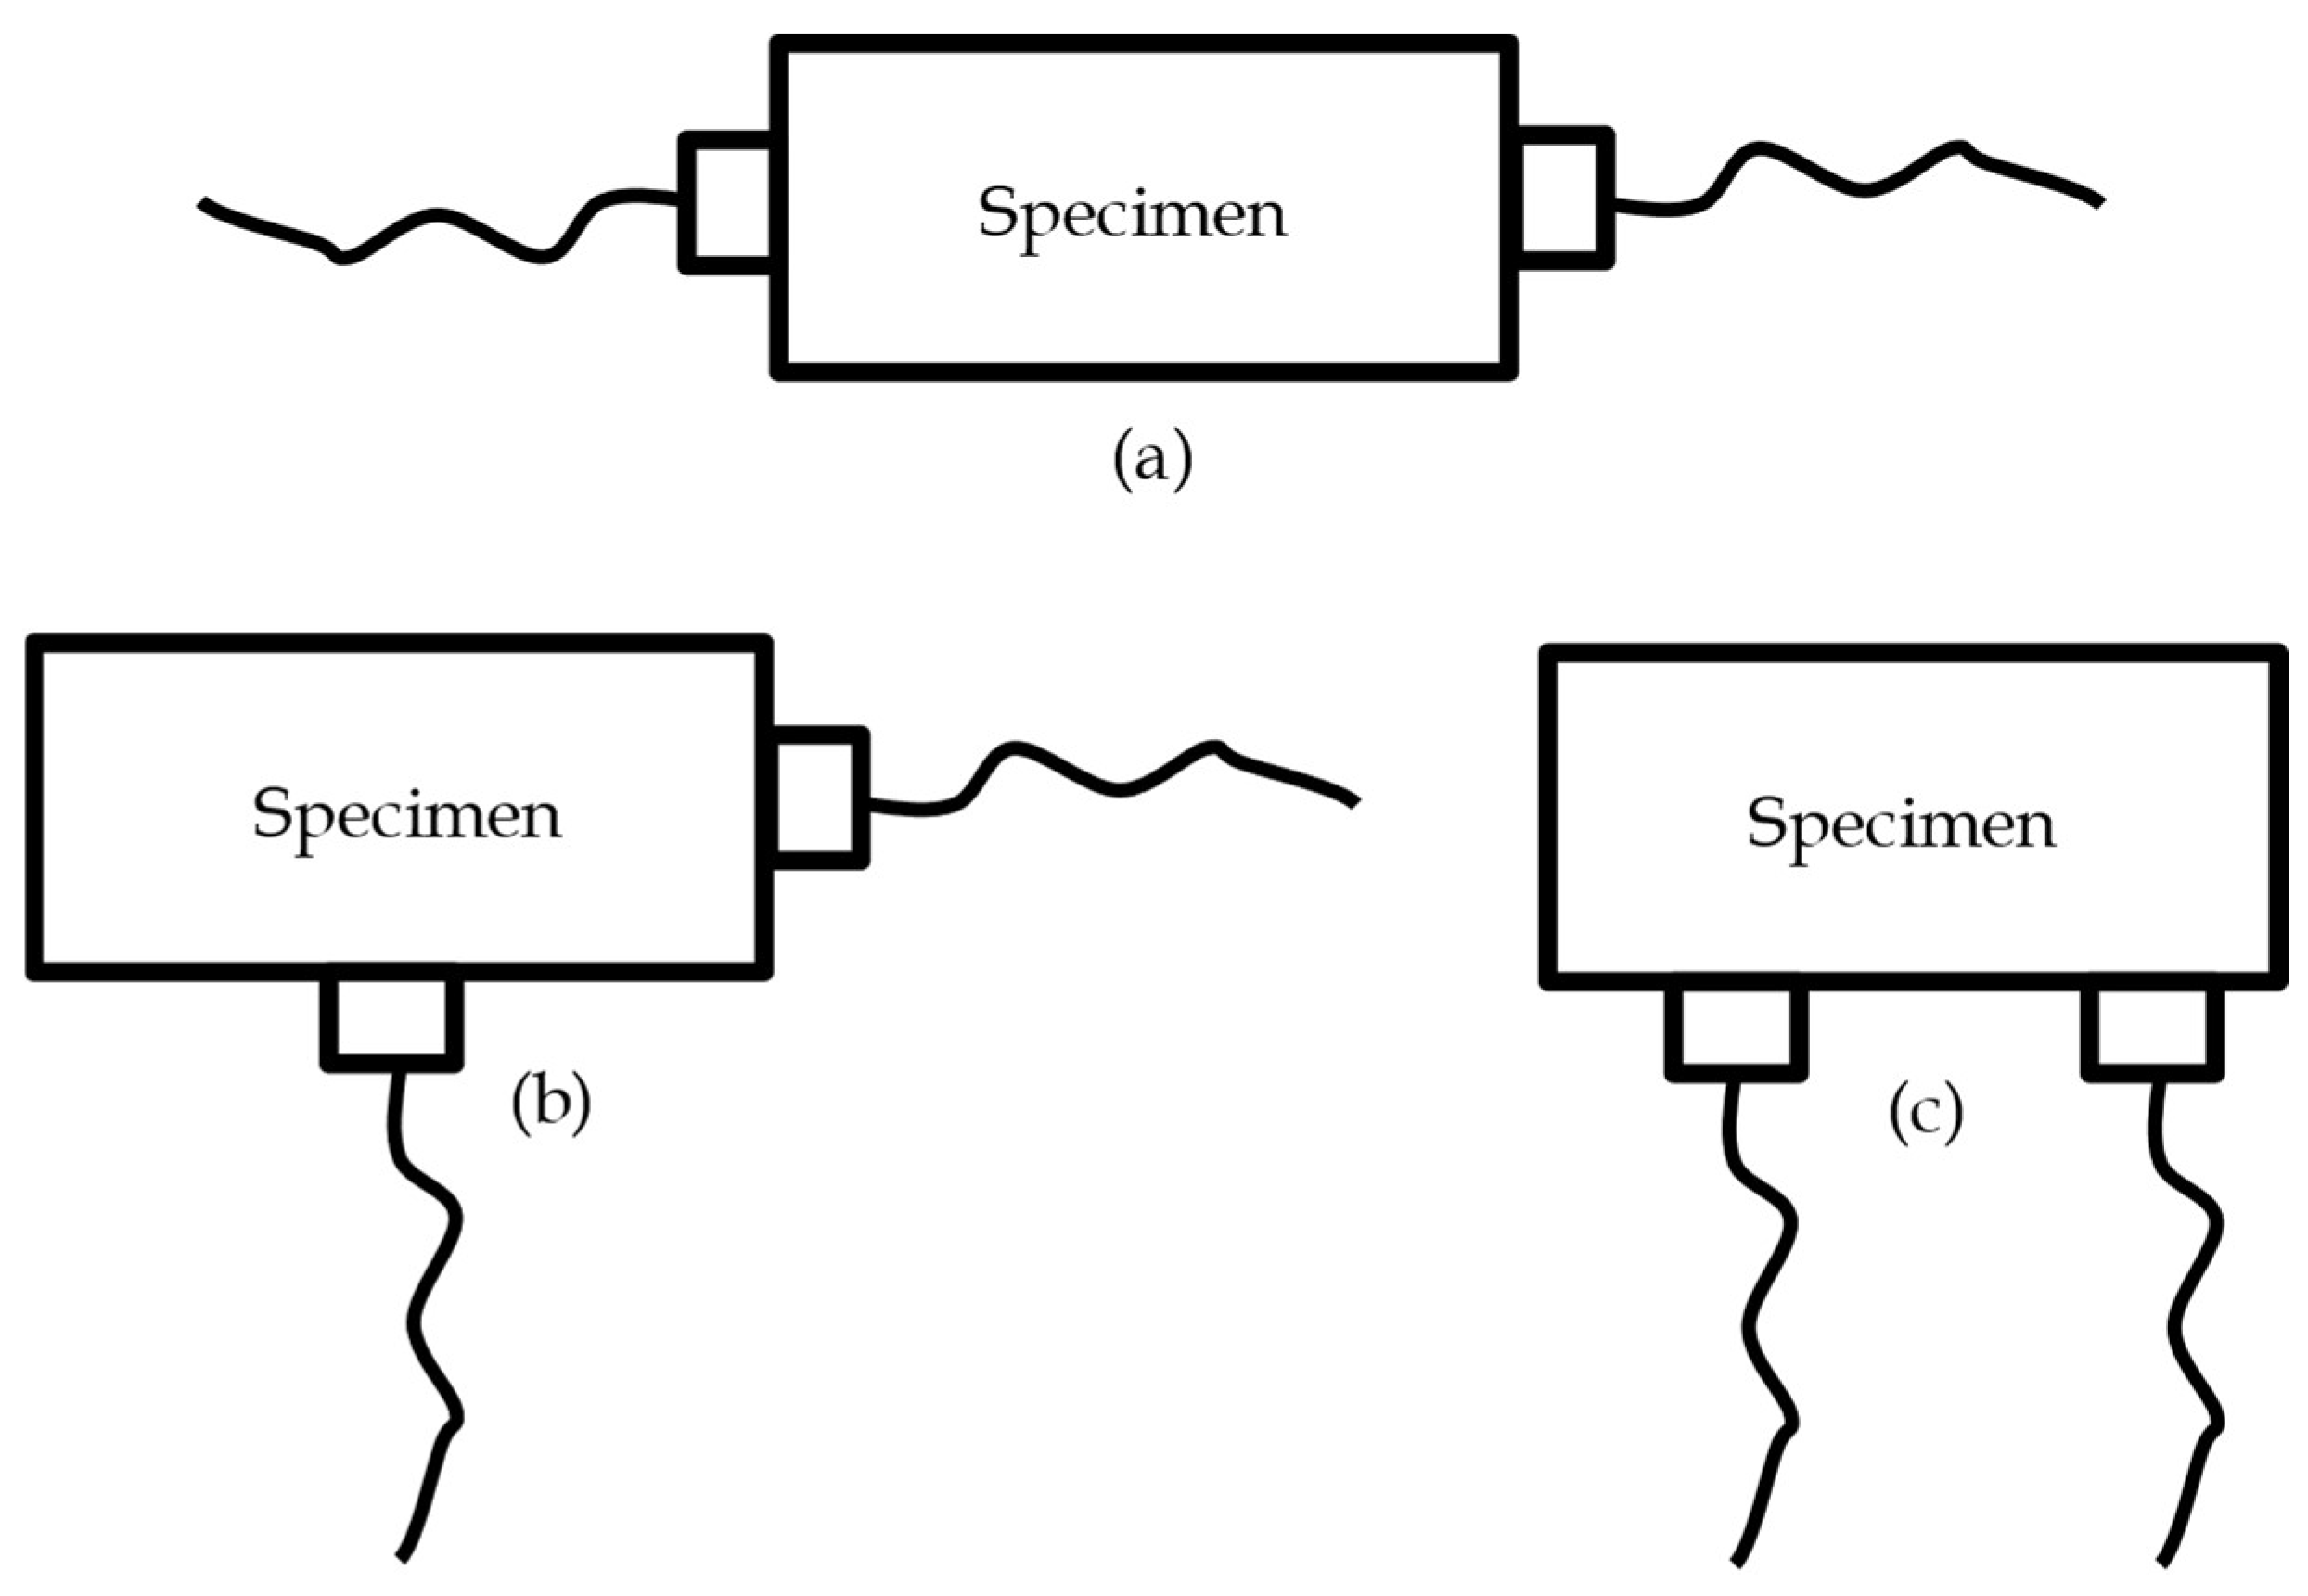
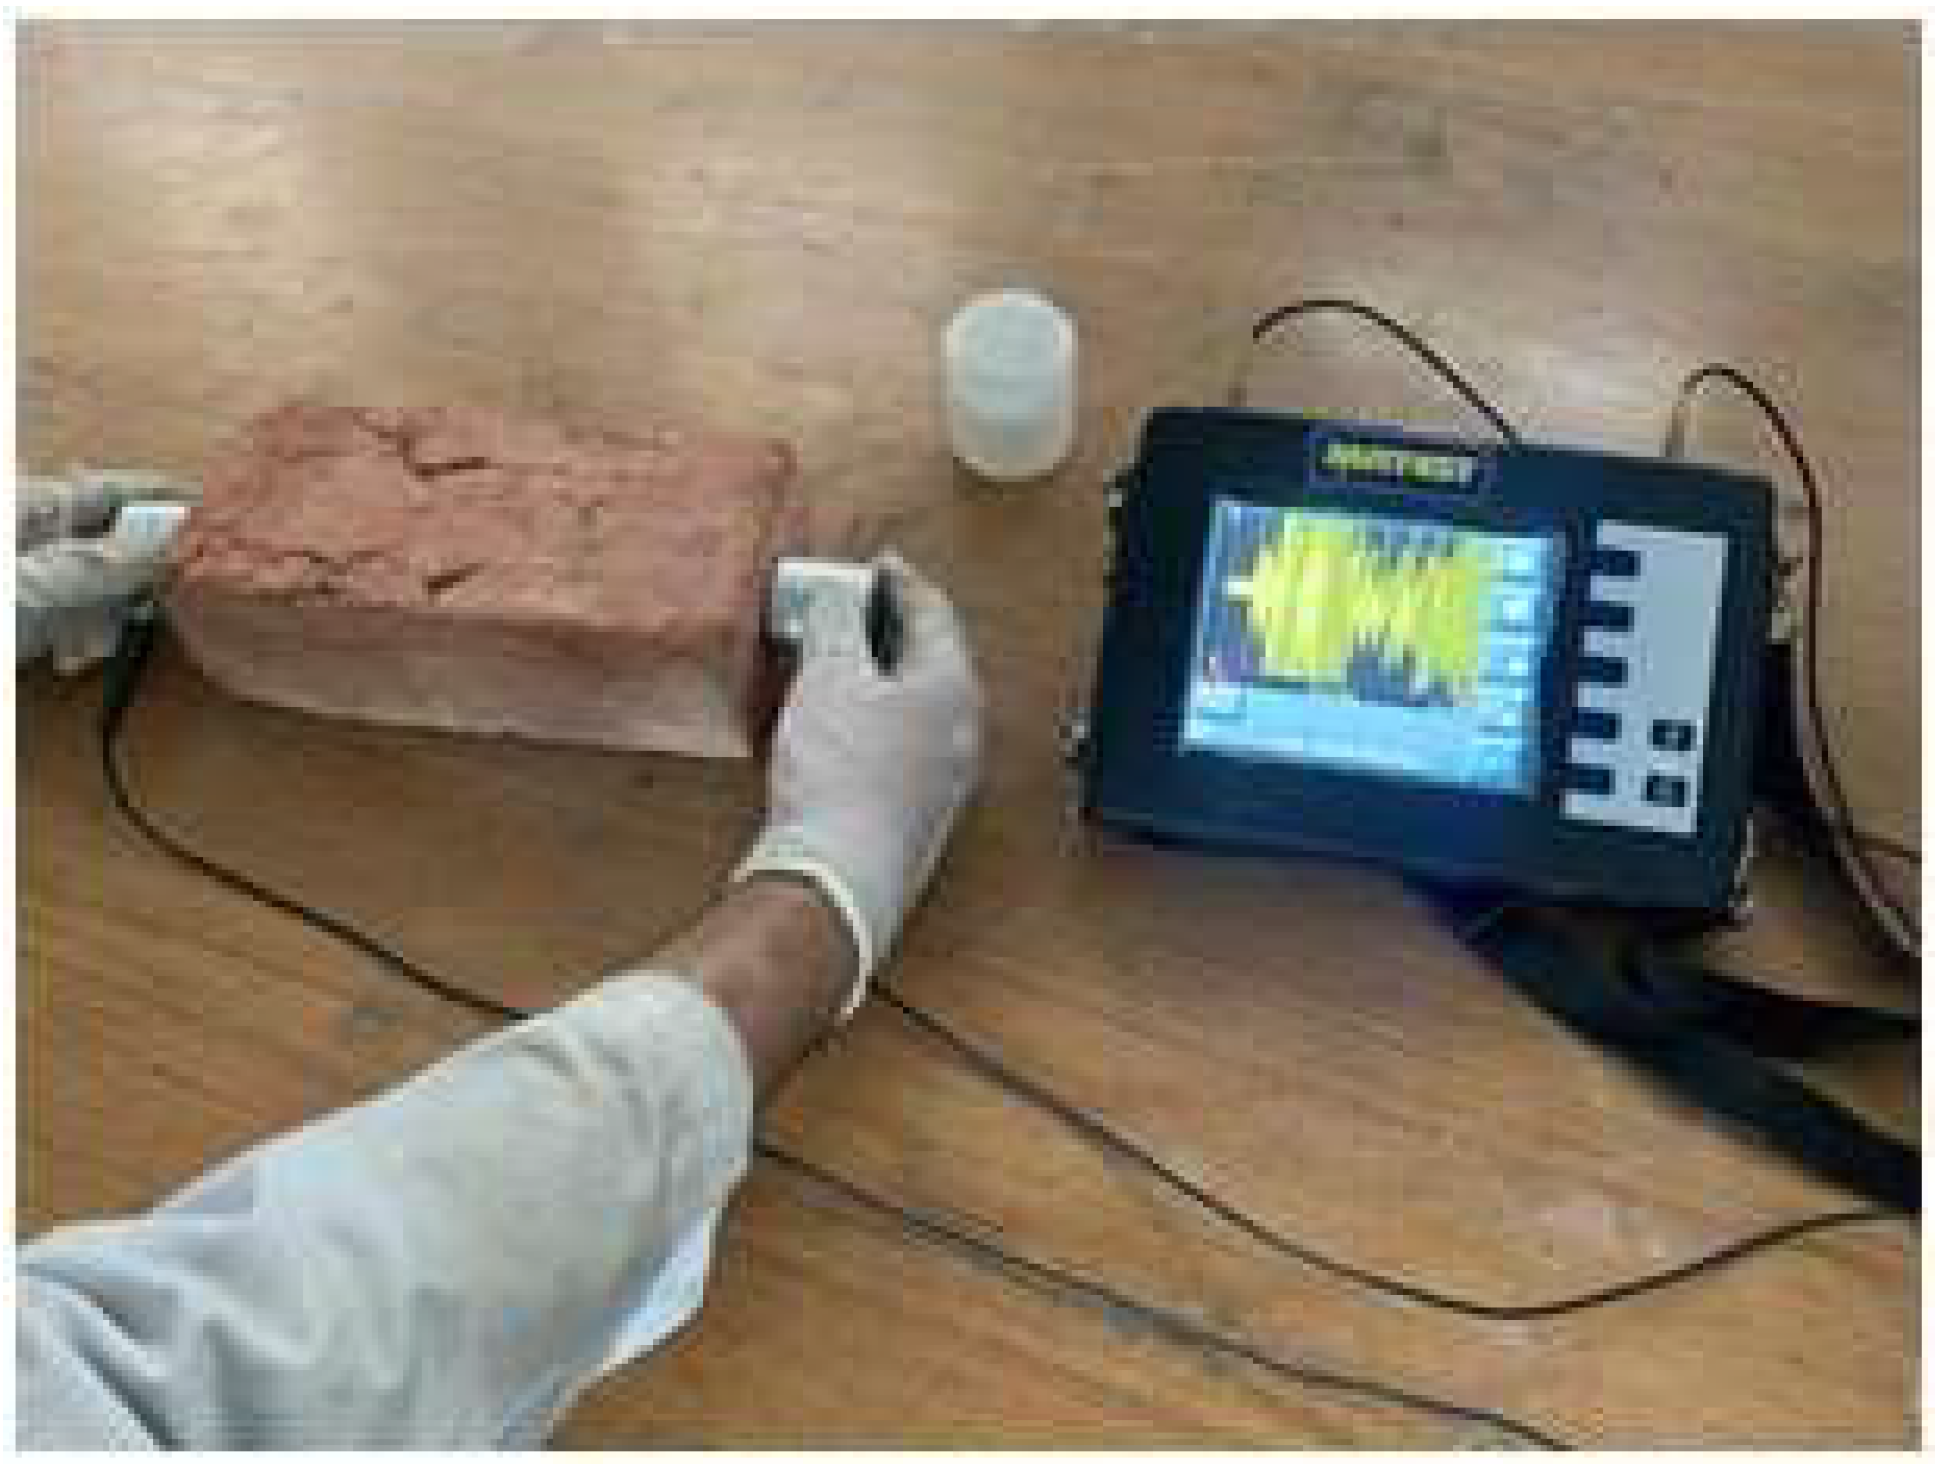
2.2.1. UPV Measurement

The UPV method has been successfully used to evaluate the quality of building materials for over 50 years [29]. This test method is applicable to assess the uniformity and relative quality of bricks, indicate the presence of voids and cracks, and evaluate the effectiveness of crack repairs. It is also applicable to indicate changes in the properties of bricks and, in the survey of structures, to estimate the severity of deterioration or cracking. An advantage of this test is the flexibility in its application for existing structures using different types of test arrangements of the transmitter and receiver, as shown in Figure 1.
For this study, the UPV test was performed on all the brick samples following the guidelines of ASTM C597 [30], where a smooth surface of the specimens is essential. Thus, the surfaces of all the samples were scrubbed, and the samples with a scrubbed surface are shown in Figure 2. A UPV test instrument with two 55 kHz transducers and standard Cod. C 370-07 couplant gel was used for all the tests. The test setup is shown in Figure 3. Before each series of UPV tests, the calibration of the instrument was checked using the standard 42.5 μs calibration rod along with the same couplant gel in order to ensure the accuracy of all the readings. The test was performed by placing the transducers on the opposite ends of the 228 mm dimension of the bricks (Figure 3), and the time of travel of the wave between the two transducers was noted. The UPV values were then calculated by dividing the length of each specimen by its corresponding travel time reading and the values are mentioned in m/s throughout this study. Further, it was ensured that the transducers were placed below the depth of frog indentation for all the bricks.

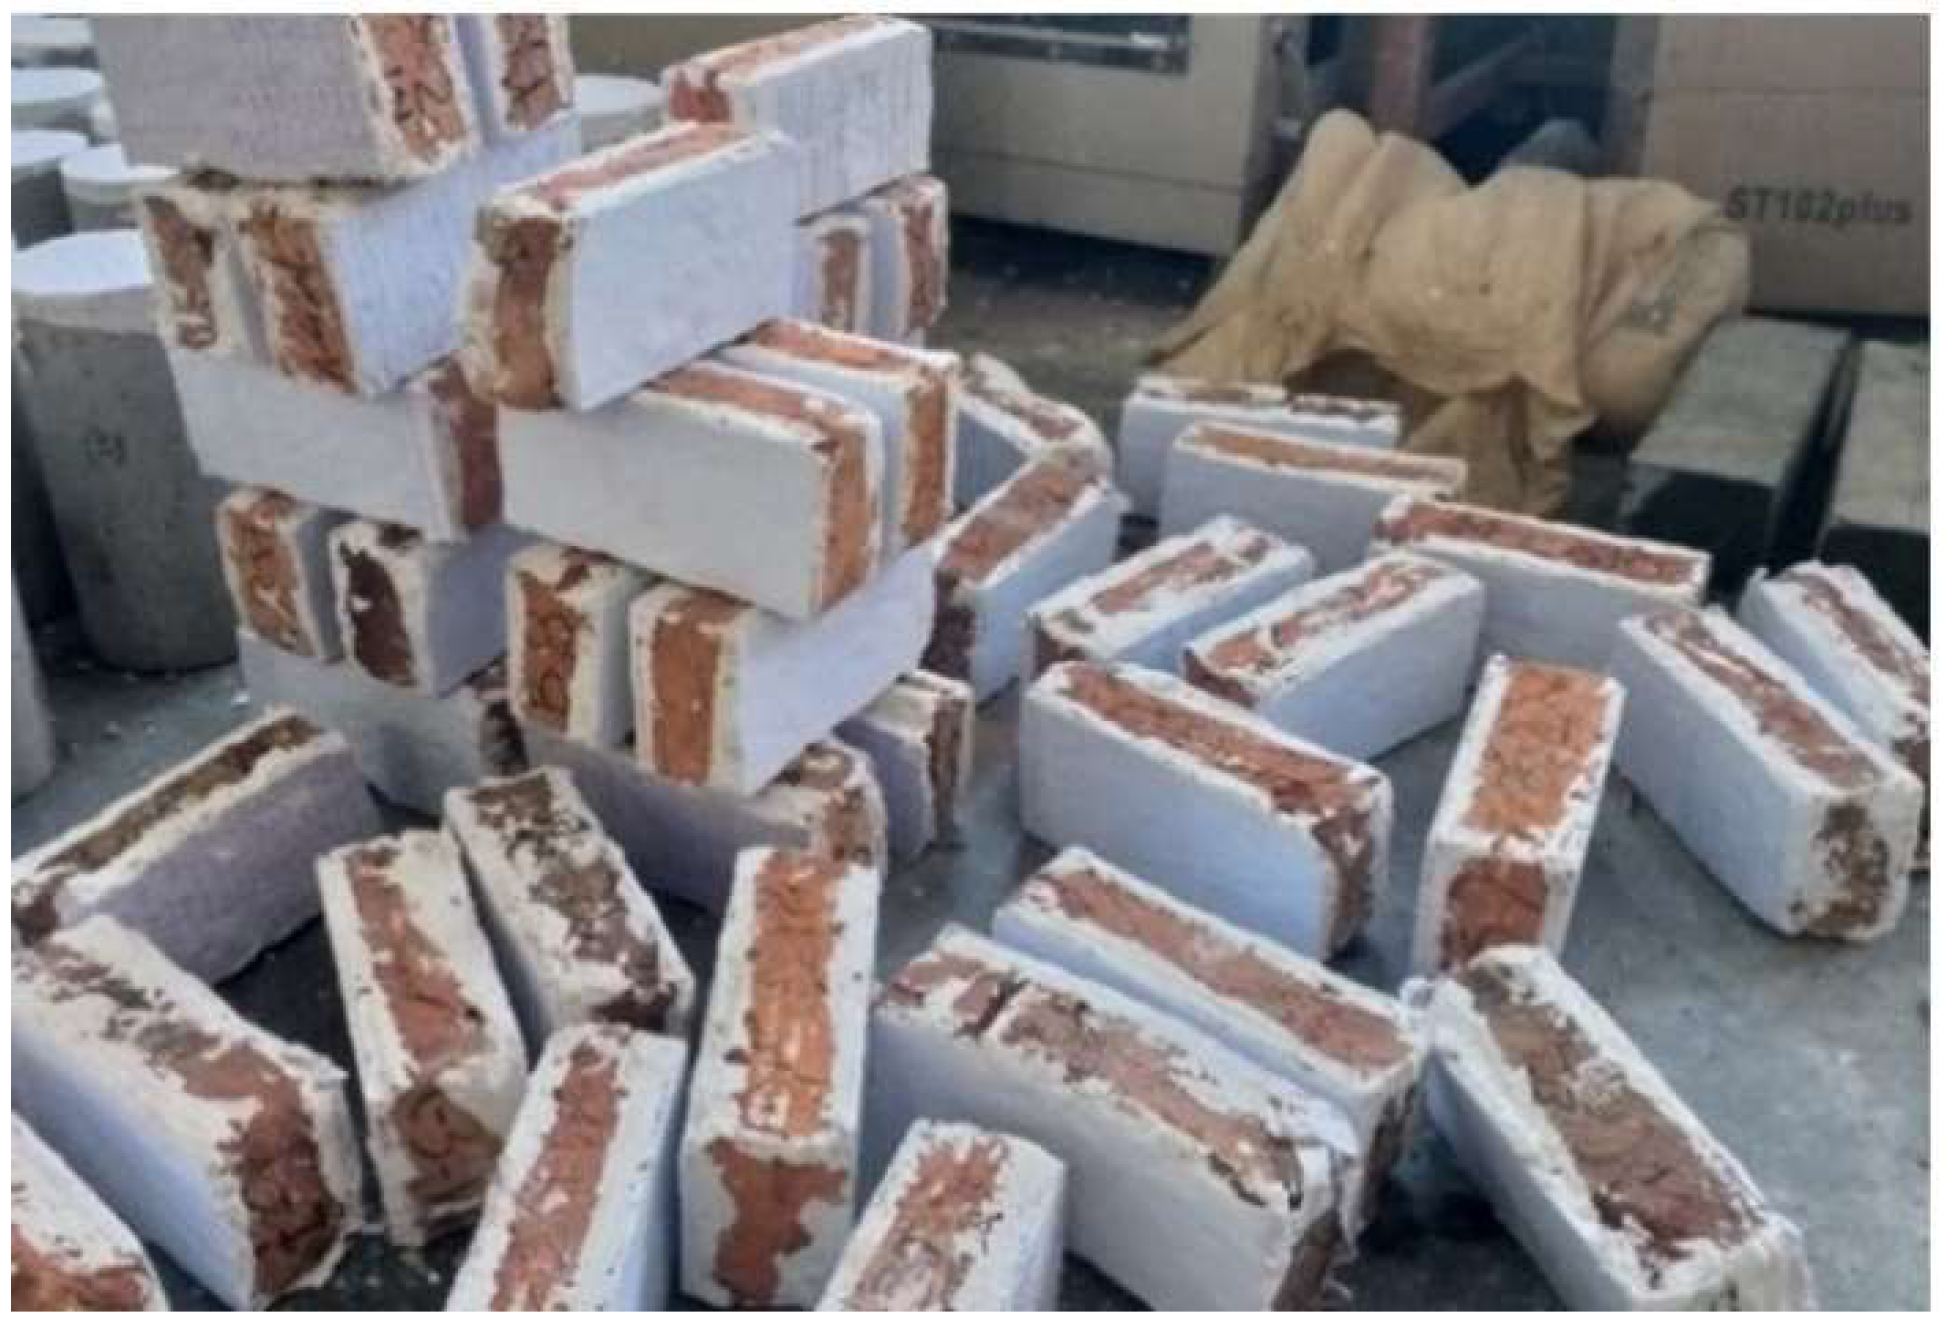
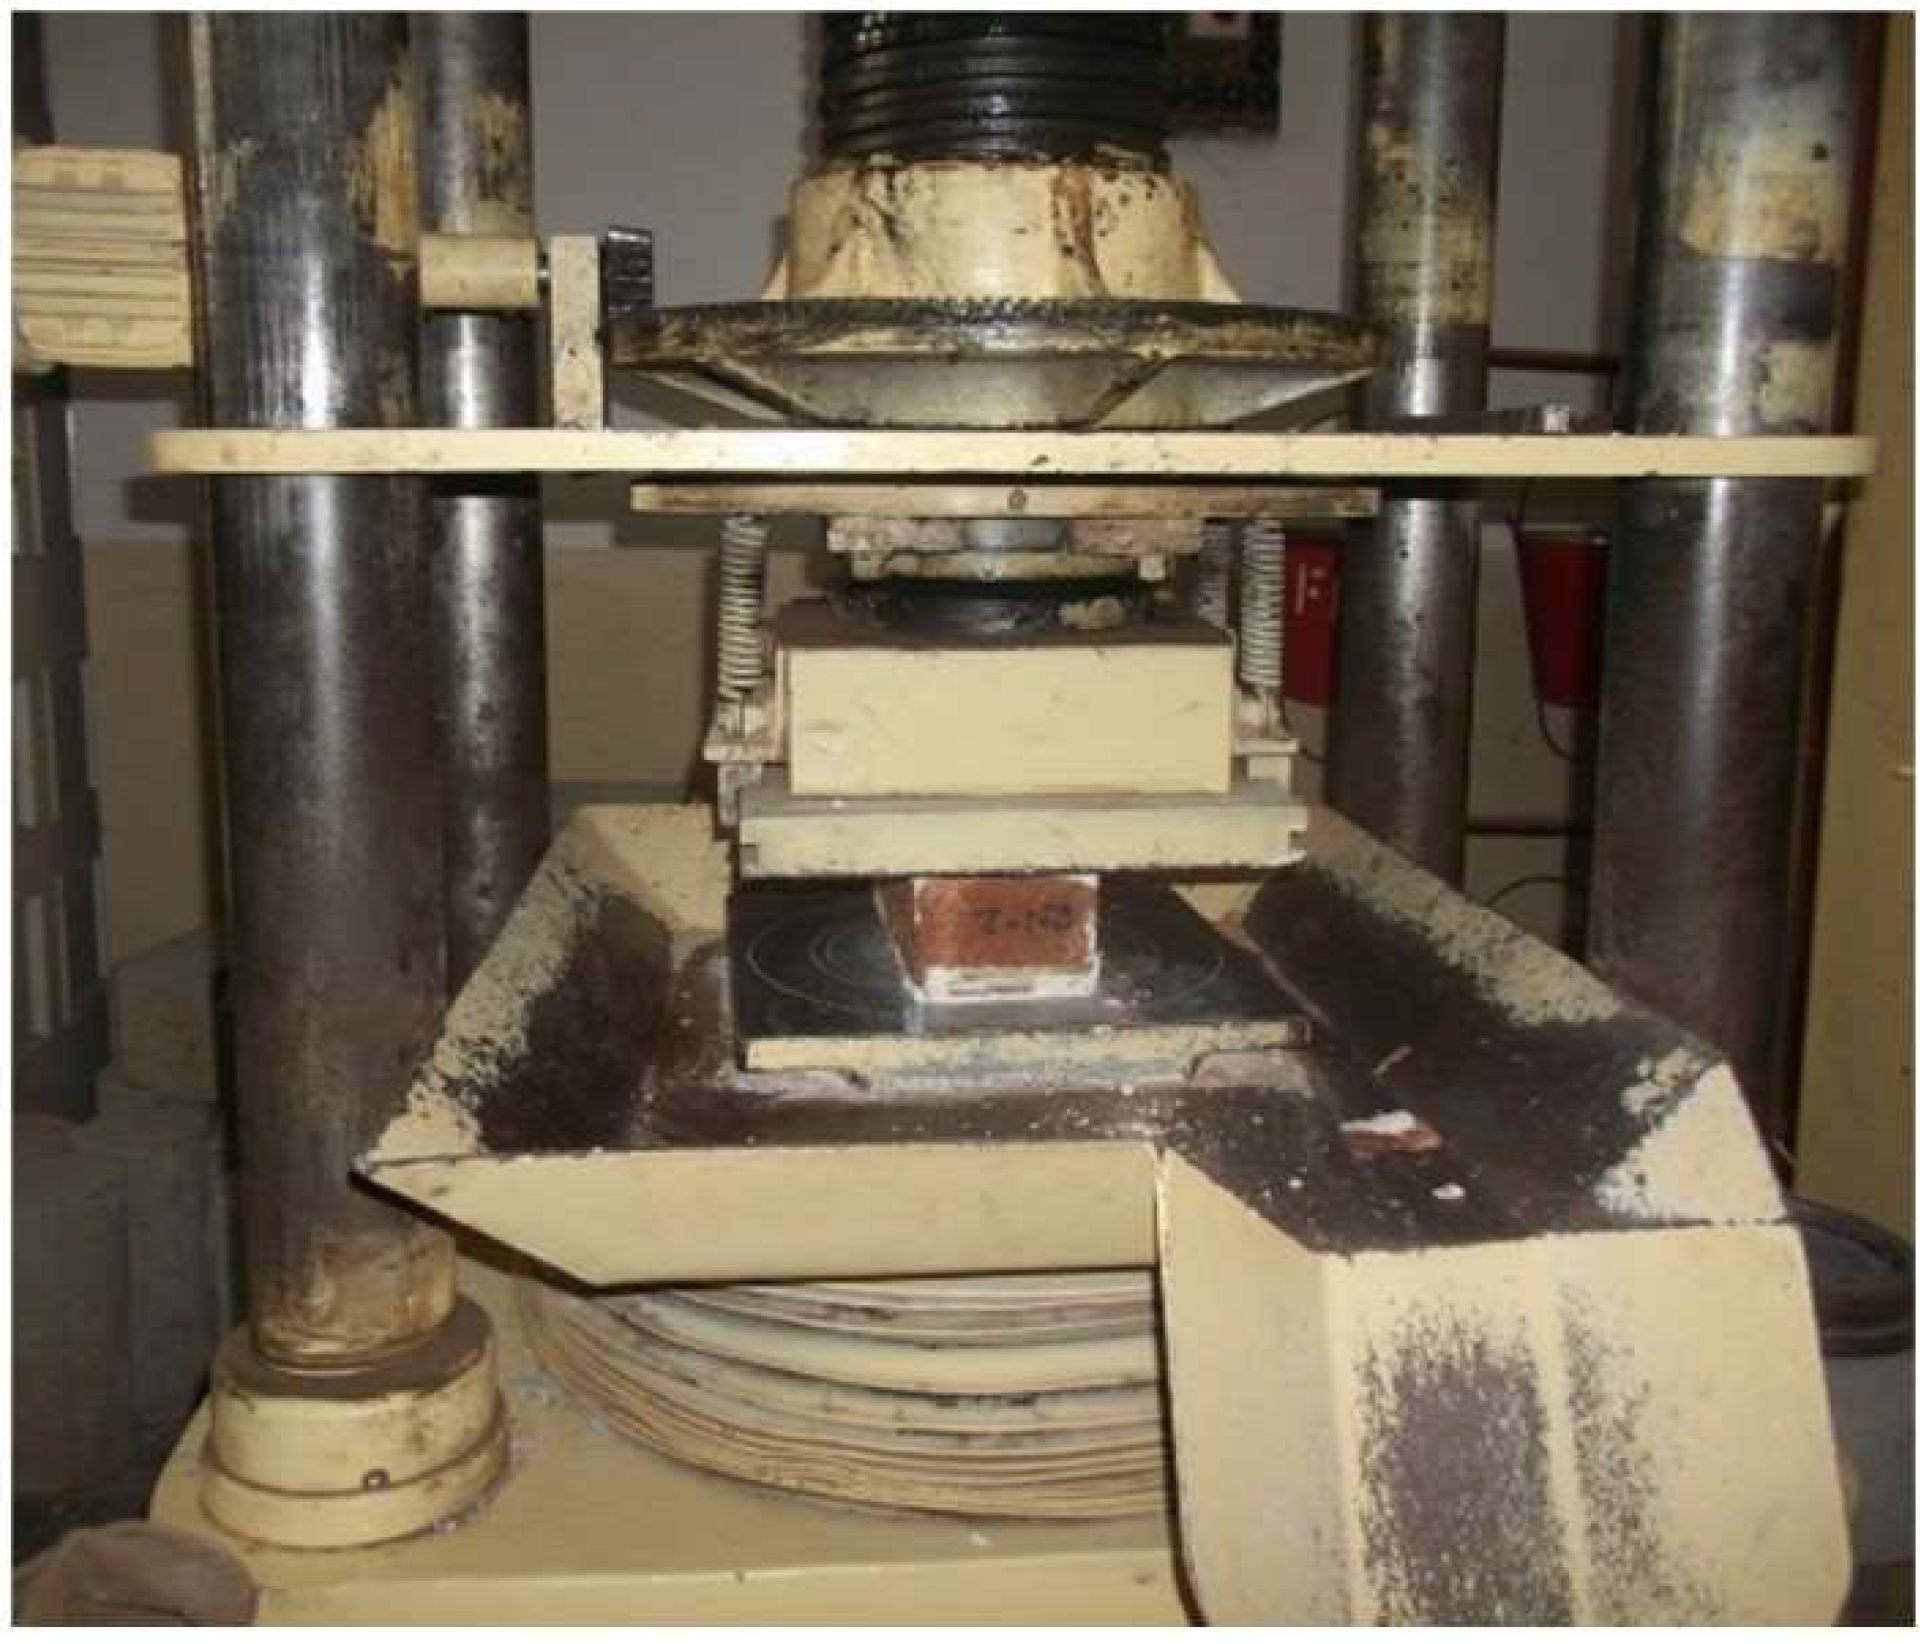
2.2.2. Uniaxial Compression Test

After UPV testing, destructive testing was performed on all the bricks to determine their compressive strength. The performed destructive test was the uniaxial compression test. The test samples were prepared and capped in accordance with ASTM C 67 [28]. All the samples were first cleaned and then both their ends were capped with gypsum at least one day before their testing. The capped bricks are shown in Figure 4. The compression test was performed using a 300-ton capacity compression testing machine with a 0.25-ton accuracy. The test setup is shown in Figure 5. The load in tons was recorded as soon as the first crack appeared in the brick. The compressive strength was computed by dividing this load value by the area computed from the dimensions noted earlier.

3. Results and Discussion

Brick specimens were first tested for UPV and then for compressive strength. Afterward, data from both tests were collected, arranged, and analyzed. Statistical analysis, i.e., linear regression analysis, was performed on the data. The correlation between compressive strength and UPV was developed, and curves were plotted. Through these curves, equations were developed which in turn provided significant results, which are discussed in the subsequent sections.

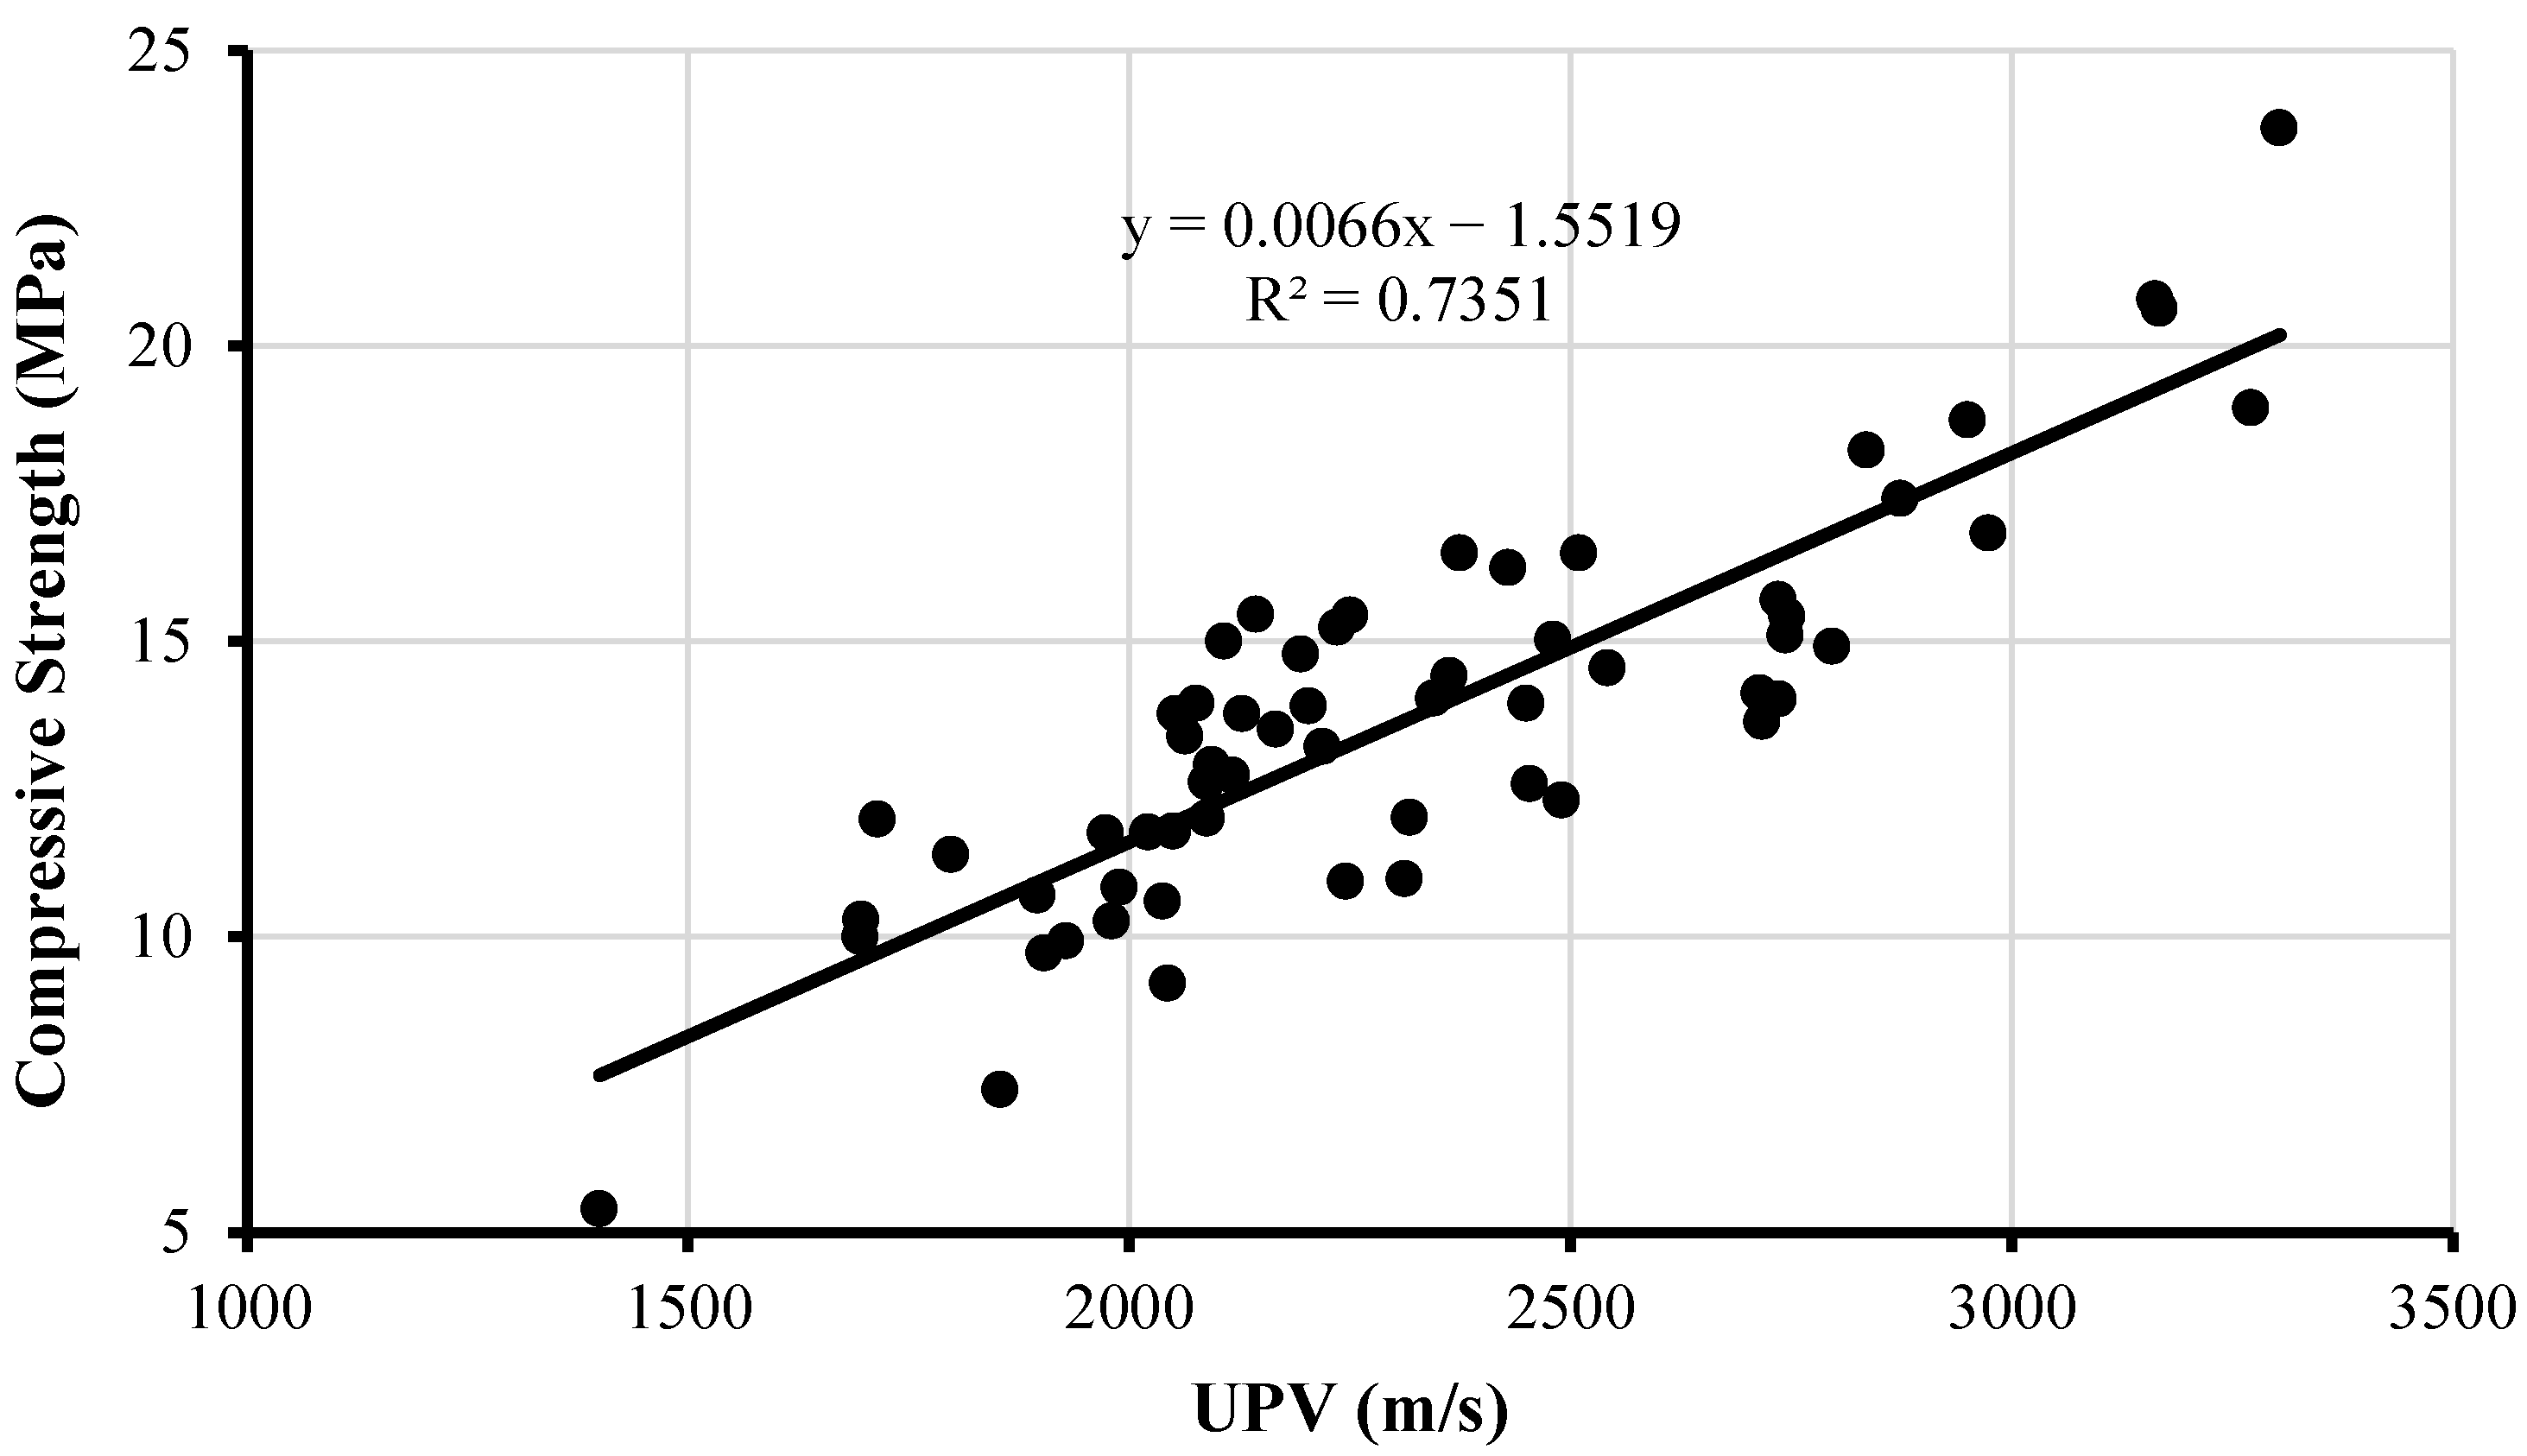
3.1. Correlations between Compression Strength of Brick and UPV Measurements

To assess the compressive strength of new as well as old bricks using the UPV test, the correlations of compressive strength and UPV were developed as part of this study. Such correlations have mainly been developed by several researchers for concrete and some of the researchers have developed these for different types and ages of bricks in their regions. Then, the relationship between the actual and the predicted compressive strength using the developed correlations was developed to check the points within the minimum and maximum limits (80 and 120%) of the compressive strength. This practice was first performed for the new and old bricks separately and then a combined correlation was developed for all the bricks of different ages considered in this study. Depending on whether the compressive strength of new or old bricks is to be assessed using UPV, the relevant correlation can be used. Further, the separate correlation for assessing the compressive strength of new bricks developed in this study would be helpful in promoting the use of the UPV test for selecting the new bricks for different projects at site. This is currently not practiced as destructive testing is only used for this purpose and the UPV test is mainly used for assessing the quality and compressive strength of old bricks, which are part of existing masonry constructions only.

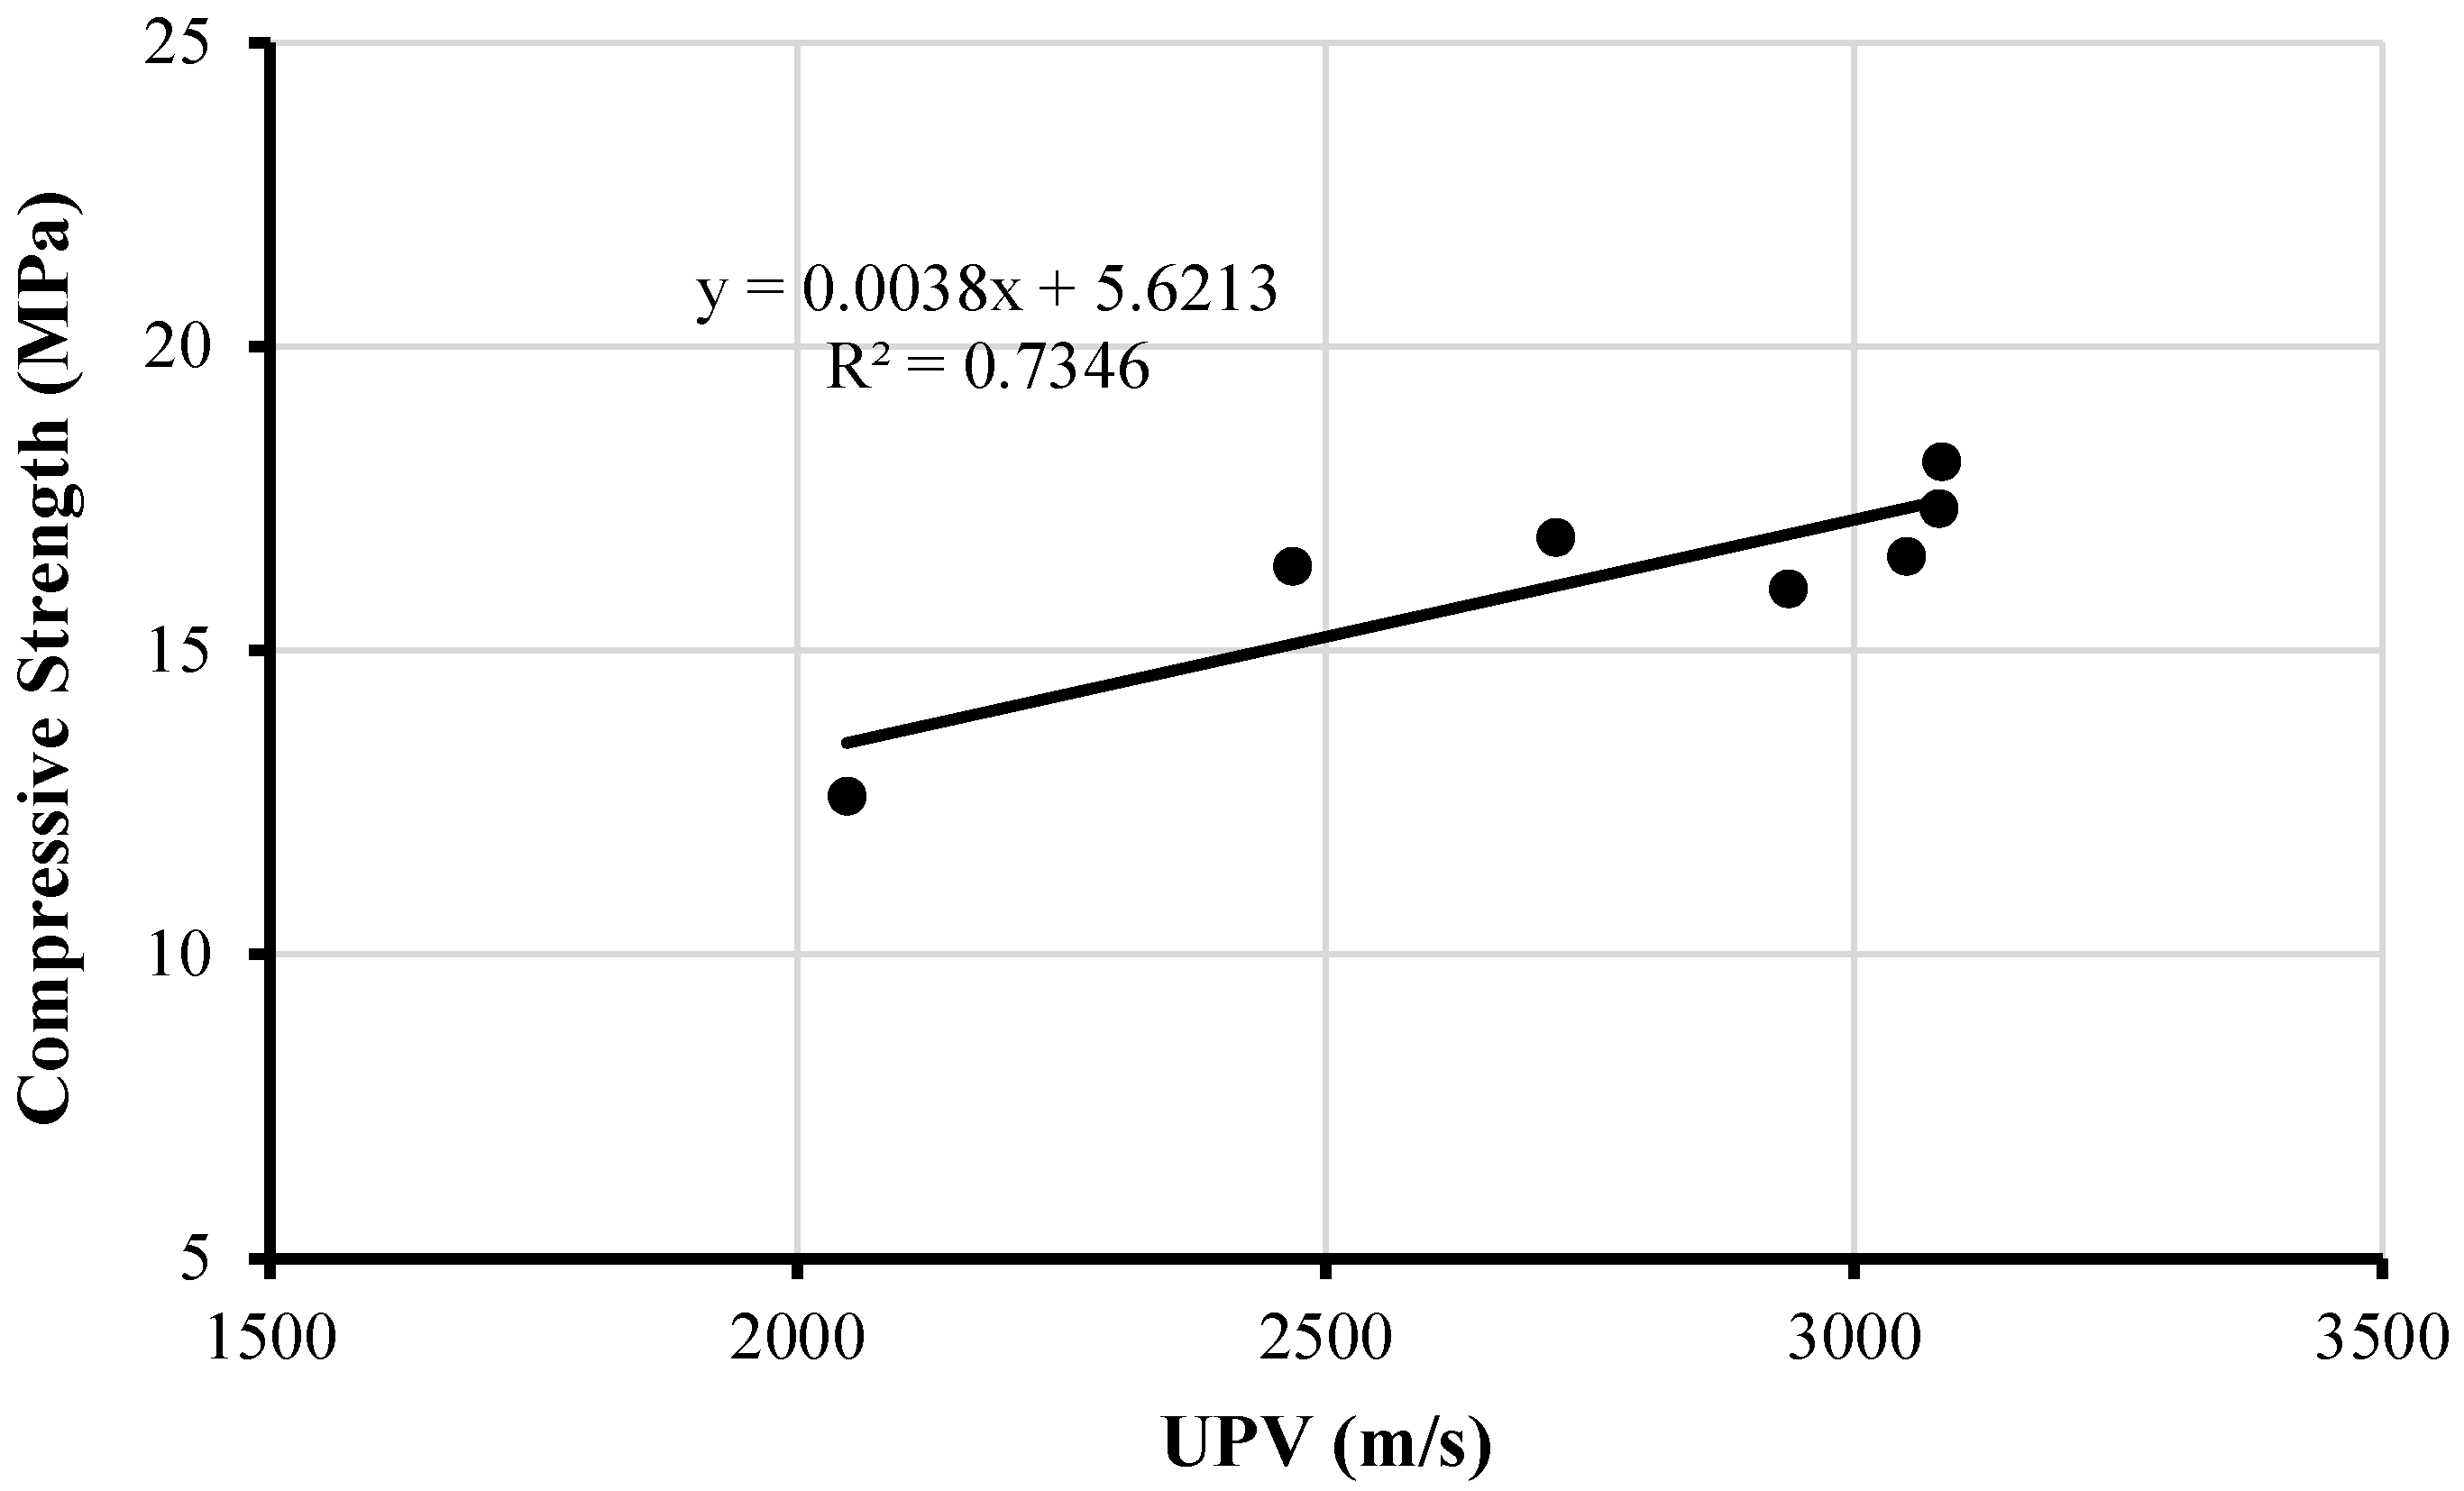
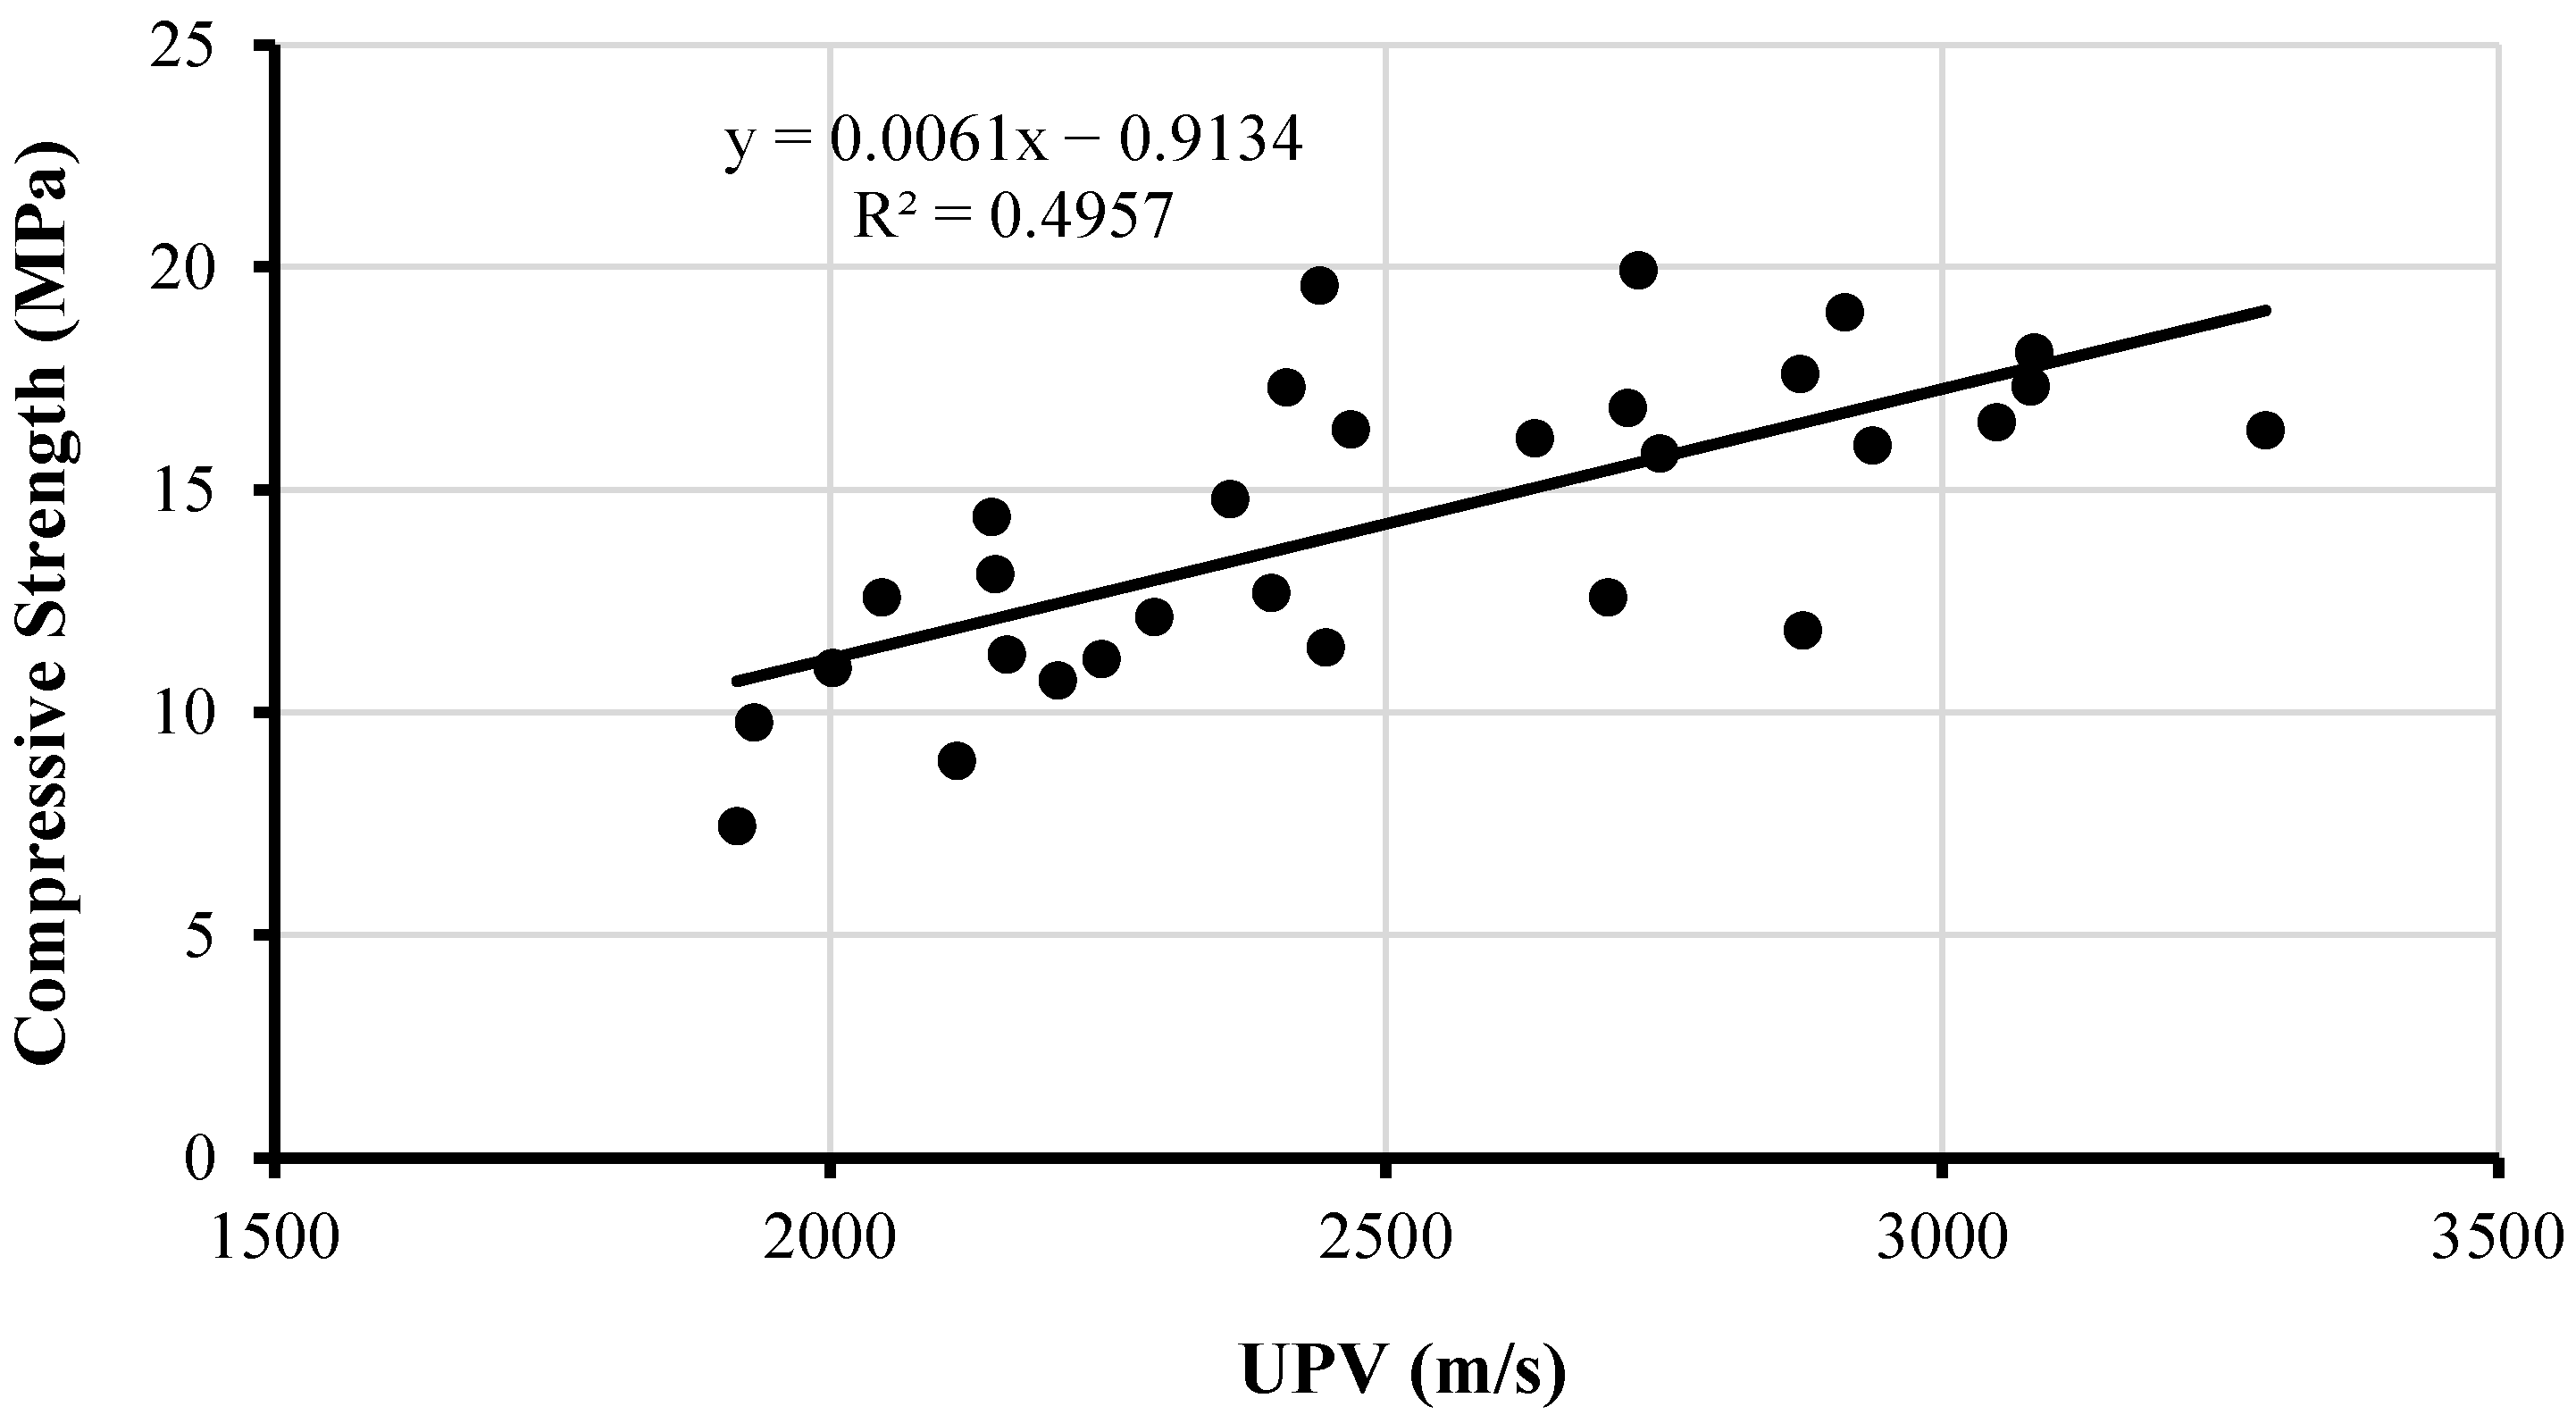
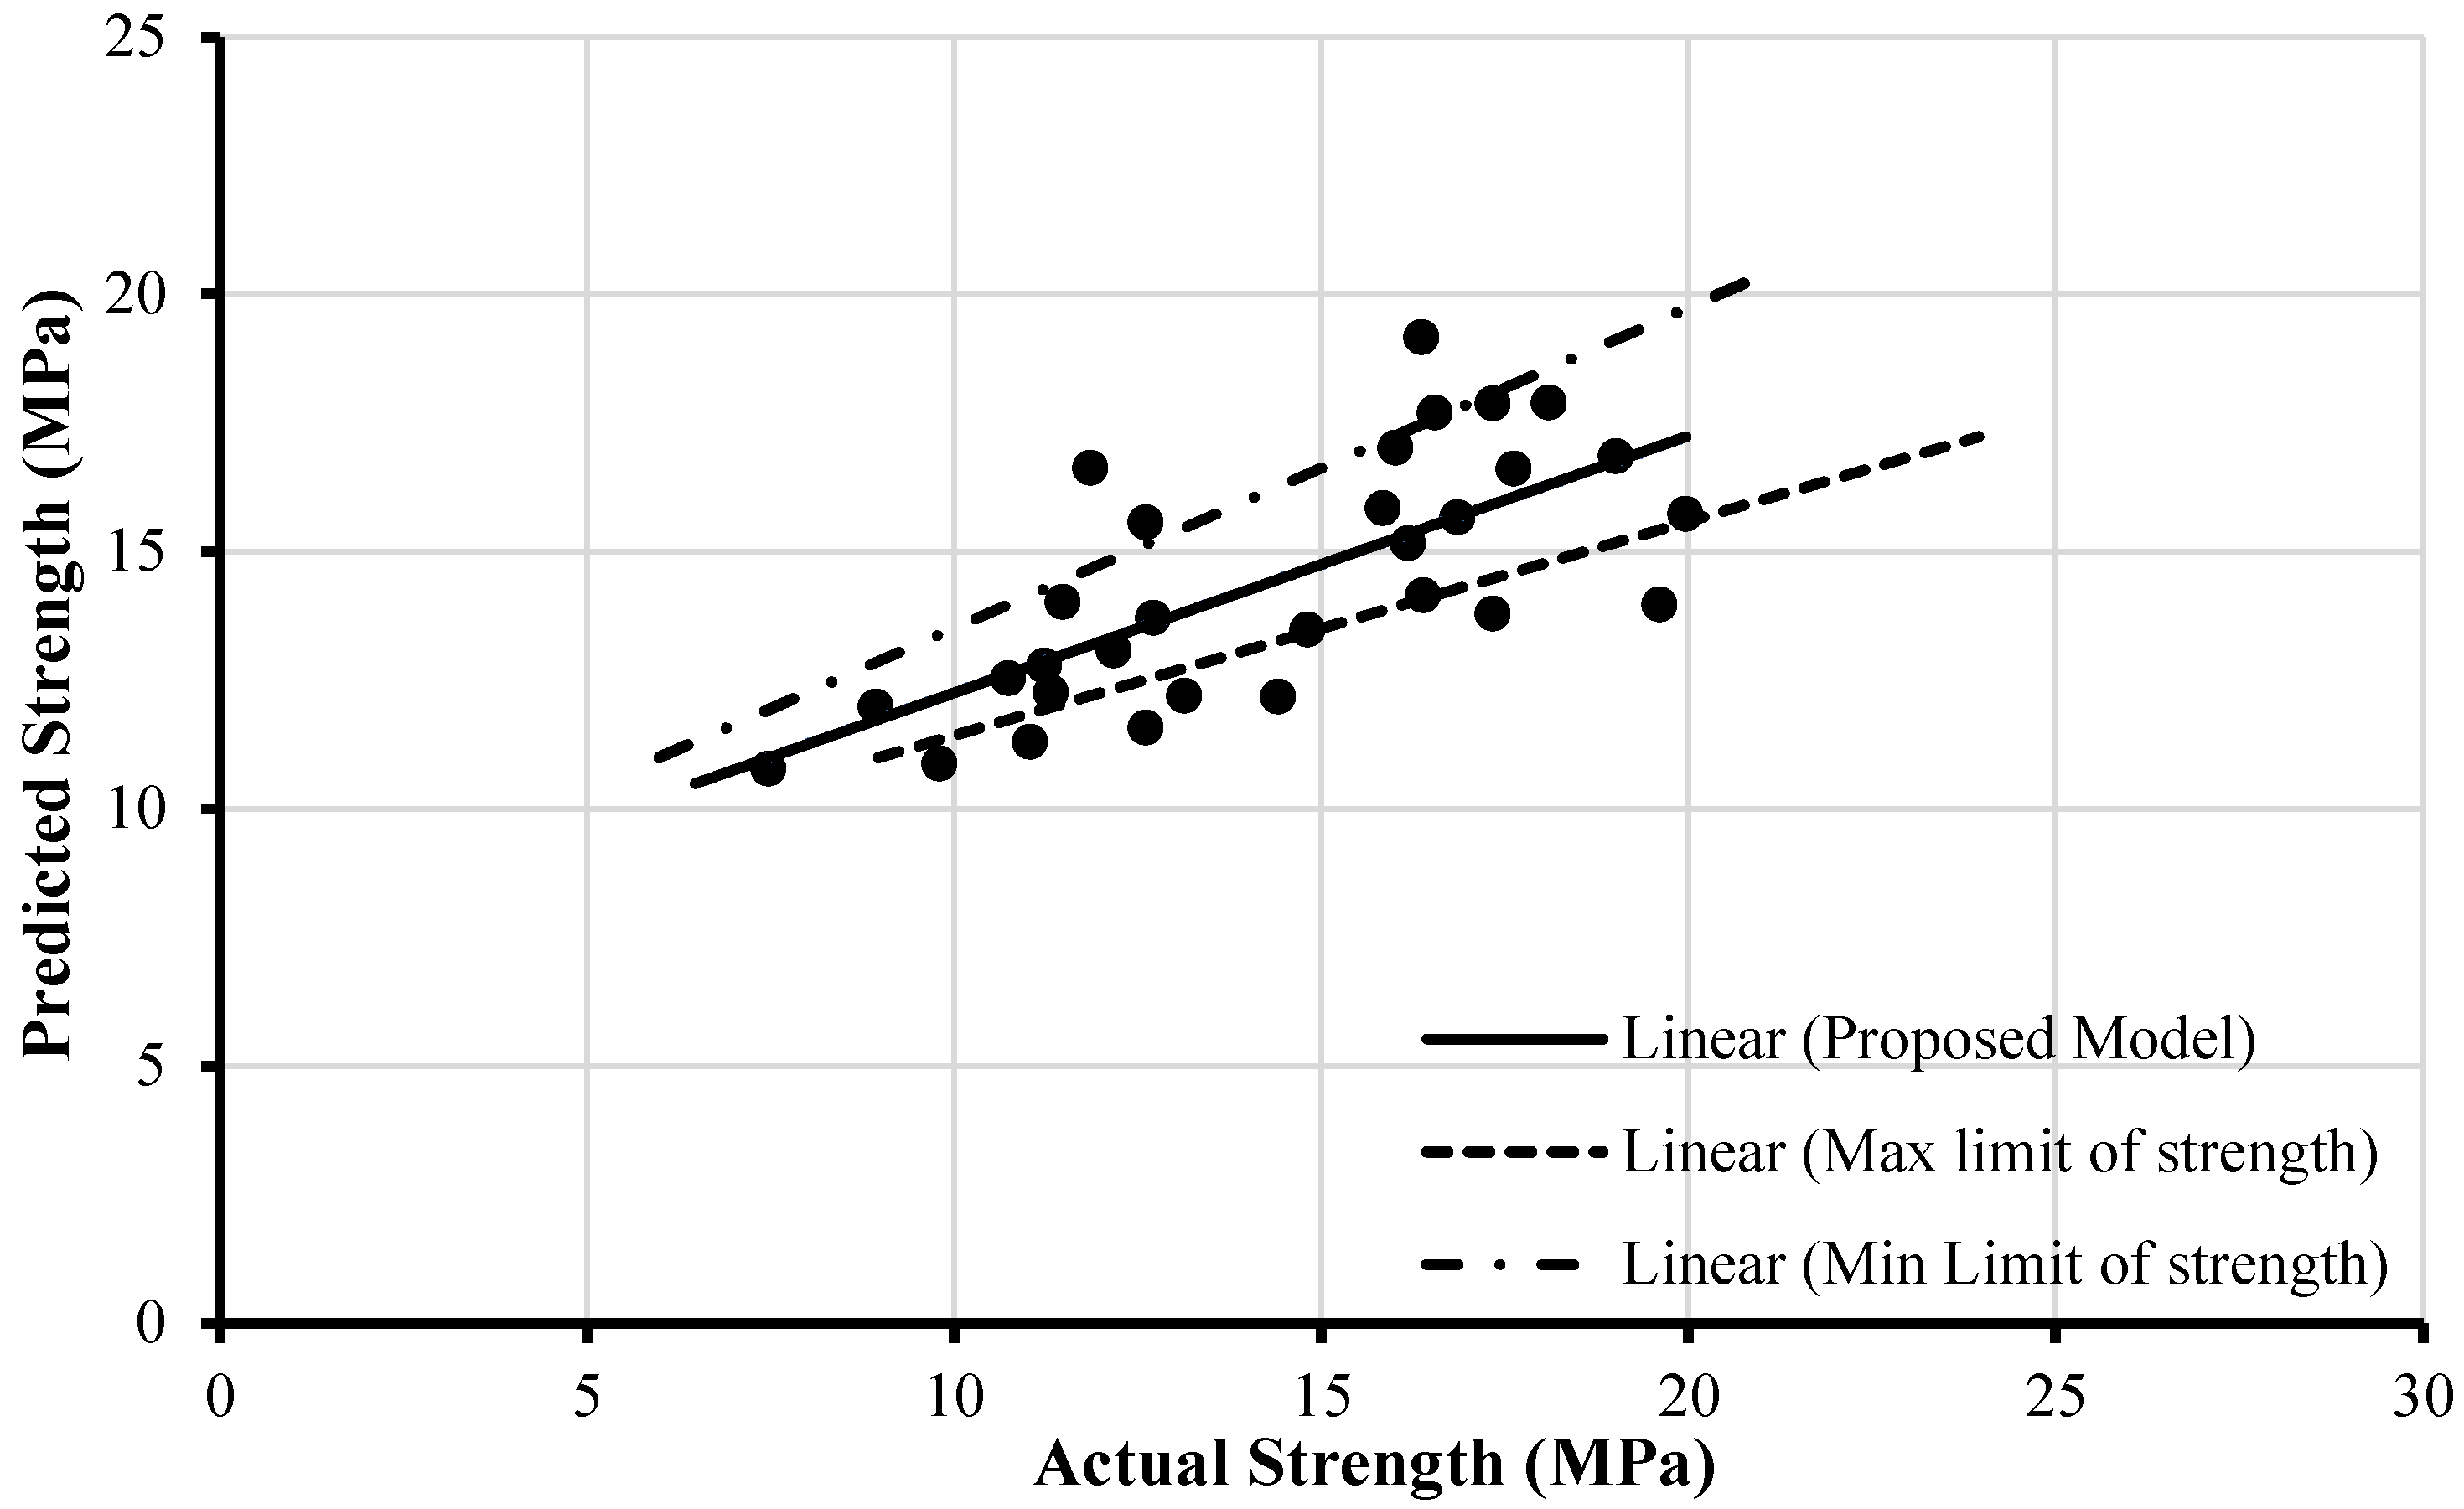
3.1.1. New Bricks from Kilns

Obtained values of UPV and the corresponding compressive strength of 60 samples are demonstrated in Figure 6, where a linear relation with a regression coefficient of R2= 0.7351 based upon the least-squares method of regression analysis is also shown. The R2 value indicates that 73.51% of the variation in compressive strength is explained by UPV and the obtained data fit to the model and all the variability of the response data around its mean.
Equation (1) shows the mathematical form of the linear relationship between UPV value and compressive strength for the new bricks developed based on the data of 60 new bricks. This equation can be used to find out the compressive strength of a new brick from its UPV value in the future.
C = 0.0066 V 1.5519
where C is the compressive strength of new bricks in MPa and V is the pulse velocity in m/s. A detailed regression analysis was conducted for this model, giving a multiple R-value of 0.85, which indicates that there is a strong correlation between UPV and compressive strength. Further, the standard error is 1.67, which indicates that observations are closer to the fitted line and the average distance of the data points from the fitted line is 1.67 MPa strength.
The relationship between actual and predicted compressive strength is displayed in Figure 7. This figure also shows the minimum and maximum limits (80 and 120%) of compressive strength. Most of the points of the graph are within the limit lines. This means that we can be 80% certain that it contains the true average value of the data of the relationship and the confidence interval covers the true value in 80 of 100 tests performed. In short, Equation (1) is worthy to obtain the predicted compressive strength from the obtained linear line for new burnt clay brick.
The above-mentioned correlations in Figure 6 and Figure 7 are for the 60 new brick specimens acquired from brick kilns. However, the difference between the actual value and the predicted value is called the residual in regression analysis. The points will be above the regression line if the residual is positive; the points will be below the regression line if the residual is negative; the points lie on the line if the residual is zero. Residuals offer an idea of the difference between the actual and predicted compressive strength. The maximum difference between actual compressive strength obtained from the compression test of burnt clay bricks and predicted compressive strength obtained from the equation of the regression line lies in the interval of −4 MPa to 2 MPa. The same compressive strength difference obtained by Brozovsky [11] is shown in Figure 8 for calcium silicate bricks and its difference lies in the interval of −9 MPa to 8 MPa. Hence, the presented model has a smaller difference interval, which indicates a lesser error in the relationship between compressive strength and UPV.

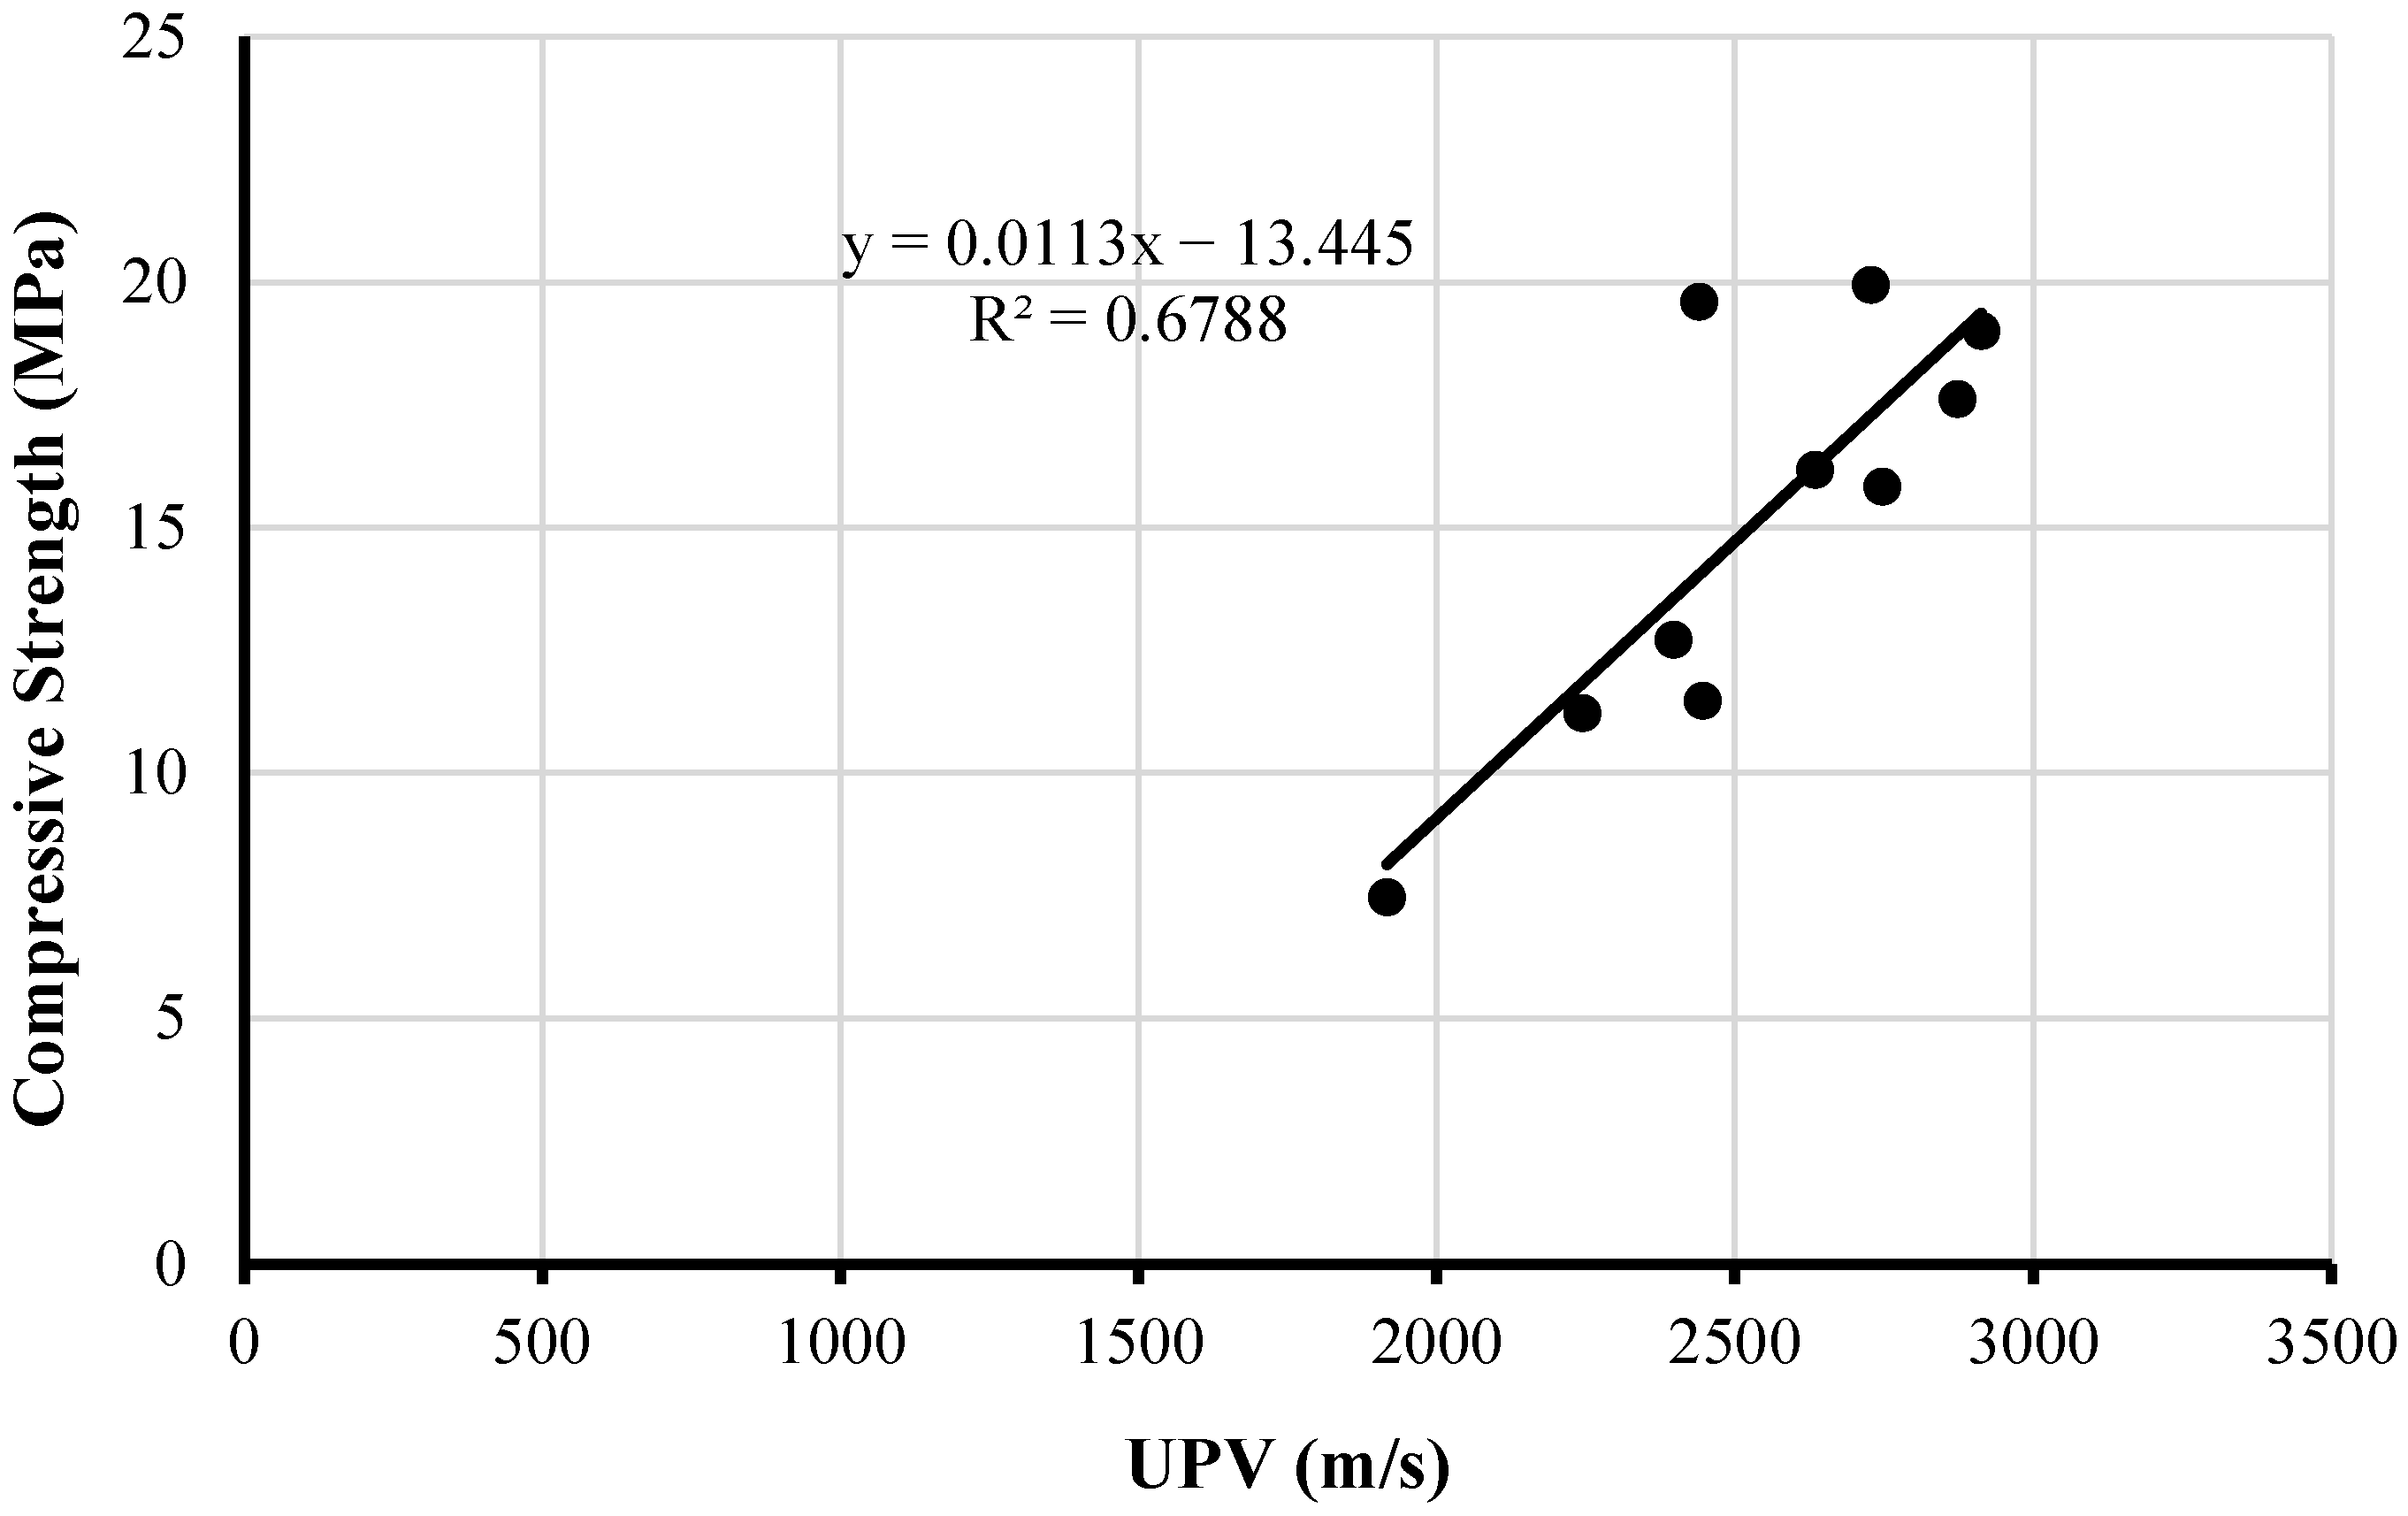
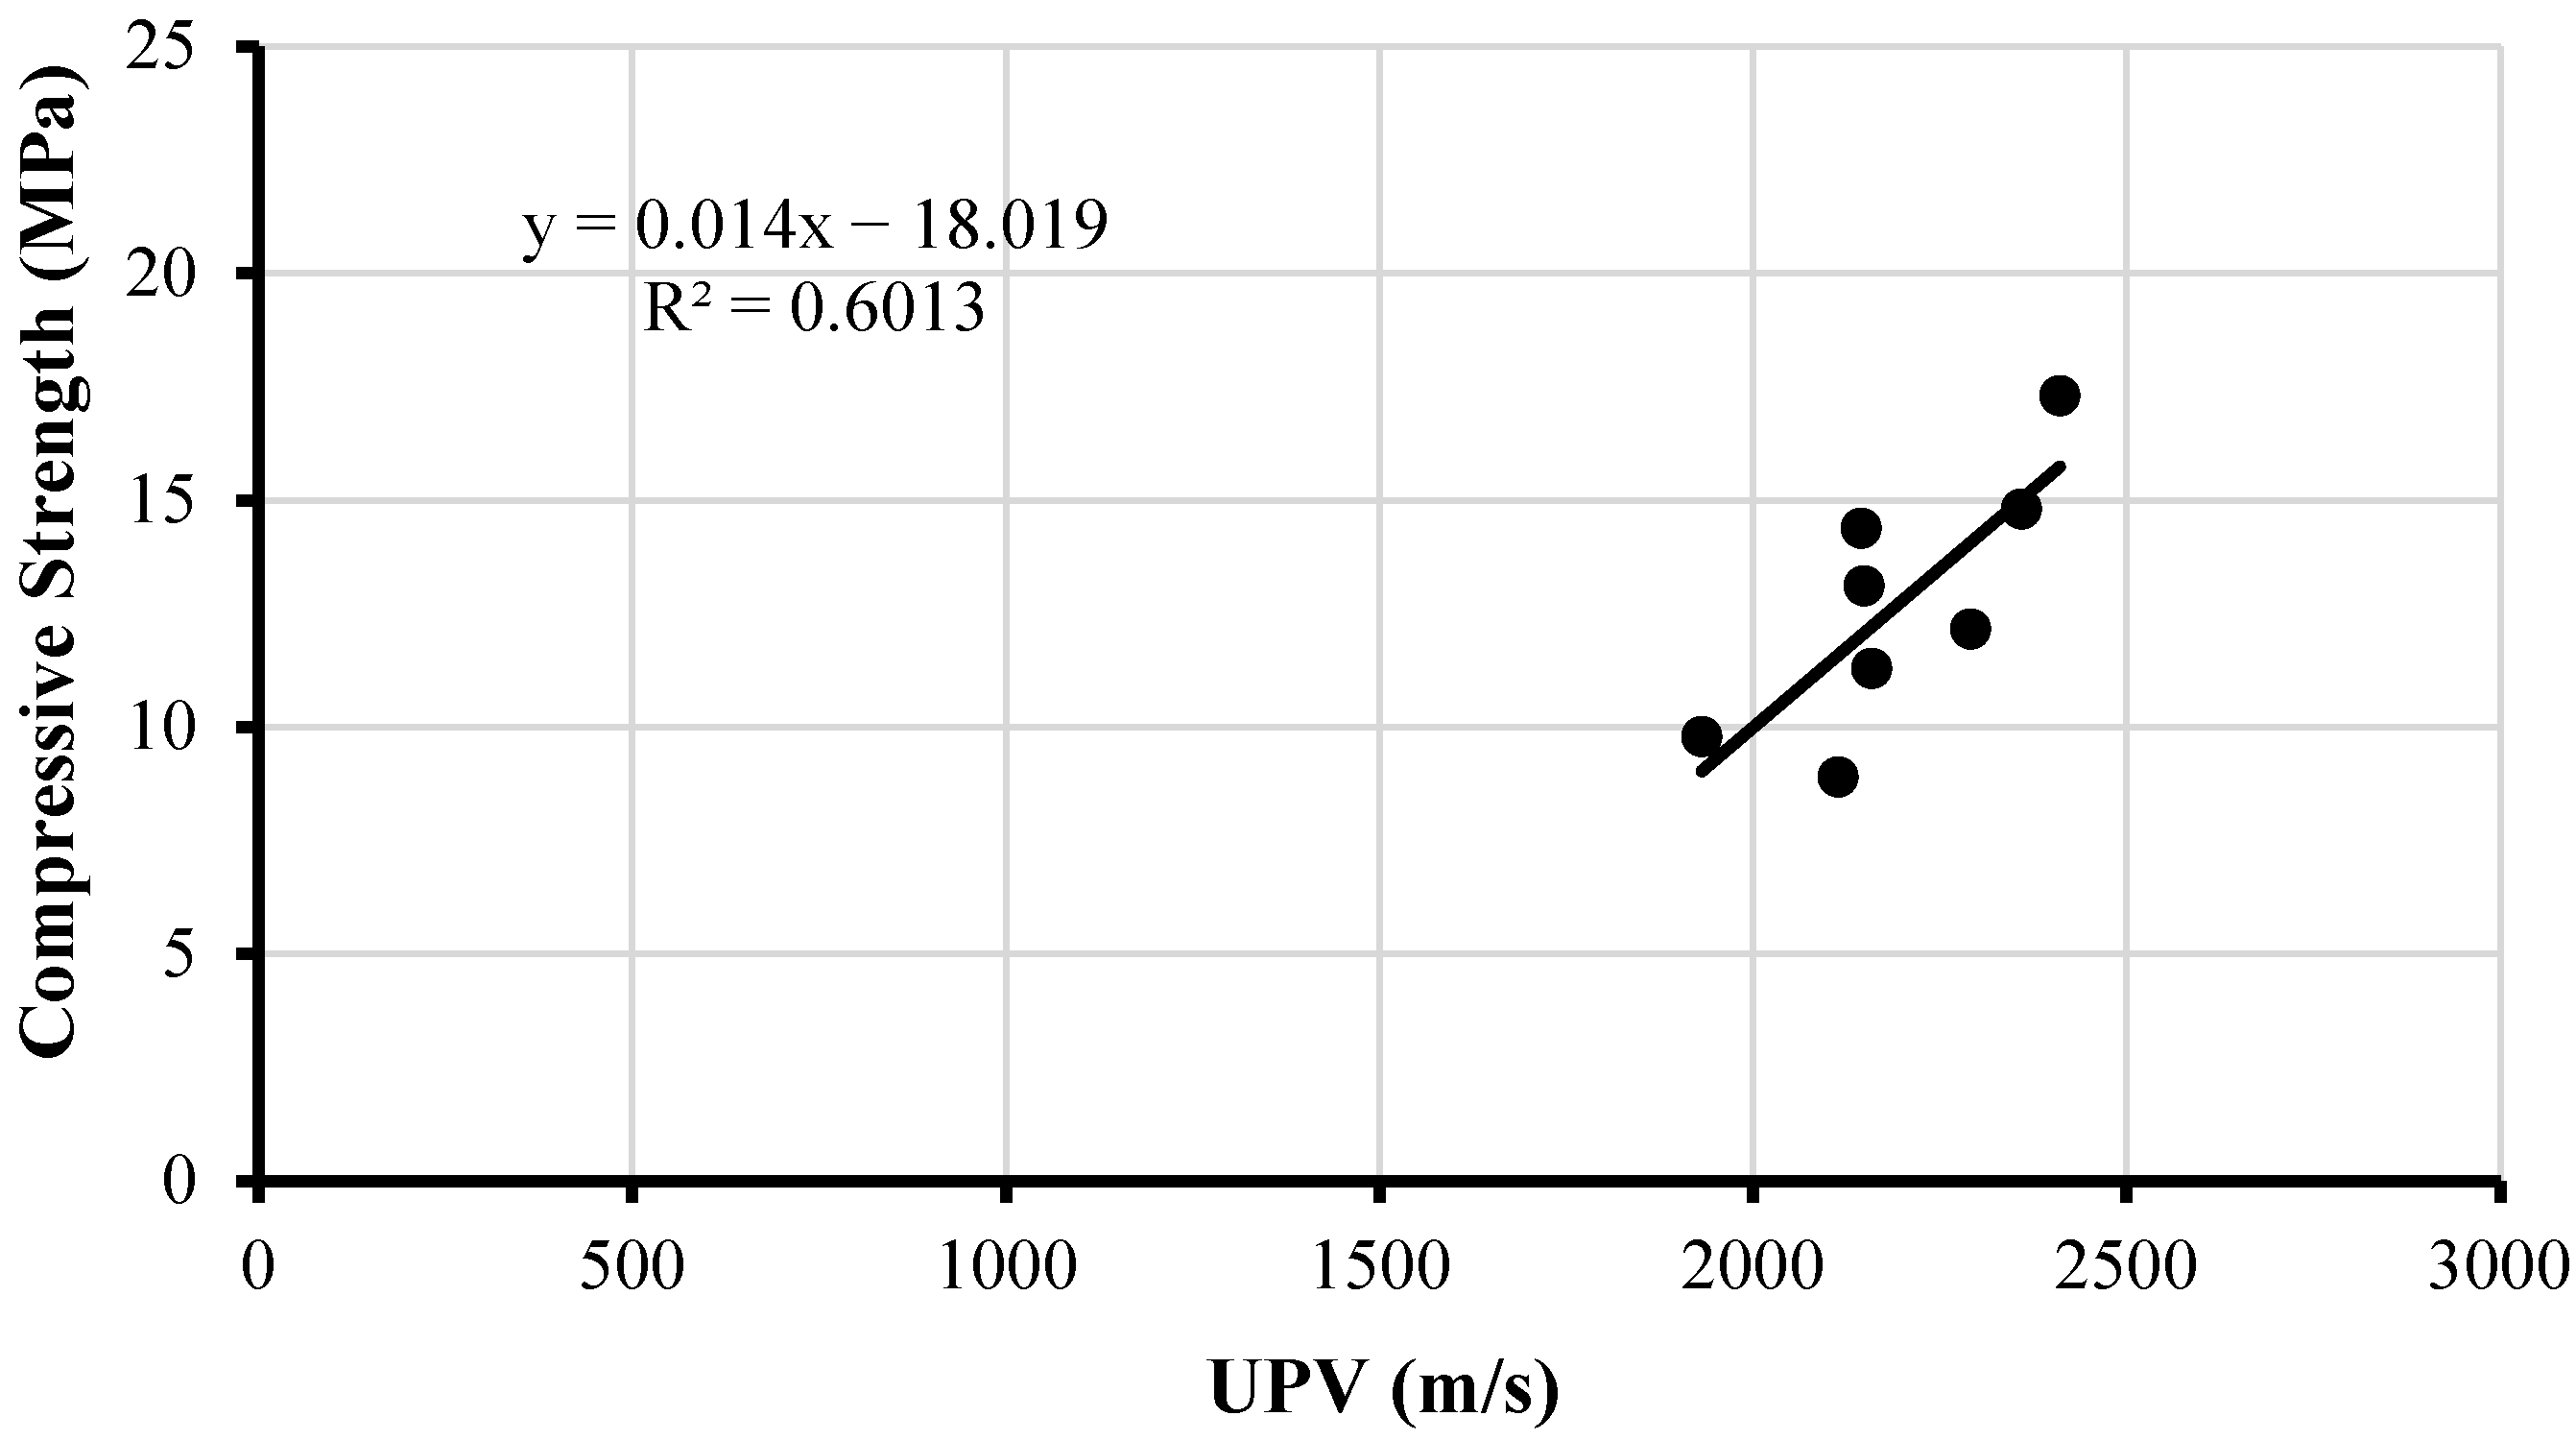
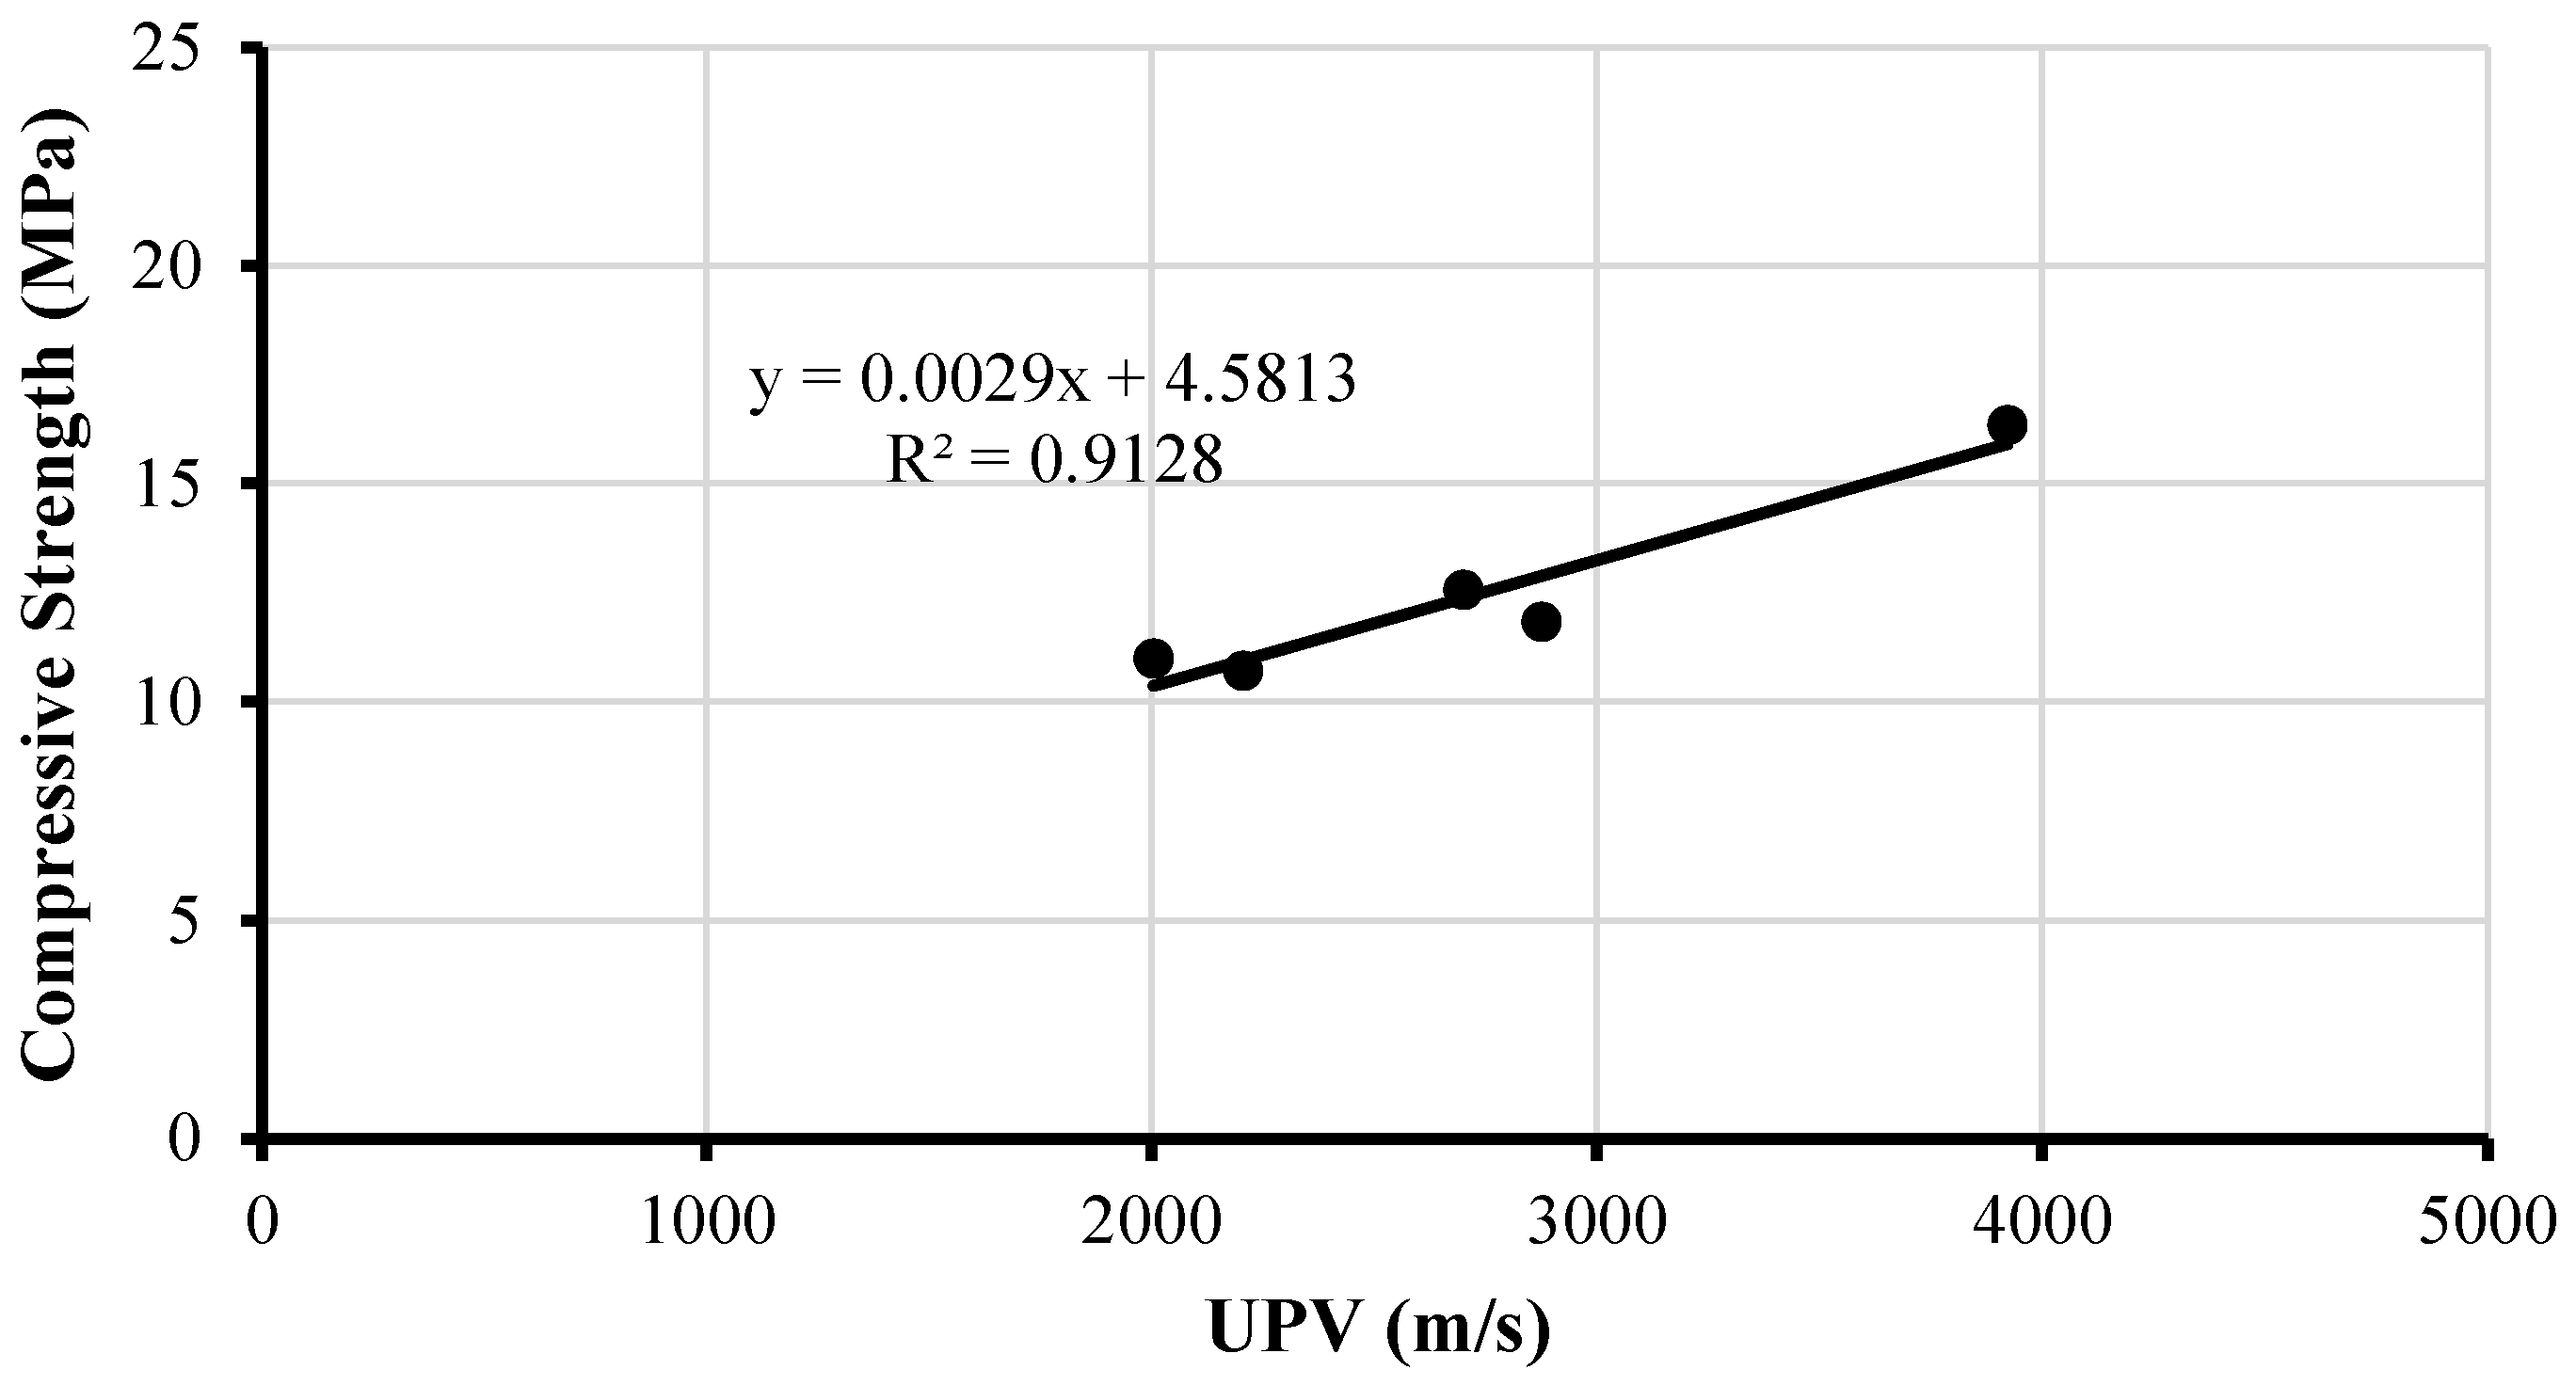
3.1.2. Old Bricks from Existing Buildings

The same procedure used for the new bricks was repeated for the 30 old bricks of four different ages collected from existing structures located in different parts of Lahore city. Figure 9, Figure 10, Figure 11 and Figure 12 show the correlation between compressive strength and the direct transmission UPV values for the 25-, 35-, 75-, and 100-year-old bricks, respectively. The linear trend lines were drawn for all these cases and their corresponding equations and R2 values are also mentioned in these figures. The residual compressive strength in an old brick that has been part of an existing structure for the last several years, other than the issues developed in the brick at the time of its manufacturing, depends on several factors, such as the load level to which the brick was subjected to, the location inside the existing structure, the exposure to weathering action, the wetting and drying cycles, etc. This is also evident from the trends achieved for these bricks of four different ages where the R2 values for the linear trend lines vary from 0.60 to 0.91.
Figure 13 shows the compiled data of all the old bricks for the sake of drawing a general correlation between the UPV value and the compressive strength for bricks of different ages. From Figure 13, Equation (2) is furnished as the equation of a linear trend line. The R2 value of 0.4957 indicates that for old bricks with ages varying between 25 and 100 years, the developed linear correlation can predict the compressive strength of old bricks with at least about 50 percent accuracy. This is lower than the 73% accuracy for the case of new bricks. The higher accuracy of prediction for the new bricks is due to the greater number of samples available to develop the correlation, better homogeneity, and reduced deterioration of the new bricks as compared to the old bricks.
C = 0.0061 V 0.9134
Similar to Figure 7 for the new bricks, Figure 14 shows the actual compressive strength of bricks against the predicted equation strength (theoretical) by offsetting max (120%) and min (80%) limits of strength. Most of the points in Figure 14 are within this set of ranges.

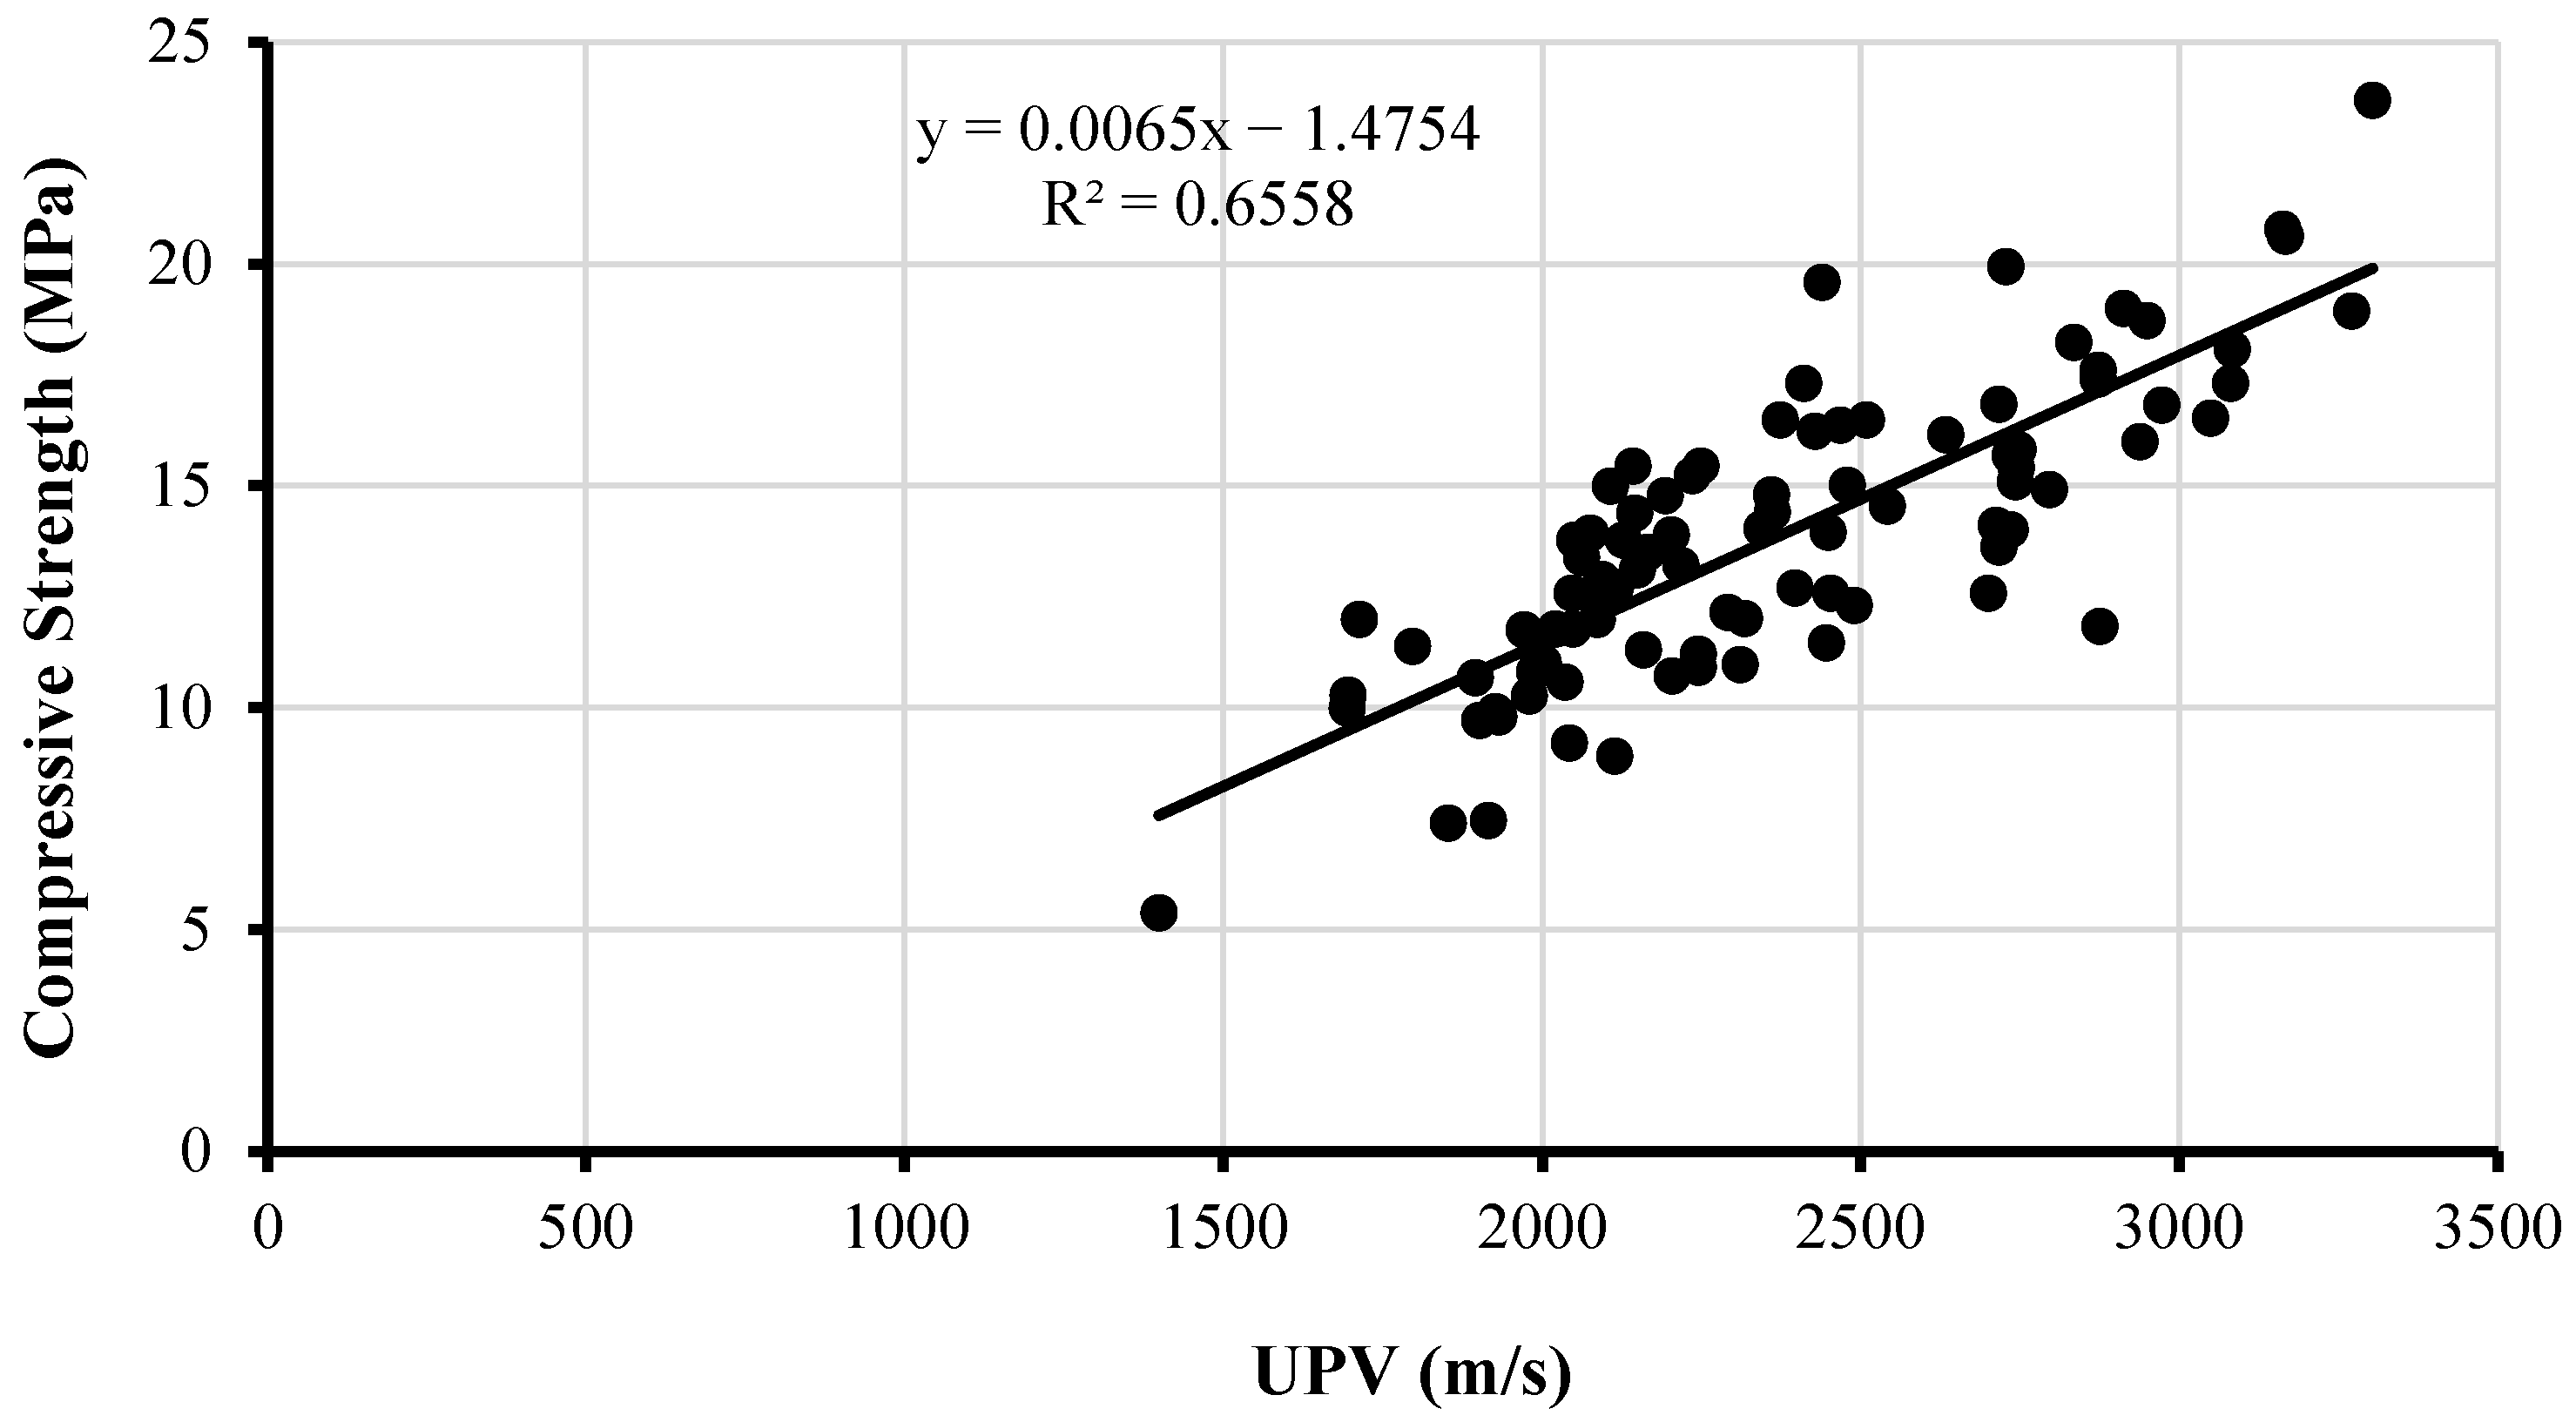
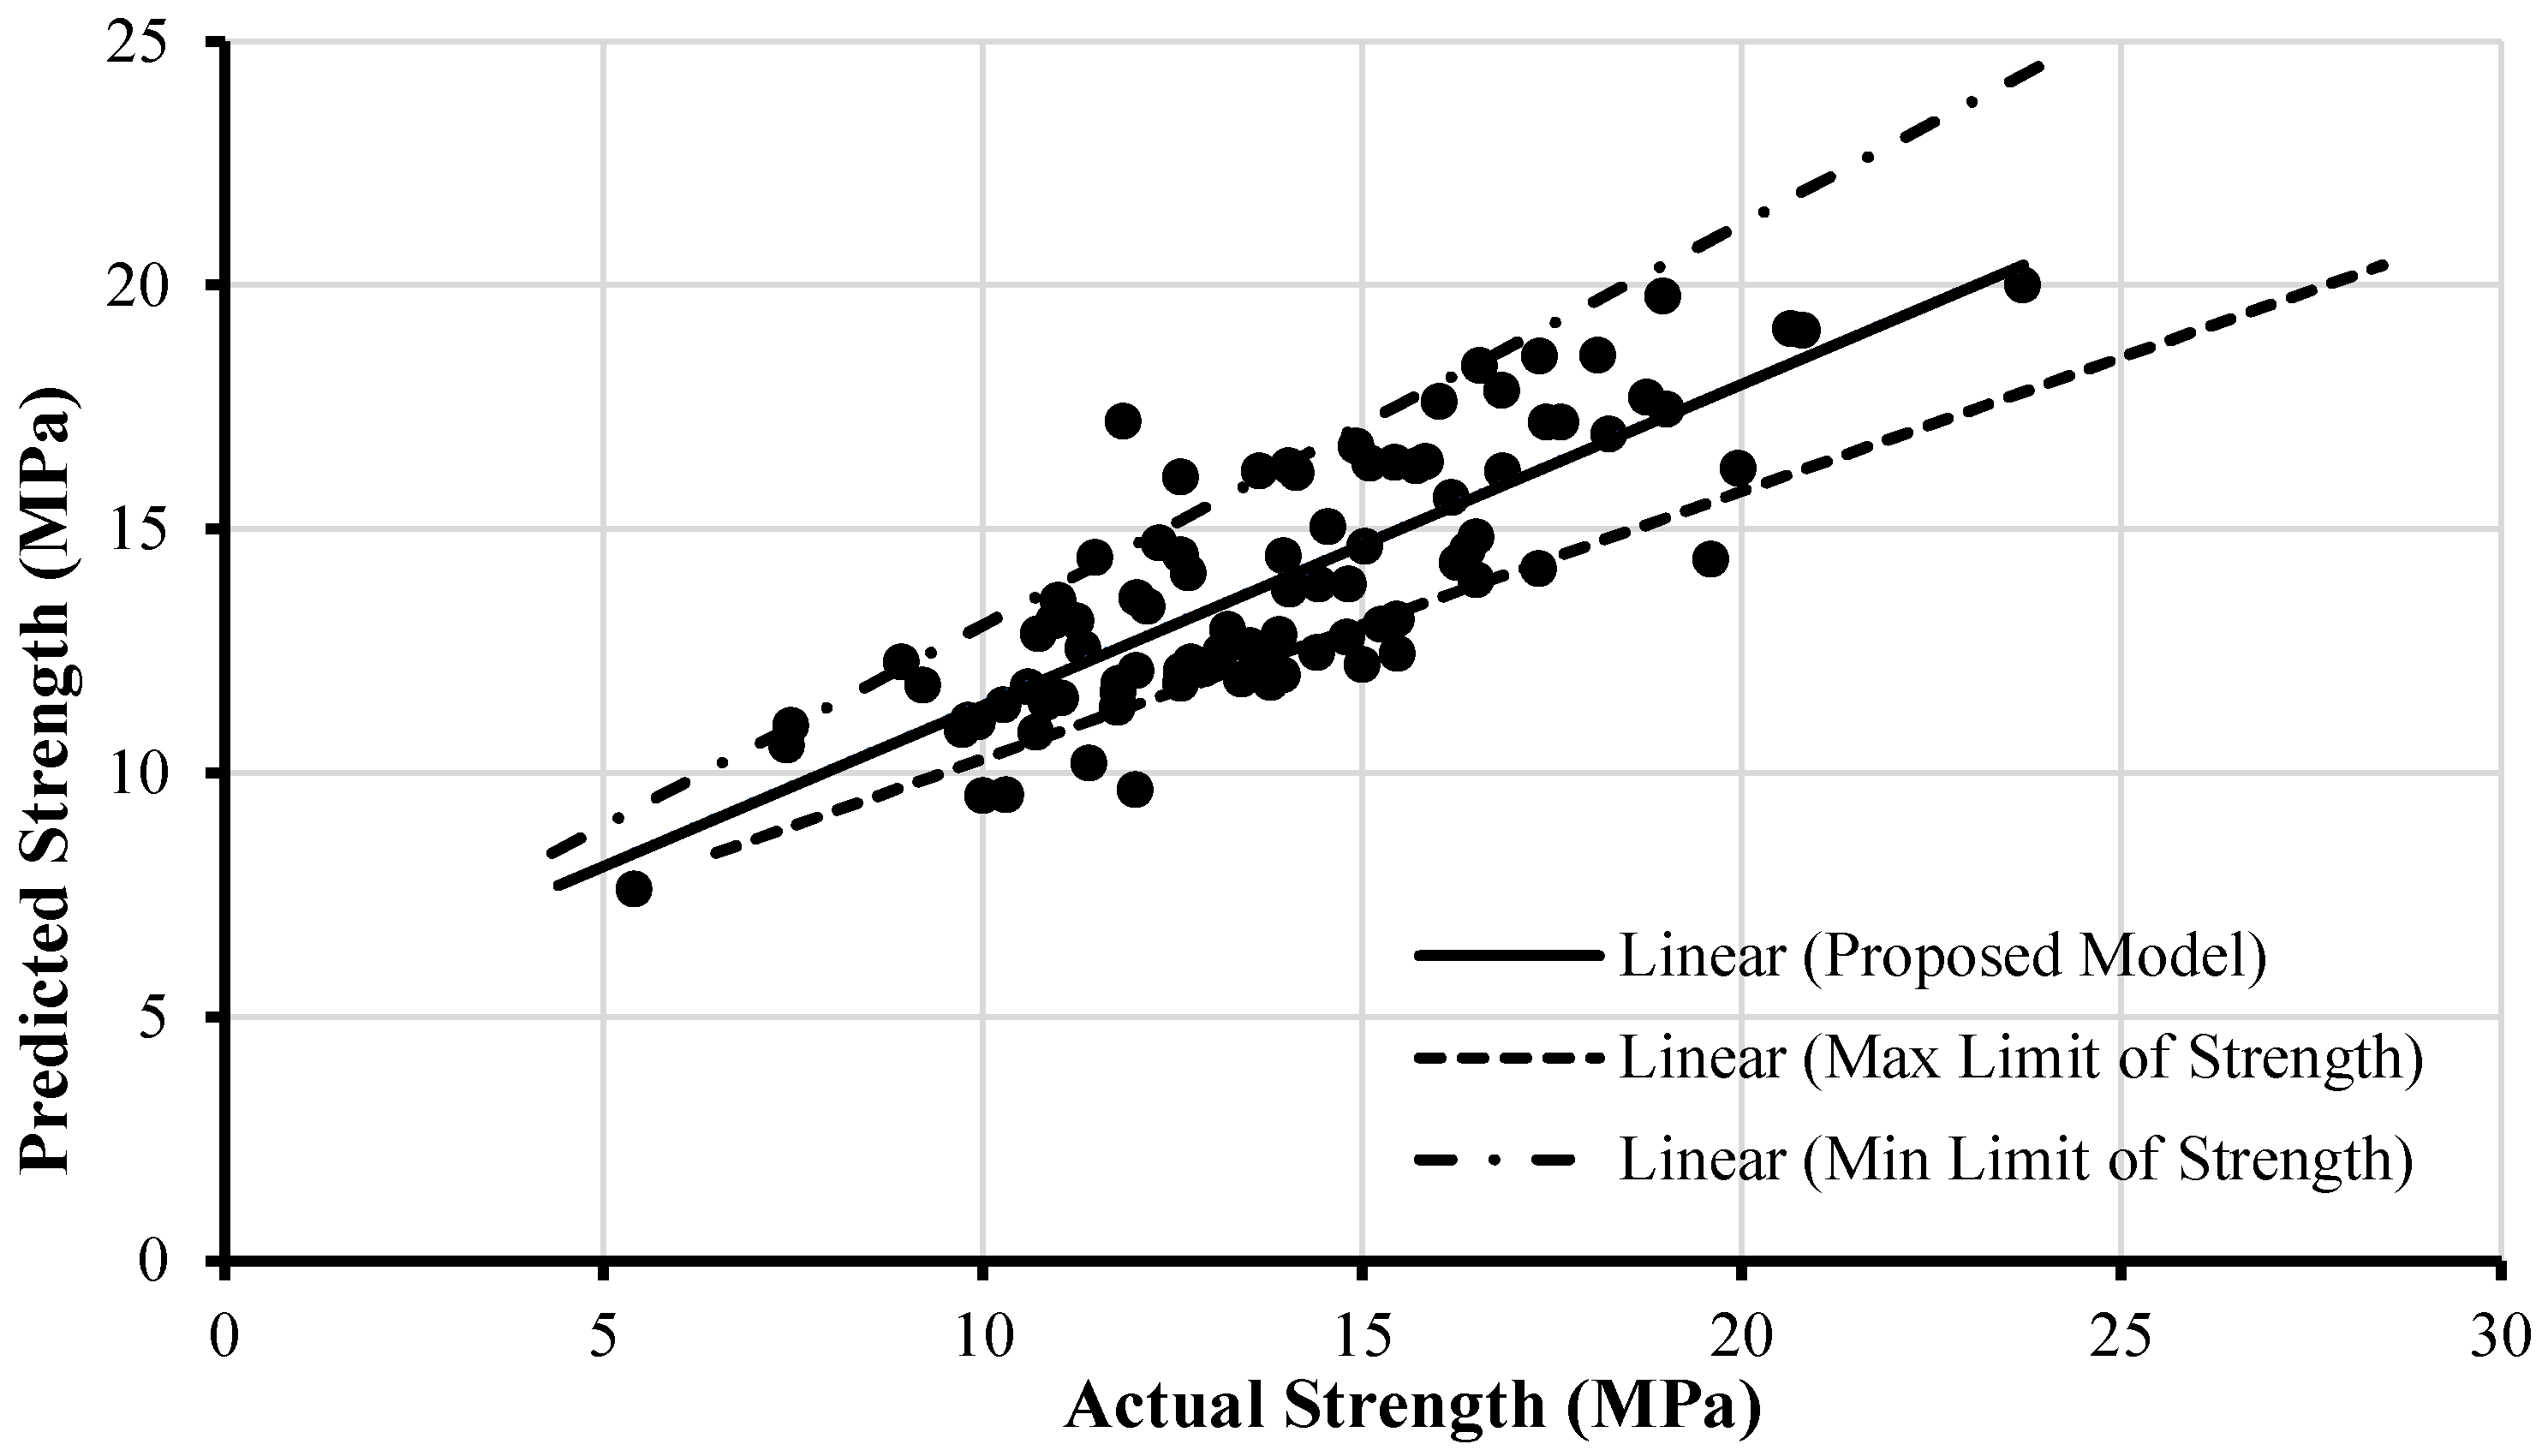
3.1.3. Combined Correlation for New and Old Bricks

Finally, the combined data of all 90 bricks (60 new and 30 old) of different sources and ages were compiled and a final curve was drawn, as shown in Figure 15, in order to derive a general correlation and propose an assessment criterion. It is clearly observed that the higher the value of UPV, the greater the compressive strength of bricks. The R2 value for the linear trend line is 65.58 percent, which shows that the relationship is not very poor even if the data of all the bricks are presented together in one single curve. From the derived correlation, a brick’s compressive strength can be estimated instantly in situ or in the laboratory with the help of Equation (3).
C = 0.0065 V 1.4754
Figure 16 shows the data of all 90 bricks against the minimum and maximum limits (80 and 120%) of compressive strength. It can be observed that most of the data points are within the limit lines, which means that even the combined correlation for new and old bricks of different ages is about 80% worthy for obtaining the predicted compressive strength.

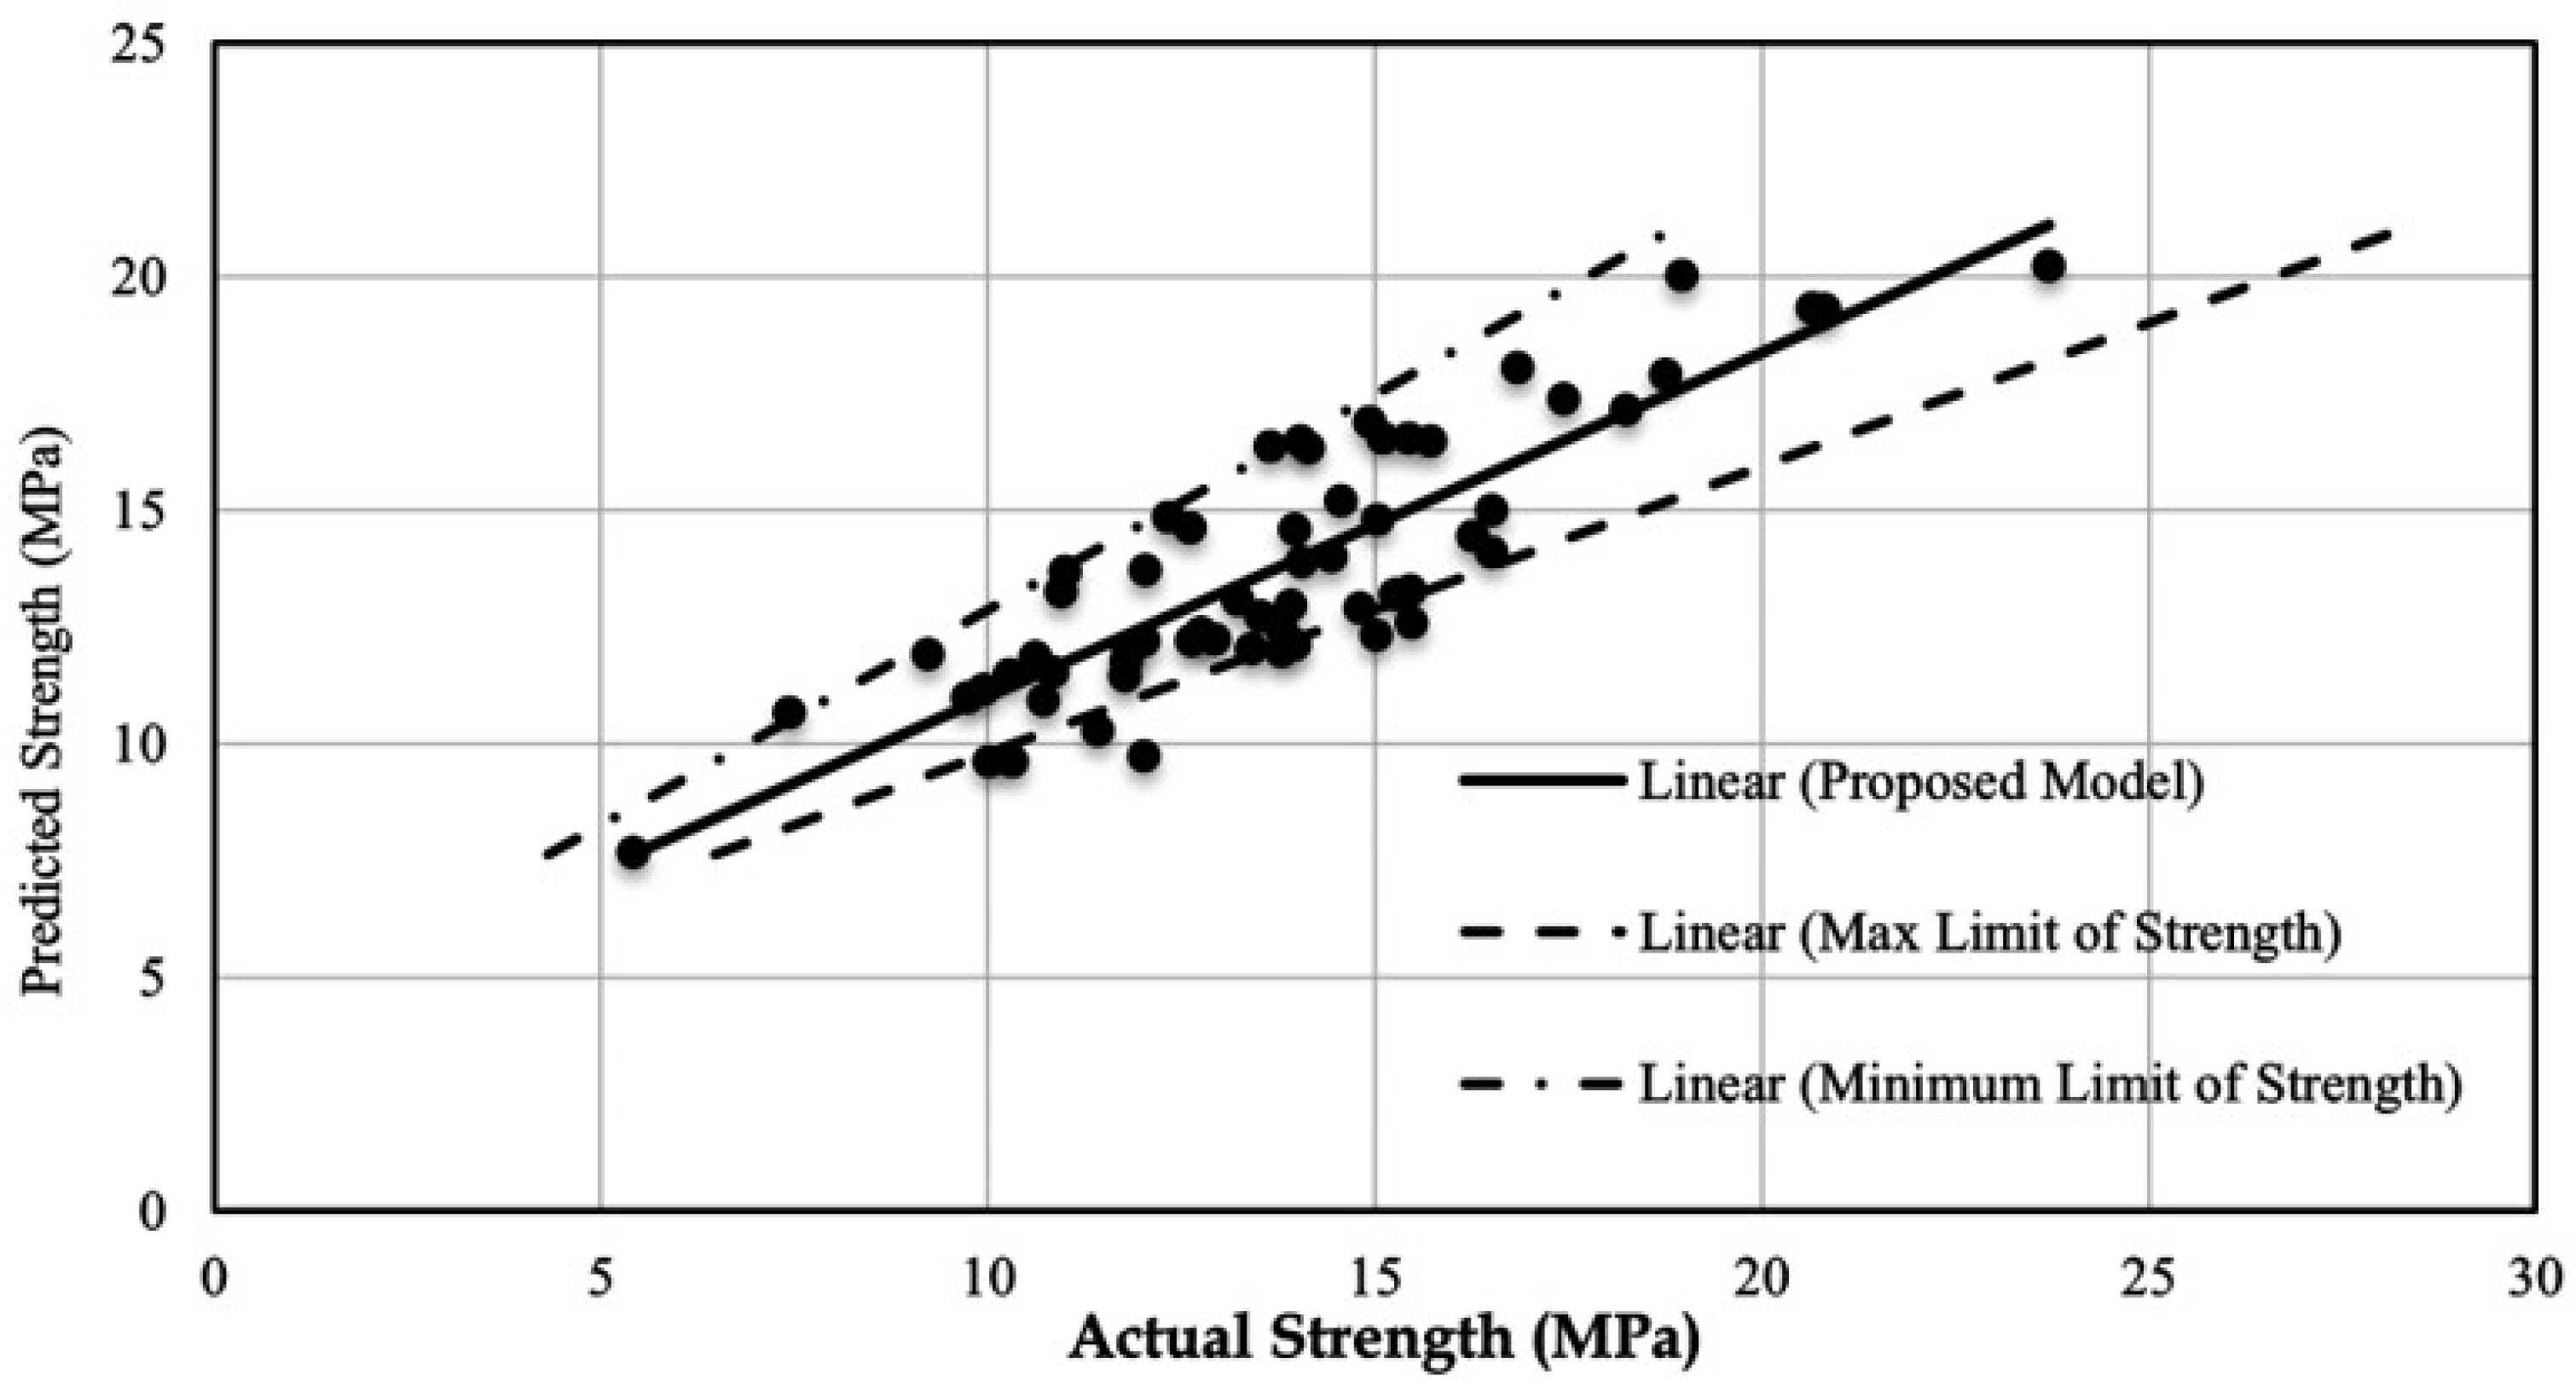
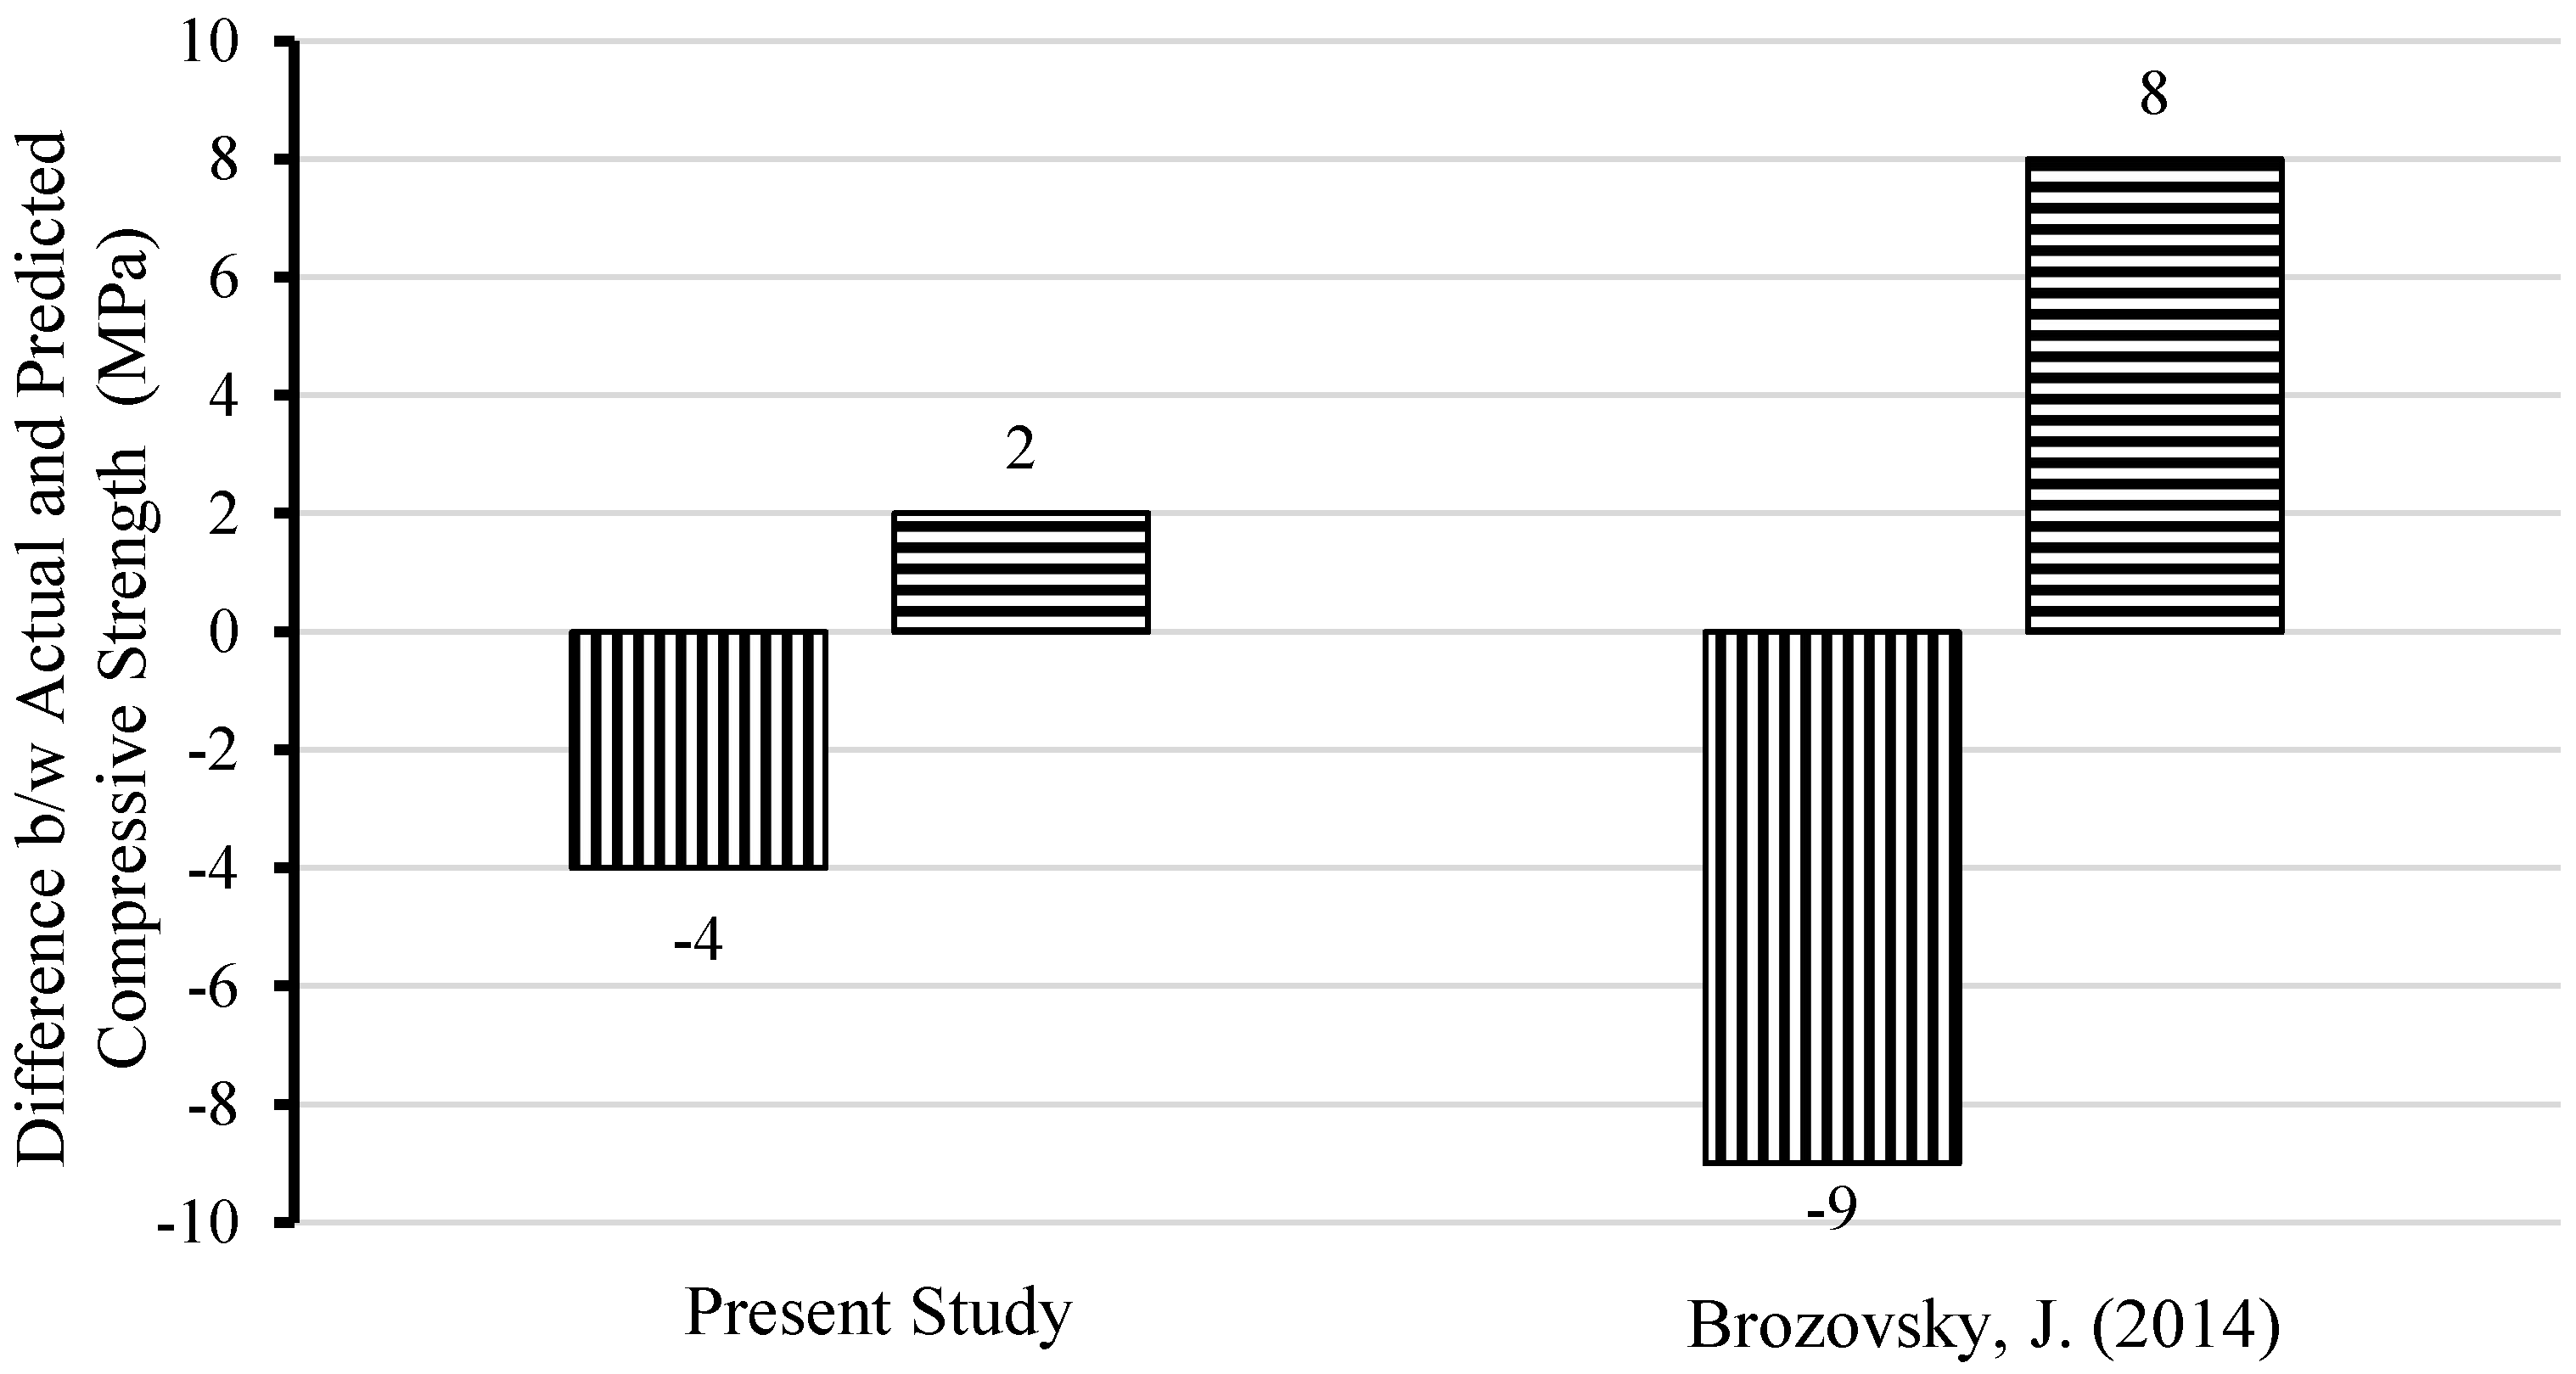
3.2. Brick Quality Assessment Criteria

ASTM C597 [30] provides guidance about the quality and integrity of concrete based upon UPV. However, there is no such standard criteria or correlation that could give an idea about the quality and compressive strength of bricks established from UPV. As mentioned before in the Introduction section, different researchers have developed correlations for the brick units used in their regions; however, there are no such criteria developed for the burnt clay bricks in Pakistan based on which the bricks can be classified for their compressive strength. Hence, based on this study, brick quality assessment criteria were proposed based on the obtained relationship between compressive strength and UPV. The UPV value ranges required to differentiate bricks based on these criteria are presented in Table 2.
According to different local standards, a first-class brick should have a compressive strength greater than 10 MPa [31]. In the developed model, the UPV corresponding to 10 MPa compressive strength is 1800 m/s. Hence, in the proposed criteria, a limit of 2000 m/s is selected to differentiate between first and lower-class bricks. Further, among first-class bricks, as is evident from Figure 15, a UPV value of 3000 means a minimum compressive strength of 15 MPa; hence, this limit of 3000 m/s is proposed to differentiate between good and excellent first-class bricks. It is important to mention that all the samples for this study were collected from structures made from first-class bricks and this is a reason why most of these samples are categorized as first-class samples according to the proposed criteria.

4. Case Study—Brick Quality Assessment of a 100-Year-Old Building

The developed correlations and criteria were applied to a 100-year-old structure, i.e., Umar Hall of the University of Engineering and Technology, (UET) Lahore. The five brick samples of 100 years of age mentioned in previous sections were retrieved from the same building during its renovation. Umar Hall is a dormitory located in UET Lahore. It was constructed in the 1920s and was recently renovated in 2021. It is a marvelous two-storey building that is still serving its purpose. Figure 17 shows the exterior front view of this building.
A UPV test was performed in situ on the walls of this structure, as shown in Figure 18, using the same equipment and procedure as described before for the testing of individual brick units in the laboratory. Other than the tests using direct transmission that were mentioned before, semi-direct and indirect transmissions were also used on the bricks in the laboratory as well as during in situ testing. This was performed to investigate the effectiveness of the UPV test to assess the compressive strength of a brick unit when it is part of a structure and only one or two of its faces are exposed. For the indirect transmission, the transducers were placed along the stretcher face of the same brick and the horizontal distance between the transducers was used to calculate the UPV value. For the semi-direct transmission, one transducer was placed on the header face while the other was placed on the stretcher face and the shortest distance between the two points was used to calculate the UPV value. The correlations developed for the semi-direct and indirect transmissions are presented in Figure 19, and these were not presented before in the previous section for the sake of brevity. The correlation and trend line for direct transmission presented in Figure 19 are the same as shown before in Figure 12 for the five bricks taken from the same structure. It is evident from Figure 19 that the transmission arrangement affects the UPV value.
Figure 19 also shows the in situ values that were recorded for the three transmission cases and their corresponding compressive strength values traced on the y-axis by using the developed linear correlations. The UPV and compressive strength values for the three transmission cases are summarized in Table 3. It can be seen from Table 3 that the in situ tested bricks had a compressive strength greater than 10 MPa for all three transmissions, which complies with the results from the destructive testing of bricks of the same building, as presented in Figure 12. Further, as per the proposed quality assessment criteria, all the in situ tested bricks were first-class bricks of good quality. In a similar way, the proposed criteria can be used to differentiate between new first- and lower-class bricks or for checking the quality of old bricks in existing structures.

5. Conclusions

The main objective of this study was to estimate the compressive strength of bricks using a familiar, user-friendly, and easily available non-destructive test method, i.e., the ultrasonic pulse velocity method. An attempt was made to estimate the compressive strength of bricks by detecting the link between UPV and the compressive strength of bricks of different ages and sources. Ninety bricks of five different ages and from seven different sources were tested for UPV and compressive strength. Only the standard-sized bricks were considered, and the effect of moisture content and porosity of bricks were not considered. The following conclusions can be drawn from this study:
  • The UPV value has a direct relation with the strength of the burnt clay brick. A UPV value of 2000 m/s is required to declare a brick as first class, i.e., minimum compressive strength of 10 MPa. A UPV value greater than 3000 m/s indicates a brick with a minimum compressive strength of 15 MPa.
  • The UPV test can be used for assessing the compressive strength of new bricks with an accuracy of more than 80%.
  • The case study example of a 100-year-old structure shows that the proposed quality assessment criteria based on UPV can be used to fairly assess the compressive strength of old bricks used in existing structures.
Generalizing the proposed quality assessment criteria to differentiate second- and third-class bricks, and considering the density, durability, and water absorption characteristics in addition to the compressive strength of the bricks will be the focus of research in the continuation of this study.

Author Contributions

Conceptualization, R.A.; Data curation, E.U.H.; Formal analysis, E.U.H.; Investigation, M.R.R., A.S. and M.Z.; Methodology, R.A., M.R.R. and E.U.H.; Project administration, R.A.; Software, E.U.H.; Supervision, R.A., A.S. and M.Z.; Validation, M.R.R., A.S. and M.Z.; Writing—original draft, M.R.R.; Writing—review & editing, R.A. and M.Z. All authors have read and agreed to the published version of the manuscript.

Funding

This research received no external funding.

Institutional Review Board Statement

Not applicable.

Informed Consent Statement

Not applicable.

Data Availability Statement

Not applicable.

Acknowledgments

The contributions of final year students Zaib un Nisa, Ayesha Siddiqa, Hammad Yousaf, Mubushra Khalil, Mohammad Qasim, and Muhammad Umer Farooq in the experimentation are highly acknowledged.

Conflicts of Interest

The authors declare no conflict of interest.

References

  1. ICIMOD. Fact Sheet: Brick Sector in Pakistan; International Centre for Integrated Mountain Development: Kathmandu, Nepal, 2019. [Google Scholar]
  2. Lodi, S.H.; Sangi, A.J.; Abdullah, A. Housing Report: Brick Masonry Construction in Pakistan. In World Housing Encyclopedia; EERI: Oakland, CA, USA, 2013. [Google Scholar]
  3. Mahmood, T.; Gulzar, S.; Awan, M.Y. An Analytical Study of Colonial and Contemporary Bricks from the Buildings of Lahore, Pakistan. J. Res. Archit. Plan. 2018, 24, 26–33. [Google Scholar] [CrossRef]
  4. Dizhur, D.; Lumantarna, R.; Biggs, D.T.; Ingham, J.M. In-situ assessment of the physical and mechanical properties of vintage solid clay bricks. Mater. Struct. 2017, 50, 63. [Google Scholar] [CrossRef]
  5. Tariq, A.R.; Nawaz, R.; Khan, M.S.; Ashraf, M.W.; Tayyaba, S.; Ahmad, N. Quality evaluation of bricks of different brick kilns in Punjab Province (Pakistan). J. Food Agric. Environ. 2014, 12, 496–498. [Google Scholar]
  6. Koroth, S.R.; Fazio, P.; Feldman, D. Evaluation of clay brick durability using ultrasonic pulse velocity. J. Archit. Eng. 1998, 4, 142–147. [Google Scholar] [CrossRef]
  7. Debailleux, L. Schmidt hammer rebound hardness tests for the characterization of ancient fired clay bricks. Int. J. Archit. Herit. 2019, 13, 288–297. [Google Scholar] [CrossRef]
  8. Papaniaros, P.A.K.; Baros, D.K.; Kalapodis, N.A.; Anifantis, N.K. Prediction of mechanical properties of thick concrete members or masonaries utilizing ultrasonics. In Proceedings of the 1st International Conference of the Greek Society of Experimental Mechanics of Materials, Procedia Structural Integrity, Athens, Greece, 10–12 May 2018; Volume 10, pp. 311–318. [Google Scholar]
  9. Schuller, M.P. Nondestructive testing and damage assessment of masonry structures. In Proceedings of the NSF/RILEM Workshop, In-Situ Evaluation of Historic Wood and Masonry Structures, Prague, Czech Republic, 10–14 July 2006. [Google Scholar]
  10. Pi, T.; Du, Z.; Zhang, H. Experimental Study on Basic Mechanical Properties of Core-Column Non-mortar Aerated Concrete Block Masonry. Int. J. Concr. Struct. Mater. 2021, 15, 18. [Google Scholar] [CrossRef]
  11. Brozovsky, J. Determine the compressive strength of calcium silicate bricks by combined nondestructive method. Sci. World J. 2014, 2014, 829794. [Google Scholar] [CrossRef]
  12. Ma, S.; Wu, Y.; Bao, P. Experimental study on the properties of modern blue clay brick for Kaifeng People’s Conference Hall. Sci. Rep. 2021, 11, 20631. [Google Scholar] [CrossRef]
  13. Napolitano, R.; Hess, M.; Glisic, B. Integrating Non-Destructive Testing, Laser Scanning, and Numerical Modeling for Damage Assessment: The Room of the Elements. Heritage 2019, 2, 151–168. [Google Scholar] [CrossRef] [Green Version]
  14. Laefer, D.F.; Zahiri, Z.; Gowen, A. Using Short-wave Infrared Range Spectrometry Data to Determine Brick Characteristics. Int. J. Archit. Herit. 2018, 14, 38–50. [Google Scholar] [CrossRef]
  15. Petro, J.T.; Kim, J. Detection of delamination in concrete using ultrasonic pulse velocity test. Constr. Build. Mater. 2011, 26, 574–582. [Google Scholar] [CrossRef]
  16. Saint-Pierre, F.; Philibert, A.; Giroux, B.; Rivard, P. Concrete quality designation based on ultrasonic pulse velocity. Constr. Build Mater. 2016, 125, 1022–1027. [Google Scholar] [CrossRef]
  17. Aliabdo, A.A.E. Reliability of using nondestructive tests to estimate compressive strength of building stones and bricks. Alex. Eng. J. 2012, 51, 193–203. [Google Scholar] [CrossRef] [Green Version]
  18. Brozovsky, J.; Zach, J.; Brozovsky, J., Jr. Determining the strength of solid burnt bricks in historical structures. In Proceedings of the Paper Presented at the 9th International Conference on NDT of Art, Jerusalem, Israel, 25–30 May 2008. [Google Scholar]
  19. Noor-E-Khuda, S.; Albermani, F. Mechanical properties of clay masonry units: Destructive and ultrasonic testing. Constr. Build. Mater. 2019, 219, 111–120. [Google Scholar] [CrossRef]
  20. Mesquita, E.; Martini, R.; Alves, A.; Antunes, P.; Varum, H. Non-destructive characterization of ancient clay brick walls by indirect ultrasonic measurements. J. Build. Eng. 2018, 19, 172. [Google Scholar] [CrossRef]
  21. Vasanelli, E.; Micelli, F.; Colangiuli, D.; Calia, A.; Aiello, M.A. A non destructive testing method for masonry by using UPV and cross validation procedure. Mater. Struct. 2020, 53, 134. [Google Scholar] [CrossRef]
  22. Ozkan, I.; Yayla, Z. Evaluation of correlation between physical properties and ultrasonic pulse velocity of fired clay samples. Ultrasonics 2016, 66, 4–10. [Google Scholar] [CrossRef]
  23. Araújo, E.; Sousa, I.; Paz, R.; Costa, C.H.; Mesquita, E. Physical and mechanical characterization of traditional Brazilian clay bricks from different centuries. J. Build. Pathol. Rehabil. 2020, 5, 22. [Google Scholar] [CrossRef]
  24. Kasinikota, P.; Tripura, D.D. Prediction of physical-mechanical properties of hollow interlocking compressed unstabilized and stabilized earth blocks at different moisture conditions using ultrasonic pulse velocity. J. Build. Eng. 2022, 48, 103961. [Google Scholar] [CrossRef]
  25. Galán-Marín, C.; Rivera-Gómez, C.; Bradley, F. Ultrasonic, Molecular and Mechanical Testing Diagnostics in Natural Fibre Reinforced, Polymer-Stabilized Earth Blocks. Int. J. Polym. Sci. 2013, 2013, 130582. [Google Scholar] [CrossRef] [Green Version]
  26. Kondekar, V.G.; Jaiswal, O.R.; Gupta, L.M. Ultrasonic Pulse Velocity Testing of Gadhi Soil Adobe Bricks. Int. J. Eng. Res. Mech. Civ. Eng. (IJERMCE) 2018, 3, 467–473. [Google Scholar]
  27. Jasiński, R.; Drobiec, Ł.; Mazur, W. Validation of Selected Non-Destructive Methods for Determining the Compressive Strength of Masonry Units Made of Autoclaved Aerated Concrete. Materials 2019, 12, 389. [Google Scholar] [CrossRef] [PubMed] [Green Version]
  28. ASTM C67; Standard Test Methods for Sampling and Testing Bricks and Structural Clay Tile. American Society of Testing Material: West Conshohocken, PA, USA, 2003.
  29. Naik, T.R.; Malhotra, V.M.; Popovics, J.S. The Ultrasonic Pulse Velocity Method. In CRC Handbook on Nondestructive Testing of Concrete; Malhotra, V.M., Carino, N.J., Eds.; CRC Press: Boca Raton, FL, USA, 2004. [Google Scholar]
  30. ASTM C597; Standard Test Method for Pulse Velocity through Concrete. American Society for Testing and Materials: West Conshohocken, PA, USA, 2016.
  31. Waheed, A.; Azam, R.; Riaz, M.R.; Zawam, M. Mechanical and durability properties of fly-ash cement sand composite bricks: An alternative to conventional burnt clay bricks. Innov. Infrastruct. Solut. 2022, 7, 24. [Google Scholar] [CrossRef]
Figure 1. Test setup for UPV, (a) direct transmission; (b) semi-direct transmission; (c) indirect transmission.
Buildings 12 01069 g001
Figure 2. Scrubbed surface of new brick specimens.
Buildings 12 01069 g002
Figure 3. UPV test setup.
Buildings 12 01069 g003
Figure 4. Capped bricks.
Buildings 12 01069 g004
Figure 5. Compressive testing setup of capped brick.
Buildings 12 01069 g005
Figure 6. UPV vs. compressive strength.
Buildings 12 01069 g006
Figure 7. Actual vs. predicted compressive strength.
Buildings 12 01069 g007
Figure 8. Maximum difference between actual and predicted strength [11].
Buildings 12 01069 g008
Figure 9. UPV vs. compressive strength of 25-year-old bricks.
Buildings 12 01069 g009
Figure 10. UPV vs. compressive strength of 35-year-old bricks.
Buildings 12 01069 g010
Figure 11. Compressive strength vs. UPV of 75-year-old bricks.
Buildings 12 01069 g011
Figure 12. Compressive strength vs. UPV of 100-year-old bricks.
Buildings 12 01069 g012
Figure 13. Old bricks combined data.
Buildings 12 01069 g013
Figure 14. Actual vs. predicted equation strength.
Buildings 12 01069 g014
Figure 15. Compressive strength vs. UPV of all new and old bricks combined.
Buildings 12 01069 g015
Figure 16. Actual vs. predicted strength in the case of all bricks combined.
Buildings 12 01069 g016
Figure 17. Elevation view of Umar Hall, a 100-year-old building.
Buildings 12 01069 g017
Figure 18. Performing in situ UPV test on Umar Hall building. (a) Semi-direct transmission, (b) indirect transmission.
Buildings 12 01069 g018
Figure 19. Compressive strength vs. UPV for Umar Hall.
Buildings 12 01069 g019
Table 1. Details of test specimen.
Brick TypeSource/Age
(Years)
Representative
Sample
Number of
Bricks
Dimensions (mm)Density
(kg/m3)
LengthWidthThickness
NewKiln 1 Buildings 12 01069 i00120219.6 ± 3.2108.2 ± 2.173.6 ± 0.91760.5 ± 36.3
Kiln 2 Buildings 12 01069 i00220220.4 ± 4.4108.5 ± 3.373.1 ± 1.11782.2 ± 30.5
Kiln 3 Buildings 12 01069 i00320223.5 ± 2.7110.1 ± 2.073.3 ± 0.71762.6 ± 25.4
Old25 Buildings 12 01069 i0047220.5 ± 3.5107.8 ± 1.774.0 ± 1.11785.9 ± 42.9
35 Buildings 12 01069 i00510226.8 ± 3.2108.6 ± 3.570.1 ± 1.91848.7 ± 51.1
75 Buildings 12 01069 i0068229.2 ± 4.8116.6 ± 3.475.3 ± 1.71692.3 ± 56.0
100 Buildings 12 01069 i0075225.1 ± 4.9109.4 ± 2.971.2 ± 1.81823.2 ± 63.8
Table 2. Proposed brick quality assessment criteria based on UPV.
UPV (m/s)Quality of Bricks
>3000Excellent
2000–3000Good
<2000Poor
Table 3. In situ values of UPV for Umar Hall.
TransmissionUPV
(m/s)
Compressive Strength
(MPa)
Direct2824.512.77
Semi-direct5345.116
Indirect3116.914.74
Publisher’s Note: MDPI stays neutral with regard to jurisdictional claims in published maps and institutional affiliations.

