Article

Parametric Investigation on the Effectiveness of FRM-Retrofitting in Masonry Buttressed Arches

Department of Architecture and Industrial Design, University of Campania “Luigi Vanvitelli”, 81031 Aversa, CE, Italy
*
Author to whom correspondence should be addressed.
Buildings 2021, 11(9), 406; https://doi.org/10.3390/buildings11090406
Submission received: 21 July 2021 / Revised: 3 September 2021 / Accepted: 7 September 2021 / Published: 11 September 2021

Abstract

:
Buttressed arches represent some of the most vulnerable elements in historical masonry buildings under seismic actions. Given their structural, architectural and often artistic importance, it is paramount to investigate effective retrofitting measures which satisfy reversibility and compatibility requirements for historical heritage. Among these, Fibre-Reinforced Mortar (FRM), characterised by enhanced ductility, has recently emerged in the scientific literature. In this paper, a numerical investigation aimed at exploring the effectiveness of this seismic retrofitting technique, when applied at intrados or extrados of various typologies of buttressed arches, is presented. An automatic tool for limit analysis is described and validated against a nonlinear Discrete Macro-Element modelling approach. This precedes an extensive parametric analysis, which has highlighted the effect of various geometrical features of the system on both collapse mechanism and maximum acceleration in the unreinforced configuration, and the high increase in seismic capacity provided by the retrofitting. This is particularly remarkable in case of local mechanism, i.e., wholly within the arch, in which case the FRM may be responsible of an overall shifting to a semi-global failure type.

1. Introduction

Most historical and artistical heritage in Europe and worldwide is made of unreinforced masonry (URM). Palaces, worship places and infrastructures represent distinctive features of any inhabited territory, and ought to be assessed, preserved and, if needed, enhanced in order to withstand anthropic and natural actions expected during their life. Focussing on seismic loading, masonry arches and vaults represent some of the most vulnerable elements of ancient structures [1] and thus in the last decades a significant research effort has been devoted to their assessment and retrofitting. Some recent studies have targeted the very common configuration constituted by semicircular arches with buttresses [2,3,4], highlighting the need for further developments regarding seismic vulnerability assessment and retrofitting design of this structural typology. Parametric investigations on the seismic capacity of URM buttressed arches of different shapes are reported in [5,6], also providing a comparison between different modelling methods.
The main traditional retrofitting techniques used in practice to increase the structural capacity of arches and vaults are tie rods or buttresses counteracting the thrust, which produce a significant change in the aesthetics and mechanical behaviour of the original structure. Other methods as Fibre Reinforced Polymers (FRP) in form of sheets or plates have proved very effective in terms of strength increment [7], but they do not satisfy compatibility and reversibility prescriptions for heritage structures. Furthermore, delamination often precedes failure of reinforcement, whose larger strength cannot thus be achieved; also, epoxy resins, in addition to the high costs and the need for specialised personnel in the installation, suffer from degradation in case of exposure to high or low temperatures, fire, ultraviolet rays, water and alkaline environment. Studies involving experimental tests and analytical/numerical modelling of FRP-reinforced arches and their main failure modes are reported in [8,9].
From the point of view of compatibility with existing materials, the use of lime-based mortar as re-pointing or surface treatment would represent the optimal material, but its low tensile strength and high brittleness make it unsuitable as a retrofitting technique. For this reason, lime-based or cementitious mortar is usually coupled to polymeric [10,11] or natural [12,13] meshes that act as embedded reinforcement and modify the structural strength and ductility (Fabric-Reinforced Cementitious Matrix, FRCM). In [14], an extensive set of over 400 tests from the literature is analysed to determine the effectiveness of inorganic composite materials to enhance in-plane shear capacity of URM walls, with the proposal of shear stress amplification factors. The widespread use of FRCM as retrofitting technology is also testified by the release of standards ruling acceptance criteria for FRCM application [15] and design and construction of strengthening systems [16]. Another innovative approach recently proposed is the introduction of short fibres of various type in the mortar paste [17]. The role of the fibres mainly consists of ensuring a more ductile post-cracking performance of the Fibre Reinforced Mortar (FRM) system. Factors that affect the retrofitting capability of FRM are the matrix composition (cement, lime, gypsum, pozzolana, additives, the presence of short fibres, etc.), type of fibre (carbon, glass, PBO, steel, basalt, etc.), fibre size and fibre orientation. This reinforcement method has been recently proposed for retrofitting masonry walls [18] and arches and vaults [19] leading to very promising results, even though in some cases high stiffness and strength of the reinforcement led to a significant brittleness and unexpected failure modes in the arch. The use of lime-based composites with low strength and stiffness and high ductility seems the most indicated approach for reinforcement of ancient vaults and arches, satisfying compatibility and reversibility requirements and providing effective enhancement to the seismic behaviour of the system.
In this paper, an extensive numerical investigation on the seismic behaviour of unreinforced masonry arches with buttresses and the effectiveness of FRM reinforcement is presented. An ad-hoc automatic tool was created for parametric limit analysis of arches with reinforcement in the form of FRM mortar layer applied at intrados or extrados of the arch. The role of buttresses in the collapse mechanism is analysed on various typologies of arches, from semicircular to various pointed arches, with the aim of highlighting the configurations where such reinforcement can be more appropriate.

2. Methods

2.1. Limit Analysis of Buttressed Arches

The most advanced methods of analysis for arches and vaults are based on Finite Element [20] or Discrete Macro-Element [21] modelling, with several variants existing in the literature. These approaches allow for a detailed geometrical and mechanical description of the system, but present two main problematic aspects: (1) the complete set of material parameters may be difficult to obtain, and uncertainty in some of them may have unexpected effects on the response prediction [22]; (2) realistic masonry materials have characteristics (softening, anisotropy, brittleness) which induce additional concerns on the computational side, and often simulations suffer from lack of robustness. For this reasons, parametric analyses, for instance aimed at informing large-scale assessment methods, should be based on simple, robust yet reliable methods with reduced number of input parameters [23]. Among these, since the seminal work of Heyman [24], limit analysis is particularly suitable for the analysis of masonry arches and for this reason it is still widely used in research and professional communities [25,26], even in combination with more advanced methodologies [27].
Limit analysis of masonry structures is based on Heyman’s hypotheses:
1.
Masonry does not have any tensile strength;
2.
Masonry has infinite compressive strength;
3.
Masonry has infinite shear strength, i.e., sliding between masonry parts cannot occur.
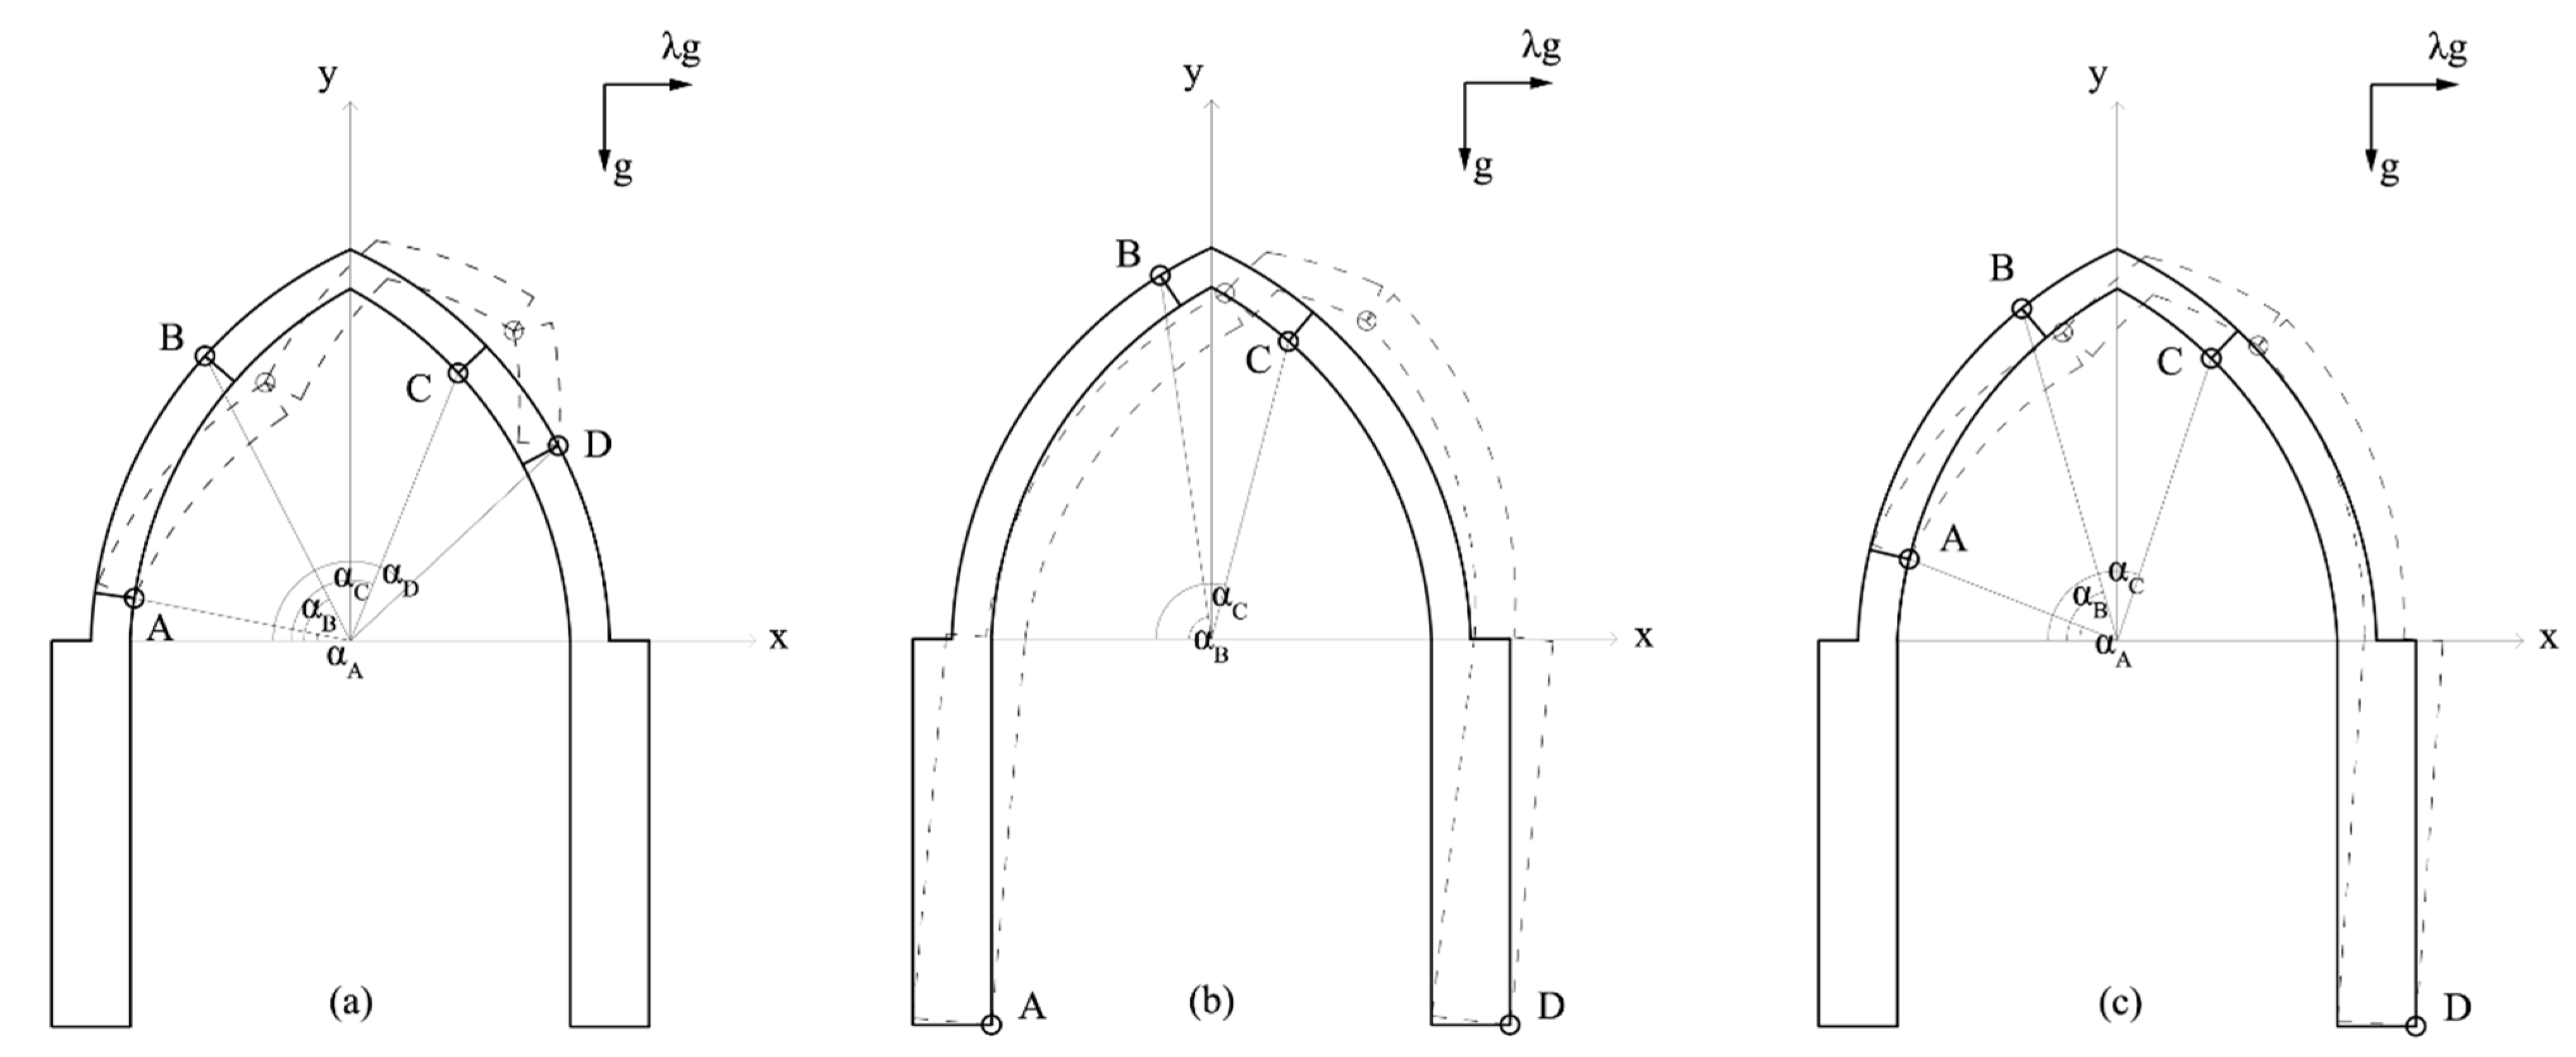
In buttressed arches subjected to vertical and seismic loadings, the development of a series of four flexural hinges, alternatively opening on the intrados or extrados, is a necessary and sufficient condition to generate a collapse mechanism. In particular, three mechanism types can be activated [28] (Figure 1):
(I)
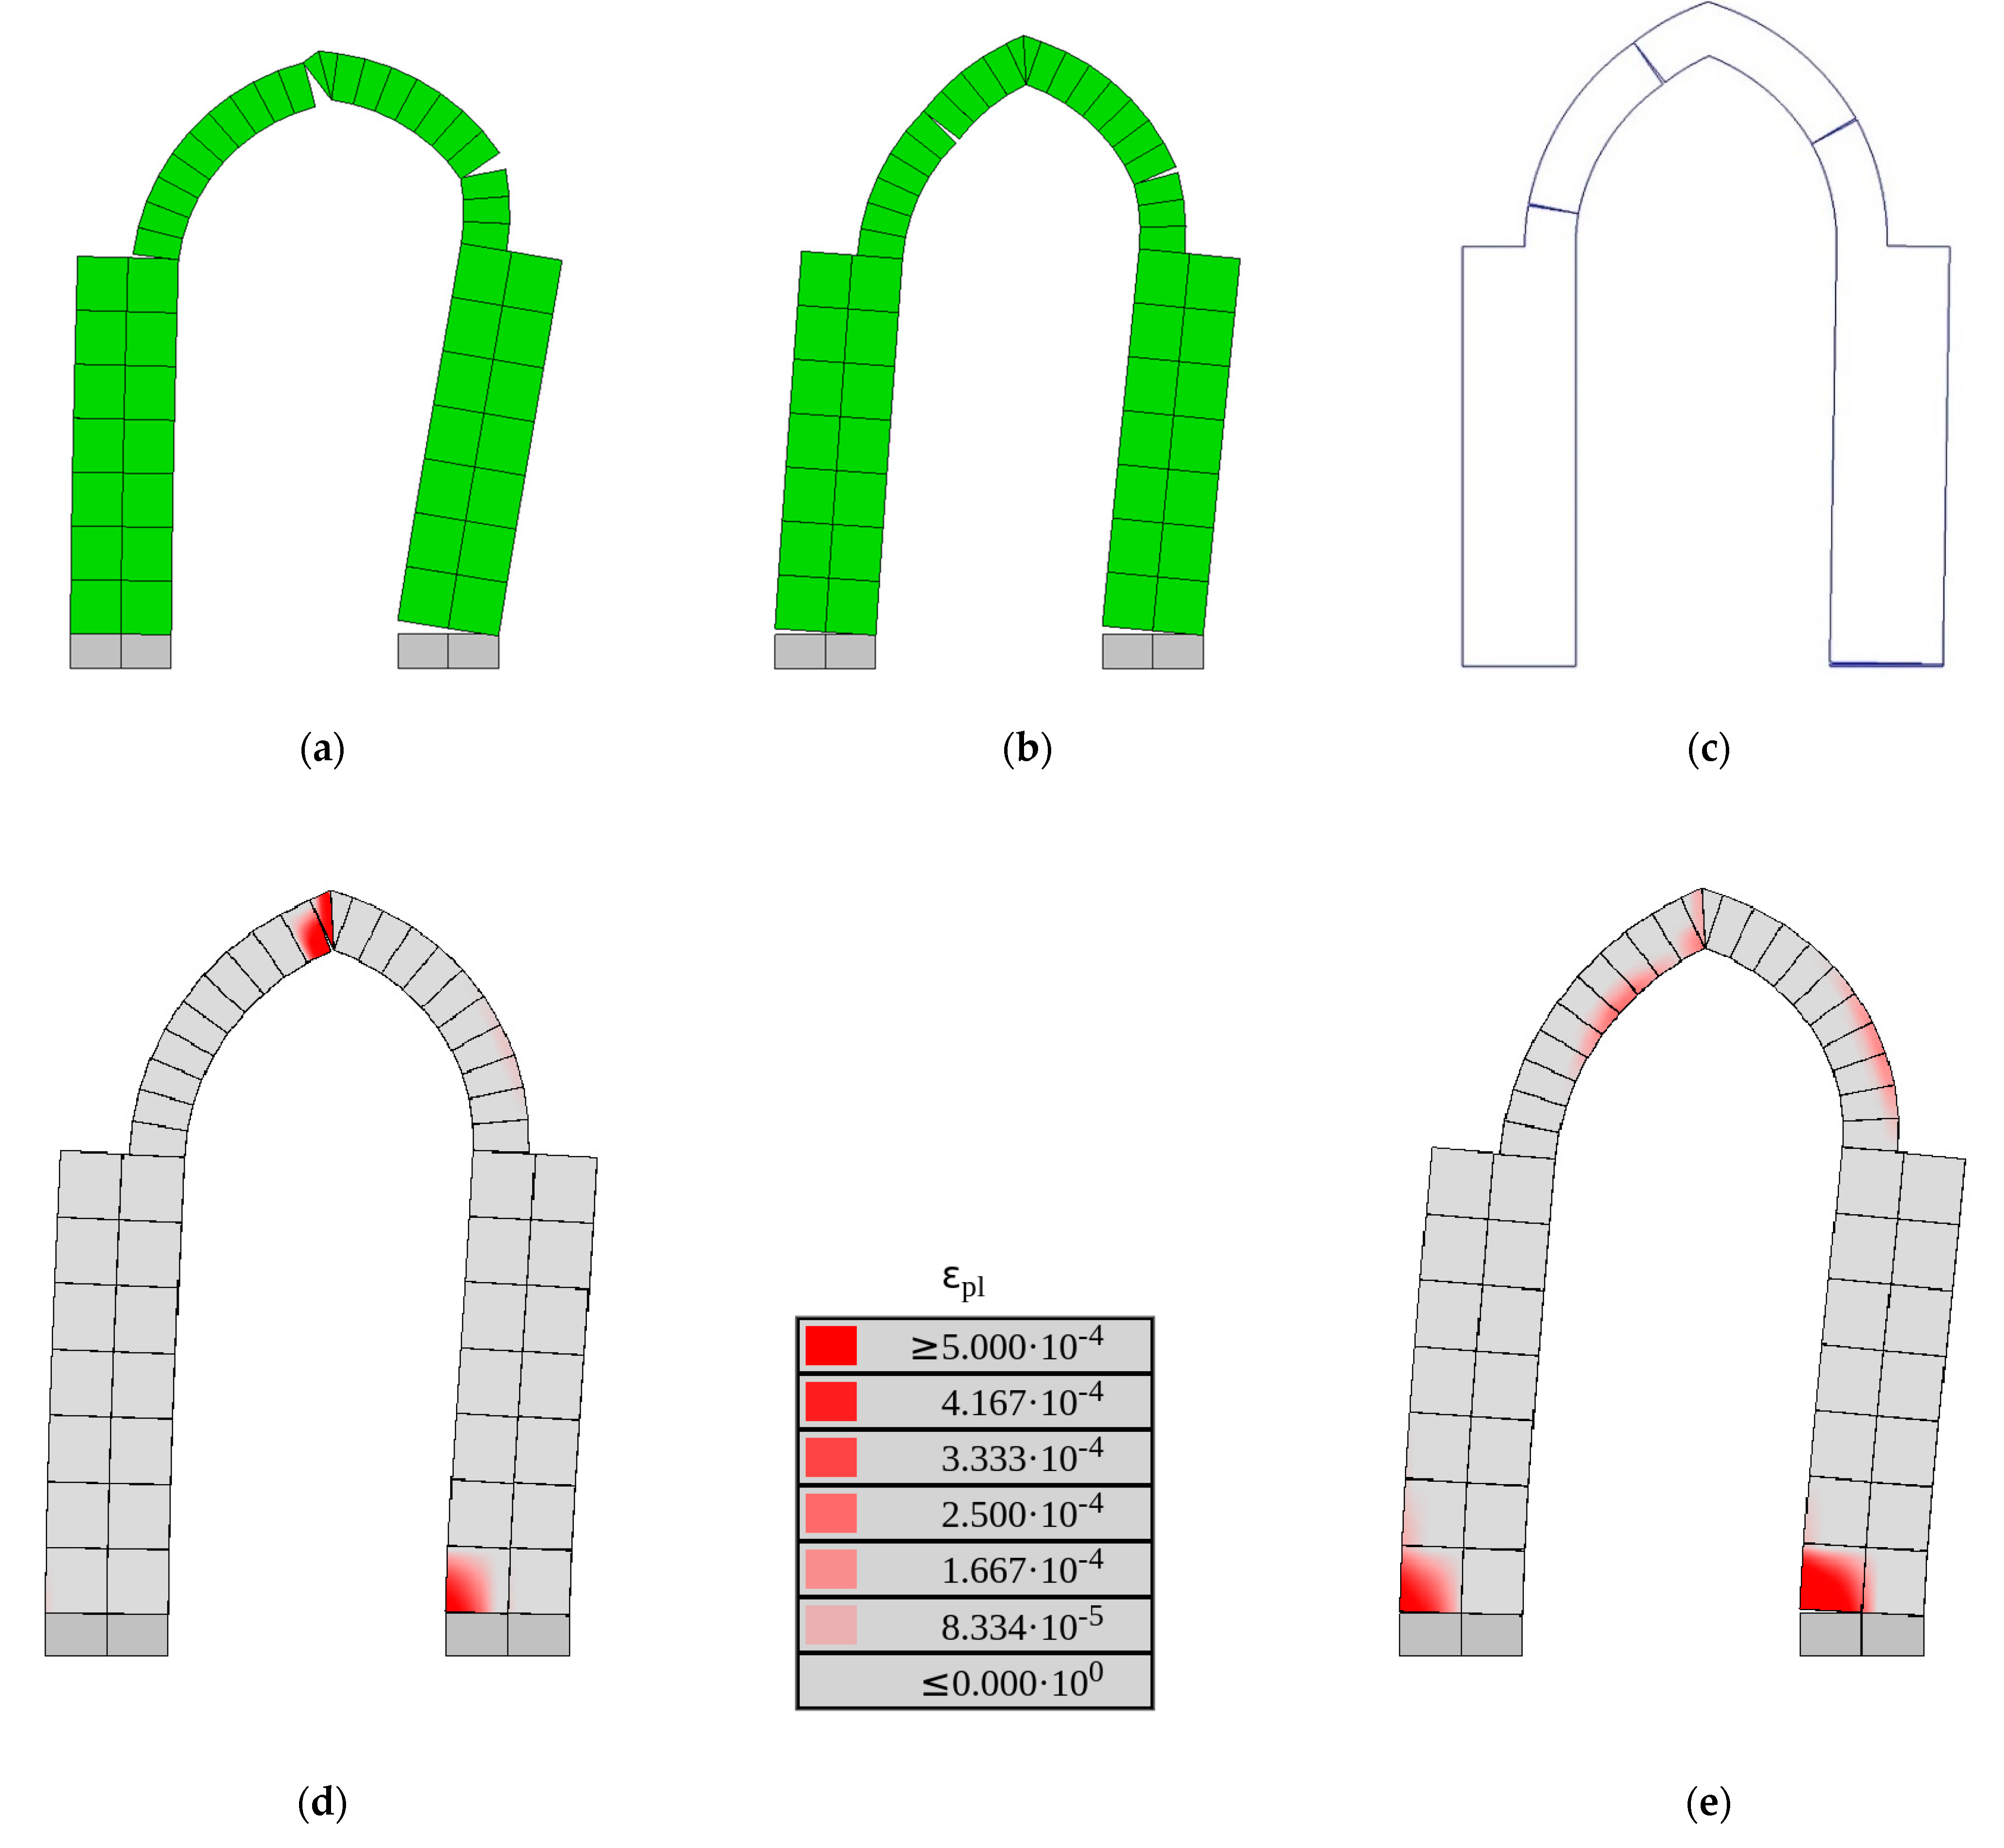
Local mechanism (L), with the formation of four hinges A, B, C and D within the thickness of the arch, whose locations are identified through the angles αA, αB, αC and αD, measured with respect the horizontal line;
(II)
Global mechanism (G), characterised by the presence of two hinges at the pier basis A (internal) and D (external) and two hinges B and C within the thickness of arch, whose positions are defined by the angles αB and αC, respectively;
(III)
Semi-global mechanism (S); characterised by the presence of one hinge D at the base of the pier (external) and three hinges A, B and C within the thickness of the arch, whose positions are identified by the angles αA, αB and αC.
The development of the flexural hinges on the system leads to the identification of three blocks, each of which rotates around its own centre of absolute rotation by an angle ϑ i . To maintain compatibility of displacements, the three rotations depend on a single Lagrangian parameter ϑ , which without loss of generality may be set equal to the keystone displacement. In the framework of small displacements, the rotations ϑ i are linear functions of ϑ , and are obtained from kinematic chains after identifying the position of the individual centres of rotations Ci, i = 1, 2, 3. While centres C1 and C3 are easily located as the points A and D, respectively, C2 comes from the sufficient and necessary condition of collinearity between absolute and relative centres of rotation for all blocks.
Limit analysis can be carried out according to either the static or kinematic method. In this paper, the second approach is used. According to the kinematic theorem of limit analysis [28], given a loading state characterised by N constant static forces F i S and M incrementally increasing forces λ F j I , the multiplier λ k for a pre-defined mechanism k is obtained by writing the Principle of Virtual Works (PVW):
W e x t k = i = 1 N F i S u i k + λ k j = 1 M F j I u j k = W i n t k
where W e x t k , W i n t k are the works done by external and internal forces for the virtual displacements of the mechanism k, respectively, and u i k is the displacement at the loading application point i. From Equation (1) λ k is evaluated as:
λ k = W i n t k ϑ i = 1 N F i S u i k ϑ j = 1 M F j I u j k ϑ
If the static loads are the weight of the structure and the increasing loads are horizontal forces proportional to the mass, Equation (2) specialises into:
λ k = W i n t k ϑ i = 1 N W i v i k ϑ i = 1 N W i u i k ϑ
where W i is the weight of the i-th block, and u i k and v i k are its horizontal and vertical displacement at centroid, respectively.
Equation (2) for a given mechanism represents an equilibrium condition, and in general the PVW may be applied to any deformed configuration to evaluate the multiplier of a certain set of variable applied forces in order for them to be in equilibrium with the constant loads. If the Lagrangian parameter ϑ univocally identifies the deformation of the system, the solution providing the minimum multiplier among all the possible deformation shapes is also the real solution of the structural problem:
λ t r u e ϑ = min k λ k ϑ
W i n t k in Equation (2) represents the internal work, and given its positiveness, always represents an additional term to the collapse multiplier. We can identify different cases:
  • Elastic behaviour. In this case, the internal work reads W i n t k = Ω σ : ε   d Ω where Ω is the domain volume. Since at collapse plastic deformations are usually much larger than elastic, this contribution on the overall energy is usually disregarded and the blocks are assumed to be rigid.
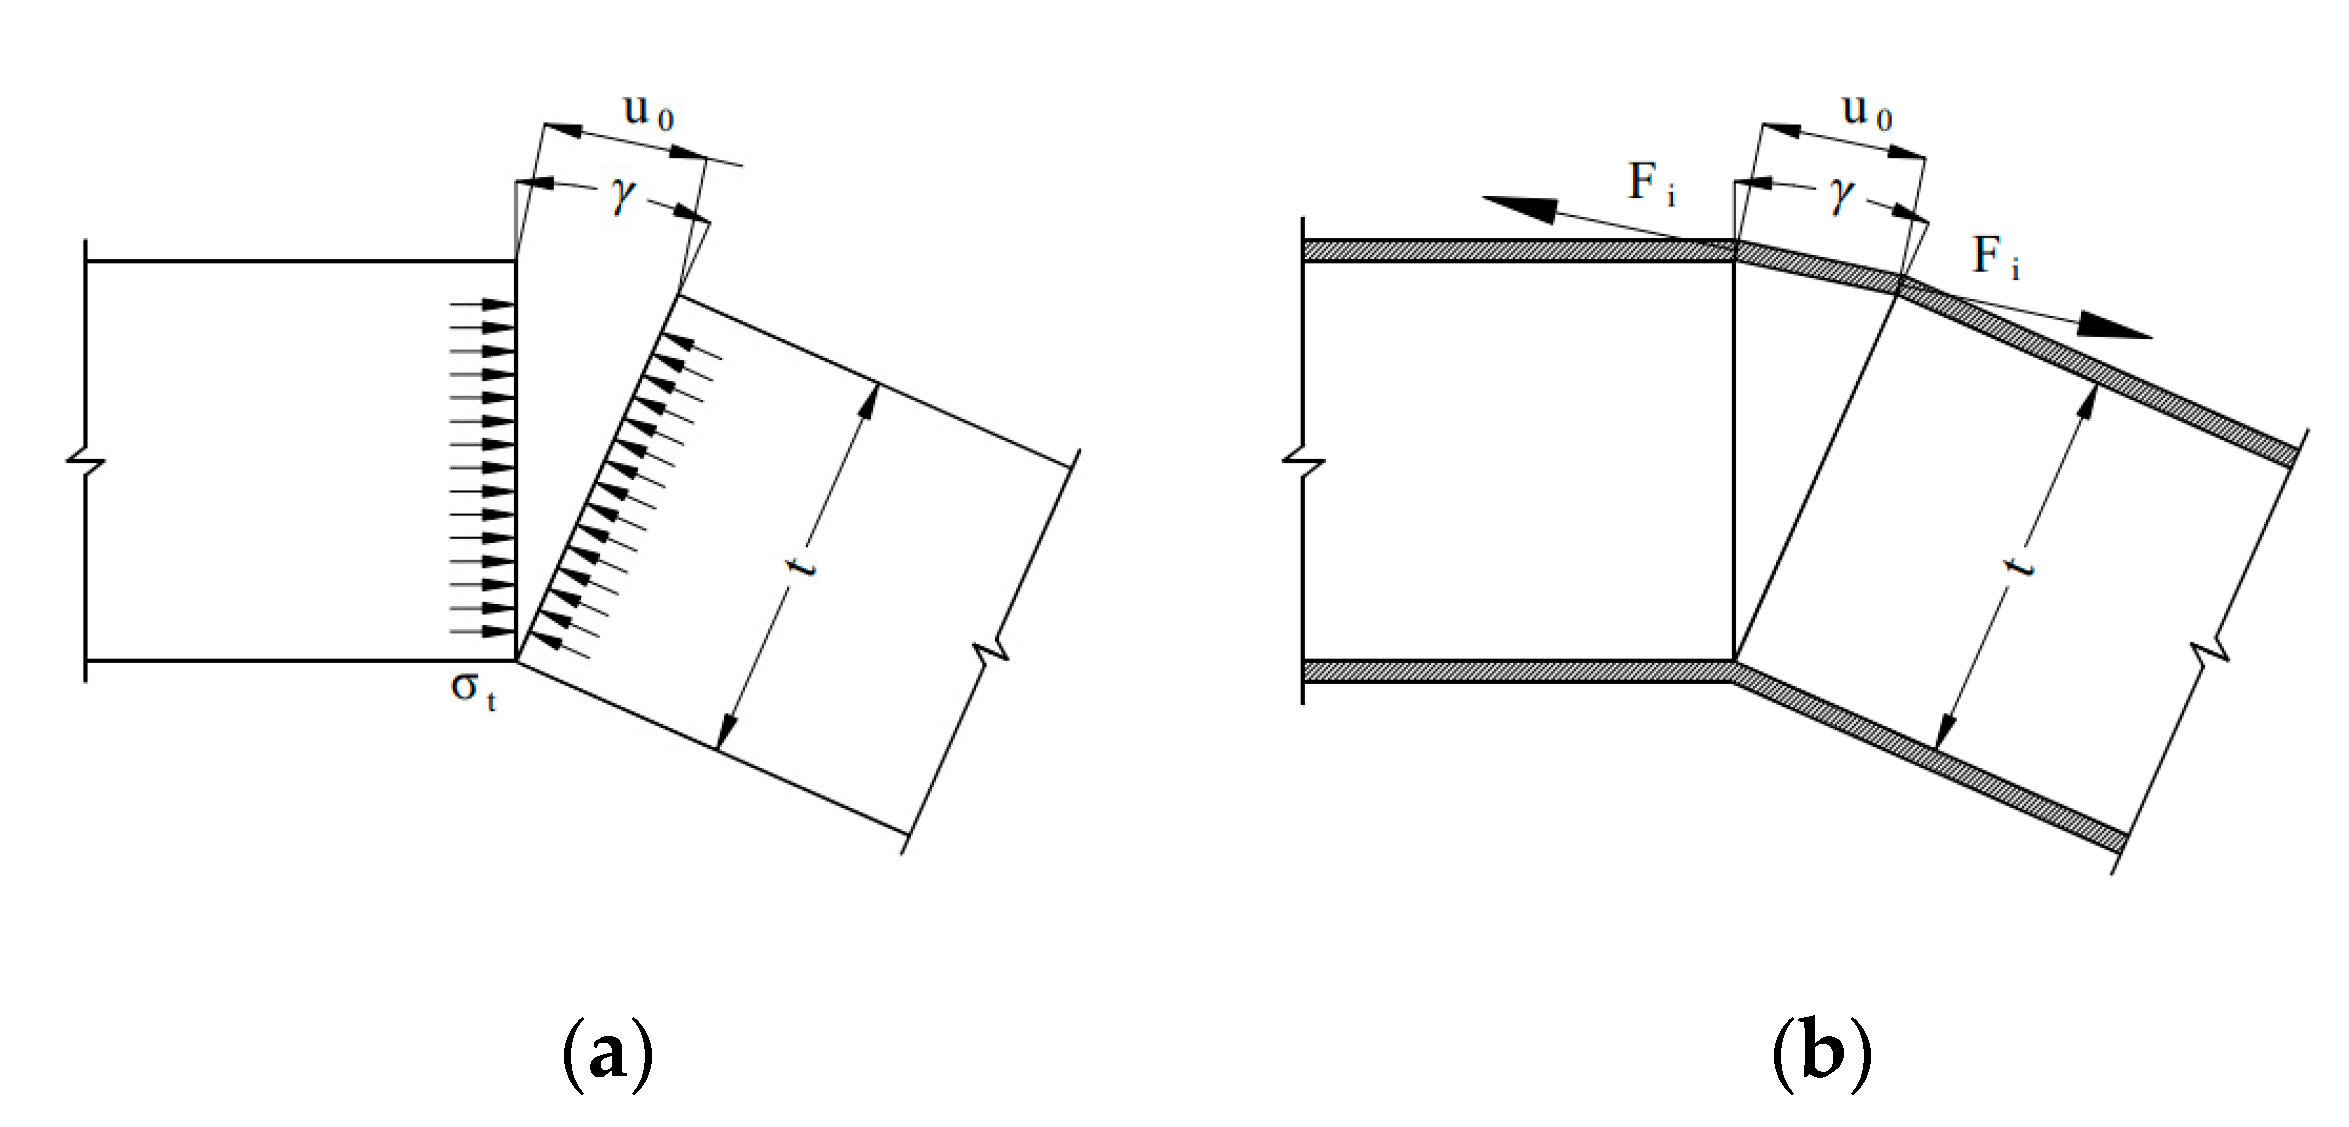
  • Perfectly plastic hinges. In this case a constant distribution of stresses is assumed along the crack, equal to tensile strength σ t (Figure 2a); the displacement profile is linear and equal to u x = u 0 t x , where u 0 is the maximum crack opening, u 0 = γ t with γ angular opening of the hinge, t the member thickness and x the local axis parallel to the crack. The internal work of the i-th hinge becomes:
    W i n t , i k = 1 2 σ t t u 0 ϑ
  • Not resisting hinge. This is the usual case in the analysis of masonry structures at collapse. The internal work of the i-th hinge is null, W i n t , i k = 0 .
  • Perfectly plastic reinforcement at intrados or extrados (Figure 2b). In this case, it is possible to assume that upon crack opening the reinforcement is able to provide a force equal to F i = f r e i n f t r e i n f with f r e i n f tensile strength of the reinforcement and t r e i n f its thickness. The virtual work is W i n t , i k = F i u 0 ϑ if the hinge opens on the side of the reinforcement, zero otherwise, since the contribution of FRM reinforcement can usually be neglected in compression.
Focussing now on the plastic cases 2–4, in Equation (2) the dependence on the Lagrangian parameter ϑ is given by a first-degree homogeneous function for the displacements u k and u 0 in case of small rotations. If W i n t k is also first-degree homogeneous function in ϑ , the dependency cancels out and the multiplier λ k is independent on the amplitude of the mechanism: this is the case of perfectly plastic hinge (2), not resisting hinges (3) and perfectly plastic reinforcement (4). The perfectly plastic hinge is not relevant to masonry, which is always characterised by quasi-brittle post-elastic behaviour in tension, and thus will not be considered in the following.

2.2. An Automatic Tool for Limit Analysis of Buttressed Arches

Equation (4) represents an optimisation problem, where the load multiplier λ is minimised by identifying the corresponding position of the four flexural hinges. To solve the problem, an automatic tool aimed at finding the location of the hinges in the masonry arches with side piers was implemented in the software Gmsh [29]. Gmsh is an open-source 3D finite element mesh generator with a built-in CAD engine and post-processor, with the possibility of scripting. In particular (Figure 3), given a trial position of the hinges α k = α A , α B , α C , α D , a low-level script draws both the undeformed structure of the arch, and the structure after the activation of the mechanism, simplifying the identification of the blocks with the applied vertical and horizontal forces and centroid displacements u i k , v i k in Equation (3), and allowing for the evaluation of the load multiplier λ k ϑ . The minimisation of Equation (4) is carried out within Gmsh by a higher-level script by systematically exploring various hinge positions α . The admissible hinge position is from 0° to 180°, with the addition of the base of the left pier, assumed conventionally as α A = 90 ° , and the base of the right pier, conventionally α D = 270 ° .
The input data (Figure 4) concerns:
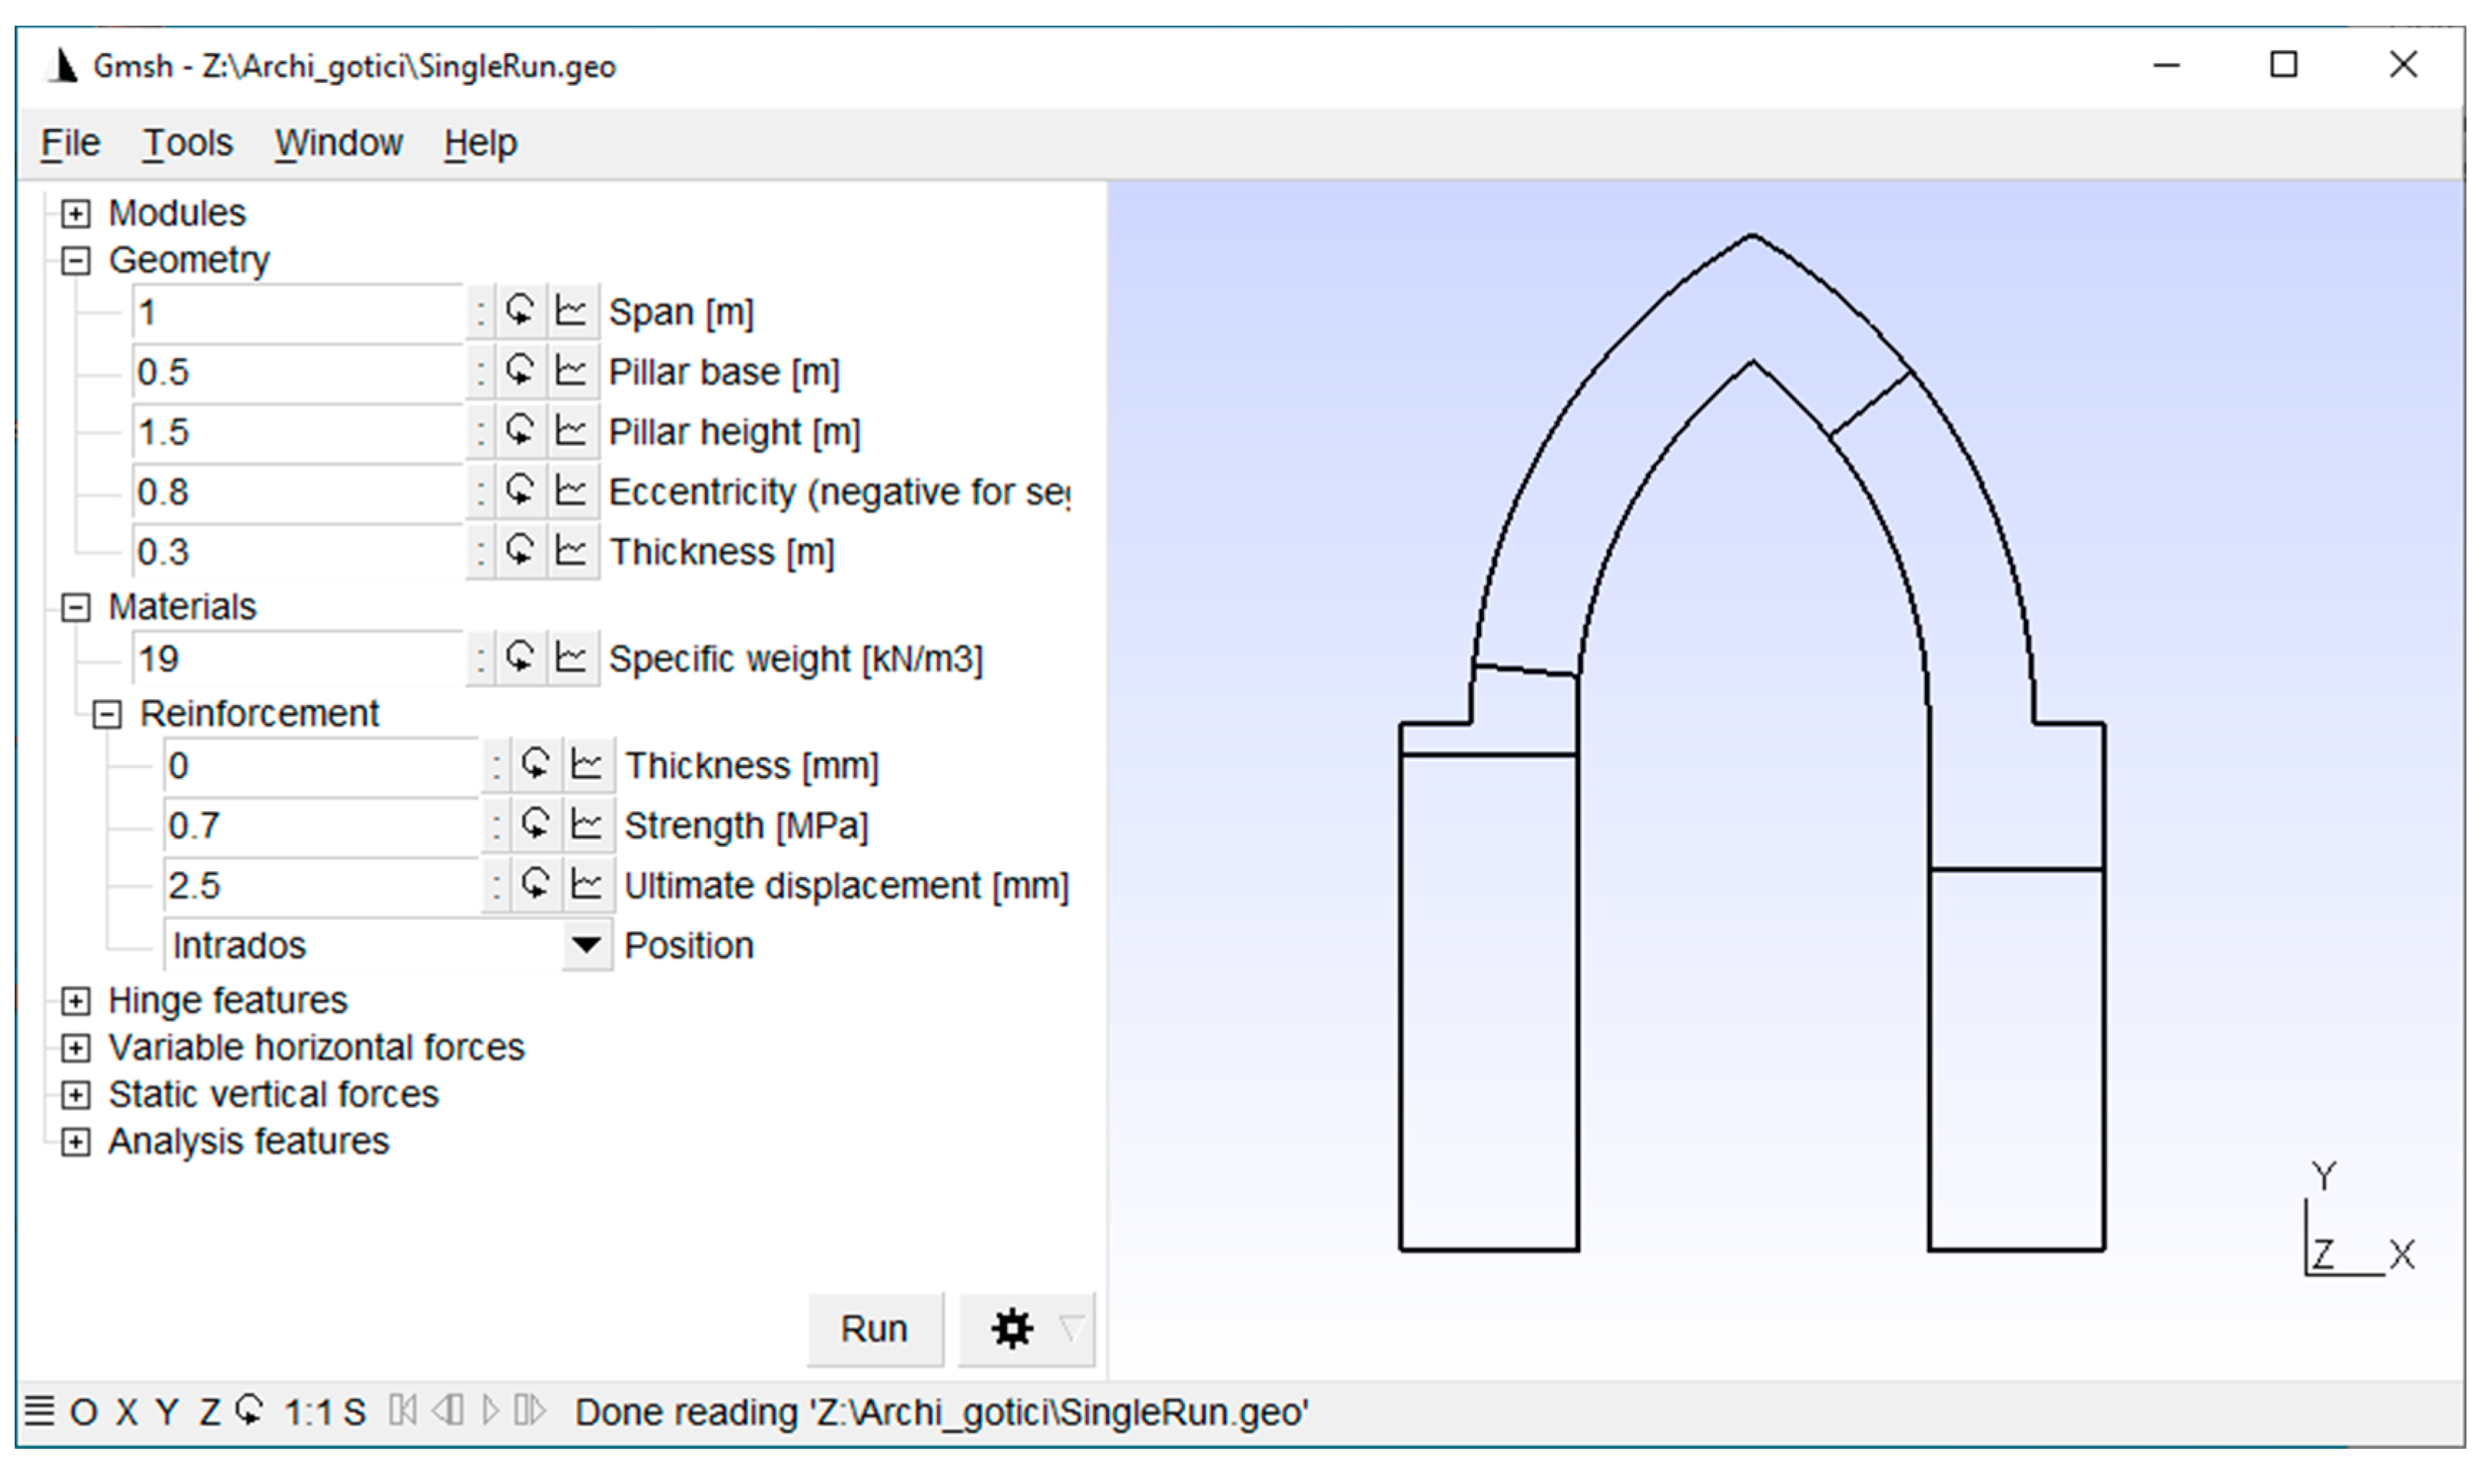
  • the geometrical and material features of the structure including the reinforcement, in the form of a perfectly plastic layer at intrados, extrados or both sides. It is possible to define the tensile strength, the thickness and the ultimate displacement of the reinforcement layer, whose contribution is evaluated by introducing the relevant internal work in Equation (3) as per Section 2.1.
  • the type of hinge: Not resisting or Fully plastic. Following the discussion in Section 2.1, the hinge constitutive behaviour modifies the internal work contribution;
  • the type of variable horizontal forces: Concentrated in a point or Proportional to masses;
  • optional additional static vertical forces;
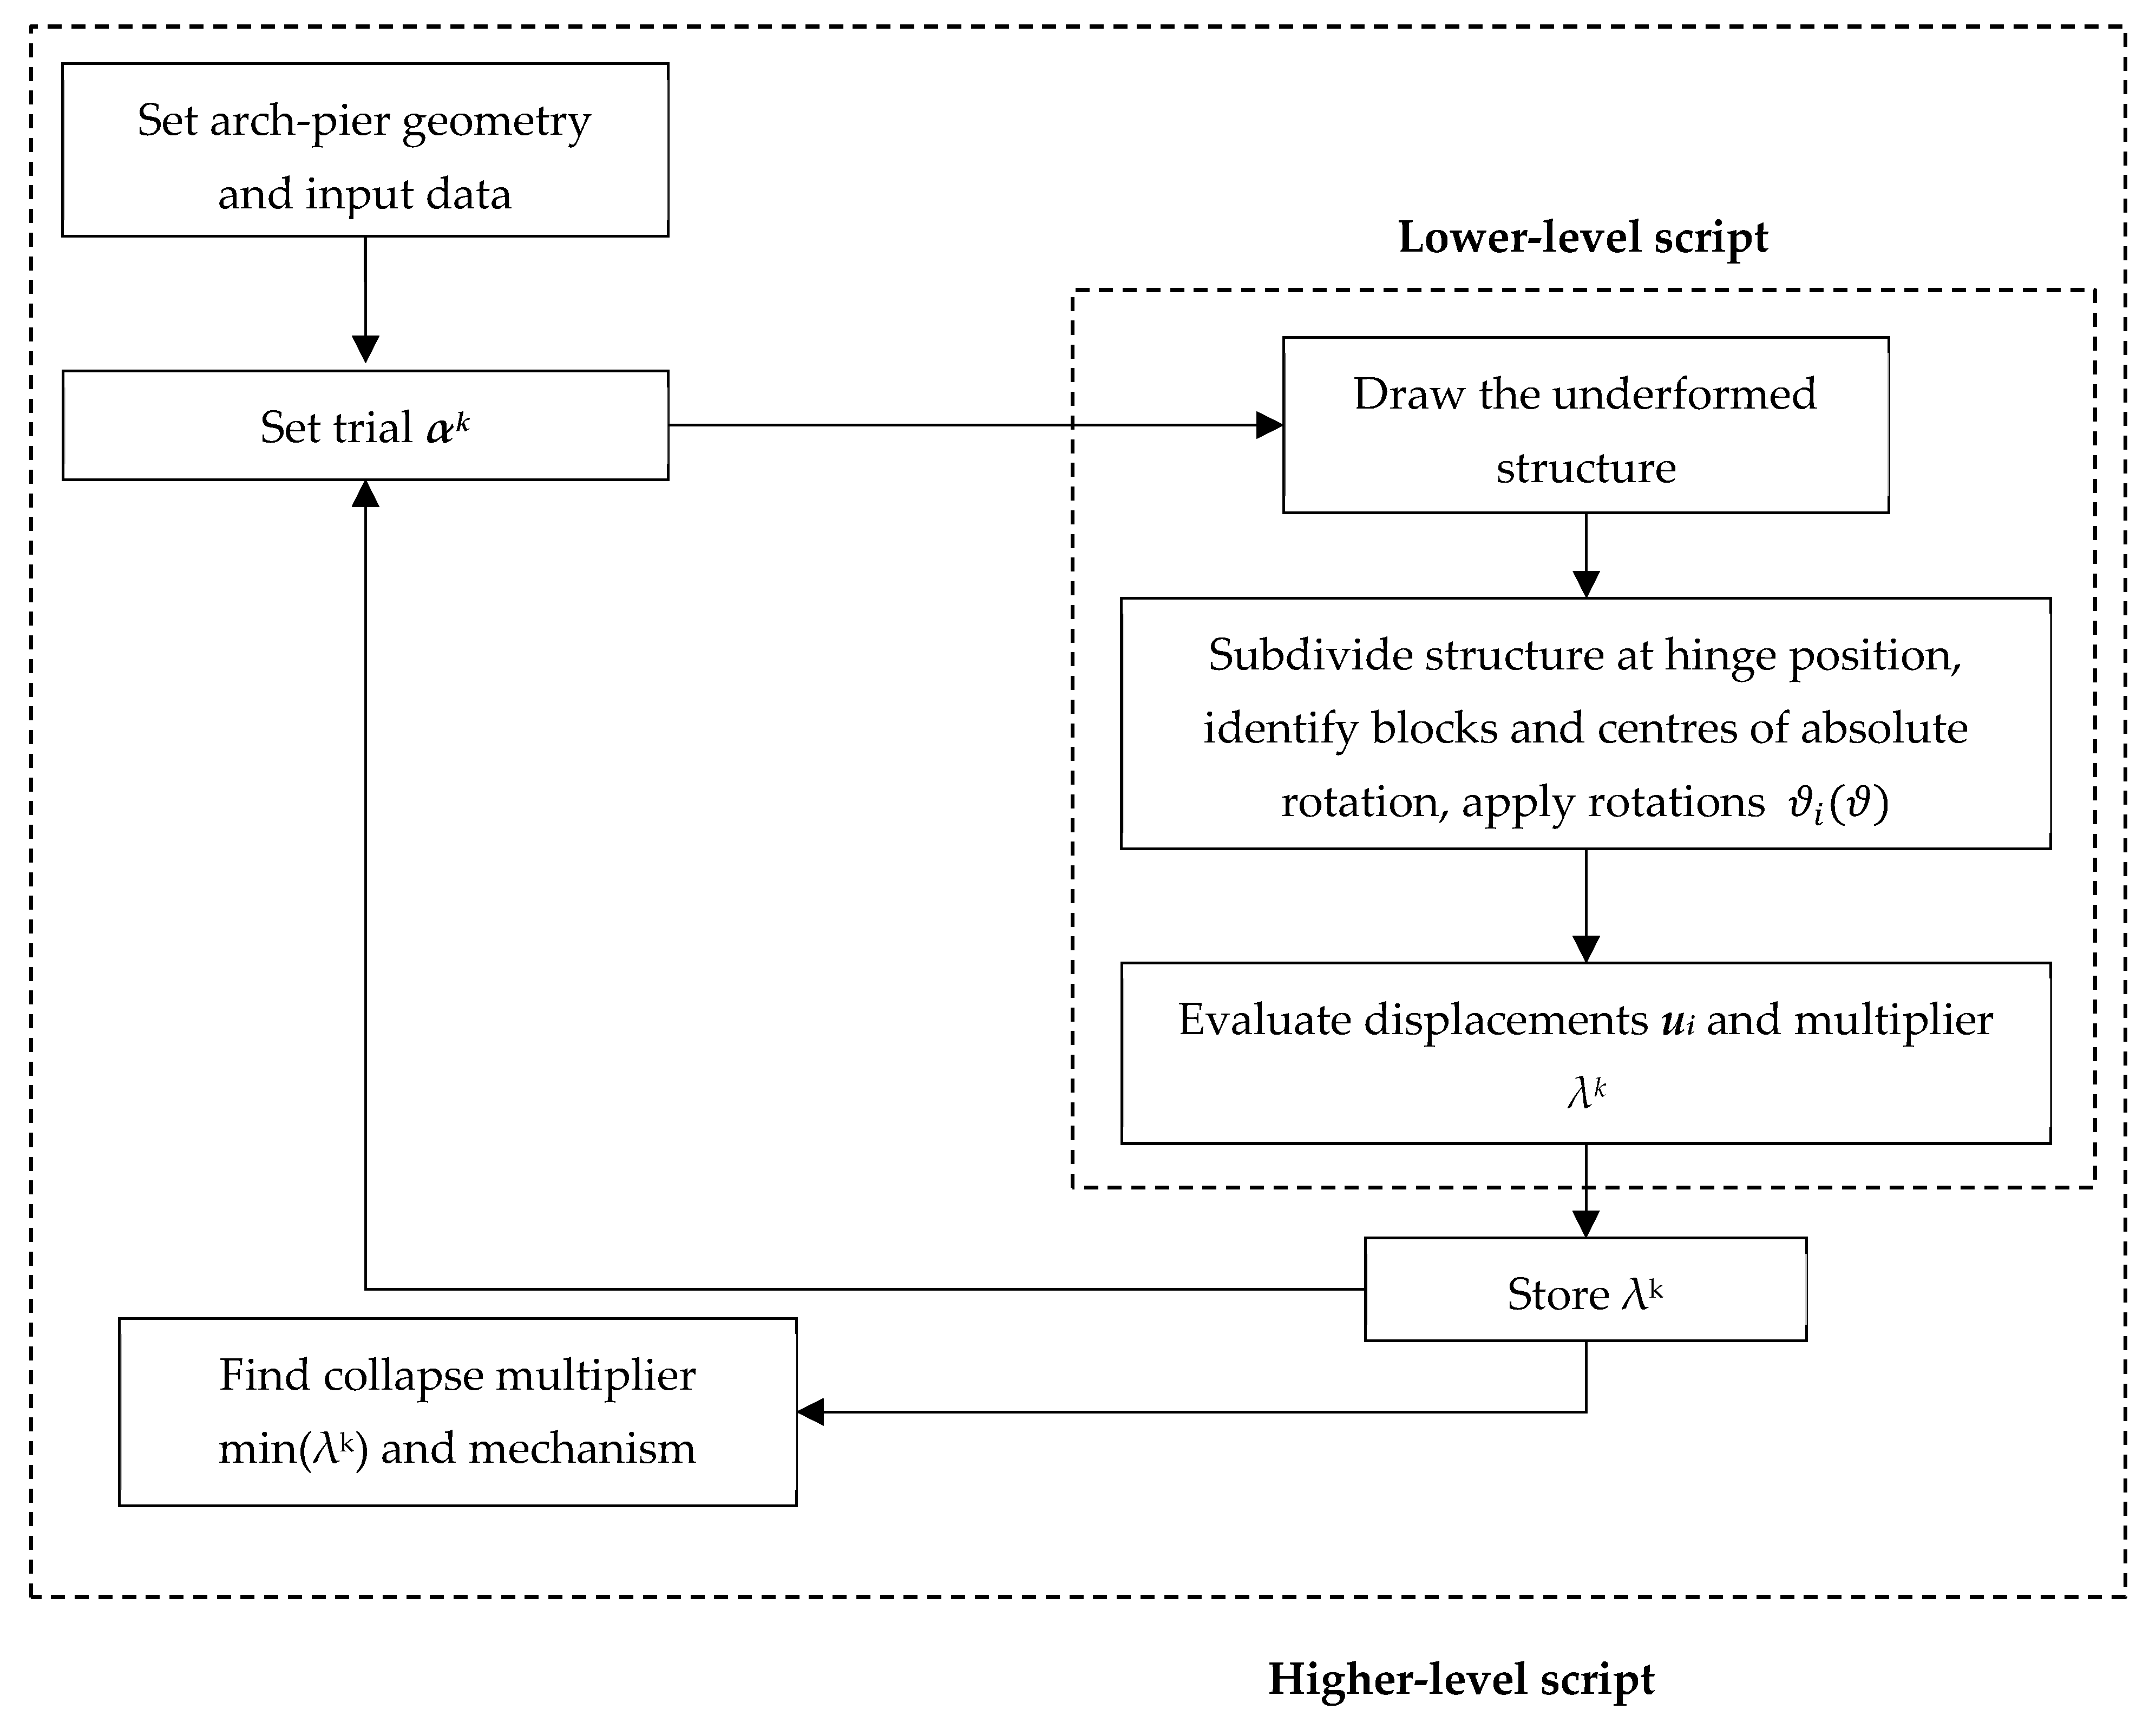
  • the type of analysis: Evaluate, to evaluate a multiplier for a specific hinge position; Minimise, to evaluate the collapse multiplier solving the minimisation problem (4);
  • the discretisation Δα for the hinges, used in the collapse multiplier exploration;
  • the user-defined keystone displacement;
The output provided by the script consists of the weight, centre of mass and displacement for each block into which the structure is divided by the hinges, the participating mass ratio, the collapse multiplier and the ultimate keystone displacement. This is defined as the keystone displacement for which the arch capacity loses the reinforcement contribution, and, given the linearity of the system, is proportional to the ultimate displacement capacity of ductile mortar, defined as input. This latter parameter is the maximum displacement at which mortar still sustains the maximum strength in tension. The dimensionless ductility of the arch δ * is defined as the ratio between ultimate keystone displacement δ u ,   k and the ductility capacity of mortar δ u , m :
δ * = δ u ,   k   δ u , m
The participating mass ratio e* is calculated as [30]:
e * = i = 1 N W i u i k ϑ 2 i = 1 N W i i = 1 N W i u i k ϑ 2
Hence, the acceleration a* that activates the identified collapse mechanisms, related to the specific value of λ, can be therefore calculated through:
a * = λ   ·   g e *

2.3. Parametric Analysis Settings

The automatic tool developed in Gmsh and previously described was exploited to perform an extensive parametric analysis on the seismic capacity of buttressed arches and to evaluate the expected enhancement due to the application of a FRM reinforcement at the intrados, extrados or both side of the arch only, i.e., not on the buttresses.
The geometrical characteristic of analysed arches can be completely defined by the following parameters (Figure 5):
-
span (S), or, alternatively, half-span (s);
-
arch thickness (t);
-
eccentricity (e);
-
arch rise (h);
-
pillars base (B);
-
pillar height (H).
The geometrical parameters investigated have been defined as functions of the half-span of the arch (s), which has been assumed in the analysis equal to 7.00 m. The different typologies of arch investigated (semicircular arch and three configurations of pointed arch, namely drop, equilateral and lancet), are therefore characterised by the ratio e/s, i.e., between eccentricity, expressed as the distance of the centre of each half-arch that composes it with respect to the central axis of the arch, and the half-span of the arch.
In order to perform comparative analyses, the following geometries were considered:
-
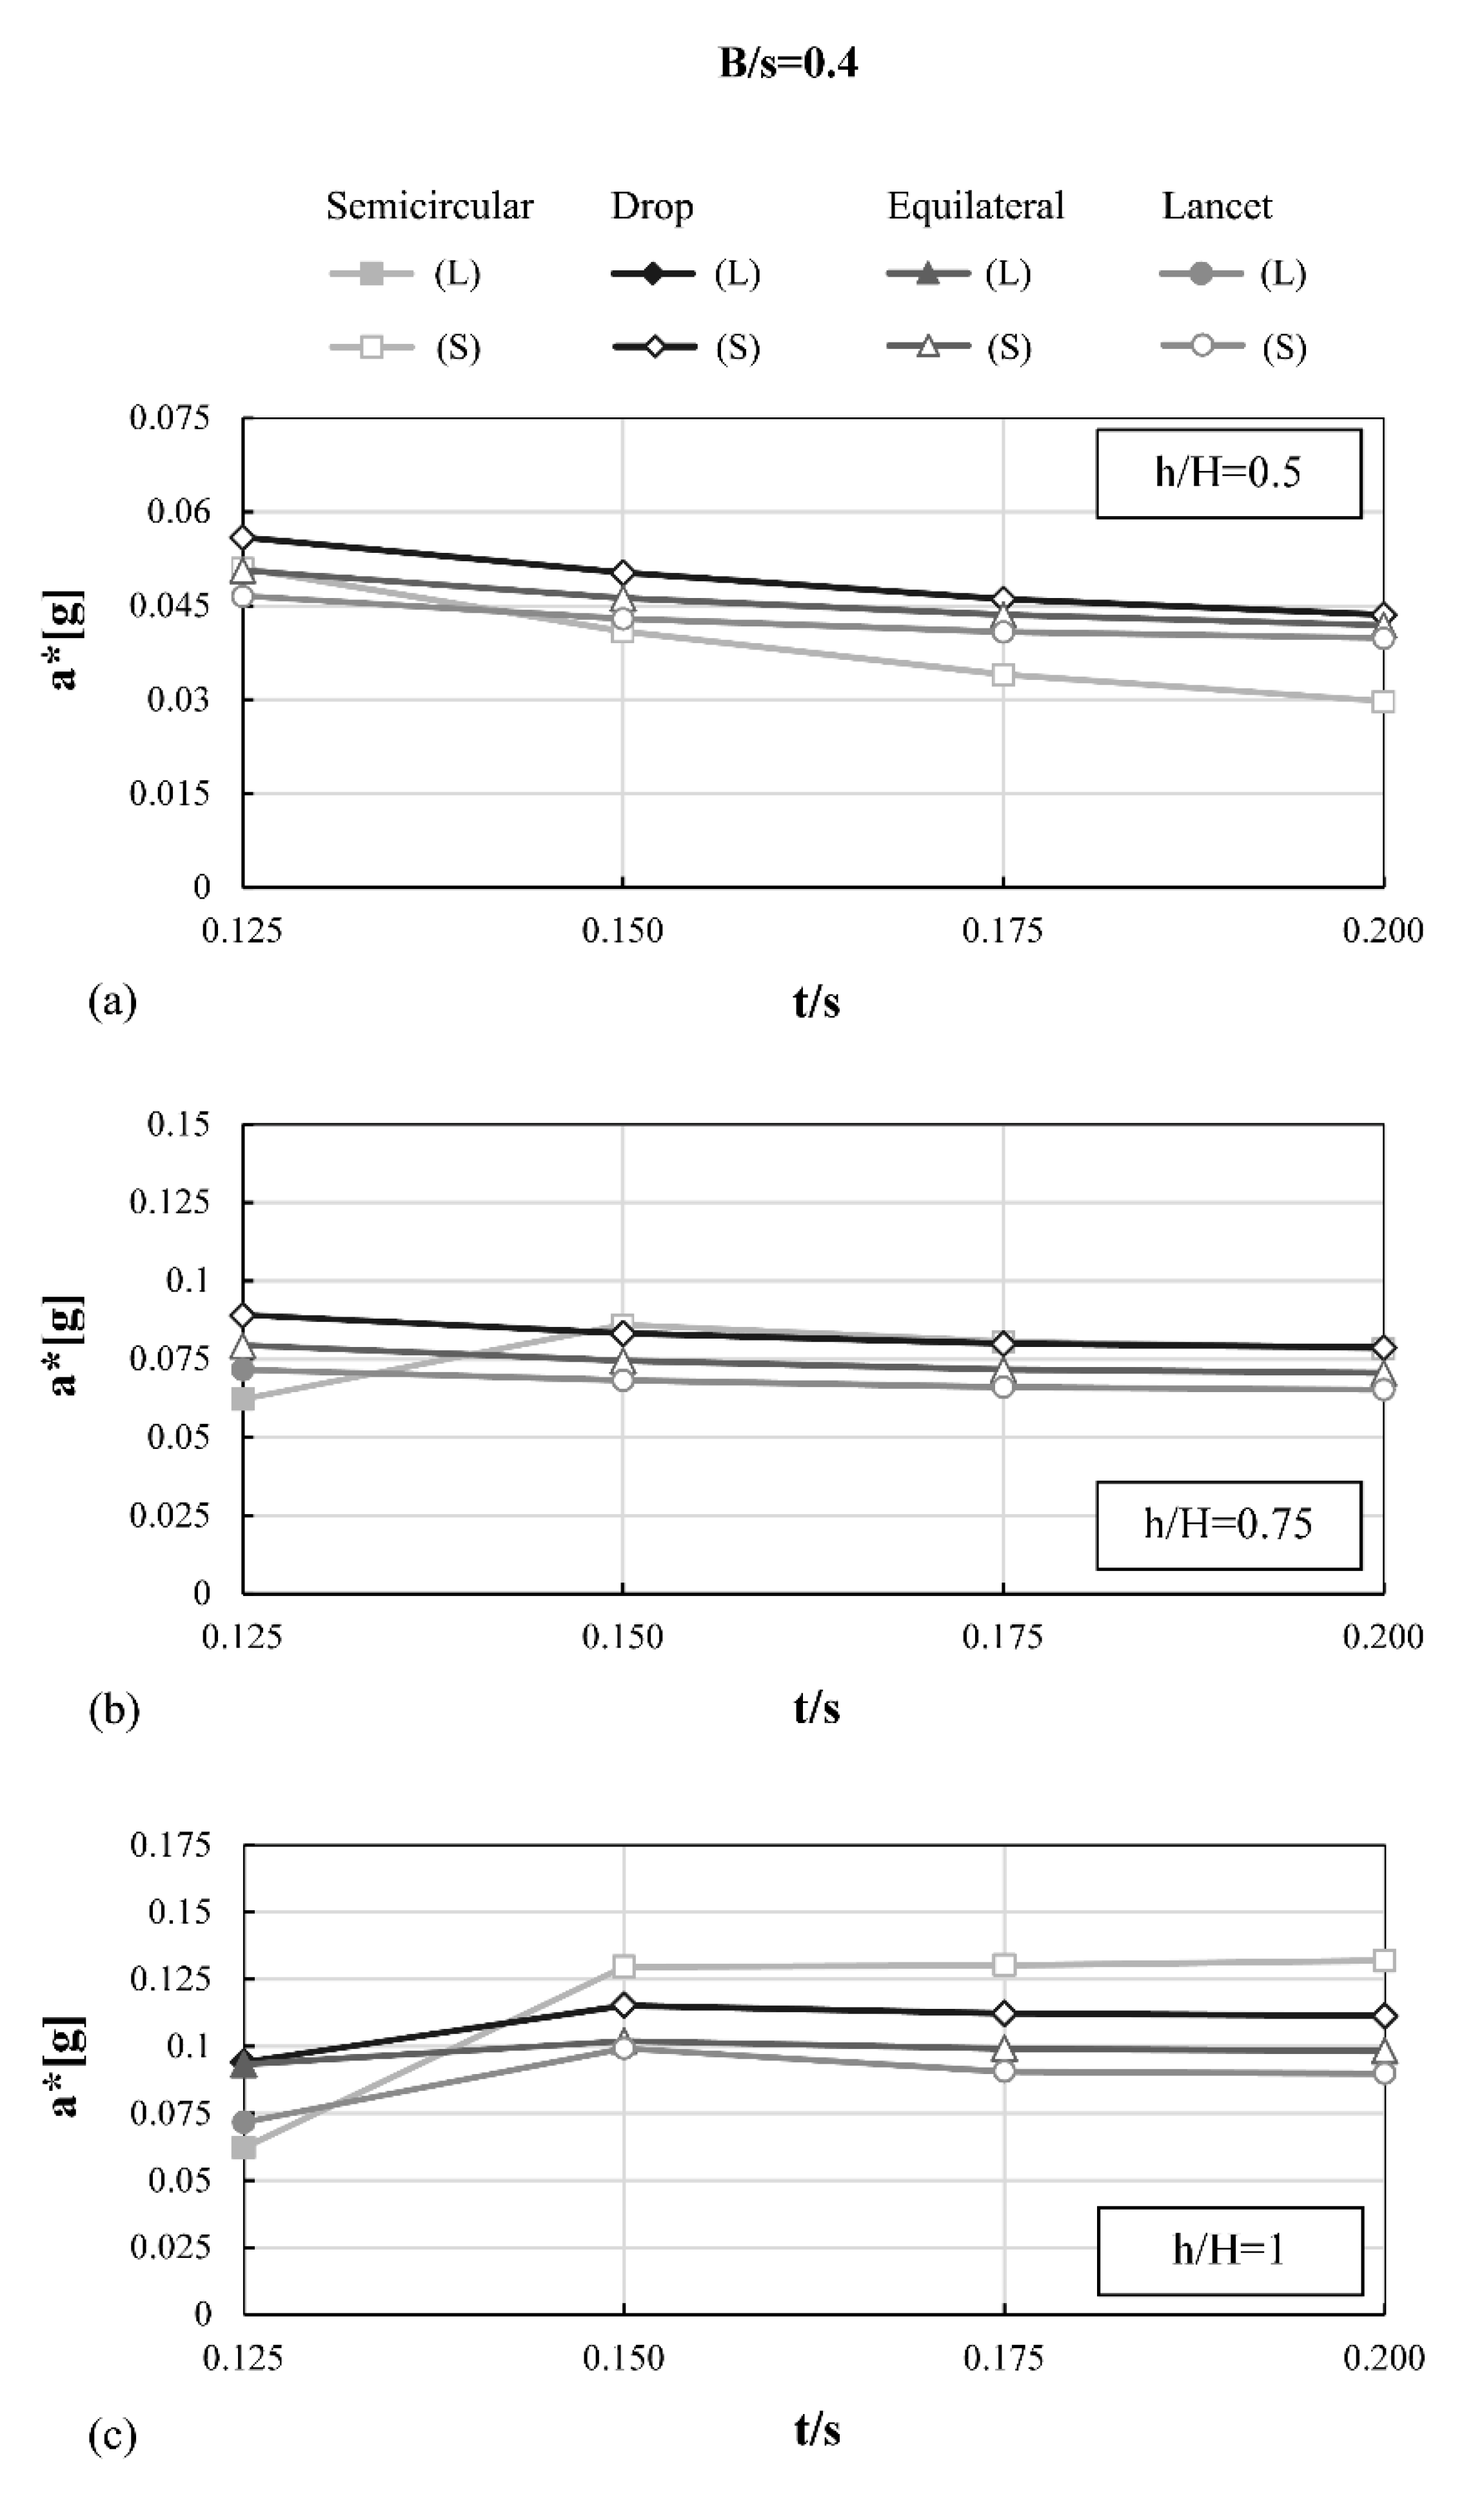
e/s = 0 (Semicircular arch);
-
e/s = 0.5 (Drop pointed arch);
-
e/s = 1 (Equilateral pointed arch);
-
e/s = 1.5 (Lancet pointed arch).
The thickness of the arches was instead defined by the following ratios:
-
t/s = 0.125;
-
t/s = 0.15;
-
t/s = 0.175;
-
t/s = 0.2.
The lowest value is slightly higher than the minimum thickness according to Heyman for a semicircular arch to withstand its own weight (t/s = 1/9 = 0.11), while the highest value roughly corresponds to a typical thickness observed in ancient Roman bridges.
From the Middle Ages derives the most widespread empirical rule for the sizing of the piers, attributed to Father Dérand by Rondelet [31]: dividing the round or the pointed arch in three equal parts, four points A, B, C and D are determined (Figure 6). With centre in the extreme D and drawing a circle of CD radius, the projection of CD on the horizontal axis determines the minimum thickness of the piers. It is possible to see that the application of this rule to circular arches leads to a ratio B/s = 0.5 (t’ in Figure 6), while a pointed arch of equal span needs a smaller pier thickness (t).
Based on these considerations, pier thickness and height were defined based on the semi-span as:
-
B/s = 0.4;
-
B/s = 0.5;
-
B/s = 0.6;
-
h/H = 0.5;
-
h/H = 0.75;
-
h/H = 1.
The specific weight of masonry was set equal to w = 19 kN/m3. The 144 configurations identified were analysed in unreinforced conditions (UN), with reinforcement at intrados (RI), at extrados (RE), or on both sides (RI-E). In the latter three cases, the reinforcement was characterised by a thickness treinf = 30 mm, and a tensile strength freinf = 0.70 MPa, which are typical though conservative design values for FRM mortar applications [17,32]. Given the difficulty of defining a typical ultimate displacement capacity of ductile mortar (δu,m), the results are then provided as dimensionless ductility of the arch δ * , according to Equation (6).

3. Results

3.1. Validation of the Automatic Tool

A validation of the automatic tool was performed considering the analytical results shown in [33] regarding the limit analysis of semicircular buttressed arches. The system having H R a v = 1.0 , B R a v = 0.5 , e = 0.0 was analysed at increasing t R a v . Consistently with [33], the average radius R a v = R + t 2 is considered for the parametric analysis. The search for the hinge location corresponding to the minimum load multiplier is performed by using an angle interval equal to 15°. The results are shown in Figure 7.
The comparison with [33] shows a very good agreement, with only some minor differences observed for low values of t R a v . This is due to the finite discretisation of the possible hinge location, as opposed to the continuous minimum search in the analytical formulation. The tool also correctly captures the change in collapse mode, from local to semi-global, approximately observed at t R a v = 0.18 , and the consequent stabilisation of the collapse multiplier. This will be confirmed in the analyses in Section 3.2 and Section 3.3
A further investigation on the results of the automatic tool for limit analysis of buttressed arches was performed considering the unreinforced system shown in Figure 8a. To investigate the influence of various material parameters on the collapse multiplier, the limit analysis results were compared with the results of a Discrete Macro-Element Model (DMEM), created by means of Histra Arches and Vaults software [21]. The DMEM approach entails the discretisation of the arch by means of plane irregular articulated quadrilateral elements, endowed with an internal shear deformability and nonlinear behaviour. The interaction between adjacent elements is modelled by means of nonlinear zero-thickness interfaces, with appropriate constitutive relationships which allow for the representation of typical arch failure modes, i.e., sliding and flexural failures (Figure 8b).
The material parameters considered for DMEM, listed in Table 1, correspond to two types of masonry, i.e., weak and strong respectively, and have the following meaning:
  • specific weight w;
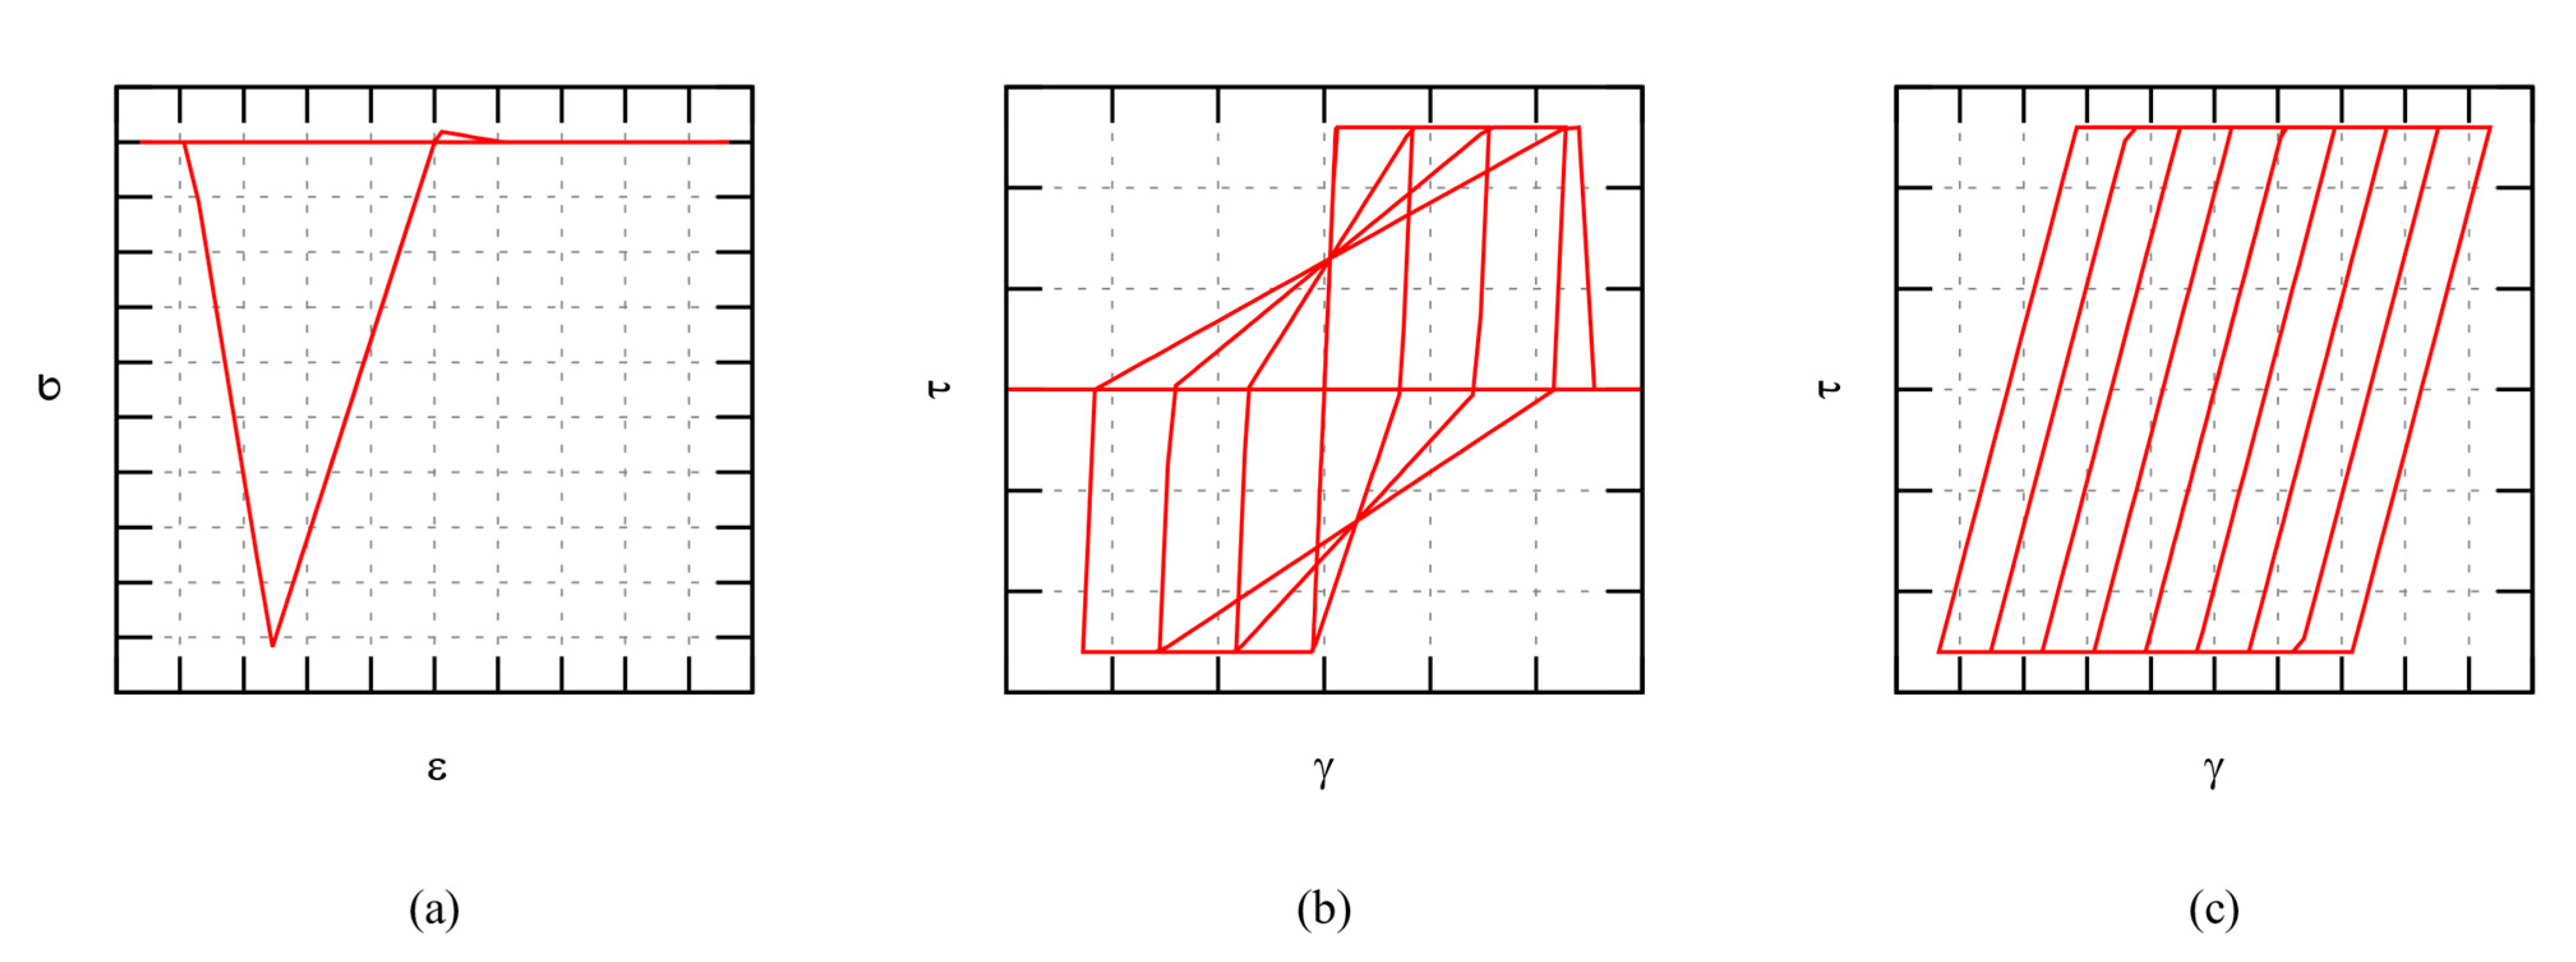
  • elastic behaviour: Young’s modulus E, shear modulus G;
  • compressive behaviour: strength fc, fracture energy Gc with linear softening (Figure 9a);
  • shear behaviour of the block: elastic-plastic Turnsek–Cacovic criterion with shear strength τ0 and ultimate shear strain γu (Figure 9b);
  • sliding behaviour: elastic-plastic Mohr–Coulomb criterion with cohesion c, friction coefficient μ and fracture energy Gf, assumed very high to simulate the elastic-perfectly plastic behaviour as an approximation of the frictional behaviour of the joints (Figure 9c).
It must be pointed out that the elastic properties must be representative of the homogenised continuum, since the quadrilateral macro-elements do not have any extensional deformability.
To investigate the influence of tensile behaviour on the force-displacement plot, a parametric analysis was performed on tensile strength ft and tensile fracture energy Gt. In particular, three levels of ft = 0.05, 0.10, 0.15 MPa with fixed Gt = 0.01 N/mm, and three levels of Gt = 0.01, 0.025, 0.05 N/mm with fixed ft = 0.10 MPa were considered for both weak and strong masonry models. Even though fracture energy is usually related to tensile strength (as in the simplified formulations reported in [34]), in this section tensile strength and fracture energy were investigated separately to isolate the individual contribution to the force-displacement plot. Variable distributed loads proportional to mass were applied to the structure, while the self-weight was maintained constant. The nonlinear static problem is solved in Histra by means of an implicit solver based on modified Newton–Raphson iterative procedure, enhanced by arc-length integration method.
The same structure was then modelled with the automatic tool described in Section 2.2. The angle interval for the exploration of the mechanisms was fixed equal to 15°.
In Figure 10, the load multiplier-key displacement plots of the different analysed models are displayed. The effect of tensile strength is evident on the peak load, but not much on the post-peak branch (Figure 10a,c). On the contrary, increasing fracture energy modifies both the peak load and the overall ductility of the system (Figure 10b,d). It is possible to appreciate that independently from the material parameters, all models tend to a common collapse multiplier for large keystone displacement values, i.e., when the post-peak hinge strength is exhausted. This λ value is well-approximated by the value λLA = 0.189 provided by limit analysis. This is reasonable, since once the residual strength of the crack approaches zero, masonry behaves like an assemblage of rigid blocks connected at the hinges, following thus Heyman’s hypotheses. The only exception is represented by the strong-masonry model with ft = 0.1 MPa, Gt = 0.05 N/mm, in the following referred to as Model 1, which shows a larger multiplier even at u = 15 mm (λ = 0.215). It is clear that increasing the crack tensile fracture energy, failure occurs with a much more diffused damage within the arch, and the rigid-block approximation becomes less realistic.
In Figure 11a–c, the deformed shape at failure given by DMEM and the hinge position by limit analysis are respectively shown. For all values of ft and Gt, the same deformed configuration displayed in Figure 11a was observed, with the exception of Model 1, which exhibited the deformed shape shown in Figure 11b. The comparison between Figure 11a and c shows that the position of hinges is globally captured by limit analysis, even though some differences are observed for the hinges on the left, which are respectively placed at αA = 15° and αB = 75°. This configuration provides a force multiplier λmin = 0.189. The position of cracks in the DMEM model would correspond to αA = 0° and αB = [90°], where the minus indicates a hinge position immediately on the left of αB = 90°. This configuration, evaluated by the automatic tool, provide λ = 0.193, which is very close to λmin. Given the small sensitivity of the load multiplier to variation in αA and αB, the position of the hinges given by limit analysis can be considered accurate. Incidentally, the configuration of Figure 11b corresponds to the hinge distribution provided by the automatic tool in case of fully resisting plastic hinge (Case 2 in Section 2.1) and any value of ft.
A final consideration regards the evolution of plastic strains, representing the opening of cracks, and the effect of fracture energy on hinge position. In Figure 11 (d and e) the plastic strain at peak load for weak-masonry models with ft = 0.1 MPa and respectively Gt = 0.01 N/mm and Gt = 0.05 N/mm are displayed. While for low fracture energy values (Figure 11d) the plastic strain contour plot is mostly coincident with the final position of the cracks (Figure 11a), with two some other hinges yet to open, the model with higher Gt shows a plastic strain concentration, i.e., the onset of cracking, at both pier bases (Figure 11e). This crack layout is not matched by the final position of the hinges (Figure 11a), and thus implies a redistribution of plastic strain during loading, which in turn is responsible of the overall higher strength shown by high-Gt models. The crack at left base may eventually close with increasing keystone displacement, determining the final collapse configuration displayed in Figure 11a, or remain active as in the configuration of Figure 11b, which represents Model 1 collapse configuration.
These considerations highlight the possibility of shift of the hinge location along the loading history and may raise some doubts on limit analysis procedures which try to identify hinge position based on the elastic stress state [25]. Given the large uncertainty on tensile strength and fracture energy quantification in existing masonry, the use of limit analysis (and thus the focus on the collapse state only) for parametric studies aimed at investigating the effectiveness of reinforcement in comparative terms was deemed reasonable hereinafter.

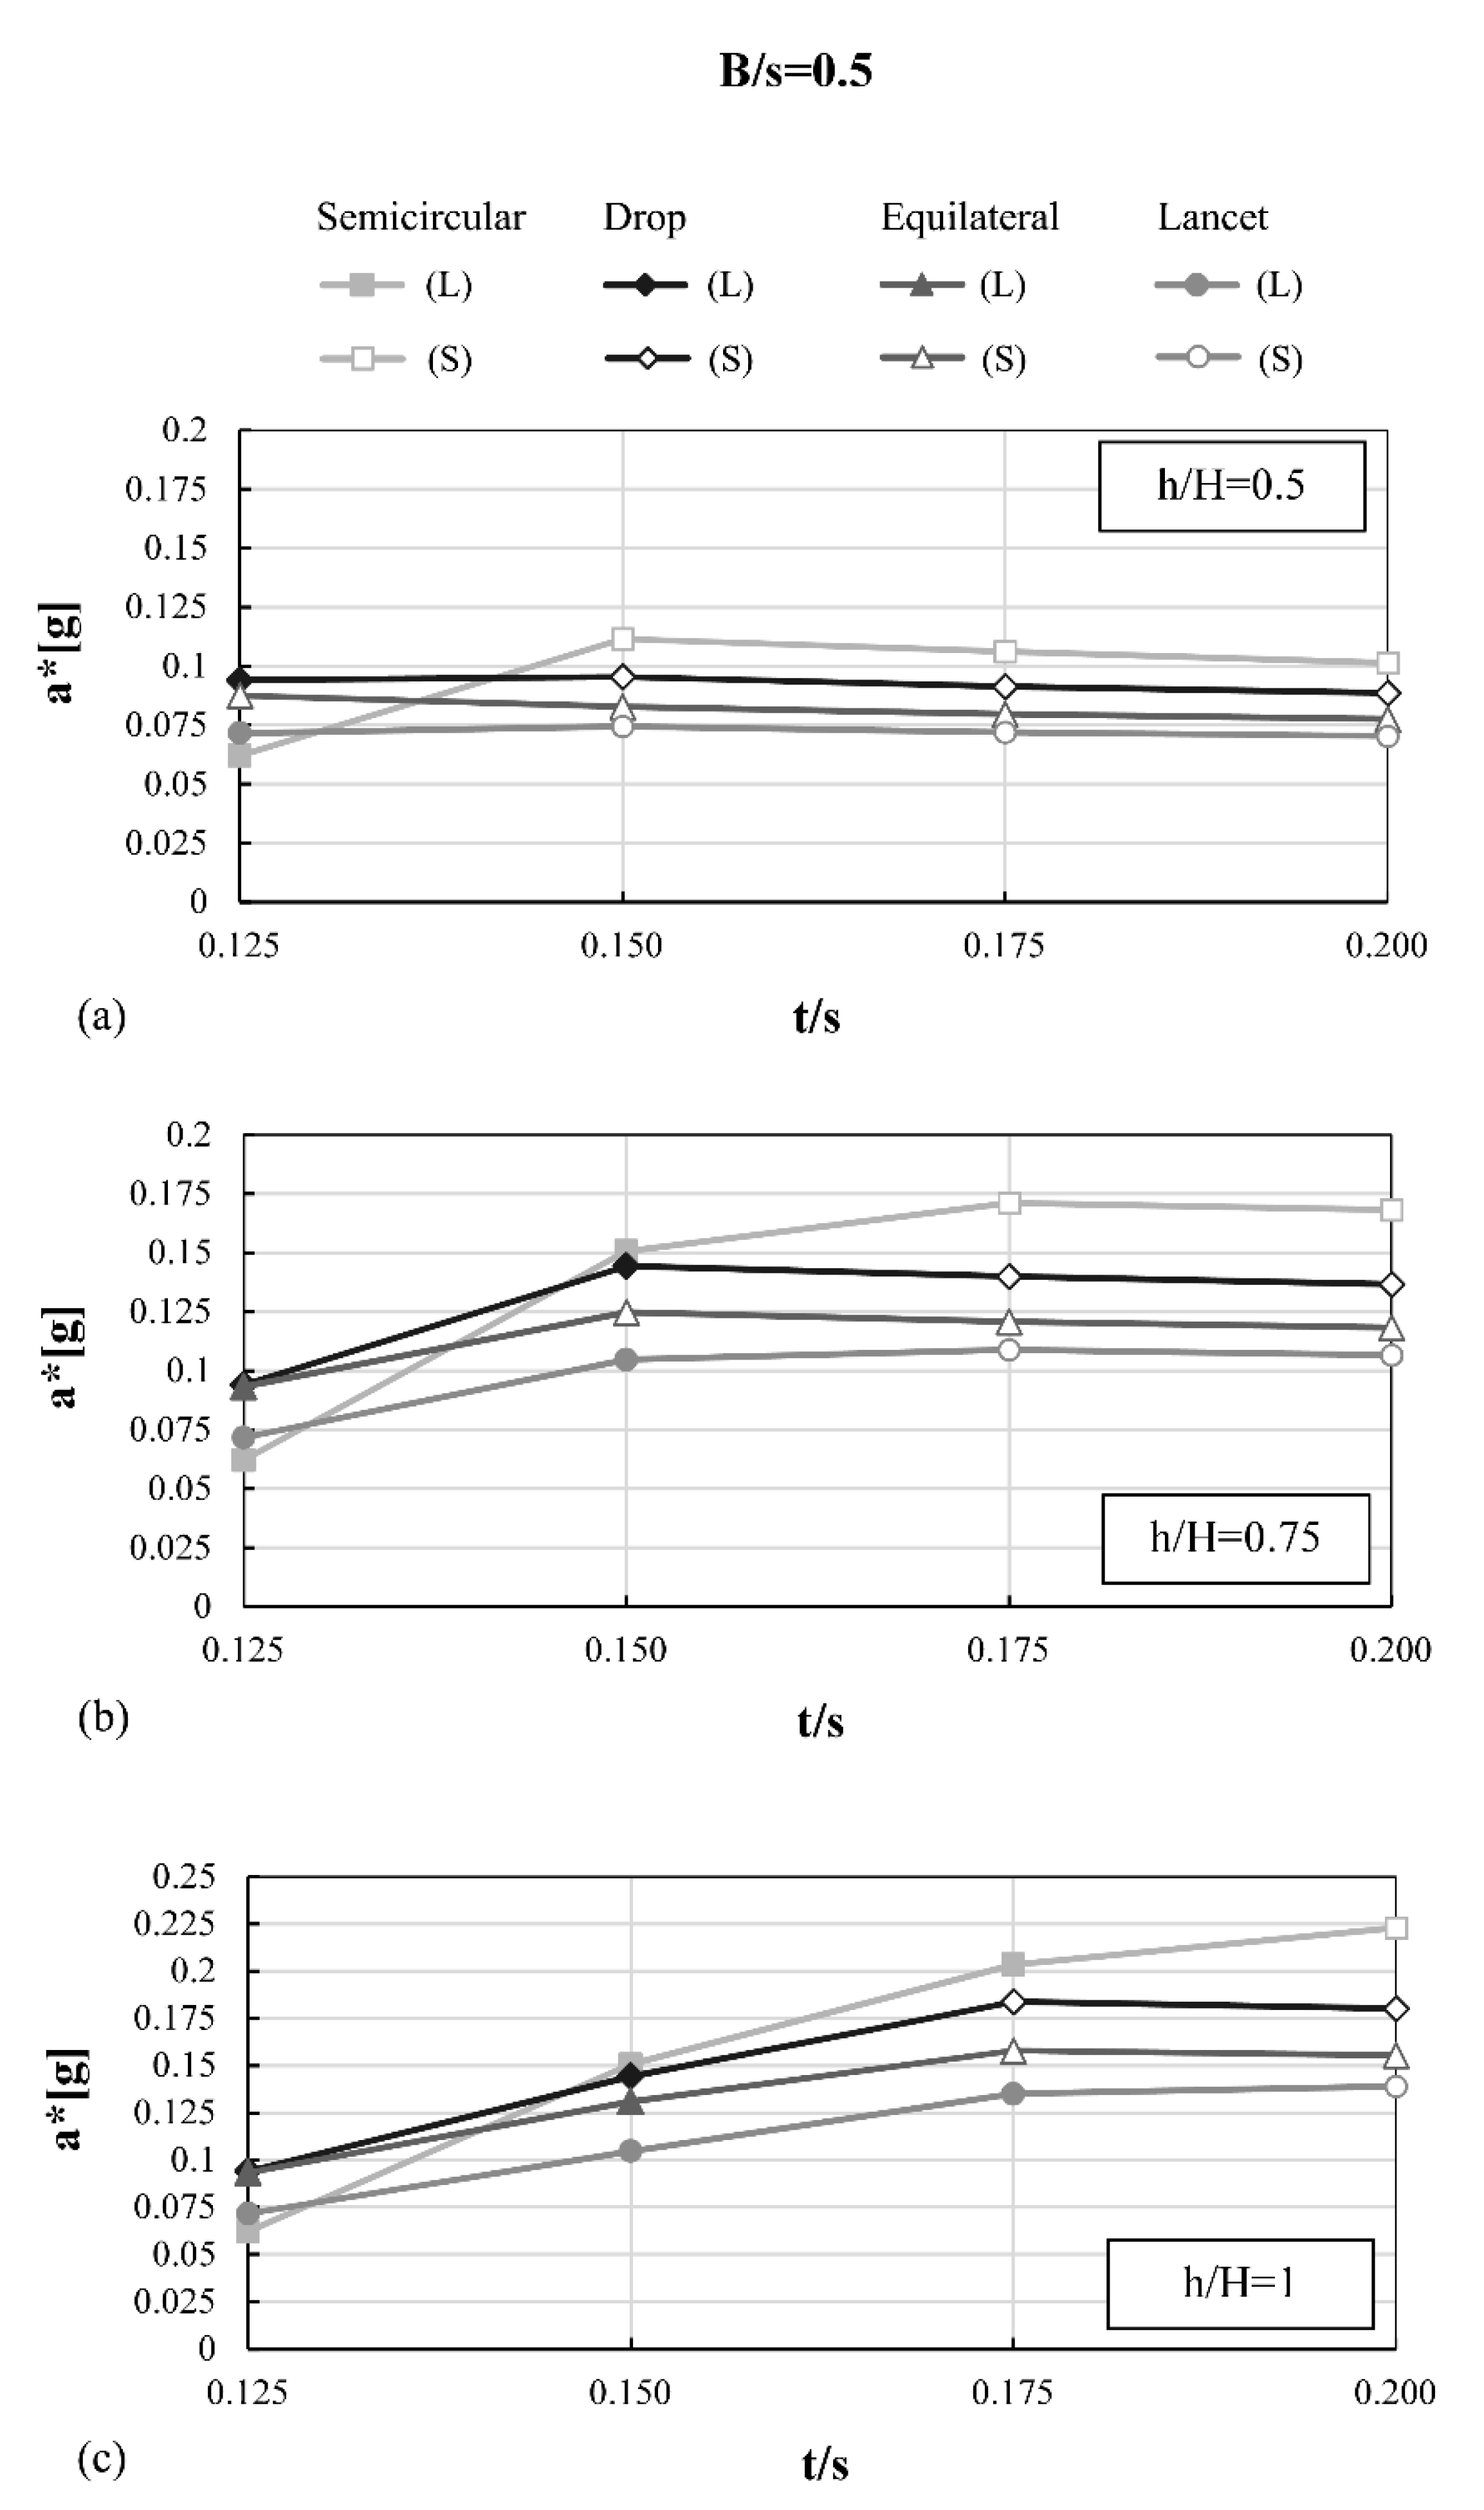
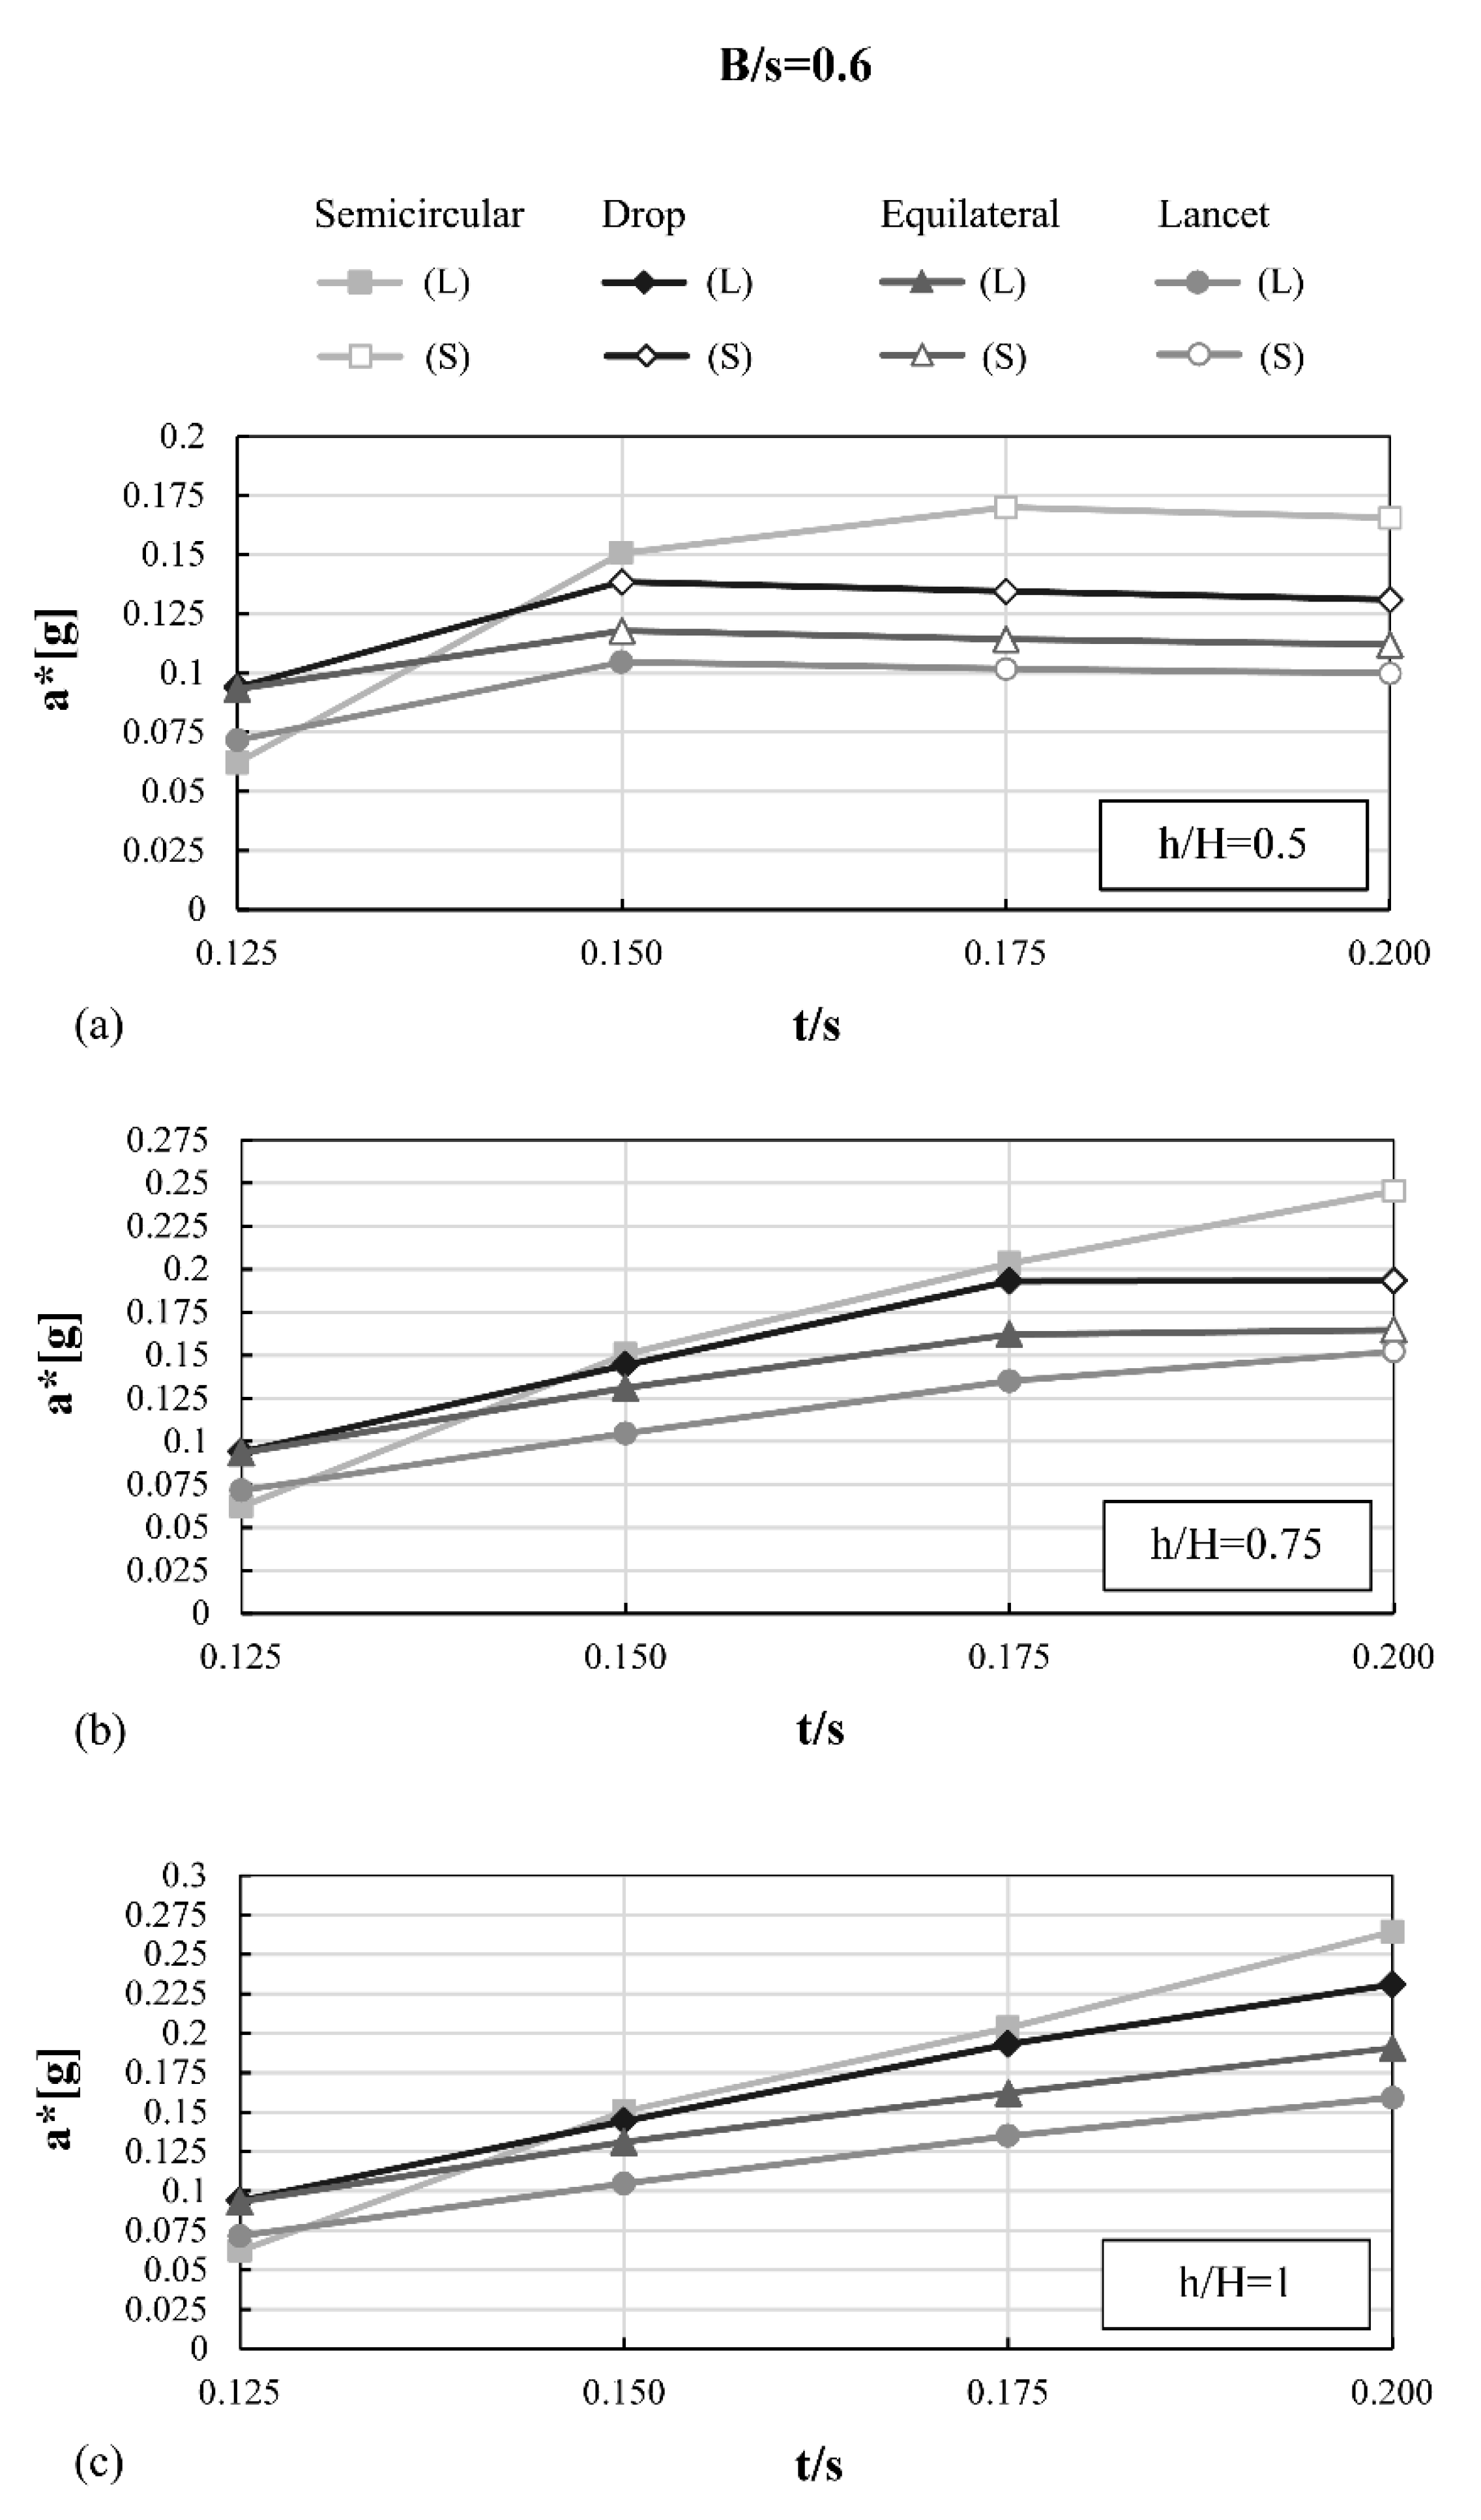
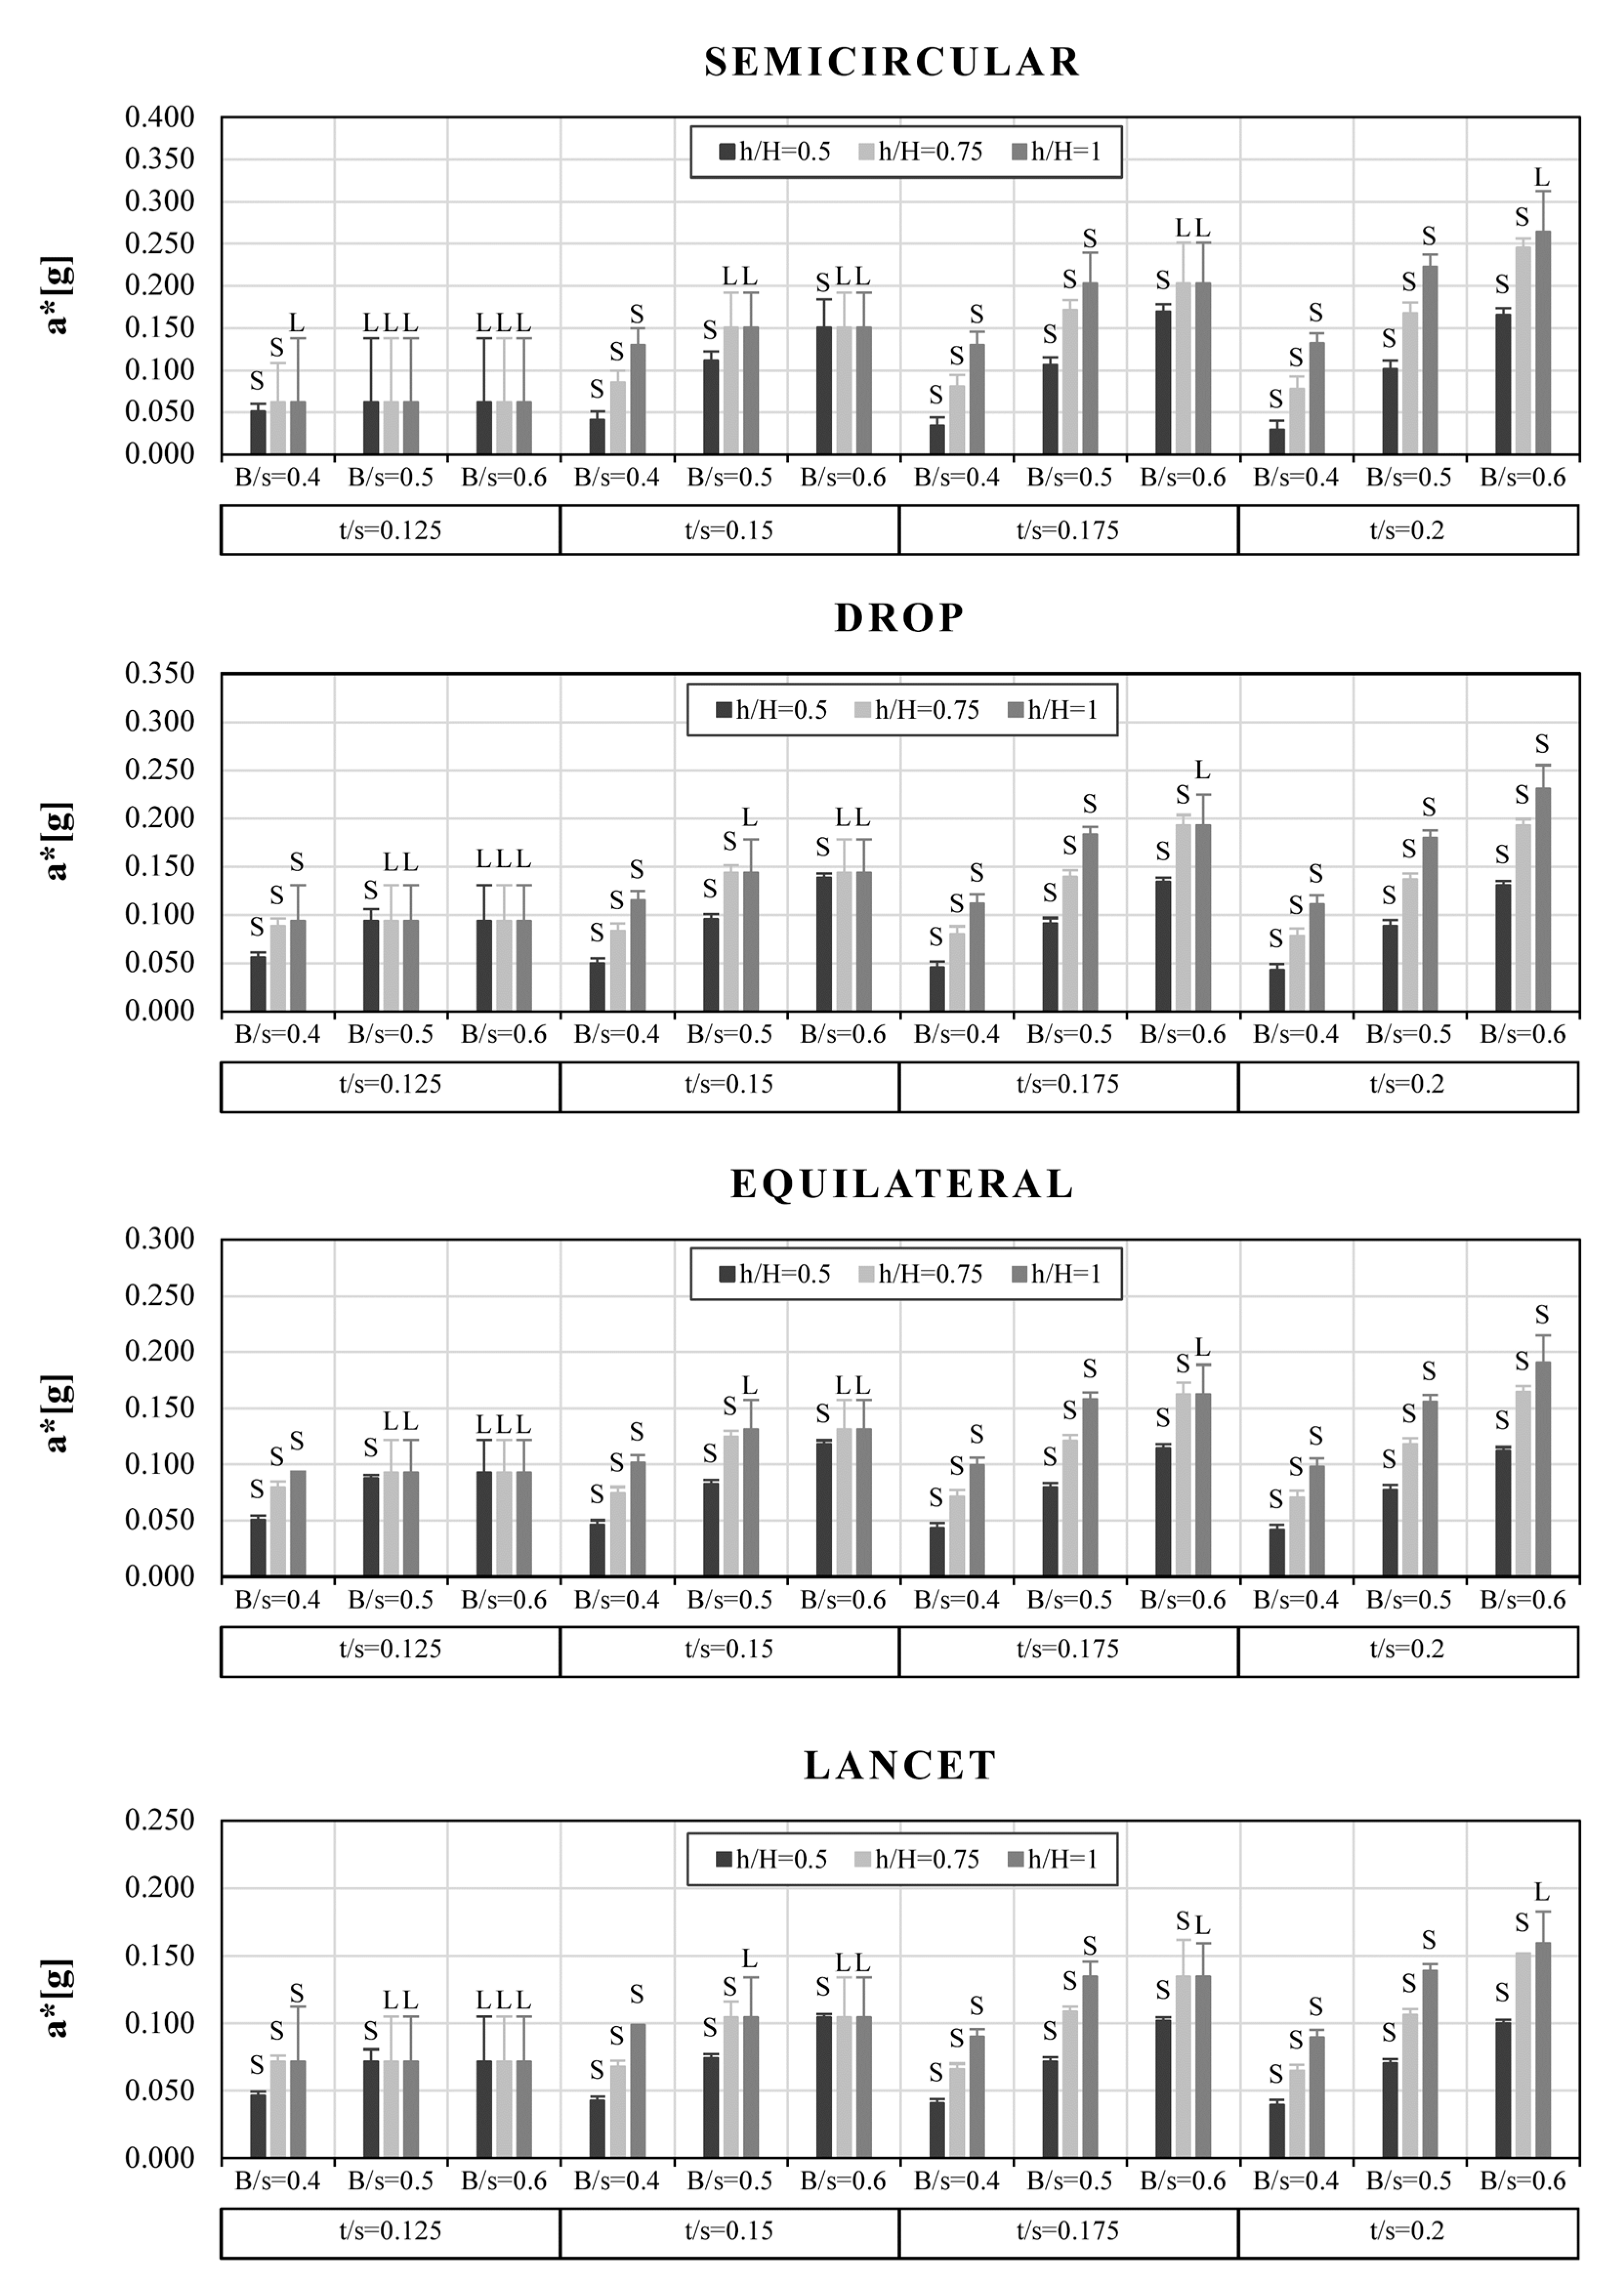
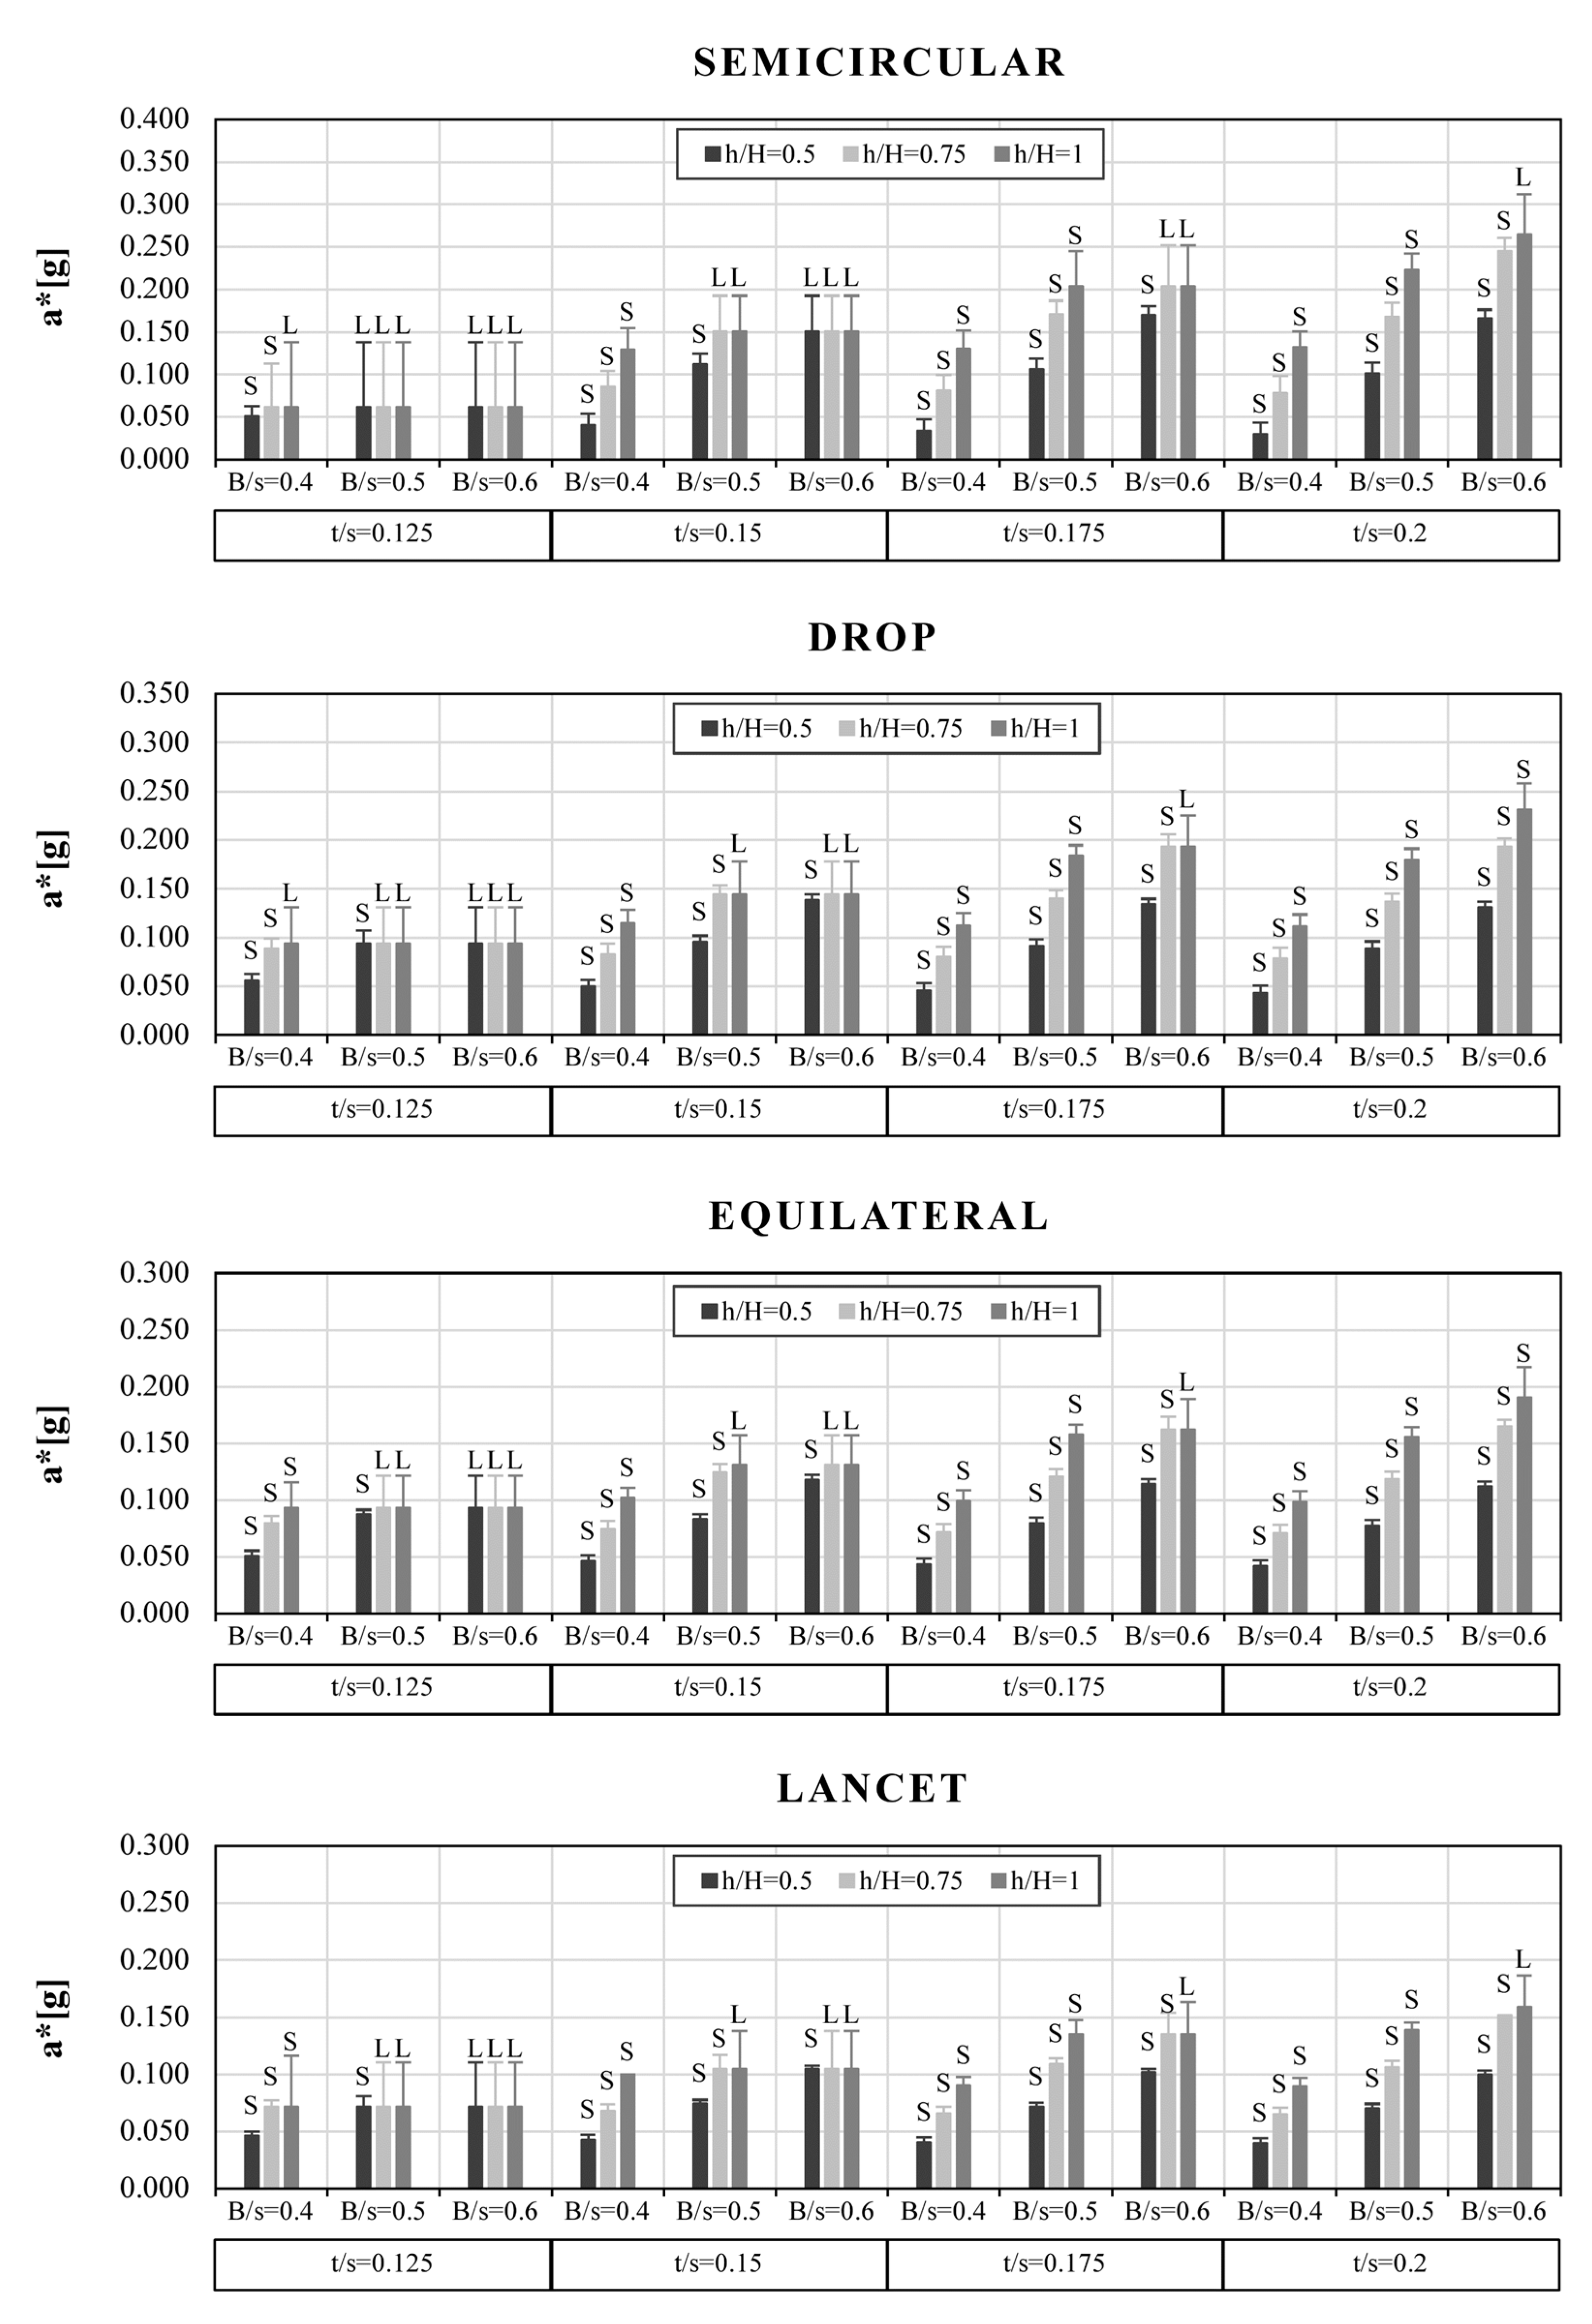
3.2. Unreinforced Buttressed Arches

In Figure 12, Figure 13 and Figure 14 the seismic capacity of the unreinforced arches is expressed in terms of peak ground acceleration a* by dividing the force multiplier λ by the participating mass ratio. The obtained a* values are displayed against the t/s ratio and presented following the B/s and h/H ratios. In addition, local (L) or semi-global (S) and global (G) mechanisms are highlighted.
It is worth noticing that only local and semi-global mechanisms have occurred in the considered geometries, i.e., global mechanism has never provided the minimum value of λ. As global mechanisms appear when the buttresses are weaker than the arch, this behaviour is expected in case of the structural typology investigated here, where the arch thickness is usually smaller than pier width. Conversely, the global mechanism is more likely in the case of diaphragm arches. The same conclusions about the admissible failure mechanisms were reached in [33] for circular barrel vaults.
From Figure 12, Figure 13 and Figure 14, it is possible to appreciate how, for lower values of relative width and height of the piers, semi-global mechanisms are 100% frequent (e.g., B/s = 0.4; h/H = 0.5), while local collapse mechanisms are 100% frequent for geometrical configuration with higher values (e.g., B/s = 0.6; h/H = 1). It is clear that the activation of local mechanisms increases as the contribution of piers increases, to the point that, for certain values (e.g., B/s = 0.6; h/H = 1), the arch becomes the weakest part of the buttressed system, and local mechanisms occur for all t/s configurations considered.
Intuitively, the influence of the thickness of the arch is positively related to the collapse acceleration when the collapse is local (see for instance B/s = 0.6 and h/H = 1.0), meaning that an increase of thickness is beneficial to the system lateral capacity. Conversely, in case of semi-global collapse type, this trend is not visible and may be even opposite (e.g., B/s = 0.4 and h/H = 0.5). The very low acceleration (0.05–0.06 g) observed for the semicircular arch in all configurations for the lowest thickness value t/s = 0.125 derives from the choice of a lower bound slightly higher than the minimum thickness necessary to withstand the arch self-weight (t/s = 1/9).
In the configuration B/s = 0.4 and h/H = 0.5, the semicircular arches show the worst seismic behaviour, with lower acceleration values as the t/s ratio increases. This is the only case where this happens, while in all other cases with t/s > 0.125 the semicircular arch is always the typology performing best under horizontal actions. In addition, the masonry arches subjected to vertical loads produce greater lateral thrusts as the rise is lowered, therefore requiring larger pier thicknesses to counteract the thrusts. Thus, the buttressed pointed arch, and in particular the drop one, has better performances than the semicircular ones for the stockiest configuration of the abutments, i.e., B/s = 0.4, h/H = 0.5.
The given results are summarised in Figure 15, for each value of eccentricity. From the graphs, it is evident that when the collapse mechanism is local, the variation of the width and the weight of the piers do not influence the a* value.

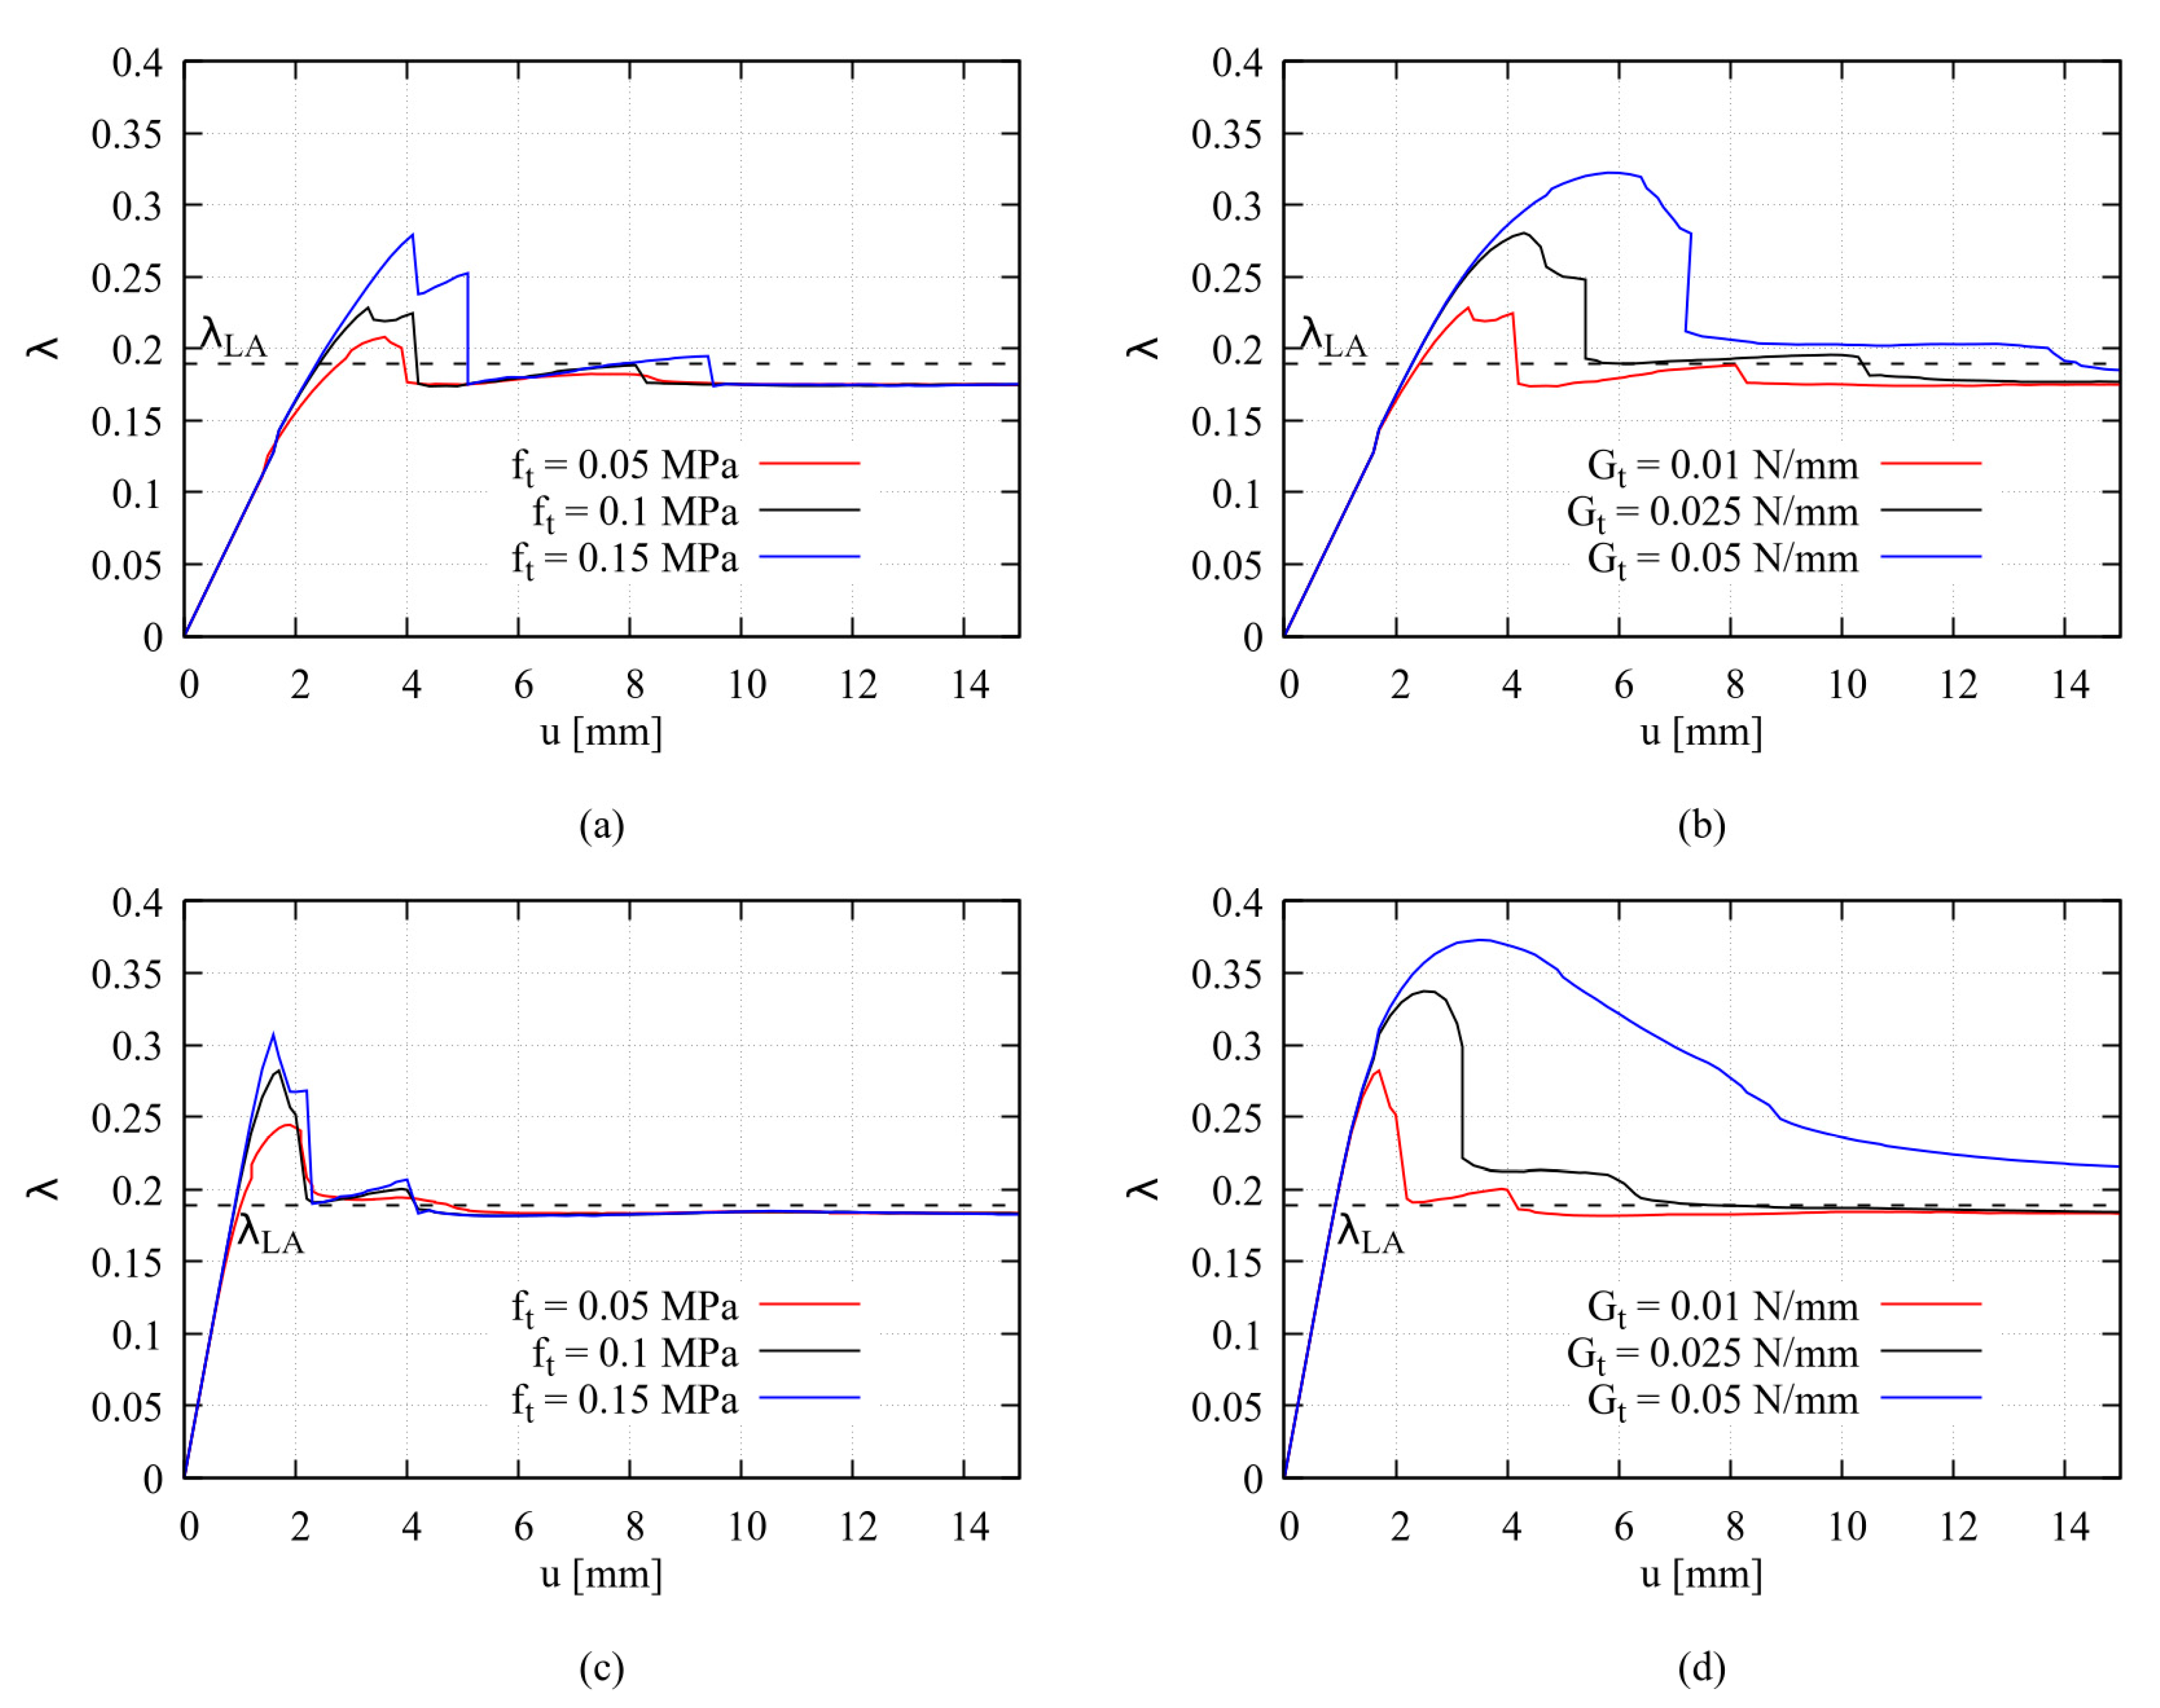
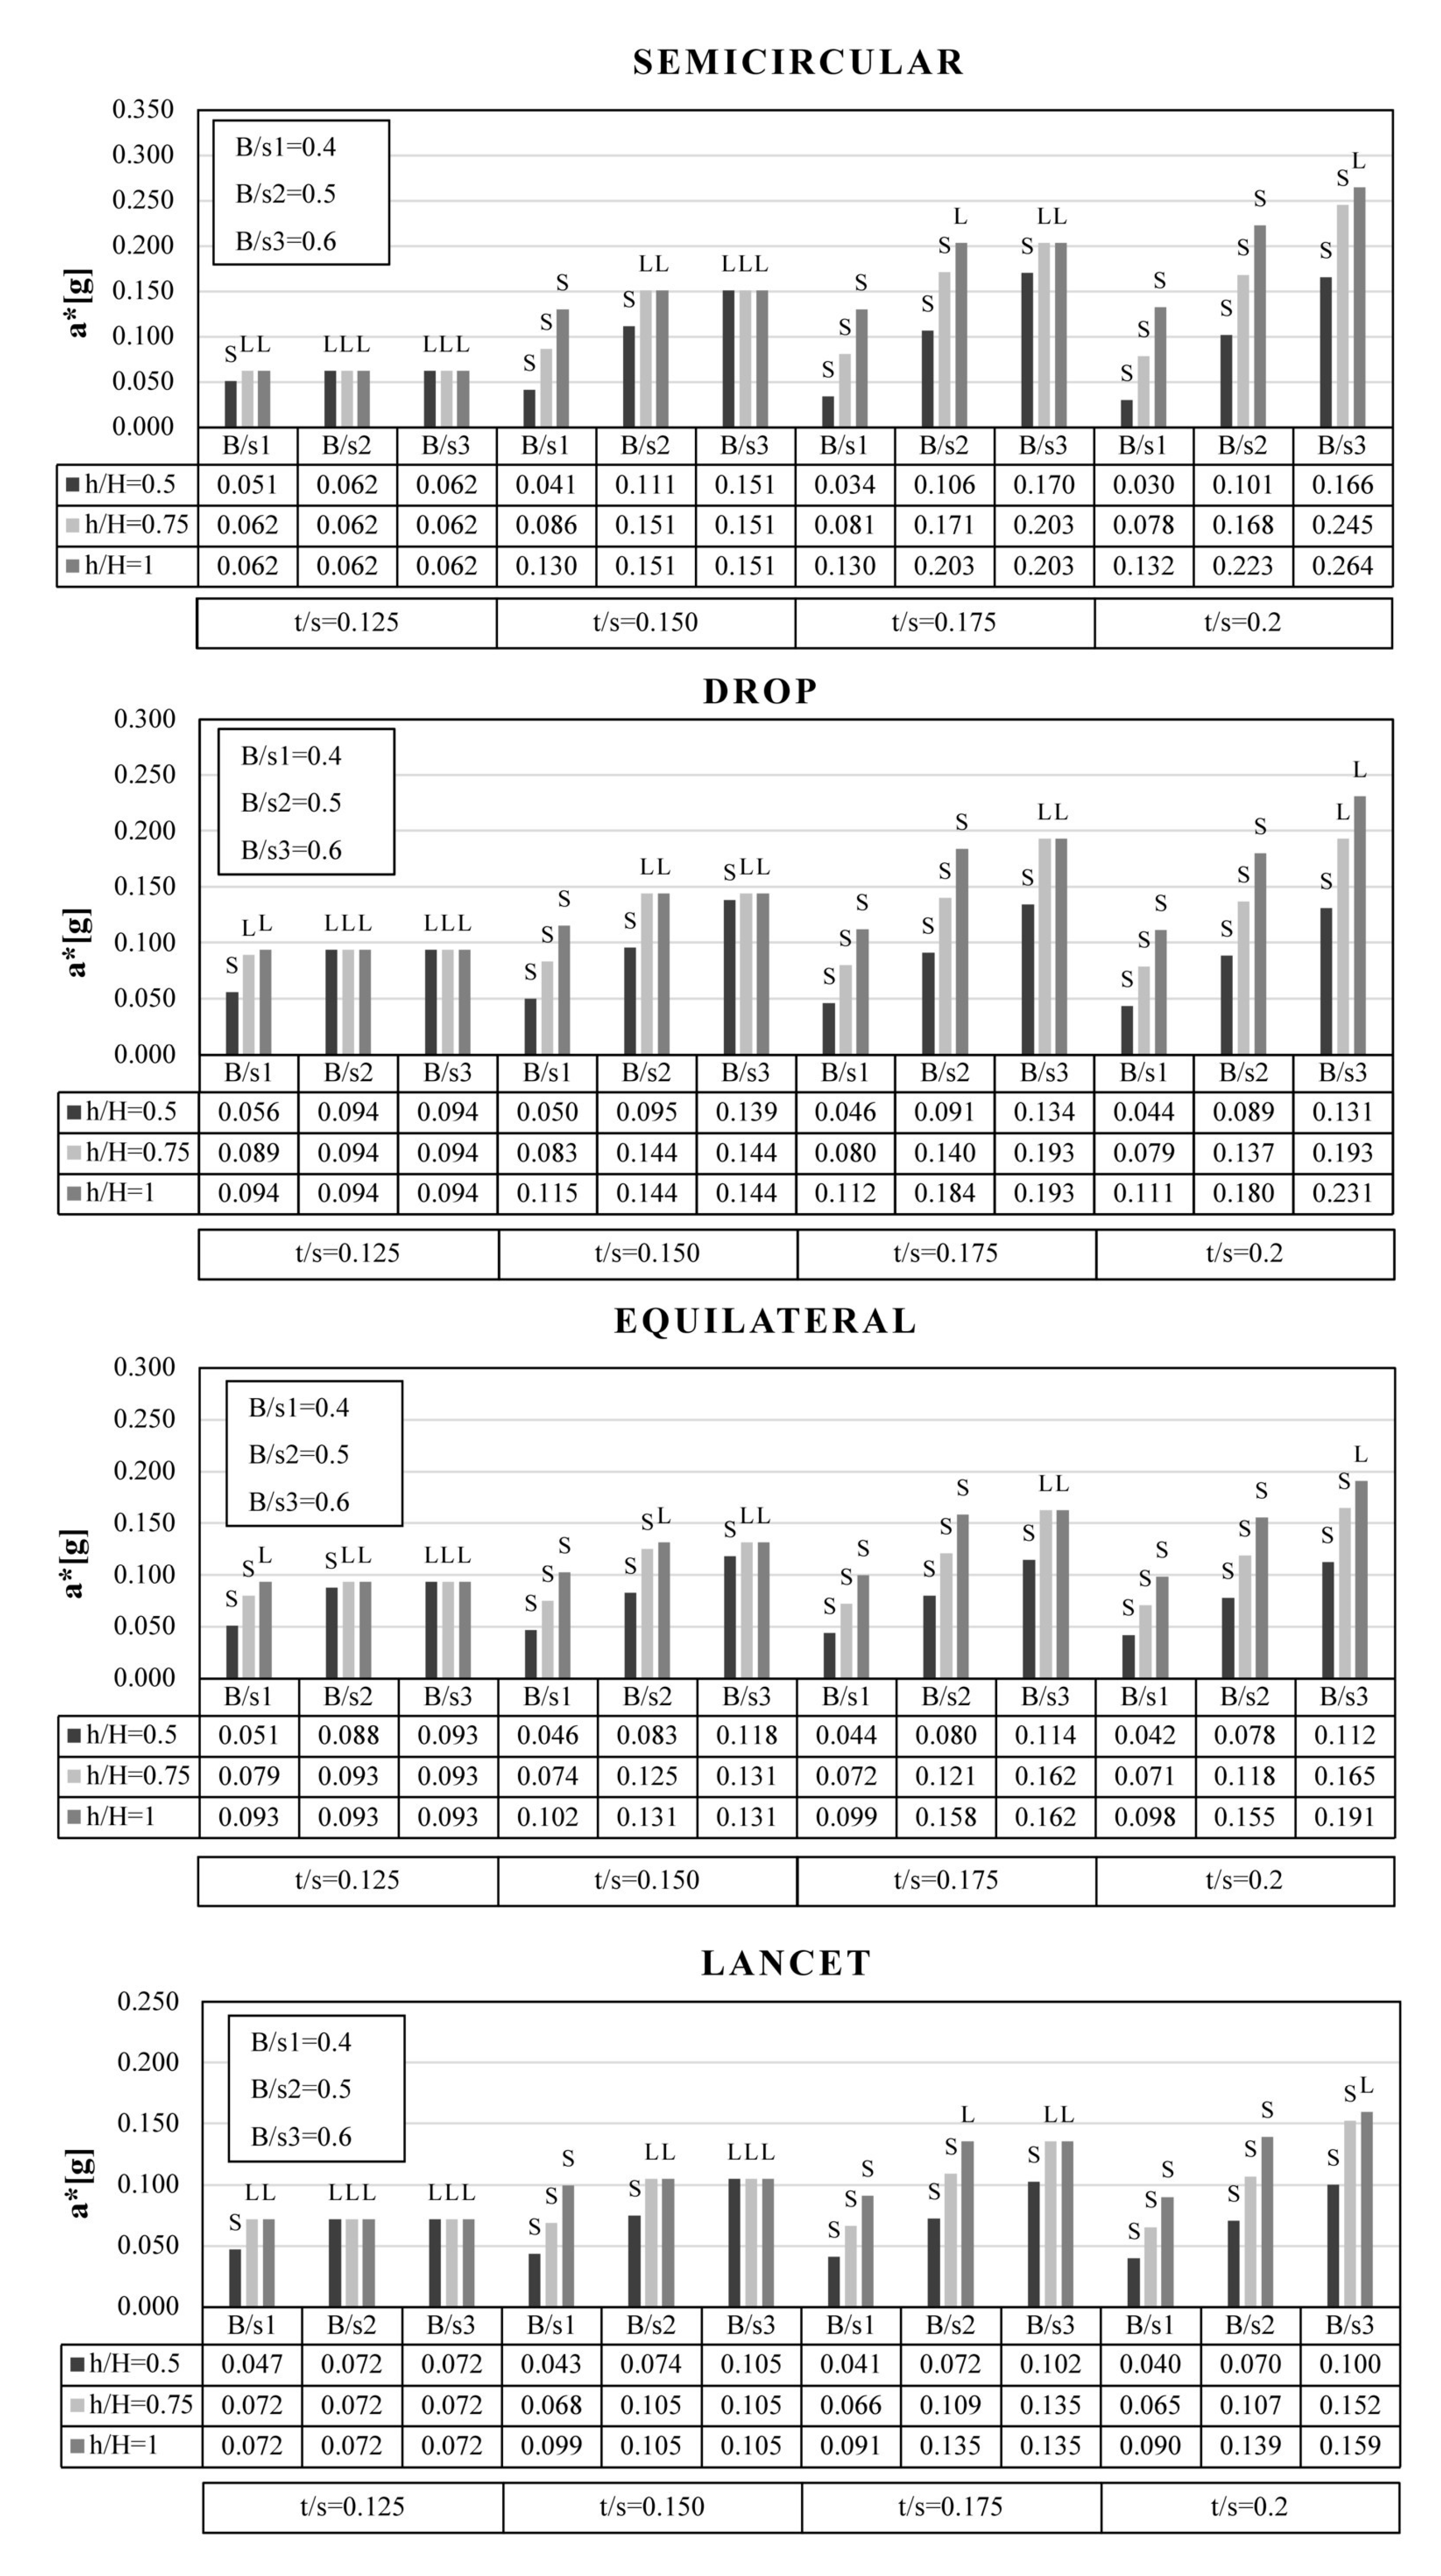
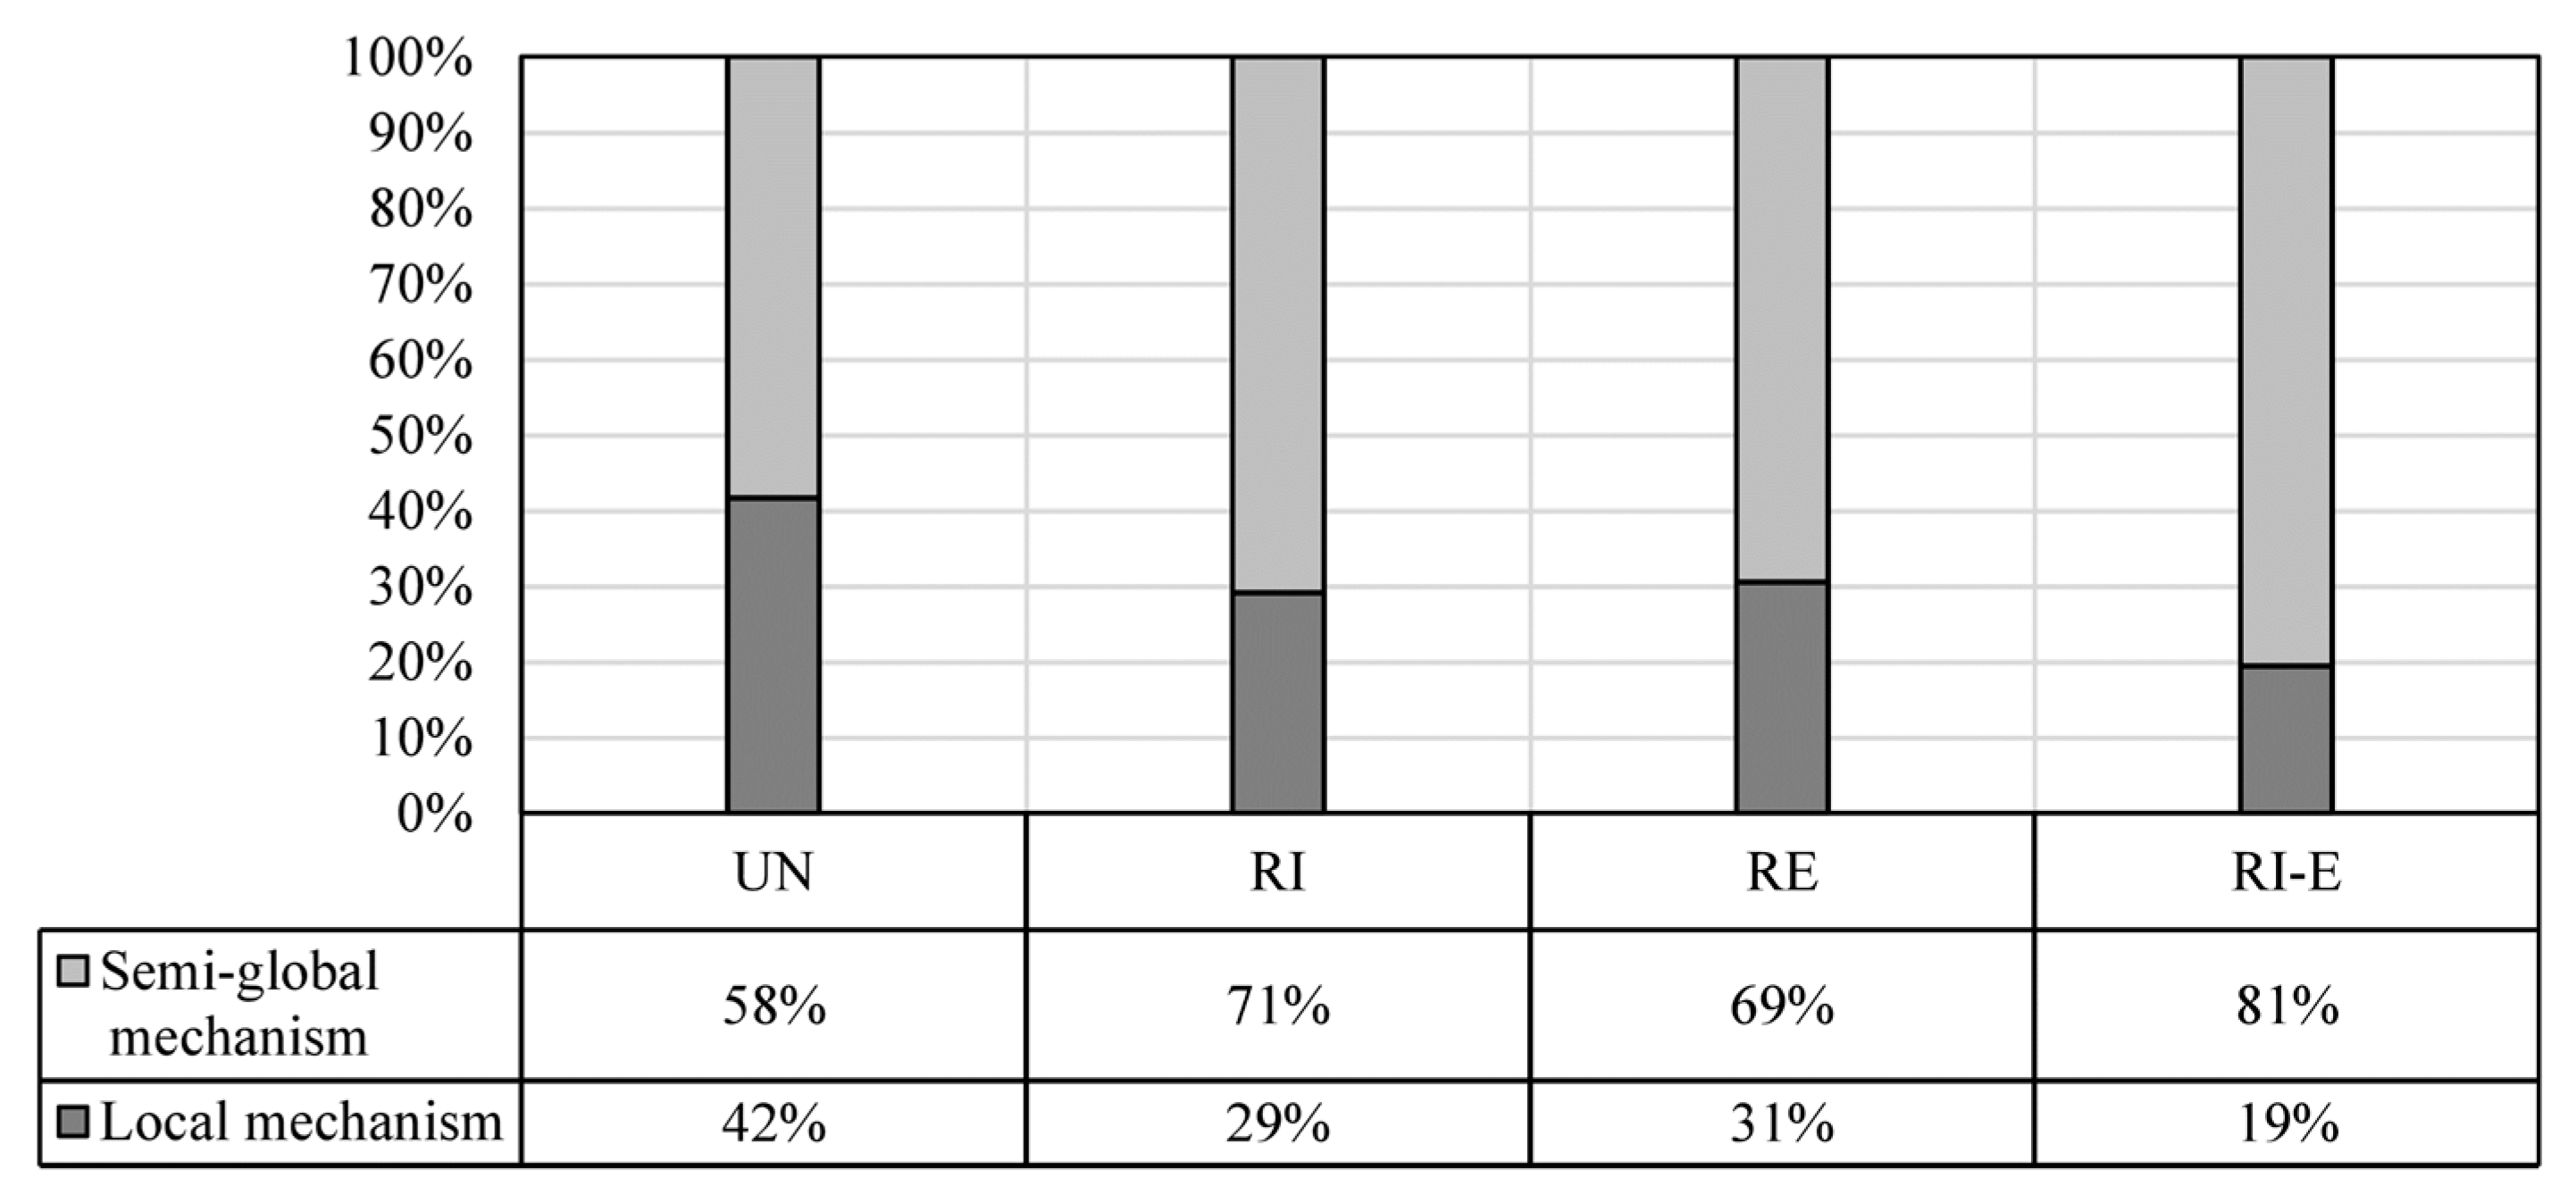
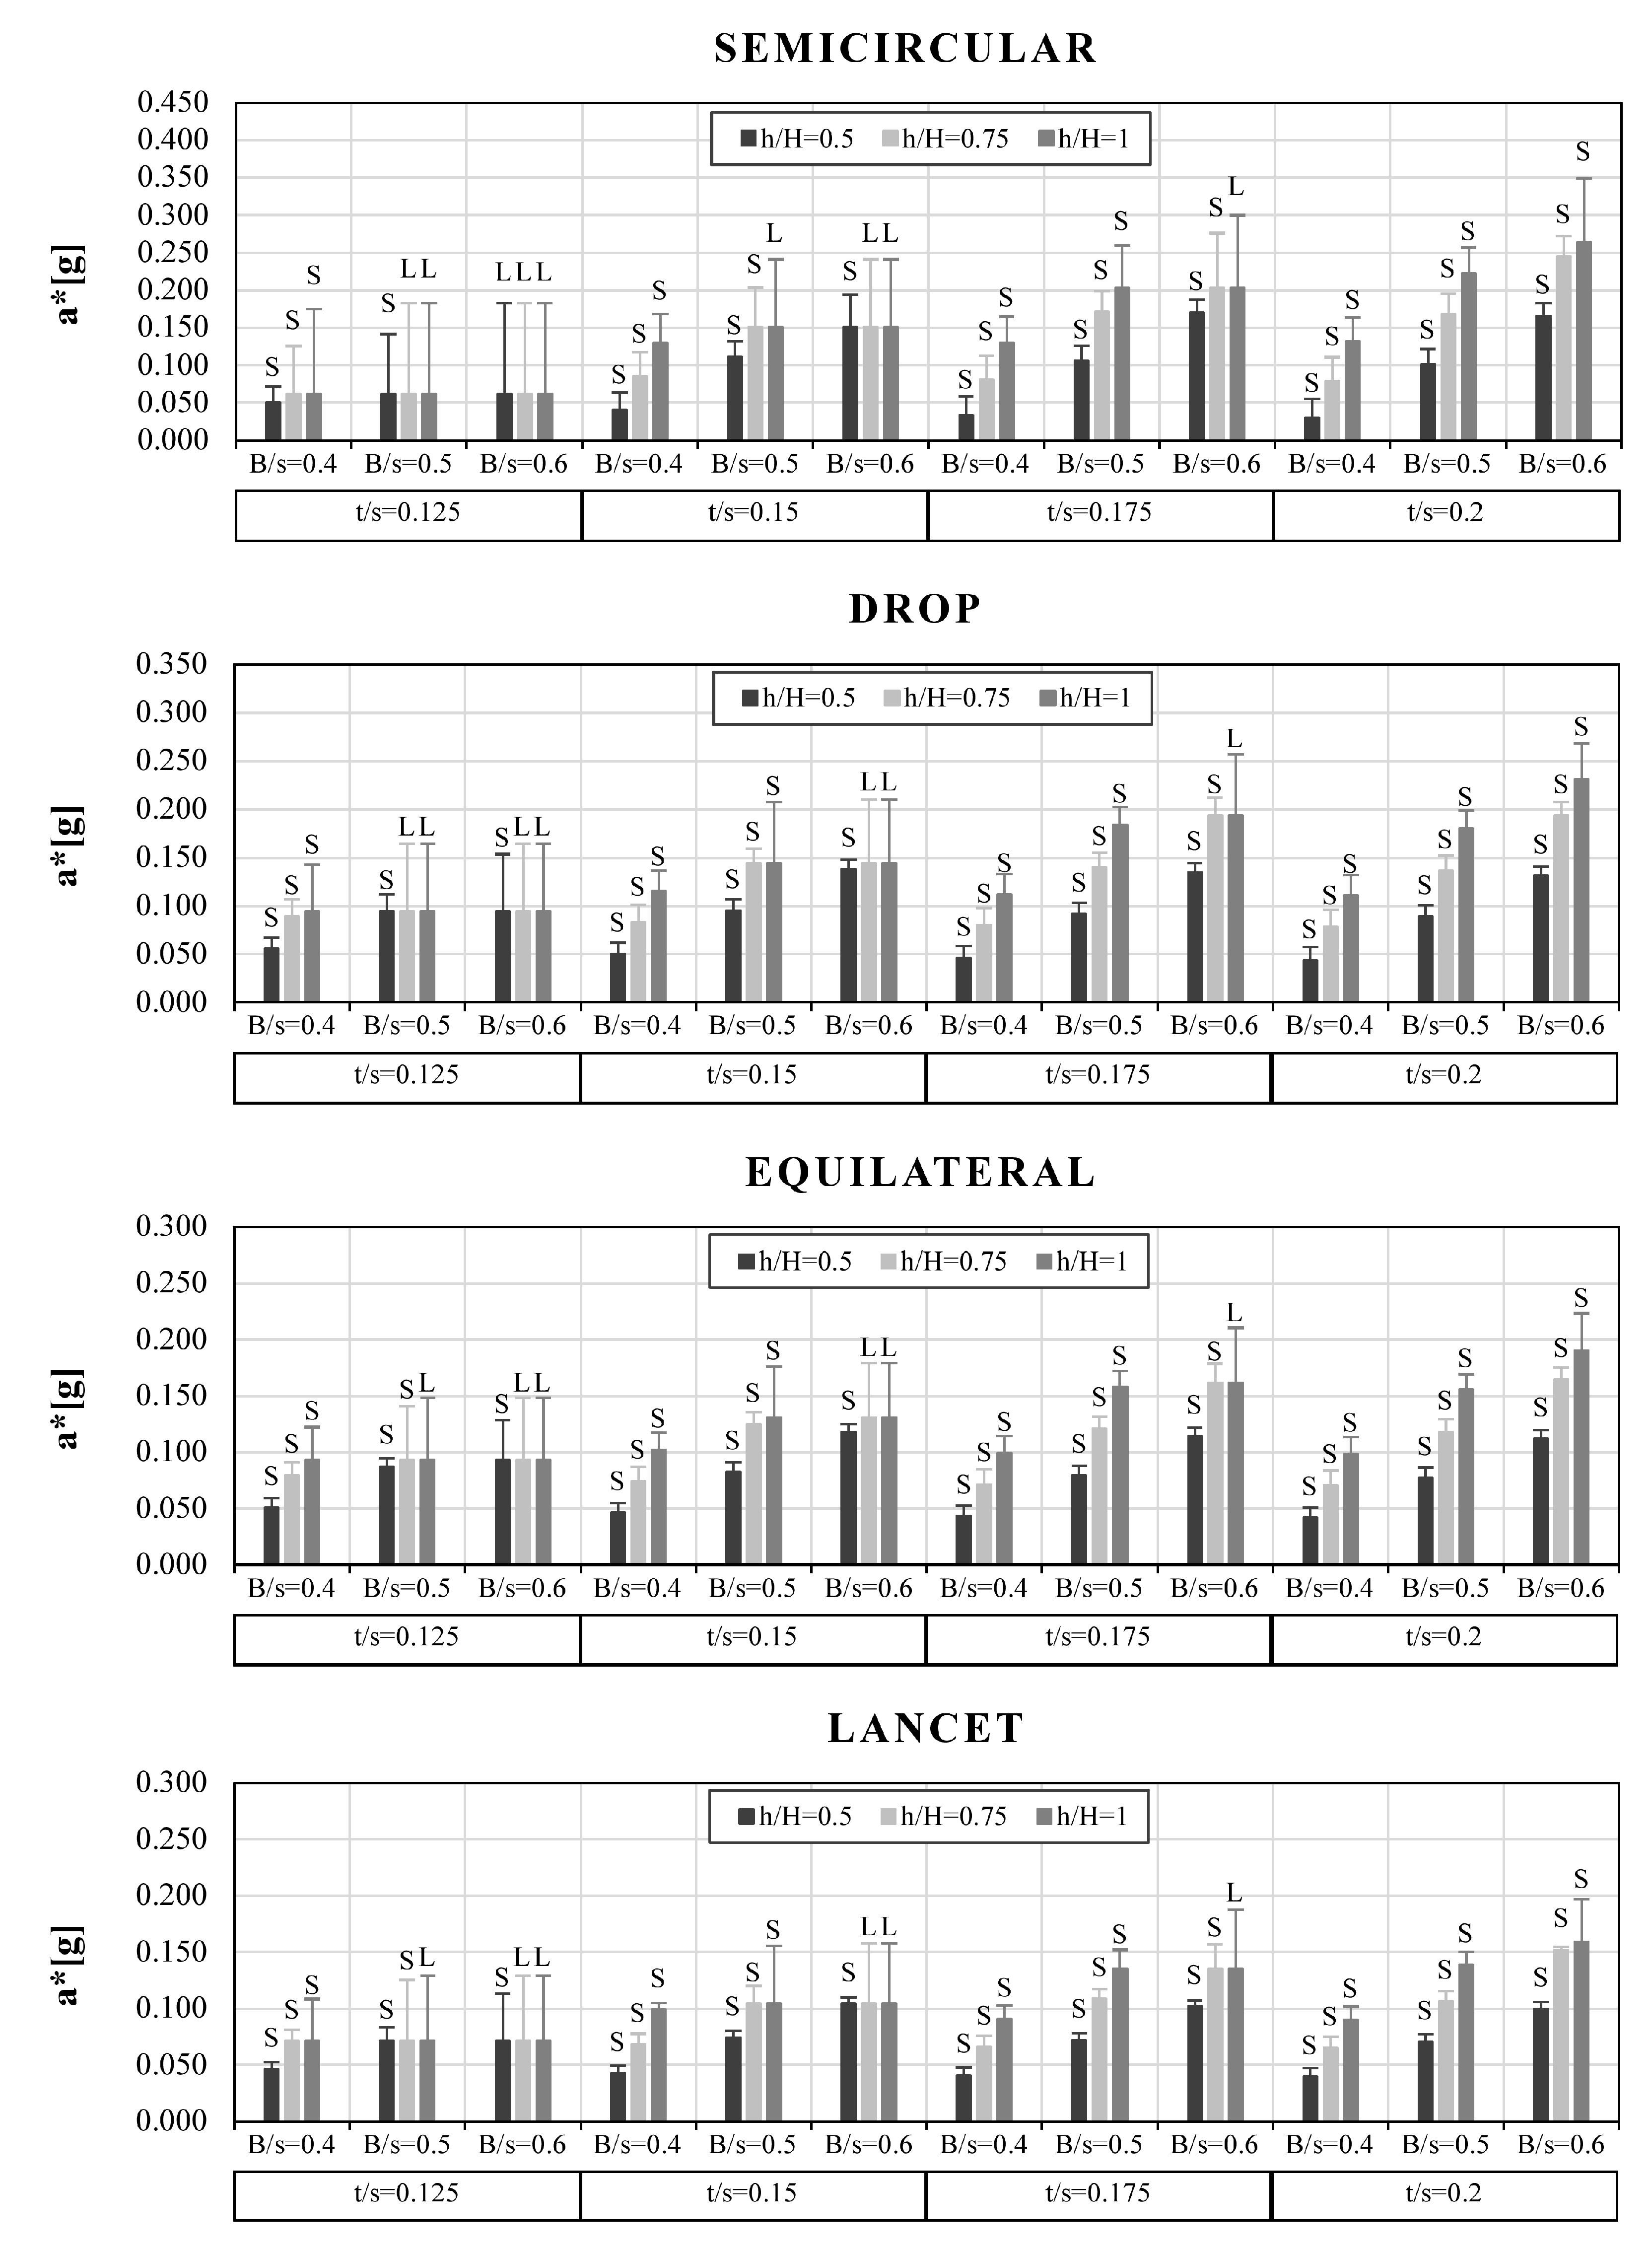
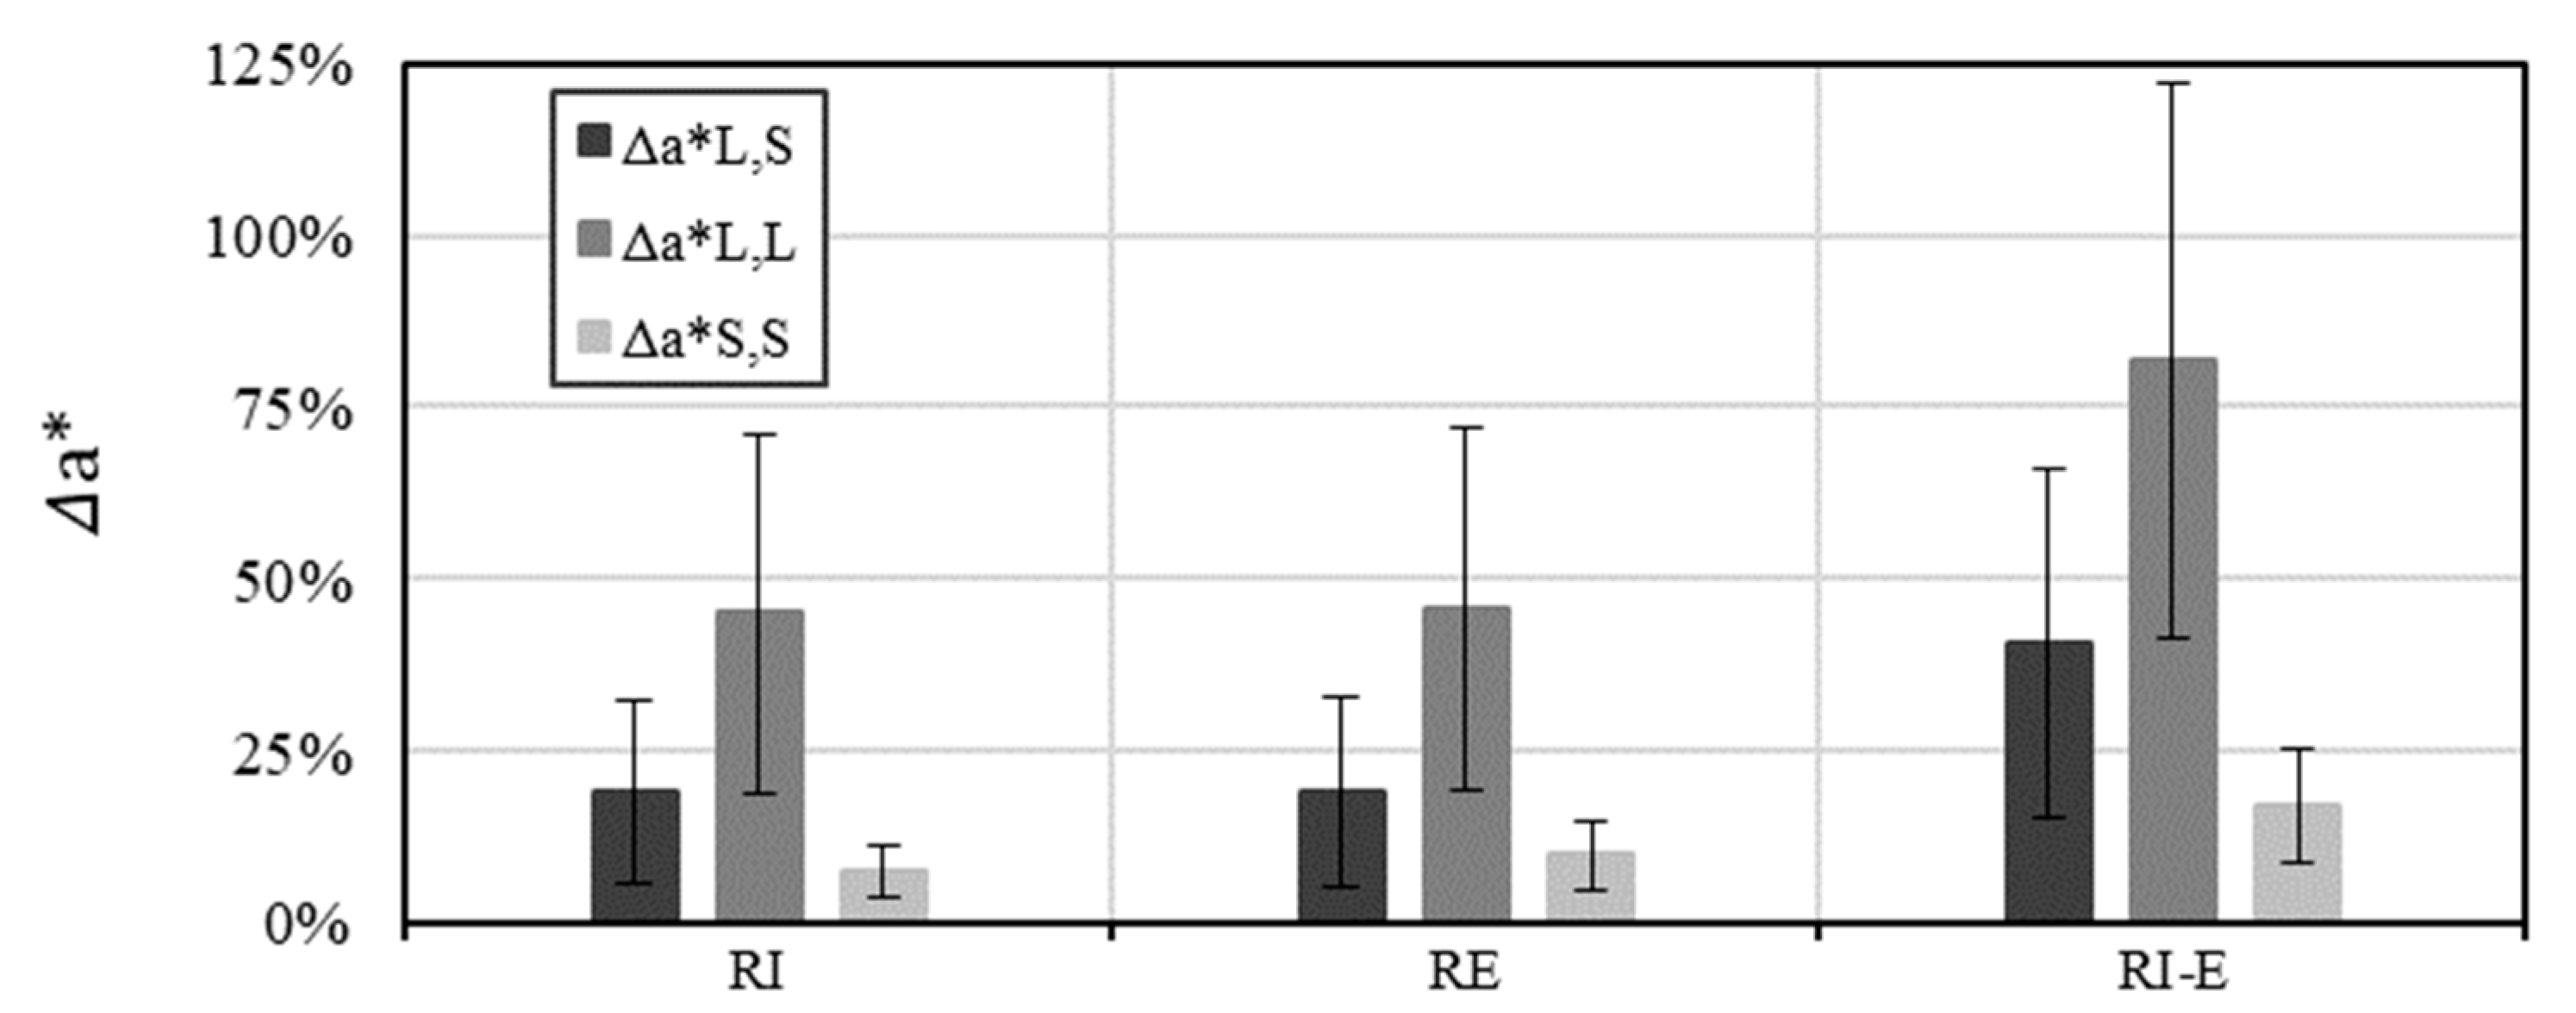
3.3. Retrofitted Buttressed Arches

The same configurations were analysed considering the reinforcement at intrados (RI), extrados (RE) and both sides (RI-E), with a total of 144 × 3 additional analyses performed. As far as the types of activated mechanisms are concerned, once again only local and semi-global mechanisms occurred in the reinforced geometries. However, provided that the reinforcement was conceived to be placed on the arch only and not on the pier, in many cases (up to the 23% in the RI-E configuration) the mechanisms occurred in the reinforced geometries changed from local to semi-global, meaning that the formation of hinges in the arch was properly limited (Figure 16).
The results obtained, for each eccentricity and reinforcement configuration (RI, RE and RI-E), are depicted in Figure 17, Figure 18 and Figure 19, in terms of increase of the a* values (thin lines) with respect to the unreinforced (UN) configuration (bars). The a* values are presented following the t/s, B/s and h/H ratios and L- or S-mechanisms in the reinforced configuration are highlighted.
In all the reinforced cases (RI, RE and RI-E), for lower values of width and height of the piers (e.g., B/s = 0.4; h/H = 0.5), as well as for the lowest value of t/s, S-mechanisms are 100% frequent. On the contrary, only for (RI-E) buttressed arches, S-mechanisms are 100% frequent for the stockier configuration of the piers and arches (e.g., t/s = 0.2, B/s = 0.6; h/H = 1). As in the UN arches, in all the cases in which a* is constant with changing buttresses’ dimensions, local mechanisms occurred.
As regards the percentage increment of a* values, higher values were obtained for (RI-E) buttressed arches. In all the reinforcement configurations, for the lowest value of t/s, the contribution of the mortar seems to be more effective for semicircular buttressed arches: for example, in the case of a semicircular arch with t/s = 0.125, B/s = 0.6 and all h/H values, an a* increase of 120% (RI and RE), up to almost 200% (RI-E) was recorded, represented by the thin lines in Figure 17, Figure 18 and Figure 19.
In Figure 20 some statistics on the percentage increase in capacity are shown, according to the modification in the collapse mechanism due to the reinforcement. More generally, larger increases in the acceleration values a* were recorded in those cases where the activated mechanism remained of L-type, from the unreinforced to the reinforced condition. In particular, an increment up to an average percentage of nearly 50% for (RI) and (RE) buttressed arches, and up to more than 80% for (RI-E) buttressed arches, can be observed (Δa*L,L). This underlines the usefulness of this type of reinforcement, which does not involve the piers, for buttressed arches more vulnerable to L-mechanisms. If the mechanism was local in the UN configuration and shifted to semi-global, the average capacity increase was on average equal to 22% for reinforcement on one side (RI or RE) and 40% for RI-E. Conversely, low average increments (from 8 to 17%) of a* can be observed for buttressed arches whose mechanisms remained of S-type, from the (UN) to the (RI), (RE) and (RI-E) cases (Δa*S,S).
According to Equation (6), it is possible to define a dimensionless ductility of the buttressed arch δ * as the ratio between the horizontal key displacement when mortar reaches its ductility limit δ u ,   k and mortar capacity δ u , m . In Figure 21, the average and standard deviation for δ * , which identify the ductility of (RI), (RE) and (RI-E) buttressed arches, are depicted. The contribution of the mortar seems more convenient in the case of (RE) buttressed arches. This ductility reserve together with increase in acceleration at collapse can be exploited for seismic retrofitting of buttressed arches.
It must be pointed out that under the usual hypothesis of limit analysis, the attainment of collapse load corresponds to the creation of a collapse mechanism in an unreinforced masonry system. It follows that the ductility, meant as the maximum displacement at ultimate load, would be theoretically infinite, only limited by either second-order effects or compressive failure at the hinge. This is also evident in the DMEM simulations shown in Figure 10. The ductility as it is referred to in Figure 21 represents the ability of the system to sustain the strength increment due to the reinforcement, and as such is of course null in the UN configuration. After exhausting this strength surplus, the system strength is expected to reduce to that of the UN configuration until the mentioned conditions (second-order effects or compressive failure) are met.
Seen in Figure 21, the RI-E configuration appears less effective than RE in average. This unintuitive result may be explained with the fact that when the reinforcement is applied either at intrados or extrados only, it may change the collapse mechanism in a way that the largest crack opening occurs on the opposite side (extrados or intrados, respectively). The ductility is thus limited by the attainment of ultimate crack opening (i.e., ultimate displacement of the reinforcement) in a crack which is not the most opened among the four which characterise the mechanism. When FRM is applied on both sides the ultimate mortar displacement is attained always at the largest crack opening, and thus this may limit the overall ductility. Of course, RI-E also implies larger strength, as evident in Figure 18, so this must not be seen as an argument against RI-E configuration.

4. Conclusions

In this paper, the seismic performance of buttressed arches with and without FRM retrofitting is parametrically investigated. The analyses were performed by means of an ad-hoc script in Gmsh software able to build the model and evaluate the plastic multiplier through the kinematic theorem of limit analysis. The validation of the script was performed comparing the results with DMEM predictions.
The results of the parametric analysis show that for this type of structure global mechanisms are unlikely, since for typical geometric ratios the arch is always weaker than the piers. This means that arch retrofitting by means of FRM may be an appropriate option to increase the seismic behaviour of the system. Semicircular arches show the best performances to horizontal actions compared to pointed arches, unless the thickness of the arch is close to the minimum thickness to withstand self-weight (t/s = 1/9). Pier dimensions and arch thickness have a positive influence on the seismic capacity in terms of maximum horizontal acceleration respectively in the case of semi-global and local mechanisms.
The application of a 30 mm-thick FRM reinforcement with ductile behaviour and 0.70 MPa tensile strength leads to a shift of collapse modes towards the semi-global type. This is particularly evident if the reinforcement is applied on both sides (81% S-mechanism, against 58% of the unreinforced case). Rather intuitively, the retrofitting is mostly effective when the mechanism remains local, with average acceleration capacity increasing up to 80%. On the contrary if the mechanism was already semi-global in the UN configuration, remarkably lower effectiveness was recorded (8–17%). It must be added that in case of semi-global or, even more, global mechanisms the strength of the pier should be enhanced, and thus different retrofitting technologies should be explored [35].
The increase in acceleration capacity is always coupled with a system ductility enhancement which depends on the characteristics of the mortar. Experimental testing activities currently undergoing will provide quantitative data and validation of the present preliminary analysis on the retrofitting technology both at material and structural level.

Supplementary Materials

The following are available online at https://www.mdpi.com/article/10.3390/buildings11090406/s1.

Author Contributions

Conceptualization, C.C. and G.D.M.; Data curation, D.C.; Funding acquisition, C.C. and G.D.M.; Investigation, D.C.; Project administration, C.C.; Software, C.C.; Supervision, G.D.M.; Visualization, D.C.; Writing—original draft, C.C. and D.C.; Writing—review & editing, C.C. and G.D.M. All authors have read and agreed to the published version of the manuscript.

Funding

The work described in this paper has been carried out within the activities of project “ARCH—Advanced Retrofitting for Curved Historical structures”, funded by the University of Campania “Luigi Vanvitelli” through the program VALERE 2020. The first author is funded by MUR (Ministry of University and Research) through PON FSE 2014-2020 program (project AIM1879349-2).

Informed Consent Statement

Not applicable.

Data Availability Statement

Data is contained within the article or Supplementary Material.

Conflicts of Interest

The authors declare no conflict of interest.

References

  1. De Matteis, G.; Zizi, M. Seismic Damage Prediction of Masonry Churches by a PGA-based Approach. Int. J. Archit. Herit. 2019, 13, 1165–1179. [Google Scholar] [CrossRef]
  2. Brandonisio, G.; Mele, E.; De Luca, A. Limit analysis of masonry circular buttressed arches under horizontal loads. Meccanica 2017, 52, 2547–2565. [Google Scholar] [CrossRef]
  3. Brandonisio, G.; Angelillo, M.; De Luca, A. Seismic capacity of buttressed masonry arches. Eng. Struct. 2020, 215, 110661. [Google Scholar] [CrossRef]
  4. Dimitri, R.; De Lorenzis, L.; Zavarise, G. Numerical study on the dynamic behavior of masonry columns and arches on buttresses with the discrete element method. Eng. Struct. 2011, 33, 3172–3188. [Google Scholar] [CrossRef]
  5. Dimitri, R.; Tornabene, F. A parametric investigation of the seismic capacity for masonry arches and portals of different shapes. Eng. Fail. Anal. 2015, 52, 1–34. [Google Scholar] [CrossRef]
  6. Pulatsu, B.; Erdogmus, E.; Bretas, E.M.; Lourenco, P. In-Plane Static Response of Dry-Joint Masonry Arch-Pier Structures. In Proceedings of the AEI 2019, Tysons, WV, USA, 3–6 April 2019. [Google Scholar]
  7. Borri, A.; Castori, G.; Corradi, M. Intrados strengthening of brick masonry arches with composite materials. Compos. Part B Eng. 2011, 42, 1164–1172. [Google Scholar] [CrossRef]
  8. Cancelliere, I.; Imbimbo, M.; Sacco, E. Experimental tests and numerical modeling of reinforced masonry arches. Eng. Struct. 2010, 32, 776–792. [Google Scholar] [CrossRef]
  9. Foraboschi, P. Strengthening of Masonry Arches with Fiber-Reinforced Polymer Strips. J. Compos. Constr. 2004, 8, 191–202. [Google Scholar] [CrossRef]
  10. Gattesco, N.; Boem, I.; Andretta, V. Experimental behaviour of non-structural masonry vaults reinforced through fibre-reinforced mortar coating and subjected to cyclic horizontal loads. Eng. Struct. 2018, 172, 419–431. [Google Scholar] [CrossRef]
  11. Angiolilli, M.; Gregori, A.; Cattari, S. Performance of Fiber Reinforced Mortar coating for irregular stone masonry: Experimental and analytical investigations. Constr. Build. Mater. 2021, 294, 123508. [Google Scholar] [CrossRef]
  12. Ferrara, G.; Caggegi, C.; Martinelli, E.; Gabor, A. Shear capacity of masonry walls externally strengthened using Flax-TRM composite systems: Experimental tests and comparative assessment. Constr. Build. Mater. 2020, 261, 120490. [Google Scholar] [CrossRef]
  13. Alecci, V.; De Stefano, M.; Focacci, F.; Luciano, R.; Rovero, L.; Stipo, G. Strengthening Masonry Arches with Lime-Based Mortar Composite. Buildings 2017, 7, 49. [Google Scholar] [CrossRef] [Green Version]
  14. Del Zoppo, M.; Di Ludovico, M.; Prota, A. Analysis of FRCM and CRM parameters for the in-plane shear strengthening of different URM types. Compos. Part B Eng. 2019, 171, 20–33. [Google Scholar] [CrossRef]
  15. ICC Evaluation Service; AC434. Acceptance Criteria for Masonry and Concrete Strengthening Using Fiber-Reinforced Cementitious Matrix (FRCM) Composite Systems; ICC Evaluation Service: Brea, CA, USA, 2011. [Google Scholar]
  16. ACI 549.4R-13. Guide to Design and Construction of Externally Bonded Fabric-Reinforced Cementitious Matrix (FRCM) Systems for Repair and Strengthening Concrete and Masonry Structures; American Concrete Institute: Farmington Hills, MI, USA, 2013. [Google Scholar]
  17. Angiolilli, M.; Gregori, A.; Vailati, M. Lime-Based Mortar Reinforced by Randomly Oriented Short Fibers for the Retrofitting of the Historical Masonry Structure. Materials 2020, 13, 3462. [Google Scholar] [CrossRef] [PubMed]
  18. Bustos-García, A.; Moreno-Fernández, E.; Zavalis, R.; Valivonis, J. Diagonal compression tests on masonry wallets coated with mortars reinforced with glass fibers. Mater. Struct. 2019, 52, 60. [Google Scholar] [CrossRef]
  19. Simoncello, N.; Zampieri, P.; Gonzalez-Libreros, J.; Pellegrino, C. Experimental behaviour of damaged masonry arches strengthened with steel fiber reinforced mortar (SFRM). Compos. Part B Eng. 2019, 177, 107386. [Google Scholar] [CrossRef]
  20. Zhang, Y.; Tubaldi, E.; Macorini, L.; Izzuddin, B.A. Mesoscale partitioned modelling of masonry bridges allowing for arch-backfill interaction. Constr. Build. Mater. 2018, 173, 820–842. [Google Scholar] [CrossRef] [Green Version]
  21. Cannizzaro, F.; Pantò, B.; Caddemi, S.; Caliò, I. A Discrete Macro-Element Method (DMEM) for the nonlinear structural assessment of masonry arches. Eng. Struct. 2018, 168, 243–256. [Google Scholar] [CrossRef] [Green Version]
  22. Pantò, B.; Chisari, C.; Macorini, L.; Izzuddin, B. A macroscale modelling approach for nonlinear analysis of masonry arch bridges. In Proceedings of the SAHC 2021, Barcelona, Spain, 29 September–1 October 2021. [Google Scholar]
  23. Zizi, M.; Cacace, D.; Rouhi, J.; Lourenço, P.B.; De Matteis, G. Automatic Procedures for the Safety Assessment of Stand-alone Masonry Arches. Int. J. Archit. Herit. 2021, in press. [Google Scholar] [CrossRef]
  24. Heyman, J. The Masonry Arch; Ellis Horwood Ltd.: Chichester, UK, 1982. [Google Scholar]
  25. De Luca, A.; Giordano, A.; Mele, E. A simplified procedure for assessing the seismic capacity of masonry arches. Eng. Struct. 2004, 26, 1915–1929. [Google Scholar] [CrossRef]
  26. Gilbert, M.; Casapulla, C.; Ahmed, H. Limit analysis of masonry block structures with non-associative frictional joints using linear programming. Comput. Struct. 2006, 84, 873–887. [Google Scholar] [CrossRef]
  27. Funari, M.F.; Spadea, S.; Lonetti, P.; Fabbrocino, F.; Luciano, R. Visual programming for structural assessment of out-of-plane mechanisms in historic masonry structures. J. Build. Eng. 2020, 31, 101425. [Google Scholar] [CrossRef]
  28. Como, M. Statics of Historic Masonry Constructions; Springer: Berlin/Heidelberg, Germany, 2013. [Google Scholar]
  29. Geuzaine, C.; Remacle, J.-F. Gmsh: A three-dimensional finite element mesh generator with built-in pre- and post-processing facilities. Int. J. Numer. Methods Eng. 2009, 79, 1309–1331. [Google Scholar] [CrossRef]
  30. Ministero delle Infrastrutture e dei Trasporti. Istruzioni per l’applicazione dell’Aggiornamento Delle “Norme Tecniche per le Costruzioni” di cui al decreto ministeriale 17 gennaio 2018; Ministero delle Infrastrutture e dei Trasporti: Rome, Italy, 2019. [Google Scholar]
  31. Rondelet, J.B. Trattato Teorico e Pratico Dell’arte di Edificare. Prima Traduzione Italiana Sulla Sesta Edizione Originale Con Note e Giunte Importantissime; Caranenti: Mantova, Italy, 1832. (In Italian) [Google Scholar]
  32. Iucolano, F.; Liguori, B.; Colella, C. Fibre-reinforced lime-based mortars: A possible resource for ancient masonry restoration. Constr. Build. Mater. 2013, 38, 785–789. [Google Scholar] [CrossRef]
  33. Alexakis, H.; Makris, N. Hinging Mechanisms of Masonry Single-Nave Barrel Vaults Subjected to Lateral and Gravity Loads. J. Struct. Eng. 2017, 143, 04017026. [Google Scholar] [CrossRef]
  34. Lourenço, P.B. Recent advances in masonry modelling: Micromodelling and homogenisation. In Multiscale Modeling in Solid Mechanics; Galvanetto, U., Aliabadi, M.H.F., Eds.; Imperial College Press: London, UK, 2009; pp. 251–294. [Google Scholar]
  35. Aiello, M.A.; Cascardi, A.; Ombres, L.; Verre, S. Confinement of Masonry Columns with the FRCM-System: Theoretical and Experimental Investigation. Infrastructures 2020, 5, 101. [Google Scholar] [CrossRef]
Figure 1. Collapse mechanisms of a buttressed arch: (a) Local mechanism; (b) Global mechanism; (c) Semi-global mechanism.
Buildings 11 00406 g001
Figure 2. Stress distribution in an opening hinge: (a) perfectly plastic, and (b) hinge with perfectly plastic reinforcement.
Buildings 11 00406 g002
Figure 3. Flowchart of the Gmsh scripts to evaluate the arch collapse multiplier.
Buildings 11 00406 g003
Figure 4. Graphical interface of the script and input data window.
Buildings 11 00406 g004
Figure 5. Dimensional parameters for the characterisation of the buttressed arches.
Buildings 11 00406 g005
Figure 6. Representation of the empirical rule for the sizing of the buttresses of an arch.
Buildings 11 00406 g006
Figure 7. Validation of the automatic tool against the analytical results in [33].
Buildings 11 00406 g007
Figure 8. Validation of the automatic tool for limit analysis and comparison with DMEM: (a) layout of the system, and (b) typical failure modes of an arch [21]. Dimensions in cm. Adapted with permission from Ref. [21]. Copyright 2021 Elsevier.
Buildings 11 00406 g008
Figure 9. Typical cyclic constitutive laws used for nonlinear springs in DMEM: (a) tension/compression (rocking), (b) shear in the block and (c) sliding.
Buildings 11 00406 g009
Figure 10. λ-u plots for the analysed models: (a,b) weak masonry, (c,d) strong masonry. (a,c) plots at varying ft, (b,d) at varying Gt.
Buildings 11 00406 g010
Figure 11. Comparison between DMEM and limit analysis: (a) DMEM deformed shape at failure for all models except Model 1, (b) Model 1 DMEM deformed shape at failure, (c) limit analysis hinge position, (d) peak load plastic strain for weak masonry with ft = 0.1 MPa, Gt = 0.01 N/mm, and (e) peak load plastic strain for weak masonry with ft = 0.1 MPa, Gt = 0.05 N/mm.
Buildings 11 00406 g011
Figure 12. Values of a* for each considered eccentricity, each h/H configuration and B/s = 0.4, expressed with respect to the t/s ratio: (a) h/H = 0.5, (b) h/H = 0.75 and (c) h/H = 1.0. Local mechanism (L) or semi-global mechanism (S) are highlighted.
Buildings 11 00406 g012
Figure 13. Values of a* for each considered eccentricity, each h/H configuration and B/s = 0.5, expressed with respect to the t/s ratio: (a) h/H = 0.5, (b) h/H = 0.75 and (c) h/H = 1.0. Local mechanism (L) or semi-global mechanism (S) are highlighted.
Buildings 11 00406 g013
Figure 14. Values of a* for each considered eccentricity, each h/H configuration and B/s = 0.6, expressed with respect to the t/s ratio: (a) h/H = 0.5, (b) h/H = 0.75 and (c) h/H = 1.0. Local mechanism (L) or semi-global mechanism (S) are highlighted.
Buildings 11 00406 g014
Figure 15. Values of a* for each considered eccentricity, t/s ratio, h/H configuration and B/s value. Local (L) or semi-global mechanism (S) are highlighted.
Buildings 11 00406 g015
Figure 16. Percentage of activation of Local or Semi-global mechanisms in (UN), (RI), (RE) and (RI-E) buttressed arches.
Buildings 11 00406 g016
Figure 17. Values of a*[g] of (RI) buttressed arches, for each considered eccentricity, t/s ratio, h/H configuration and B/s value. Local mechanism (L) or Semi-global mechanism (S) are highlighted.
Buildings 11 00406 g017
Figure 18. Values of a*[g] of (RE) buttressed arches, for each considered eccentricity, t/s ratio, h/H configuration and B/s value. Local mechanism (L) or Semi-global mechanism (S) are highlighted.
Buildings 11 00406 g018
Figure 19. Values of a*[g] of (RI-E) buttressed arches, for each considered eccentricity, t/s ratio, h/H configuration and B/s value. Local mechanism (L) or Semi-global mechanism (S) are highlighted.
Buildings 11 00406 g019
Figure 20. Percentage Δa* increment ± standard deviation of (RI), (RE) and (RI-E) buttressed arches, classified according to the variation of the activated mechanisms with respect to the (UN) buttressed arches.
Buildings 11 00406 g020
Figure 21. Dimensionless ductility of (UN), (RI), (RE) and (RI-E) buttressed arches.
Buildings 11 00406 g021
Table 1. Material parameters for the arch used in the validation.
Masonry Typew (kN/m3)E
(Mpa)
G
(Mpa)
fc (Mpa)Gc (N/mm)τ0 (Mpa)γu
(-)
c
(Mpa)
μ
(-)
Gf (N/mm)
Weak196902301.03.00.0180.0050.0180.62.0
Strong1918006004.63.00.130.0050.130.62.0
Publisher’s Note: MDPI stays neutral with regard to jurisdictional claims in published maps and institutional affiliations.

