Article

Lateral Impact Response of Concrete-Filled Square Steel Tubes with Local Defects

1
School of Civil Engineering, Xijing University, Xi’an 710123, China
2
School of Civil Engineering, Harbin Institute of Technology, Harbin 150090, China
3
Postdoctoral Station of Civil Engineering, Chongqing University, Chongqing 400045, China
*
Author to whom correspondence should be addressed.
Buildings 2022, 12(7), 996; https://doi.org/10.3390/buildings12070996
Submission received: 7 June 2022 / Revised: 5 July 2022 / Accepted: 11 July 2022 / Published: 13 July 2022
(This article belongs to the Special Issue Sustainability and Resiliency of Building Materials and Structures)

Abstract

:
A numerical model of 84 high-strength concrete-filled square steel tubular columns (HSCFST) with local defects is developed using ABAQUS. The effects of parameters such as crack angle, crack length, impact surface and impact energy on the impact resistance of HSCFST columns are considered. The results show that under the effect of local corrosion, a model with horizontal cracks will show the phenomenon of crack closure when subjected to the front impact. The impact force platform value is mainly affected by the impact surface, followed by the crack angle, while the increase of the crack length mainly has a greater effect on the model of the rear impact. The impact resistance of the front impact model is better than that of the side and rear impact models. Increasing the crack length and decreasing the crack angle will increase the mid-span deflection of the model, and the mid-span deflection of the front impact model is smaller than that of the side and rear impact models. The energy absorption ratio of the model is proportional to the increase of the crack length and inversely proportional to the increase of the crack angle. Decreasing the crack angle will reduce the increase coefficient (Rd) of the dynamic flexural capacity of the model. A practical calculation method for the increased coefficient of the dynamic flexural capacity of HSCFST columns under local corrosion is proposed.

1. Introduction

A concrete-filled steel tube (CFST) structure has the characteristics of high-bearing capacity, good plasticity and toughness. Meanwhile, a concrete-filled steel tube structure has good seismic performance and fire resistance, which is suitable for use in seismic zones as well as in structural engineering that requires fire resistance design [1,2]. Therefore, concrete-filled steel tube structures are widely used in all kinds of civil engineering structures, such as large-span space structures of super high-rise buildings, bridge piers, power towers, subway stations, etc.
Most of the actual engineering design only considers static loads such as constant load, live load and dynamic loads such as wind load and earthquake action, while ignoring the dynamic impact loads with very short action time and huge energy. The impact load will cause rapid deformation of structural members, which will lead to the collapse of the whole structure and the loss of load-bearing capacity in serious cases. Therefore, the lateral impact resistance of concrete-filled steel tube members is particularly important. Bambach et al. [3,4] conducted static and dynamic performance tests and numerical simulation studies on square concrete-filled steel tubular members under impact load, and the results indicated that slender concrete-filled steel tubular members were prone to early fracture, resulting in a decline in energy dissipation capacity. Hou et al. [5] obtained the correlation functions of the improved coefficients of dynamic flexural capacity of concrete-filled circular steel tubular members through regression analysis. The results of the parametric analysis showed that the yield strength of steel, the percentage of steel in the section, the diameter of the section and the impact velocity were the main parameters that affected the dynamic flexural strength of the section. Qu et al. [6] simplified the lateral impact model of concrete-filled circular steel tubes and found that when the section reaches the dynamic ultimate bending moment the angle could be calculated from the bending moment and impact energy. Yang [7] systematically studied the dynamic mechanical response of structural steel and high-strength concrete-filled square steel tubes. The strain rate effect model of S690 high-strength structural steel under three different working conditions was proposed. Cai et al. [8] numerically simulated the lateral impact of concrete-filled square steel tubes and proposed a practical calculation formula for the increased coefficient of section dynamic flexural capacity. Regarding hollow structural steel, Suzuki and Lignos [9] experimentally studied the collapse behavior of full-scale steel HSS under a symmetric lateral displacement loading protocol along with a near-collapse lateral displacement protocol, which represents the ratcheting behavior of steel columns in a special moment frame prior to collapse. Sediek et al. [10] concluded that the depth-to-thickness ratio and initial axial load ratio are the most influential parameters on the axial capacity of hollow structural steel columns under combined axial and lateral loading.
Concrete-filled steel tube structures in different service environments, in addition to the impact-resistant design of the components, should also pay special attention to the existence of easy corrosion of steel shortcomings. As CFST structures are exposed to the natural environment for a long time, it is almost inevitable that the outer steel tube will suffer from corrosion. The probability of local corrosion is much greater than uniform corrosion in construction engineering. When the concrete-filled steel tube member is locally corroded, the local corroded area of the steel tube cannot provide effective restraint to the concrete, which results in the deterioration of the overall performance of the member. Therefore, the effect of corrosive environment on the mechanical properties of concrete-filled steel tubular members is also a concern of many researchers. Gao et al. [11,12] studied the mechanical properties of concrete-filled circular steel tubular short columns under complex environments of freeze–thaw cycles, salt spray corrosion and freeze–thaw–salt spray interaction. The results showed that there was a linear decrease in the axial compression load capacity of the members with the action degree of the three environmental conditions. Han et al. [13] studied the mechanical properties of CFST under the combined action of medium and long-term loading and chloride salt corrosion. The studies showed that the stiffness, bearing capacity and ductility of CFST were significantly reduced by the overall corrosion of the steel tube. Ding et al. [14] studied the axial compression performance of CFST with notch and the results showed that the CFST bearing capacity with notch was significantly reduced. Chen et al. [15] studied the effect of acid rain environment on the mechanical properties of concrete-filled square steel tubes. The results showed that acid rain corrosion reduced not only the bearing capacity but also the energy dissipation capacity of the members.
In the service process of concrete-filled steel tube structures, the external impact on the structural members and the local corrosion on the steel tube occur almost simultaneously and cannot be avoided in the construction project. At present, there is no relevant research on the impact resistance of CFST members under local corrosion and the calculation method of the impact bearing capacity of CFST members based on local corrosion. Therefore, in this paper, ABAQUS software will be used to establish the lateral impact model of high-strength concrete-filled square steel tubular (HSCFST) columns with local corrosion. The corrosion crack of an HSCFST column will be simulated by setting local notches on the outer steel tube of the model. The influence of impact energy, impact surface and corrosion morphology on the impact resistance of the HSCFST column under local corrosion is observed. The design method of the lateral impact capacity of the HSCFST column under local corrosion is explored, which provides the basis for the improvement of the impact resistance design theory of concrete-filled steel tube structures regarding life-cycle service.

2. Numerical Simulation Program

2.1. Model Design

The finite element analysis (FEA) model design adopted the model parameters in the literature [7]. The cross-section size of the HSCFST model is D × D = 180 mm × 180 mm. The model has an overall length of 1700 mm and a steel tube thickness of 6mm. The rigid support is set 250 mm away from both ends of the model. In addition, the weight of the drop hammer is 424 kg and its impact height is 4 m, 8 m and 12 m. Based on the initial model, the local corrosion of the steel tube was simulated by setting local notch cracks with a width of 8 mm. Meanwhile, different crack lengths (lc), crack angles (θ) and impact surfaces were designed to analyze the lateral impact response of the HSCFST model. The local corrosion parameters and model numbers used in this simulation are detailed in Table 1. The local corrosion locations and crack types of the model are detailed in Figure 1, Figure 2 and Figure 3.

2.2. Material Model

2.2.1. Material Model for Steel Tube

The structure or component will be in a high strain rate under dynamic conditions such as high-speed impact and explosion. Currently, the Cowper–Symonds (CS) model [16] and the Johnson–Cook (JC) model [17] are commonly used to predict the dynamic mechanical properties of metallic materials. The CS model is commonly used to characterize the dynamic increment coefficient of dynamic yield strength or ultimate strength, which is applied to the calculation of dynamical problems at medium strain rates. The JC model can well predict the relationship between the dynamic flow stress and plastic strain, strain rate and temperature of the material, and it is suitable for the calculation of high strain rate problems [18]. In this paper, the improved JC model (i.e., MJC model, as shown in Equation (1)) from the literature [7] was used as the dynamic mechanical constitutive model of S690 steel. The MJC model can well predict the dynamic mechanical properties of S690 steel at medium and high strain rates. The ideal elastic plastic model based on the Von Mises yield criterion was used to set the steel tube material properties in the finite element model. The material parameters of the steel tubes were adopted from S690 materiality test data in the literature [7], as shown in Table 2.
σ = ( A + B ε p q ) ( 1 + C ε ˙ d )
in which
ε ˙ d = ε ˙ / ε ˙ o
where σ is the plastic flow stress; ε p is the plastic true strain; ε ˙ d is the dimensionless strain rate parameter; ε ˙ is the strain rate; ε ˙ o is the quasi-static reference strain rate, i.e., 0.001 s−1; A, B, C, q, and d are material constants. A is usually taken as the yield strength of the material and B and q are used to characterize the degree of strain reinforcement. C and d are the material parameter values of the model, which can be fitted using the dynamic increase coefficients corresponding to the strain rate of the material at each level.
The material constant of S690 in this paper adopts the fitting results in reference [7], as shown in Table 3.

2.2.2. Material Model for Core Concrete

The static stress–strain relationship model and strain rate effect model were used to describe the dynamic mechanical properties of concrete. Since the compressive and tensile mechanical behaviors of concrete were inconsistent, different constitutive relations were used for the compressive and tensile properties of concrete in this simulation.
The compressive mechanical behavior of core concrete adopted the stress–strain relationship model given by Han [1], as shown in Equation (3).
y = { 2 x x 2 x β o ( x 1 ) η + x
in which
x = ε ε o
y = σ σ o
σ o = f c
ξ = A s f y A c f ck
ε o = ε c + 800 × ξ 0.2 × 10 6
ε c = ( 1300 + 1.25 f c ) × 10 6
η = 1.6 + 1.5 / x
β o = ( f c ) 0.1 1.2 1 + ξ
where Ac is the concrete cross-sectional area; As is the steel tube cross-sectional area; fy is the steel yield strength; fck is the standard value of concrete axial compressive strength; f c is the concrete cylindrical compressive strength.
For the tensile response of concrete, the tensile stress–strain relationship model for concrete from GB 50010-2010 [19] is used, as shown in Equation (12).
σ = ( 1 d t ) E c ε
in which
d t = { 1 ρ t ( 1.2 0.2 x 5 ) 1 ρ t α t ( x 1 ) 1.7 + x x 1 x > 1
x = ε ε t , r
ρ t = f t , r E c ε t , r
where α t is the parameter value of the falling section of the uniaxial stress–strain curve of concrete, which can be calculated in accordance with α t = 0.312 f t , r 2 ; f t , r is the representative value of the uniaxial tensile strength of concrete, which can be calculated by f t , r = 0.395 f cu 0.55 ; ε t , r is the peak tensile strain of concrete in uniaxial tension, which can be calculated by ε t , r = f t , r 0.54 × 65 × 10 6 ; Ec is the modulus of elasticity of concrete.
Concrete also showed obvious strain rate effects under dynamic load. In this paper, the empirical formula provided in the European Concrete Institute code [20] was used to calculate the coefficient of dynamic increase of concrete, as shown in Equations (16) and (17).
Compression   effect :   { f cd / f cs = ( ε ˙ / ε ˙ co ) 1.026 α s , | ε ˙ | 30   s 1 f cd / f cs = γ s ( ε ˙ / ε ˙ co ) 1 / 3 , | ε ˙ | > 30   s 1
Tension   effect : { f td / f ts = ( ε ˙ / ε ˙ to ) 1.016 δ s , ε ˙ 30   s 1 f td / f ts = β s ( ε ˙ / ε ˙ to ) 1 / 3 , ε ˙ > 30   s 1
in which
ε ˙ co = 30 × 10 6   s 1
ε ˙ to = 3 × 10 6   s 1
α s = 1 5 + 9 f c / f co
δ s = 1 10 + 6 f c / f co
f co = 10   MPa
log γ s = 6.156 α s 2
log β s = 7.112 δ s 2.33
where fcd is the dynamic compressive strength of concrete; ftd is the dynamic tensile strength of concrete; fcs is the static compressive strength of concrete; fts is the static tensile strength of concrete.
The material setup of core concrete was described by the Concrete Damaged Plasticity (CDP model) of concrete built into the FEA. The mechanical parameters of concrete were based on the data obtained in the literature [7], where the elastic modulus is 50.8 GPa; density is 2450 kg/m3; Poisson’s ratio is 0.191. Other specific parameter settings of the model are shown in Table 4 [21].

2.3. Modeling Techniques

The FEA model was primarily composed of the HSCFST model, drop hammer and support, as shown in Figure 4. The impact location was directly above the mid span of the HSCFST model. The drop hammer and support adopted discrete rigid body elements and set reference points to facilitate the application of boundary conditions and impact action. The reference points of the supports were set with fixed constraints. The drop hammer only allowed translational degrees of freedom in the direction of impact (vertically downward).
Hard contact was used in the normal direction of the contact surface in this numerical simulation. The tangential direction of the contact surface between the steel tube, drop hammer and support was set to frictionless. The Coulomb friction model was used to represent the relative sliding between the steel tube and the concrete and its corresponding friction coefficient was taken as 0.6 [22]. The steel tube and the core concrete were simulated by a C3D8R solid element in the ABAQUS library. Drop hammers and supports were simulated by an R3D4 discrete rigid body element from the ABAQUS library. The mesh size of the HSCFST model is 20 mm, which is 1/9 side length. In addition, the mesh size within 300 mm of the impact position of the drop hammer was encrypted to improve the calculation accuracy of the finite element model.
Although the ABAQUS/Standard solver that requires a low computational resource is normally adopted in structural analysis, great efforts are required for the convergence of a static solver when complex contact phenomena exist in the model, not to mention model the impact loading. The ABAQUS/Explicit solver could overcome the difficulties of convergence problems associated with impact simulation and sophisticated contact. In this study, about 30–45 min was needed to run an impact simulation of the model by using the ABAQUS/Explicit solver.

2.4. Validation of Finite Element Model

In order to verify the correctness of the FEA model established in this paper, the above numerical simulation method was used to compare the specimen numbered HS3-100-1200-6 in reference [7]. The specimen has the same material strength, specimen size and boundary conditions as the finite element model established in this paper, except that the height of drop hammer impact is 3 m. The chemical composition of the high-strength steel is listed in Table 5. The mix proportion of C100 concrete is listed in Table 6.
Figure 5 shows the time history curve comparison of impact force F and displacement U of specimen HS3-100-1200-6. It can be seen that the finite element simulation results of the peak impact force, the maximum mid-span deformation and the platform value are in good agreement with the test data, which proves the reliability of the finite element model.

3. Numerical Simulation Results

3.1. Failure Pattern of Crack-Free Model

The HSCFST model principally shows a symmetric overall bending failure on both sides under lateral load. As shown in Figure 6 and Figure 7, the plastic hinge is concentrated in the mid-span drop hammer impact zone. The surface of the model is slightly depressed at the contact position with the drop hammer. Meanwhile, the local “drum” buckling phenomenon occurred on both sides of the mid span and near the impact position due to the extrusion of the drop hammer.

3.2. Failure Pattern of the Model under Local Corrosion

Local notch cracks generally increase the amplitude of overall bending and local “drum” buckling of the model. In addition, the change of crack angle and impact surface affects the failure pattern of the model. In order to better reflect the influence of each parameter on the HSCFST model, this paper adopts the failure pattern of the model with an impact height of 12 m for comparison.

3.2.1. Models with Horizontal Cracks (θ = 0°)

Compared with the crack-free model, the front impact will reduce the amplitude of buckling near the impact point of the drop hammer and increase the amplitude of buckling on both sides of the model. The rear impact will reduce the amplitude of the buckling near the impact point of the drop hammer, while both sides of the model have a slight buckling near the top surface. The side impact model has a small amplitude of buckling near the impact point of the drop hammer and in the crack area. In addition, the crack width near the impact surface will decrease while the crack width far from the impact surface will increase when the model is side impacted. As the impact energy or the crack length increases, the horizontal crack will gradually shrink or crack close under front impact, as shown in Figure 8; crack width no longer decreases or crack closure generally occurs at the end of the impact platform segment. With the increase of impact energy, the time of crack closure is relatively earlier than the time of impact platform section end. Nevertheless, the model with crack width no longer decreasing or crack closure occurring earlier has lower impact platform values. Back impact will increase the width of cracks, while the increase of crack length and impact energy will lead to excessive local stress at both ends of cracks and yield failure phenomenon, as shown in Figure 9. In side impact, the increase of crack length and impact energy will lead to the yield failure of the steel tube at the bottom of the crack. In addition, the increase in crack length reduces the local buckling amplitude of the side impact model and the cracks eventually take on similar “triangular” shapes, as shown in Figure 10.

3.2.2. Models with Vertical or Oblique Cracks (θ = 45°, 90°)

The model with oblique and vertical cracks presents an obvious bending failure pattern. Compared with the crack-free model, the front impact will increase the local “drum” buckling amplitude of the model. For the model with oblique cracks, increasing the crack length will increase the amplitude and area of buckling on both sides of the mid span, while the amplitude of buckling near the impact point will decrease. The phenomenon of the vertical cracks model is the opposite to that of the oblique cracks model. In addition, the oblique crack width gradually decreases but does not close during impact, while the vertical crack width basically remains unchanged, as shown in Figure 11.
When the model is subjected to rear impact, the model with oblique crack almost does not appear to buckle near the impact point, while the buckling amplitude of the model with vertical crack is not much different from that of the crack-free model. In addition, increasing the crack length will increase the width of oblique cracks and the local buckling area of the vertical crack model, as shown in Figure 12.
When the model is subjected to side impact, the buckling amplitude of the model with oblique cracks is lower than that of the crack-free model, while the buckling amplitude of the model with vertical cracks is increased. Increasing the crack length will enlarge the buckling area of the model on both sides of the mid span, especially the crack area near the impact surface, as shown in Figure 13.

3.3. Impact Force versus Time Curves

3.3.1. Comparison between Crack-Free Model and Local Corrosion Model

Figure 14 shows that raising the impact height has almost no effect on the impact platform value of the crack-free model, but it will significantly increase the peak segment of the impact time history curve and prolong the impact duration of the model. When the impact height is increased to 8 m and 12 m, the peak segment of the impact time history curve increases by 56% and 90%, respectively, while the impact duration increases by 16% and 39%, respectively.
Figure 15 takes the same impact energy (m = 424 kg, H = 4 m) as an example to analyze the influence of impact surface (F, R and S), crack angle (H, O and V) and crack length (0.5D, 0.75D and 1D) on the impact time history curve. Figure 15a shows that the three impact surfaces affect the impact duration to different degrees. The increase in impact duration for the models subjected to front, rear and side impacts are 12%, 16.4% and 6%, respectively. Figure 15b shows that the change of crack angle has a stable influence on impact duration. The influence of the crack angle on the impact duration of the model is about 11%. Figure 15c shows that the increase in crack length prolongs the impact duration of the model by about 12~30%. Meanwhile, the changes in impact surface, crack angle and crack length will reduce the impact platform value of the model to varying degrees. Among the three impact surfaces, front impact reduces the impact platform value by about 11%; rear impact reduces the impact platform value by about 26%; side impact reduces the impact platform value by less than 5%. Crack angles (H, O and V) reduce the impact platform values by 11%, 5% and 7%, respectively. In addition, when the crack length increases from 0.5D to 1D, the impact platform value reduction of the model is increased from 11% to 30%.

3.3.2. Comparison of Horizontal Crack Models

  • Comparison of peak segment of impact time history curve
As shown in Figure 16, the peak segment of the impact time history curve of the model with horizontal cracks is mainly influenced by the impact height. When the impact height is increased to 8 m and 12 m, the peak segment of the model impact time history curve will increase by 31% and 56%, respectively. Compared with the peak segment of the impact time history curve of the crack-free model, the peak segment of the impact time history curve of the horizontal crack model is basically unchanged when the impact height is 4 m. When the impact height is increased to 8–12 m, the peak segment of the impact time history curve will be reduced by about 21%.
2.
Comparison of impact duration
Figure 16a,c shows that crack length, impact surface and impact energy all affect the impact duration of the horizontal crack model. Overall, the impact surface has the greatest effect on the impact duration, while the crack length has the least effect on the impact duration. With the increase in impact energy, the impact duration of the front impact model is more stable in variation and its overall performance is better than that of the rear and side impact models.
3.
Comparison of impact platform values
Figure 16d shows that the impact platform values show a downward trend with the change of impact surface (F, S and R). Increasing impact energy has a greater influence on the impact platform values of the side and rear impact models, while it has little influence on the impact platform values of the front impact model. Meanwhile, increasing the crack length will reduce the impact platform value of the model. Compared with the crack-free model, the impact platform value of the model with front impact decreases by about 17%. Under impact heights of 4 m, 8 m and 12 m, the impact platform values of the rear impact model decrease by 35%, 55% and 60% respectively, while the impact platform values of the side impact model decrease by 8%, 26% and 38% respectively. Figure 16a–d show that the impact platform value and impact duration of the model with horizontal cracks are relatively stable under the front impact load and it exhibits better impact resistance performance.

3.3.3. Comparison of Oblique Crack Models

  • Comparison of peak segment of impact time history curve
As shown in Figure 17a–c, the peak segment of the impact time history curve is mainly influenced by impact height. When the impact height is raised to 8 m and 12 m, the peak segments of the impact time history curves of the model increase by about 23% and 44%, respectively. Compared with the crack-free model, the peak segment of the impact time history curve of the model with oblique cracks is basically unaffected when the impact height is 4 m. However, when the impact height is increased to 8–12 m, the peak segment of the impact time history curve of the model decreases by about 24%.
2.
Comparison of impact duration
Figure 17a–c show that the impact duration of the oblique crack model is less affected by crack length than that of the horizontal crack model. Among the three impact surfaces, the rear impact significantly increases the impact duration of the model, while the front impact has the least effect on the model impact duration. In addition, the impact duration of the model is gradually prolonged with the increase of impact energy.
3.
Comparison of impact platform values
Figure 17d shows that the impact platform values overall show a decreasing trend with the change of impact surface (F, S and R). Increasing impact energy will reduce the impact platform values of side and rear impact models, while the impact platform values of front impact models will increase. Meanwhile, increasing crack length will reduce the impact platform value of side and rear impact models, but it has basically no effect on the front impact model. Under impact heights of 4 m, 8 m and 12 m, the impact platform values of the front impact model decrease by about 10%, while the impact platform values of the rear impact model decrease by 24%, 42% and 49%, respectively. The impact platform values of the side impact model decrease by 6%, 16% and 22% at impact heights of 4 m, 8 m and 12 m, respectively. Compared with the horizontal cracked model, the crack length and impact energy have less effect on the oblique cracked model. In addition, the front impact model still shows good impact resistance in the three impact surfaces.

3.3.4. Comparison of Vertical Cracking Models

  • Comparison of peak segment of impact time history curve
As shown in Figure 18a–c, the peak segment of the impact time history curve is mainly affected by impact height. When the impact height is increased to 8 m and 12 m, the peak segment of the impact time history curve of the vertical cracks model increases by 24% and 45%, respectively. Compared with the crack-free model, the peak segment of the impact time history curve of the vertical crack model is basically unaffected when the impact height is 4 m. When the impact height is increased to 8–12 m, the peak segment of the impact time history curve of the model decreases by about 25%.
2.
Comparison of impact duration
Figure 18a–c show that the crack length only has a great influence on the impact duration of the rear impact model. Overall, the impact duration of the vertical crack model is mainly affected by the impact energy followed by the crack length. The impact surface has little influence on the impact duration of the vertical crack model.
3.
Comparison of impact platform values
Figure 18d shows that both the reduction of the impact energy and the increase of crack length will improve the impact platform value of the rear impact model. In general, the impact platform value of the vertical crack model is relatively stable as a whole, and its impact platform value varies in the range of 4% to 16%. The results show that the overall impact resistance of the vertical crack model is better than that of the model with horizontal and oblique cracks.

3.4. Mid-Span Displacement versus Time Curves

The model starts to rebound after reaching the mid-span peak displacement, and its mid-span displacement reverses until the energy is completely absorbed. In this case, the mid-span final deflection of the model is the mid-span final displacement. The mid-span final displacement of the model is generally lower than its peak displacement. Figure 19 shows the influence of each parameter on mid-span peak displacement. Overall, the mid-span peak displacement of the model gradually increases with the increase of impact energy and crack length. Among the three impact surfaces, the mid-span peak displacement of the rear impact model is the largest, while the mid-span peak displacement of the front impact model is the smallest. Increasing the crack angle can effectively reduce the effect of impact surface and crack length on the mid-span peak displacement of the model. In addition, the crack length has the greatest effect on the rear impact model and the least effect on the front impact model.
Figure 20 shows that when the impact height of the crack-free model is increased to 8 m and 12 m, its mid-span peak displacement increases by 68% and 160%, respectively. The existence of cracks will deepen the influence of impact height on the mid-span peak displacement of the model. Meanwhile, increasing the impact height will reduce the rebound amplitude of the model with local corrosion, especially the model with horizontal cracks that has the most obvious reduction. Combining Figure 19 and Figure 20, it can be seen that the model with vertical cracks has a smaller change in the mid-span peak displacement under the front impact and a larger rebound after reaching the mid-span peak displacement, which shows better impact resistance stability.

3.5. Comparison of Impact Platform Value and Mid-Span Peak Displacement

Figure 21 shows the influence of each parameter on the impact platform value and mid-span peak displacement of the model. As shown in the figure, the impact platform value is negatively correlated with the overall change trend of mid-span peak displacement. Increasing the crack length will decrease the impact platform value and increase the mid-span peak displacement. Among the three impact surfaces, the rear impact has the greatest influence on the impact platform value and mid-span peak displacement of the model, while the front impact has the least influence on the impact platform value and mid-span peak displacement of the model. The influence of crack length and impact surface on the model decreases with the increase of crack angle. Overall, the impact surface has the greatest influence on the impact platform value and mid-span peak displacement of the model, while increasing the crack angle can effectively reduce the influence of the impact surface.

3.6. Energy Absorption Ratio of the Model

The energy loss caused by friction during impact is ignored in this paper. The total gravitational potential energy of the free-falling motion of the drop hammer is used as the impact energy of the whole system, i.e., Ei = mgH. The total impact energy of the drop hammer in the first impact process will be divided into three parts, namely the energy absorbed by the local denting and buckling, the energy absorbed by the overall bending deformation and the remaining kinetic energy of the drop hammer. Local corrosion will increase the overall bending and local buckling deformation of the model to a certain extent. Since the amplitude of the local deformation of the model is smaller than that of the whole bending deformation, most of the energy may be absorbed mainly by the whole bending deformation of the model [23].
The impact force mid-span displacement curve is obtained by combining the impact force and mid-span displacement time history curves of the model, thus quantifying the energy absorbed by the whole bending deformation of the model. A typical impact force mid-span displacement curve is shown in Figure 22. The energy value Eg absorbed by the whole bending deformation of each model can be obtained by mathematically integral calculation of the area enveloped by the impact force mid-span displacement curve of each model. Thus, the energy absorption ratio (EAR) of the whole deformation can be obtained, i.e., EAR = Eg/Ei. As shown in Figure 23a, the EAR of the crack-free model increased by 7.2% and 11% as impact height increased to 8 m and 12 m, respectively. Figure 23b–d show the influence of impact surface, crack length and crack angle on the EAR of the model. Overall, the EAR of the model is generally inversely proportional to the increase in crack angle and directly proportional to the increase in crack length. The front impact will reduce the EAR of the model, while the side and rear impacts will generally increase the EAR of the model. The energy absorption ratio of the rear impact model is the highest among the three impact surfaces. This indicates that the model is more favorable to absorbing impact energy when subjected to rear impact under local corrosion.

3.7. The Evaluation of Dynamic Flexural Strength

For the convenience of the analysis, the concept of increasing coefficient Rd of dynamic flexural strength of the model is defined as shown in Equation (25). According to the literature [1], the static ultimate bending moment Msu of CFST under bending failure is shown in Equation (26).
R d = M d M su
M su = γ m W scm f scy
in which
M d = E p L 4 U
γ m = 1.04 + 0.48 ln ( ξ + 0.1 )
ξ = A s f y A c f ck
W scm = B 3 / 6
f scy = ( 1.18 + 0.85 ξ ) f c
where Md is the simplified rigid-plasticity theory formula, which is the dynamic plastic moment of CFST under impact loading [8]; L is the effective length of the model; Ep and U are the plastic strain energy and mid-span final deflection obtained by FEA; Msu is the flexural strength value of the model under static loading; γ m is the calculation coefficient of flexural strength; ξ is the degree of the confinement on the concrete fill provided by the steel tube; As and Ac are the cross-sectional areas of the steel tube and core concrete; fy is the yield strength of steel; fck is the standard value of concrete compressive strength; Wscm is the modulus of flexural resistance of the model section; B is the cross-section side length of the model; fscy is the index of axial compression strength bearing capacity of the model.
Figure 24a shows that the Rd of the crack-free model decreases with the increase of impact energy. It shows that the increase of flexural strength of the model decreases gradually. This is because when the impact height increases to 8 m and 12 m, the plastic strain energy Ep of the model increases only by 6% and 29.3%, while the mid-span final deflection increases by 99.1% and 264.8%, respectively. It can be seen that the mid-span final deflection values of the model basically increase exponentially. The relative value of the strength increase of the model is decreased due to the small difference of the strength increase caused by the strain rate effect of the material. Figure 24b–d show the influence of crack length and crack angle on Rd under different impact surfaces. Overall, the Rd value of the model can be reduced by decreasing the crack angle and increasing the crack length. With the increase of impact height, the overall variation amplitude of the rear impact model is more obvious than that of the front and side impact models. The Rd value of the side impact model is basically higher than that of the front and rear impact models when the impact height is 4 m. In addition, the maximum reduction in Rd value for the front impact model is 8% when the impact height is 12 m, while the maximum reduction in Rd value for the rear and side impact models is 62.2% and 38.5%, respectively. The results show that the decrease in crack length and the increase in crack angle are proportional to the increase of Rd. Under the same crack angle and crack length, the Rd reduction amplitude of the rear impact model is more obvious than that of the front impact and side impact models. The impact resistance of side impact models is better than that of front and rear impact models when impact energy is small. When the impact energy is large, the impact resistance of the front impact model is better than that of rear and side impact models.

4. Practical Design Method for Dynamic Flexural Strength

Both the local corrosion type and the impact direction will affect the impact resistance of CFST. An important index to predict the impact resistance of CFST is the dynamic flexural strength improvement coefficient Rd under impact loading. In this paper, based on the parametric analysis results, the key factors affecting the improvement coefficient of dynamic flexural strength are selected, including crack length (lc), crack angle (θ), impact surface (F, R and S) and impact energy (Ei). The practical design method (32–33) for the improvement coefficient Rd of the dynamic flexural strength of the concrete-filled square steel tube model section is obtained by regression analysis.
R d = 3.76682 f ( n ) f ( E i ) f ( β ) θ = [ 0 o , 90 o )
in which
f ( n ) = 0.84476 + 2.26886 n 0.97719 n 2
f ( E i ) = 3.97012 0.12813 E i + 1.28 × 10 3 E i 2
f ( β ) = 1.72369 + 0.69479 β 1.19763 β 2
R d = 2.05226 f ( l c ) f ( E i ) f ( β ) θ = 90 o
in which
f ( l c ) = 3.8859 + 0.03977 l c 1.58754 × 10 4 l c 2
f ( E i ) = 1.14824 0.03763 E i + 3.8461 × 10 4 E i 2
f ( β ) = 0.73013 + 0.06594 β 0.04551 β 2
where n is the ratio of the cross-sectional area of the steel tube before and after local corrosion. The area after corrosion is the horizontal projection area and calculated according to n = ( A t l c cos θ ) / A ; A is the cross-sectional area of the steel tube; t is the wall thickness of the steel tube; β is the impact orientation factor, which is the angle formed by the impact direction of the drop hammer and the normal direction of the corrosion surface. The angle range 0–180° is normalized by taking β = 0 for front impact, β = 0.5 for side impact and β = 1 for rear impact. The specific application range of each parameter in the formula is shown in Table 7.
Figure 25a,b shows the comparison results of the improvement coefficient Rd of dynamic flexural strength by finite element simulation and proposed design method. The relative error between them is less than 10% basically, which shows that the calculation results of the proposed design method are in good agreement with the finite element simulation results. The proposed design method could be used to predict the dynamic plastic moment of CFST with local defects under impact loading.

5. Conclusions

In this paper, the impact resistance of locally corroded HSCFST members simulated by local notch cracks is numerically simulated. The influence of crack length, crack angle, impact surface and impact energy on the impact resistance of members is considered. The prediction method of impact resistance of HSCFST under the local corrosion is proposed. Some conclusions could be drawn as follows:
(1) The change in crack angle and crack length under the local corrosion will affect the amplitude and range of the local drum curvature. A model with horizontal cracks will show the phenomenon of crack closure when subjected to the front impact. The side impact will cause the horizontal crack to take on a “triangular” shape and will also cause the tensile failure of the steel tube at the bottom of the crack.
(2) The front impact and vertical cracks have little influence on the impact platform values of the model under local corrosion. Increasing the crack length and impact energy will reduce the impact platform value of the model. Among the three impact surfaces, the rear impact has the greatest influence on the impact platform value and impact duration of the model.
(3) The energy absorption ratio of the model under local corrosion is inversely proportional to the increase of crack angle and proportional to the increase of crack length in general. The side and rear impacts will promote the absorption of impact energy by the model and the energy absorption ratio of both is basically above 90%.
(4) The Rd of the model is generally proportional to the increase in crack angle and inversely proportional to the increase in crack length. The impact resistance of the side impact model is better than that of the front and rear impact models when the impact energy is small. The impact resistance of the front impact model is better than that of the side and rear impact models when the impact energy is larger.
(5) Based on the parametric analysis results, a practical design method for the improvement coefficient of dynamic flexural strength Rd of the HSCFST model under local corrosion under lateral impact is proposed and validated against the simulation results. The proposed design method could be used to predict the dynamic plastic moment of HSCFST with local defects under impact loading.

Author Contributions

Investigation and writing—original draft preparation, Y.W.; conceptualization and writing—review and editing, S.G.; formal analysis, Y.X.; validation F.L. All authors have read and agreed to the published version of the manuscript.

Funding

This research was funded by National Natural Science Foundation of China (No. 51908085), Natural Science Foundation of Chongqing (cstc2020jcyj-msxmX0010), Fundamental Research Funds for the Central Universities (AUGA5710010322, 2020CDJ-LHZZ-013) and The Youth Innovation Team of Shaanxi Universities (21JP138), which are gratefully acknowledged.

Conflicts of Interest

The authors declare no conflict of interest.

References

  1. Han, L.H. Concrete-Filled Steel Tubular Structures: Theory & Application; Science Press: Beijing, China, 2016. [Google Scholar]
  2. Zhong, S.T. The Concrete-Filled Steel Tubular Structures; Tsinghua University Press: Beijing, China, 2003. [Google Scholar]
  3. Bambach, M.R.; Jama, H.; Zhao, X.L.; Grzebieta, R.H. Hollow and concrete-filled steel hollow sections under transverse impact loads. Eng. Struct. 2008, 30, 2859–2870. [Google Scholar] [CrossRef]
  4. Bambach, M.R. Design of hollow and concrete-filled steel and stainless steel tubular columns for transverse impact loads. Steel Constr. 2011, 49, 1251–1260. [Google Scholar] [CrossRef]
  5. Hou, C.C. Study on Performance of Circular Concrete-Filled Steel Tubular (CFST) Members under Low Velocity Transverse Impact. Master’s Thesis, Tsinghua University, Beijing, China, May 2012. [Google Scholar]
  6. Qu, H.; Li, G.; Sun, J.; Sozen, M.A. Numerical simulation analysis of circular concrete-filled steel tube specimen under lateral impact. J. Archit. Civ. Eng. 2010, 27, 89–96. [Google Scholar]
  7. Yang, X.Q. Dynamic Constitutive Models of Structural Steels and Transverse Impact Resistance of High-Strength Concrete Filled Steel Tubes with Square Cross-Section. Ph.D. Thesis, Harbin Institute of Technology, Harbin, China, June 2020. [Google Scholar]
  8. Cai, J.; Yu, Y.; Chen, Q.J.; Li, Y.N.; Ye, J.B. Parameter study on dynamic response of concrete filled square tube under lateral impact. J. Cent. South Univ. 2019, 50, 409–419. [Google Scholar]
  9. Suzuki, Y.; Lignos, D.G. Collapse behavior of steel columns as part of steel frame buildings: Experiments and numerical models. In Proceedings of the 16th World Conference on Earthquake Engineering, Santiago, Chile, 9–13 January 2017. [Google Scholar]
  10. Sediek, O.A.; Wu, T.-Y.; McCormick, J.; El-Tawil, S. Collapse Behavior of Hollow Structural Section Columns under Combined Axial and Lateral Loading. J. Struct. Eng. 2020, 146, 04020094. [Google Scholar] [CrossRef]
  11. Gao, S.; Zhang, K.Y.; Li, J.Q.; Xu, Y.C.; Wang, Y.G. Experimental study on axial performance of circular CFST under freeze-thaw and corrosion complex environment. J. Nat. Disasters 2021, 30, 93–100. [Google Scholar]
  12. Gao, S.; Peng, Z.; Guo, L.H. Experimental study on axial performance of concrete-filled steel tubular stub column under salt spray corrosion. J. Build. Struct. 2019, 40, 214–219. [Google Scholar]
  13. Han, L.H.; Hou, C.C.; Wang, Q.L. Behavior of circular CFST stub columns under sustained load and chloride corrosion. J. Constr. Steel Res. 2014, 103, 23–36. [Google Scholar] [CrossRef]
  14. Ding, F.X.; Fu, L.; Yu, Z.W. Behaviors of axially loaded square concrete-filled steel tube (CFST) Stub columns with notch in steel tube. Thin-Walled Struct. 2017, 115, 196–204. [Google Scholar] [CrossRef]
  15. Chen, M.C.; Zhang, F.; Huang, H.; Wang, C. Study on seismic performance of concrete filled square steel tubes subjected to simulated acid rain attack. J. China Railw. Soc. 2018, 40, 106–114. [Google Scholar]
  16. Cowper, G.R.; Symonds, P.S. Strain-Hardening and Strain-Rate Effects in the Impact Loading of Cantilever Beams; Brown University: Providence, RI, USA, 1957. [Google Scholar]
  17. Johnson, G.R.; Cook, W.H. A constitutive model and data for metals subjected to large strains, high strain rates and high temperatures. In Proceedings of the 7th International Symposium on Ballistics, The Hague, The Netherlands, 19–21April 1983; Volume 21, pp. 541–547. [Google Scholar]
  18. Zhu, M.; Liu, J.; Wang, Q.; Feng, X. Experimental research on square steel tubular columns filled with steel-reinforced self-consolidating high-strength concrete under axial load. Eng. Struct. 2010, 32, 2278–2286. [Google Scholar] [CrossRef]
  19. China Building Industry Press. Code for Design of Concrete Structures; GB 50010-2010; China Building Industry Press: Beijing, China, 2010. (In Chinese) [Google Scholar]
  20. Comite Euro-International du Beton. CEB-FIP Model Code 1990; Redwood Books: Trowbridge, UK, 1993. [Google Scholar]
  21. Tao, Z.; Wang, Z.B.; Yu, Q. Finite element modelling of concrete-filled steel stub columns under axial compression. J. Constr. Steel Res. 2013, 133, 121–131. [Google Scholar] [CrossRef]
  22. Han, L.H.; Yao, G.H.; Tao, Z. Performance of concrete-filled thin-walled steel tubes under pure torsion. Thin-Walled Struct. 2007, 45, 24–36. [Google Scholar] [CrossRef]
  23. Wu, C.; Liu, J.L.; Wang, R.H. A study on the dynamic response of welded hollow spherical joints under impact loading. Prog. Steel Build. Struct. 2021, 23, 82–93. [Google Scholar]
Figure 1. Details of the model. (a) Model size. (b) Crack angle.
Buildings 12 00996 g001
Figure 2. Crack type. (a) Type A: 1D. (b) Type B: 0.75D. (c) Type C: 0.5D.
Buildings 12 00996 g002
Figure 3. Impact surface (relative to the surface where the cracks are located). (a) Type A: front (F). (b) Type B: rear (R). (c) Type C: side (S).
Buildings 12 00996 g003
Figure 4. Overall view of FEA model.
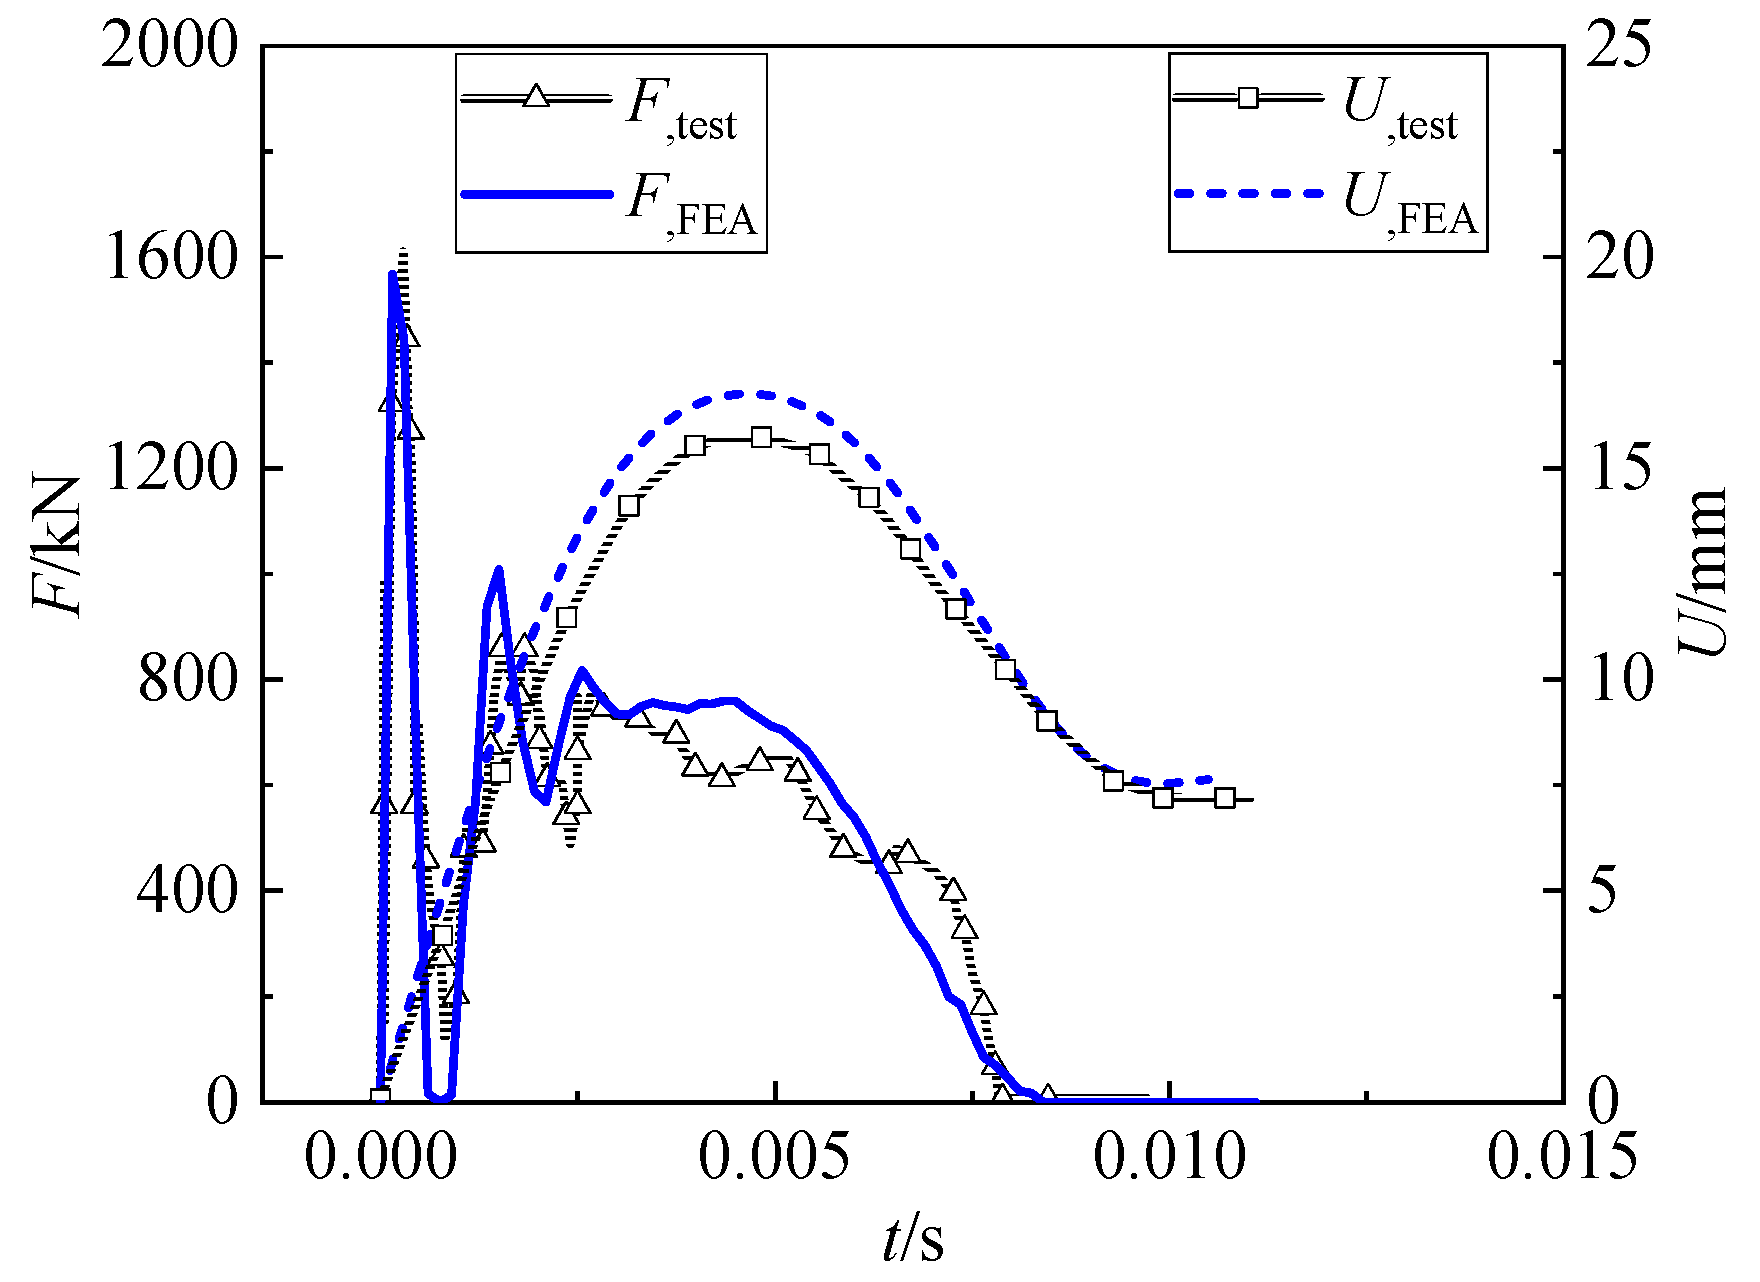
Buildings 12 00996 g004
Figure 5. Time history curves of impact force and mid-span displacement of specimen HS3-100-1200-6.
Buildings 12 00996 g005
Figure 6. Typical overall bending failure.
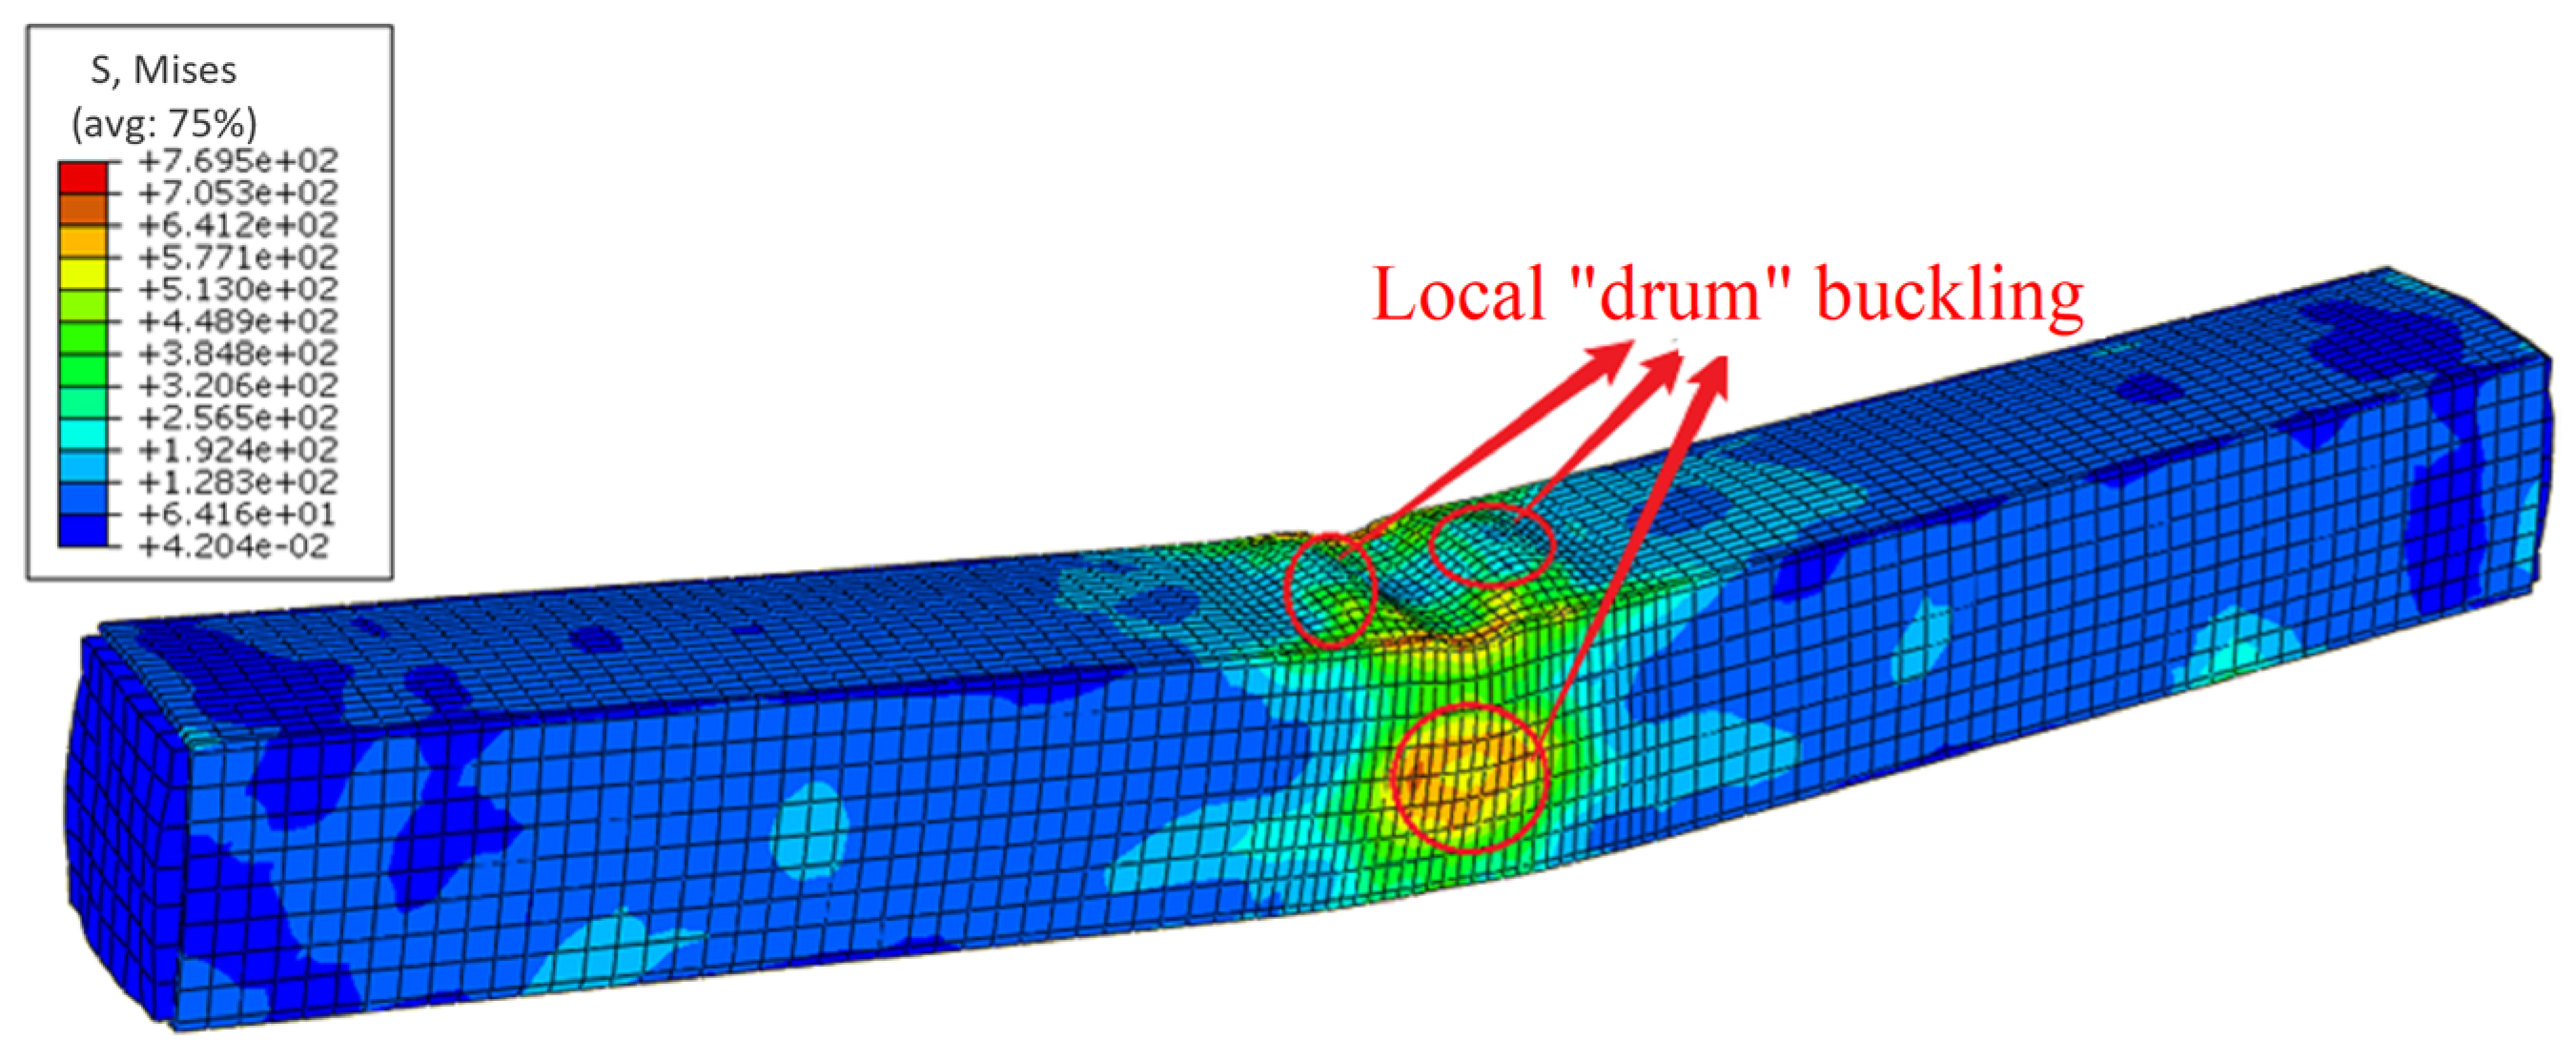
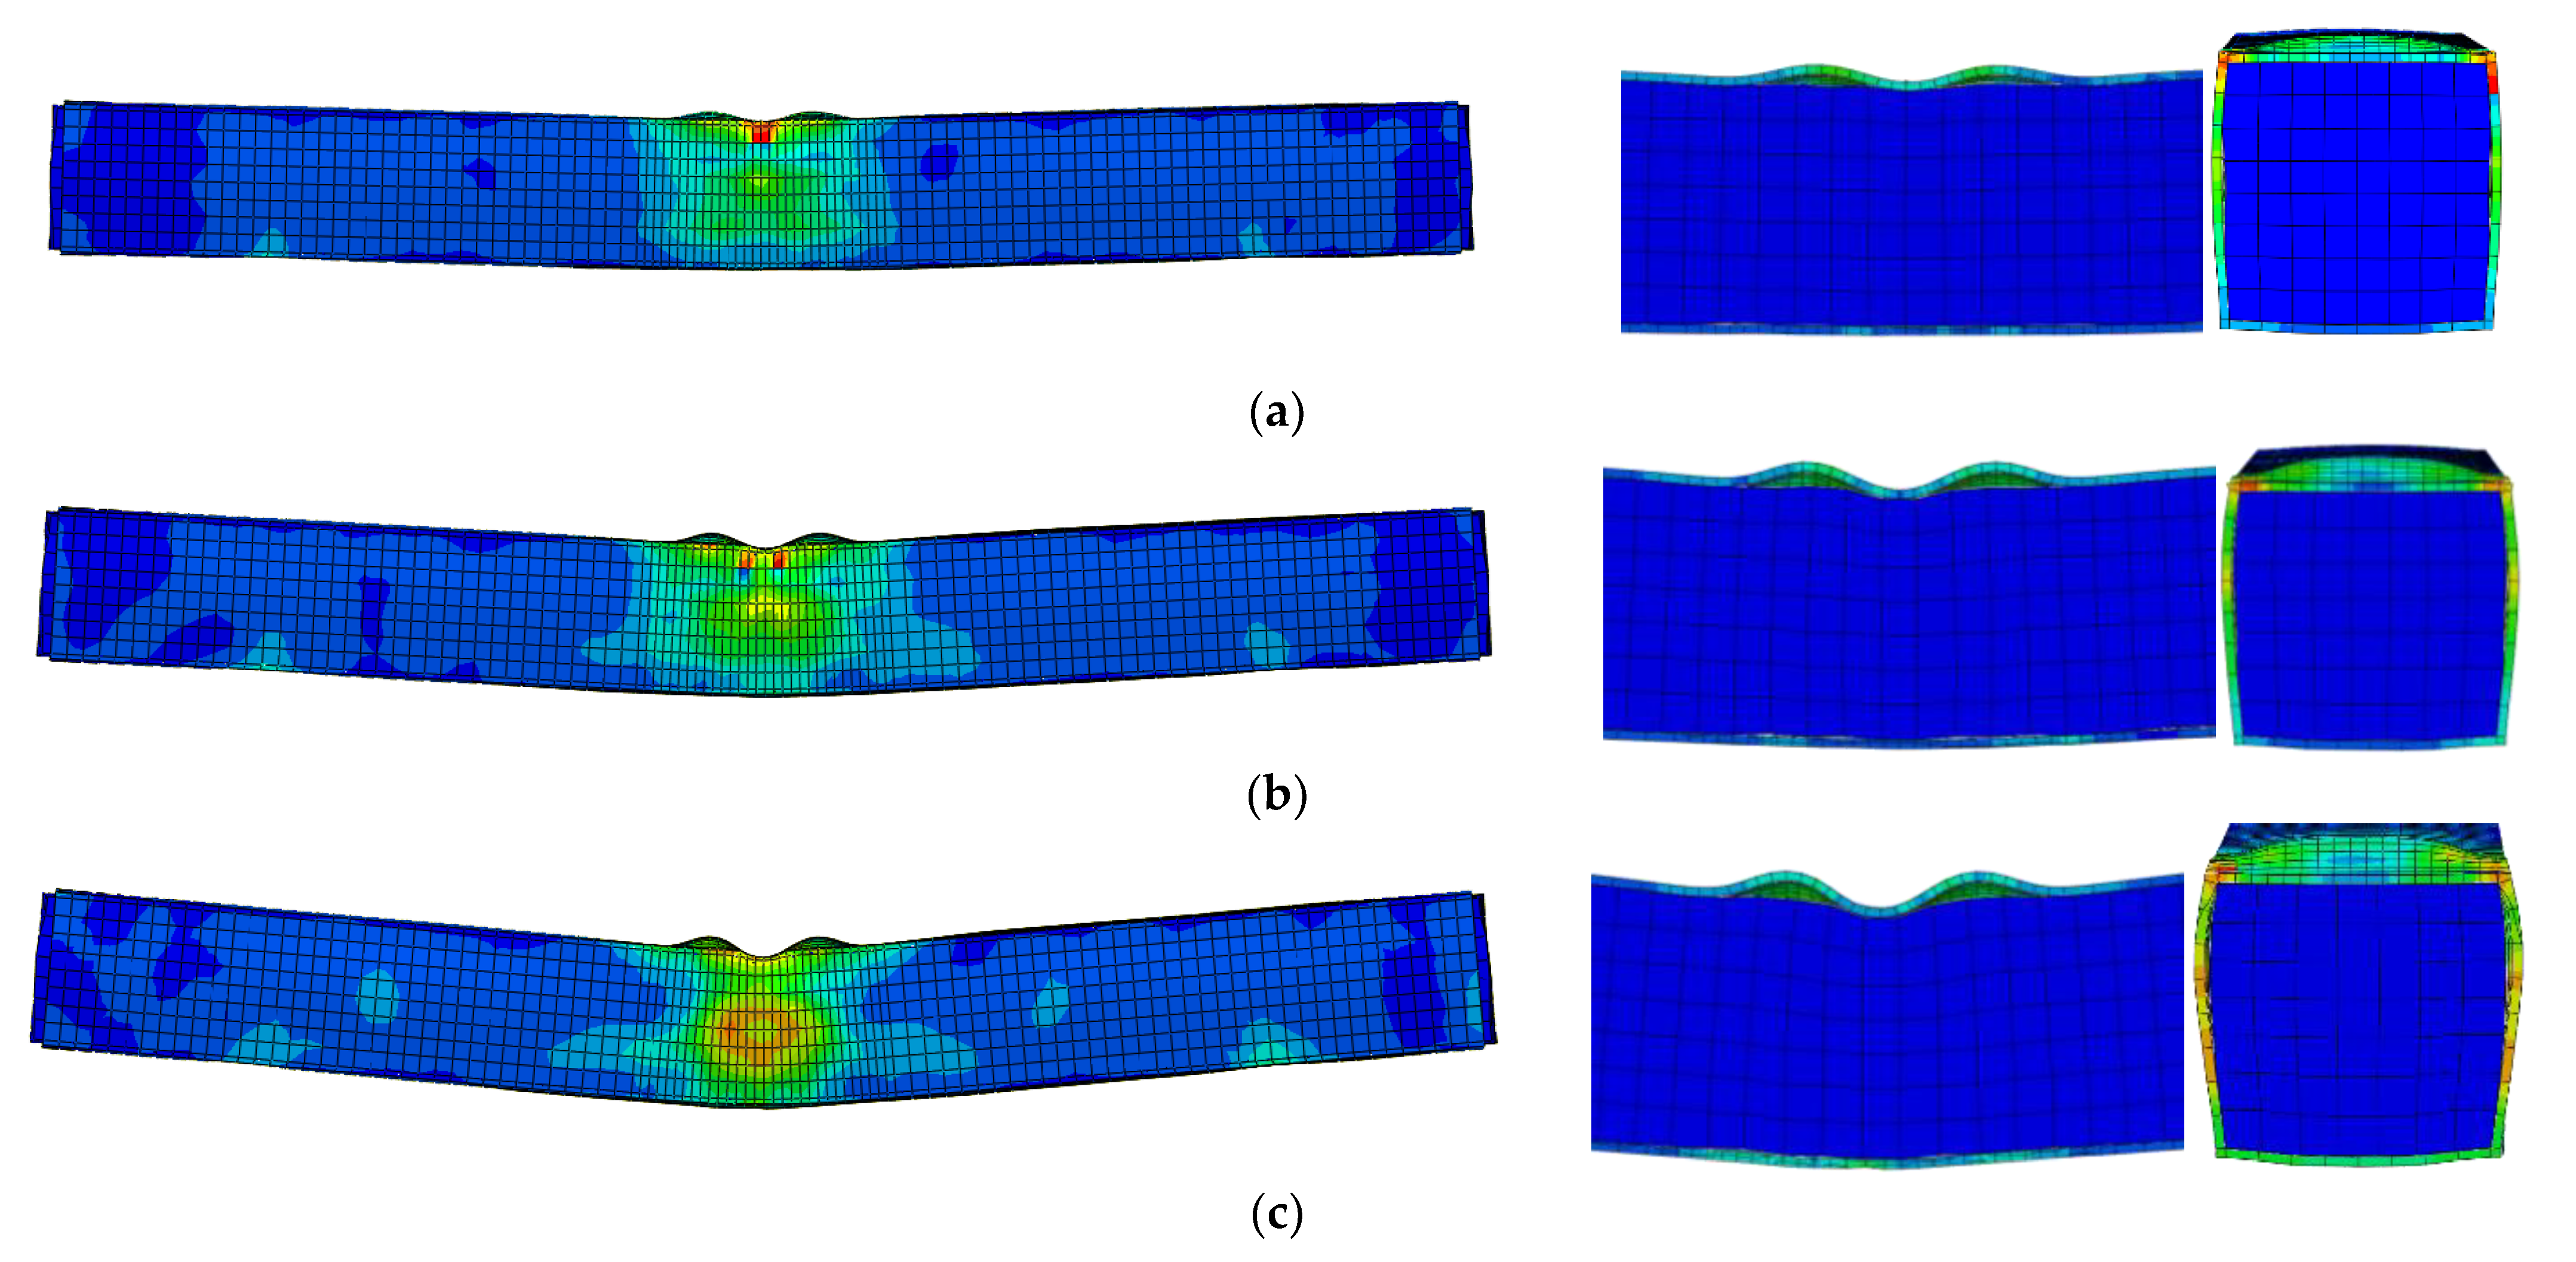
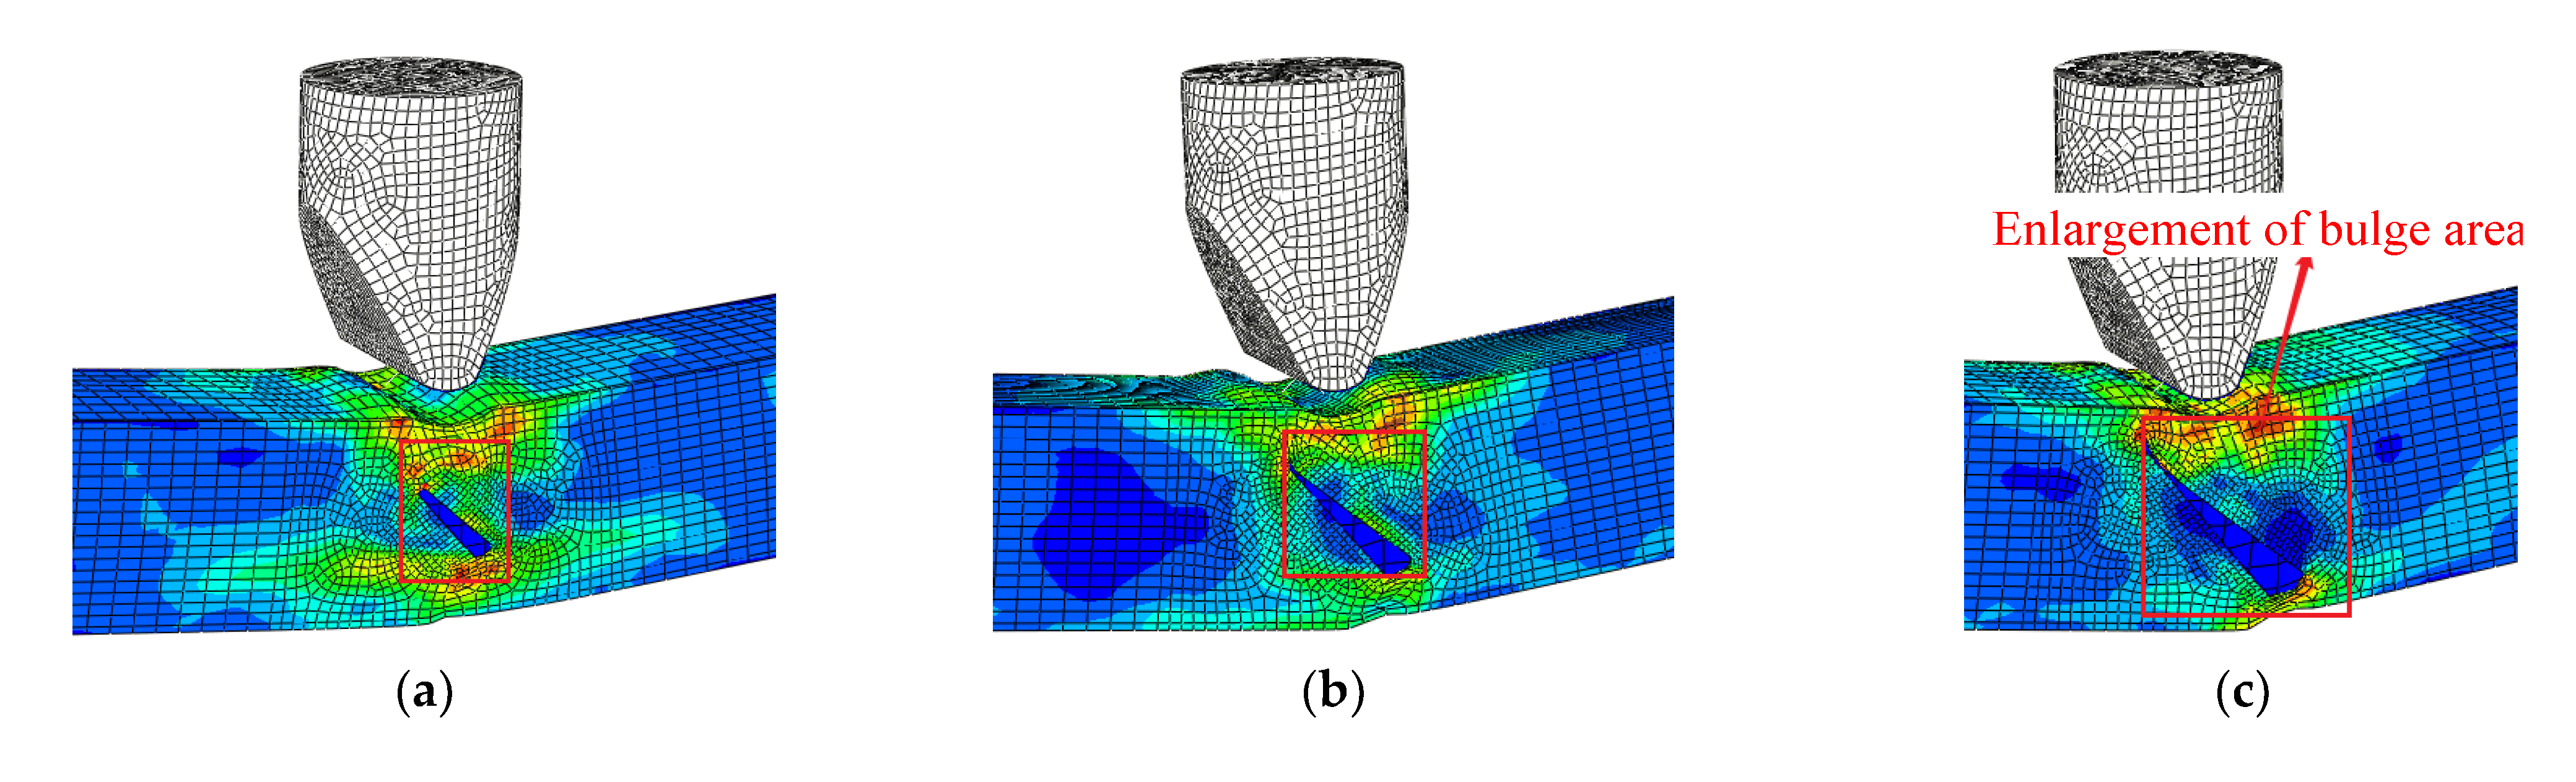
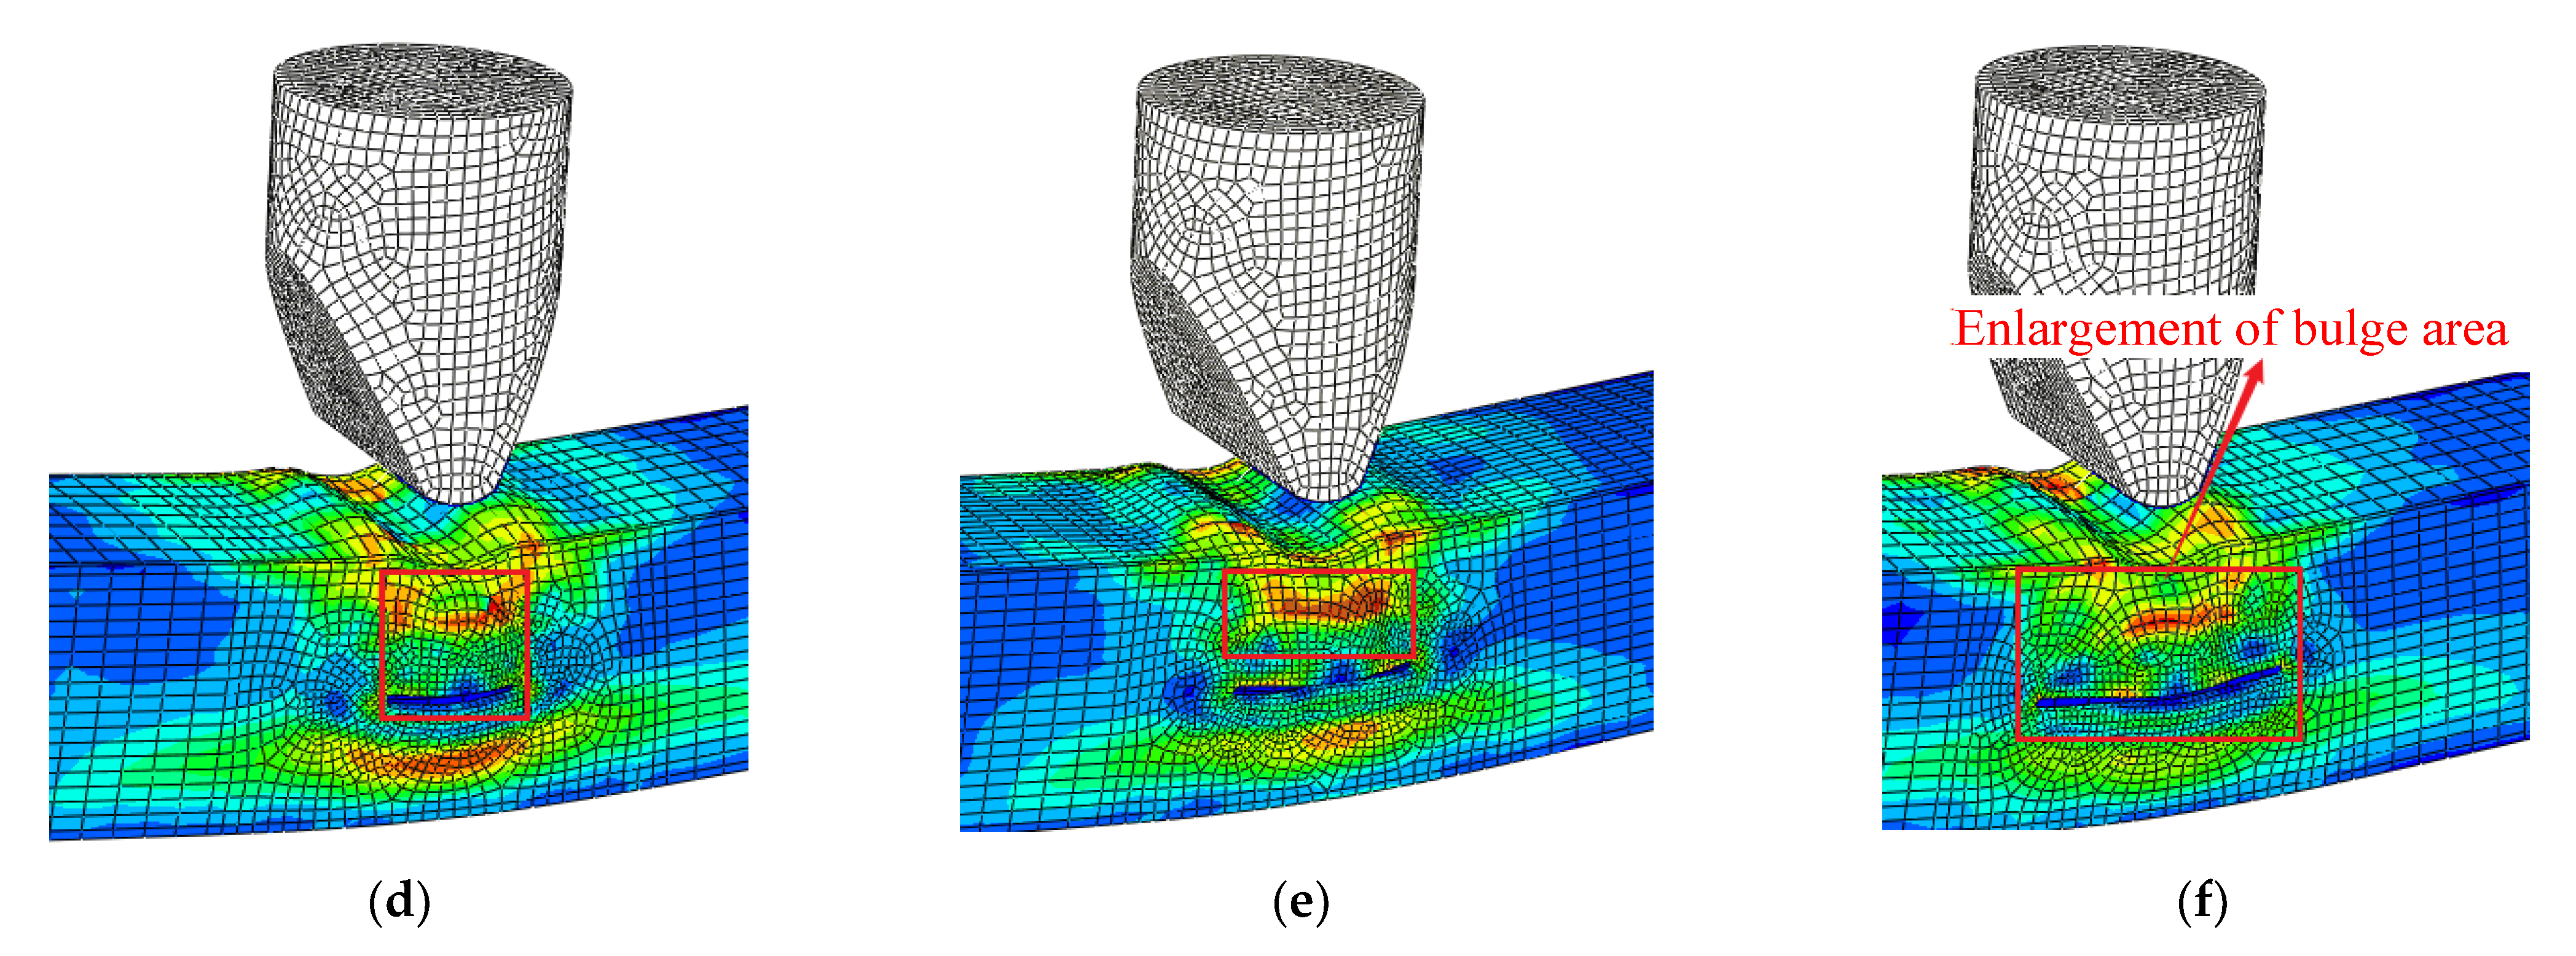
Buildings 12 00996 g006
Figure 7. Local “drum” buckling diagram of crack-free model. (a) Model 424-4. (b) Model 424-8. (c) Model 424-12.
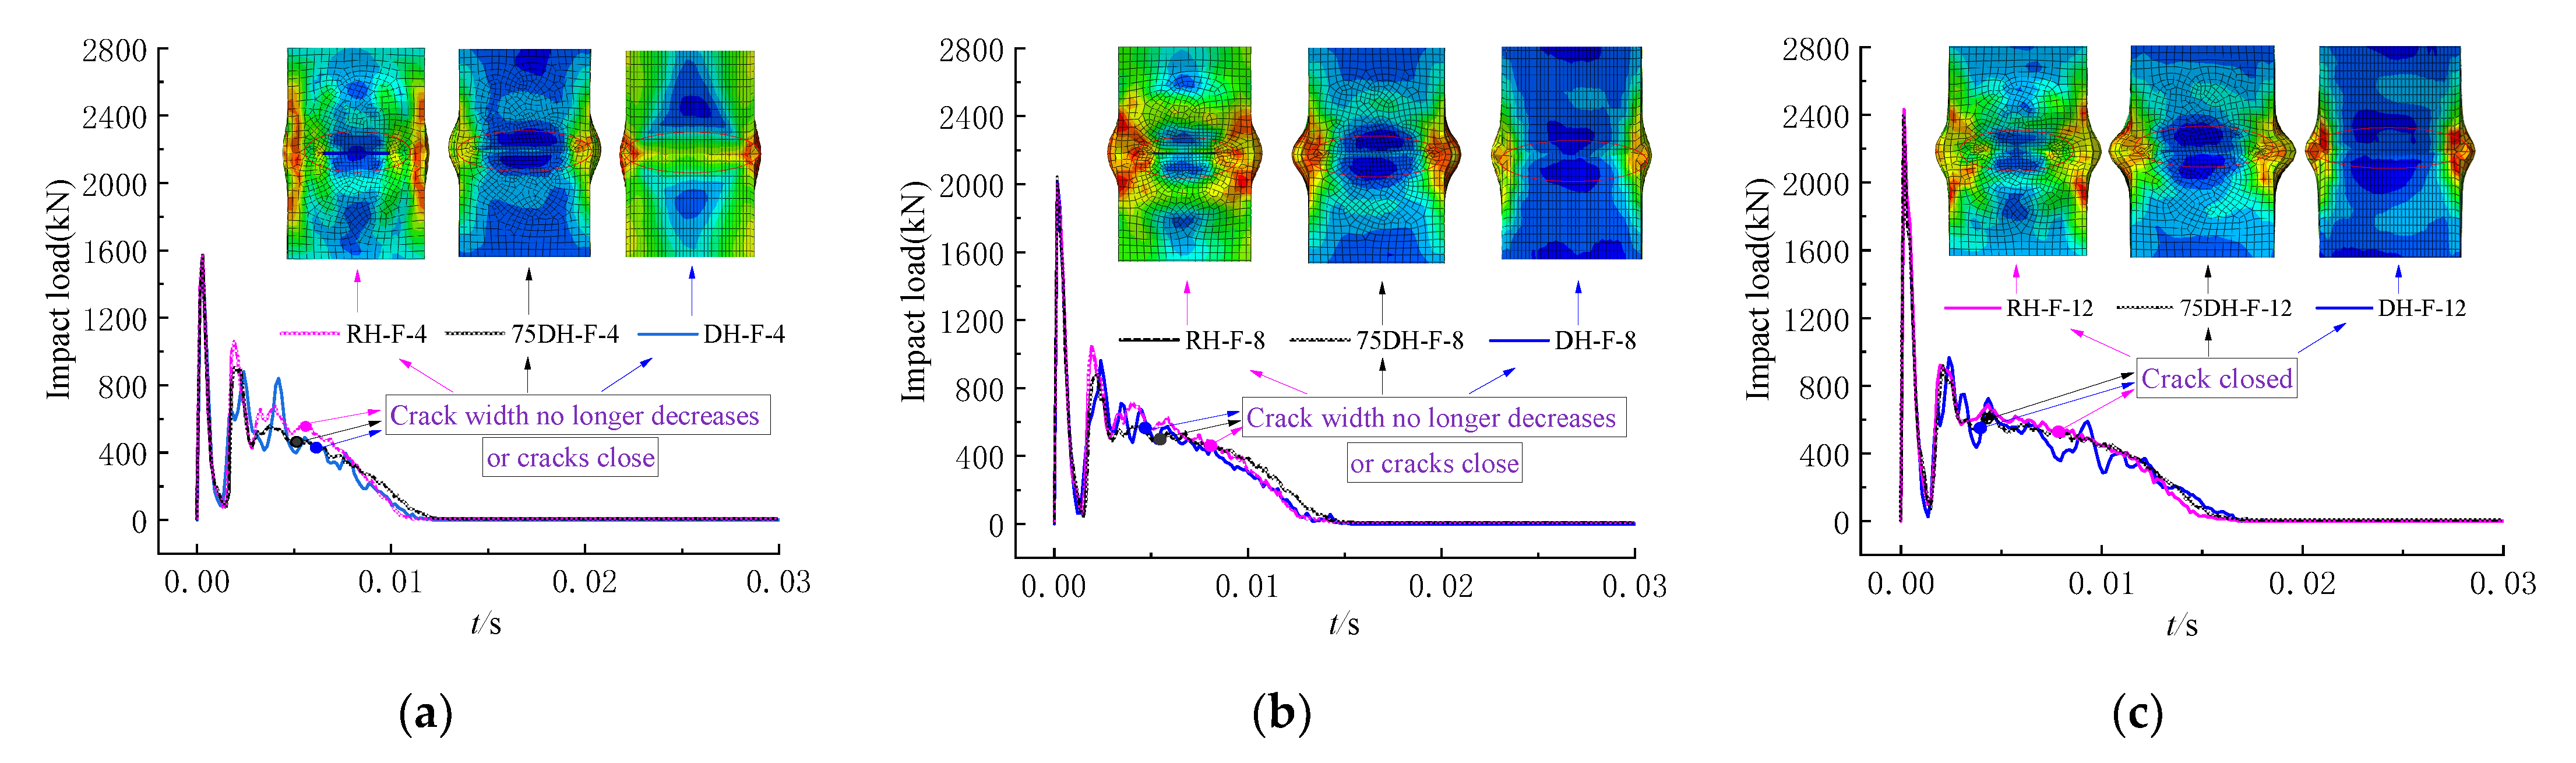
Buildings 12 00996 g007
Figure 8. Horizontal crack closure time under front impact. (a) Impact height: 4 m. (b) Impact height: 8 m. (c) Impact height: 12 m.
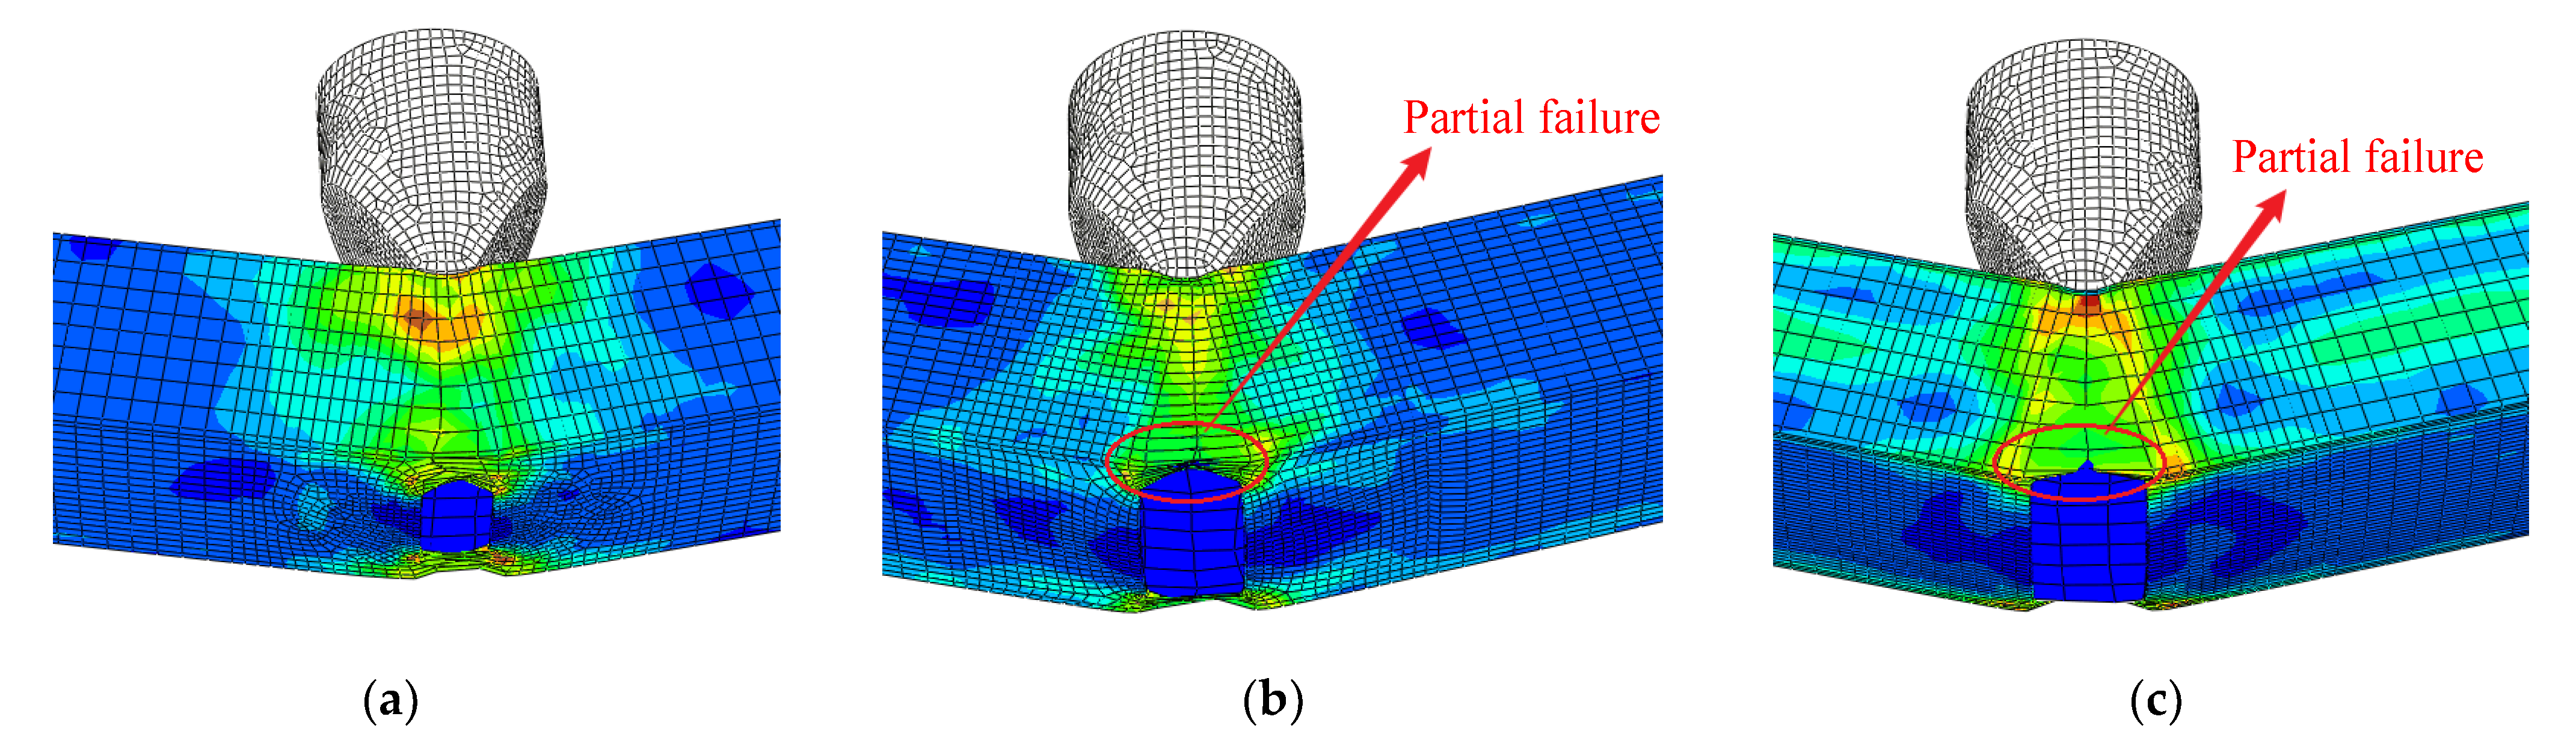
Buildings 12 00996 g008
Figure 9. Failure pattern of a model with horizontal cracks under rear impact. (a) RH-424-R-12. (b) 75DH-424-R-12. (c) DH-424-R-12.
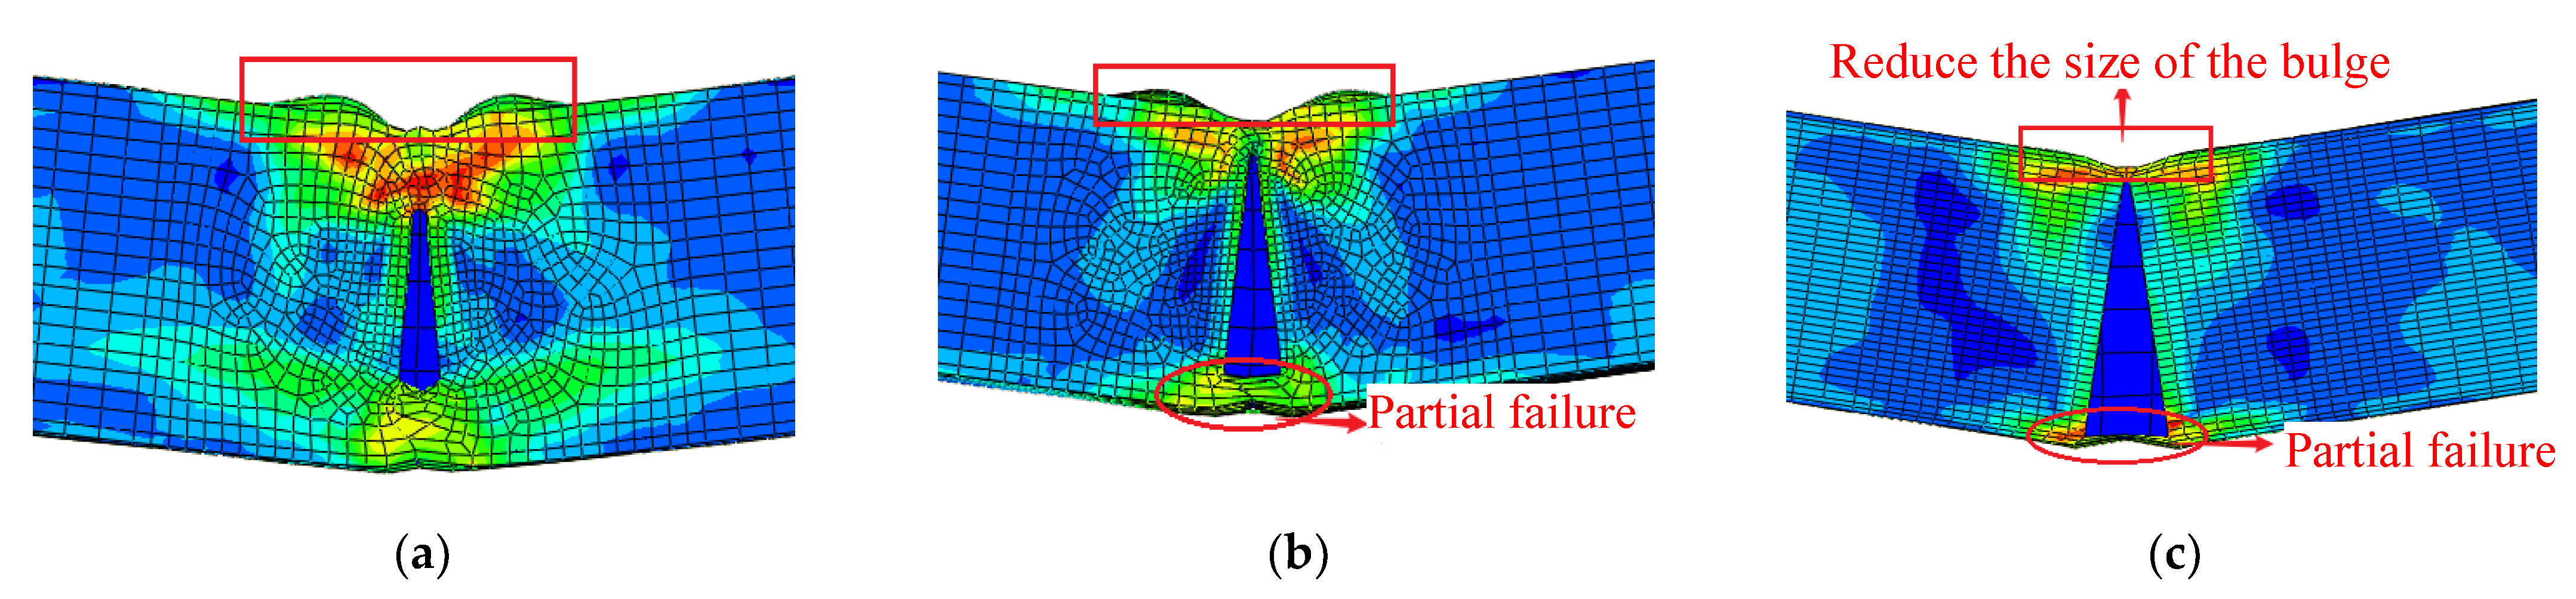
Buildings 12 00996 g009
Figure 10. Failure pattern of a model with horizontal cracks under side impact. (a) RH-424-S-12. (b) 75DH-424-S-12. (c) DH-424-S-12.
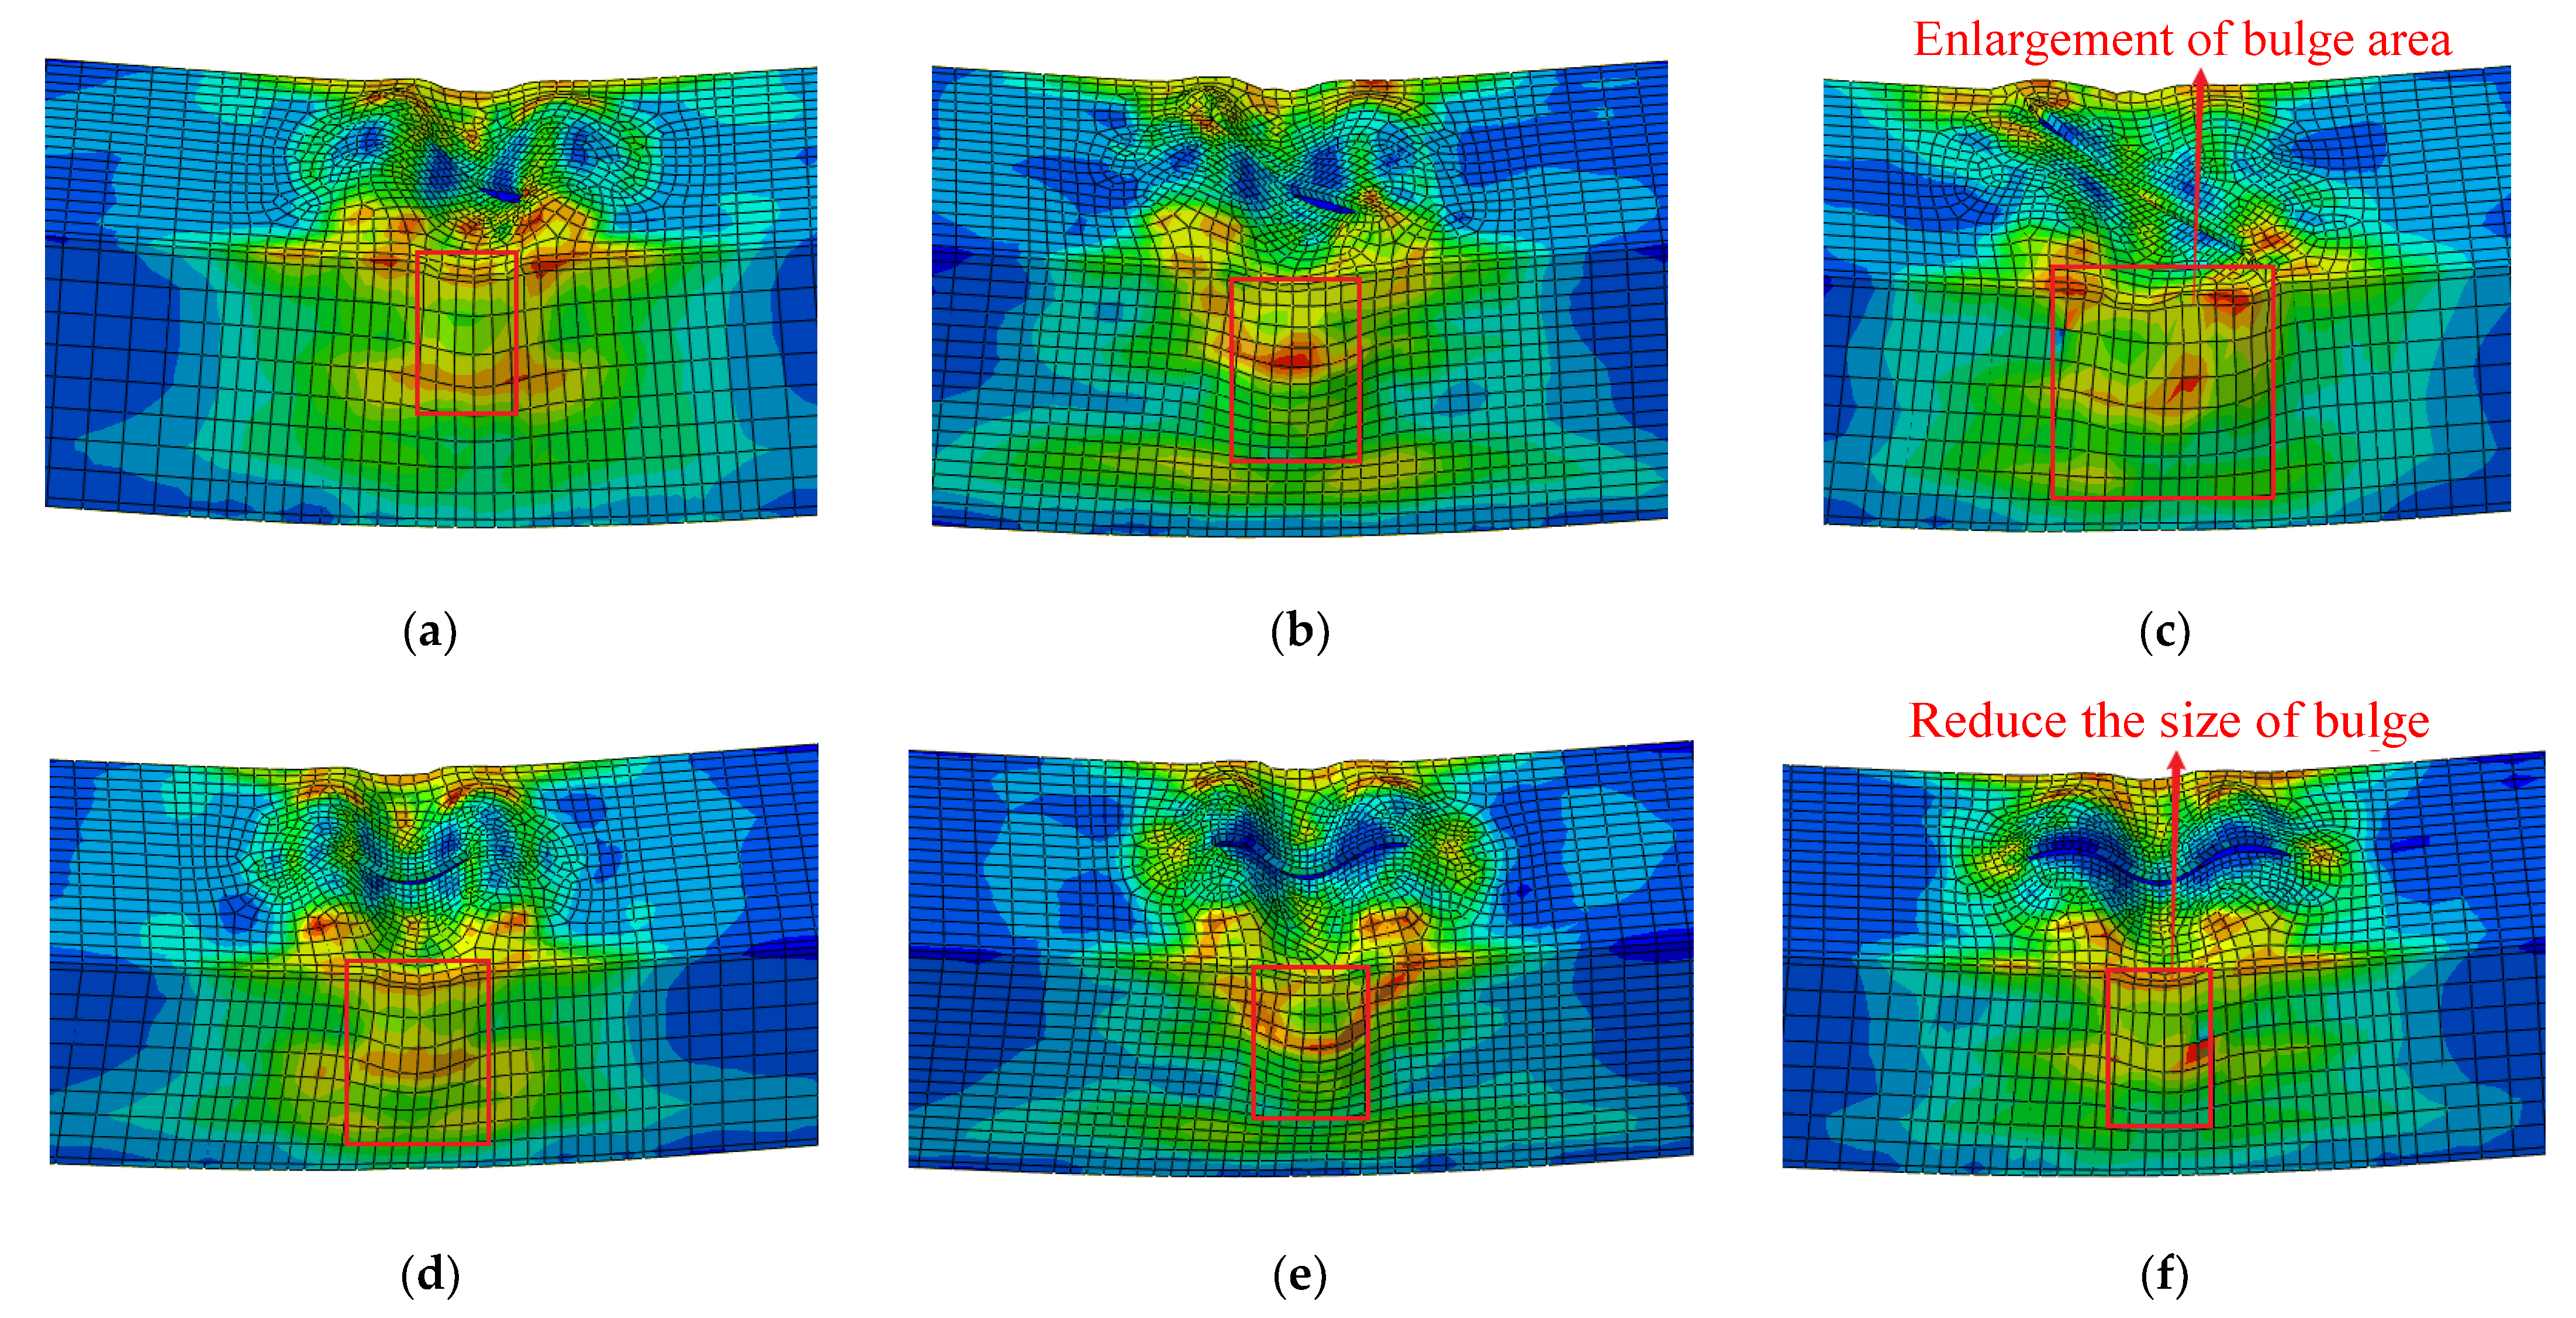
Buildings 12 00996 g010
Figure 11. Failure patterns of models with oblique and vertical cracks under front impact. (a) RO-424-F-12. (b) 75DO-424-F-12. (c) DO-424-F-12. (d) RV-424-F-12. (e) 75DV-424-F-12. (f) DV-424-F-12.
Buildings 12 00996 g011
Figure 12. Failure patterns of models with oblique and vertical cracks under rear impact. (a) RO-424-R-12. (b) 75DO-424-R-12. (c) DO-424-R-12. (d) RV-424-R-12. (e) 75DV-424-R-12. (f) DV-424-R-12.
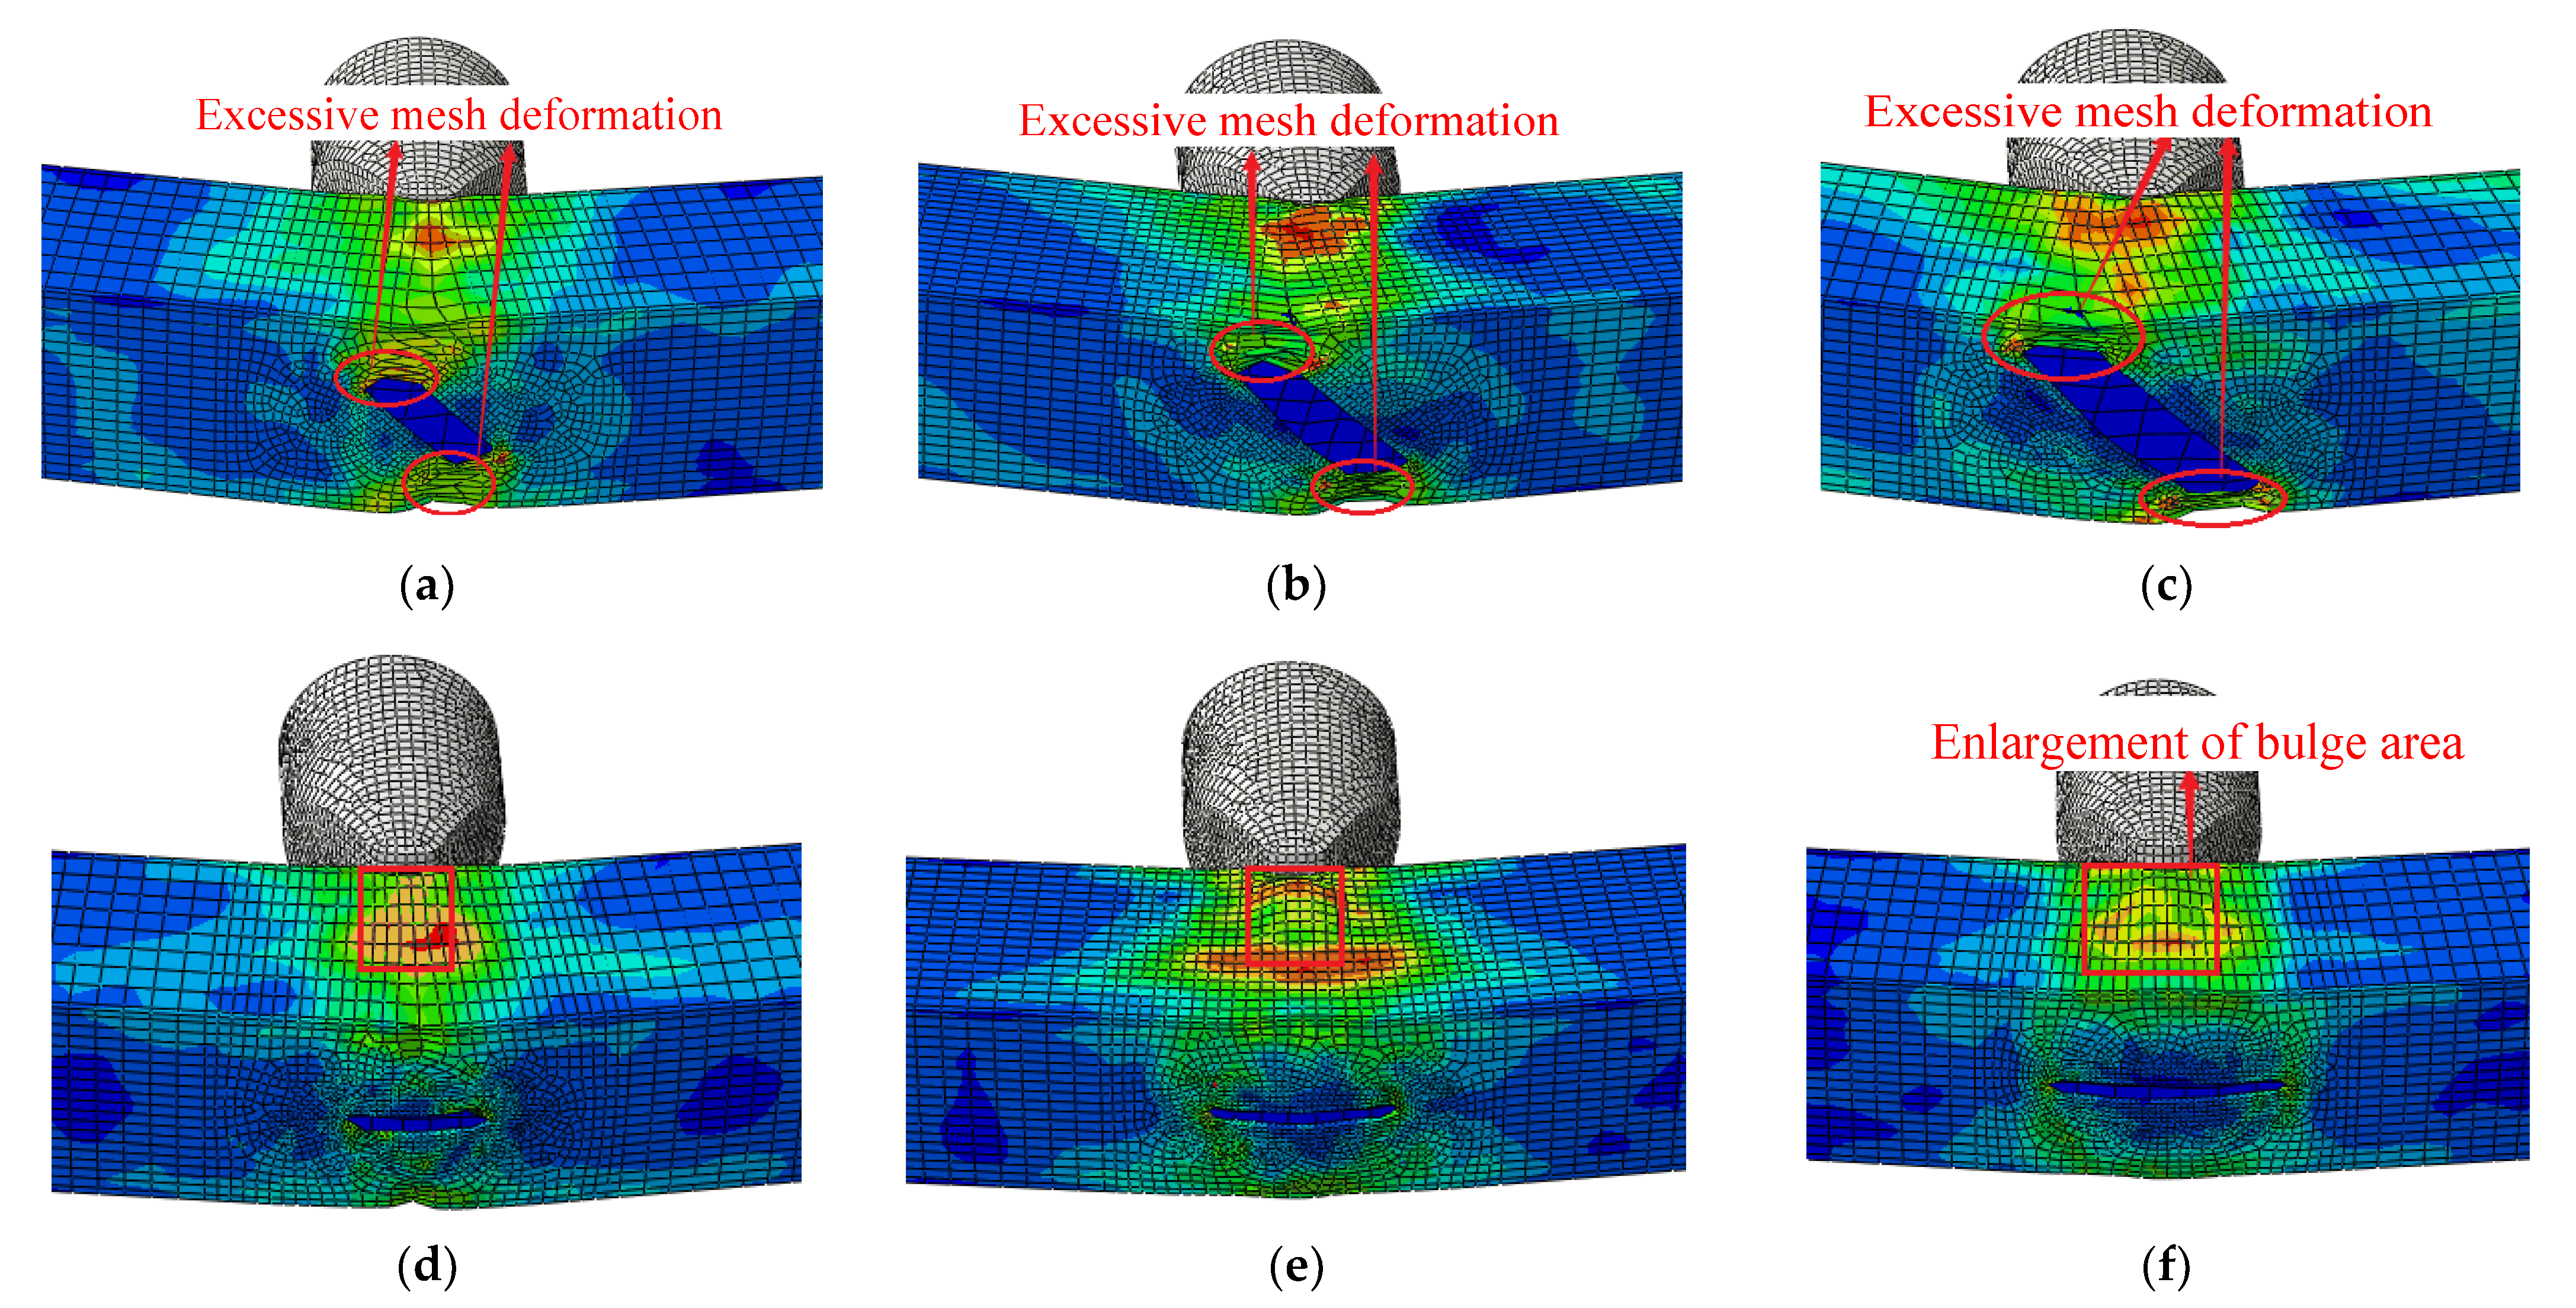
Buildings 12 00996 g012
Figure 13. Failure patterns of models with oblique and vertical cracks under side impact. (a) RO-424-S-12. (b) 75DO-424-S-12. (c) DO-424-S-12. (d) RV-424-S-12. (e) 75DV-424-S-12. (f) DV-424-S-12.
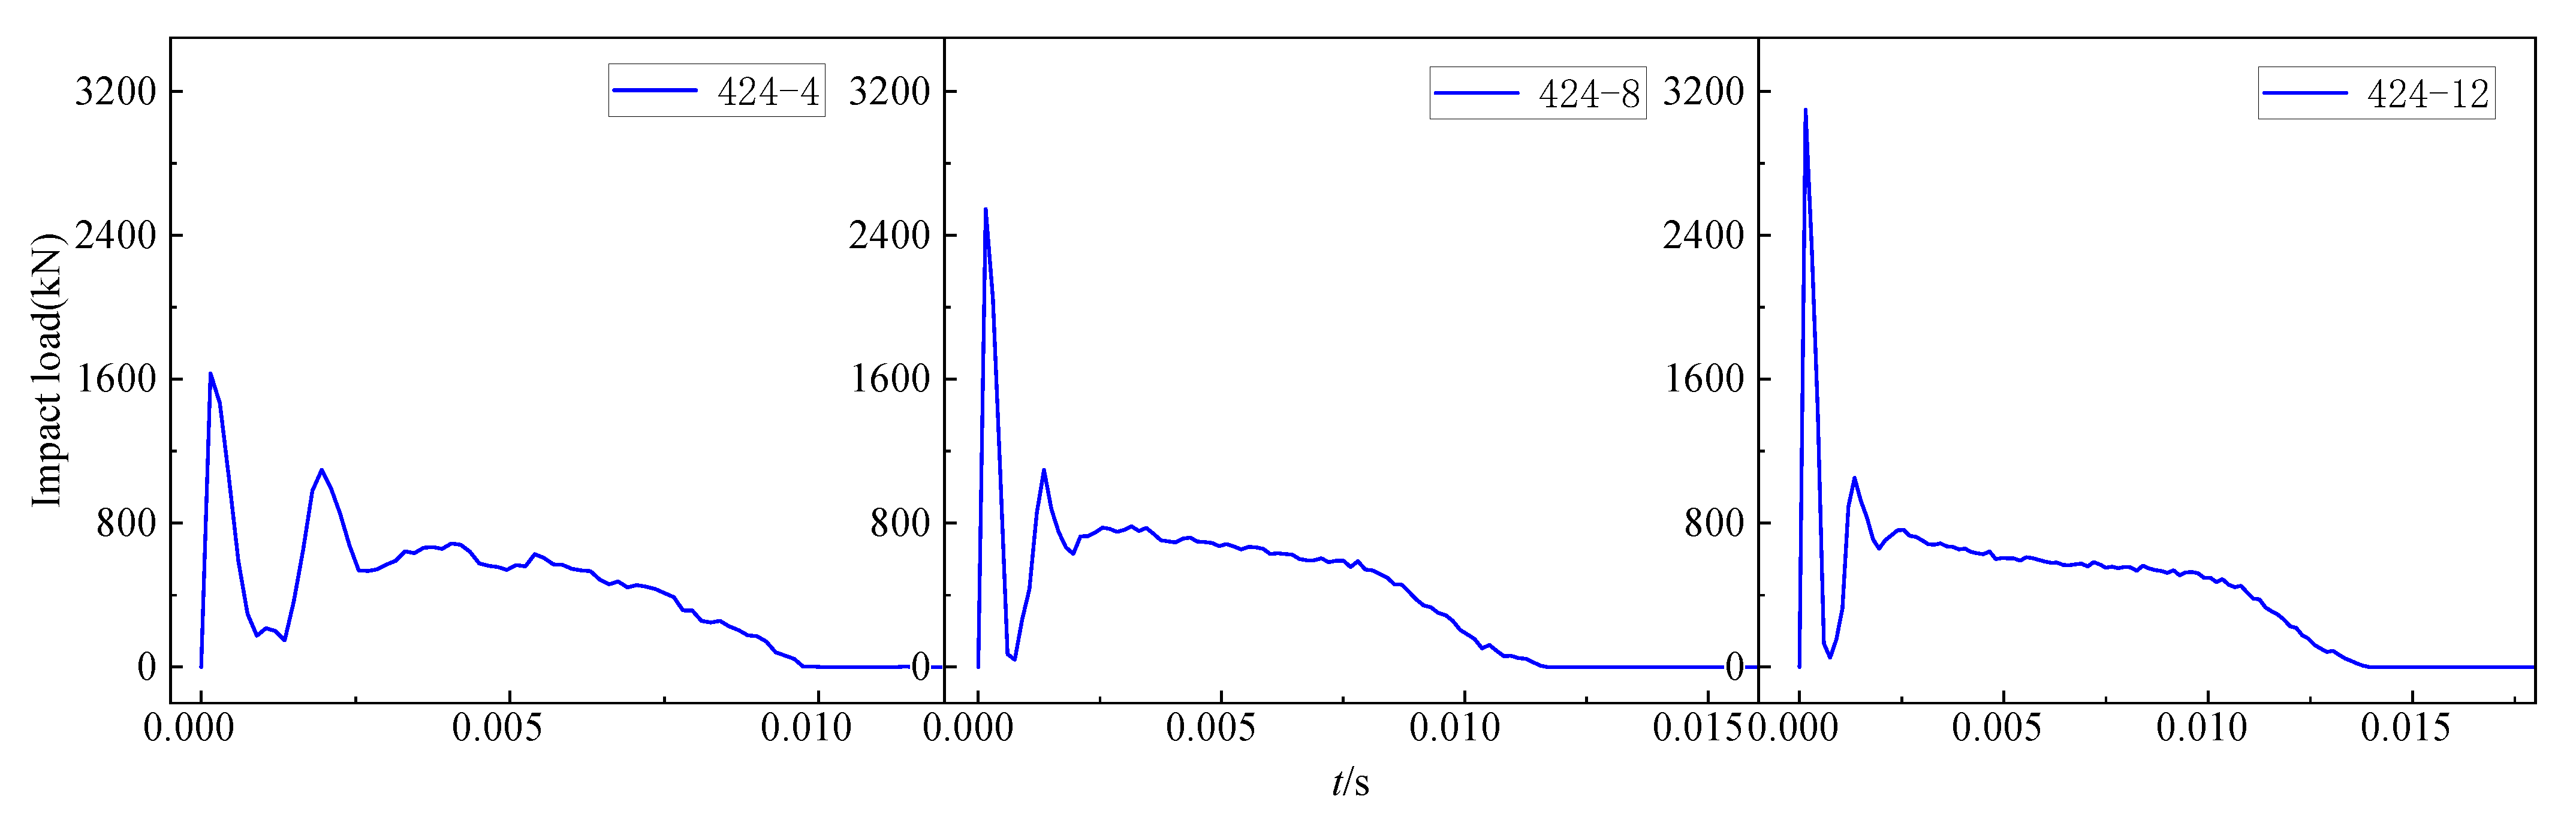
Buildings 12 00996 g013aBuildings 12 00996 g013b
Figure 14. Time history curve of impact force for crack-free model.
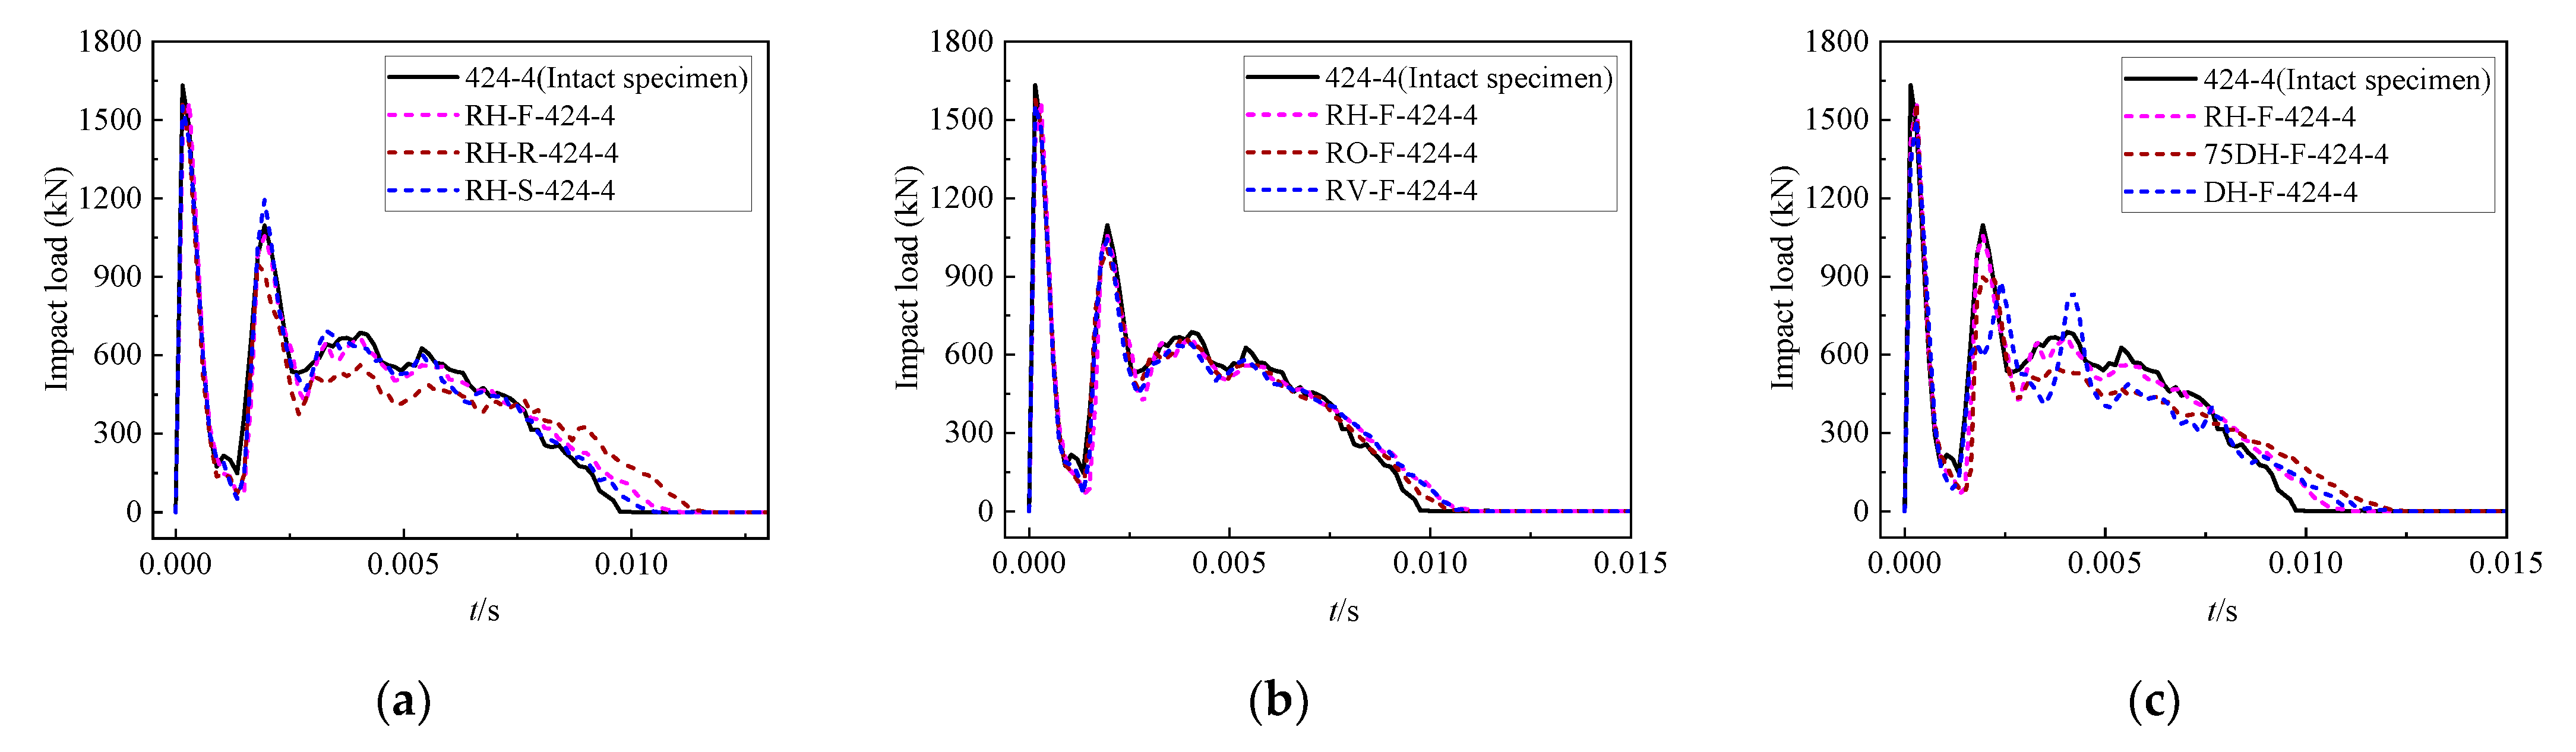
Buildings 12 00996 g014
Figure 15. Comparison of each parameter with the crack-free model. (a) Change of impact surface. (b) Change of crack angle. (c) Change of crack length.
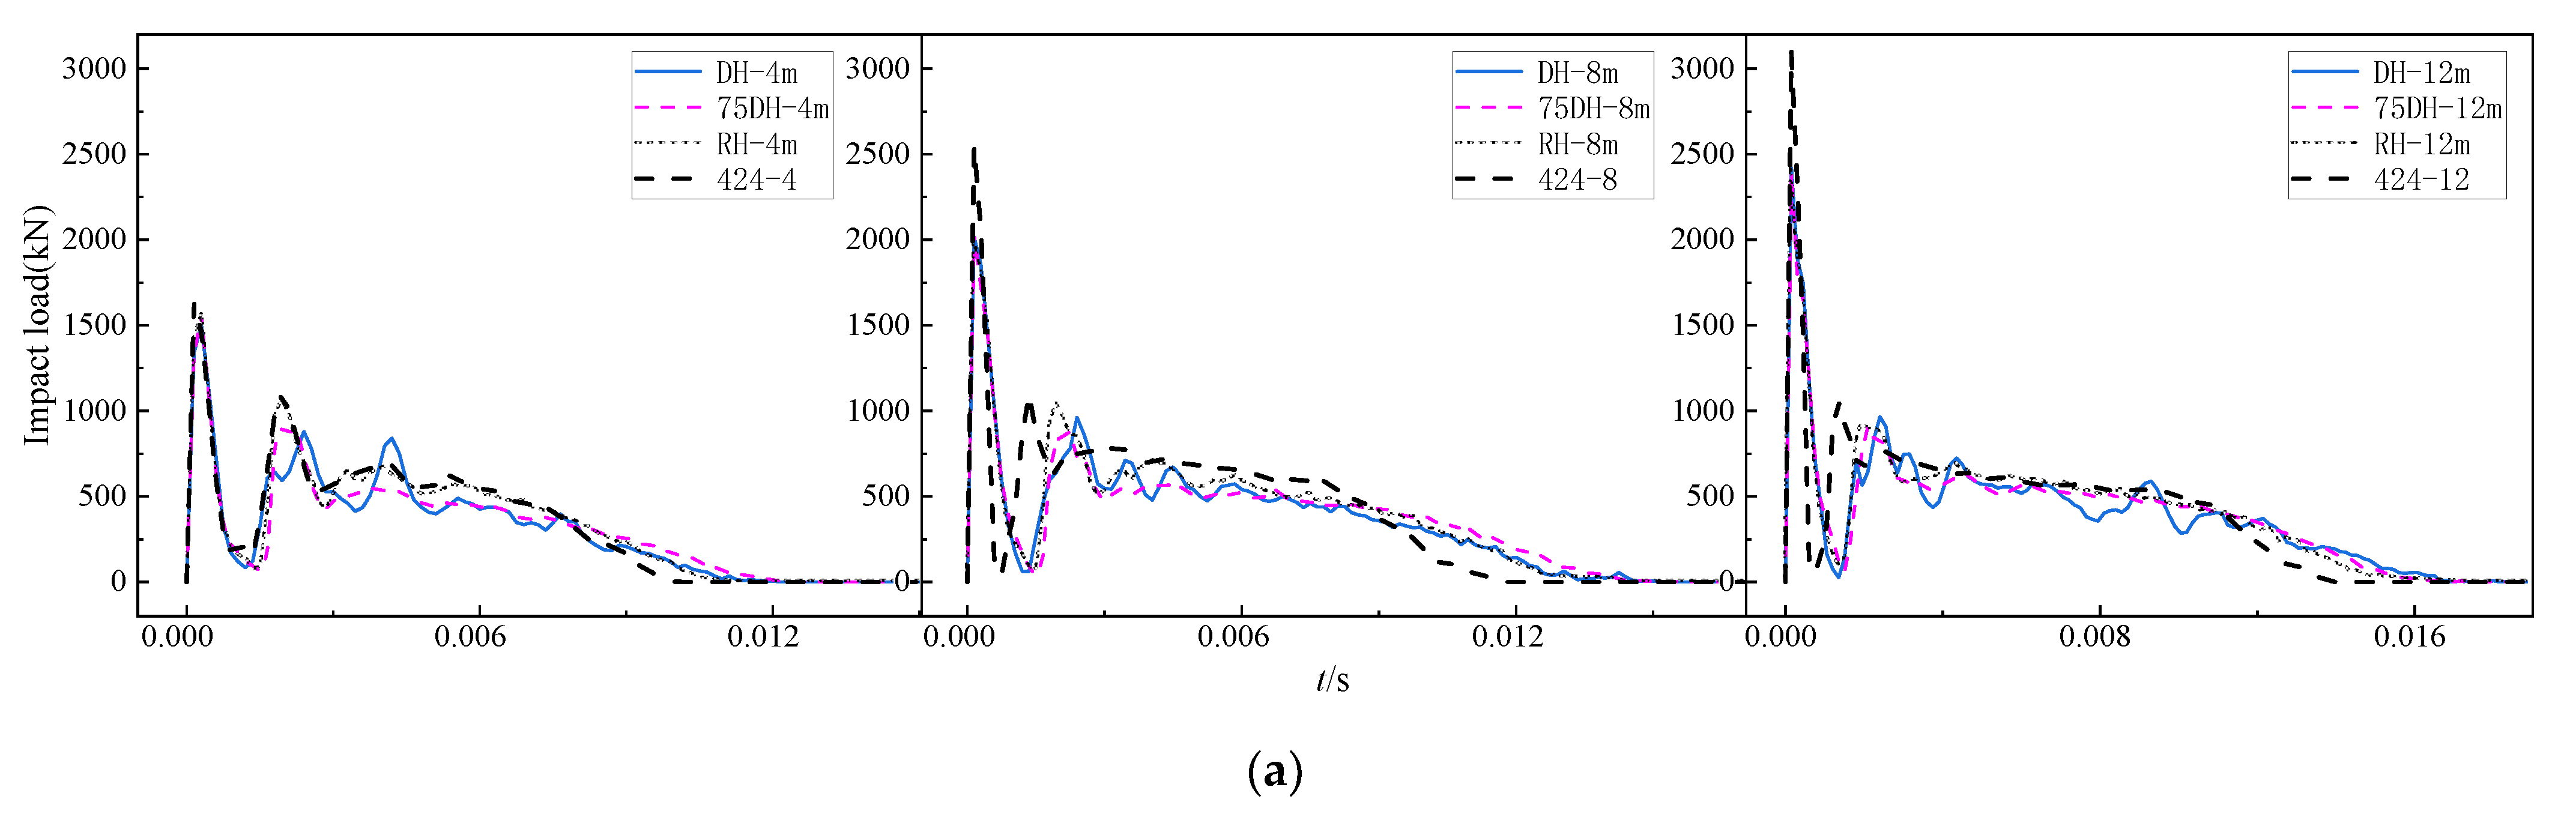
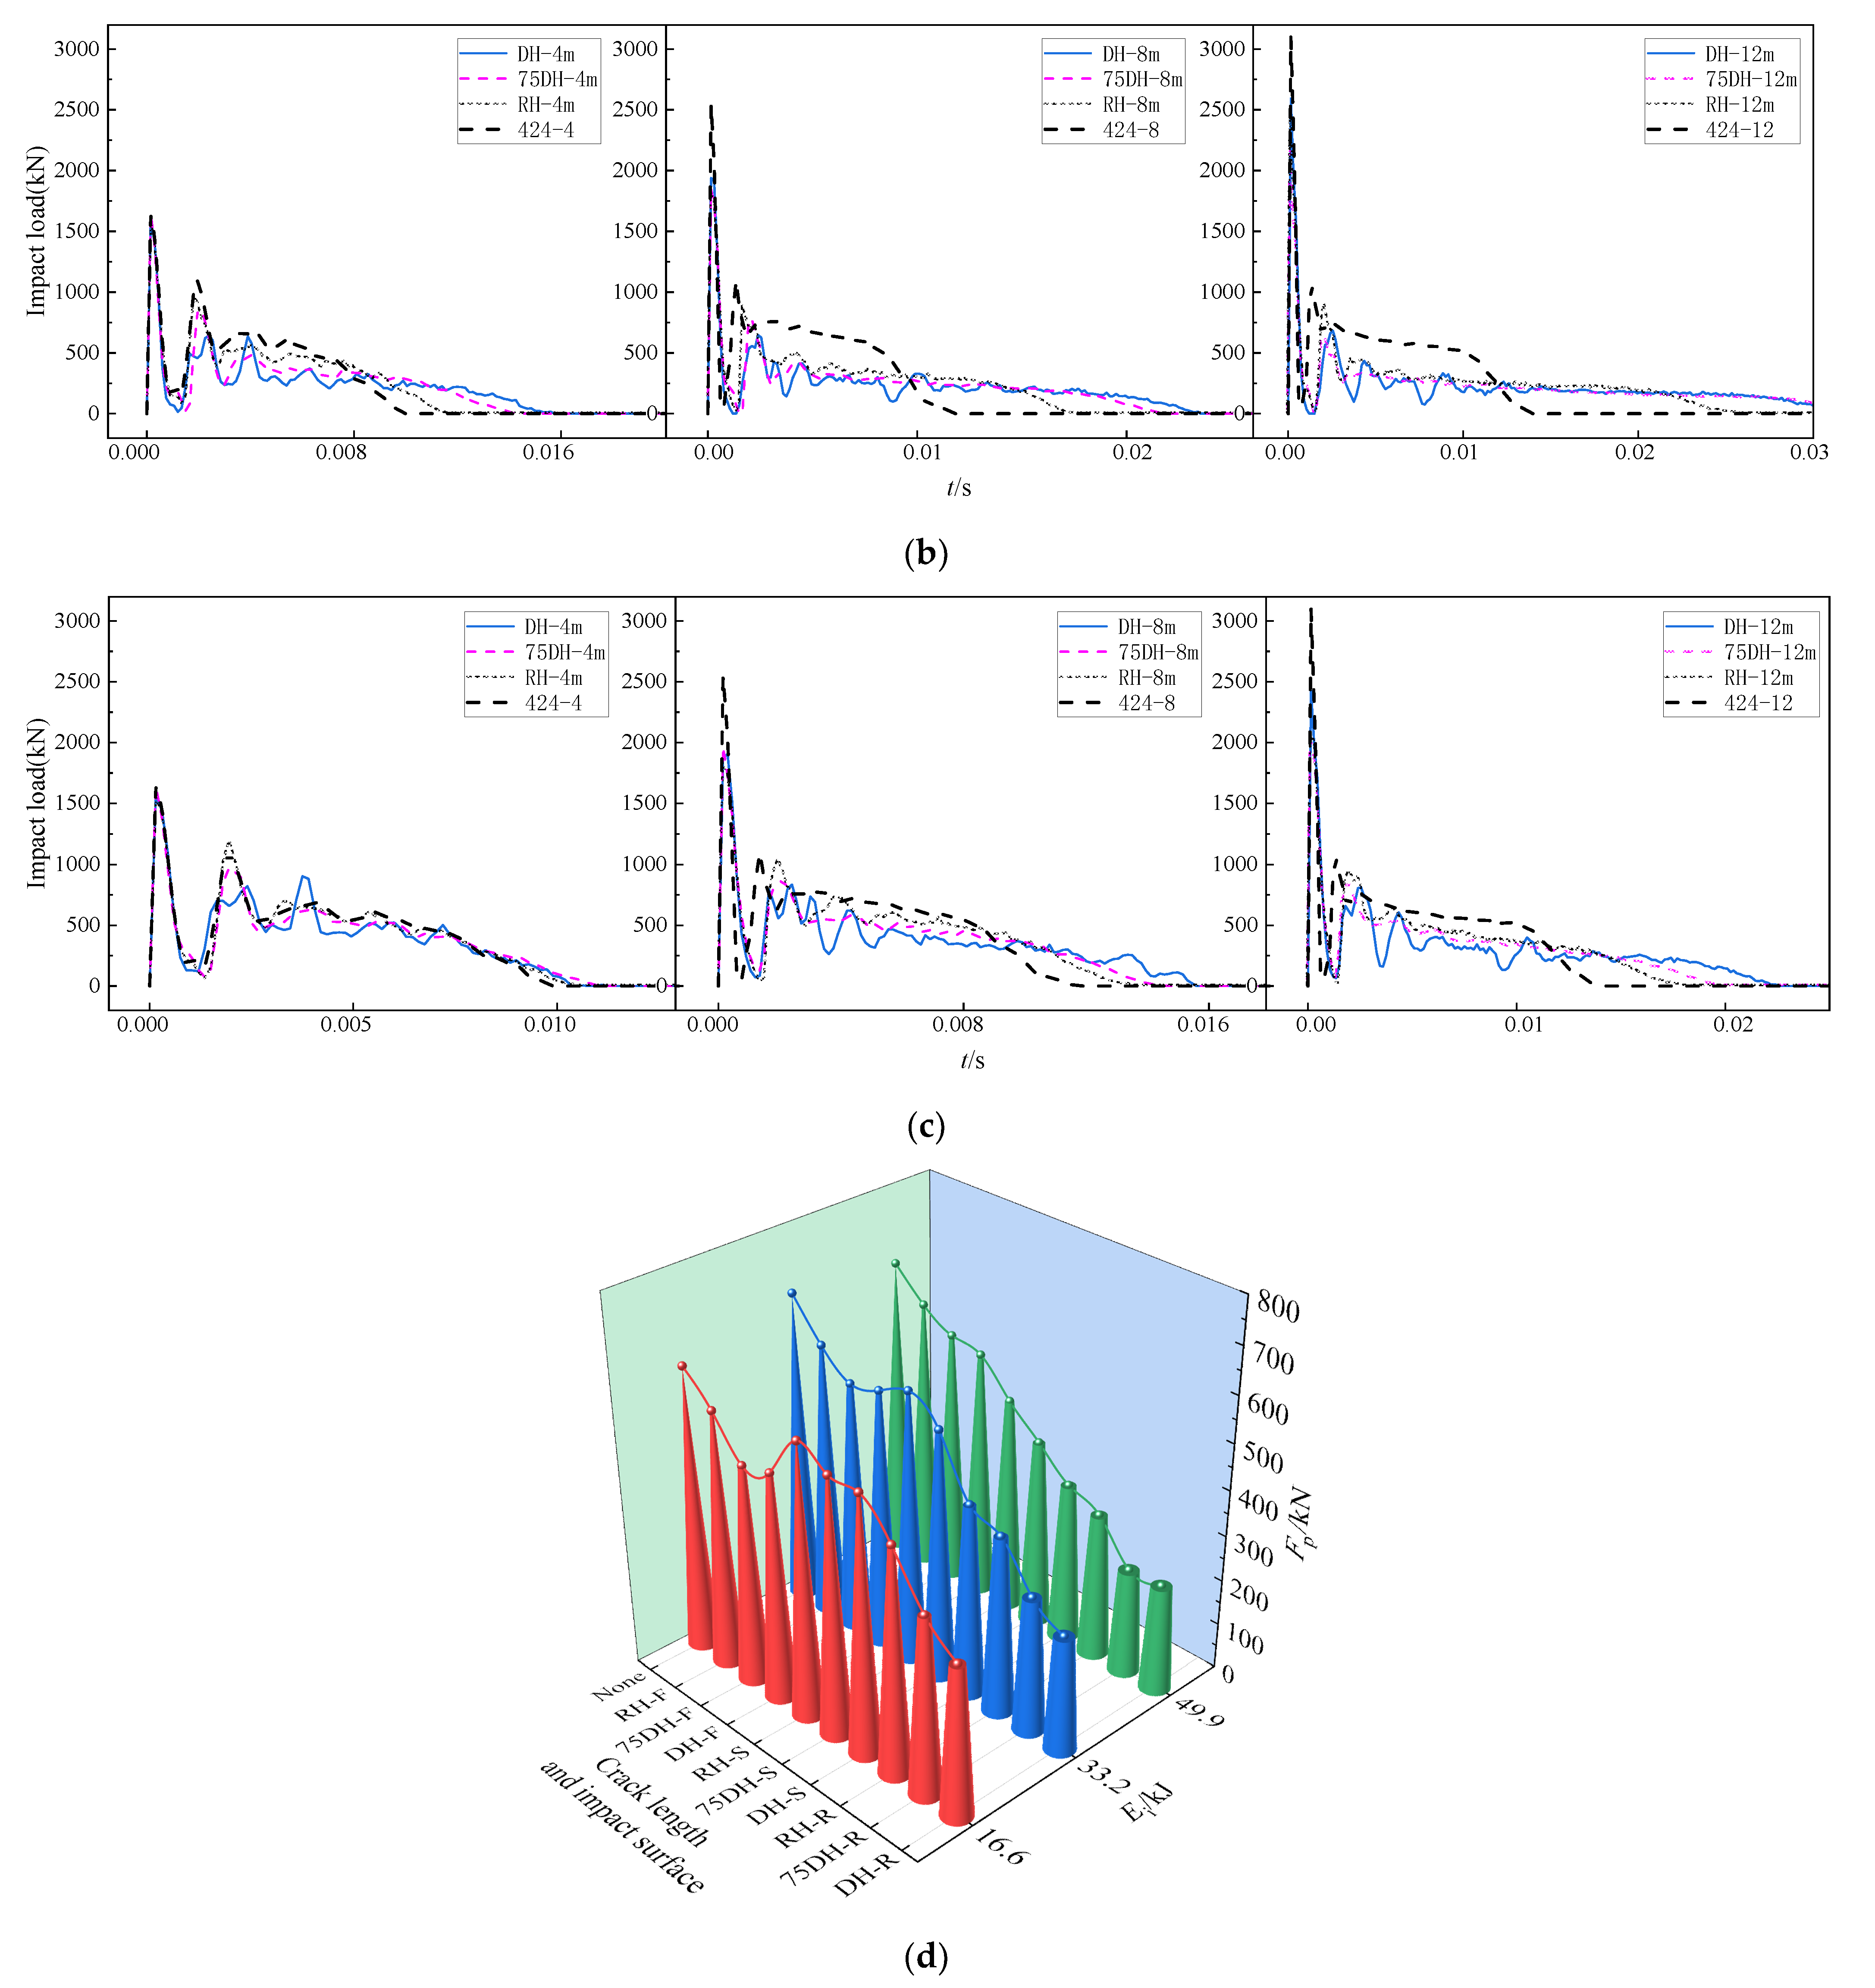
Buildings 12 00996 g015
Figure 16. Comparison of impact time history curve and impact platform value of horizontal crack model. (a) Front impact. (b) Rear impact. (c) Side impact. (d) Impact platform value of horizontal crack model.
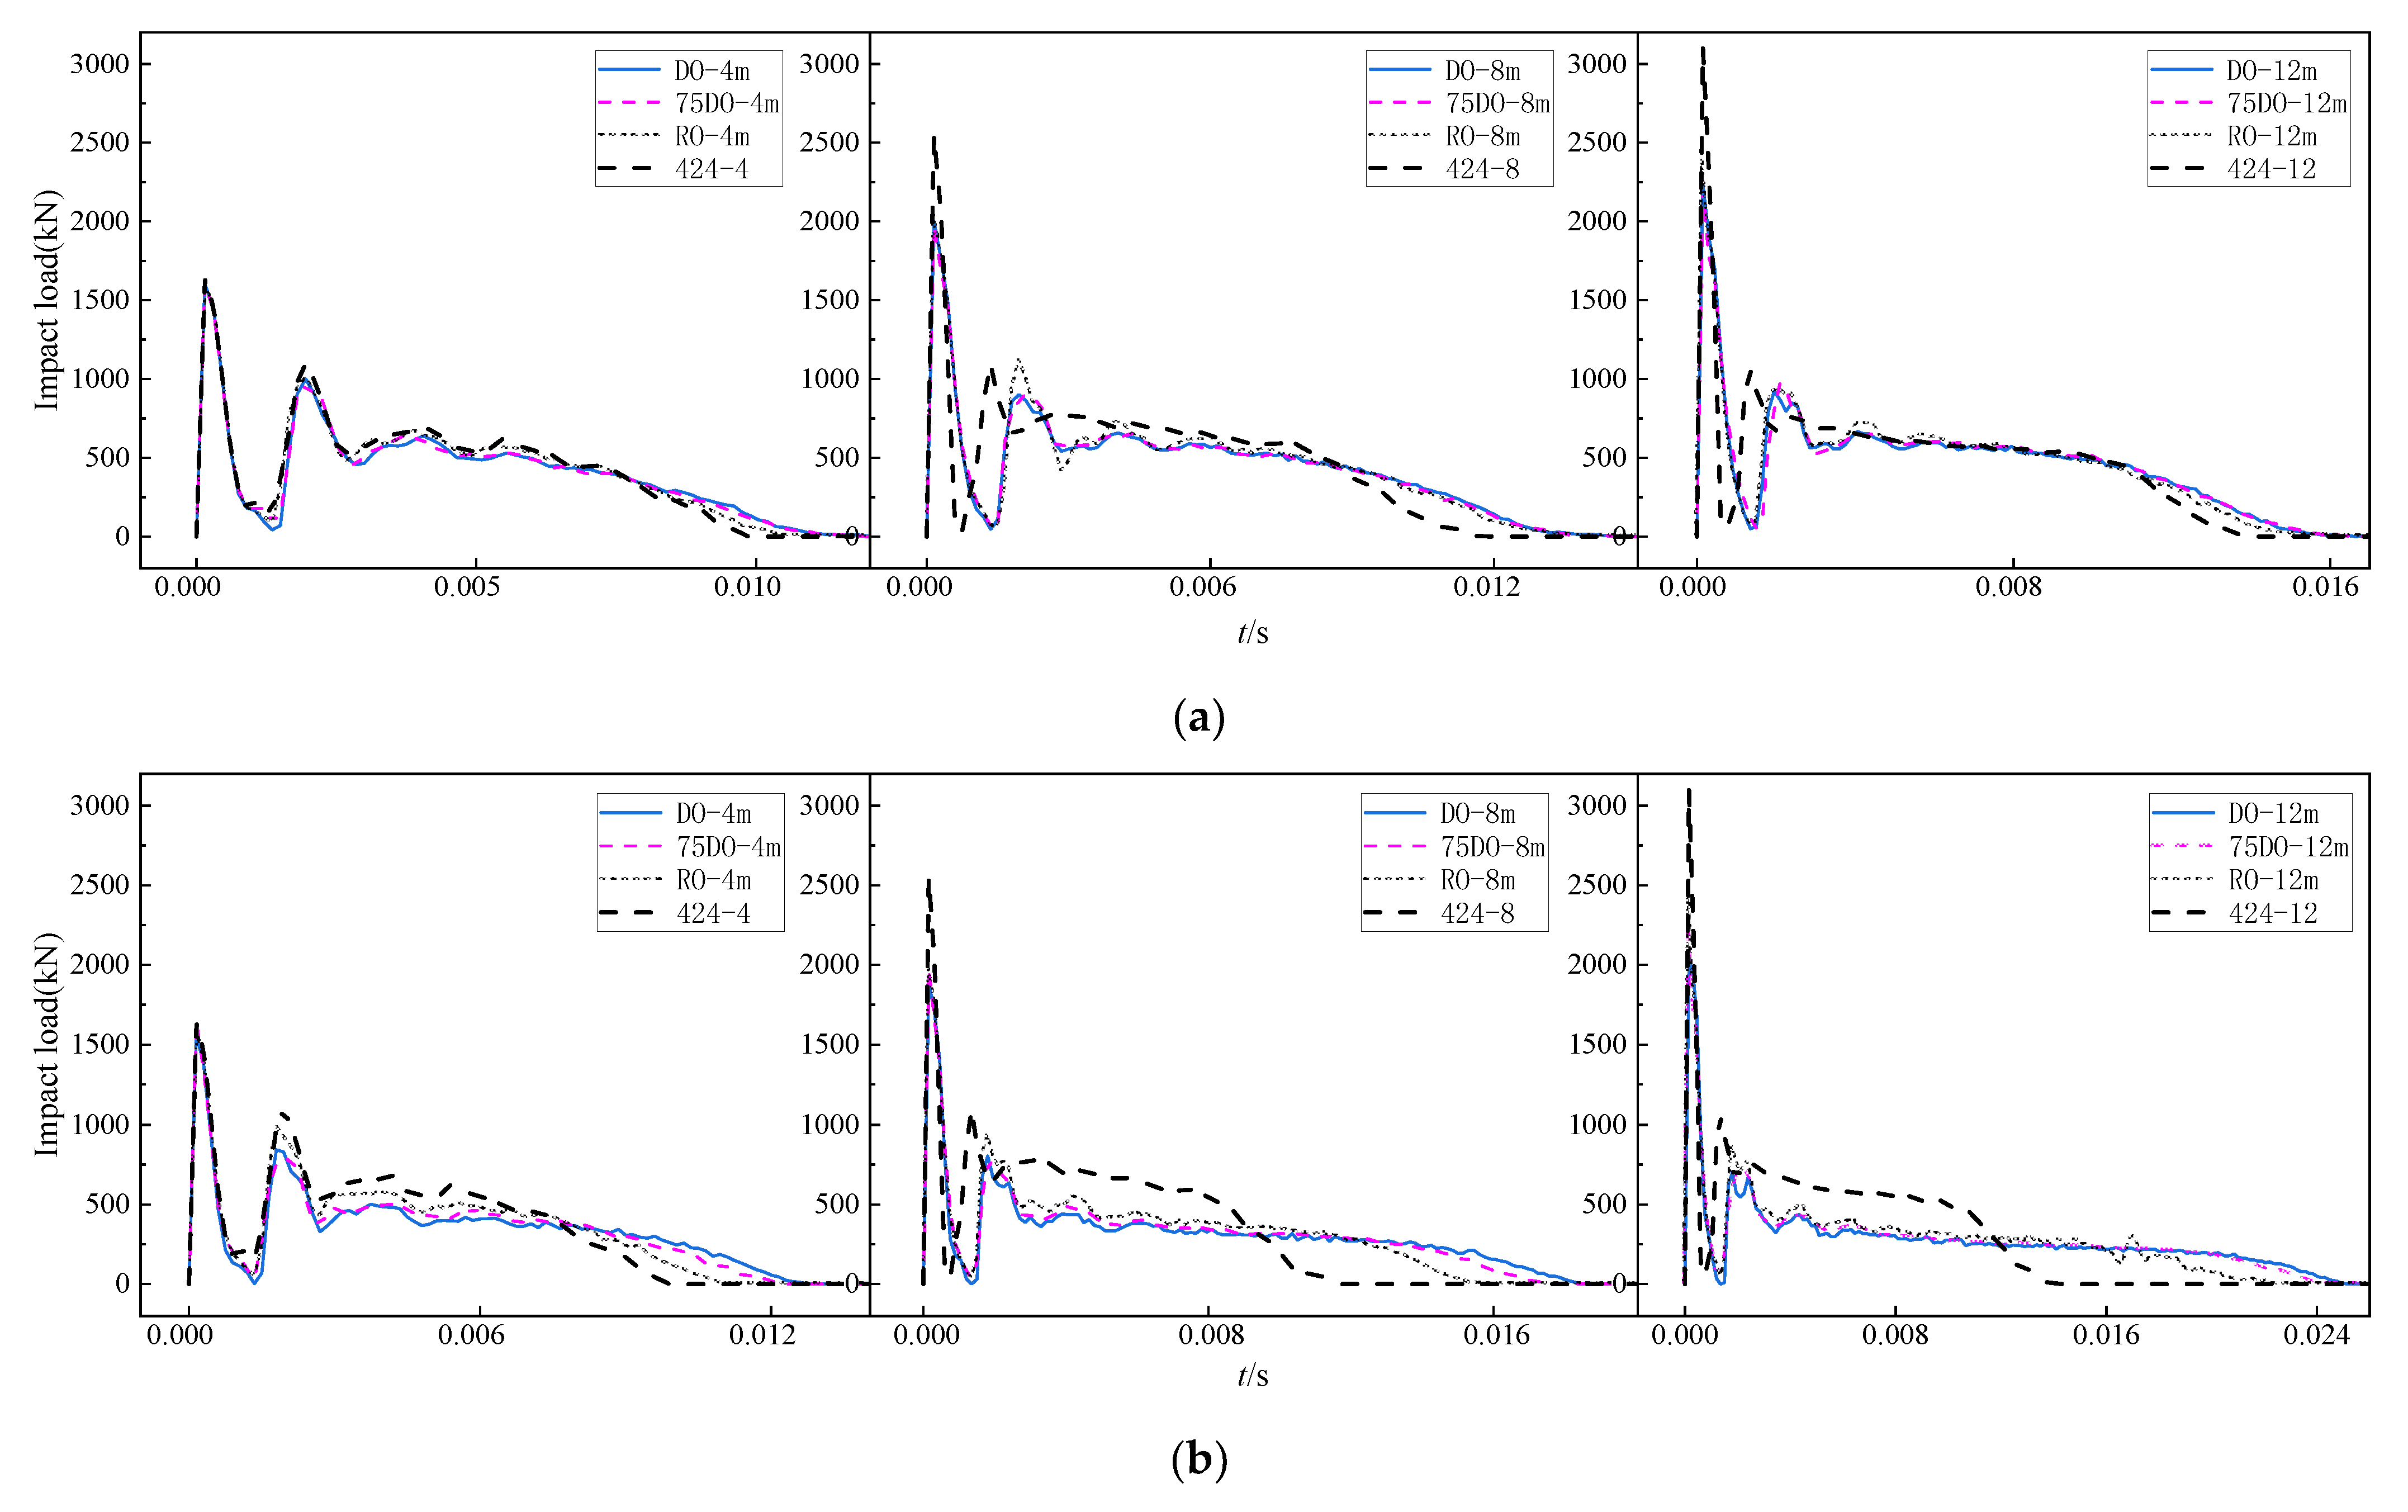
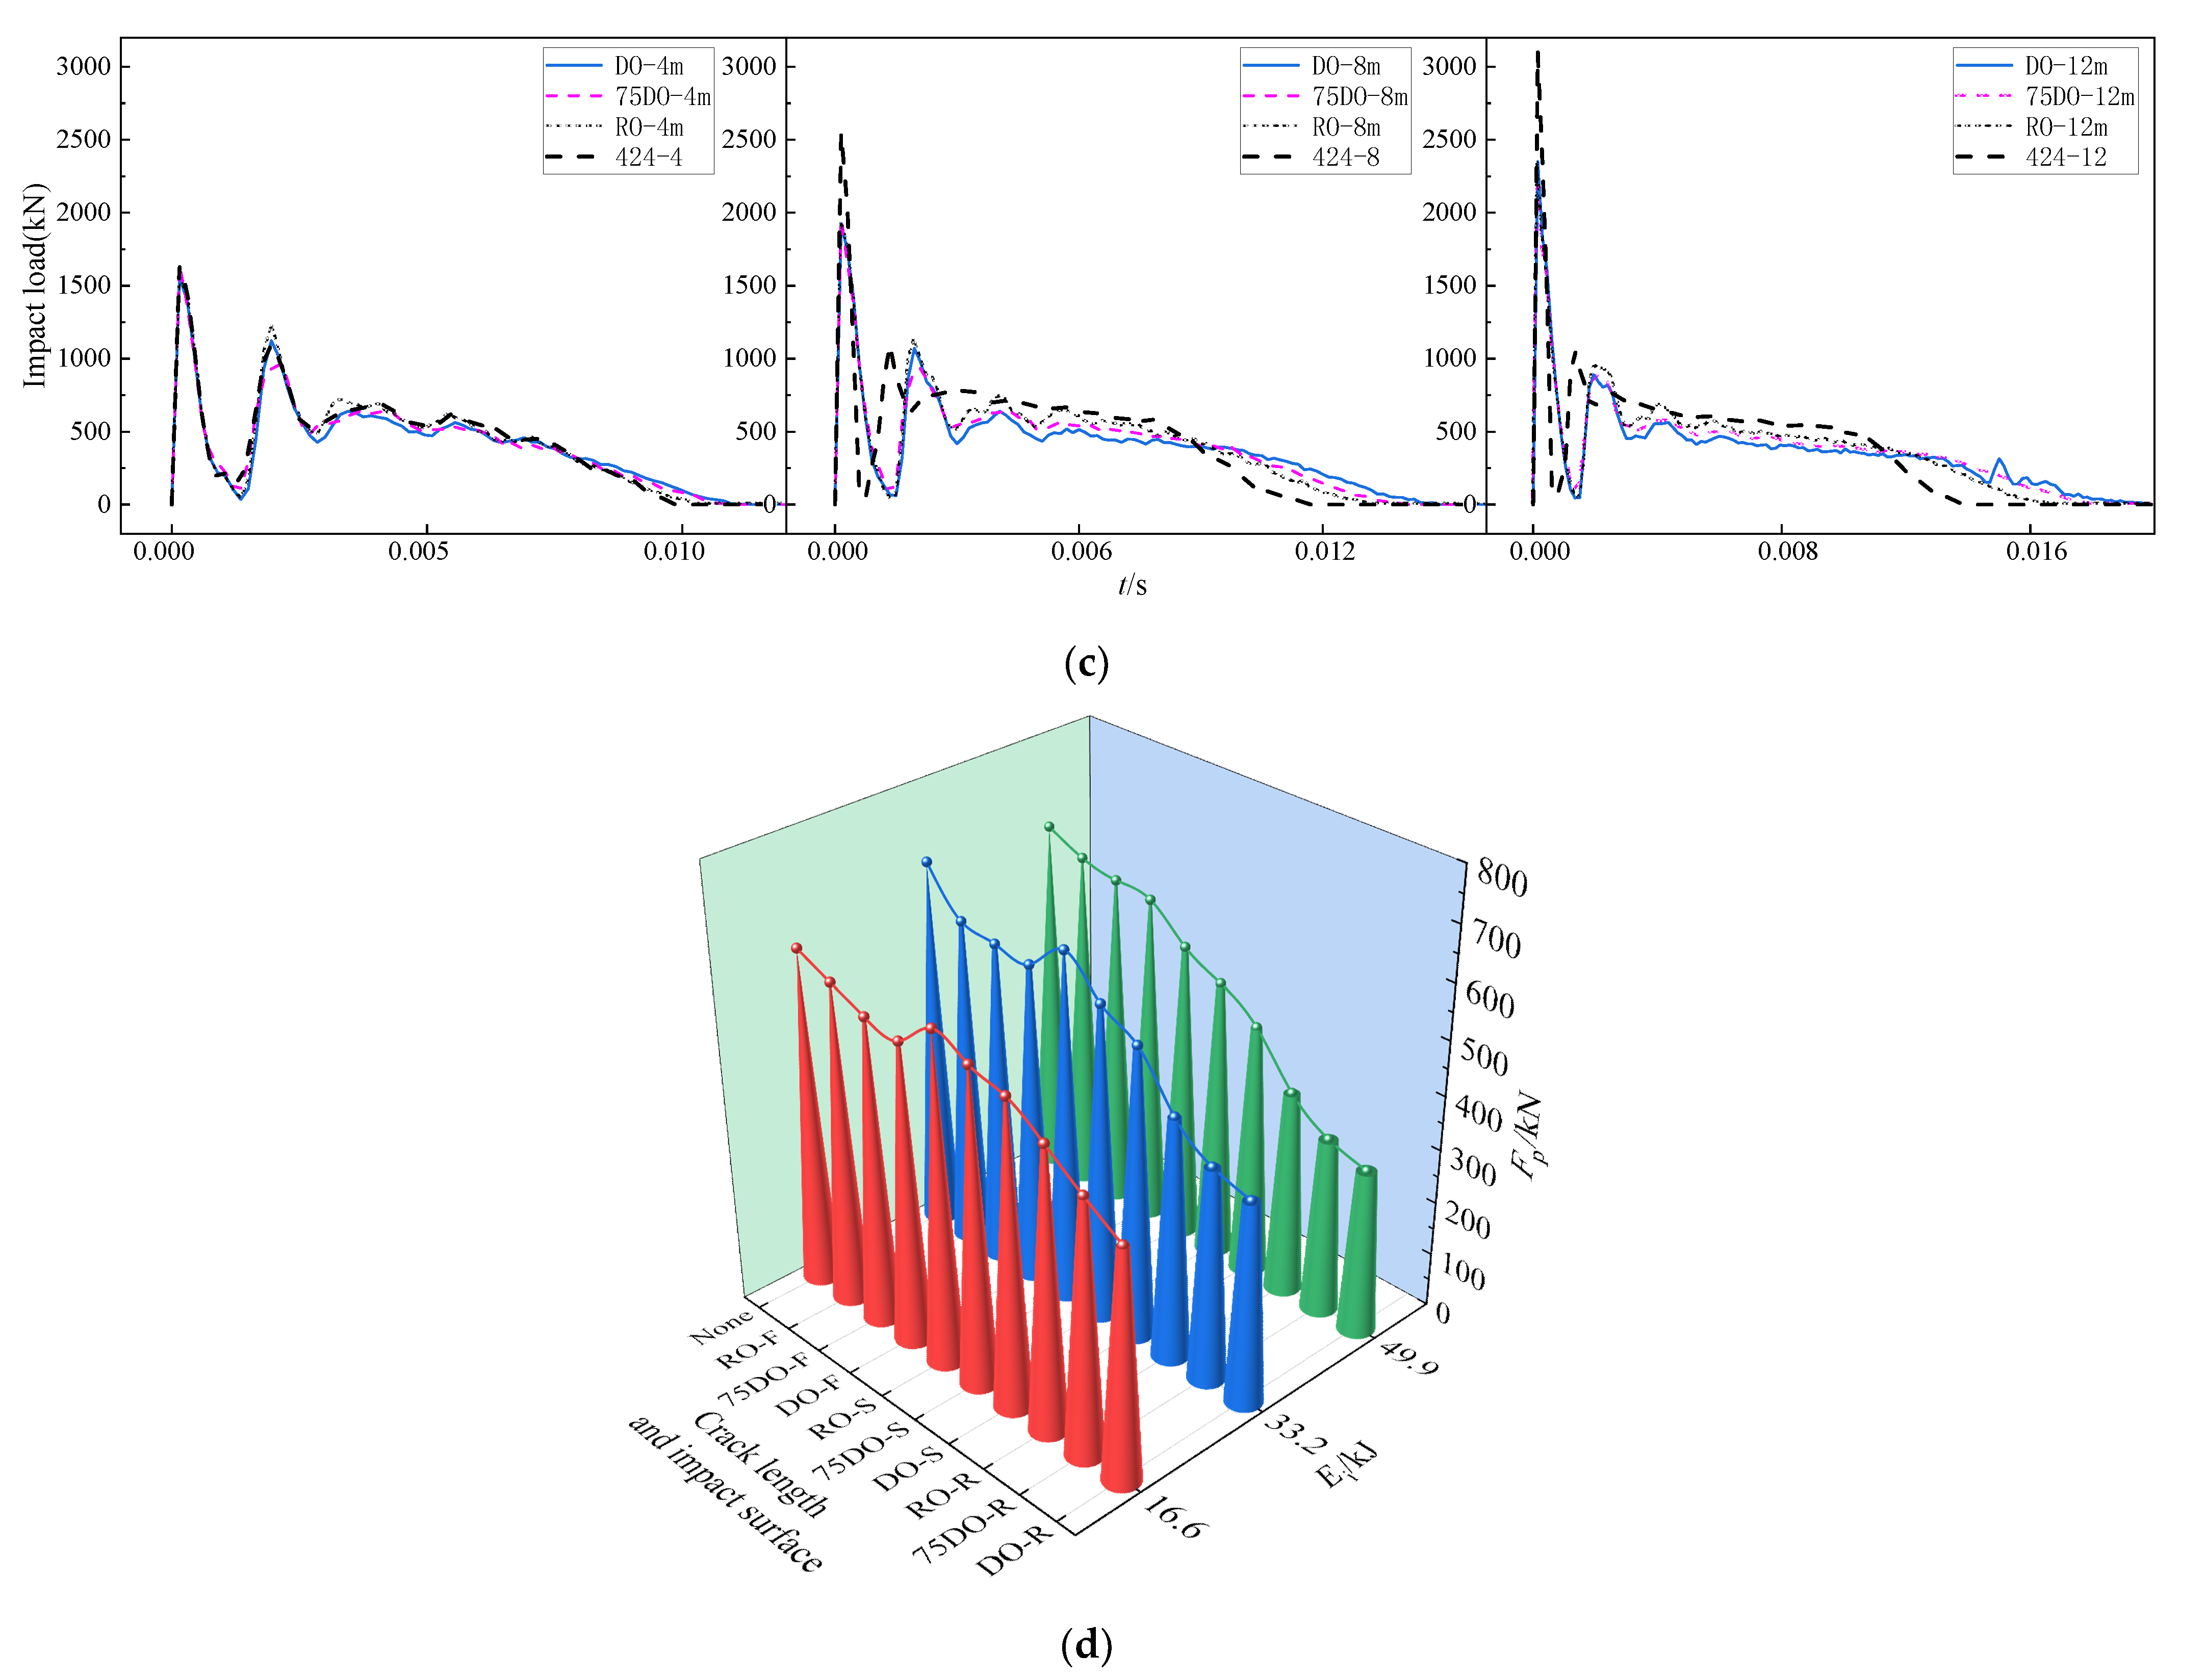
Buildings 12 00996 g016aBuildings 12 00996 g016b
Figure 17. Comparison of impact time history curve and impact platform value of oblique crack model. (a) Front impact. (b) Rear impact. (c) Side impact. (d) Impact platform values of oblique crack model.
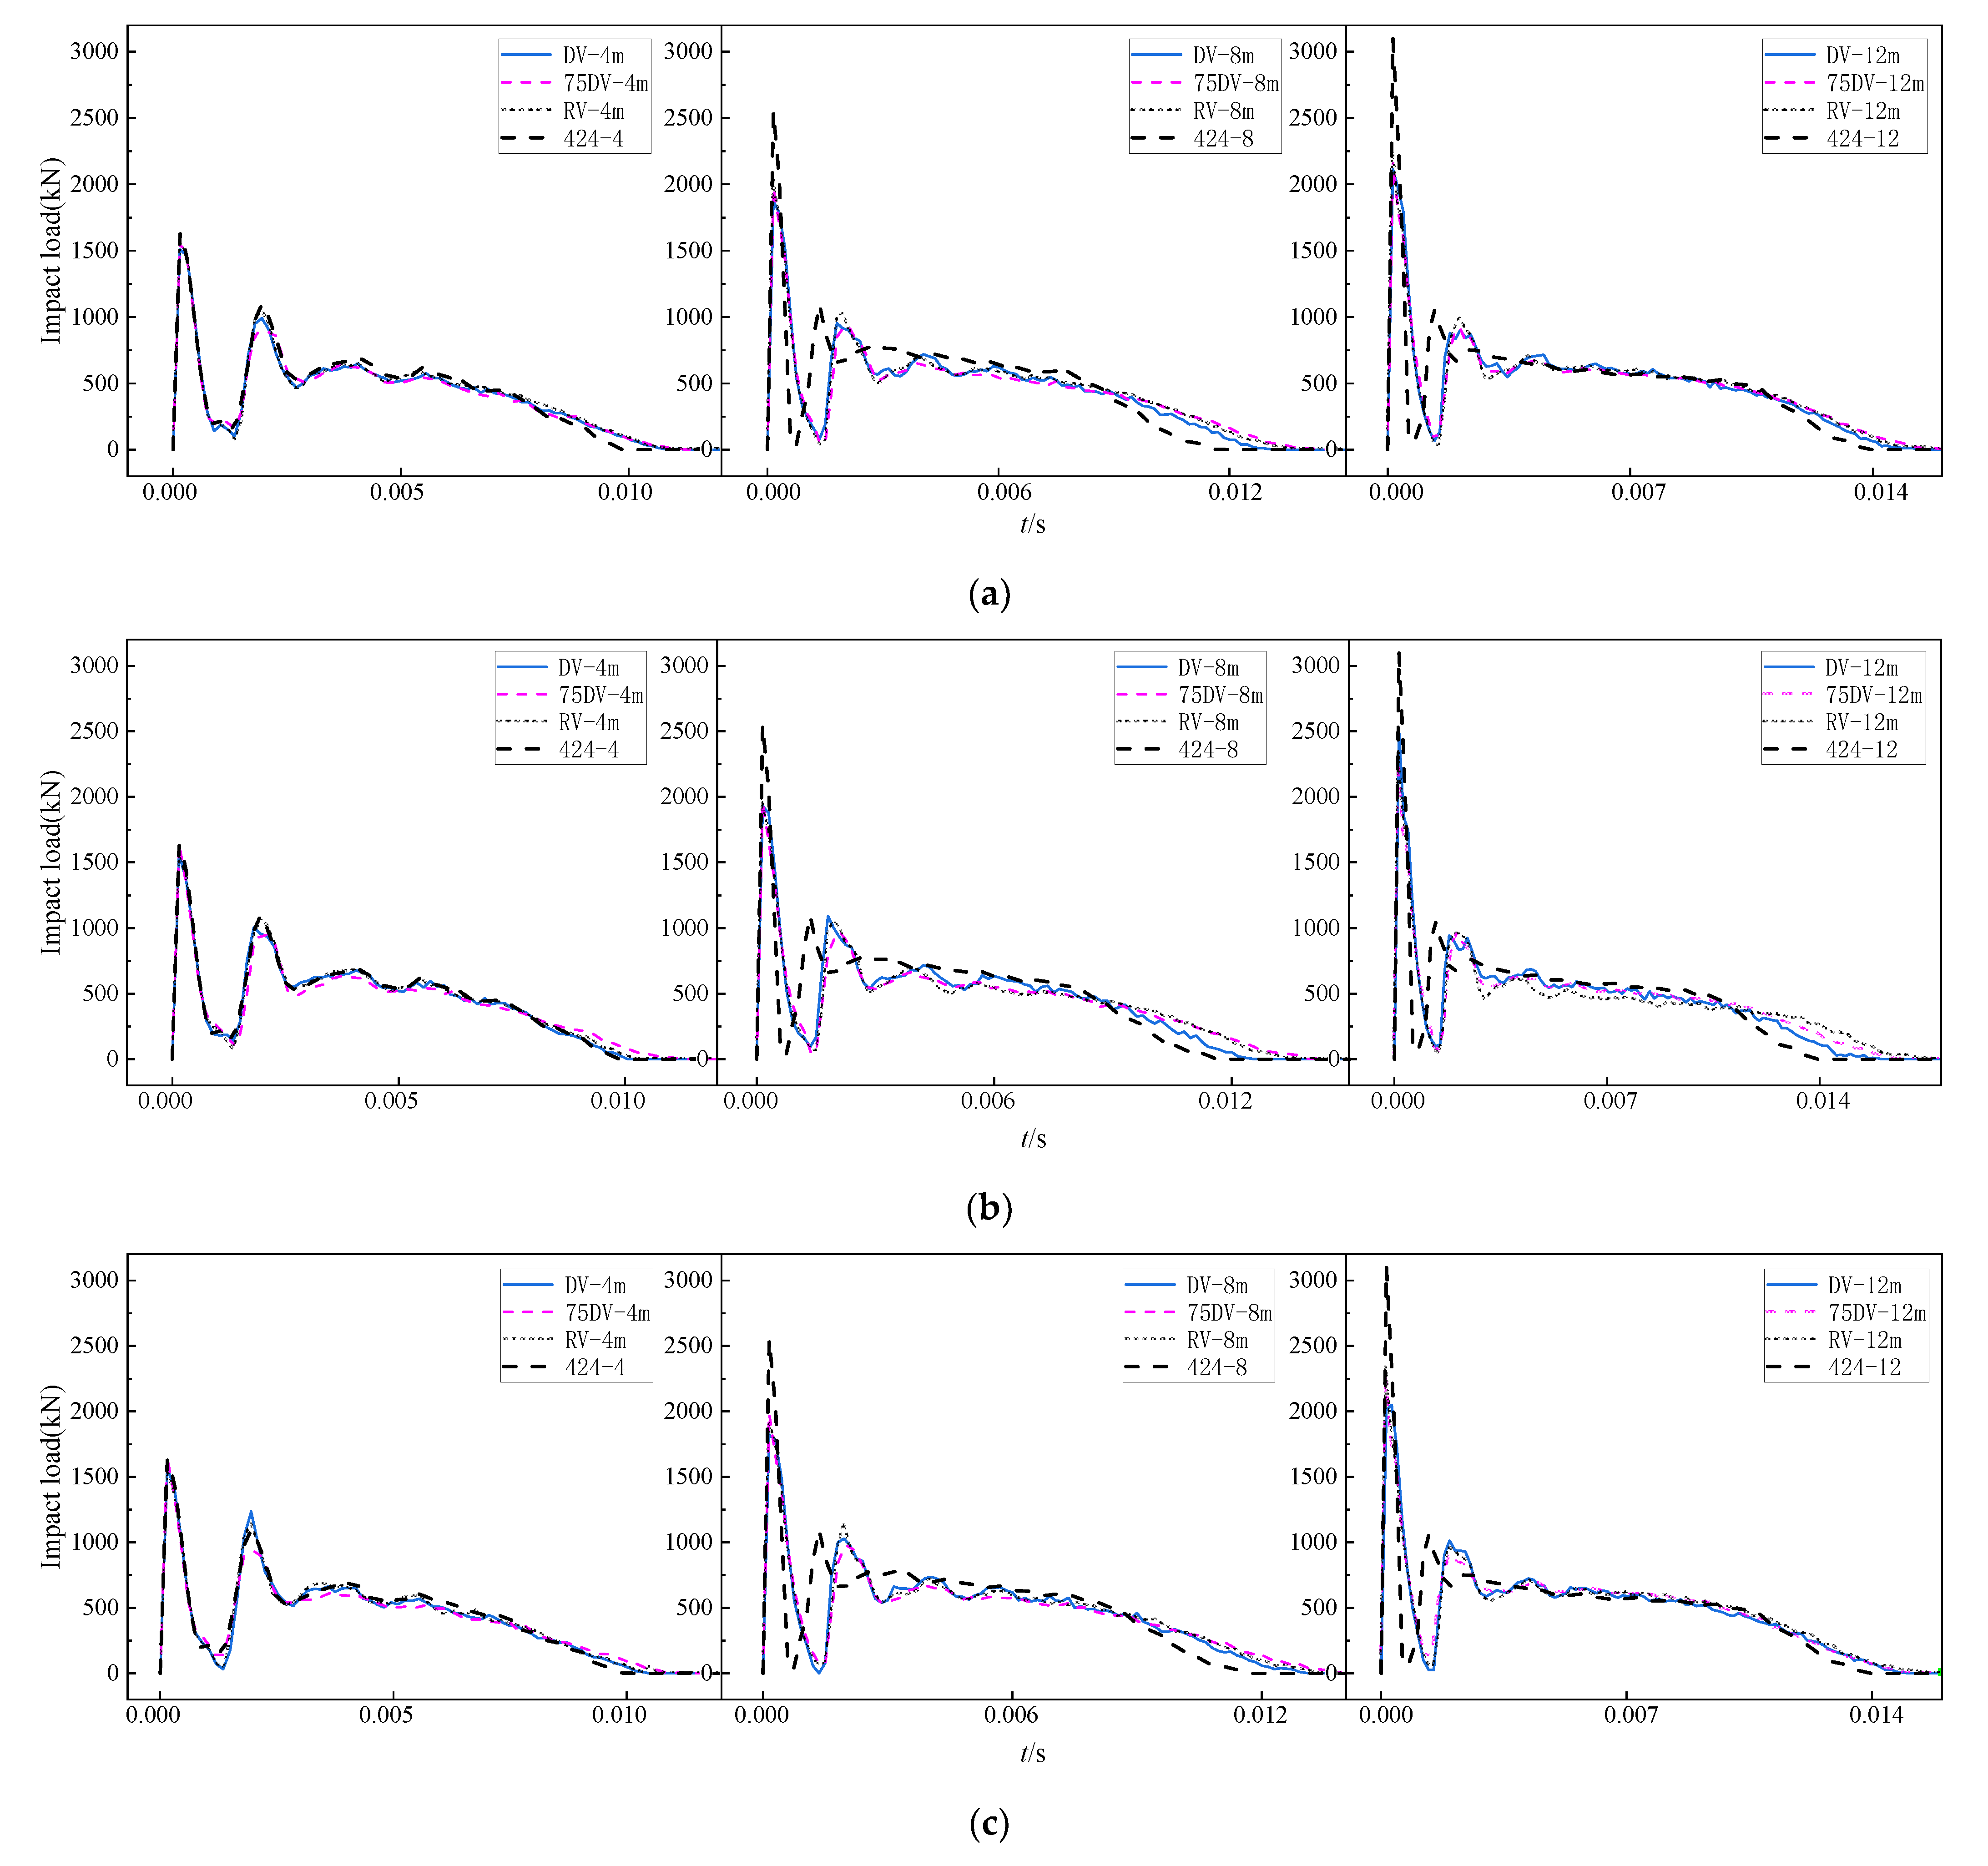
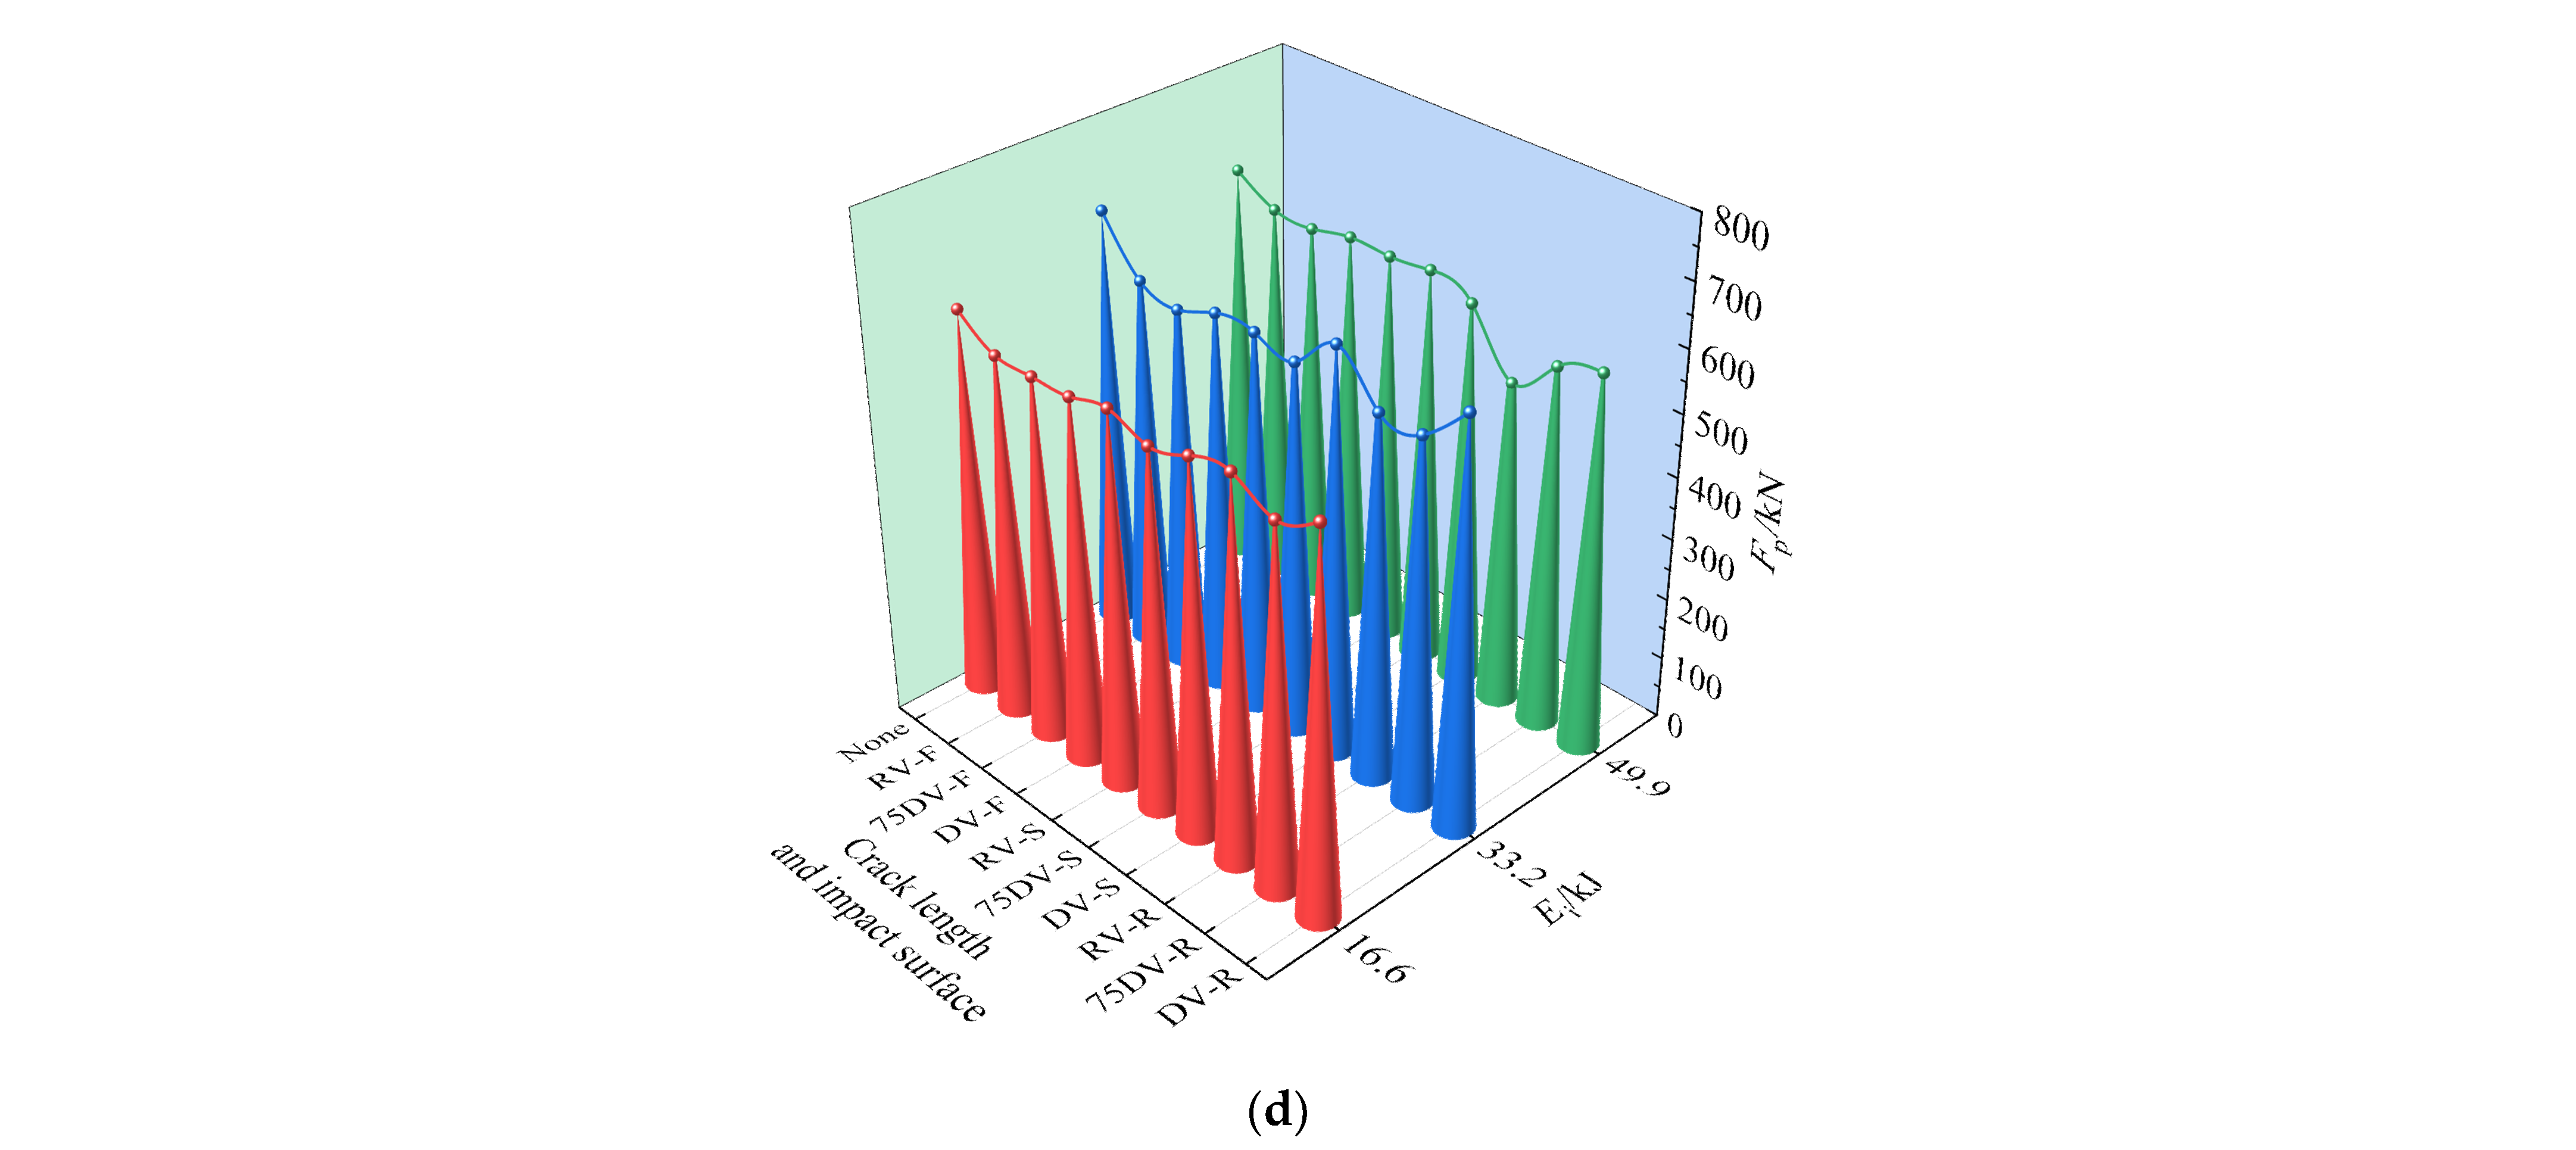
Buildings 12 00996 g017aBuildings 12 00996 g017b
Figure 18. Comparison of impact time history curve and impact platform value of vertical cracking model. (a) Front impact. (b) Rear impact. (c) Side impact. (d) Impact platform values of vertical crack model.
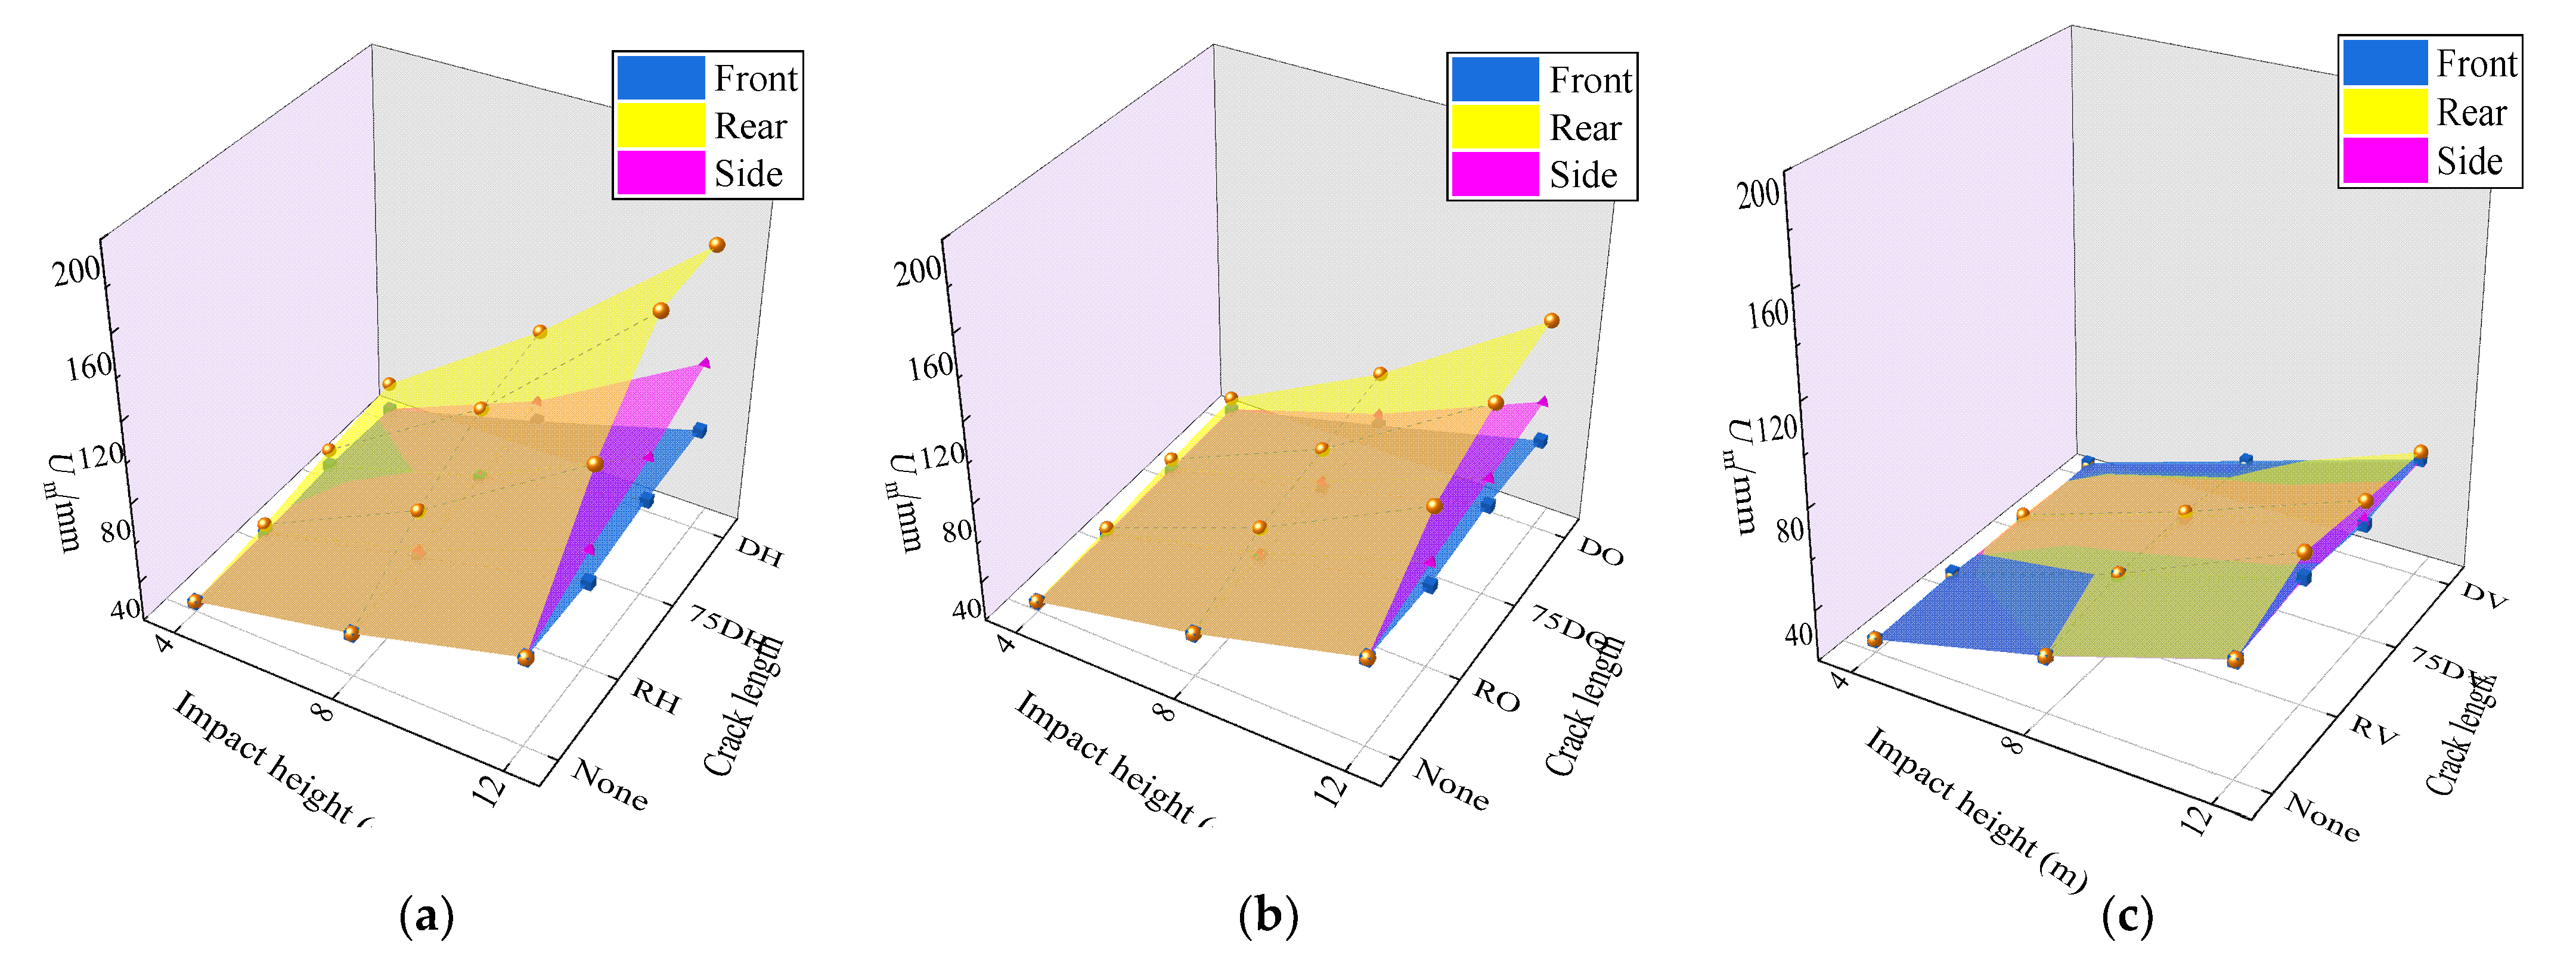
Buildings 12 00996 g018aBuildings 12 00996 g018b
Figure 19. Comparison of peak displacement of models. (a) Horizontal crack. (b) Oblique crack. (c) Vertical crack.
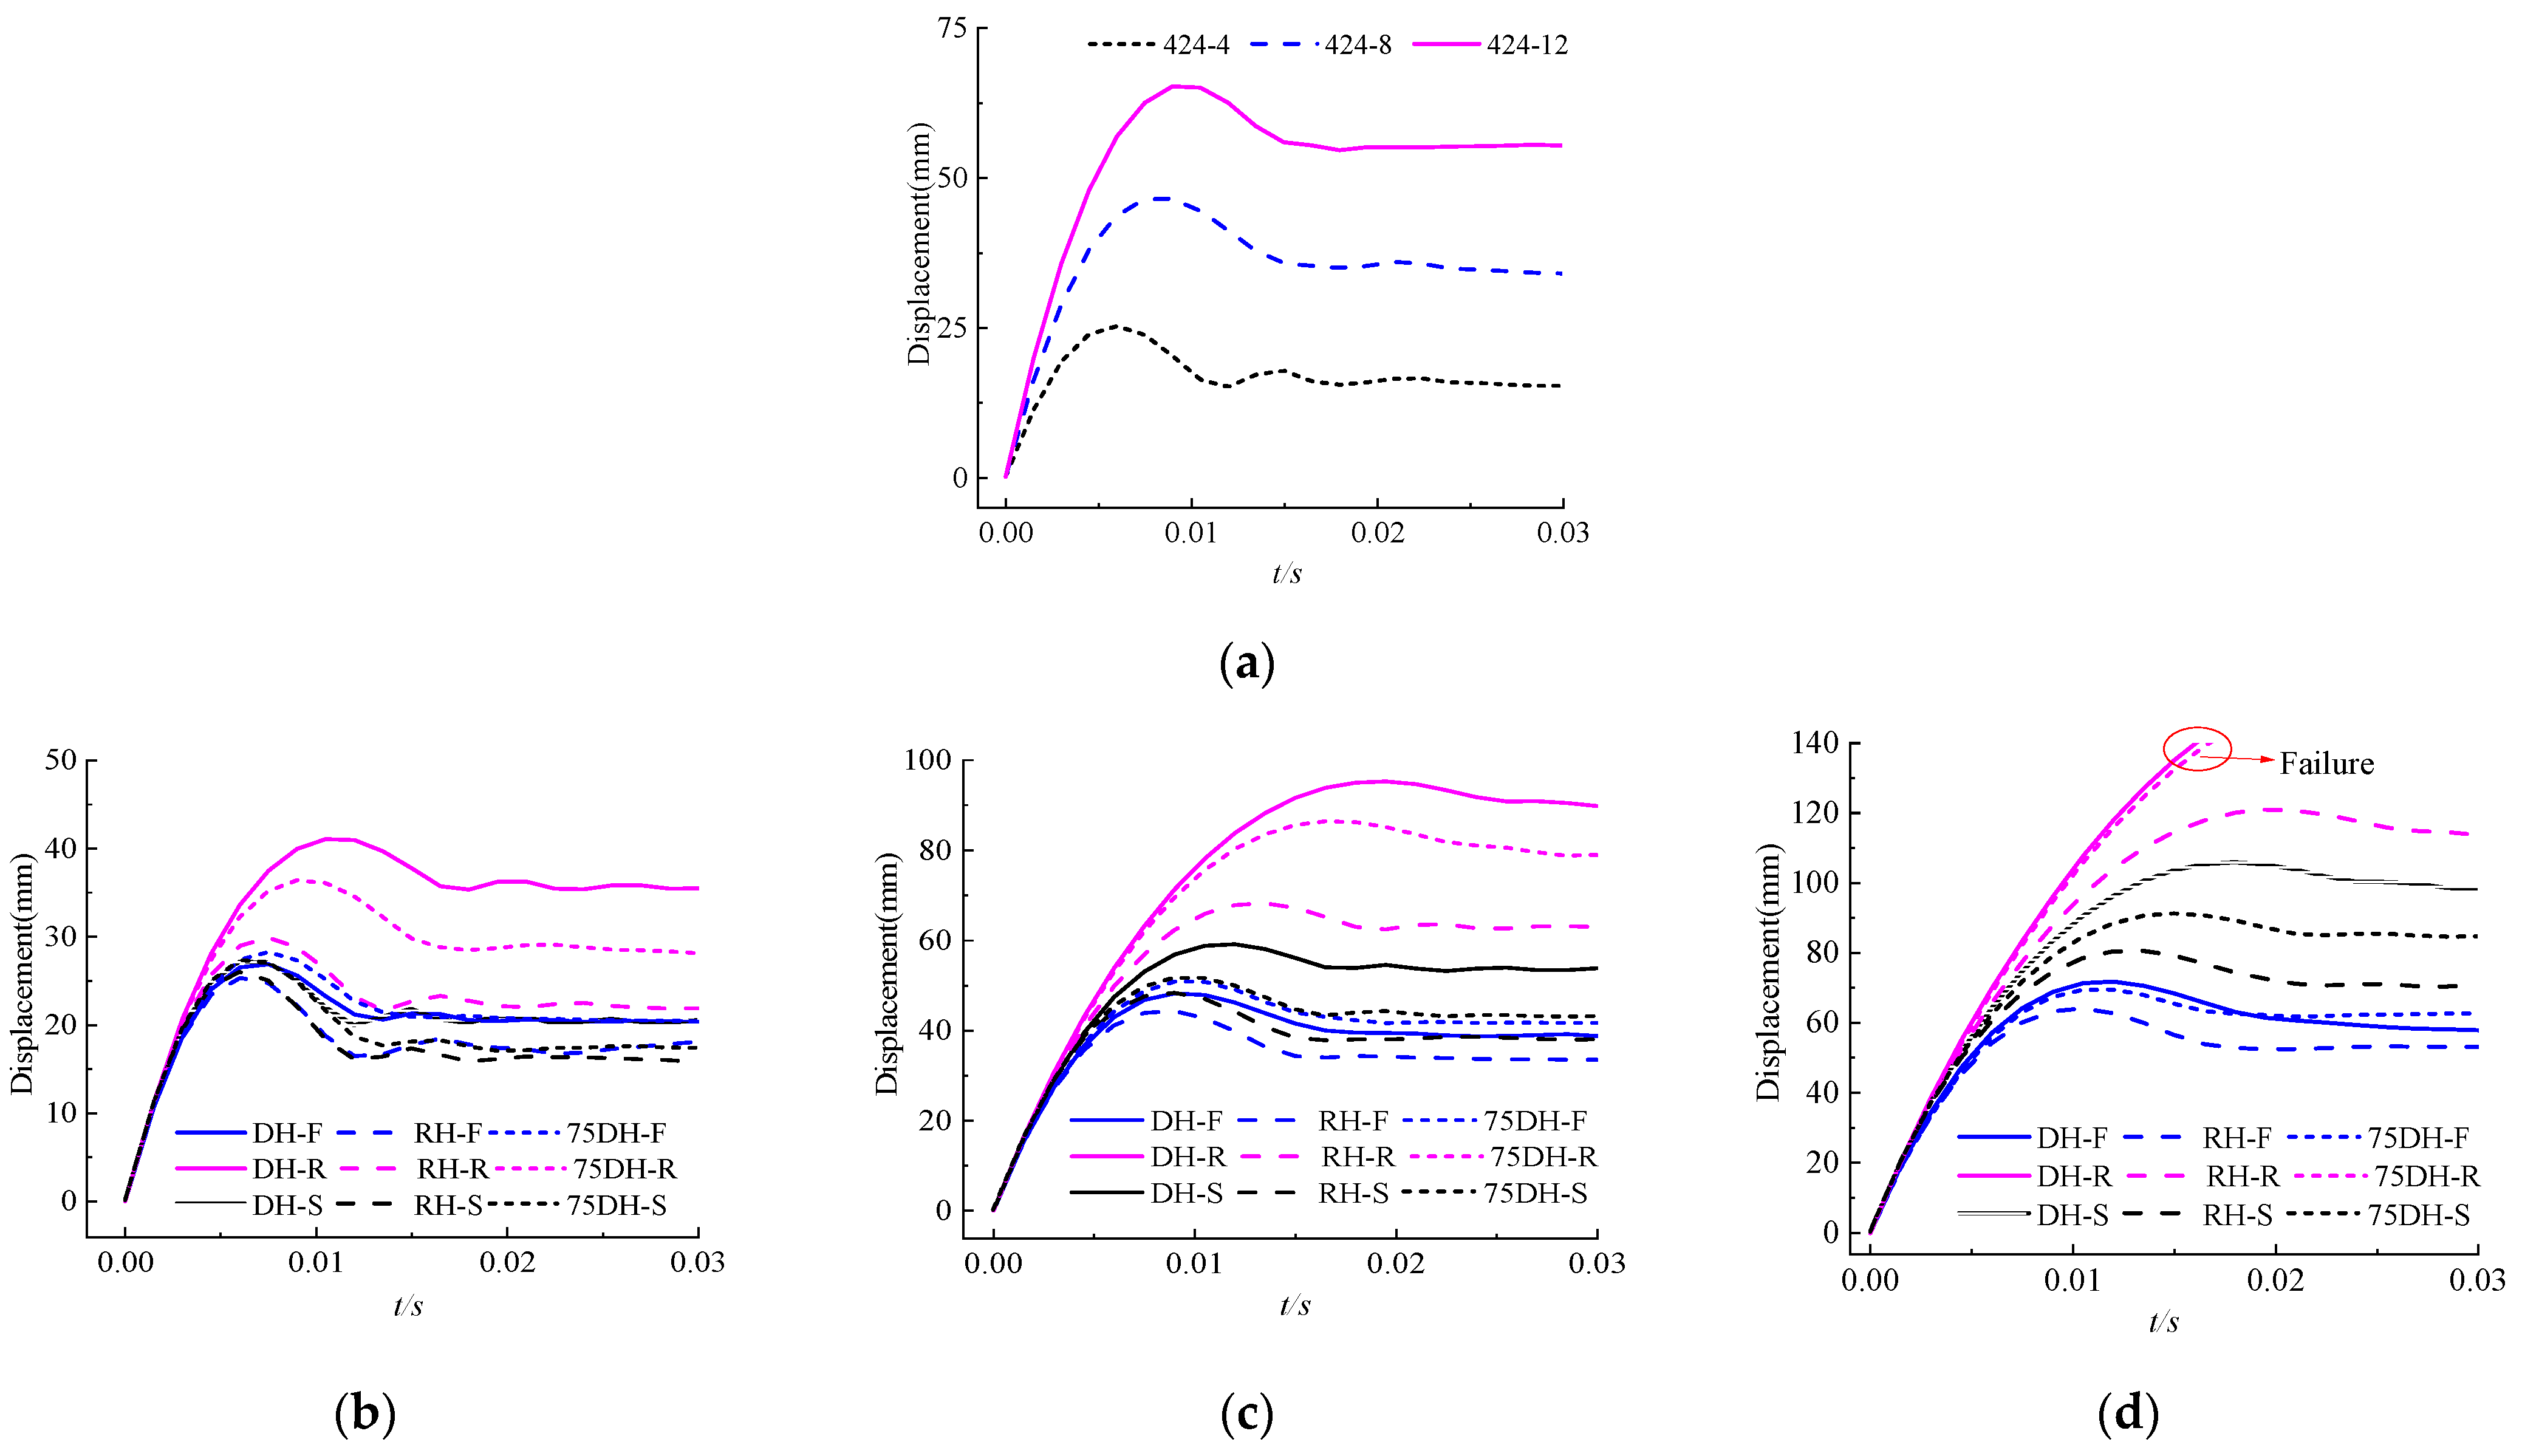
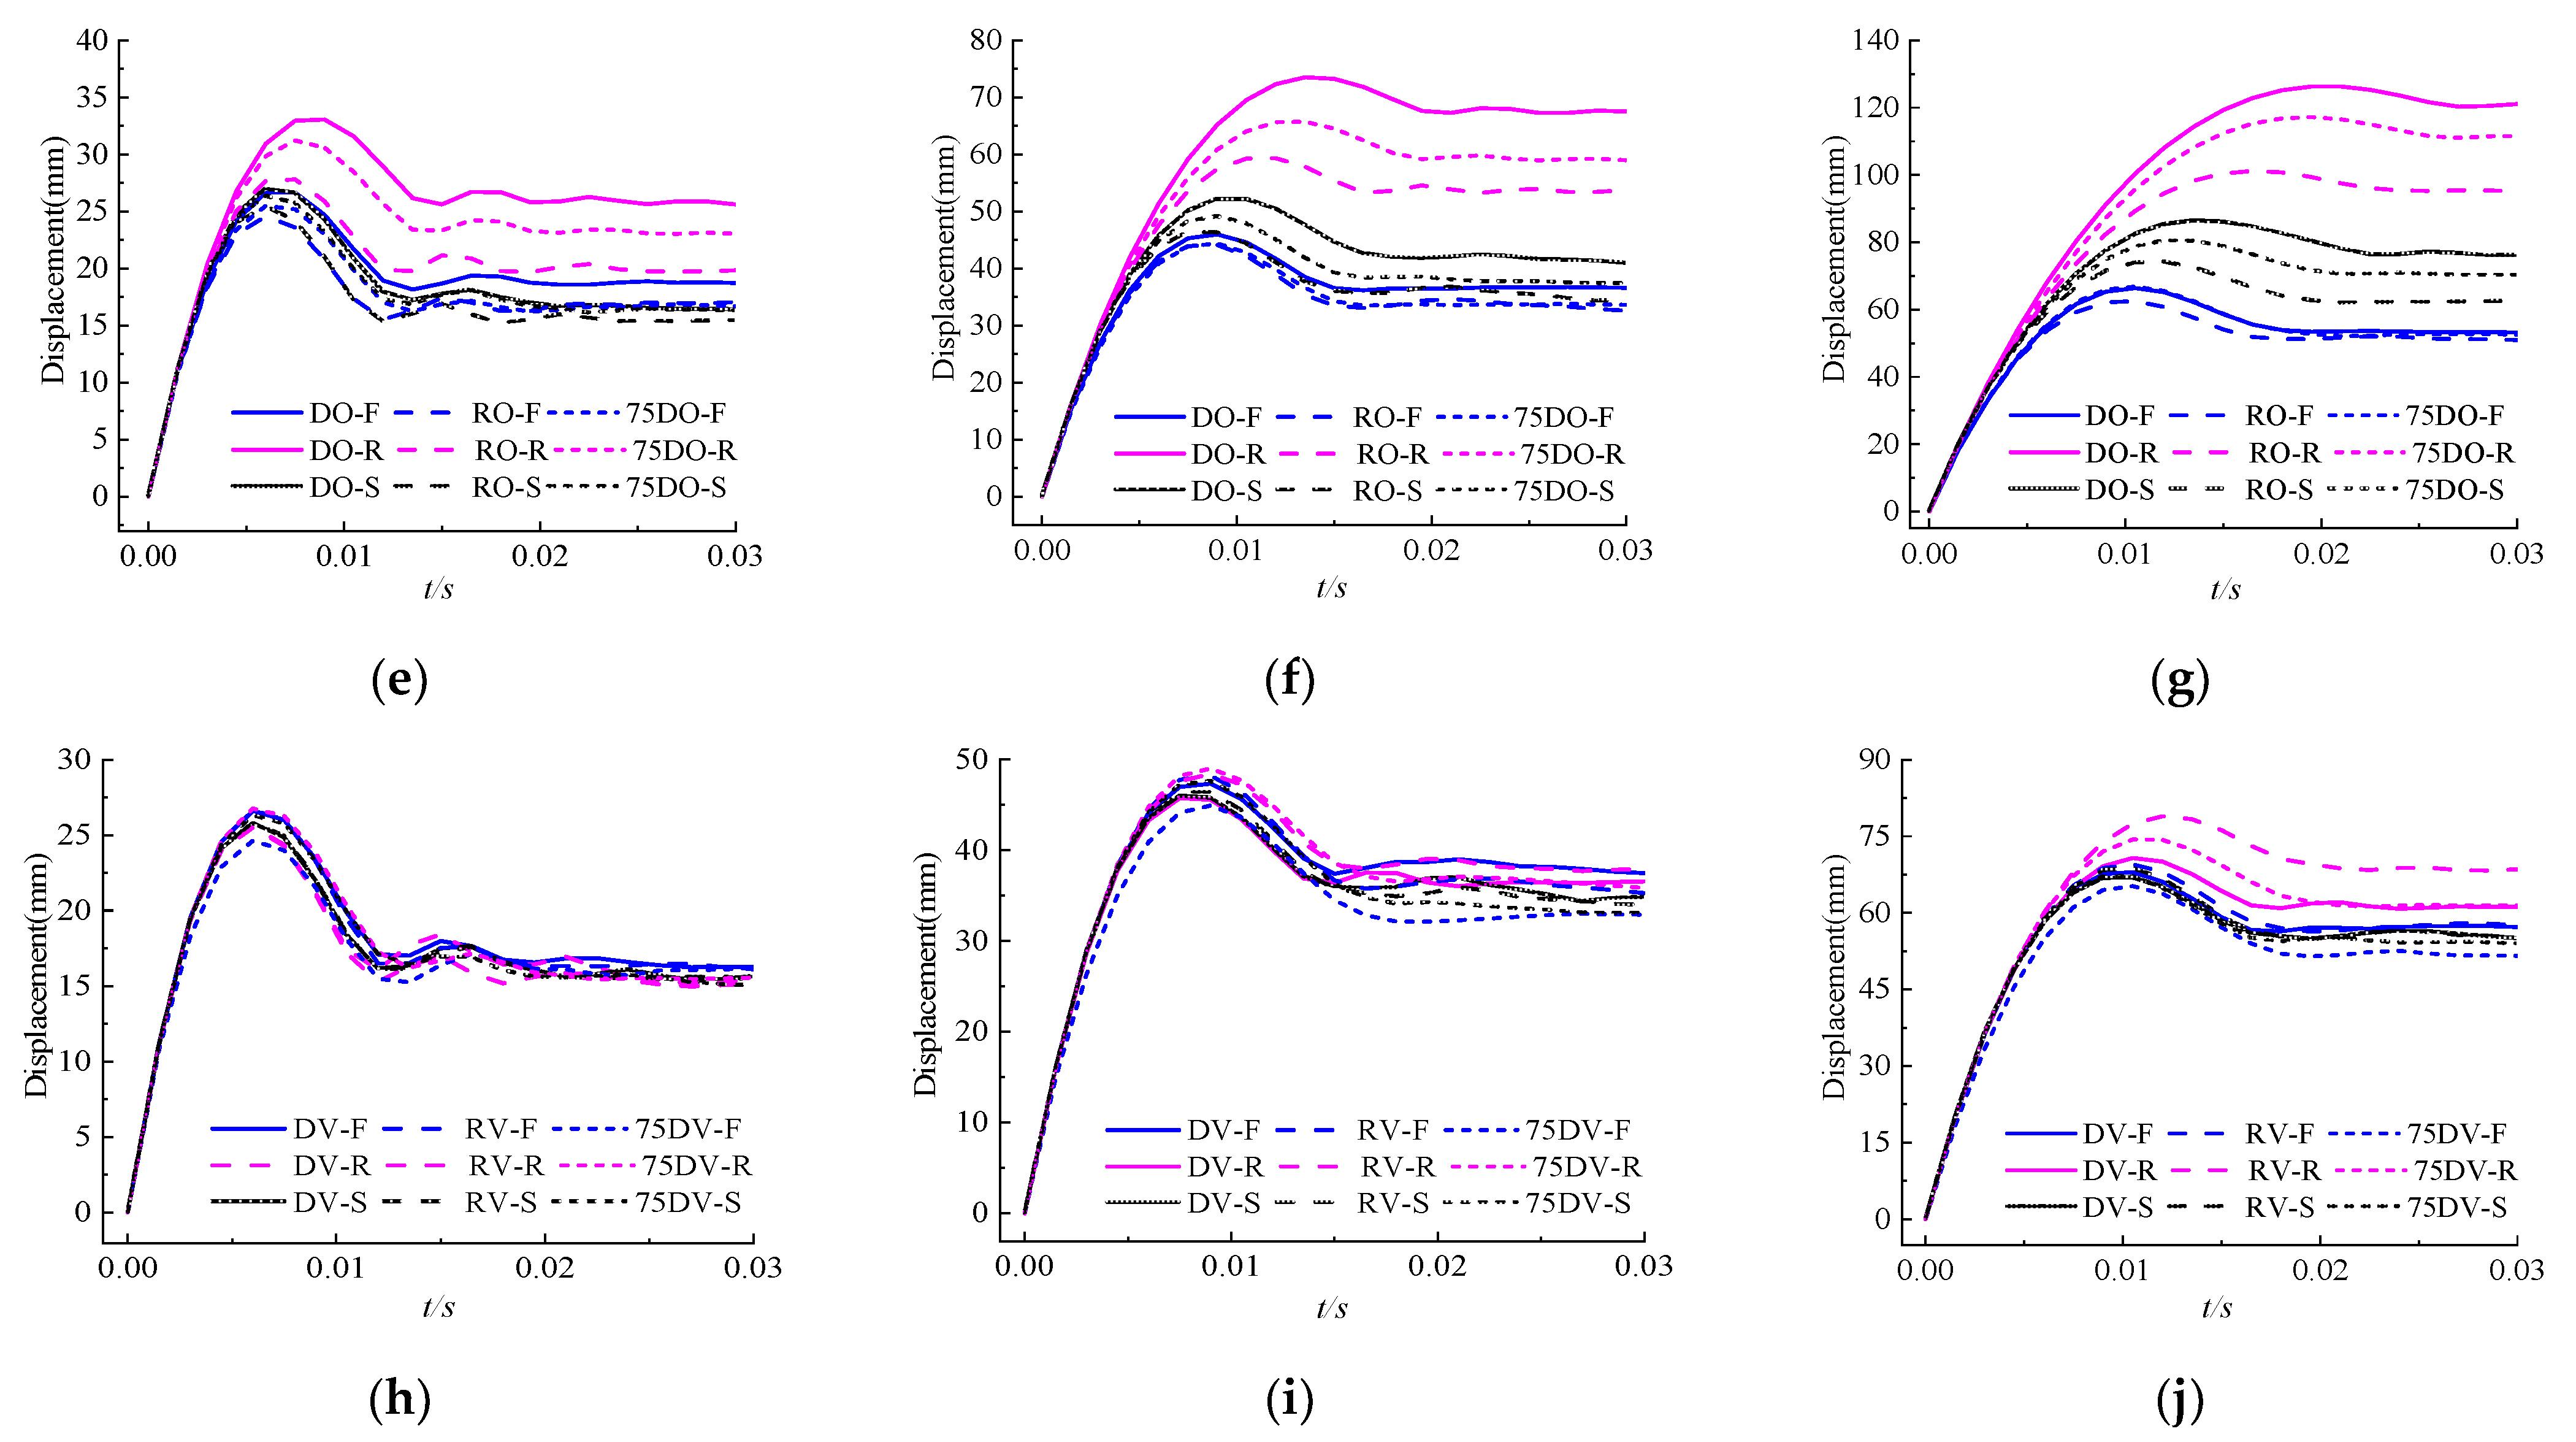
Buildings 12 00996 g019
Figure 20. Mid-span displacement time history curve of the models. (a) 424-4/8/12 (b) H-424-4. (c) H-424-8. (d) H-424-12. (e) O-424-4. (f) O-424-8. (g) O-424-12. (h) V-424-4. (i) V-424-8. (j) V-424-12.
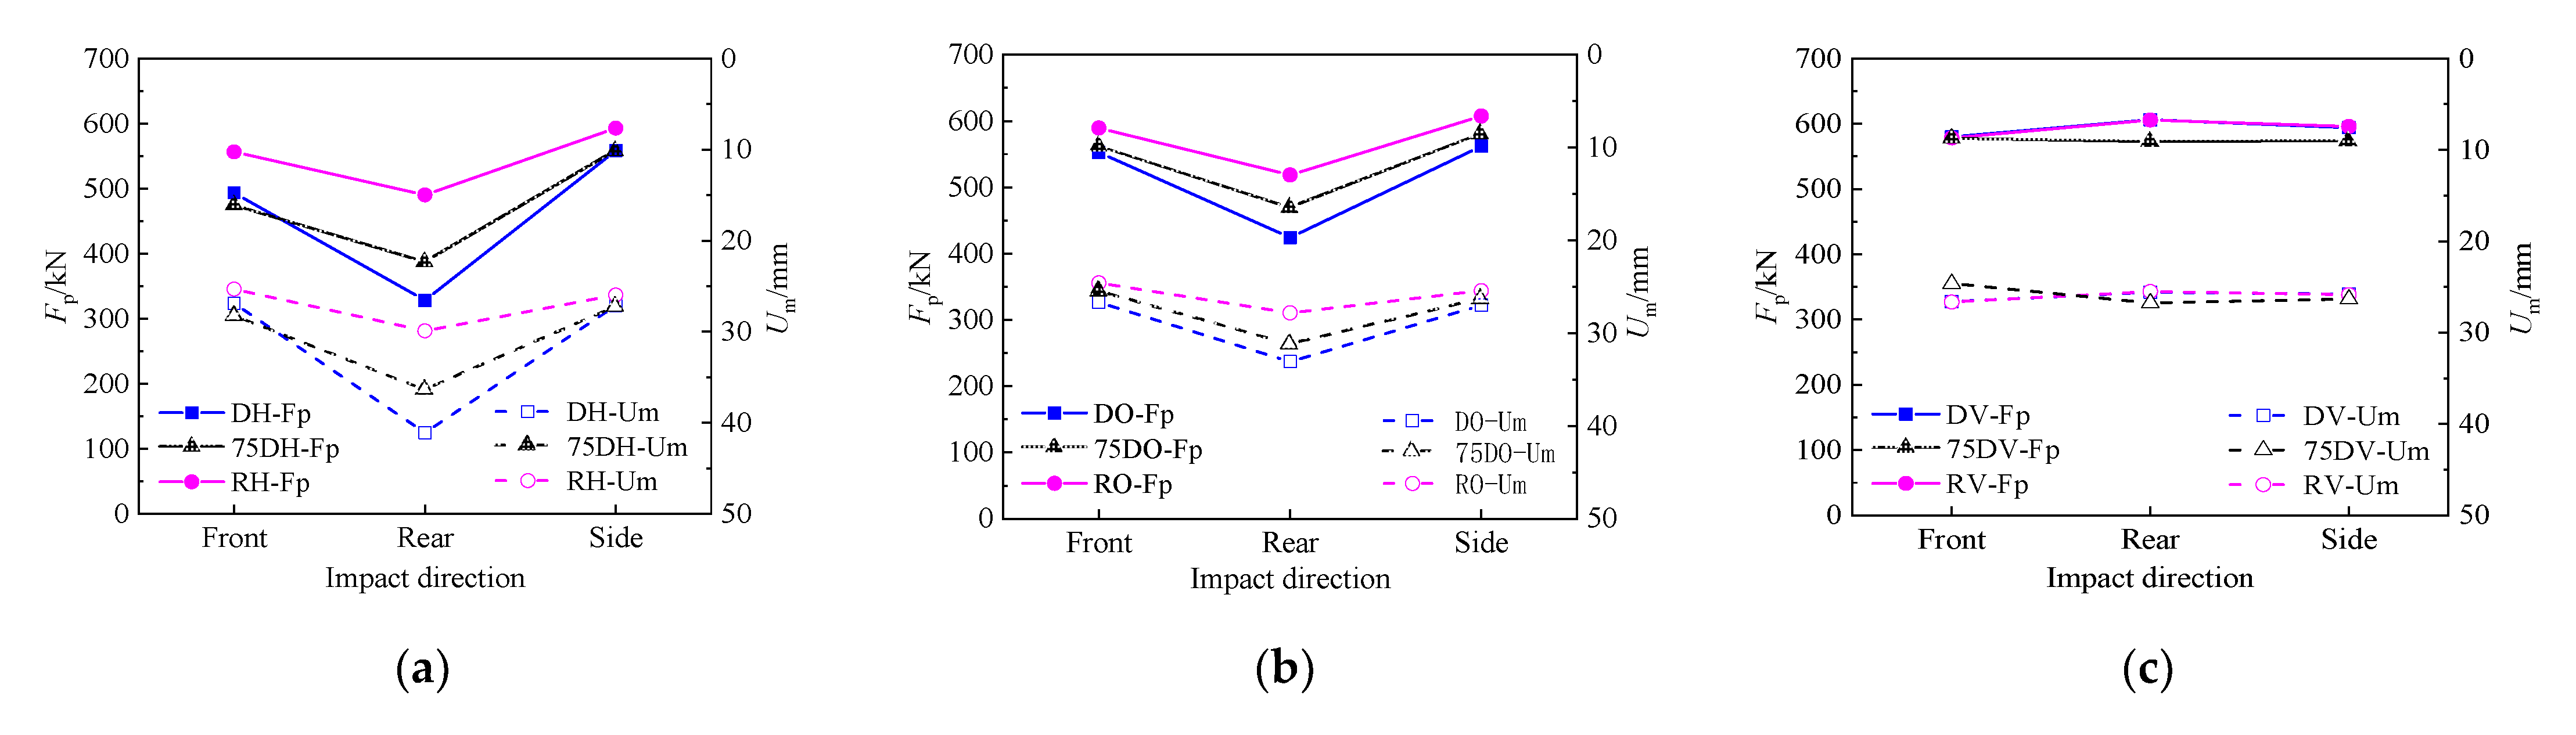
Buildings 12 00996 g020aBuildings 12 00996 g020b
Figure 21. Comparison of impact platform value and mid-span peak displacement of the model. (a) H-424-4. (b) O-424-4. (c) V-424-4. (d) H-424-8. (e) O-424-8. (f) V-424-8. (g) H-424-12. (h) O-424-12. (i) V-424-12.
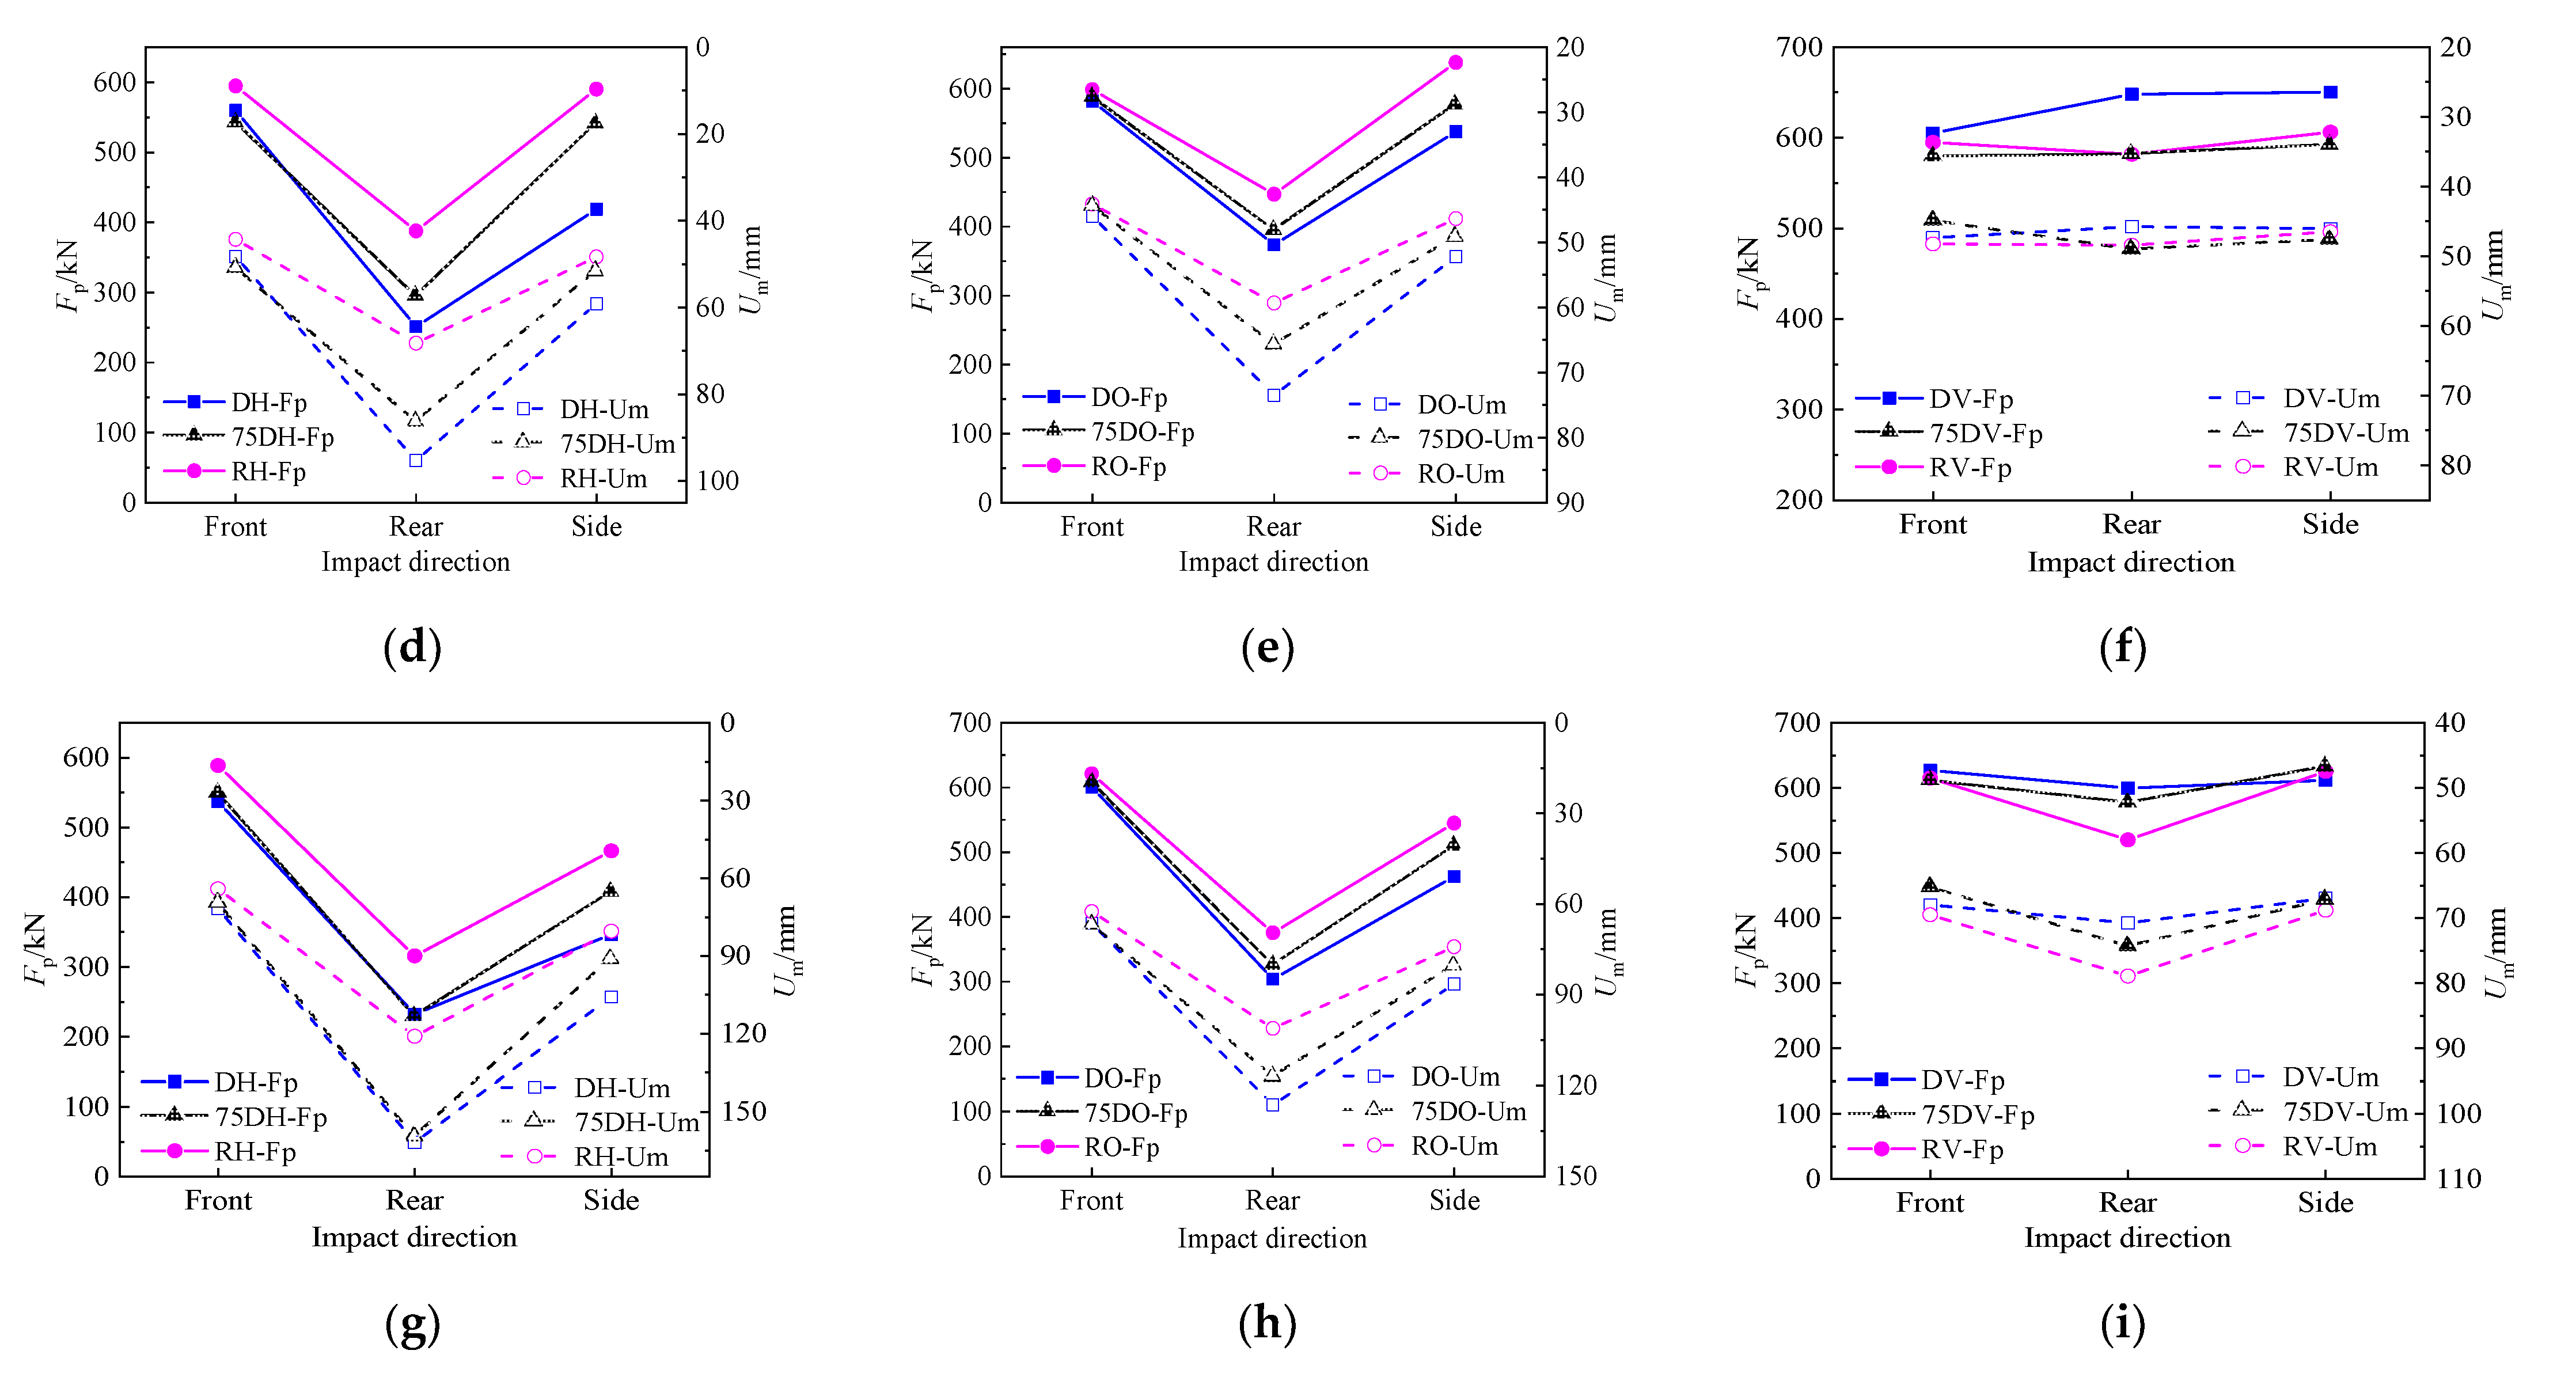
Buildings 12 00996 g021aBuildings 12 00996 g021b
Figure 22. Typical impact force mid-span deformation curve (RV-F-424-8).
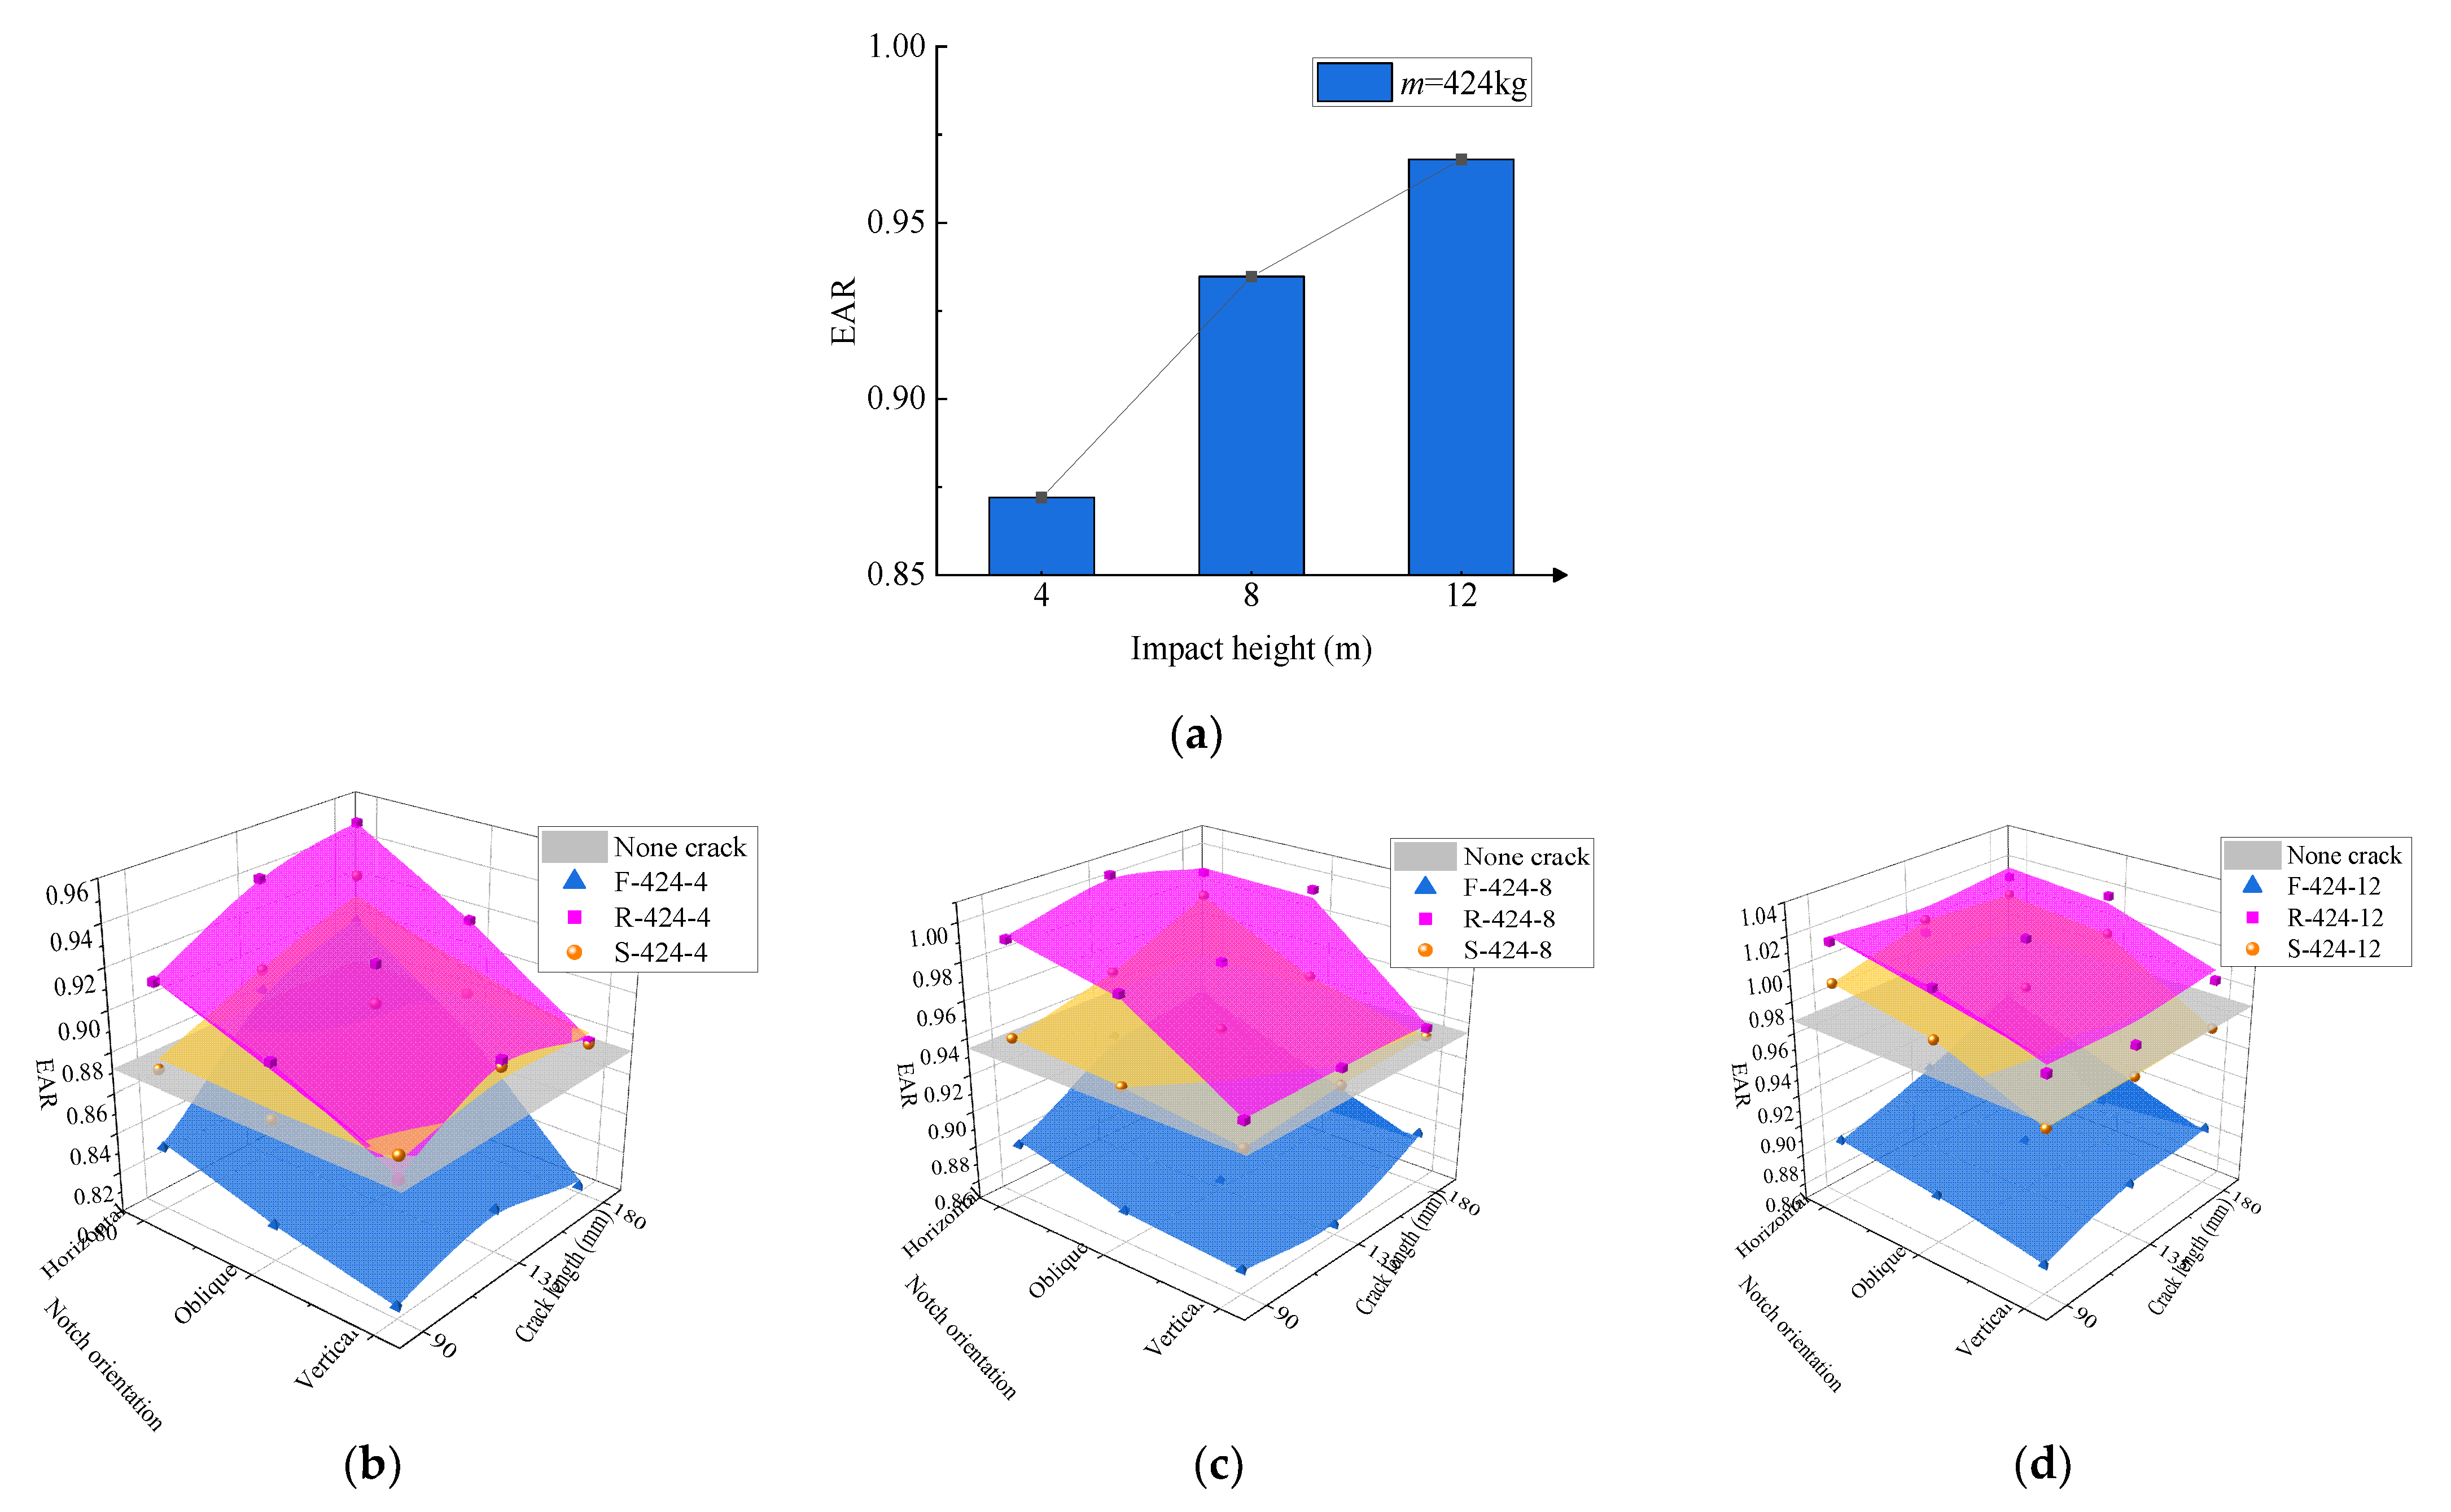
Buildings 12 00996 g022
Figure 23. Comparison of energy absorption ratio. (a) 424-4/8/12. (b) Impact height: 4 m. (c) Impact height: 8 m. (d) Impact height: 12 m.
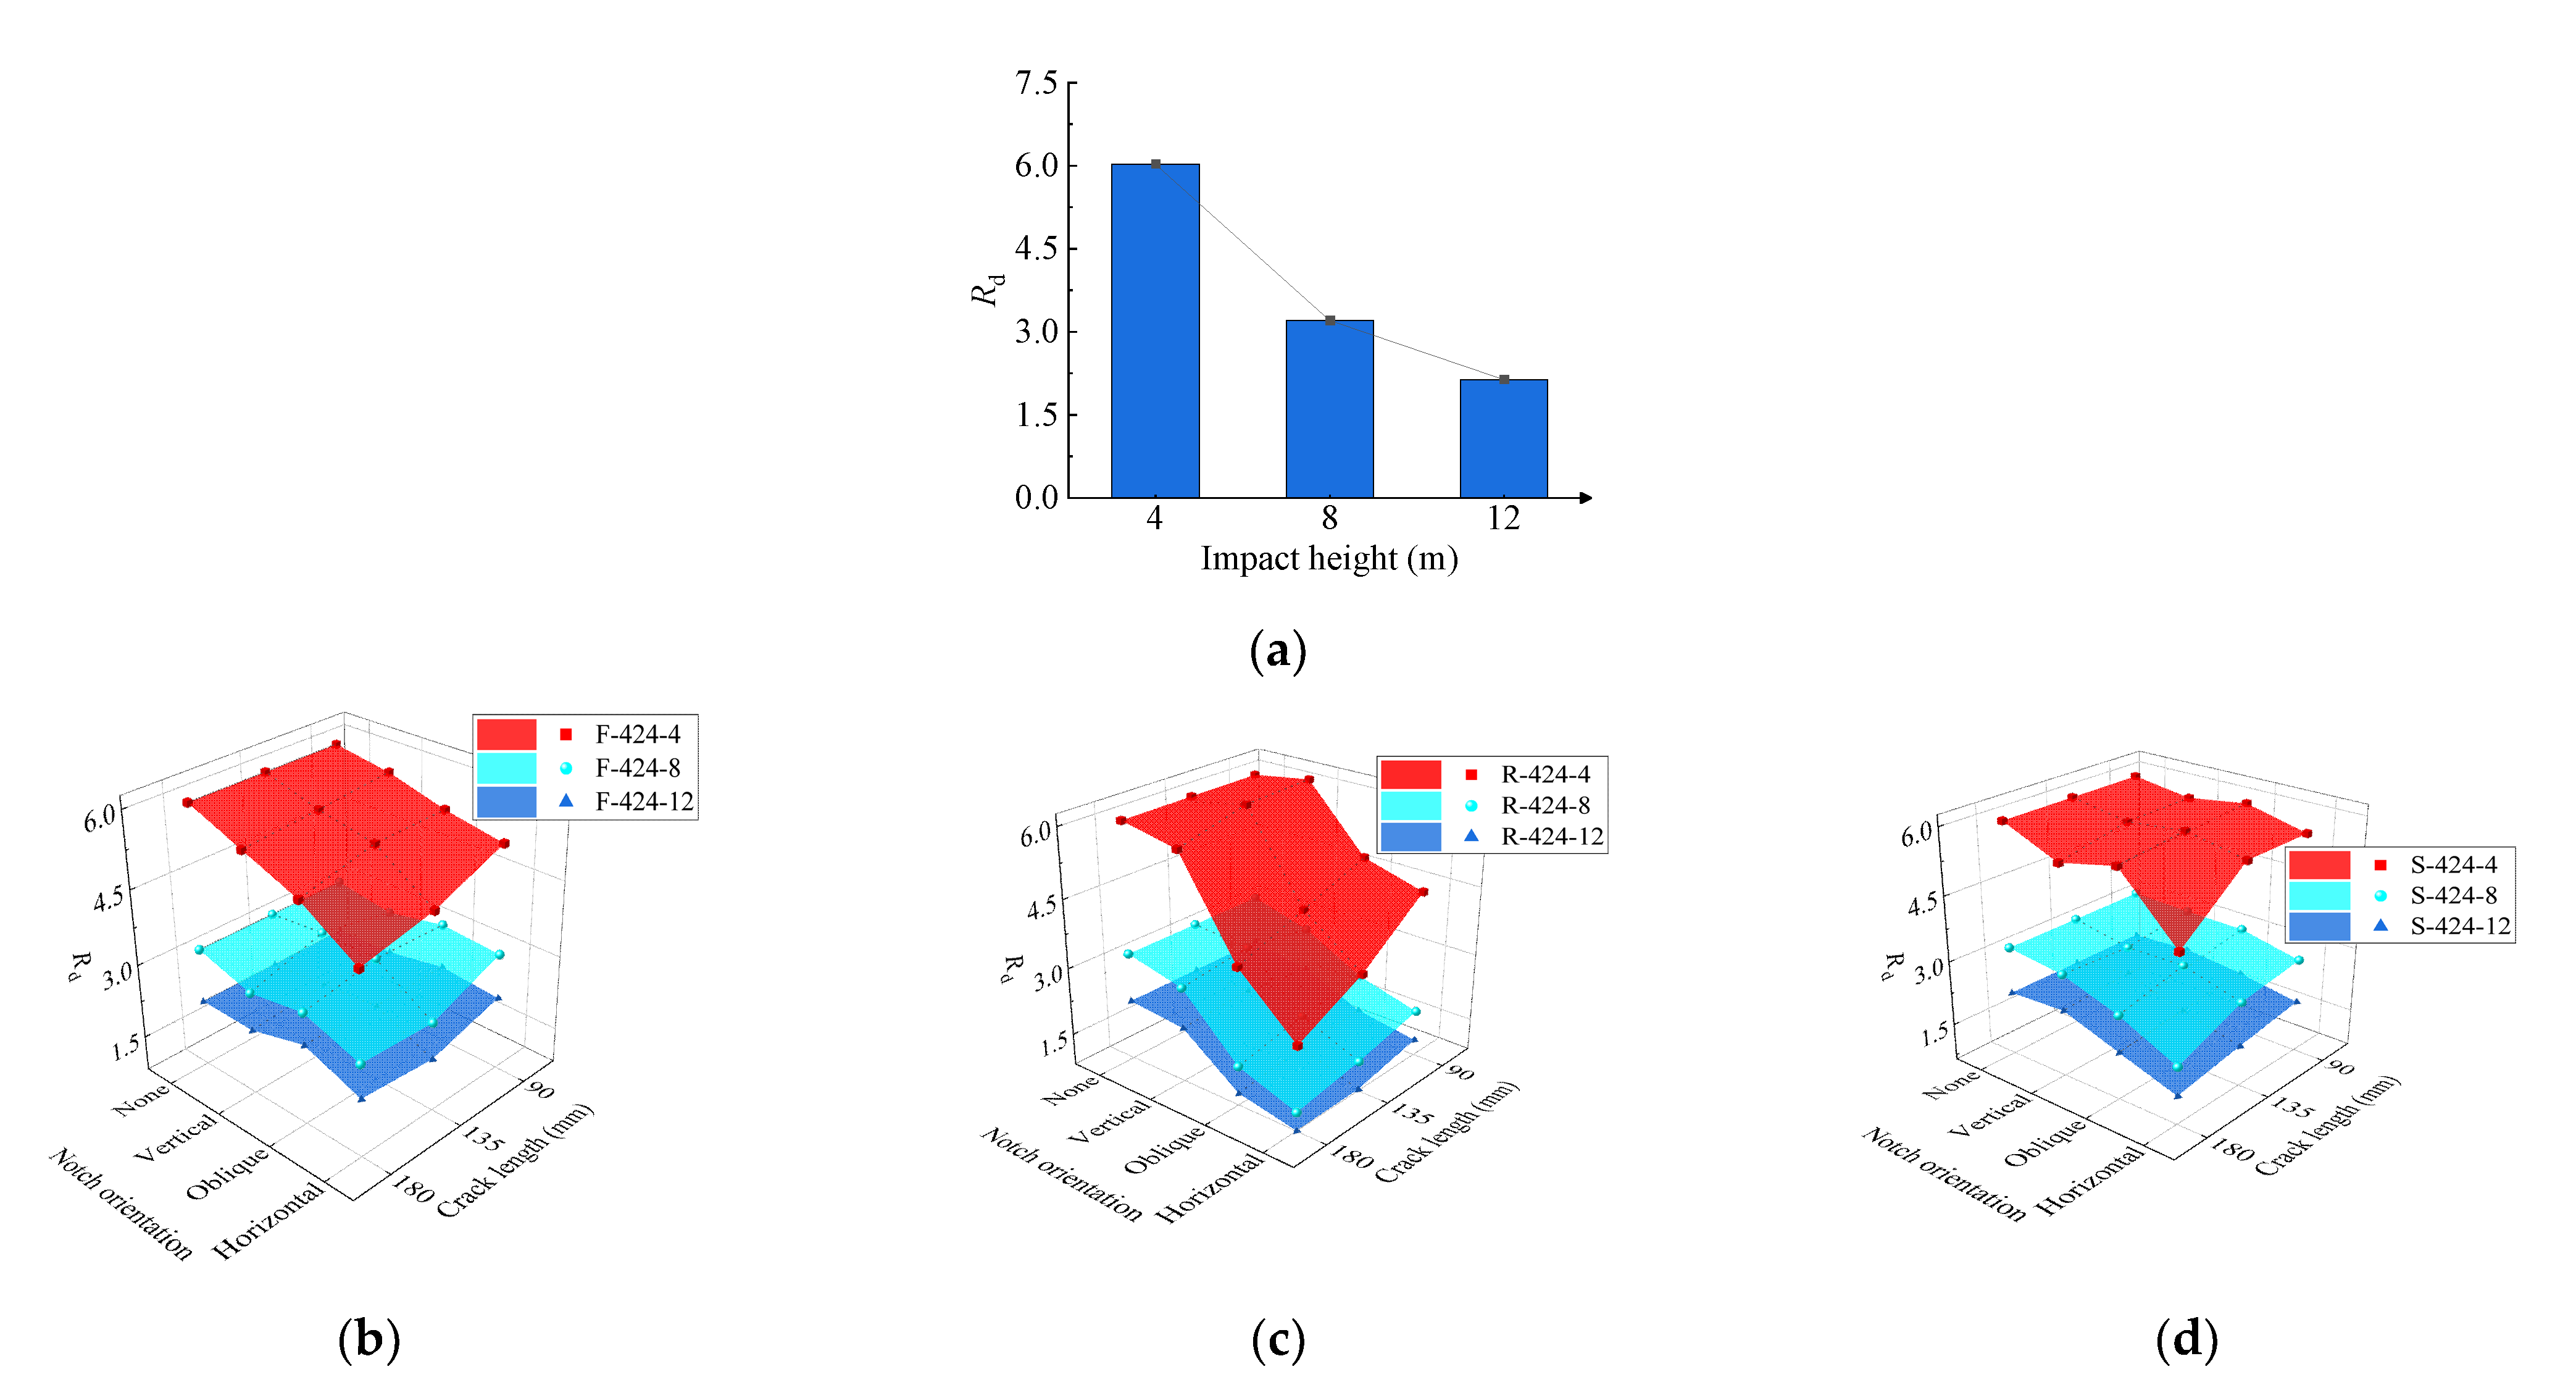
Buildings 12 00996 g023
Figure 24. Comparison of the influencing factors of Rd. (a) 424-4/8/12. (b) Front impact. (c) Rear impact. (d) Side impact.
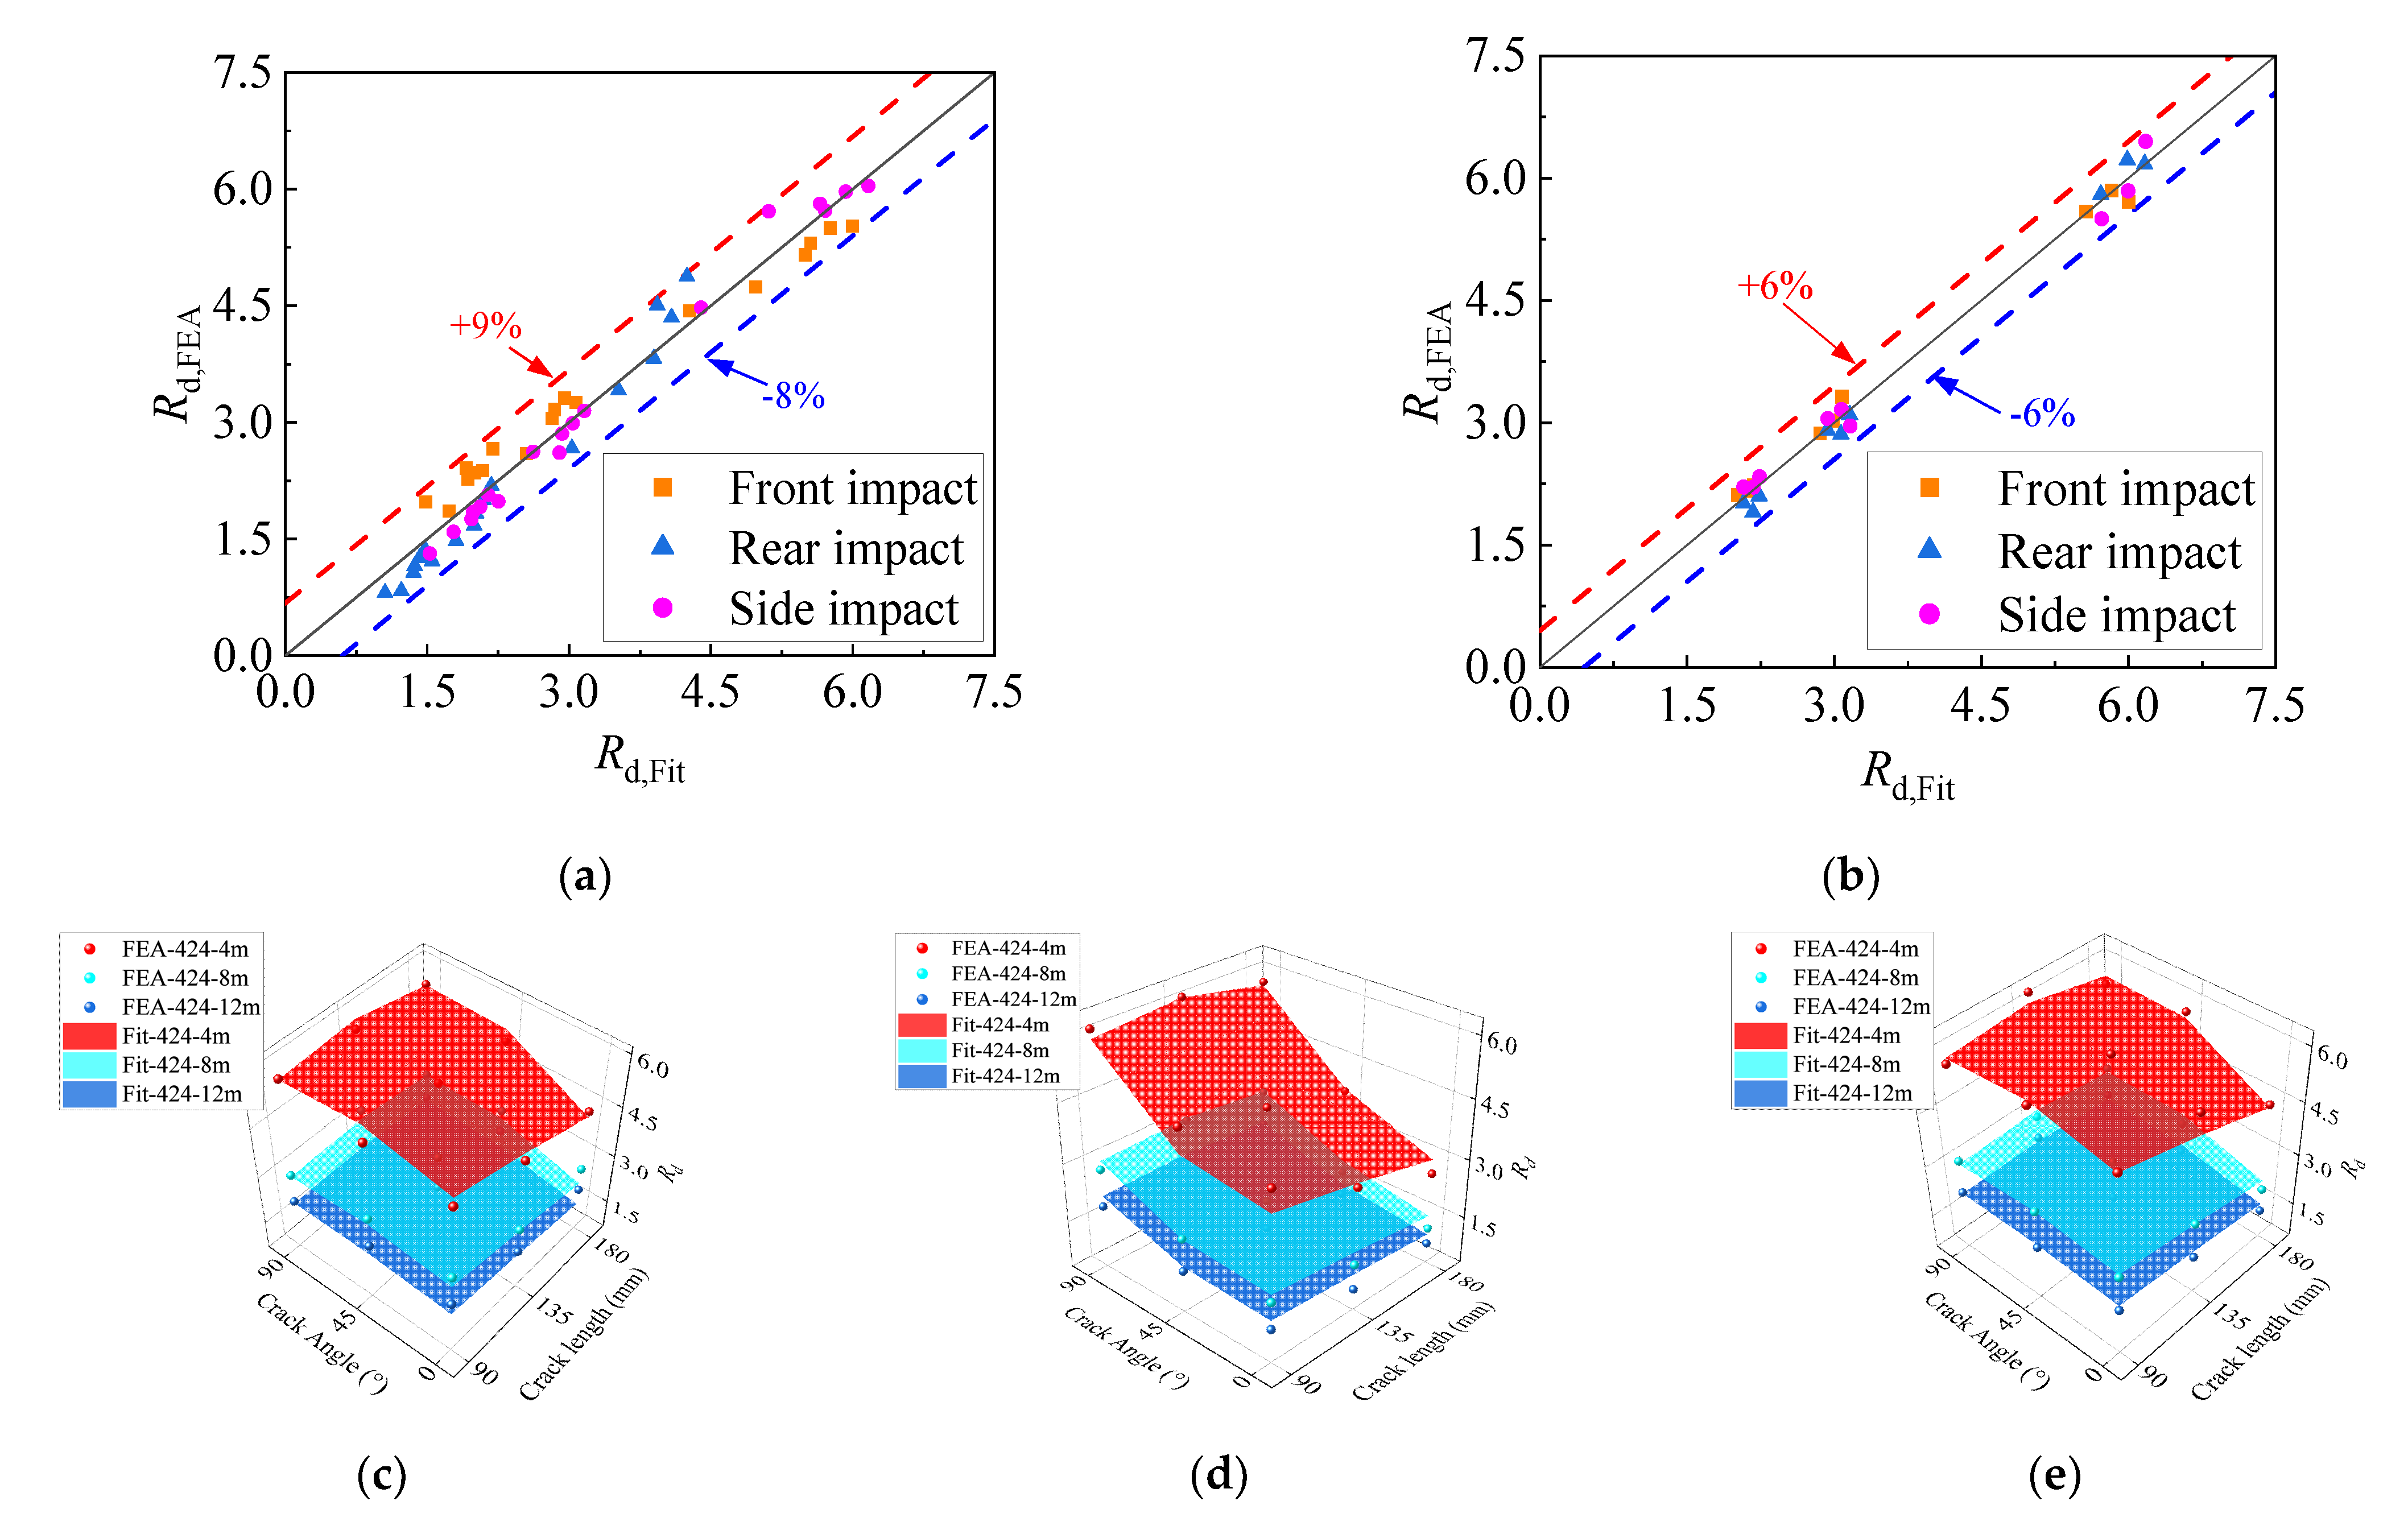
Buildings 12 00996 g024
Figure 25. Comparison of simulated and fitted values of Rd. (a) θ = 0 o ~ 45 o . (b) θ = 90 o . (c) Front impact. (d) Rear impact. (e) Side impact.
Buildings 12 00996 g025
Table 1. Parameters of the HSCFST model.
Model NumberImpact SurfaceCrack Length lc/mm Crack   Angle   θ / ( ° ) Impact Height H/mImpact Mass m/kgImpact Energy Ei/kJ
F/R/S180/135/90H/O/V4/8/12
424-4/8/12------4/8/1242416.6/33.2/49.9
DH/DO/DV-F-424-4/8/12F1DH/O/V4/8/1242416.6/33.2/49.9
75DH/75DO/75DV-F-424-4/8/12F0.75DH/O/V4/8/1242416.6/33.2/49.9
RH/RO/RV-F-424-4/8/12F0.5DH/O/V4/8/1242416.6/33.2/49.9
DH/DO/DV-R-424-4/8/12R1DH/O/V4/8/1242416.6/33.2/49.9
75DH/75DO/75DV-R-424-4/8/12R0.75DH/O/V4/8/1242416.6/33.2/49.9
RH/RO/RV-R-424-4/8/12R0.5DH/O/V4/8/1242416.6/33.2/49.9
DH/DO/DV-S-424-4/8/12S1DH/O/V4/8/1242416.6/33.2/49.9
75DH/75DO/75DV-S-424-4/8/12S0.75DH/O/V4/8/1242416.6/33.2/49.9
RH/SO/SV-S-424-4/8/12S0.5DH/O/V4/8/1242416.6/33.2/49.9
Note: impact surface: F for front, R for rear, S for side; crack length: 1D = 180 mm, 0.75D = 135 mm, 0.5D = 90 mm; crack angle: H for 0°, O for 45°, V for 90°.
Table 2. Material parameters of steel.
Density (kg/m3)fy (MPa)fu (MPa)Es (105MPa)Poisson’s RatioElongation
78507227581.960.30.15
Table 3. Material constants of S690.
A (MPa)B (MPa)Cqd
7274000.060.570.23
Table 4. Material parameters of concrete.
e α f K c μ / 10 3 φ / ( ° )
0.11.160.66670.530
Table 5. Chemical composition of steel (in mass %).
CSiMnSPNNiMoCrCuVTiNbCEV
0.140.291.260.00060.0140.00180.020.110.20.010.0030.0230.0150.42
Table 6. Mix proportion of C100 concrete.
Water Cement RatioWater kg/m3Cement kg/m3Sand kg/m3Gravel kg/m3Silica Fume kg/m3Superplasticizer kg/m3
0.2212150062311565010
Table 7. Application scope of the practical formula of Rd.
l c / mm θ / ( o ) β E i / kJ
90~1800~90°0, 0.5, 116.6~49.9
Publisher’s Note: MDPI stays neutral with regard to jurisdictional claims in published maps and institutional affiliations.

