Article

Mesoscale Study on Dilation Behavior of Plain Concrete under Axial Compression

1
Department of Engineering Mechanics, Shijiazhuang Tiedao University, Shijiazhuang 050043, China
2
Hebei Key Laboratory of Mechanics of Intelligent Materials and Structures, Shijiazhuang Tiedao University, Shijiazhuang 050043, China
3
Department of Construction Engineering, Hebei Petroleum University of Technology, Chengde 067000, China
*
Author to whom correspondence should be addressed.
Buildings 2022, 12(7), 908; https://doi.org/10.3390/buildings12070908
Submission received: 21 May 2022 / Revised: 19 June 2022 / Accepted: 23 June 2022 / Published: 27 June 2022
(This article belongs to the Special Issue Sustainability and Resiliency of Building Materials and Structures)

Abstract

:
The dilation of concrete in the radial direction is crucial in understanding the failure process and the key to predicting the confining level of passively confined concrete. To better understand this problem, we established a mesoscale model of concrete by considering the random distribution of coarse aggregate and the different properties between mortar and concrete. The model’s validity was demonstrated by comparing with the stress–strain curves in code and the lateral–axial strain curves in test. The simulation results show that the lateral dilation is non-uniformly distributed along the specimen height and the circumferential direction of sections. Moreover, the deformation mainly occurs in the middle part of the specimen ranging from 3/8 to 5/8. The strength of concrete influences the stress ratio at maximum compressive strain, while it slightly influences the stress ratio at zero volumetric strain. The secant strain ratio is about 0.5 as the compressive stress reaches the strength of concrete. Compared with the simulation, the relationship between lateral strain and axial strain proposed by Teng and Binici shows excellent performance on the dilation trend prediction of plain concrete.

1. Introduction

As a composite material, concrete is widely used in buildings, bridges, tunnels, water conservancies, and other engineering projects due to its advantages, such as economy, convenience, high strength, and excellent durability. The economic and safe design of such structures cannot be realized until a deep understanding of the mechanical behavior of concrete is available. At present, the research mainly focuses on the analysis of concrete in the longitudinal direction [1,2,3,4,5,6,7,8,9,10], while research on the dilation behavior of concrete in the radial direction is relatively limited. Relevant research is crucial in understanding the failure process of concrete. Moreover, it is also the key to predicting the mechanical behavior of passively confined concrete, because the performance of the developed model depends on how well it captures the dilation tendency of concrete.
The dilation of plain concrete under axial load has attracted the interest of several researchers. Klink studied the distribution of dilation at the section of a concrete specimen experimentally [11], and Allos investigated the influences of compressive strength and age on the dilation of concrete [12]. The volumetric strain of concrete was analyzed in Ferretti’s study [13], which was used to describe the biaxial behavior of concrete using damage mechanics [14]. Although relevant studies have been carried out, no theoretical formula for the dilation of plain concrete has been put forward in the above literature. In FRP-confined concrete, the confinement enhances the strength and ductility of concrete [15,16,17,18,19]. The performance of the developed model depends on how well it captures the dilation tendency of concrete. Thus, the dilation property of FRP-confined concrete has been investigated by many scholars [20,21,22,23,24,25,26,27], and can be used to predict its mechanical behavior through an iterative procedure. Harries et al. [24] developed a dilation ratio formula for FRP-confined concrete, in which the ratio kept constant at the value of Poisson’s ratio before reaching 66% peak strain. After that, the ratio increased linearly until it reached a maximum value at two times the peak strain. Beyond this point, the increase in this ratio stopped and kept constant. A fractional equation was proposed by Mirmiran to describe the dilation rate of a concrete specimen confined by FRP jacket [25], in which the rate decreased to an asymptotic value after reaching a peak value. A similar conclusion was also obtained in the studies of Pimanmas and Nguyen [26,27] because the increasing confining pressure will inhibit the dilation of concrete. The authors believe that the increasing pressure makes the dilation of concrete specimens confined by FRP jacket differ from that of plain concrete, and thus, these formulas are not suitable for plain concrete. Based on the test data of plain concrete and actively confined concrete, researchers [28,29,30] proposed the lateral–axial strain relationship formula for concrete specimens confined by constant pressure. The dilation behavior of plain concrete can be obtained when the confining pressure is set as zero. However, the derived dilation curves of plain concrete are different in form and values, because the test data of plain concrete in literature are limited. Moreover, the dilation of plain concrete after reaching the peak stress has a large discreteness due to the local failure and non-uniform distribution of strain. Therefore, dilation analysis of plain concrete from limited experimental data is far from sufficient. The improvement in computing power promotes the development of the mesoscale simulation in concrete, in which the heterogeneity of concrete and the interaction among phases are considered [31,32,33,34,35,36,37,38,39,40,41,42]. As an essential supplement to experimental research, numerical simulation of dilation behavior will deepen our understanding of the concrete failure process.
The purpose of this study was to propose a new method to predict the dilation behavior of concrete. To achieve this goal, a mesoscale model was first established based on random distribution theory, in which concrete was divided into the mortar, aggregate, and interfacial transition zone (ITZ). After validation of the proposed model, the dilation of plain concrete subjected to axial compression was analyzed. Finally, we compared the predictions of the existing theoretical formulas with the simulation results.

2. Mesoscale Model of Concrete

2.1. Generation of the Coarse Aggregate

In this paper, the Fuller curve [31] was adopted to describe the particle gradation of coarse aggregate, which was proposed based on the theory of maximum density. The cumulative percentage P of the coarse aggregate that passes through the sieve is shown by the following equation.
P = 100 × ( d / d max ) n
where d is the sieve size; dmax is the maximum diameter of coarse aggregate; n is a constant value ranging from 0.45 to 0.70, and 0.5 was used herein. Therefore, the aggregate volume Vp in size range of ds + 1 to ds is shown by Equation (2).
V p = P ( d s ) P ( d s + 1 ) P ( d max ) P ( d min ) × v p × V
where V is the total volume of the specimen and vp is the volume ratio of coarse aggregate.
Similar to the studies in the literature [32,33,34], the spherical aggregate particles were used in the simulation. The random distribution of coarse aggregate was fulfilled by adopting the Monte Carlo method in MATLAB (version 2016, MathWorks, Natick, MA, USA) until the aggregate content in each size range had been determined. To improve the computational efficiency, coarse aggregate less than 5 mm was assumed as the mortar phase, and a relatively lower aggregate percentage of 30% was used, which was also demonstrated by other studies [35,36,37]. In the mesoscale model, 10 mm and 20 mm were used as the equivalent diameter representing the aggregate in size range of 5–15 mm and 15–25 mm, respectively. Moreover, all coarse aggregates are in the range of specimen volume and do not intersect with each other.

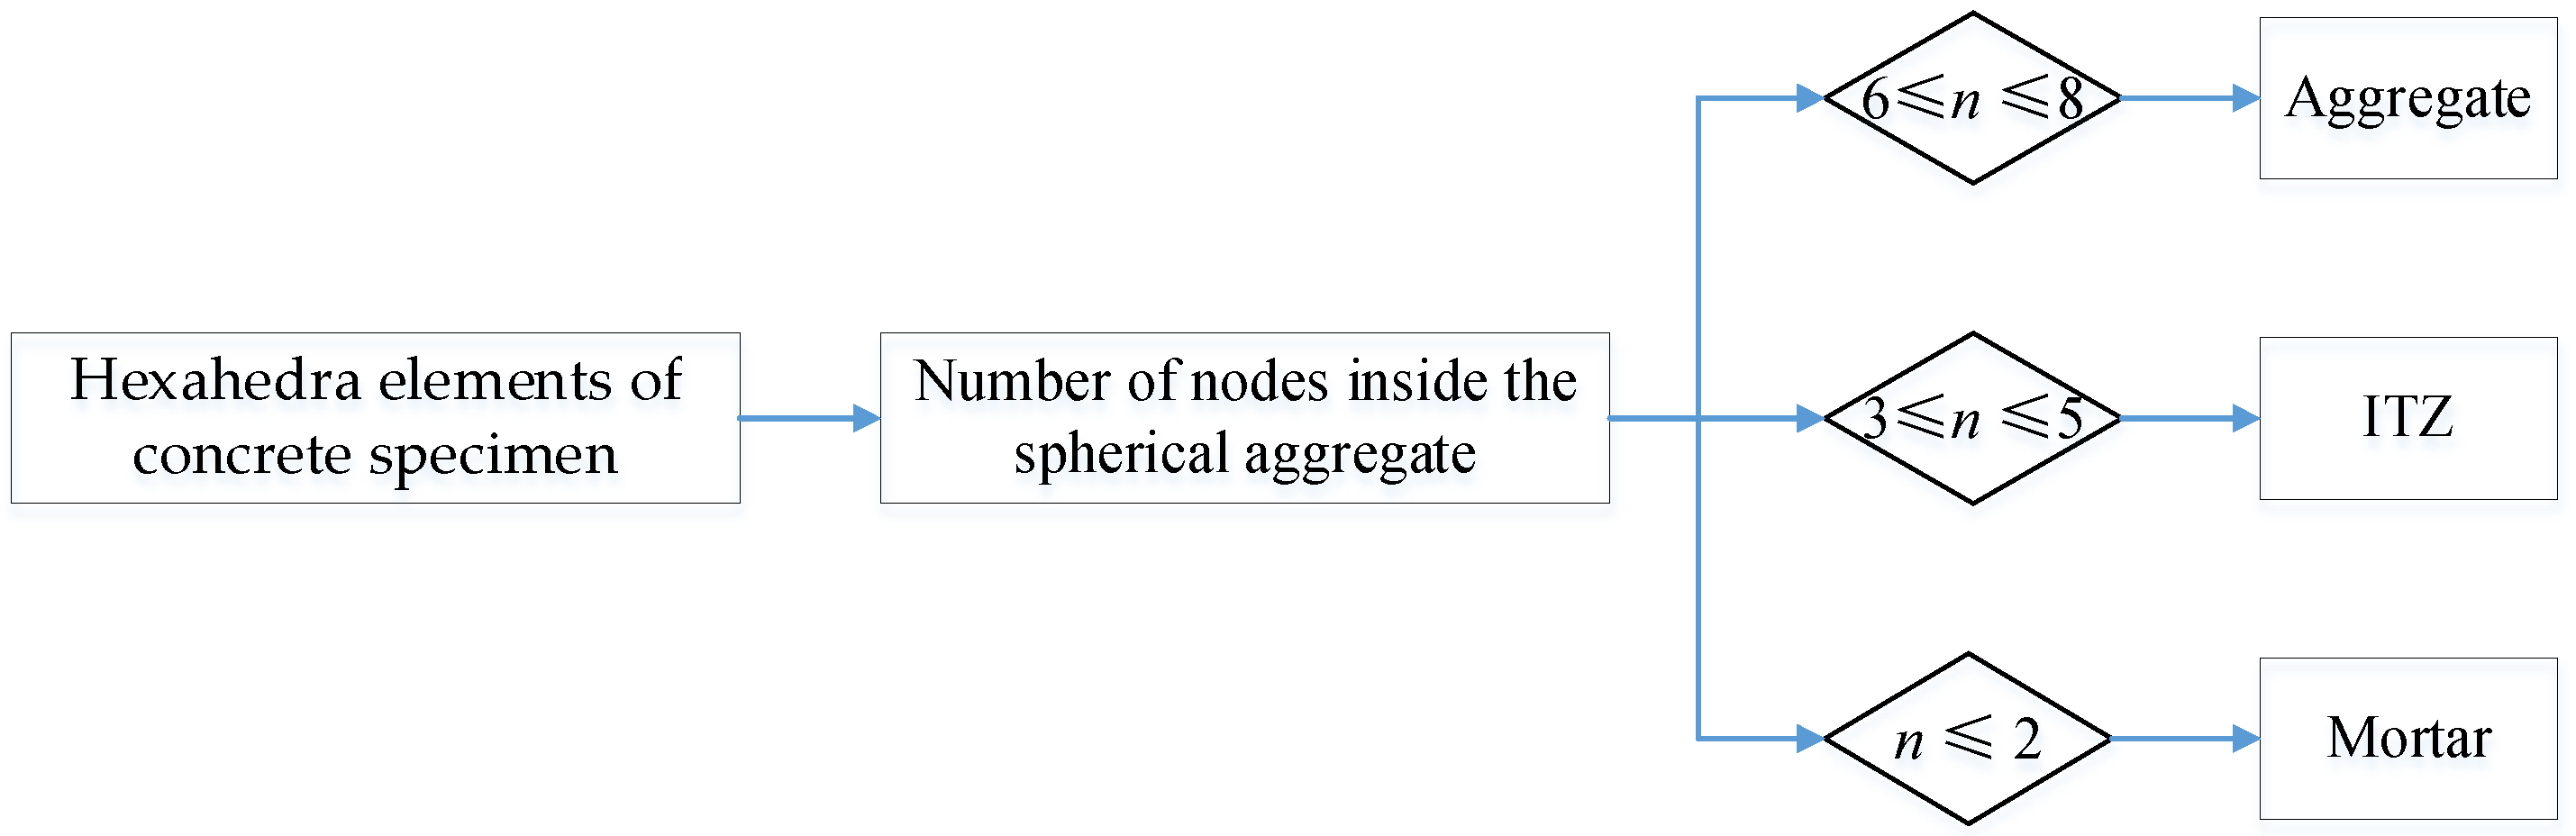
2.2. Determination of the Three Phases

The specimen was divided into hexahedra elements of the same size using the mapping mesh method, and the attribute of each element can be determined according to the coordinates of element nodes and the center of spherical aggregate. The classification principle of each phase is shown in Figure 1.
Figure 1 shows the classification principle of each phase, and the principle of classification is as follows. (1) If 0–2 nodes of the hexahedra element are inside the spherical aggregate, the property is defined as the mortar phase. (2) If 3–5 nodes are inside the spherical aggregate, the property is defined as the interface phase. (3) If 6–8 nodes are inside the spherical aggregate, the attribute is defined as the aggregate phase.
Based on the studies in the literature [38,39,40], the actual size of ITZ is about 10–50 μm, and the variation in element size in the range of 0.5–2 mm only has a slight influence on the stress–strain curve of concrete. Thus, 2 mm was used as the element size in the mesoscale simulation to reduce the computational cost, and the same method was also adopted by previous scholars [41,42]. The numerical model is shown in Figure 2.
In Figure 2, the numerical concrete column is subjected to axial compression, where the coarse aggregate, the mortar, and interfacial transition zone (ITZ) are represented by green, gray, and red colors, respectively.

2.3. Damage Plasticity Model of Concrete

The damage plasticity model established by Lubiliner and Lee et al. [43,44] has been widely used to describe the property of concrete, which accounts for the tension cracking and compression crushing of concrete. The stress–strain relationship of concrete under axial load can be defined by Equations (3) and (4), in which d t , ε t , and ε ˜ t pl represent the damage coefficient, the total strain, and plastic strain under axial tension, respectively. The subscript c represents the variables under axial compression.
σ c = ( 1 d c ) E 0 ( ε c ε ˜ c pl )
σ t = ( 1 d t ) E 0 ( ε t ε ˜ t pl )
In the software of ABAQUS (version 6.14, Dassault Simulia, France), the plastic strain of concrete under compressive and tensile load depends on the definition of inelastic strain ε ˜ c in and cracking strain ε ˜ t ck of concrete. The relationship can be described by Equations (5) and (6). Meanwhile, the inelastic strain and cracking strain can be obtained until the constitutive model of the material is available, as shown by Equations (7) and (8). The characteristic length le is set as 2 mm, and the symbol w represents the cracking displacement.
ε ˜ c pl = ε ˜ c in d c 1 d c σ c E 0
ε ˜ t pl = ε ˜ t ck d t 1 d t σ t E 0
ε ˜ c in = ε c σ c E 0
ε ˜ t ck = w l e
Based on the theory of energy equivalence in the literature [45,46,47], the damage coefficient of concrete under axial load can be expressed by Equation (9), which reflects the stiffness degradation of the material.
d = 1 σ E 0 ε

2.4. Constitutive Model of Each Phase

Compared with the mortar and ITZ phase, the aggregate particles have a higher strength, and the fracture of aggregate in normal concrete is usually ignored. Therefore, it was assumed as an elastic body in the mesoscale simulation. The difference between aggregate and mortar in mechanical and thermal properties results in higher porosity and water–cement ratio in ITZ. Nevertheless, the ITZ can be regarded as the mortar with weakened mechanical properties, considering that they have a similar material composition [48]. Thus, the key to the mesoscale model lies in the definition of the constitutive model of the mortar.
Based on the test data and analysis in the literature [49,50,51], it was found that there existed great differences between the mortar and concrete in aspects of peak strain, elastic modulus, and decreasing index. The authors [52] conducted a parameter analysis to investigate the influence of these parameters on the properties of concrete, and then proposed three correction coefficients to consider the difference. Finally, a constitutive model of the mortar under axial compression and tension was proposed, as shown by Equations (10) and (11) and Equations (12)–(14), respectively. The stress-cracking relationship rather than the stress–strain relationship was used in the tension definition, which can reduce the mesh size dependency in simulation [53,54].
y = { 2 x x 2 x r r 1 + x r x 1 x > 1
ε m 0 = 1260 + 310 f m
where y = σ m / f m , x = ε m / ε m 0 , r = E m / ( E m E p ) , E m = 4000 f m , and E p = 1.44 f m / ε m 0 .
σ t = { f t ( 1 w w 0 ) w w 0 0 w > w 0
f t = 0.26 ( 1.25 f c ) 2 / 3
G f = ( 1.25 d max + 10 ) ( f c / 10 ) 0.7 × 10 3 ( N / mm )

2.5. Validation of the Mesoscale Model

The concrete studied in this work is made up of conventional cement and additives, and the compressive strength of the mortar instead of the water–cement ratio was taken as the basic parameter in the mesoscale simulation. This is because the mesoscale model is not able to describe the interaction between water and cement. Figure 3a depicts the stress–strain relationship of the concrete specimen with varying mortar strengths. To reflect the accuracy of the simulation results, the stress–strain curves derived from code GB50010-2010 are also added to this figure. The comparison shows that the mesoscale model can make a satisfactory estimation of the properties of concrete under axial compression. Figure 3b shows the relationship between the mortar strength and peak values of concrete. It can be noticed that the peak stress and peak strain increase linearly with the increase in mortar strength, and the strength relationship between mortar and concrete is shown by Equation (15), which can be utilized to simulate the concrete with different strengths in the following sections.
f c = 2.7 + 0.67 f m
To further illustrate the validity of the established mesoscale model, the lateral–axial strain curves of plain concrete with six strengths were collected from the existing literature [55,56,57,58,59], as shown in Figure 4. The strength of concrete is 26 MPa, 35.8 MPa, 40 MPa, 50 MPa, 60 MPa, and 68 MPa, respectively, while the corresponding strength of the mortar in the mesoscale simulation is 34.8 MPa, 49.4 MPa, 55.7 MPa, 70.6 MPa, 85.5 MPa, and 97.5 MPa, according to the strength relationship shown by Equation (15).
Figure 4 shows the comparison of the lateral–axial strain relationship between the simulation and test results in the middle section of the specimen. The established model can make an adequate prediction of the development trend of the lateral–axial strain curve. Although there are some differences in specific values, the model is still deemed effective considering the sensitivity and discreteness of the strain measurement.
In sum, a mesoscale model of concrete was established in this section, which can be utilized to investigate the dilation properties of plain concrete. Based on this, the dilation law of concrete under axial compression is discussed in the following section.

3. Results

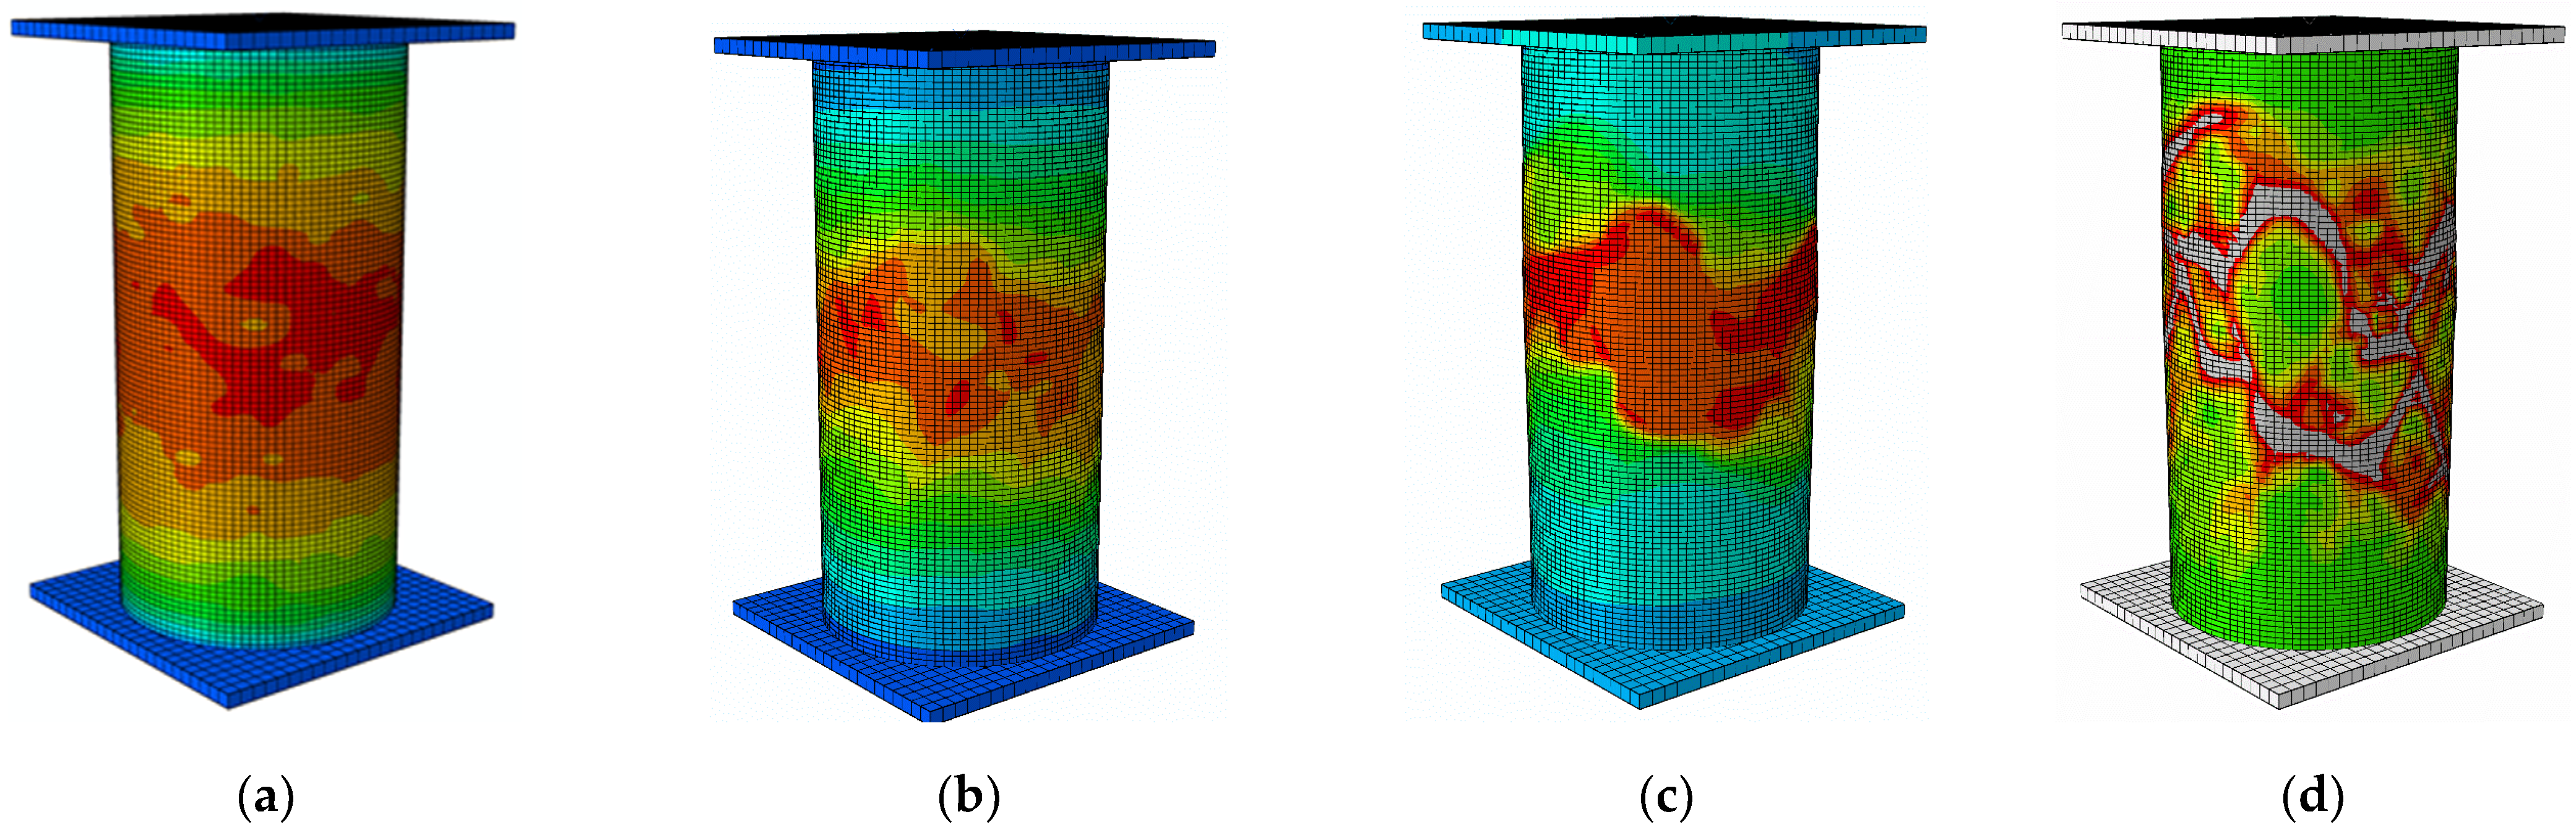
3.1. Failure Process of the Concrete Specimen

The properties of concrete specimens subjected to axial compression were studied through parameter analysis, and it was found that they had a similar failure process. Figure 5 shows the schematic diagram of axial strain and lateral strain. In the simulation, the axial displacement Δh and radial displacement Δr were extracted and divided by the height h and diameter r of the specimen, respectively, as shown in Equations (16) and (17), and the axial strain εv of the specimen and lateral strain εh at the middle section could be obtained. The secant strain ratio is the ratio between lateral strain and axial strain, as shown in Equation (18).
ε v = Δ h h
ε h = Δ r r
μ s = ε h ε v
Figure 6 depicts the development of the stress–strain curve and secant strain ratio–strain curve. It shows that the secant strain ratio increases slowly when the axial strain is less than 1000 με, because the cracks in the specimen grow slowly in the elastic stage. The result is consistent with the study conducted by Spoelstra and Marques [60,61]. With the increase in axial strain, the secant strain ratio increases rapidly.
The axial stress is close to concrete strength as the secant strain ratio reaches 0.5. The secant strain ratio increases slowly after the axial strain reaches 4000 με, which may be related to the larger value of the current axial strain. The residual stress is about 1/3 of the concrete strength as axial strain reaches 6000 με. At this time, the cracks in concrete have been fully developed and the secant strain ratio is about 2.5, which is close to the statistical results in the literature [28].

3.2. Distribution of Lateral Strain in the Specimen

Seven sections were selected on the specimen to study the distribution of lateral strain along the specimen height, as shown in Figure 7a. The specimen height is designed as 200 mm, and the spacing of each section is 25 mm. Based on Equation (17), the lateral strain of each section can be obtained by extracting the radial displacement. Figure 7b reflects the distribution of lateral strain along the specimen height. It shows that the lateral strain is relatively uniform along the specimen height when the axial strain is less than 1000 με. The lateral strain at the middle section increases sharply as the axial strain increases. The main reason is that the middle region of the specimen is less affected by the end constraint and the crack development is intensive. This phenomenon is also observed in Figure 8, where the radial displacement field at axial strains of 1000, 2000, and 4000 με is depicted. The figure shows that the dilation of concrete mainly occurs in the middle part of the specimen ranging from 3/8 to 5/8, where the stiffness degradation of the material is the most serious, as shown in Figure 8d.
To study the distribution of lateral strain along the circumferential direction, the lateral strains of 50 points along the middle section of the specimen were extracted, as shown in Figure 9.
One can see from Figure 9 that the lateral strain at the middle section is evenly distributed along the circumferential direction when the axial strain is less than 2000 με. As the axial strain reaches 3000 με, the lateral strain along the circumferential direction begins to fluctuate, which shows that the strain starts to distribute non-uniformly. This is because the extended cracks pass through different positions at the middle section in this stage, resulting in differences in radial displacement.

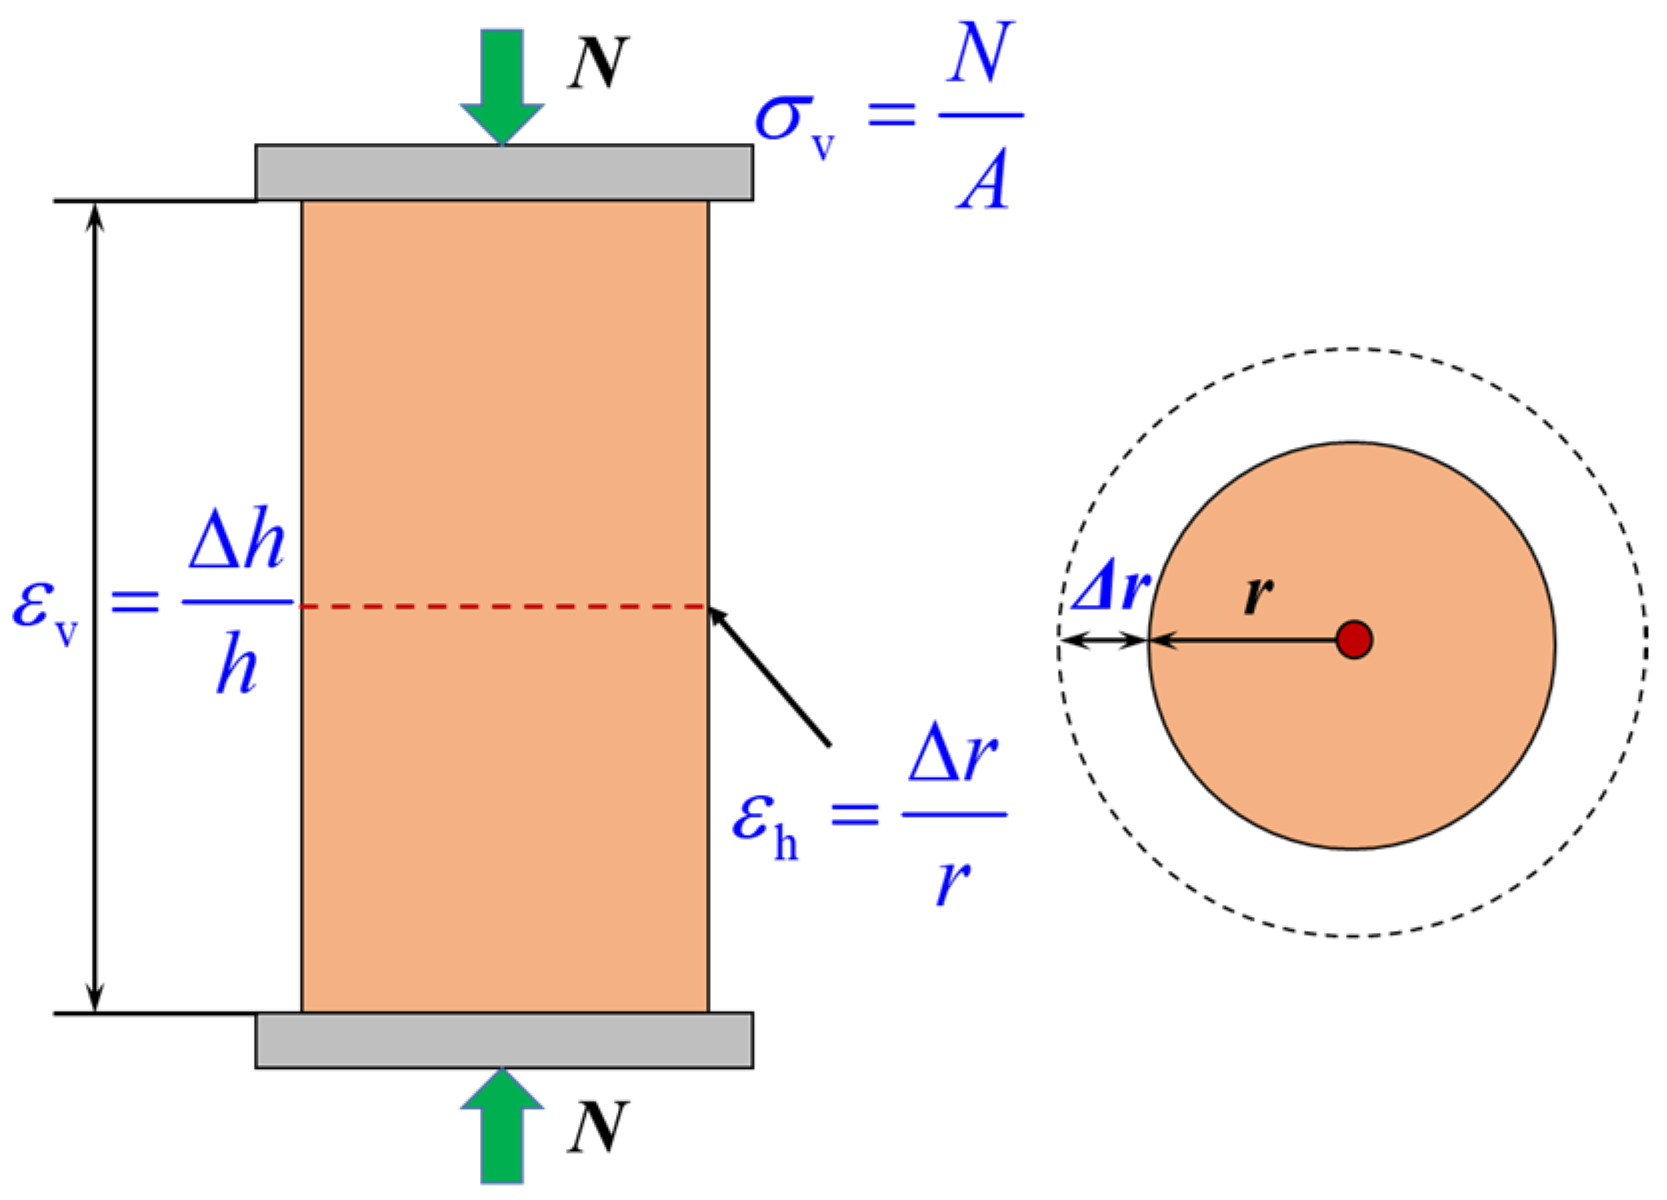
3.3. Lateral–Axial Strain Relationship for Plain Concrete

The cracks mainly concentrate in the middle part of the specimen, and the lateral strain develops quickly in this area. Thus, the average strain at the sections of 3/8, 1/2, and 5/8 is taken as the lateral strain of the specimen, and the ratio between lateral strain and axial strain is defined as the secant strain ratio. Figure 10 shows the lateral strain–axial strain curves and secant strain ratio–axial strain curves of concrete with different strengths under axial compression. It shows that the development of lateral strain and secant strain ratio can be divided into three stages. The lateral strain is small and the secant strain ratio increases slowly from 0.2 in the first stage, because the fracture development is less in this stage. When the axial strain exceeds 1000 με, the internal cracks continue to accumulate, leading to a rapid increase in lateral strain and secant strain ratio. Moreover, the lateral strain and the secant strain ratio of concrete with higher strength are smaller than those with lower strength. The lateral–axial strain relationship is approximately linear in the last stage as the axial strain exceeds 4000 με. At the same time, the secant strain ratio grows slowly and approaches its critical value with the increase in axial strain.
The volumetric strain is an important parameter to illustrate the failure process of concrete, and its definition is shown by Equation (19). Figure 11a depicts the stress–volumetric strain relationship of the specimens with different strengths under axial compression. One can see that the volume of the specimen decreases slowly due to the compression, and then expands rapidly with the development of internal cracks.
Figure 11b depicts the stress ratio at maximum compressive strain and zero volumetric strain, where stress ratio represents the ratio between stress at a certain strain and the maximum stress. It shows that the stress ratio at maximum compressive strain increases from 0.64 to 0.82 when the mortar strength varies from 20 MPa to 80 MPa, illustrating that the initiation of cracks starts later in concrete specimens with higher strength. The volume of concrete changes from compression to dilation when the volumetric strain reaches zero, and the stress ratio at this point is approximately equal to 1.0. That is to say, the secant strain ratio is about 0.5 when the axial stress reaches the concrete strength, which is consistent with the literature [28,60,61].
ε vol = ε v + 2 ε h = ( 1 2 μ s ) ε v
In sum, the development trend of secant strain ratio, the distribution of lateral strain, and the lateral–axial strain relationship of plain concrete under axial compression were studied in this section, which deepens our understanding of the dilation behavior of concrete.

4. Comparison with Current Formulas

Currently, several formulas are available for determining the lateral–axial strain relationship of concrete specimen. To illustrate the accuracy of the formulas for different strengths of concrete, three formulas, namely, the Binici model [28], Teng model [29], and Lim model [30], are utilized to make a comparison.
Equation (20) was proposed by Binici [28] to describe the secant strain ratio of concrete under axial compression. In the elastic stage, the secant strain ratio keeps constant at the value of Poisson’s ratio, which is between 0.15 and 0.2. With the increase in axial strain, the secant strain ratio increases nonlinearly. The authors believe an ultimate strain ratio exists as the axial strain becomes much larger, and the critical value can be calculated by Equation (21). The diameter ϕ is the ratio between the confinement pressure and concrete strength, and the value is set as zero for plain concrete.
μ s = { μ 0 ε ε e μ l ( μ l μ 0 ) exp [ ( ε v ε e Δ ) 2 ] ε > ε e
Δ = ε co ε e ln β     β = μ l μ p μ l μ 0     μ l = μ p + 1 ( ϕ + 0.85 ) 4
where μ 0 represents Poisson’s ratio of concrete, and 0.2 is adopted here; μ p represents the secant strain ratio as axial strain reaches peak strain, and 0.5 is set as the value; μ l represents the critical secant strain ratio when the axial strain is much larger.
Based on the test data of plain concrete and confined concrete, Teng et al. [29] proposed a lateral–axial strain curve for confined concrete, which can be used to study the properties of FRP confined concrete. The equation is shown as follows:
ε v ε co = 0.85 ( 1 + 8 p f co ) { [ 1 + 0.75 ( ε h ε co ) ] 0.7 exp [ 7 ( ε h ε co ) ] }
where p is the confining pressure; its value is zero for plain concrete.
After that, Lim et al. [30] also proposed a lateral–axial strain curve for concrete based on statistical test data shown by Equation (23). The strain relationship for plain concrete can be obtained when the confining pressure is set as zero. A parameter n was introduced in this formula to consider the influence of concrete strength on initial turning point of the curves, and its value is defined by Equation (24).
ε v = ε h μ 0 [ 1 + ( ε h μ 0 ε co ) n ] 1 / n + 0.04 ε h 0.7 [ 1 + 21 ( p f co ) 0.8 ]
n = 1 + 0.03 f co
Figure 12 compares the secant strain ratio–axial strain relationship between simulation and formula predictions. The comparison illustrates that the simulation results are consistent with those predicted by formulas of Teng et al. and Binici et al. [28,29] when the axial strain is less than 2000 με. At this stage, the stress–strain curve of concrete is in the ascending branch. However, the formula proposed by Lim et al. [30] makes a relatively more significant difference due to the longer constant stage. The stress–strain curve of concrete enters the descending branch as the axial strain exceeds 2000 με, and a certain degree of difference occurs between the simulation and formulas proposed by Teng et al. and Binici et al. [28,29]. Nevertheless, the simulation result is in the range of the theoretical results, which demonstrates the validation of the mesoscale model in predicting the dilation of plain concrete. Therefore, the mesoscale simulation is an efficient tool to investigate the dilation behavior of concrete.

5. Conclusions

In this work, we established a mesoscale model of concrete by considering the random distribution of coarse aggregate and the different properties between mortar and concrete. The validity of the proposed model was demonstrated by code curves and test data; then, the failure process of the concrete, the distribution of lateral strain, and the lateral–axial strain relationship of concrete were analyzed. The main conclusions are summarized as follows:
(1)
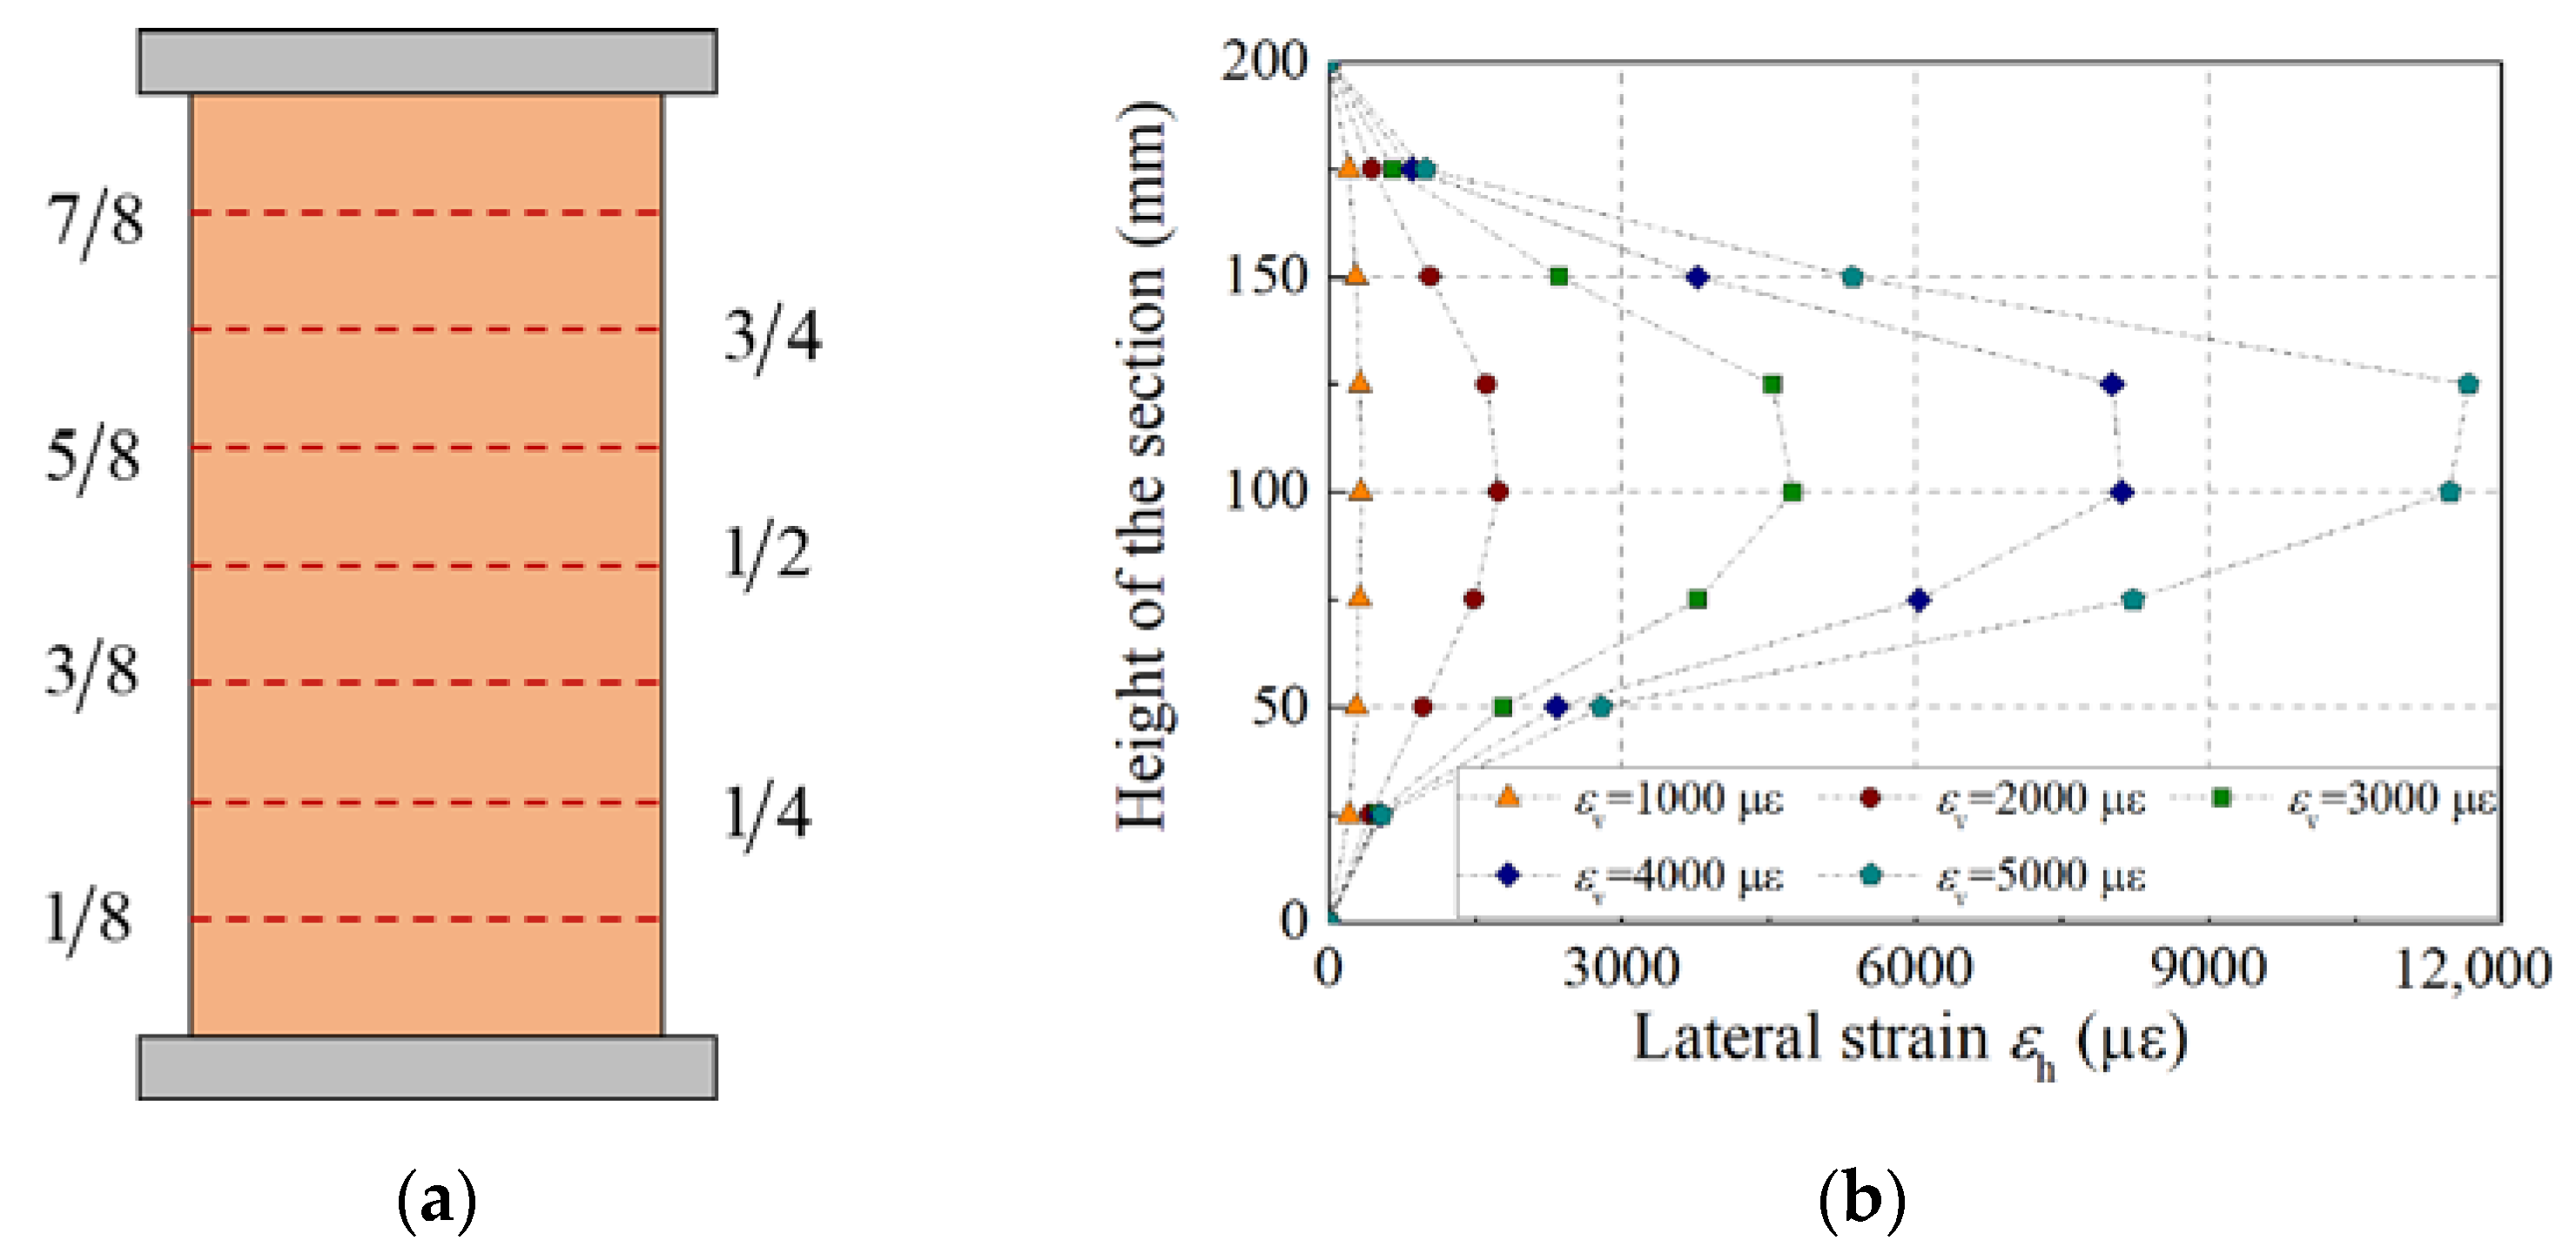
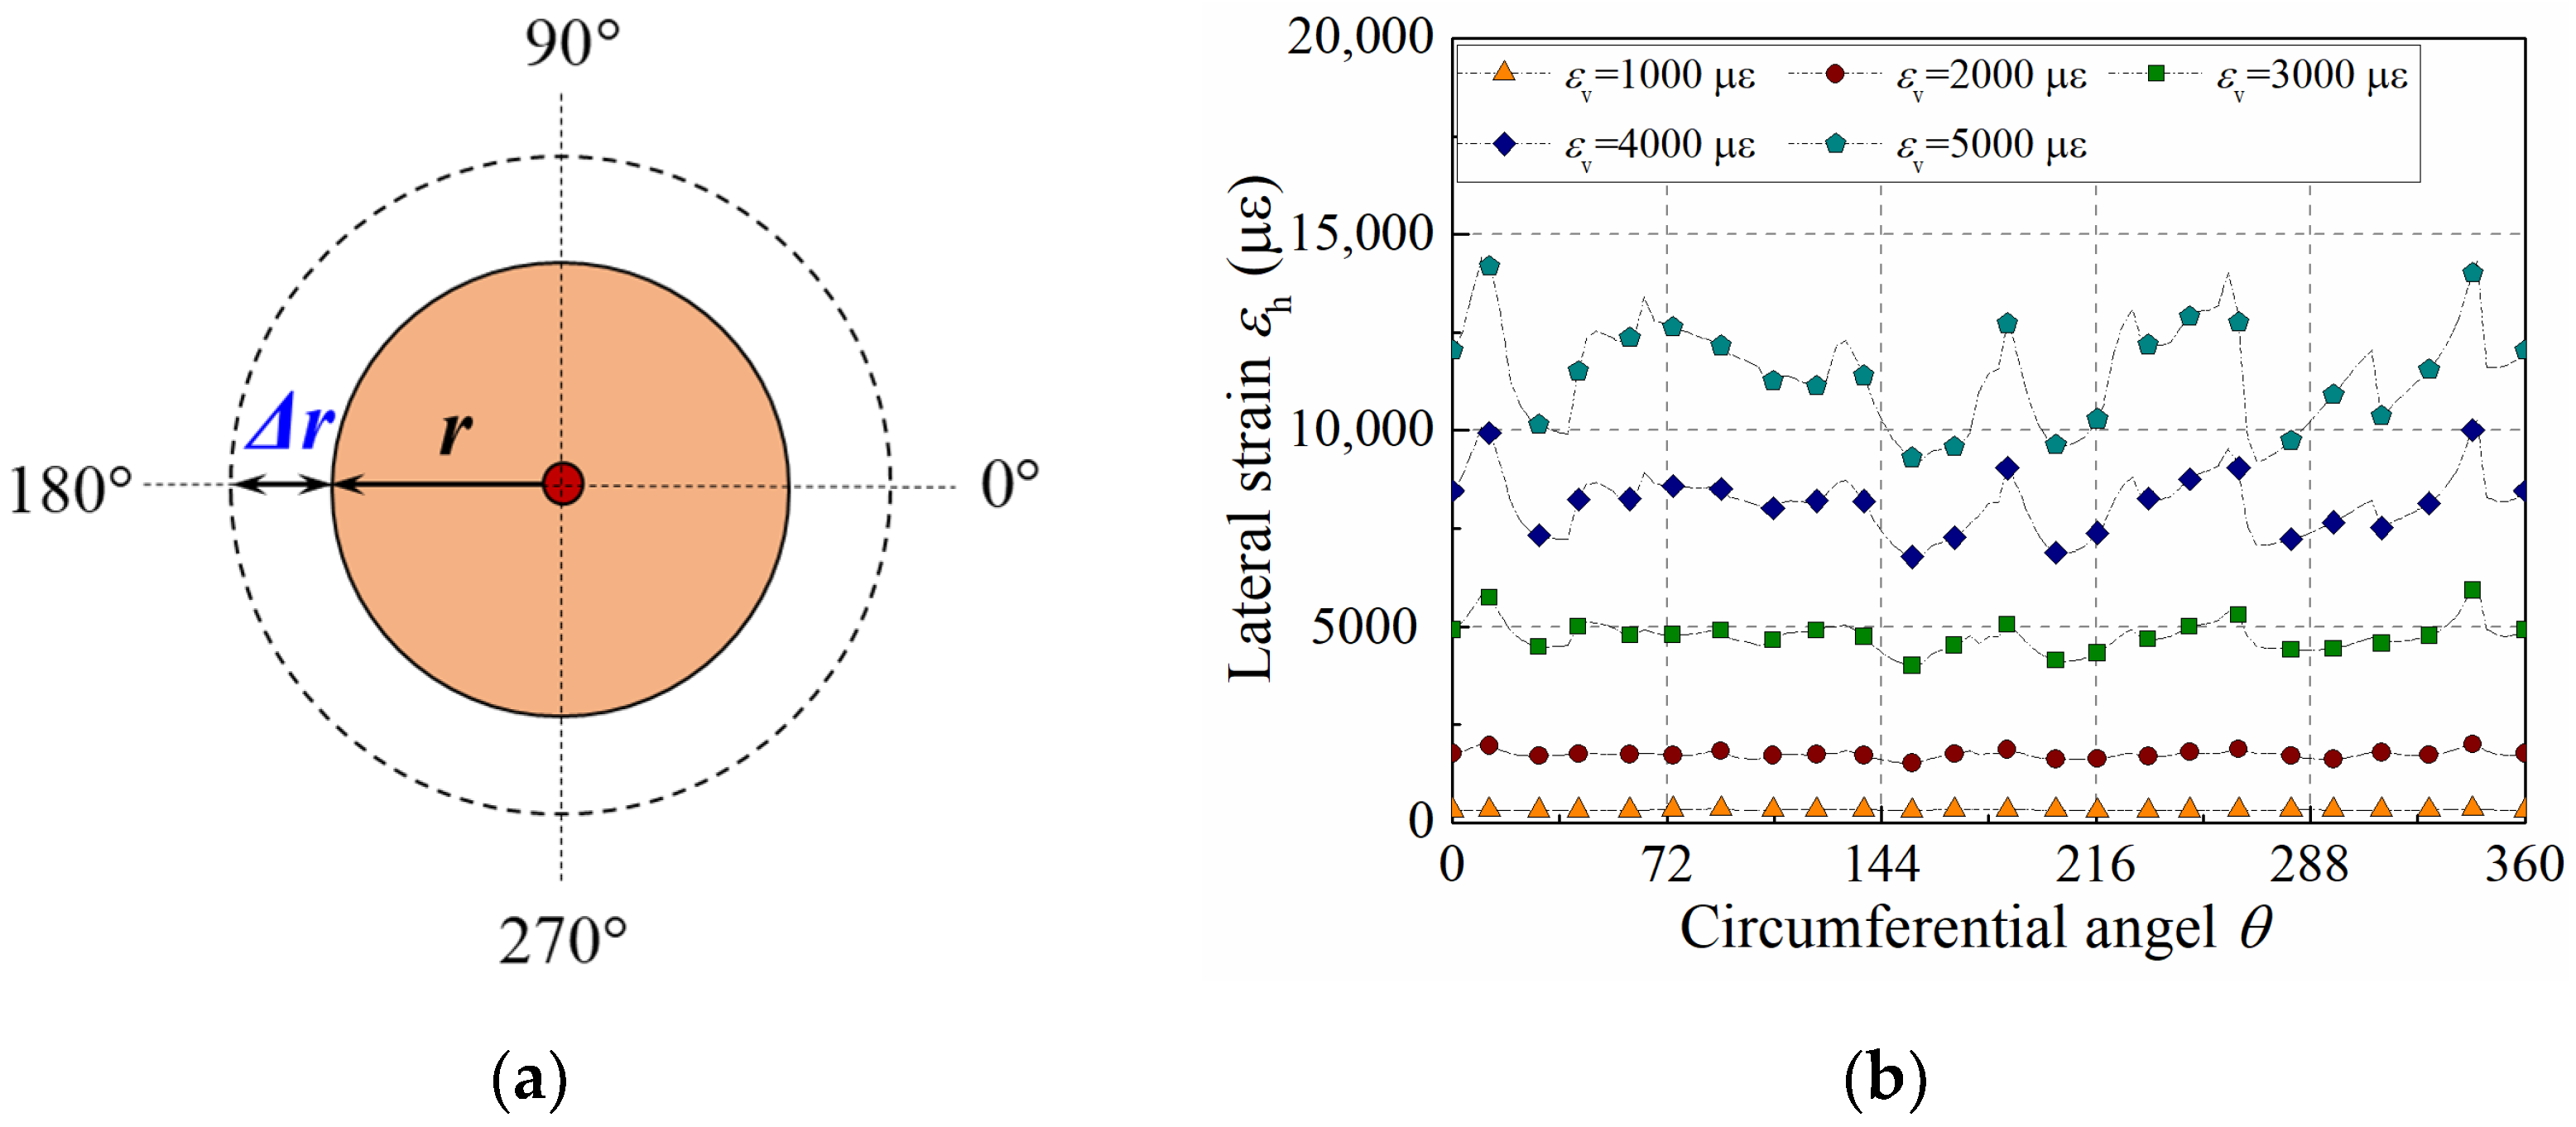
The lateral strain is non-uniformly distributed along the specimen height, and the lateral deformation mainly occurs in the middle part of the specimen ranging from 3/8 to 5/8, where the stiffness degradation is the most serious. Moreover, the lateral strain along the circumferential direction becomes non-uniform as axial strain reaches 3000 με.
(2)
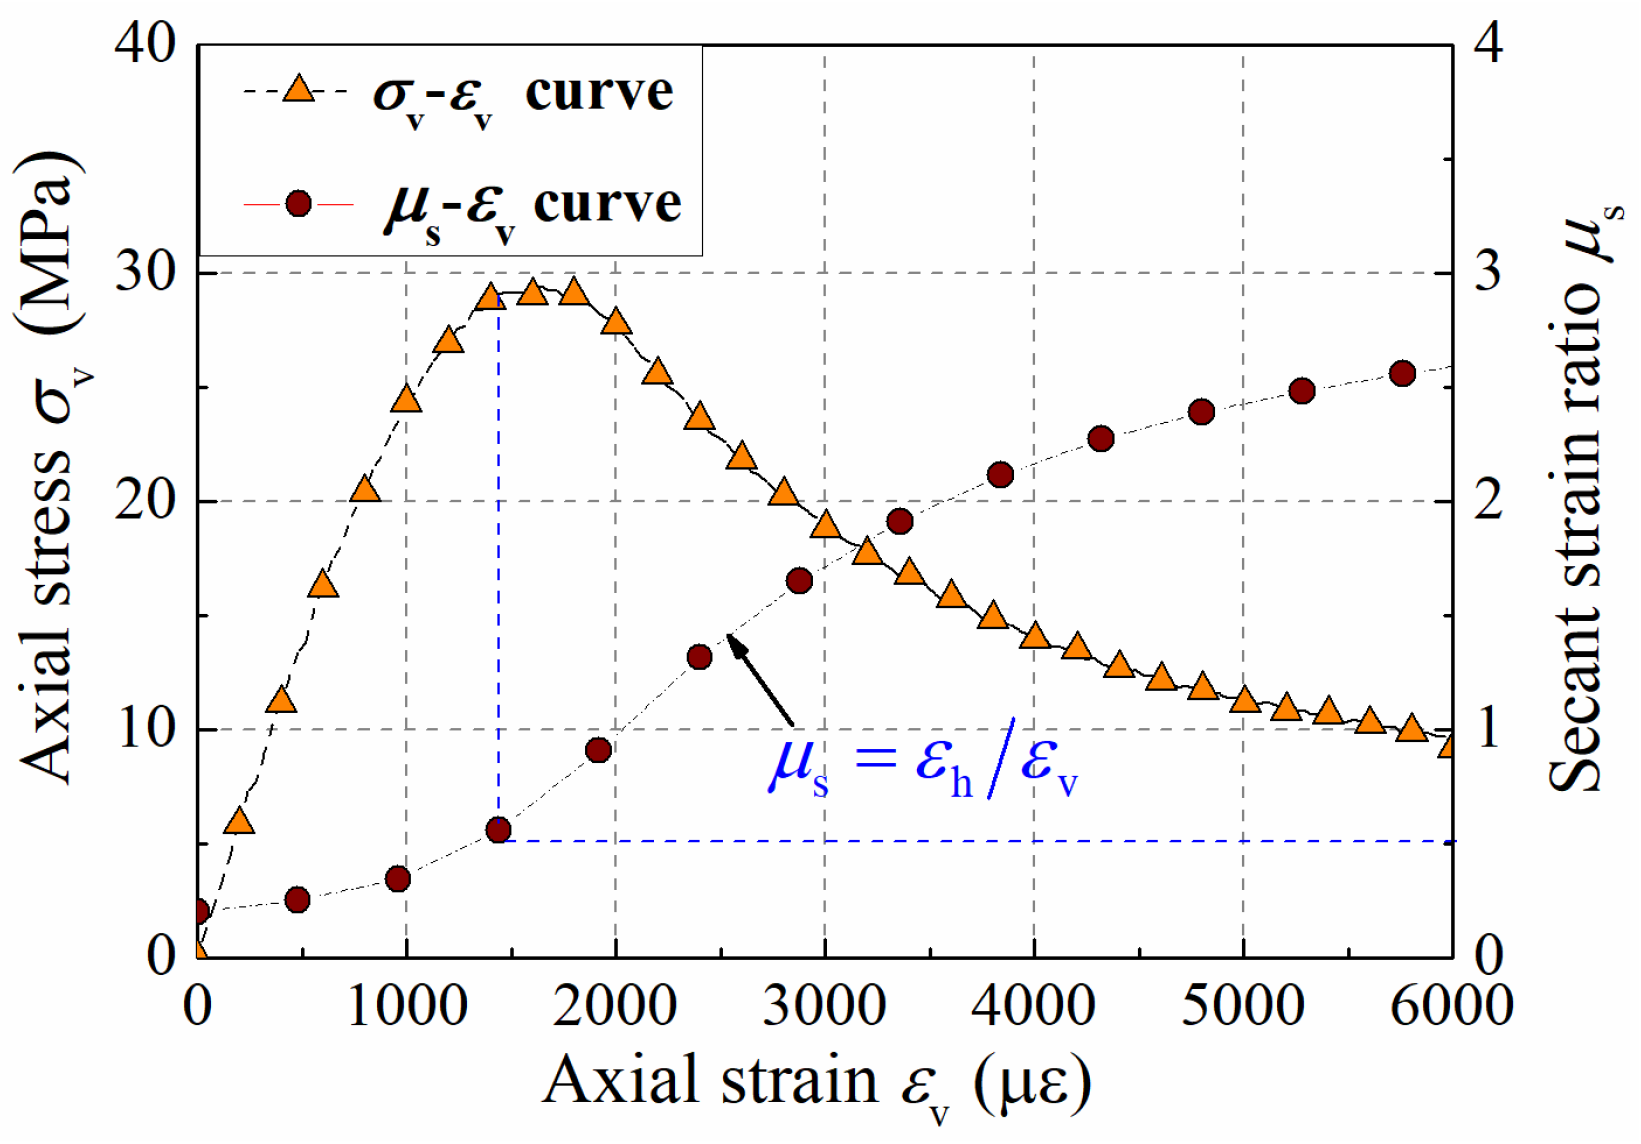
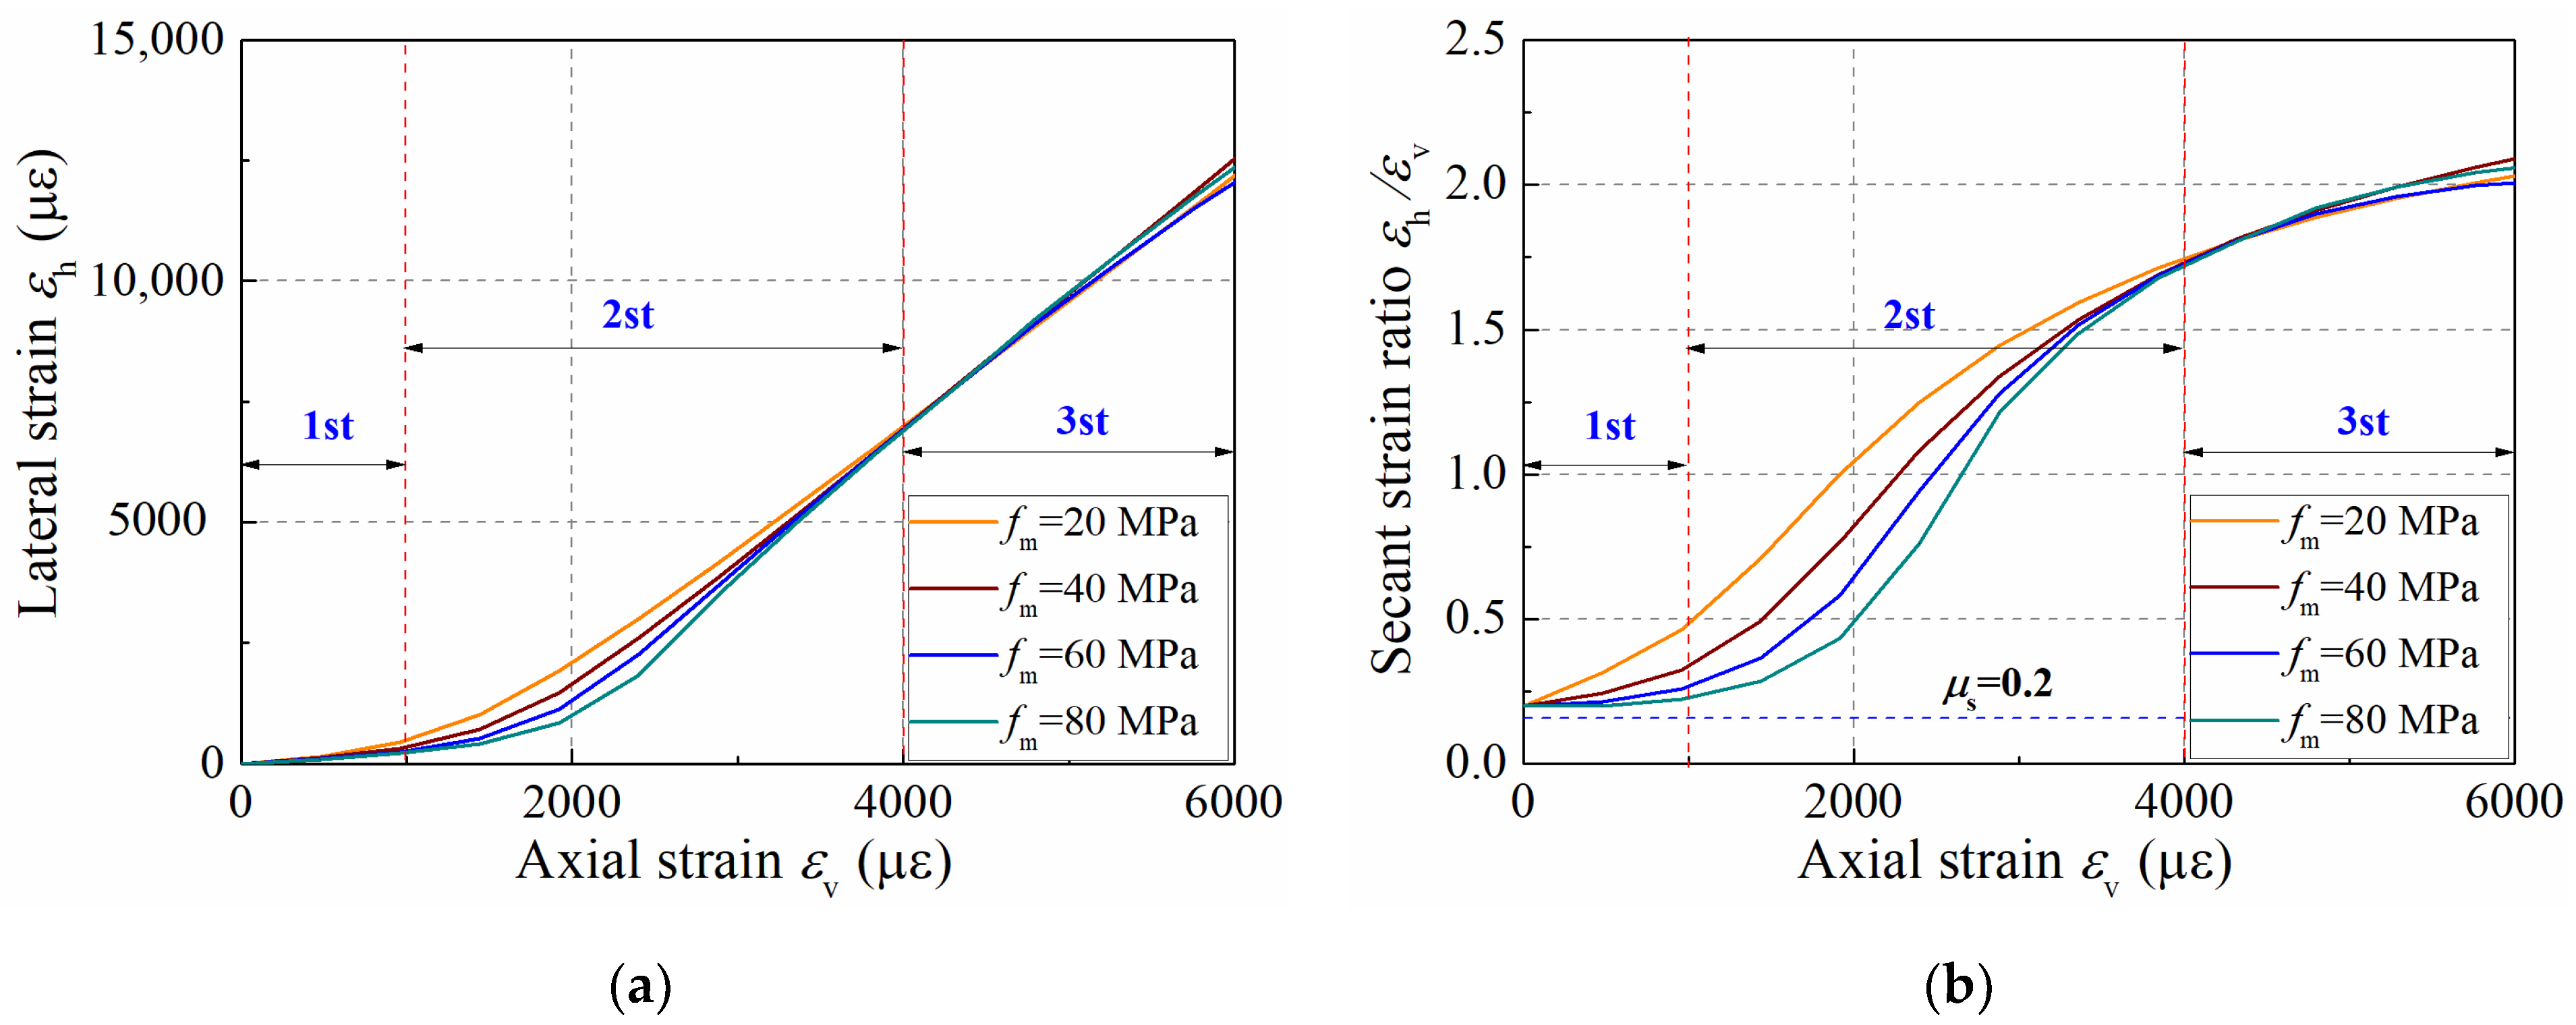
The development of lateral strain and secant strain ratio can be divided into three stages. In the first stage, the lateral strain is small and the secant strain ratio increases slowly from 0.2. In the second stage, the lateral strain and the secant strain ratio increase rapidly as the internal cracks continue to accumulate. In the third stage, the lateral–axial strain curve is approximately linear, and the secant strain ratio grows slowly and approaches its critical value.
(3)
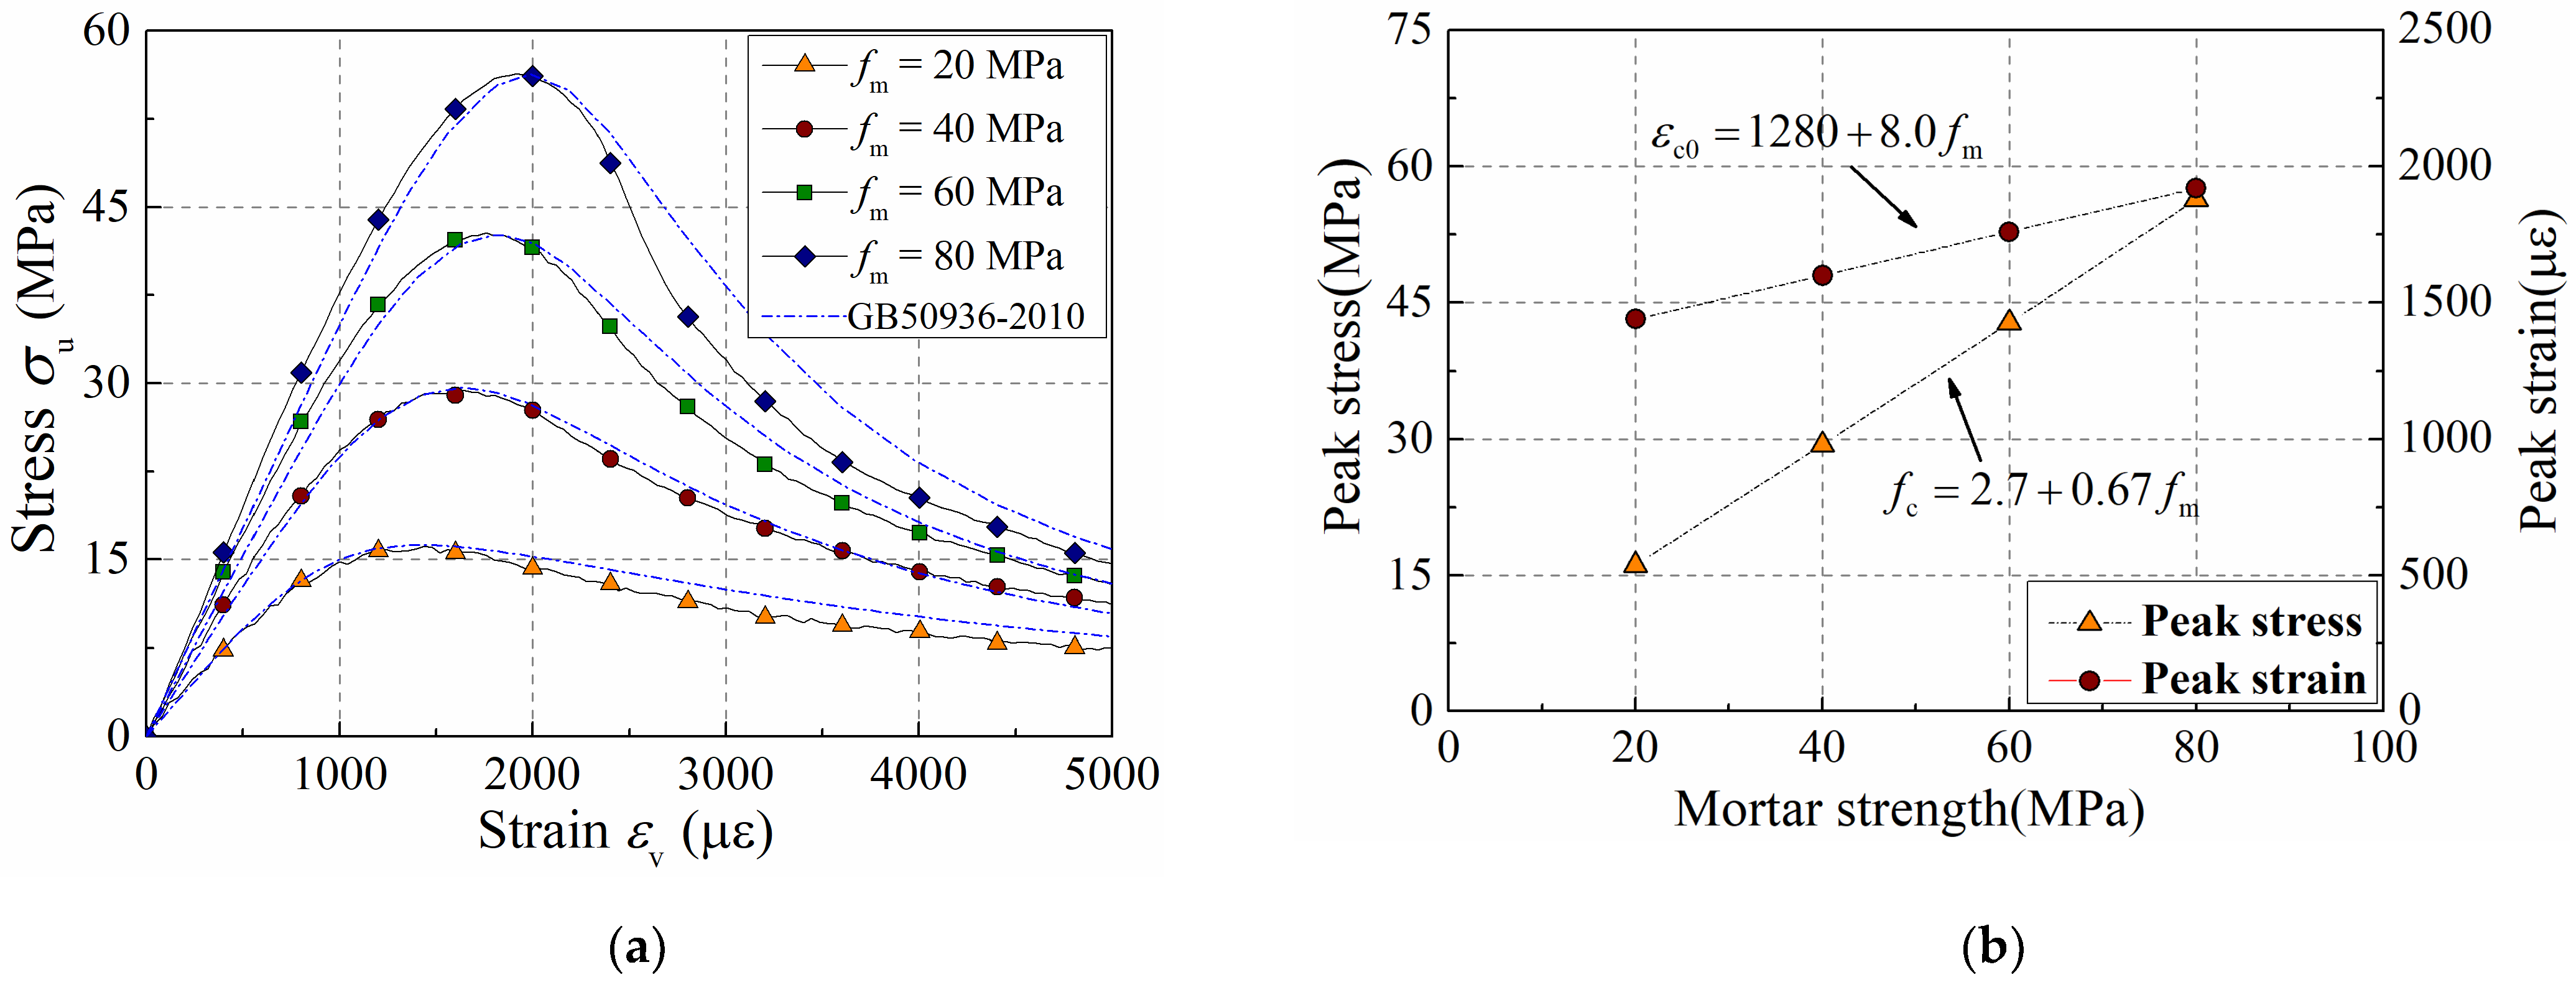
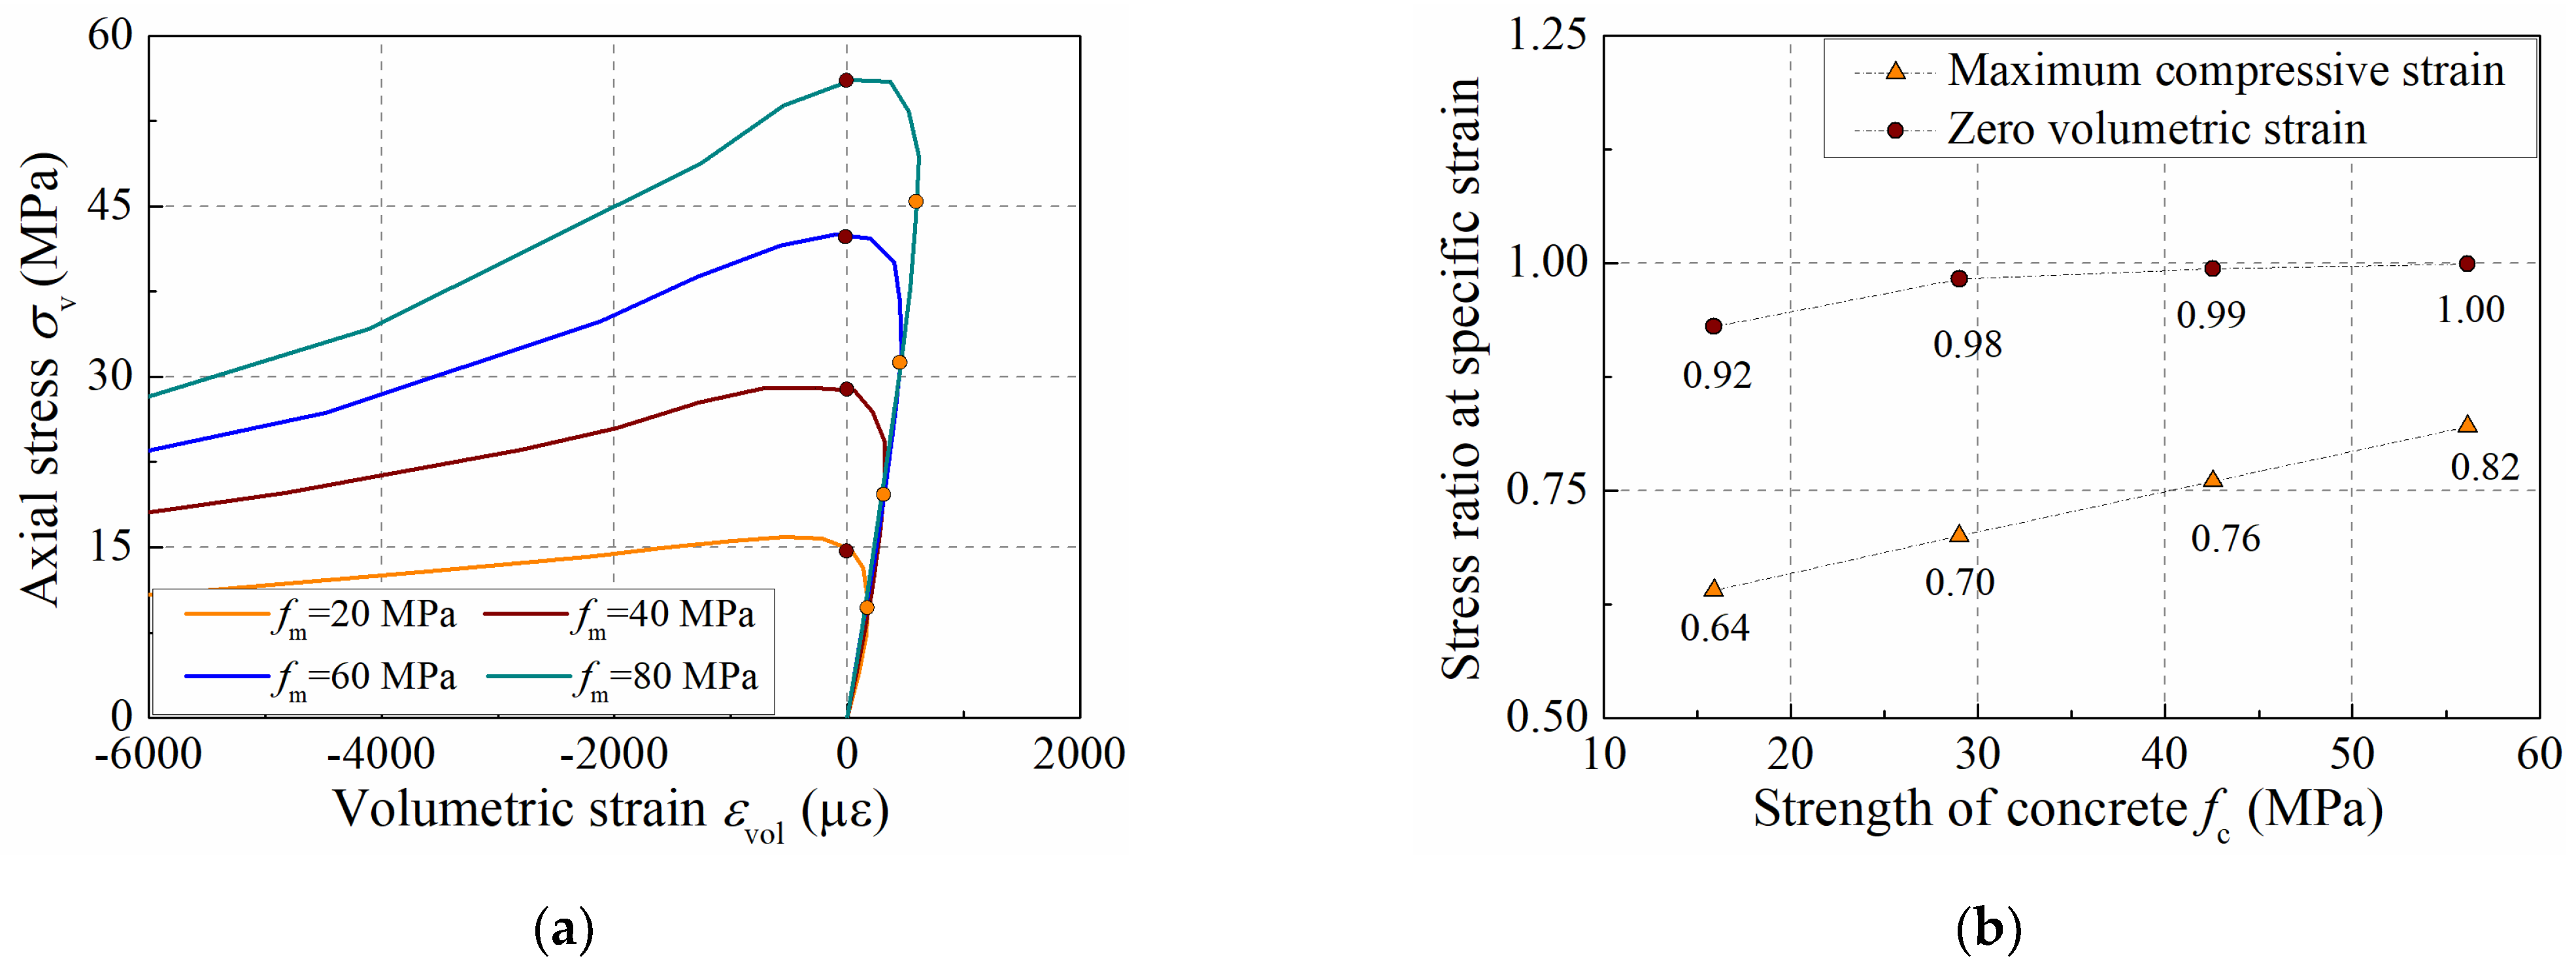
The strength of concrete influences the stress ratio at maximum compressive strain, and the stress ratio varies from 0.62 to 0.82 when the mortar strength varies from 20 MPa to 80 MPa, illustrating that the initiation of cracks starts later in concrete with higher strength. Moreover, the secant strain ratio is about 0.5 as the stress reaches the concrete strength.
(4)
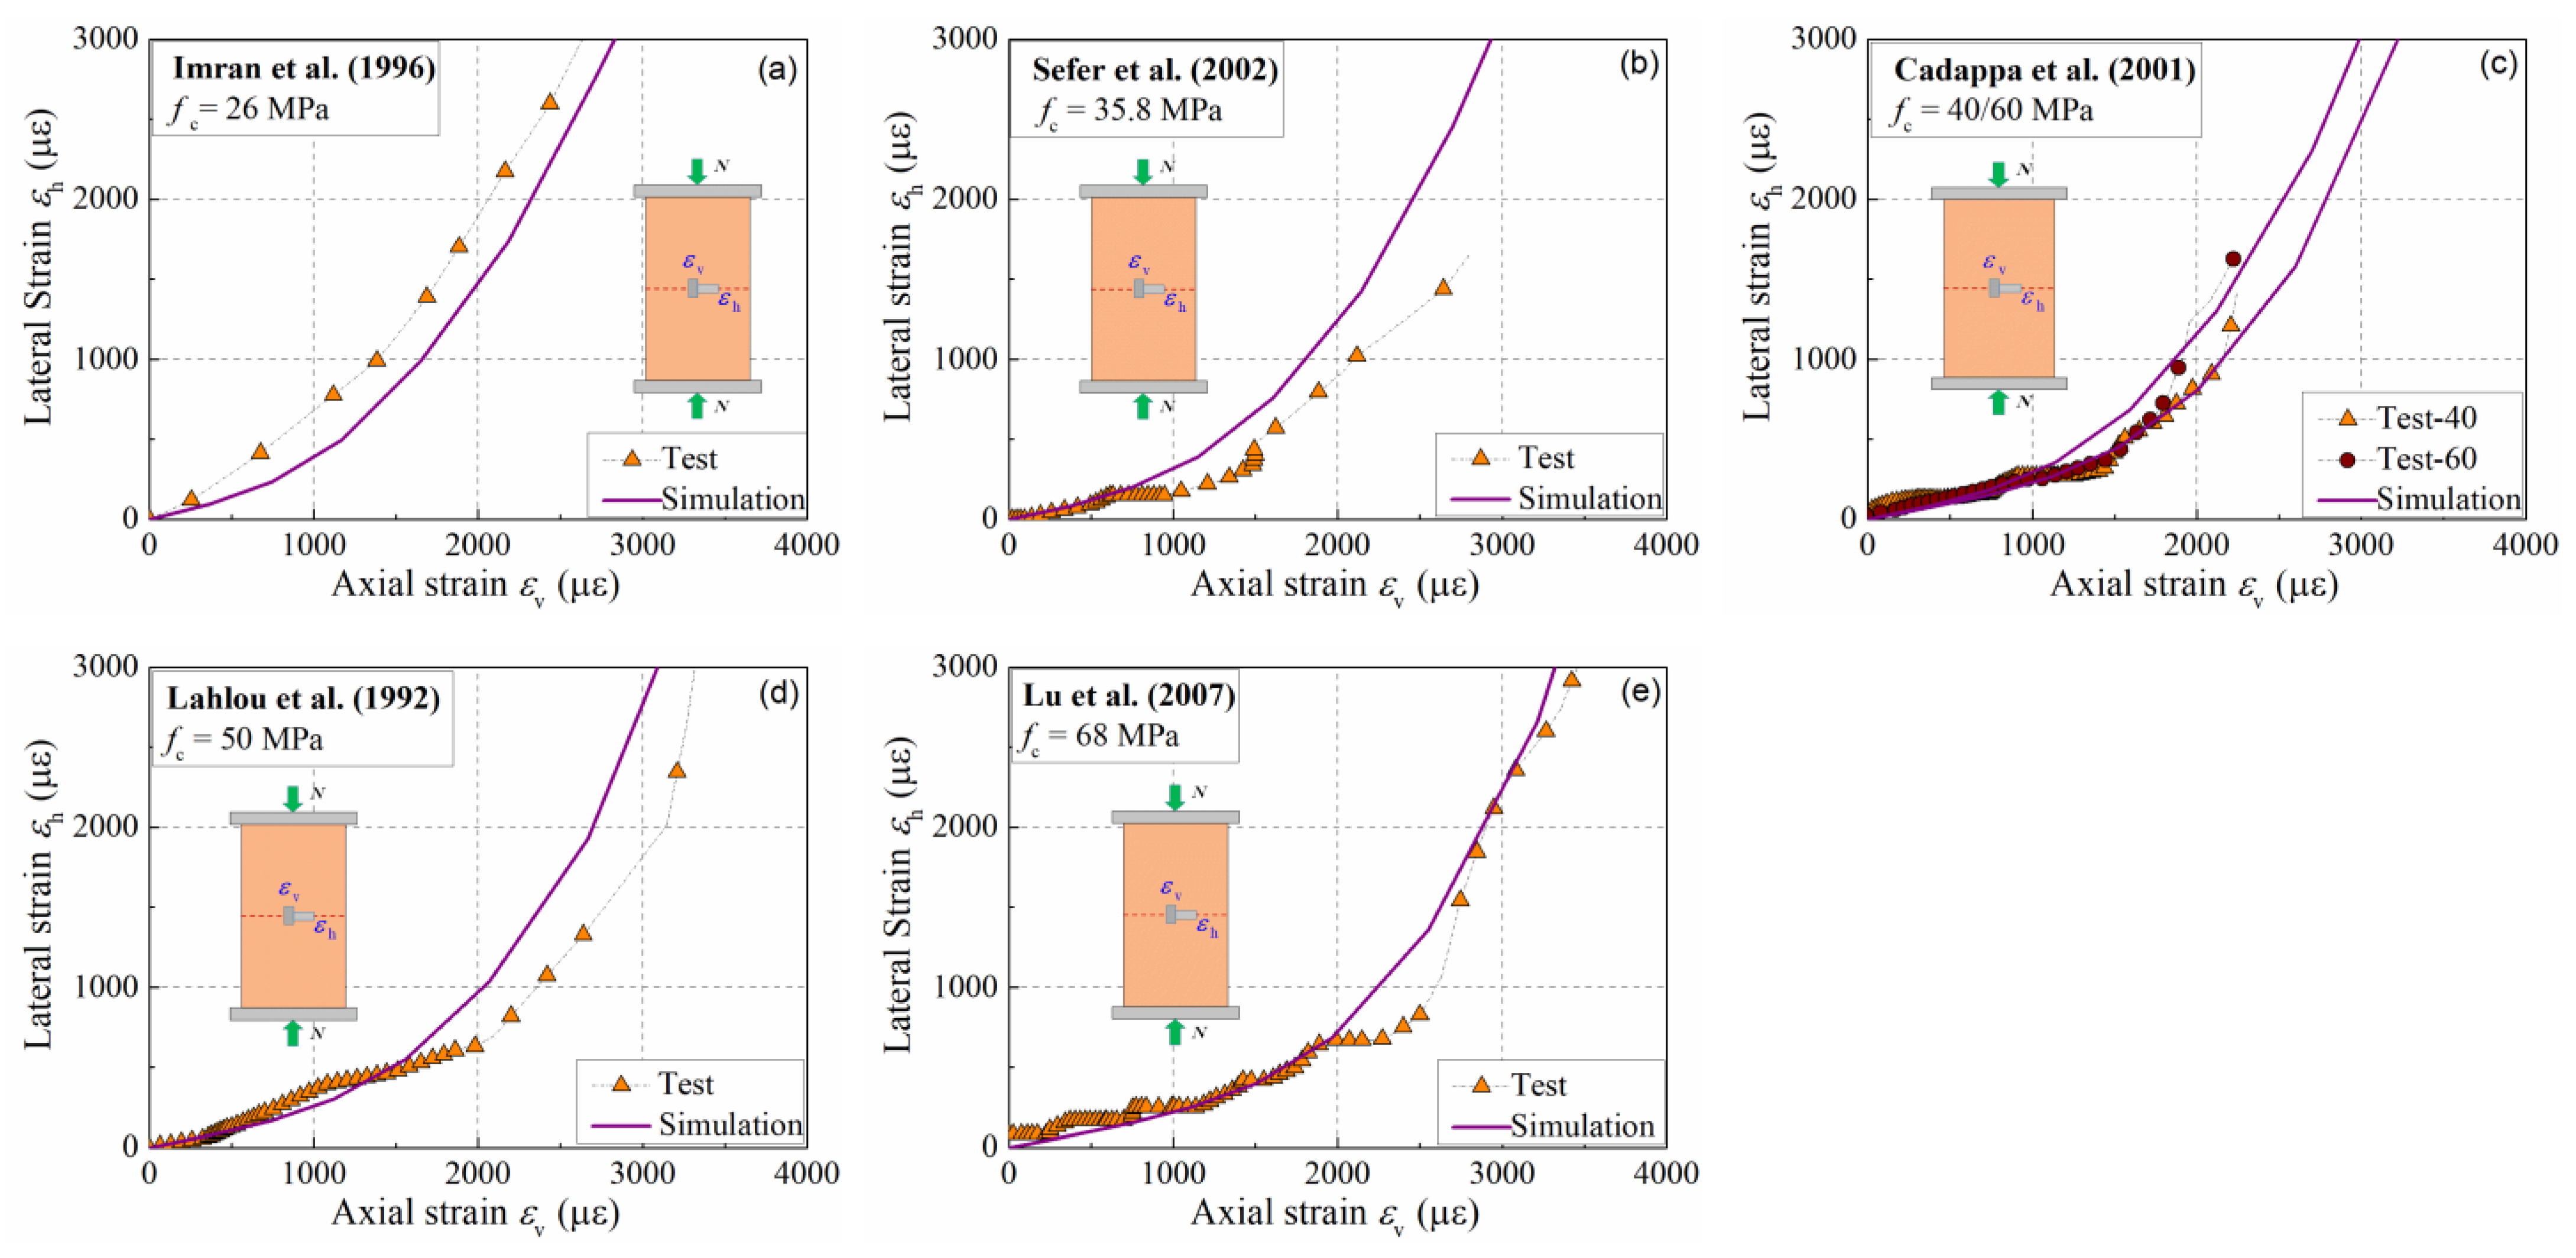
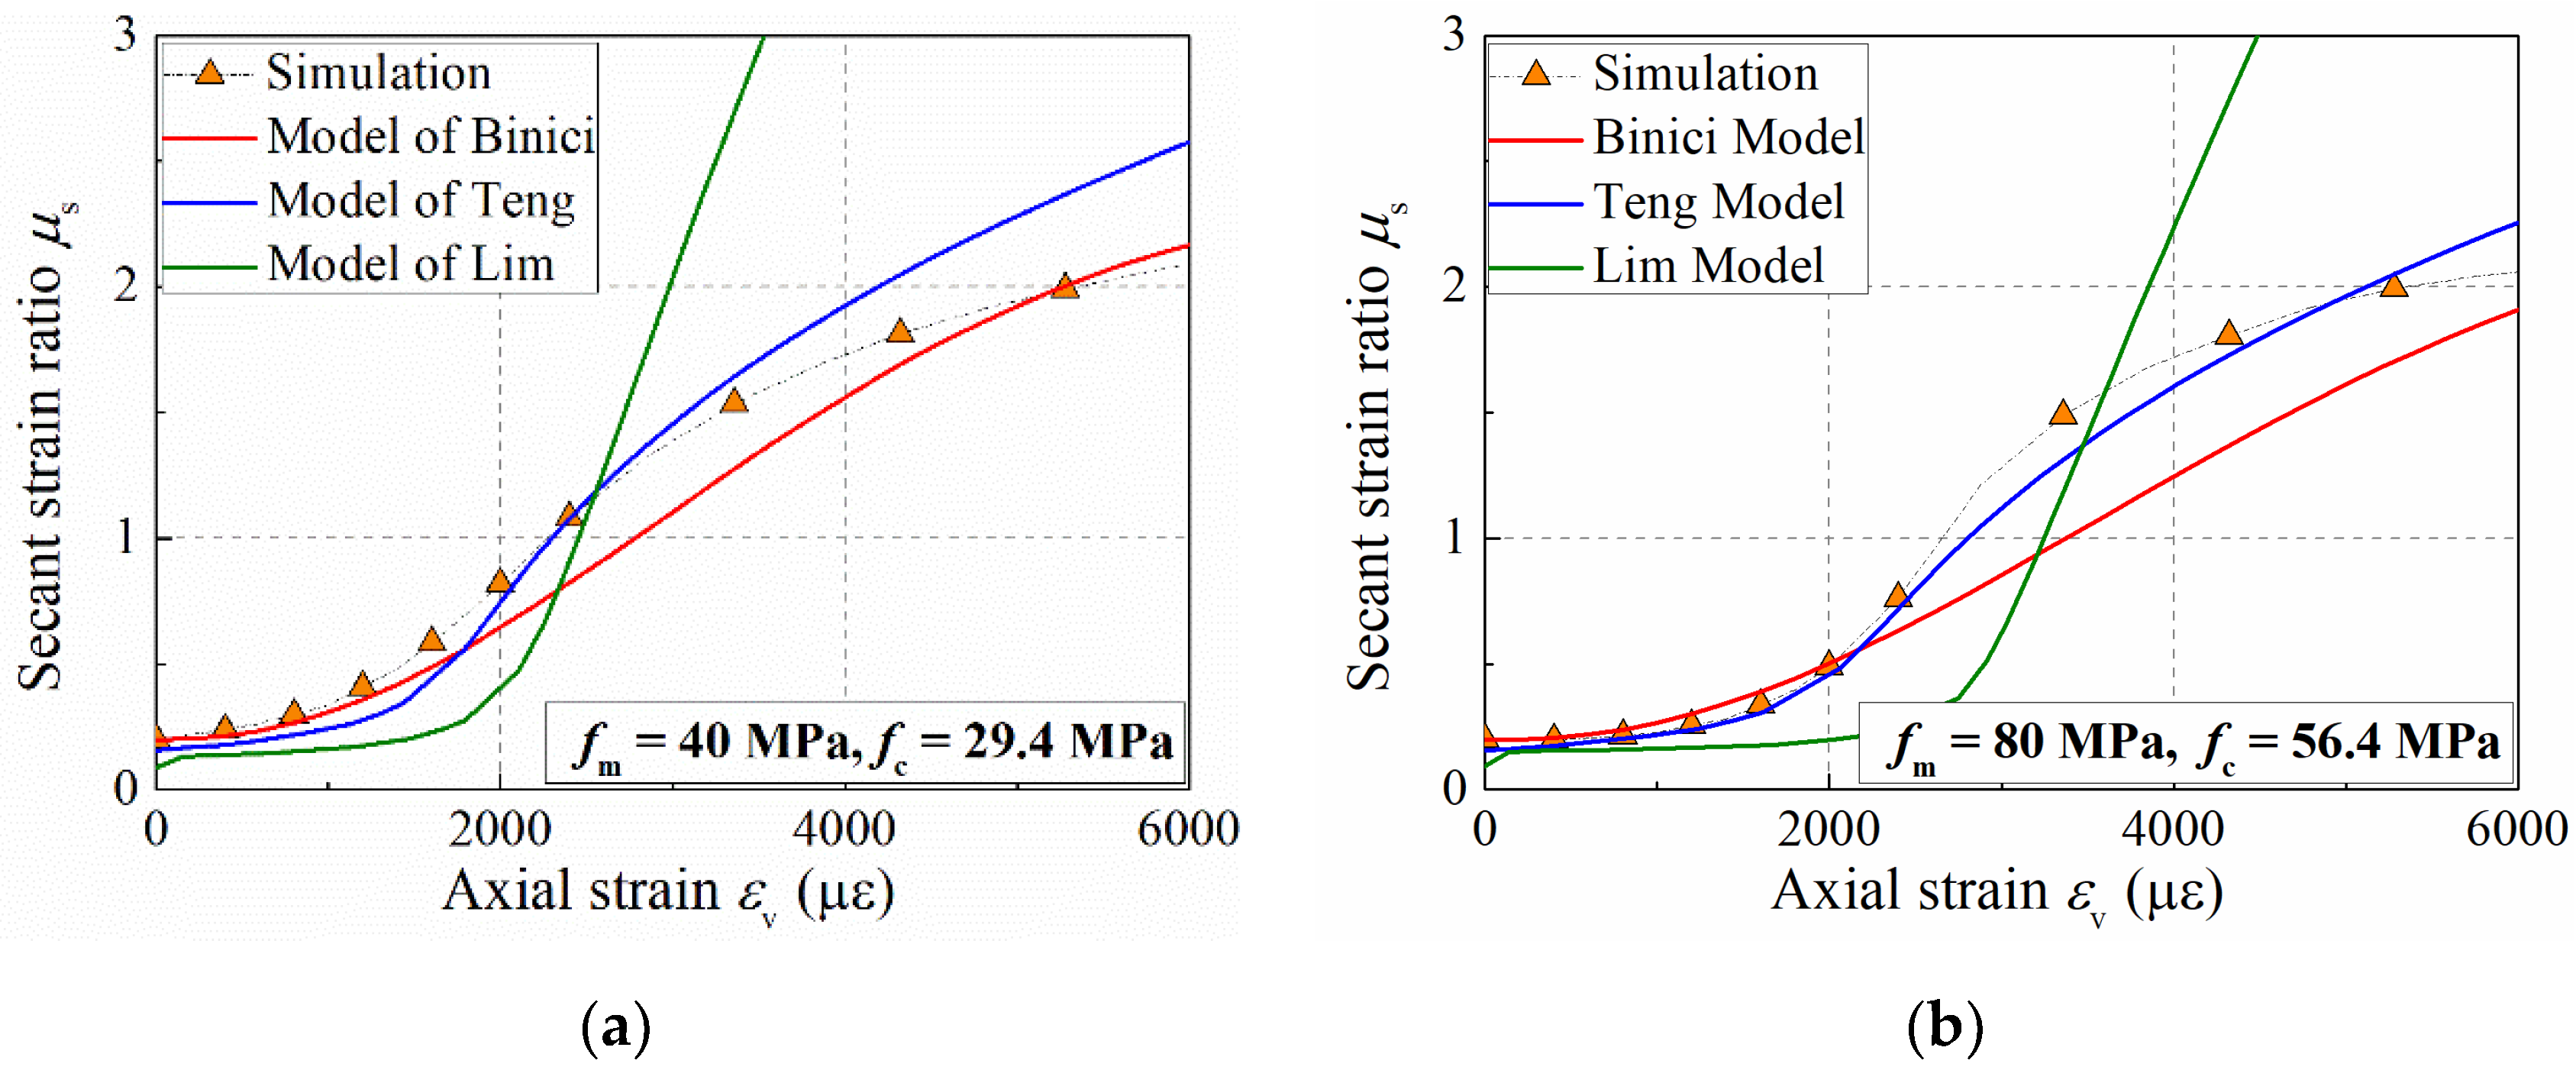
The secant strain ratio–axial strain curves in the simulation are consistent with the results predicted by the formulas of Teng et al. and Binici et al. in the ascending branch of the stress–strain curve of concrete. When the stress–strain curve of concrete enters the descending branch, the simulation of the secant strain ratio is in the range of the theoretical results, which demonstrates the validation of our mesoscale model in predicting the dilation of plain concrete.
We have proposed a new method to predict the dilation behavior of concrete, and the relevant analysis will deepen our understanding of the failure process of concrete. The content in this manuscript is part of our current work, based on which we are trying to investigate the dilation of concrete columns under varying confining pressures, and then propose a formula that can be applied to both unconfined and confined concrete.

Author Contributions

Conceptualization, P.C.; methodology, P.C.; software, X.C.; validation, X.C.; formal analysis, P.C. and H.Z.; investigation, H.Z.; writing—original draft preparation, S.S.; writing—review and editing, H.Z.; visualization, S.S.; supervision, H.Z.; funding acquisition, P.C. All authors have read and agreed to the published version of the manuscript.

Funding

This research was funded by the National Natural Science Foundation of China (grant number 51908381).

Institutional Review Board Statement

Not applicable.

Informed Consent Statement

Not applicable.

Data Availability Statement

Not applicable.

Conflicts of Interest

The authors declare no conflict of interest.

References

  1. Mander, J.B.; Priestley, M.J.N.; Park, R. Theoretical stress-strain model for confined concrete. J. Struct. Eng. 1988, 114, 1804–1826. [Google Scholar] [CrossRef] [Green Version]
  2. Teng, J.G.; Lam, L. Compressive behavior of carbon fiber reinforced polymer-confined concrete in elliptical columns. J. Struct. Eng. 2002, 128, 1535–1543. [Google Scholar] [CrossRef]
  3. Han, L.H.; An, Y.F. Performance of concrete-encased CFST short columns under axial compression. J. Constr. Steel Res. 2014, 93, 62–76. [Google Scholar] [CrossRef]
  4. Tang, Y.; Xiao, J.; Zhang, H.; Duan, Z.; Xia, B. Mechanical properties and uniaxial compressive stress-strain behavior of fully recycled aggregate concrete. Constr. Build. Mater. 2022, 323, 126546. [Google Scholar] [CrossRef]
  5. Zheng, D.; Song, W.; Fu, J.; Xue, G.; Li, J.; Cao, S. Research on mechanical characteristics, fractal dimension and internal structure of fiber reinforced concrete under uniaxial compression. Constr. Build. Mater. 2020, 258, 120351. [Google Scholar] [CrossRef]
  6. Ma, L.; Li, Z.; Liu, J.; Duan, L.; Wu, J. Mechanical properties of coral concrete subjected to uniaxial dynamic compression. Constr. Build. Mater. 2019, 199, 244–255. [Google Scholar] [CrossRef]
  7. Shi, X.; Park, P.; Rew, Y.; Huang, K.; Sim, C. Constitutive behaviors of steel fiber reinforced concrete under uniaxial compression and tension. Constr. Build. Mater. 2020, 233, 117316. [Google Scholar] [CrossRef]
  8. Zhou, W.; Feng, P.; Lin, H. Constitutive relations of coral aggregate concrete under uniaxial and triaxial compression. Constr. Build. Mater. 2020, 251, 118957. [Google Scholar] [CrossRef]
  9. Yang, L.; Xie, H.; Fang, S.; Huang, C.; Chao, Y.J. Experimental study on mechanical properties and damage mechanism of basalt fiber reinforced concrete under uniaxial compression. Structures 2021, 31, 330–340. [Google Scholar] [CrossRef]
  10. Zhu, H.; Yu, H.; Ma, H.; Yang, S. Uniaxial compressive stress-strain curves of magnesium oxysulfate cement concrete. Constr. Build. Mater. 2020, 232, 117244. [Google Scholar] [CrossRef]
  11. Klink, S.A. Poisson’s ratio variations in concrete. Exp. Mech. 1975, 15, 139–141. [Google Scholar] [CrossRef]
  12. Allos, A.E.; Martin, L.H. Factors affecting Poisson’s ratio for concrete. Build. Environ. 1981, 16, 1–9. [Google Scholar] [CrossRef]
  13. Ferretti, E. On Poisson’s ratio and volumetric strain in concrete. Int. J. Fract. 2004, 126, 49–55. [Google Scholar] [CrossRef]
  14. Smahi, R.; Bouafia, Y.; Kachi, M.S. Modeling the biaxial behavior of concrete by damage mechanics with Poisson’s ratio variable. Appl. Mech. Mater. 2015, 749, 391–397. [Google Scholar] [CrossRef]
  15. Raza, A.; Ahmad, A. Prediction of axial compressive strength for FRP-confined concrete compression members. KSCE J. Civ. Eng. 2020, 24, 2099–2109. [Google Scholar] [CrossRef]
  16. Moran, D.A.; Pantelides, C.P.; Reaveley, L.D. Mohr-coulomb model for rectangular and square FRP-confined concrete. Compos. Struct. 2019, 209, 889–904. [Google Scholar] [CrossRef]
  17. Pour, A.F.; Nguyen, G.D.; Vincent, T.; Ozbakkaloglu, T. Investigation of the compressive behavior and failure modes of unconfined and FRP-confined concrete using digital image correlation. Compos. Struct. 2020, 252, 112642. [Google Scholar] [CrossRef]
  18. Ghorbel, E.; Limaiem, M.; Wardeh, G. Mechanical performance of bio-based FRP-confined recycled aggregate concrete under uniaxial compression. Materials 2021, 14, 1778. [Google Scholar] [CrossRef]
  19. Ribeiro, F.; Sena, J.; Branco, F.G. Júlio, E. 3D finite element model for hybrid FRP-confined concrete in compression using modified CDPM. Eng. Struct. 2019, 190, 459–479. [Google Scholar] [CrossRef]
  20. Shayanfar, J.; Rezazadeh, M.; Barros, J.A. Analytical model to predict dilation behavior of FRP confined circular concrete columns subjected to axial compressive loading. J. Compos. Constr. 2020, 24, 04020071. [Google Scholar] [CrossRef]
  21. Shayanfar, J.; Rezazadeh, M.; Barros, J.; Ramezansefat, H. A new dilation model for FRP fully/partially confined concrete column under axial loading. In Proceedings of the 3rd RILEM Spring Convention 2020 Ambitioning a Sustainable Future for Built Environment: Comprehensive Strategies for Unprecedented Challenges, Guimarães, Portugal, 10–14 March 2020; pp. 435–446. [Google Scholar] [CrossRef]
  22. Chang, W.; Zheng, W.; Hao, M. Lateral dilation and limited value of volumetric ratio of stirrups for ultra-high strength concrete confined with spiral stirrups. Mater. Struct. 2021, 54, 125. [Google Scholar] [CrossRef]
  23. Dong, C.; Kwan, A.; Ho, J. Effects of confining stiffness and rupture strain on the performance of FRP confined concrete. Eng. Struct. 2015, 97, 1–14. [Google Scholar] [CrossRef]
  24. Harries, K.A.; Kharel, G. Behavior and modeling of concrete subjected to variable confining pressure. ACI Mater. 2002, 99, 180–189. [Google Scholar]
  25. Mirmiran, A.; Shahawy, M. Dilation characteristics of confined concrete. Mech. Cohesive Frict. Mater. 1997, 2, 237–249. [Google Scholar] [CrossRef]
  26. Pimanmas, A.; Saleem, S. Dilation characteristics of PET FRP-confined concrete. J. Compos. Constr. 2018, 22, 04018006. [Google Scholar] [CrossRef]
  27. Nguyen, H.D.; Choi, E.; Park, K. Dilation behavior of normal strength concrete confined by FRP wire jackets. Constr. Build. Mater. 2018, 190, 728–739. [Google Scholar] [CrossRef]
  28. Binici, B. An analytical model for stress-strain behavior of confined concrete. Eng. Struct. 2005, 27, 1040–1051. [Google Scholar] [CrossRef]
  29. Teng, J.G.; Huang, Y.L.; Lam, L. Theoretical model for fiber-reinforced polymer-confined concrete. J. Compos. Constr. 2007, 11, 201–211. [Google Scholar] [CrossRef]
  30. Lim, J.C.; Ozbakkaloglu, T. Lateral strain-to-axial strain relationship of confined concrete. J. Struct. Eng. 2015, 141, 04014141. [Google Scholar] [CrossRef]
  31. Fuller, W.B.; Thompson, S.E. The laws of proportioning concrete. Trans. Am. Soc. Civ. Eng. 1907, 59, 7–143. [Google Scholar] [CrossRef]
  32. Wriggers, P.; Moftah, S.O. Mesoscale models for concrete: Homogenization and damage behavior. Finite Elem. Anal. Des. 2006, 42, 623–636. [Google Scholar] [CrossRef]
  33. Gal, E.; Ganz, A.; Hadad, L. Development of a concrete unit cell. Int. J. Multiscale Comp. 2008, 6, 499–510. [Google Scholar] [CrossRef]
  34. Shahbeyk, S.; Hosseini, M.; Yaghoobi, M. Mesoscale finite element prediction of concrete failure. Comput. Mater. Sci. 2011, 50, 1973–1990. [Google Scholar] [CrossRef]
  35. Jin, L.; Xia, H.; Jiang, X. Size effect on shear failure of CFRP-strengthened concrete beams without web reinforcement: Meso-scale simulation and formulation. Compos. Struct. 2020, 236, 11895. [Google Scholar] [CrossRef]
  36. Donza, H.; Cabrera, O.; Irassar, E.F. High-strength concrete with different fine aggregate. Cem. Concr. Res. 2002, 32, 1755–1761. [Google Scholar] [CrossRef]
  37. Meddah, M.S.; Zitouni, S.; Belaabes, S. Effect of content and particle size distribution of coarse aggregate on the compressive strength of concrete. Constr. Build. Mater. 2010, 24, 505–512. [Google Scholar] [CrossRef]
  38. Jin, L.; Yu, W.; Du, X. Meso-scale simulation of size effect on concrete dynamic splitting tensile strength: Influence of aggregate content and maximum aggregate size. Eng. Fract. Mech. 2020, 230, 106979. [Google Scholar] [CrossRef]
  39. Kim, S.M.; Al-Rub, R.K.A. Meso-scale computational modeling of the plastic-damage response of cementitious composites. Cem. Concr. Res. 2011, 41, 339–358. [Google Scholar] [CrossRef]
  40. Song, Z.; Lu, Y. Mesoscopic analysis of concrete under excessively high strain rate compression and implications on the interpretation of test data. Int. J. Impact Eng. 2012, 46, 41–55. [Google Scholar] [CrossRef]
  41. Jin, L.; Yu, W.; Du, X. Mesoscopic numerical simulation of dynamic size effect on the splitting tensile strength of concrete. Eng. Frac. Mech. 2019, 209, 317–332. [Google Scholar] [CrossRef]
  42. Jin, L.; Chen, H.; Wang, Z. Size effect on axial compressive failure of CFRP-wrapped square concrete columns: Tests and simulations. Compos. Struct. 2020, 254, 112843. [Google Scholar] [CrossRef]
  43. Lubliner, J.; Oliver, J.; Oller, S. A plastic-damage model for concrete. Int. J. Solids Struct. 1989, 25, 299–326. [Google Scholar] [CrossRef]
  44. Lee, J.; Fenves, G.L. Plastic-damage model for cyclic loading of concrete structures. J. Eng. Mech. 1998, 124, 892–900. [Google Scholar] [CrossRef]
  45. Cao, M. Research on damage plastic calculation method of ABAQUS concrete damaged plasticity model. Transp. Stand. 2012, 2, 51–54. [Google Scholar]
  46. Tian, L.; Hou, J. Reasonable plastic damaged factor of concrete damaged plastic model of ABAQUS. J. Hubei Univ. (Nat. Sci.) 2015, 37, 340–347. [Google Scholar]
  47. Yao, F.; Guan, Q.; Wang, P. Simulation analysis of damage factor based on ABAQUS damage plasticity model. Struct. Eng. 2019, 35, 76–81. [Google Scholar]
  48. Grote, D.L.; Park, S.W.; Zhou, M. Dynamic behavior of concrete at high strain rates and pressures: Experimental characterization. Int. J. Impact Eng. 2001, 25, 869–886. [Google Scholar] [CrossRef]
  49. Su, J. The Research on the Size Effect of Concrete Behavior in Compression and Tension. Hunan: Hunan University 2013. Available online: https://kns.cnki.net/kcms/detail/detail.aspx?dbcode=CDFD&dbname=CDFD1214&filename=1013348096.nh&uniplatform=NZKPT&v=SIF9m1fDwexpnbE4w2N6m5P5aeKE8AWXCZifpfHgEbdPdOzGZlGihSf10XAXu1v3 (accessed on 20 March 2022). (In Chinese).
  50. Xiao, J.; Li, W.; Corr, D.J. Effects of interfacial transition zones on the stress-strain behavior of modeled recycled aggregate concrete. Cem. Concr. Res. 2013, 52, 82–99. [Google Scholar] [CrossRef]
  51. Guo, Z.H.; Zhang, X.Q.; Zhang, D.C. Experimental investigation of the complete stress-strain curve of concrete. J. Build. Struct. 1982, 1, 1–12. [Google Scholar]
  52. Chen, P.; Liu, J.X.; Cui, X.M.; Si, S.P. Mesoscale analysis of concrete under axial compression. Constr. Build. Mater. 2022, 337, 127580. [Google Scholar] [CrossRef]
  53. Huang, Y.J.; Yang, Z.J.; Chen, X.W. Monte Carlo simulations of mesoscale dynamic compressive behavior of concrete based on X-ray computed tomography images. Int. J. Impact Eng. 2016, 97, 102–115. [Google Scholar] [CrossRef]
  54. Jin, L.; Du, M.; Li, D. Effects of cross-section size and transverse rebar on the behavior of short squared RC columns under axial compression. Eng. Struct. 2017, 142, 223–239. [Google Scholar] [CrossRef]
  55. Imran, I.; Pantazopoulou, S.J. Experimental study of plain concrete under triaxial stress. ACI Struct. J. 1996, 93, 589–601. [Google Scholar] [CrossRef]
  56. Sefer, D.; Carol, I.; Gettu, R.; Etse, G. Study of the behavior of concrete under triaxial compression. J. Eng. Mech. 2002, 128, 156–163. [Google Scholar] [CrossRef]
  57. Candappa, D.C.; Sanjayan, J.G.; Setunge, S. Complete triaxial stress-strain curves of high-strength concrete. J. Mater. Civ. Eng. 2001, 13, 209–215. [Google Scholar] [CrossRef]
  58. Lahlou, K.; Aitcin, P.C.; Chaallal, O. Behavior of high-strength concrete under confined stress. Cem. Concr. Compos. 1992, 14, 185–193. [Google Scholar] [CrossRef]
  59. Lu, X.; Hsu, C.T.T. Stress-strain relations of high-strength concrete under triaxial compression. J. Mater. Civil Eng. 2007, 19, 261–268. [Google Scholar] [CrossRef]
  60. Spoelstra, M.R.; Monti, G. FRP-confined concrete model. J. Compos. Constr. 1999, 3, 143–150. [Google Scholar] [CrossRef]
  61. Marques, S.P.; Marques, D.C.; Siva, J.; Cavalcante, M.A. Model for analysis of short columns of concrete confined by fiber-reinforced polymer. J. Compos. Constr. 2004, 8, 332–340. [Google Scholar] [CrossRef]
Figure 1. Classification principle of each phase.
Buildings 12 00908 g001
Figure 2. Mesoscale model of concrete cylinder.
Buildings 12 00908 g002
Figure 3. Mechanical properties of concrete specimens with varying mortar strengths: (a) stress–strain curve; (b) peak values.
Buildings 12 00908 g003
Figure 4. Comparison of the lateral–axial strain relationship: (a) fc = 26 Mpa; (b) fc = 35.8 Mpa; (c) fc = 40/60 Mpa; (d) fc = 50 Mpa; (e) fc = 68 MPa.
Buildings 12 00908 g004
Figure 5. The axial and lateral strain of the specimen.
Buildings 12 00908 g005
Figure 6. Secant strain ratio of concrete under axial load.
Buildings 12 00908 g006
Figure 7. Distribution of the lateral strain along the specimen height: (a) location of the measured section; (b) distribution of the lateral strain.
Buildings 12 00908 g007
Figure 8. Field of radial displacement and stiffness damage in concrete specimen: (a) Ur at 1000 με; (b) Ur at 2000 με; (c) Ur at 4000 με; (d) SDEG at 2000 με.
Buildings 12 00908 g008
Figure 9. Distribution of the lateral strain along circumferential direction: (a) middle section of the specimen; (b) distribution of the lateral strain.
Buildings 12 00908 g009
Figure 10. Dilation behavior of concrete in radial direction: (a) εhεv curve; (b) μsεv curve.
Buildings 12 00908 g010
Figure 11. Volumetric dilation behavior of the concrete specimen: (a) σv–εvol curve; (b) stress ratio at maximum compressive strain and zero volumetric strain.
Buildings 12 00908 g011
Figure 12. The secant strain ratio–strain relationship: (a) fm = 40 MPa; (b) fm = 80 MPa.
Buildings 12 00908 g012
Publisher’s Note: MDPI stays neutral with regard to jurisdictional claims in published maps and institutional affiliations.

