Article

Integrated Economic and Environmental Assessment-Based Optimization Design Method of Building Roof Thermal Insulation

College of Civil Engineering, Henan University of Technology, Zhengzhou 450001, China
*
Author to whom correspondence should be addressed.
Buildings 2022, 12(7), 916; https://doi.org/10.3390/buildings12070916
Submission received: 21 May 2022 / Revised: 27 June 2022 / Accepted: 28 June 2022 / Published: 29 June 2022
(This article belongs to the Special Issue Urban Climate, Comfort and Building Energy Performance)

Abstract

:
The design of thermal insulation in roofs is very important to reduce energy consumption and decrease the environmental impacts of buildings. An integrated economic and environmental assessment-based optimization design method is presented in this paper to find the best candidate insulation design scheme for building roofs, including the determination of roof thermal insulation type and the optimum insulation thickness. In the optimization design method, a zonal method-based double-skin ventilation roof heat transfer model is developed to predict the roof energy consumption. Economic and environmental benefits due to thermal insulation are calculated by using the economic analysis model, the environmental analysis model, and roof energy consumption. Moreover, an integrated dimensionless economic and environmental assessment index is proposed to evaluate different roof thermal insulation design schemes. The optimum insulation thickness is determined by maximizing the sum of economic benefit and environmental benefit due to thermal insulation. The validation results in a real building show that the predicted data for the zonal-based double-skin ventilation roof heat transfer model agreed well with the measured data, with a maximum relative error of 8.2%. The optimum insulation thickness of extruded polystyrene (EPS), mineral wool (MW), and polyurethane (PU) was between 0.082 m and 0.171 m for the single-skin roof in a low-temperature granary in Changsha region in China. The ranking of the integrated assessment indexes of thermal insulation is EPS > MW > PU. A double-skin ventilation roof can reduce the optimum thickness of thermal insulation. The best result is obtained by EPS for the double-skin roof with a grey outer surface color for the low-temperature granary roof in Changsha region in China. The influencing factors of insulation type, roof structure, and roof outer-surface color should be considered in finding the best candidate insulation design solution for building roofs. The integrated economic and environmental assessment-based optimization design method can help designers to efficiently find the best design scheme of thermal insulation to maximize the sum of economic benefit and environmental benefit for building roofs.

1. Introduction

The building sector has long been the main consumer of the world’s energy [1]. Existing buildings account for about 40% of the total energy consumption in the United States, Europe, and the other developed countries [2]. The proportion of building energy consumption of the total social energy consumption is about 25% in China [3]. The roof is the part of the building envelope that receives the most solar radiation. A great deal of external heat is transferred into the building through the roof. The employment of roof insulation is one of the most effective ways of reducing building energy consumption [4]. However, the production process of roof thermal insulation consumes massive amounts of energy and produces a large amount of environmental pollutants [5,6,7]. Therefore, the design of roof thermal insulation is not only an economical issue, with the aim of reducing building energy consumption, but also an environmental issue, with the aim of reducing the impact of thermal insulation production on the environment [8,9]. It has become more and more important to develop a comprehensive economic and environmental optimization method for thermal insulation in building roofs [10].
Many researchers have focused on the economic analysis of building thermal insulation [11]. The goal of economic analysis of building insulation is to minimize the sum of the energy consumption costs of HVAC systems and thermal insulation investment costs over the whole life cycle [12]. The energy consumption cost of an HVAC system is closely related to the economic performance of thermal insulation. Therefore, many different methods are used to predict the energy consumption of walls and roofs [13], such as cooling and heating degree-day analysis [14,15,16], energy consumption prediction models [17,18,19], and energy consumption simulation software [20,21,22]. The operating time of an HVAC system assumed in the degree-day estimation method is inconsistent with its actual operating time [23]. The degree-day estimation method cannot predict the building energy consumption accurately, which will affect the accuracy of economic analysis results [24,25,26]. There is still a lack of accurate double-skin ventilation roof heat transfer models which can forecast building roof energy consumption accurately. Moreover, existing energy consumption simulation software also cannot predict energy consumption of the double-skin ventilation roof accurately [27]. Therefore, the development of accurate double-skin ventilation roof heat transfer models is very important to determine the optimal insulation thickness in double-skin ventilation roofs [28,29,30].
On the other hand, some researchers have also paid attention to the environmental impacts of building products [10]. Wi et al. [31] evaluated the pollutant emissions of 18 kinds of construction products during their combustion process quantitatively. Dylewski and Adamczyk [32] presented a method to assess the environmental benefits of four types of wall thermal insulation in heating buildings in Poland. Furthermore, they conducted an analysis of the environmental impact of polystyrene plaster in the external walls of heating buildings in Poland [33]. Buyle et al. [34] pointed out that the research on energy saving and on the use of eco-friendly materials were important research fields for life cycle assessment (LCA) in the building construction industry. Monteiro et al. [35] assessed the environmental impact of building envelope construction with varying thermal performance of a house in Southwest Europe under two operating patterns using the LCA method.
Existing studies have investigated the economic performance and the environmental performance of building thermal insulation, respectively. However, studies on the combined economic and environmental benefits of thermal insulation in buildings are insufficient [8,9], which is not conducive to selecting an appropriate building thermal insulation design scheme. Therefore, it is necessary to develop an integrated economic and environmental assessment-based optimization design method of building roof thermal insulation, which is presented in this paper. The novelty of this study is in developing an accurate double-skin ventilation roof heat transfer model for predicting the roof energy consumption and presenting an integrated economic and environmental assessment-based optimization design method for building roof thermal insulation. The study proposed in this paper can search for the optimal roof thermal insulation design scheme to improve the energy response of the building roofs. It is able to respond simultaneously to economic issues, environmental issues, energy savings, and the sustainability of building roof thermal insulation [10]. The remainder of this paper is organized as follows. Section 2 presents the overview of the integrated economic and environmental assessment-based optimization design method. Section 3 provides a description of the building and environmental cost analysis of thermal insulation. Section 4 presents the results and discussions of the optimization design method for roof thermal insulation. Finally, a conclusion is drawn.

2. Methodology

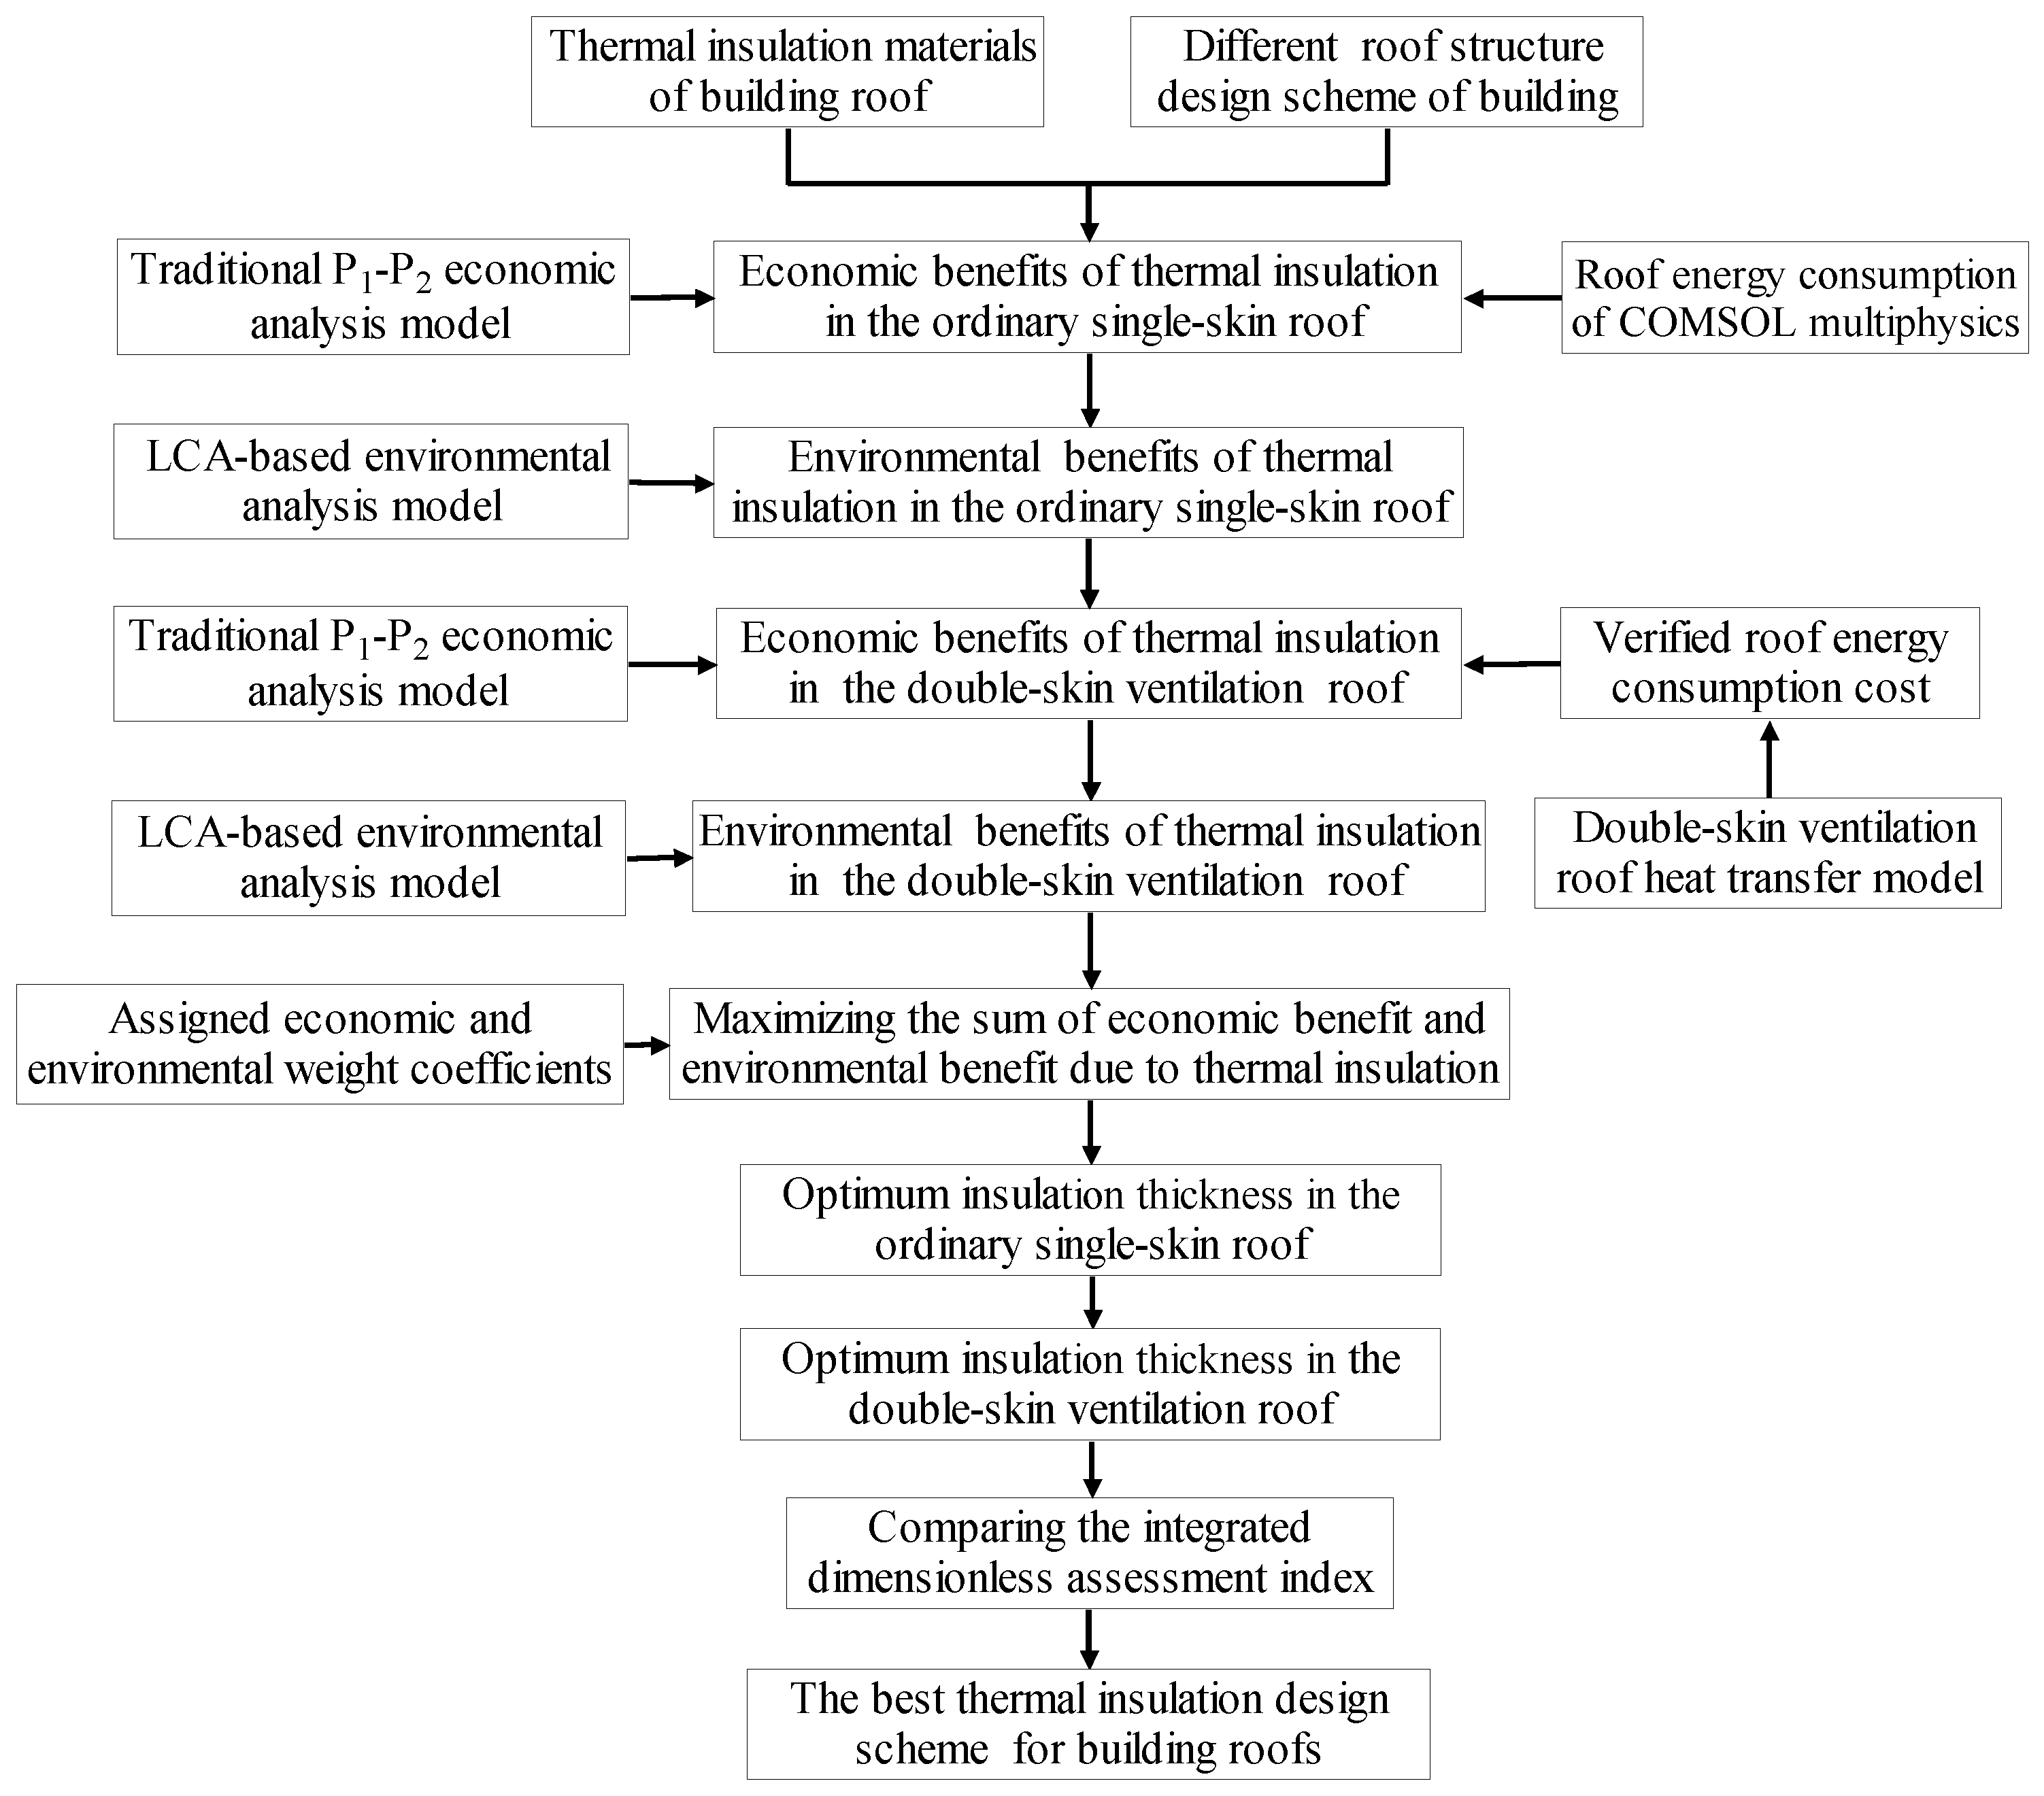
2.1. Overview of the Optimization Design Method for Roof Insulation

An integrated economic and environmental assessment-based optimization design method is presented in this paper for building roof thermal insulation using the economic analysis model, environmental analysis model, and an integrated dimensionless assessment index, comprehensively. Figure 1 shows the block diagram of the integrated economic and environmental assessment-based optimization design method for roof insulation. A zonal method-based double-skin ventilation roof heat transfer model is presented and used to predict roof energy consumption. The traditional P1-P2 economic analysis model is utilized to analyze the economic benefits of roof insulation. The LCA-based environmental analysis model is used to analyze the environmental benefits of roof insulation. An integrated dimensionless economic and environmental assessment index is presented to evaluate thermal insulation in building roofs. The integrated dimensionless assessment index can eliminate the influence of different units of economic benefit and environmental benefit. The optimum thermal insulation of building roofs is determined by maximizing the sum of economic benefit and environmental benefit due to thermal insulation. The thermal insulation with the maximum integrated assessment index is the best candidate insulation design solution for building roofs.
In the integrated economic and environmental assessment-based optimization design method, economic benefit is determined by using the general LCA-based economic analysis model of roof insulation. Environmental benefit is also determined by using the general LCA-based environmental analysis model. The assigned economic and environmental weight coefficients of the comprehensive assessment index can be determined according to actual engineering needs, promoting LCA applications in building construction industry. Therefore, the integrated economic and environmental assessment-based optimization design method presented can be applied to building roofs in different climatic regions and different thermal insulation materials. The integrated economic and environmental assessment-based optimization design method presented can be used to find the best candidate insulation design scheme for a building’s roof, including the determination of roof thermal insulation type and the optimum insulation thickness.

2.2. Building Roof Energy Consumption

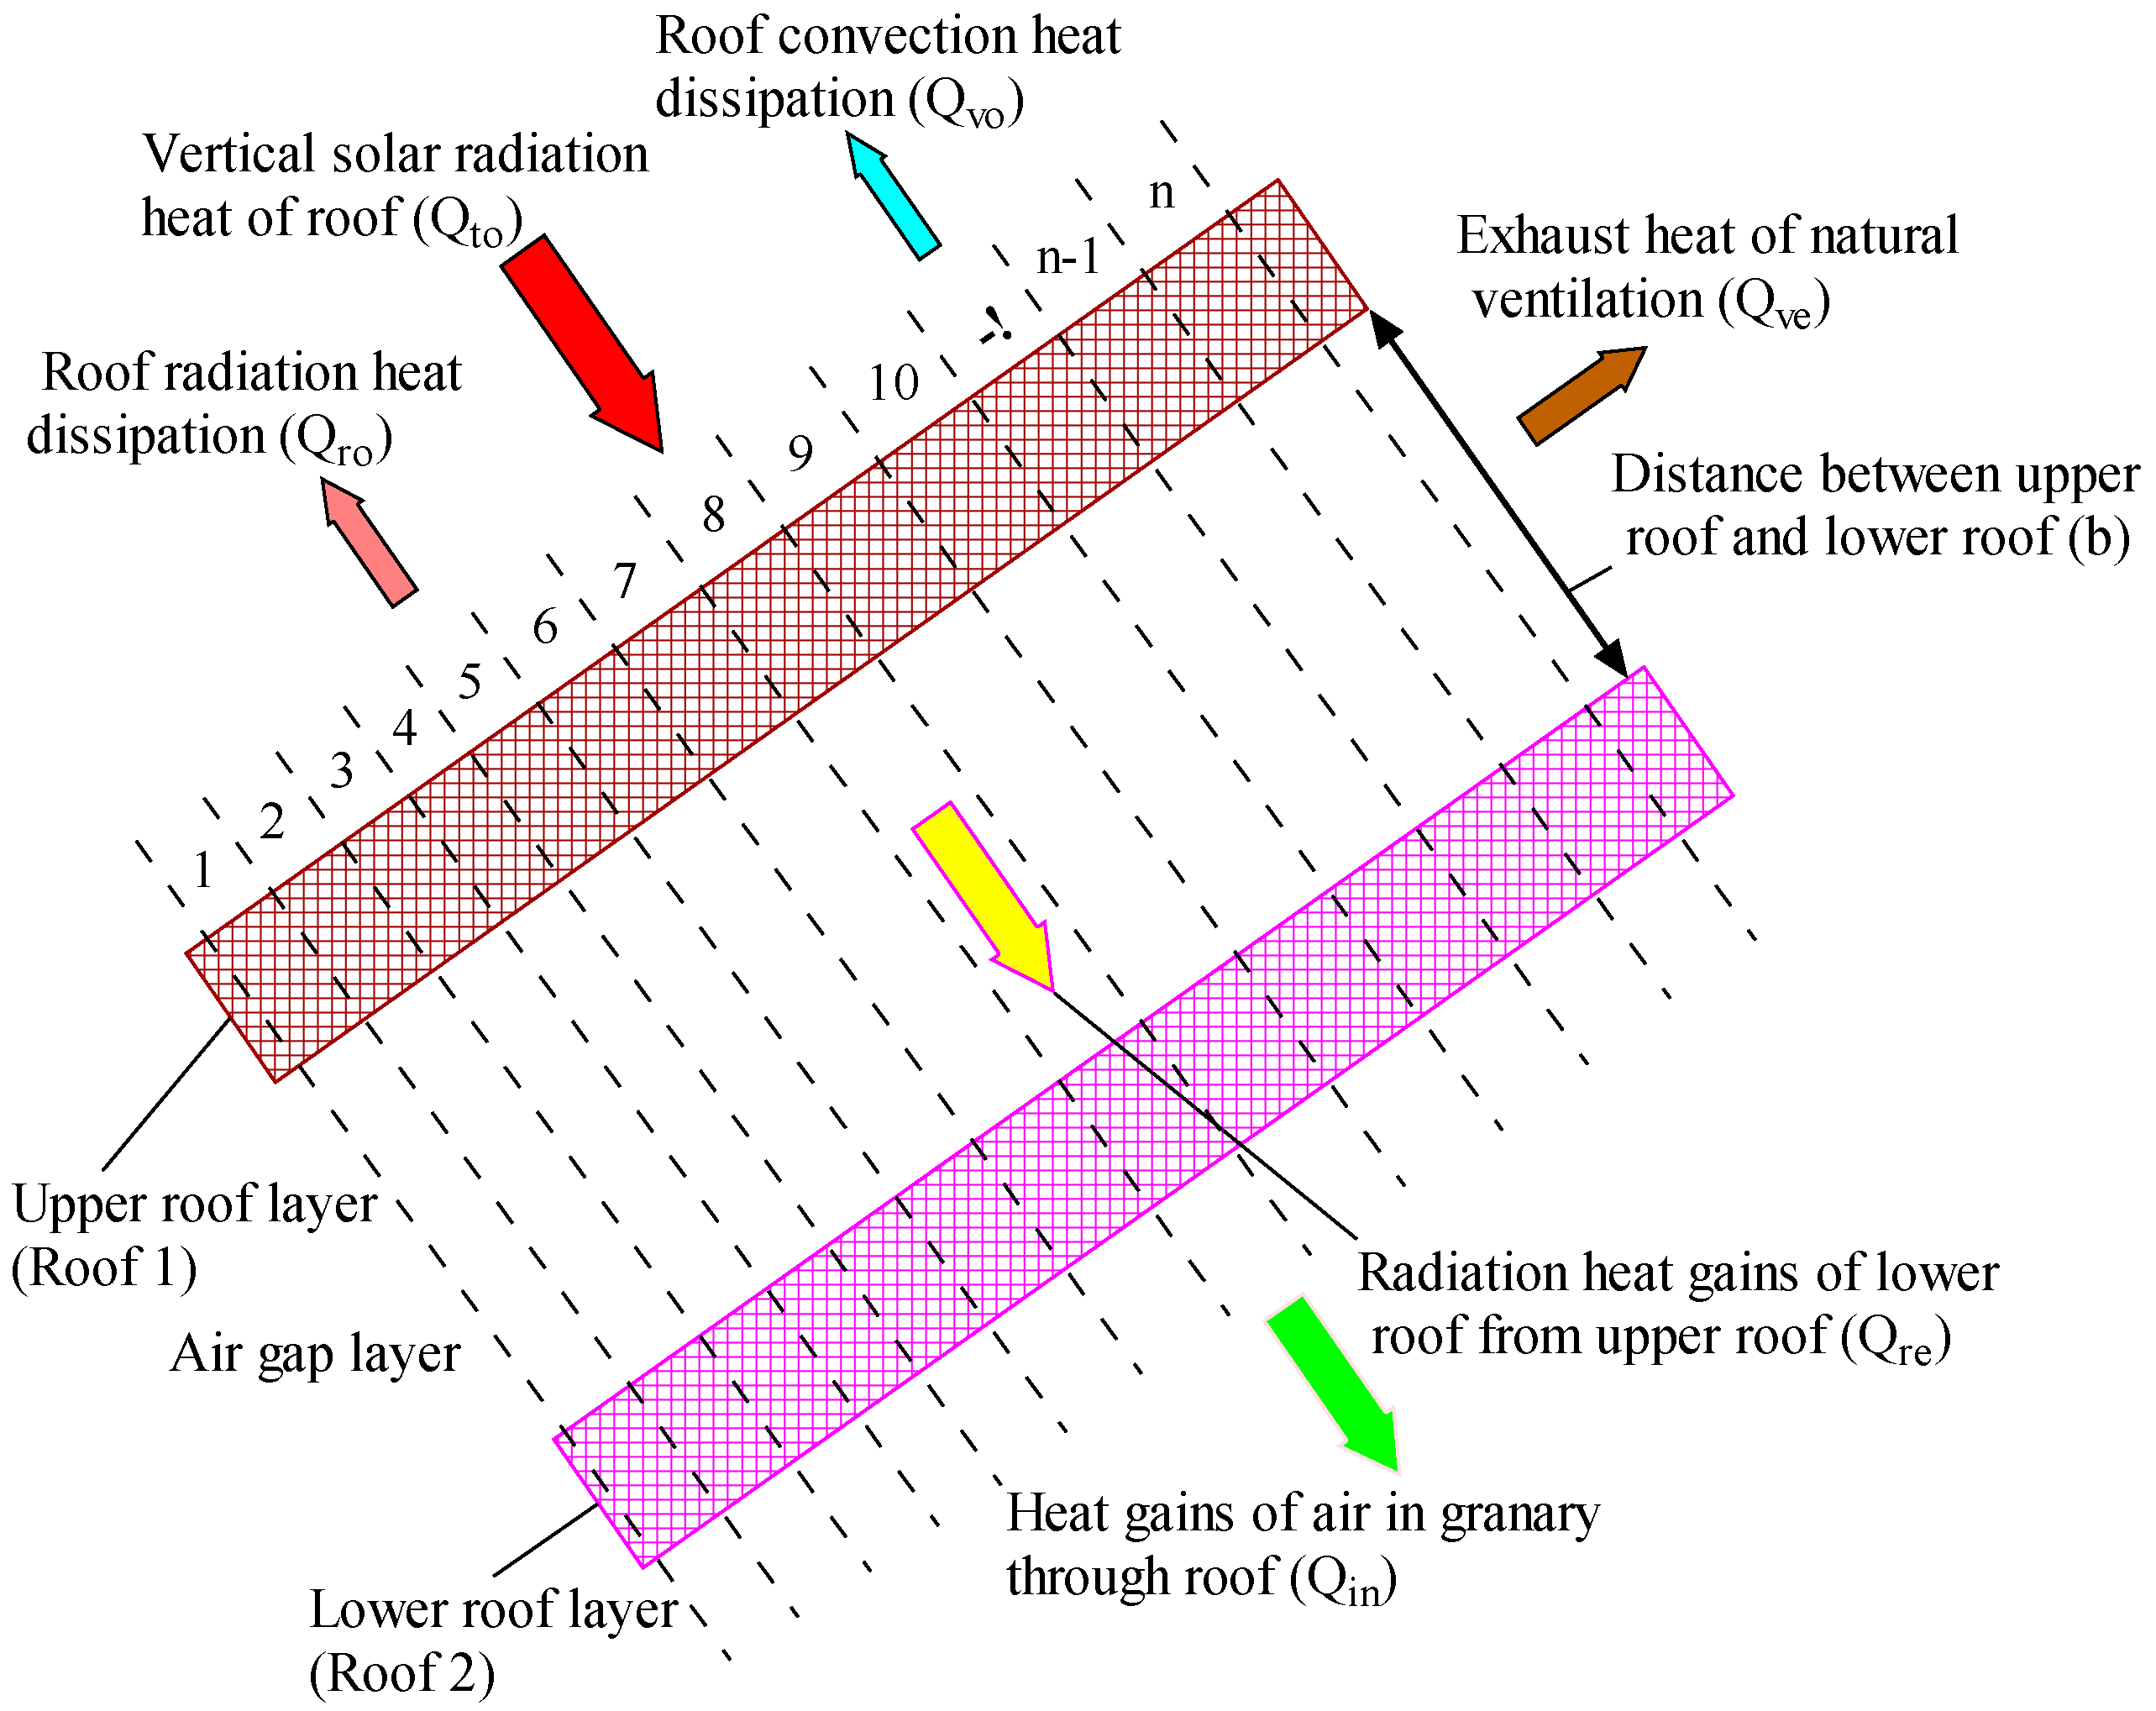
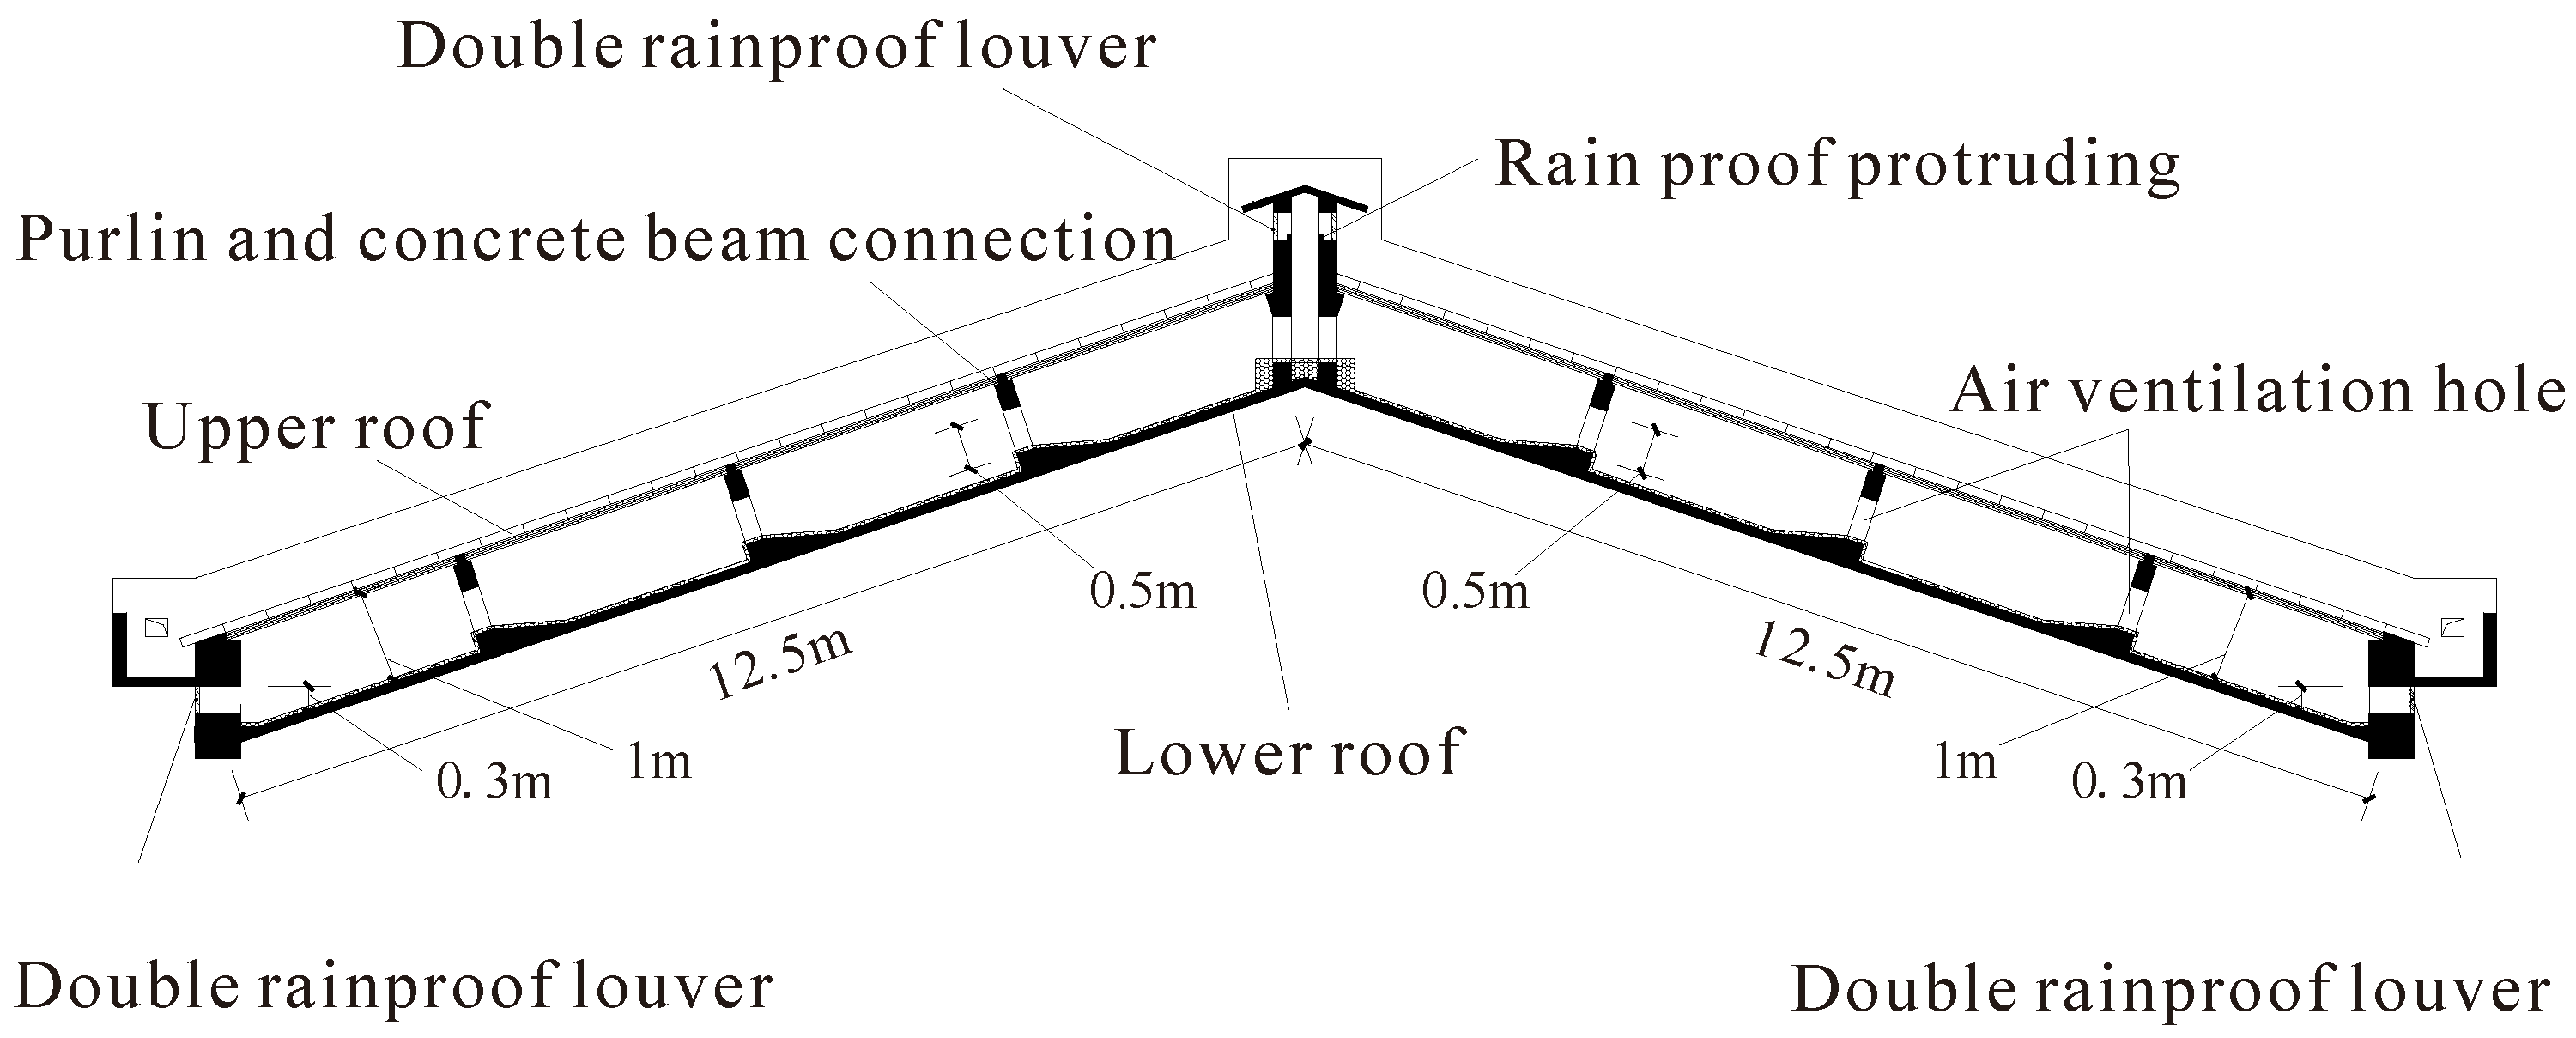
2.2.1. Zonal Method-Based Double-Skin Ventilation Roof Heat Transfer Model

In a double-skin ventilation roof, radiation heat transfer is highly coupled with natural convection heat transfer. It is necessary to develop heat transfer models and to understand the heat transfer mechanism of a double-skin ventilation roof. Some solar radiation heat absorbed by the upper roof is transferred to the external atmospheric environment by radiation heat transfer and convection heat transfer. The other solar radiation heat absorbed by the upper roof is mainly transferred to the lower roof by radiation heat transfer. Some heat will be transferred to the external atmospheric environment along with the natural ventilation airflow in the air gap between the upper and lower roofs. Figure 2 shows the heat transfer mechanism of a double-skin ventilation roof.
The double-skin ventilation roof heat transfer model is a typical 2D model with lateral and vertical heat transfer. As shown in Figure 2, there are three layers (i.e., the upper roof layer, air gap layer, and lower roof layer) from the outside to the inside of a double-skin ventilation roof. Each layer is divided into several cells according to the length of the double-skin ventilation roof. In order to simplify the heat transfer calculation process, the following assumptions are made: (1) each cell of the layers is uniform; (2) the physical properties of the center point can stand for the whole cell; (3) the porous material is continuous, uniform, and isotropic; (4) the physical parameters of the material are constant without changing with temperature; (5) conductive heat transfer in the slope direction of the sloping roof layers is neglected; and (6) the thermal conduction of the adjacent zones in the slope direction of the sloping roof is neglected.
The transient transfer heat flux through the upper roof layer can be derived by solving Equation (1).
( m c ) u p , i T u p , i t = A u p , i h u p - o u t ( T s o , a i r T u p , i ) + A u p , i h u p - g a p ( T g a p , i T u p , i )
T s o , a i r = T o u t + α I t / h u p - o u t ε u p Δ R / h u p - o u t
I t = H b ( cos θ / cos θ z ) + 0.5 H d ( 1 + cos θ ) + 0.5 ρ g r H ( 1 cos β )
where m is the quality, kg. c is the specific heat capacity, J/(kg·K). A u p , i is the area of the ith control unit of the upper roof, m2. T u p , i is the temperature of the ith control unit of the upper roof, K. h u p - o u t is the outdoor convective heat transfer coefficient, W/(m2·K). In this study, h u p - o u t = 23.26 W/(m2·K) [36]. h u p - g a p is the convective heat transfer coefficient between the upper roof and the air gap, W/(m2·K). T s o , a i r is the solar-air temperature, K. T u p , i is the outdoor surface temperature of the ith control unit of the upper roof, K. T g a p , i is the temperature of the ith control unit of the air gap, K. ε u p is the thermal emittance of the upper surface of the roof. α is the upper surface solar absorbance coefficient. I t is the total solar radiation. H b is the direct horizontal solar radiation, W/m2. H d is the diffuse solar horizontal radiation, W/m2. H is the global horizontal solar radiation, W/m2. ε u p Δ R / h o u t is the correction factor. The correction factor is 0 when the surface is vertical. θ is the incident angle. β is the roof slope. β = 90 ° is used for a vertical roof. β = 0 ° is used for the horizontal roof.
The transient transfer heat flux through the air gap between upper and lower roofs can be derived by solving Equation (4):
( m c ) g a p , i T g a p , i t = A g a p , i h u p - g a p ( T u p , i T g a p , i ) + A g a p , i h d n - g a p ( T d n , i T g a p , i ) + ( m g a p c g a p , i 1 T g a p , i 1 m g a p c g a p , i T g a p , i )
where T g a p , i 1 is the temperature of the i − 1th control unit of the air gap, K. A g a p , i is the area of the ith control unit of the air gap, m2. T d n , i is the temperature of the ith control unit of the lower roof, K. h d n - g a p is the convective heat transfer coefficient between the lower roof and the air gap, W/(m2·K). m g a p is the quality of air flow in the air gap, kg/s. c g a p , i is the specific heat capacity of the ith control unit of the air gap, kJ/(kg·K). c g a p , i 1 is the specific heat capacity of the i − 1th control unit of the air gap, kJ/(kg·K).
The transient transfer heat flux through the lower roof can be derived by solving Equation (5):
( m c ) d n , i T d n , i t = A d n , i h d n - g a p ( T g a p , i T d n , i ) + A d n , i h d n - i n ( T i n T d n , i )
where A d n , i is the area of the ith control unit of the lower roof, m2. h d n - i n is the convective heat transfer coefficient between the lower roof and the indoor air, W/(m2·K). In this study, h d n - i n = 8.72 W/(m2·K) [36]. T d n , i is the indoor surface temperature of the ith control unit of the lower roof, K. T i n is the indoor air temperature, K.
To solve the partial differential equations of Equations (1), (4), and (5), these partial differential equations must be linearly discretized, and the solution method of linear equations is used to solve these partial differential equations. In this study, the difference method is used to discretize the partial differential equations. Equations (6)–(8) are the discrete forms of Equations (1), (4), and (5), respectively.
( m c ) u p , i ( T u p , i k + 1 T u p , i k ) Δ t = A u p , i h u p - o u t ( T s o , a i r T u p , i k ) + A u p , i h u p - g a p ( T g a p , i k T u p , i k )
( m c ) g a p , i ( T g a p , i k + 1 T g a p , i k ) Δ t = A g a p , i h u p - g a p ( T u p , i k T g a p , i k ) + A g a p , i h d n - g a p ( T d n , i k T g a p , i k ) + ( m g a p c g a p , i 1 T g a p , i 1 k m g a p c g a p , i T g a p , i k )
( m c ) d n , i ( T d n , i k + 1 T d n , i k ) Δ t = A d n , i h d n - g a p ( T g a p , i i T d n , i k ) + A d n , i h d n - i n ( T i n T d n , i k )
The thermal pressure in the air gap between the upper and lower roofs is the result of the joint action of air flow in various zones. The thermal pressure in the air gap between the upper and lower roofs ( Δ P t h ) can be calculated by Equation (9):
Δ P t h = g Δ h i = 1 n ( ρ 0 ρ c a , i )
where Δ P t h is the thermal pressure, Pa. g is the gravitational acceleration, m/s2. Δ h is the height of each control zone, m. ρ 0 is the density of ambient air, kg/m3. ρ c a , i is the density of the ith control volume of the air gap between the upper and lower roofs.

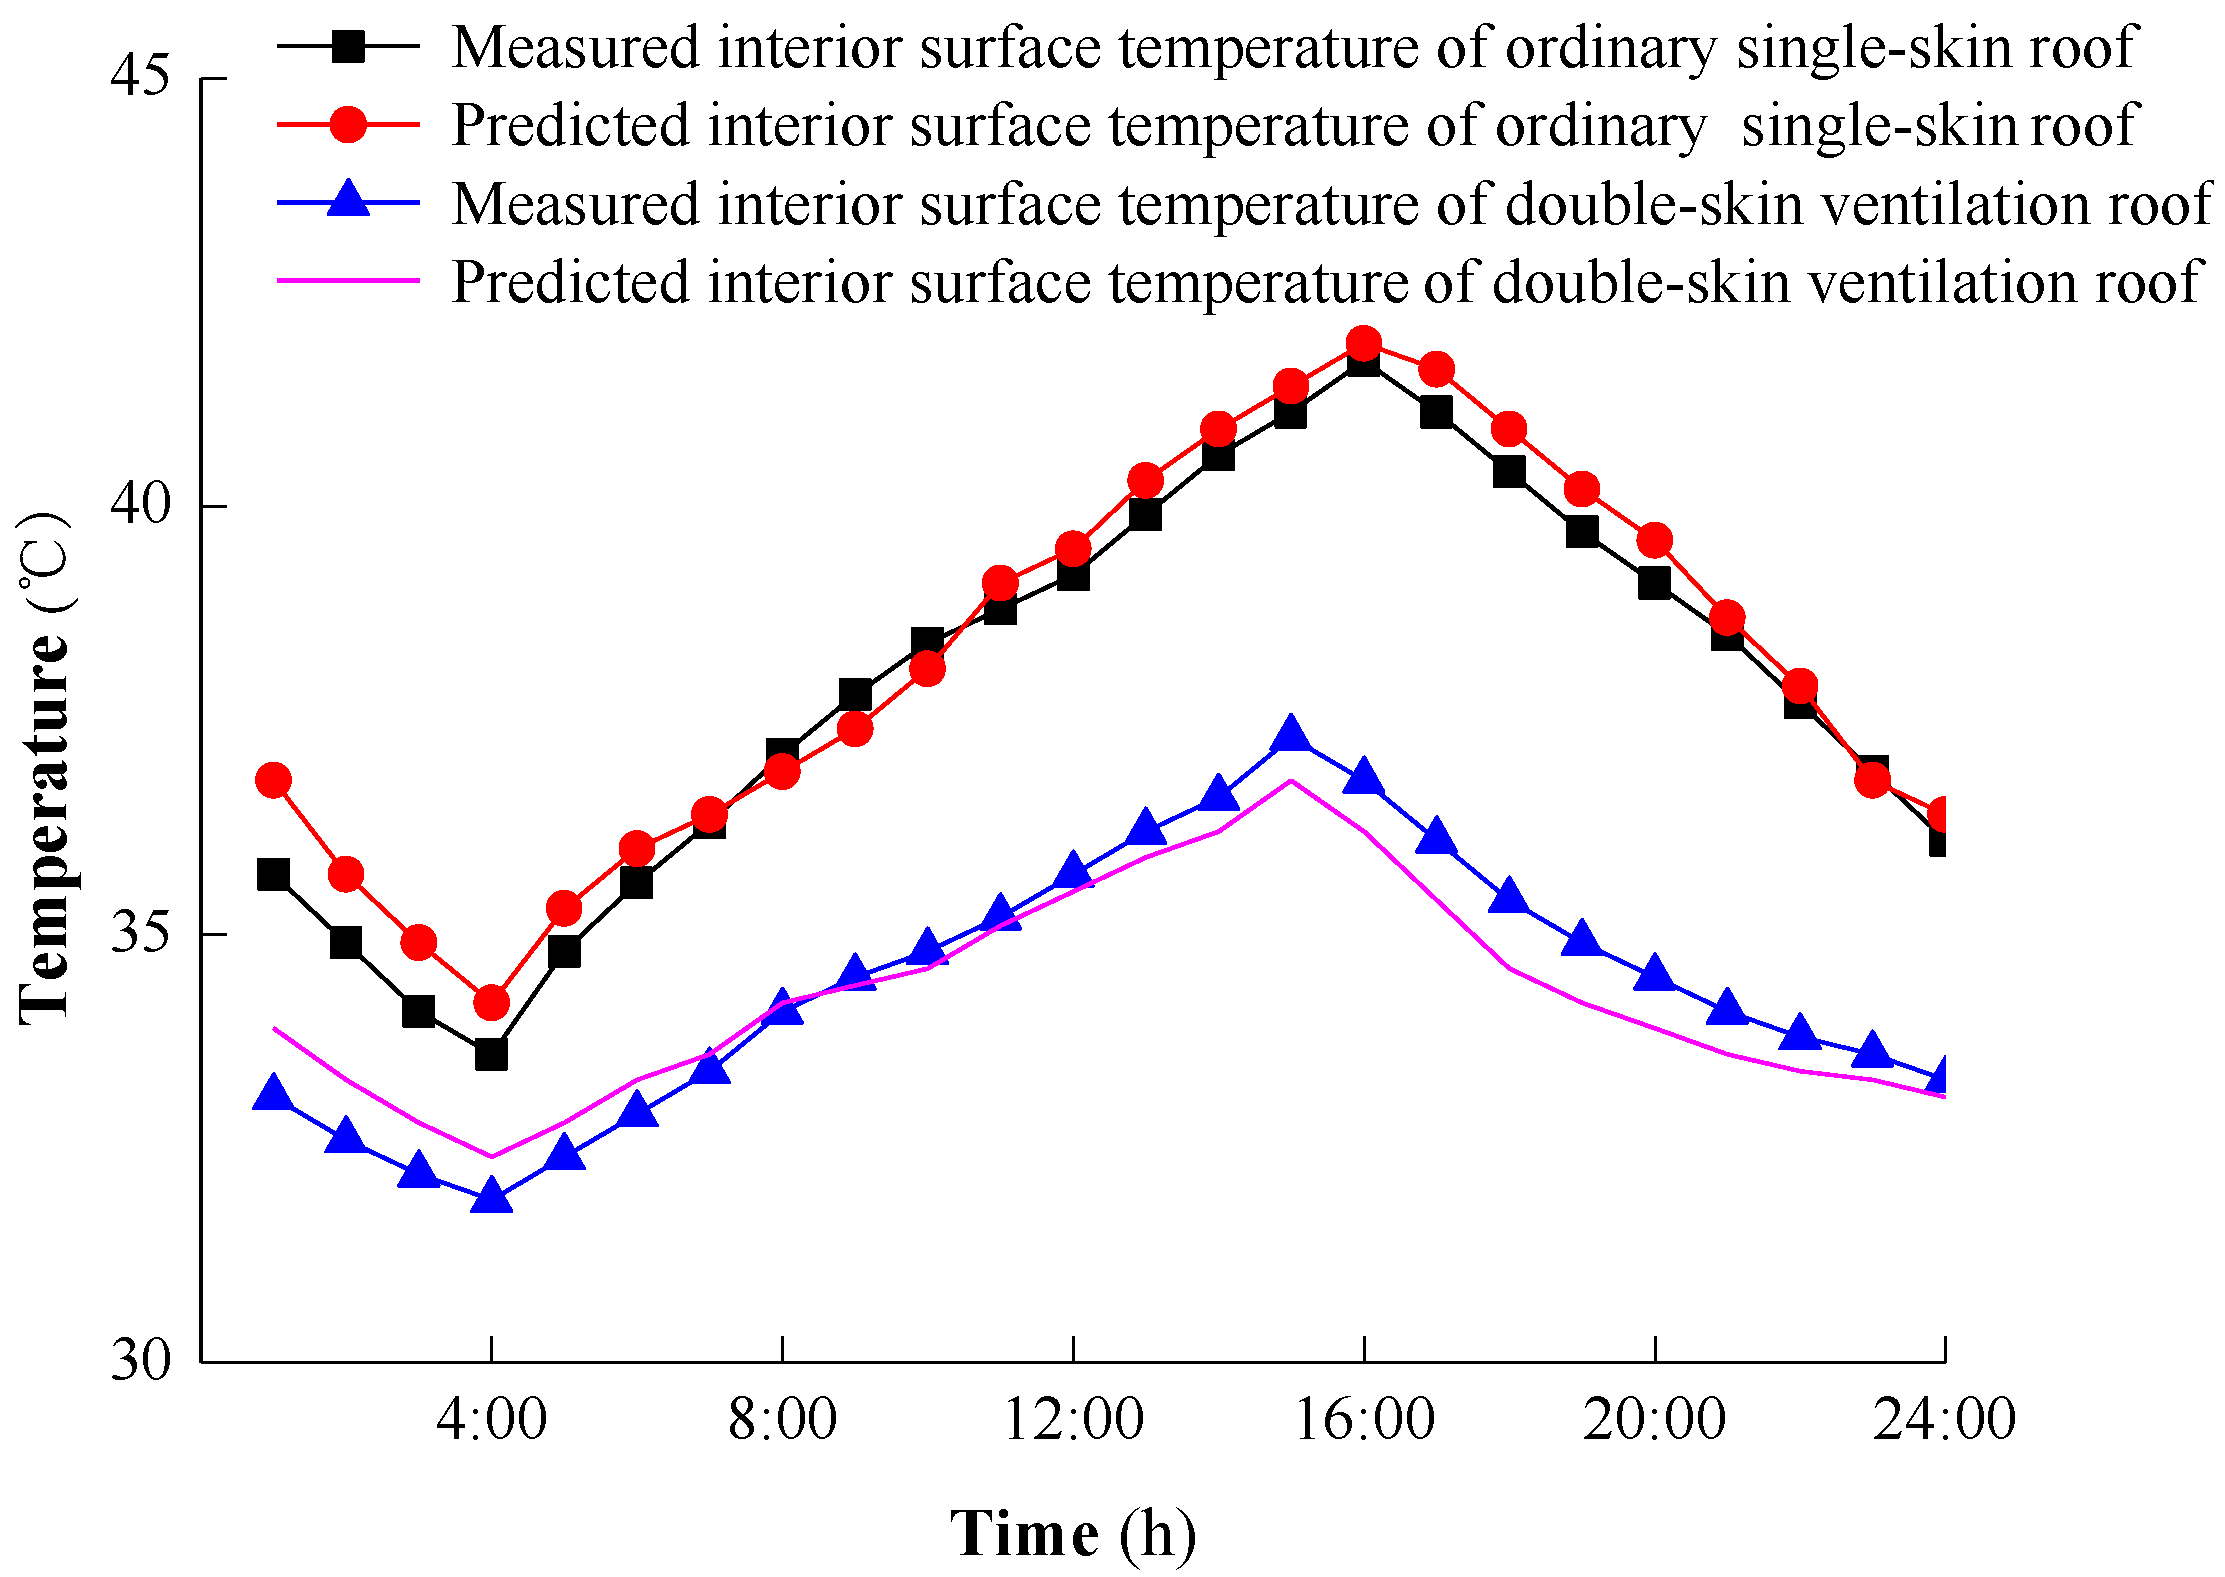
2.2.2. Validation of the Double-Skin Ventilation Roof Heat Transfer Model

The temperature and airflow of a double-skin ventilation roof can be predicted using the zonal method-based double-skin ventilation roof heat transfer model under different outdoor air meteorological conditions and indoor air temperature conditions. The double-skin ventilation roof heat transfer model was validated by comparing the predicted and measured inner surface temperatures of the building roof. The inner surface temperature of a single-skin sloping granary roof and a double-skin ventilation sloping granary roof were measured and gathered at 10 min intervals in Changsha region from 29 July 2017 to 30 July 2017. The measured temperature was the average temperature of three different adjacent measuring points in the center line of the sloping roof. The single-skin sloping granary roof consisted of a 40 mm fine aggregate concrete layer, a 20 mm cement mortar layer, a 4 mm waterproof coiled material layer, a 20 mm cement mortar layer, an 80 mm fly ash ceramsite concrete layer, and a 350 mm reinforced concrete layer, from top to bottom. The double-skin sloping granary roof consisted of a 100 mm reddish-brown tile roof (upper granary roof) and a reinforced concrete roof (lower granary roof), as shown in Figure 3.
The initial temperature of the roof was the average temperature of the measured roof inner surface temperature for 29 July 2017. Figure 4 shows the measured and predicted inner surface temperatures of the building roofs. The maximum temperature difference and the average temperature difference between the measured and predicted single-skin roof inner surface temperatures were 1.1 °C and 0.33 °C, respectively. The maximum temperature difference and the average temperature difference between the measured and predicted double-skin ventilation roof inner surface temperatures were 0.8 °C and 0.12 °C, respectively. The maximum percentage error between the measured and predicted roof inner surface temperature were 6.7% and 8.2% for the single-skin roof and the double-skin ventilation roof, respectively, which is an acceptable value of prediction accuracy in engineering applications.

2.2.3. Determining the Energy-Consumption Cost of Building Roof

The hourly cooling load of the double-skin roof was predicted by using the double-skin ventilation roof heat transfer model under outdoor meteorological conditions. The hourly cooling load of the single-skin roof at different conditions was predicted by using the COMSOL Multiphysics software. The annual roof cooling load ( Q c ) can be calculated by summing up the hourly cooling load of roof throughout the year.
Q c = 3600 s = 1 24 D c q c
Δ Q c = Q c , 0 Q c , δ
where q c is the hourly cooling load per square meter of roof, W/m2. D c is the number of cooling days of the building throughout the year. Δ Q c is the total cooling load saved, W/m2. Q c , 0 is the total cooling load without thermal materials, W/m2. Q c , δ is the total cooling load with thermal materials, W/m2.
Energy consumption cost ( E c ) caused by roof cooling load per square meter can be calculated by Equation (12).
E c = Z Q c 3.6 × 10 6 E E R
E C s a = Z Δ Q c 3.6 × 10 6 E E R
where E c is the energy consumption cost, USD/m2. E C s a represents the energy-saving cost of roof per square meter due to thermal insulation, USD/m2. Z is the electricity price, Z = 0.088 USD/KWh [18]. E E R is the energy efficiency ratio of air-conditioning systems installed in the building, E E R = 2.3 [18].

2.3. LCA-Based Economic Analysis of Roof Insulation of Building

The traditional P 1 - P 2 economic model [37], which is a typical life cycle assessment method, was used to analyze the economic performance of roof insulation. In the P 1 - P 2 economic model, P 1 is the ratio of total roof energy consumption cost in the life cycle to the roof energy consumption cost in the first year. P 1 is the present value factor of roof energy consumption cost in the life cycle, which is positively proportional to all expenses related to roof energy consumption [37].
P 1 = P W F ( N c , f , d ) = { 1 d f [ 1 1 + f 1 + d ] N c , f d N c 1 + f , f = d
where P W F is the discount factor. f is bank deposit interest rate, f = 1 % [38]. d represents the inflation rate, d = 5 % [39]. N c represents the economic analysis period, N c = 20 years [15].
P 2 is the ratio of the total investment to the initial investment of thermal insulation in the life cycle. P 2 is inversely proportional to all expenses related to the initial investment of the thermal insulation [37].
P 2 = D + ( 1 + D ) P W F ( N min , 0 , d ) P W F ( N m , 0 , s ) + P W F ( N c , f , d ) M R ( 1 + d ) N c
where, D represents the down payment proportion of thermal insulation, D = 100 % [38]. M represents the ratio of annual maintenance cost to initial investment cost of thermal insulation, M = 0 [39]. N m is the loan term of thermal insulation. N min = min ( N c , N m ) . s is the loan interest rate of thermal insulation. R is the recycling price ratio of thermal insulation, R = 0 [38].
Life cycle total investment cost ( L C T ) is the sum of roof energy consumption cost and investment cost of thermal insulation. Life cycle saving ( L C S ) is the difference between the energy-saving cost of roof and investment cost of thermal insulation in the life cycle. L C T and L C S are calculated by Equations (16) and (17), respectively [37].
L C T = P 1 E C co + P 2 ( U i δ + U c )
L C S = P 1 E C s a P 2 ( U i δ + U c )
where E C c o represents the energy consumption cost per square meter of roof, USD/m2. E C s a represents the energy-saving cost of roof per square meter due to thermal insulation, USD/m2. U i represents the unit price of thermal insulation, USD/m3. U c represents other comprehensive costs of thermal insulation, which includes labor cost, other material costs, and unforeseen costs for thermal insulation, U c = 6.705 USD/m2 [18]. δ represents thermal insulation thickness, m. In the study, P 1 = 13.503 , P 2 = 1 [40].

2.4. LCA-Based Environmental Analysis of Building Roof Insulation

The traditional LCA-based environmental assessment methods include the mid-point environmental assessment (problem-oriented) method and the end-point environmental assessment (damage-oriented) method [41,42]. The mid-point LCA environmental assessment method is often adopted to evaluate the environmental themes involving ozone depletion potential impact, global warming potential impact, and acidification potential impact [43]. The end-point LCA environmental assessment method is usually utilized to evaluate environmental impacts including human health, natural environment, and resources quantitatively [44,45,46]. In the end-point LCA environmental assessment method, the environmental damage is evaluated in the form of scores for the production and production environmental impacts of concern [47,48]. In this study, the end-point LCA environmental assessment method is adopted to assess the environmental impacts of roof insulation quantitatively.
The negative environmental impact is the environmental cost per unit area of the thermal insulation ( E N co ). E N co is closely related to thermal insulation type and insulation thickness. The E N co of roof thermal insulation can be calculated by the following formula [31]:
E N co = K l δ
where, E N co is the environmental cost per unit area of the thermal insulation, Pt/m2. K l represents the environmental load generated by the use of 1 m3 of thermal insulation in the roof, Pt/m3.
Thermal insulation can reduce roof energy consumption, and the reduction in energy consumption will bring in the environmental income of energy saving ( E N s a ). The environmental income of energy saving is closely related to thermal insulation type and insulation thickness. E N s a can be calculated by the following equations:
E N sa = ( E N 0 E N δ ) n / A
E N 0 = Z e , 0 k e A r e
E N δ = Z e , δ k e A r e
where E N s a is the environmental income in the life cycle due to energy-saving, Pt/m2. E N 0 is the LCA environmental analysis result of roof energy consumption without thermal insulation, Pt/year. E N δ is the LCA environmental analysis result of roof energy consumption with a δ thermal insulation thickness, Pt/year. n is the service life of the roof thermal insulation. Z e , 0 is the energy consumption of 1 m2 of roof without insulation, KWh/(m2·year). Z e , δ is the energy consumption of 1 m2 of roof with a δ thermal insulation thickness, KWh/(m2·year). k e is the environmental cost of 1 KWh of energy consumption of roof, Pt/KWh. A is the external surface area of the roof, m2. A r e is the usable roof area, m2. In this study, A = 890.6 m2 and A r e = 864 m2.
The environmental benefit ( E N B ) of thermal insulation in a roof is the difference between the environmental income of energy saving and the environmental cost of the thermal insulation. E N B of thermal insulation in roof can be calculated by Equation (22).
E N B = E N s a E N c o
When E N B 0 , it indicates that the use of the thermal insulation will produce environmental benefits: the thermal insulation is environmentally feasible and environmentally friendly. When E N B < 0 , it implies that the use of the thermal insulation will have negative impacts on the environment.

2.5. Integrated Economic and Environmental Assessment of Roof Insulation

An integrated dimensionless assessment index ( b ) considering both economic and environmental factors is presented and used to assess the roof insulation comprehensively. The integrated dimensionless assessment index can eliminate the influence of different units of economic benefit and environmental benefit. The thermal insulation with the maximum integrated assessment index is the best candidate insulation design solution for building roofs. The integrated dimensionless assessment index can be determined as follows:
b = w 1 E C B + w 2 E N B
E C B = E C B E C B max
E C B = P 1 E C s a A P 2 ( U i δ + U c ) A
E N B = E N B E N B max
where w 1 is the assigned weight of the economic benefit and w 2 is the assigned weight of the environmental benefit, where w 1 + w 2 = 1 . E N B is the net present value of environmental benefit for roof insulation, Pt/m2. E N B is calculated by using Equation (22). E N B max is the maximum net present value of environmental benefit for roof insulation, USD/m2. E N B is the relative value of the environmental benefit for insulation investment. E C B is the net present value of economic benefit for roof insulation. E C B is calculated by using Equation (25). E C B max is the maximum net present value of economic benefit for insulation investment. E C B is the relative value of economic benefits for roof insulation.
The best solution of roof thermal insulation is determined by comparing the value of the dimensionless economic and environmental assessment index. The thermal insulation with the largest value for the dimensionless assessment index is the best solution for building roofs. The optimum roof insulation thickness is determined by maximizing the sum of economic benefits and environmental benefits of roof thermal insulation. When the optimum thickness of roof insulation has been determined, the payback period ( L P ) of roof insulation can be calculated by Equation (27). Payback period is an important economic index in evaluating the economic performance of insulation [37].
L P = { ln [ 1 P 2 ( U i δ + U c ) ( d f ) Δ E c ] ln ( 1 + f 1 + d ) , f d P 2 ( U i δ + U c ) ( d f ) Δ E c , f = d

3. Building and Environmental Cost of Thermal Insulation

A low-temperature granary was studied as a case study in this paper, using the optimization design method of roof thermal insulation proposed here. This low-temperature granary is located in Changsha city, in China, with typical hot summer and cool winter climate characteristics. Low-temperature grain storage (below 20 °C) is a popular green ecological grain-storage technique. However, the energy consumption of low-temperature granaries is high. This low-temperature granary is a large warehouse with dimensions of 24 m (width) × 8.3 m (height) × 36 m (length), as shown in Figure 5. Air-conditioning systems are installed in the granary to maintain the 15 °C indoor air temperature in the granary. The energy efficiency ratio of air-conditioning systems concerned is 2.3. The characteristic parameters of roof materials are shown in Table 1.
The thermal insulation layer is located between the cement mortar layer and the waterproofing membrane layer. Three types of thermal insulation are considered in this paper: expanded polystyrene (EPS), polyurethane (PU), and mineral wool (MW), as shown in Table 2. A single-skin roof and a double-skin roof are considered in this paper to investigate the effect of different roof structures on economic and environmental performances of roof insulation. A white roof outer surface color (solar radiation reflectivity coefficient γ = 0.55) and a grey roof outer surface color ( γ = 0.25) are considered in this paper to investigate the effect of different roof outer surface colors on the economic and environmental performance of thermal insulation.
Eco-indicator 99 is one of the most famous environmental assessment methods in the world and has been used to assess the environmental impacts of insulation in buildings [31,32,43]. Three environmental damage types and eleven environmental impacts are considered in Eco-indicator 99. Each environmental impact category is translated into a single score, which can be used to assess the impacts on human health, environmental quality, and natural resource utilization quantitatively [49]. The categories of impact and damage are expressed in the unit of point (Pt). A score of 1 Pt indicates 103 units of annual damage to the environment for one citizen of Europe. The results of LCA analysis for three types of insulation and electricity consumption of Dylewski and Adamczyk [43] are used as the basic data to assess the environmental performance of roof thermal insulation, as shown in Table 3. The total cooling loads of the roofs throughout the year is simulated by COMSOL and the roof energy consumption cost per square meter is calculated by Equations (10)–(13), as shown in Table 4.

4. Results and Discussions

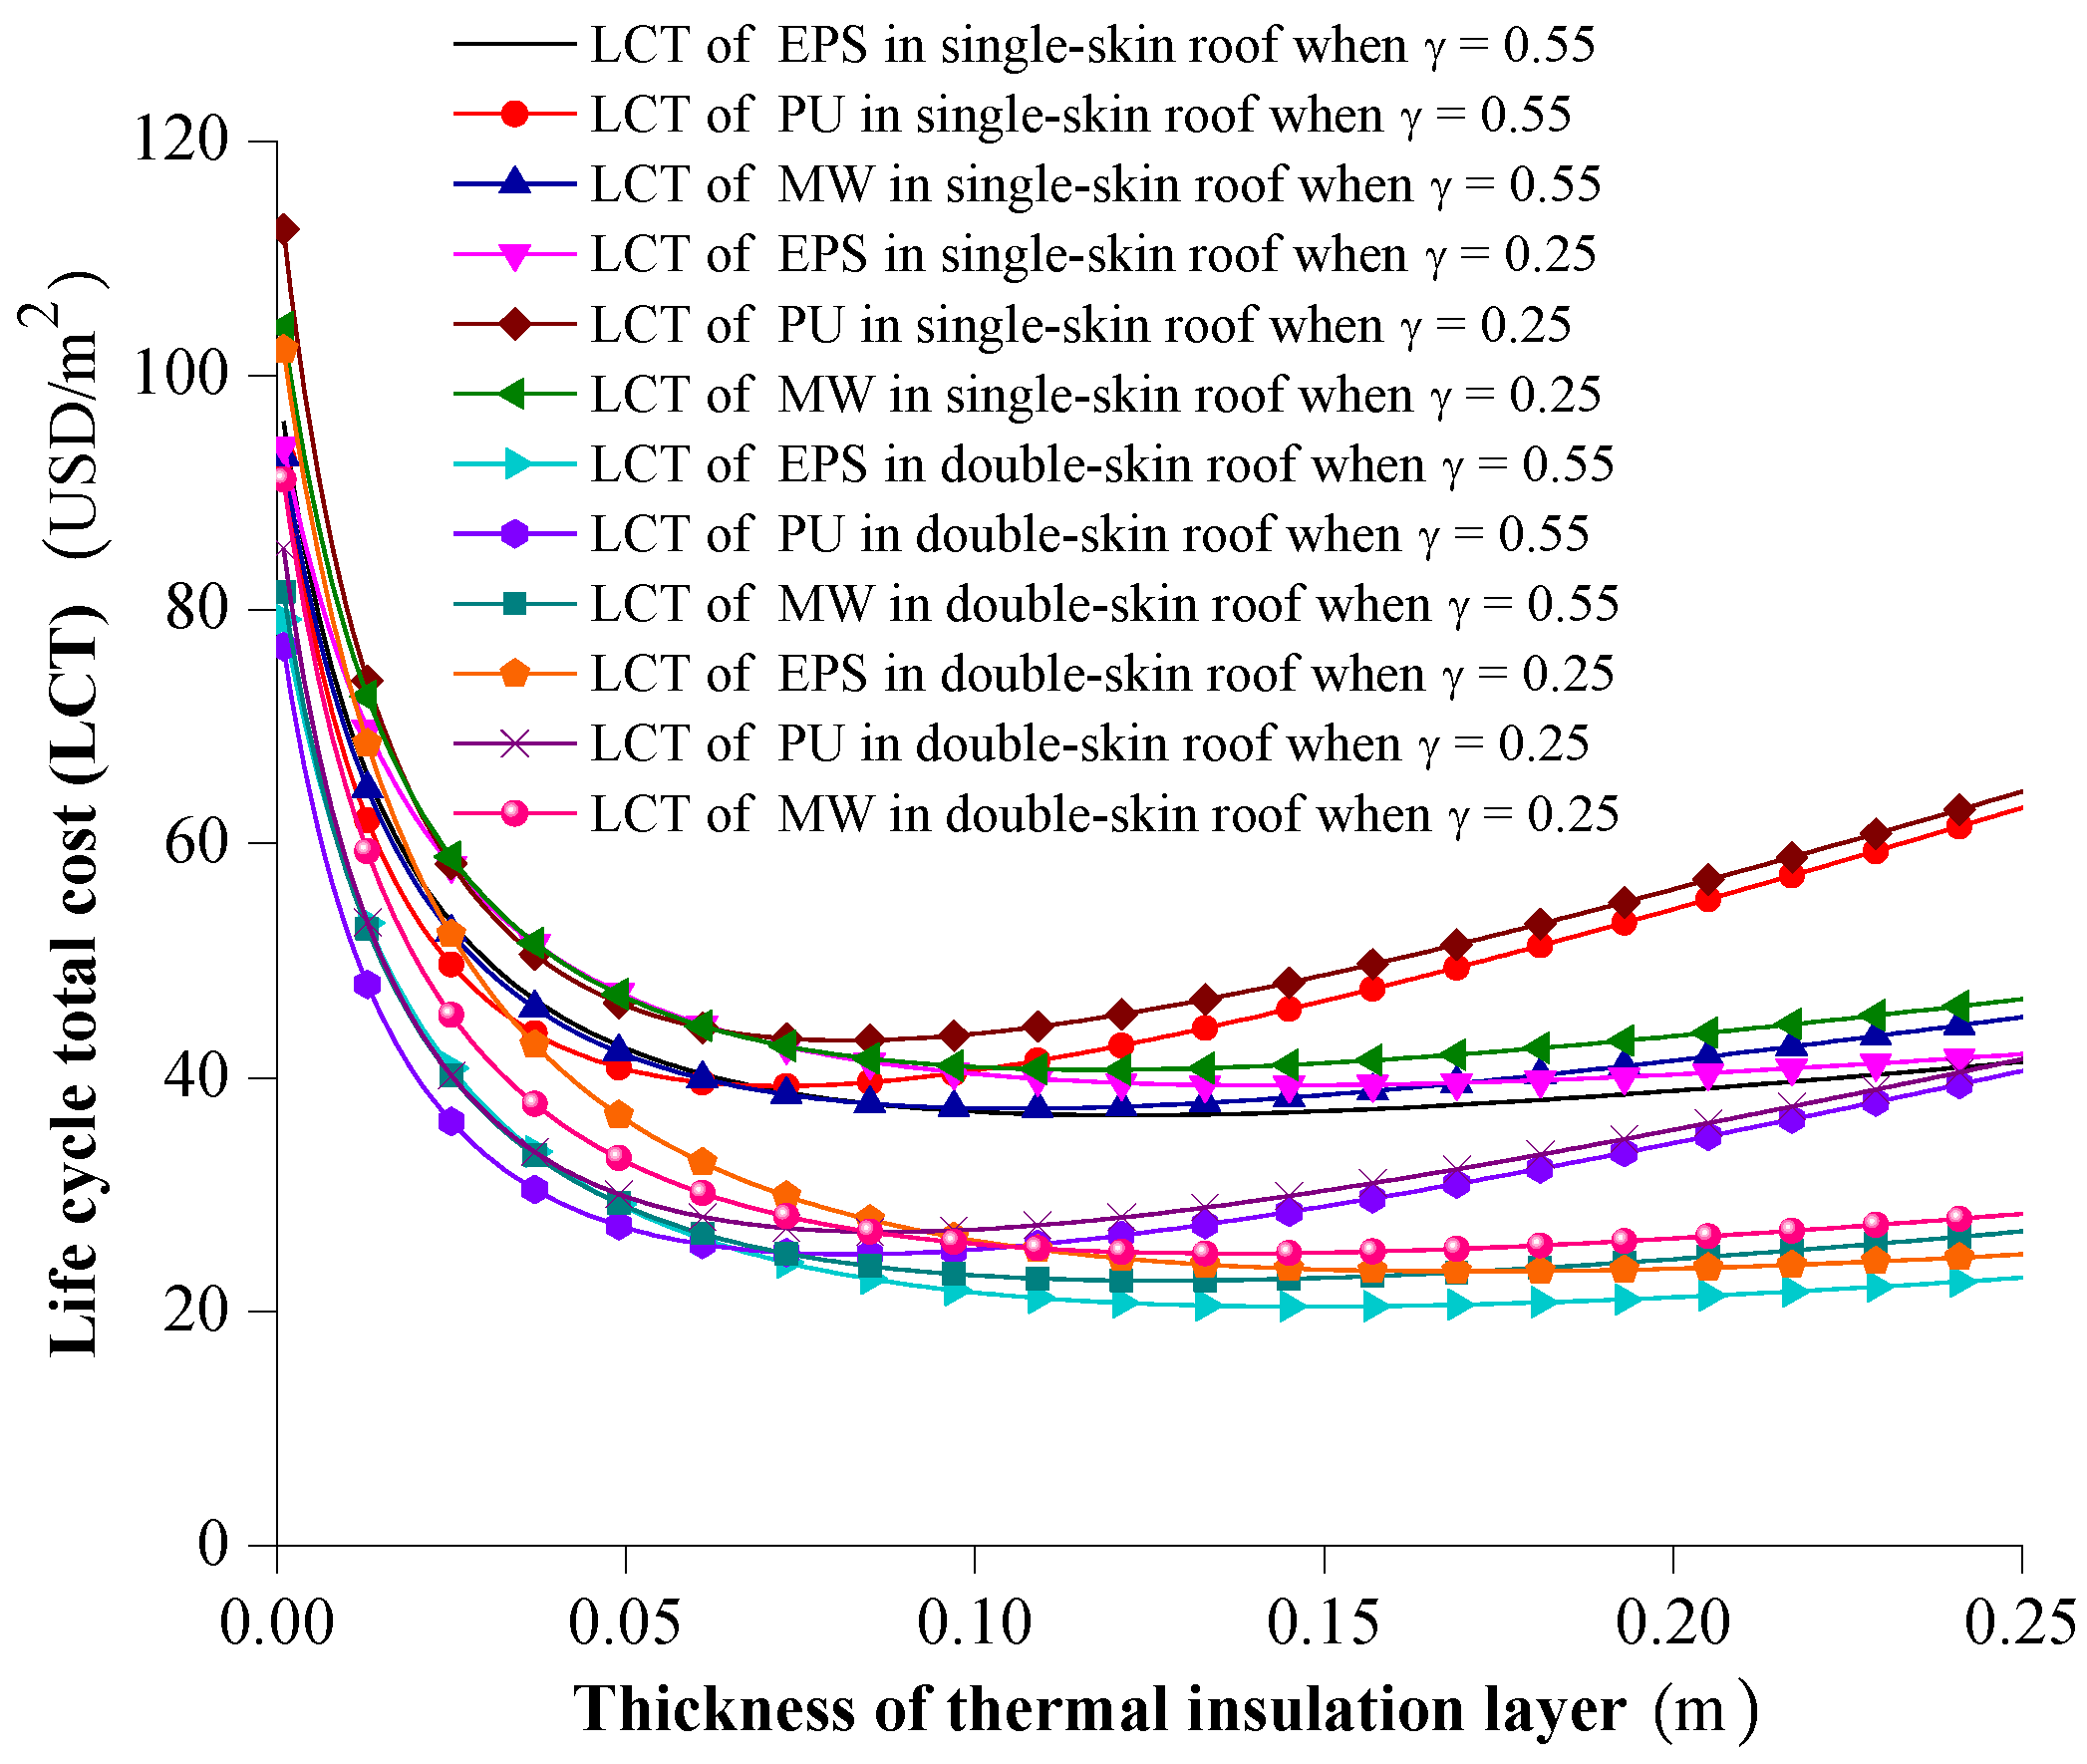
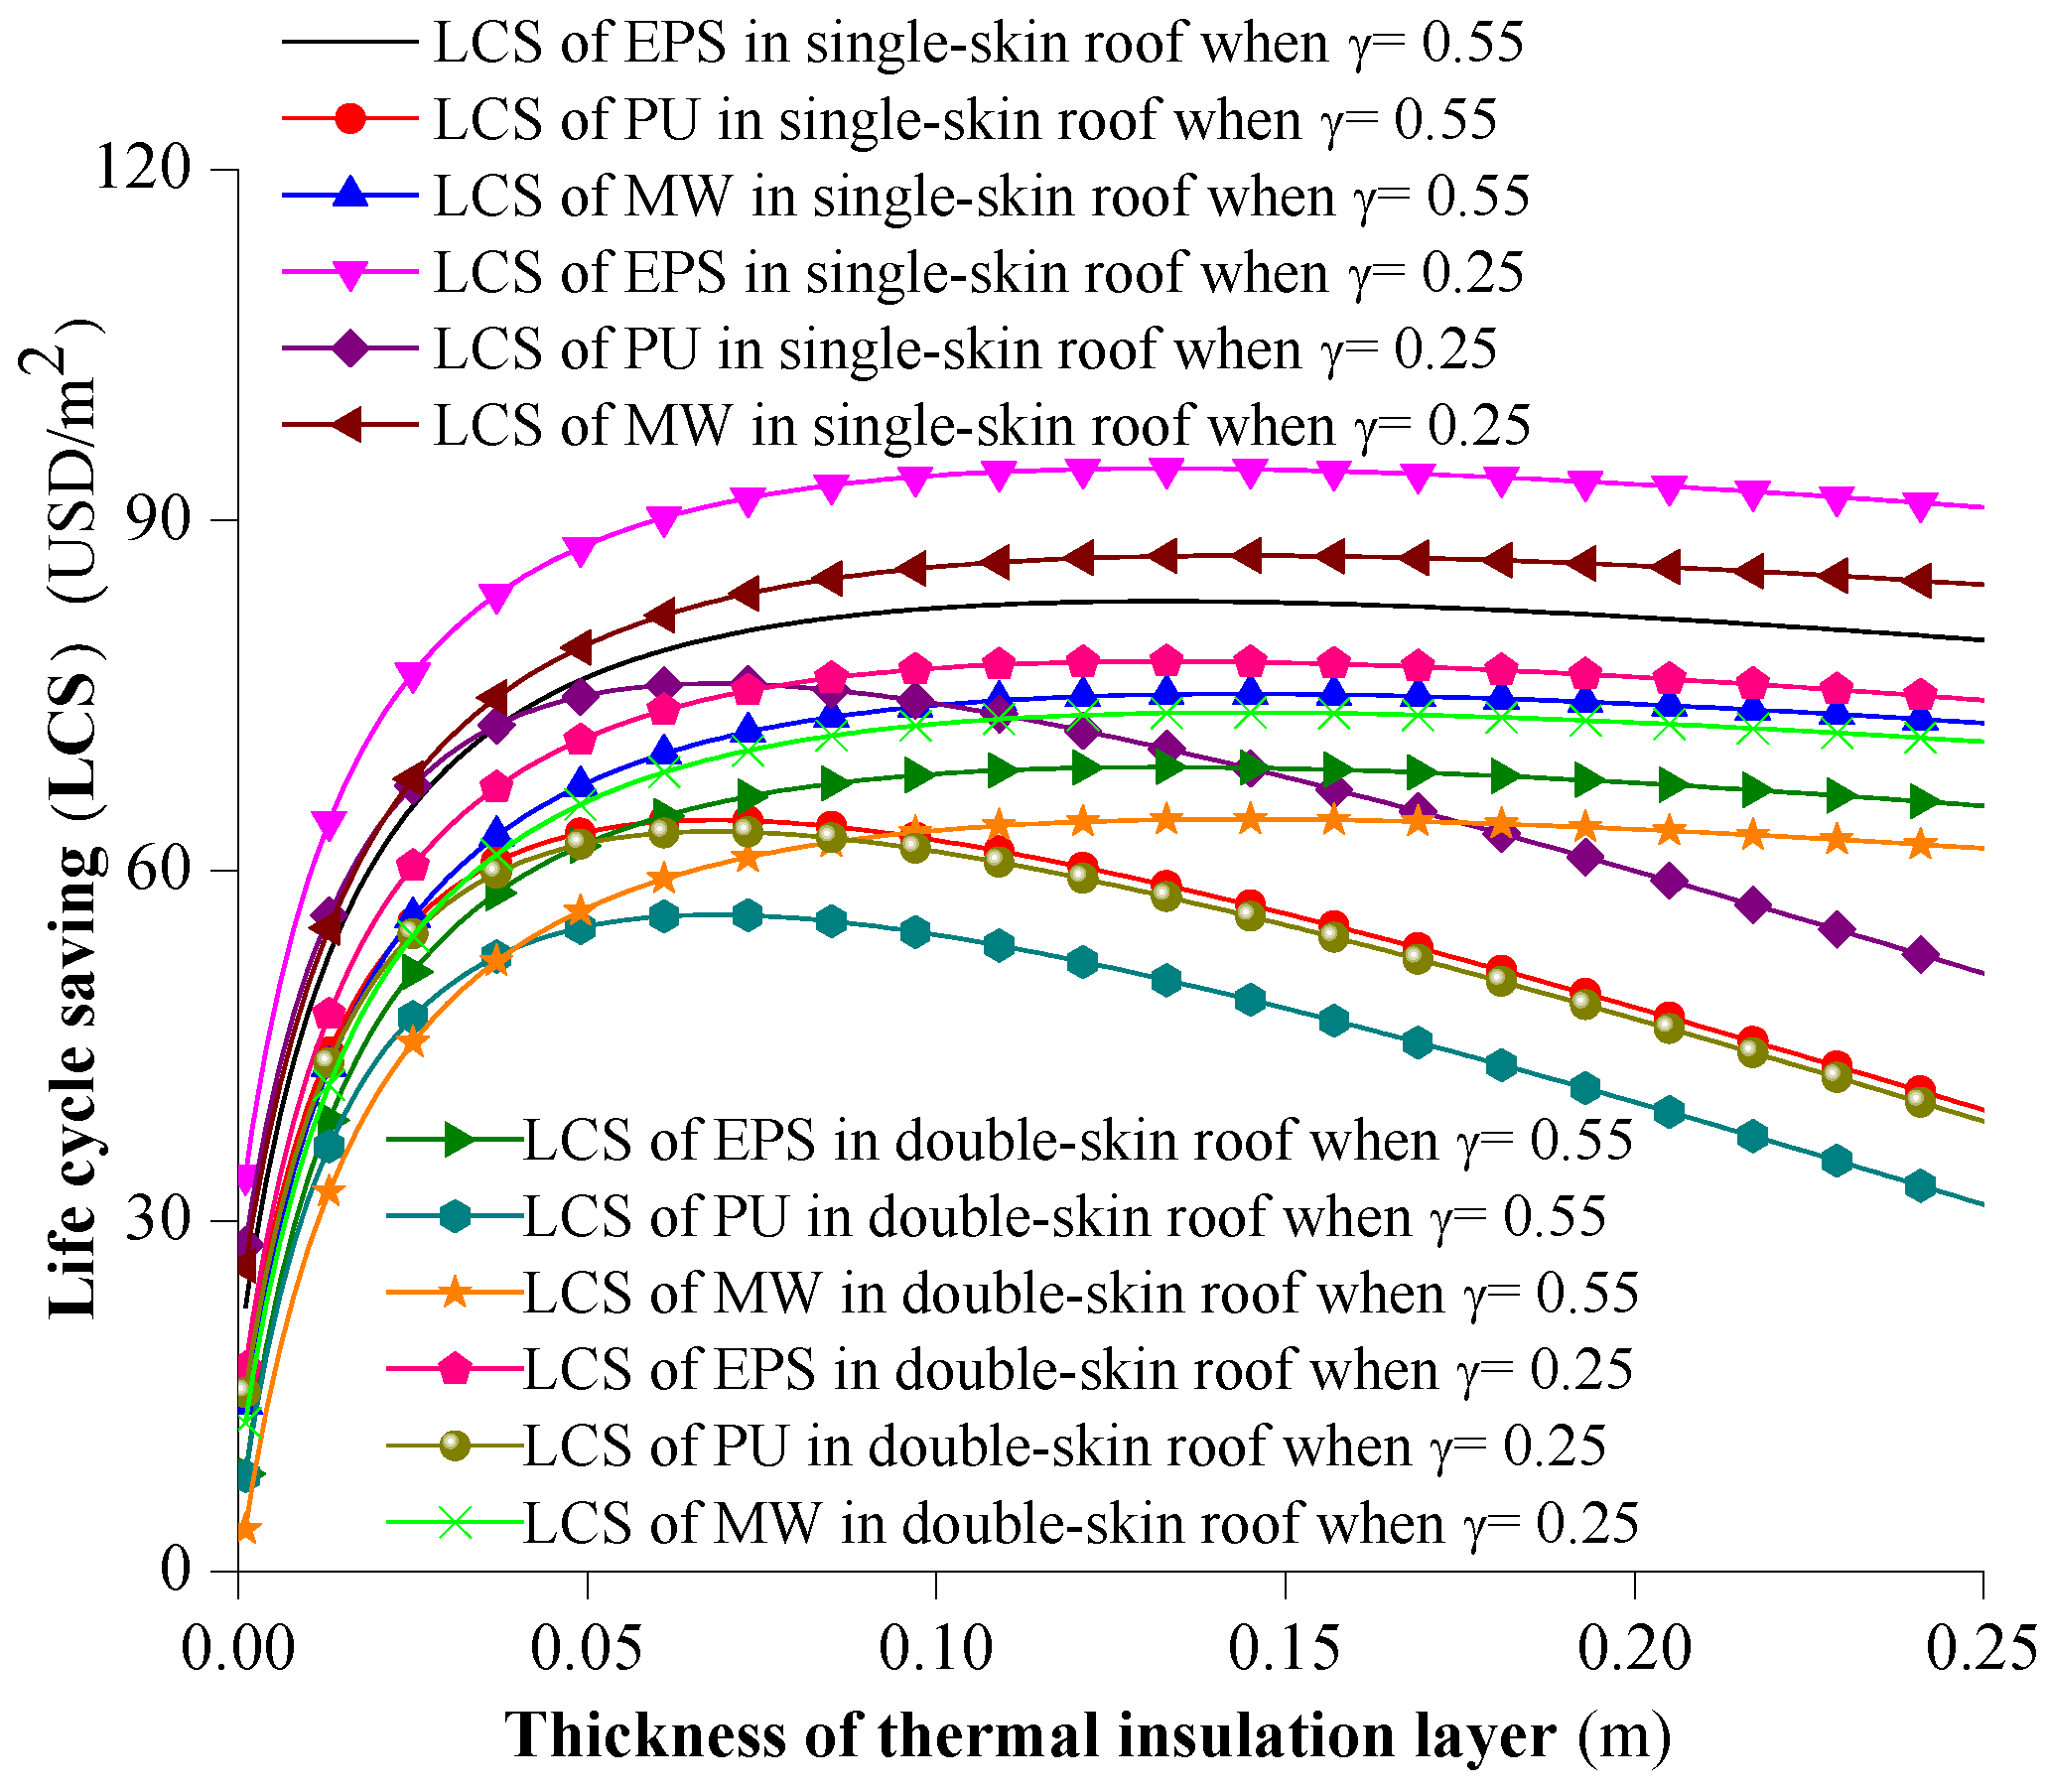
4.1. Results of Economic Benefits of Roof Insulation of Buildings

Figure 6 shows the results of the life cycle total investment cost of three types of roof thermal insulation. With an increase in thermal insulation thickness, the calculated values of L C T for three types of insulation first decrease and then increase. There is a critical value of insulation thickness to minimize the life cycle total investment cost. The L C T values of EPS, PU, and MW increase as the solar radiation reflectivity coefficient of the roof outer surface decreases. The double-skin ventilation roof increases the L C T of thermal insulation in the building’s roof compared to that of the single-skin roof.
Figure 7 shows the results of life cycle saving of three types of roof thermal insulation. With an increase in insulation layer thickness, the calculated values of L C S for three types of insulation first increase and then decrease. There is a critical value of the insulation thickness to maximize the life cycle saving. The roof heat transfer of the double-skin roof is lower than that of the single-skin roof. Less cooling energy is required for the double-skin roof than for the single-skin roof. Roof thermal insulation would save less cooling energy consumption costs for the double-skin roof than those for the single-skin roof. This suggests that a single-layer roof needs more thermal insulation than a double-layer roof. Therefore, the L C S of thermal insulation of the double-skin ventilation roof decreases compared to that of the single-skin roof.
The maximum L C S value of EPS, PU, and MW are 83.05, 64.31, and 75.11 USD/m2 for the single-skin roof with a 0.55 solar radiation reflectivity coefficient, respectively. The maximum L C S values of EPS, PU, and MW are 94.41, 76, and 86.96 USD/m2 for the single-skin roof with a 0.25 solar radiation reflectivity coefficient, respectively. The maximum L C S values of EPS, PU, and MW are 68.85, 53.97, and 64.39 USD/m2 for the double-skin roof with a 0.55 solar radiation reflectivity coefficient, respectively. The maximum L C S values of EPS, PU, and MW are 77.9, 63.34, and 73.52 USD/m2 for the double-skin roof with a 0.25 solar radiation reflectivity coefficient, respectively.
Roof heat transfer is lower when the solar radiation reflectivity coefficient of the outer surface of the roof is higher. Less cooling energy consumption is required for the roof with a higher outer surface reflectivity coefficient of solar radiation. Roof thermal insulation can save less cooling energy consumption cost due to a building roof having a higher outer surface reflectivity coefficient of solar radiation. Therefore, the maximum economic benefit of EPS, PU, and MW increases decreasing solar radiation reflectivity coefficient of the outer surface of the roof. This implies that the economic need to install a thermal insulation layer in the roof increases decreasing solar radiation reflectivity coefficient of the outer surface of the roof.

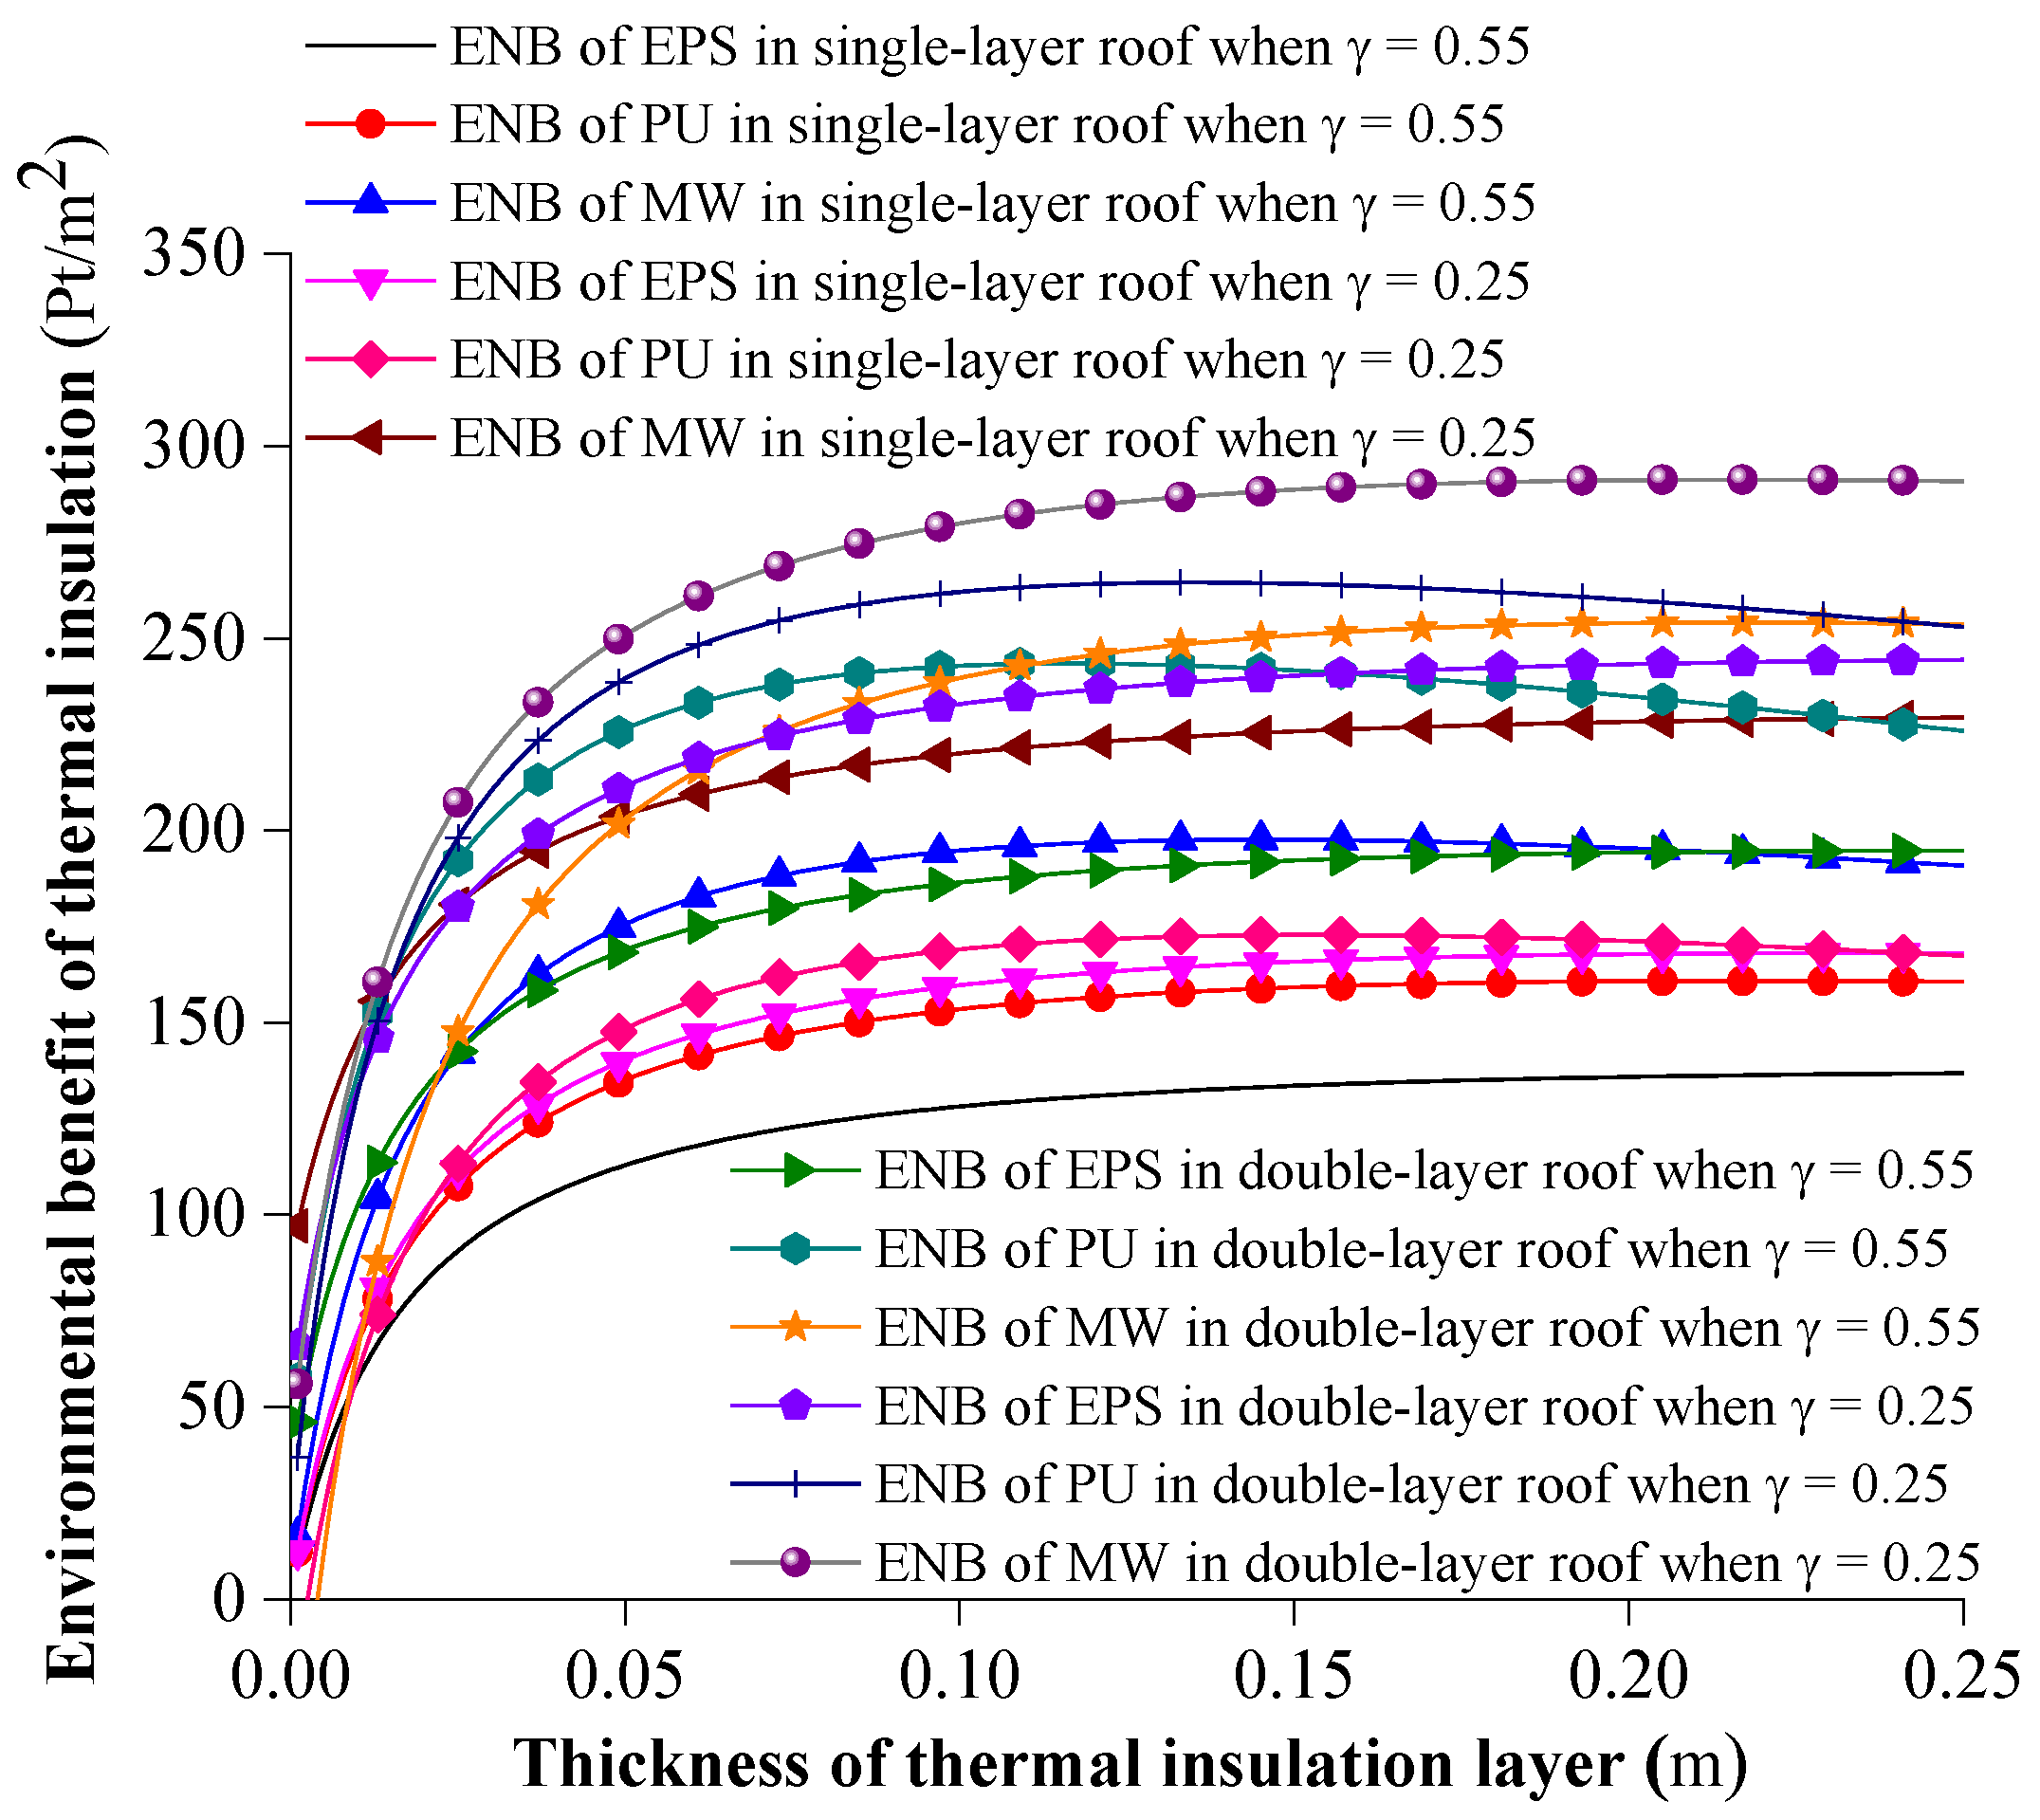
4.2. Results of Environmental Benefits of Roof Insulation of Buildings

Figure 8 shows the results of the environmental benefits of three types of thermal insulation. With an increase in the thermal insulation thickness, the environmental benefits for the three types of insulation first increase and then decrease. There is a critical value of insulation thickness to maximize the environmental benefits of roof thermal insulation. The double-skin ventilation roof increases the environmental benefits of thermal insulation in a building’s roof compared to the single-skin roof.
The maximum environmental benefit value of EPS, PU, and MW is 136.53, 159.55, and 196.66 Pt/m2 for the single-skin roof with a 0.55 solar radiation reflectivity coefficient, respectively. The maximum environmental benefit value of EPS, PU, and MW is 166.69, 172.80, and 229.67 Pt/m2 for the single-skin roof with a 0.25 solar radiation reflectivity coefficient, respectively. The maximum environmental benefit of EPS, PU, and MW increases with decreasing solar radiation reflectivity coefficient of the outer surface of the roof. This implies that the environmental need to install a thermal insulation layer in the roof increases with decreasing solar radiation reflectivity coefficient of the outer surface of the roof.
The maximum environmental benefit value of EPS, PU, and MW is 194.70, 243.43, and 254.11 Pt/m2 for the double-skin roof with a 0.55 solar radiation reflectivity coefficient, respectively. The maximum environmental benefit value of EPS, PU, and MW is 244.54, 264.49, and 291.20 Pt/m2 for the double-skin roof with a 0.25 solar radiation reflectivity coefficient, respectively. The ranking of the maximum environmental benefit of three types of thermal insulation is MW > EPS > PU. The double-skin roof has greater environmental benefits than those of the single-skin roof. In order to achieve a better environmental impact, the double-skin ventilation roof of a low-temperature granary should be used with a suitable thermal insulation thickness in the Changsha region in China.

4.3. Results of the Integrated Assessment of Roof Thermal Insulation

An economic weight coefficient of w 1 = 0.8 and an environmental weight coefficient of w 2 = 0.2 were used as examples in this paper to assess the integrated economic and environmental performances of three types of roof thermal insulation. Among the three types of roof thermal insulation studied, the thermal insulation with the best economic benefit is EPS. The insulation material with the best environmental benefit is MW. The assigned economic and environmental weight coefficients can be determined according to the actual engineering needs in real buildings. When the economic weight coefficient is greater, the assigned economic and environmental weight coefficient values are suitable for the projects that focus on economic benefits. When the environmental weight coefficient is bigger, the assigned economic and environmental weight coefficient values are suitable for the projects that focus on environmental benefits. When the economic and environmental weight coefficients are the same, the assigned economic and environmental weight coefficient values are suitable for the projects that focus on economic and environmental benefits equally.
The optimum insulation thickness is determined by maximizing the sum of economic benefits and environmental benefits due to roof thermal insulation. Figure 9 shows the optimal insulation thickness under the influences of multiple factors (roof structure, roof outer surface color, and insulation type). The optimal insulation thickness of EPS, PU, and MW is 0.148 m, 0.082 m and 0.122 m for the single-skin roof with a 0.55 solar radiation reflectivity coefficient, respectively. The optimal insulation thickness of EPS, PU, and MW is 0.171 m, 0.095 m and 0.142 m for the single-skin roof with a 0.25 solar radiation reflectivity coefficient, respectively. The optimal insulation thickness of EPS, PU, and MW is 0.128 m, 0.068 m and 0.104 m for the double-skin roof with a 0.55 solar radiation reflectivity coefficient respectively. The optimal insulation thickness of EPS, PU, and MW is 0.153 m, 0.081 m and 0.127 m for the double-skin roof with a 0.25 solar radiation reflectivity coefficient, respectively.
Figure 10 shows the payback period for the investment of three types of thermal insulation. The payback period of investment for EPS, PU, and MW is 2.01–2.68 years, 2.44–3.0 years, and 2.25–2.84 years, respectively.
The economic benefits ( E C B ) of the three types of thermal insulation are summarized in Table 5. The environmental benefits ( E N B ) of the three types of roof thermal insulation are summarized in Table 6. All environmental benefits in Table 6 are positive, which indicates that each type of thermal insulation concerned is profitable for environmental reasons.
Table 7 presents the analysis results of integrated dimensionless assessment indexes for three types of roof insulation. The larger the value of the integrated assessment index, the greater the integrated economic and environmental benefit. The analysis results of the control variable method show that the differences in the integrated assessment index range from 0.134 to 0.157 when the variable is the solar radiation reflectivity coefficient of the roof outer surface for the low-temperature granary roof in the Changsha region in China. Insulation type has a certain influence on the integrated assessment index. The influence of insulation type should be considered in finding the best candidate insulation design scheme for building roofs. By comparing the integrated dimensionless economic and environmental assessment indexes, it can be seen that the best result is obtained by EPS for the double-skin sloping roof with a grey outer surface color for the low-temperature granary roof in the Changsha region in China. The ranking of the integrated assessment indexes of thermal insulation is EPS > MW > PU. In order to achieve a better economic effect and better environmental impact, the double-skin ventilation roof should include a suitable thermal insulation thickness in the low-temperature granary roof in the Changsha region in China.
When the variable is the solar radiation reflectivity coefficient of roof outer surface, the differences in integrated assessment index range from 0.006 to 0.015 for a single-skin roof. The differences in the integrated assessment index range from 0.007 to 0.013 for a double-skin roof in the low-temperature granary in Changsha region in China. The influence of the solar radiation reflectivity coefficient of the roof outer surface should be considered in finding the best candidate insulation design scheme for building roofs. The solar radiation reflectivity coefficients of roof outer surface are determined according to different outer surface colors. The integrated assessment index for the roof with a lower solar radiation reflectivity coefficient is greater than that for the roof with a higher solar radiation reflectivity coefficient. This indicates that the integrated economic and environmental benefit of insulation in the roof with a lower solar radiation reflectivity coefficient is better than that in the roof with a higher solar radiation reflectivity coefficient.
When the roof structure is different, the differences in the integrated assessment index range from 0.014 to 0.038 for the single-skin roof and the double-skin roof in the low-temperature granary in Changsha region in China, respectively. The influence of roof structure should be considered in finding the best candidate insulation design scheme for building roofs. The integrated assessment index of the double-skin roof is greater than that of the single-skin roof when the solar radiation reflectivity coefficient of roof outer surface is the same. Therefore, the integrated economic and environmental benefit of a double-skin roof is better than that of a single-skin layer.
When compared with the existing studies, it may be found that the current findings are supported by many existing studies. Las-Heras-Casas et al. [8] found that the use of thermal insulation in the envelopes can apparently improve the economic and environmental performances of existing multi-family buildings in the hot and temperate climate zones of Spain. Akan and Akan [9] found that EPS, PU, and RW can reduce energy consumption by 10.1~61.1% and CO2 emissions by 46~69% for buildings in Turkey during the cooling season. Annibaldi et al. [10] found that rock wool can save 10.17 USD/m2 and reduce CO2 emissions of building walls in Italy by 10.07 kg/m2 for the whole life cycle. The research results of Las-Heras-Casas et al. [8], Akan and Akan [9], and Annibaldi et al. [10] can confirm our findings that the use of thermal insulation is beneficial to both the economy and the environment of the low-temperature granary roof in Changsha region in China. The economic benefits of EPS, PU, and RW in roofs range from 53.97 to 94.41 USD/m2, and the environmental benefits of EPS, PU, and RW in roofs range from 136.53 to 291.20 Pt/m2 for the low-temperature granary in the Changsha region in China in the whole life cycle.

5. Conclusions

The design of thermal insulation in a roof is very important to reduce roof energy consumption and decrease the environmental pollution impacts of buildings. An integrated economic and environmental assessment-based optimization design method has been presented in this paper to find the best candidate insulation design scheme for building roofs, including the determination of the roof thermal insulation type and the optimum insulation thickness. The main conclusions are as follows:
(1)
The integrated economic and environmental assessment-based optimization design method can help designers to find the best design scheme of thermal insulation, maximizing the sum of economic benefit and environmental benefit for building roofs efficiently.
(2)
The proposed integrated optimization design method was actually developed based on two general economic and environmental analysis models that take into account different building types in different regions. Therefore, the proposed integrated optimization design method can also be applied to building roofs with different thermal insulation materials in different climatic regions.
(3)
The validation result shows that the predicted data of zonal-based double-skin ventilation roof heat transfer model agreed well with the measured data, with a maximum relative error of 8.2%.
(4)
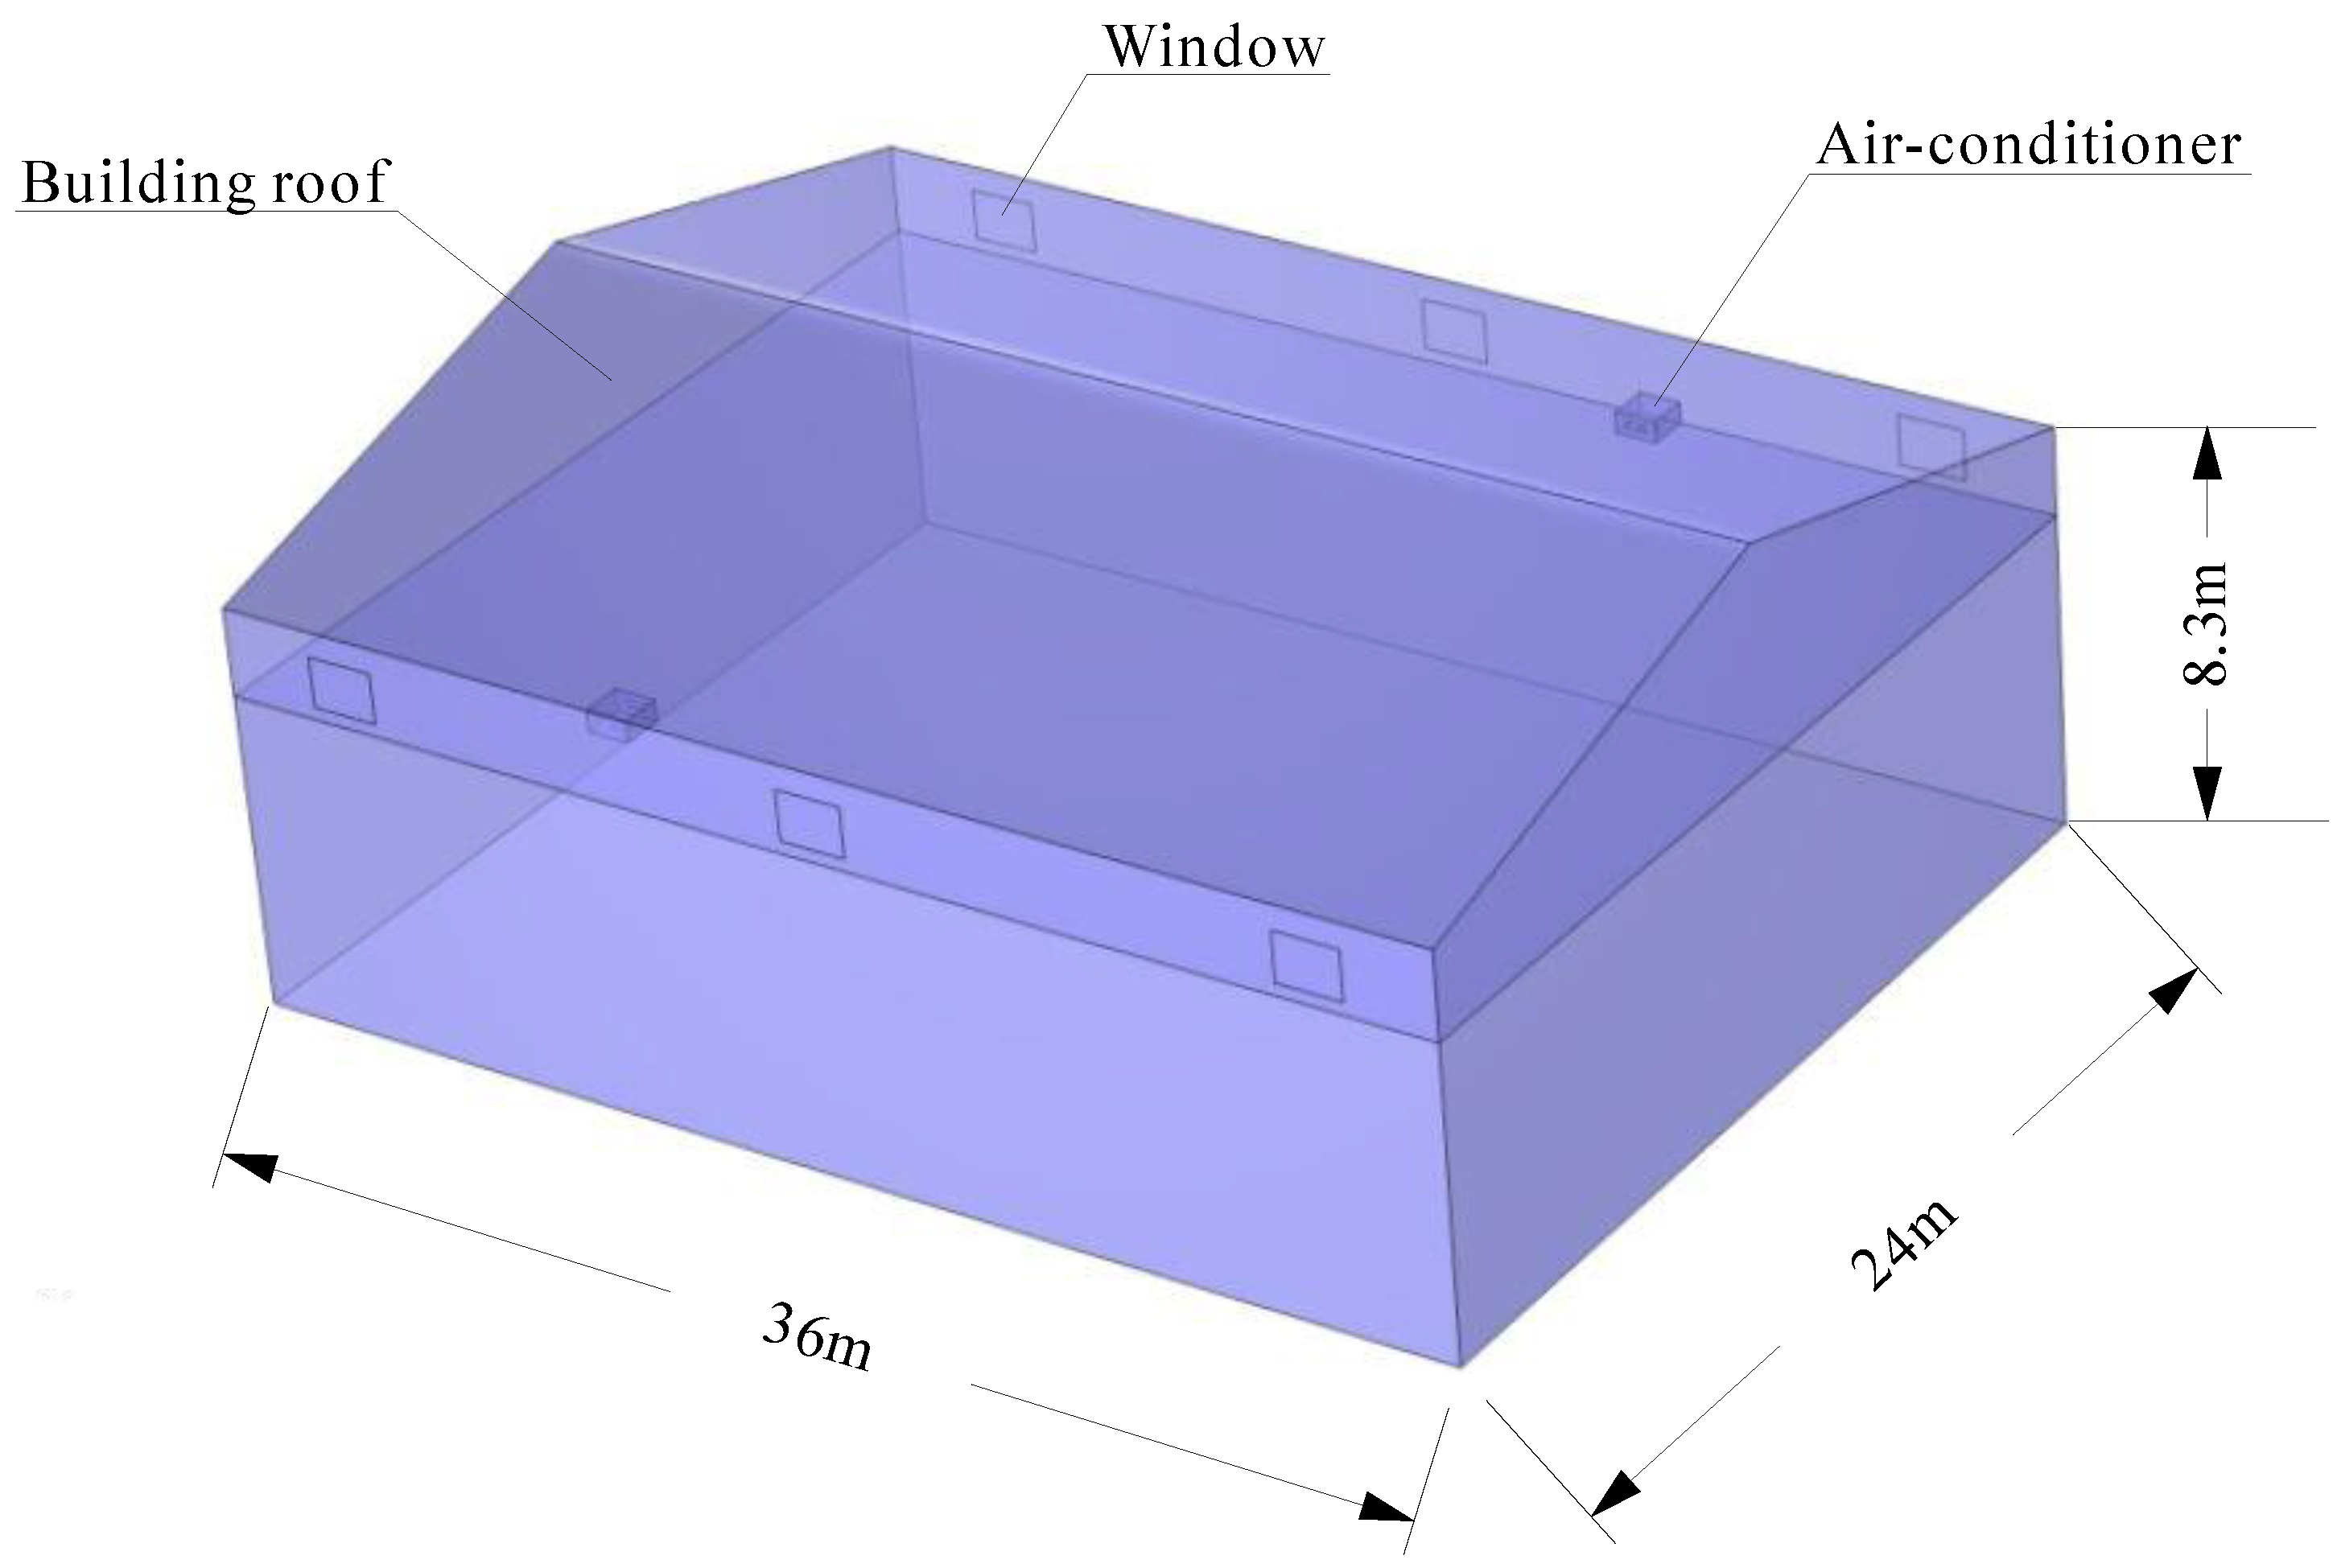
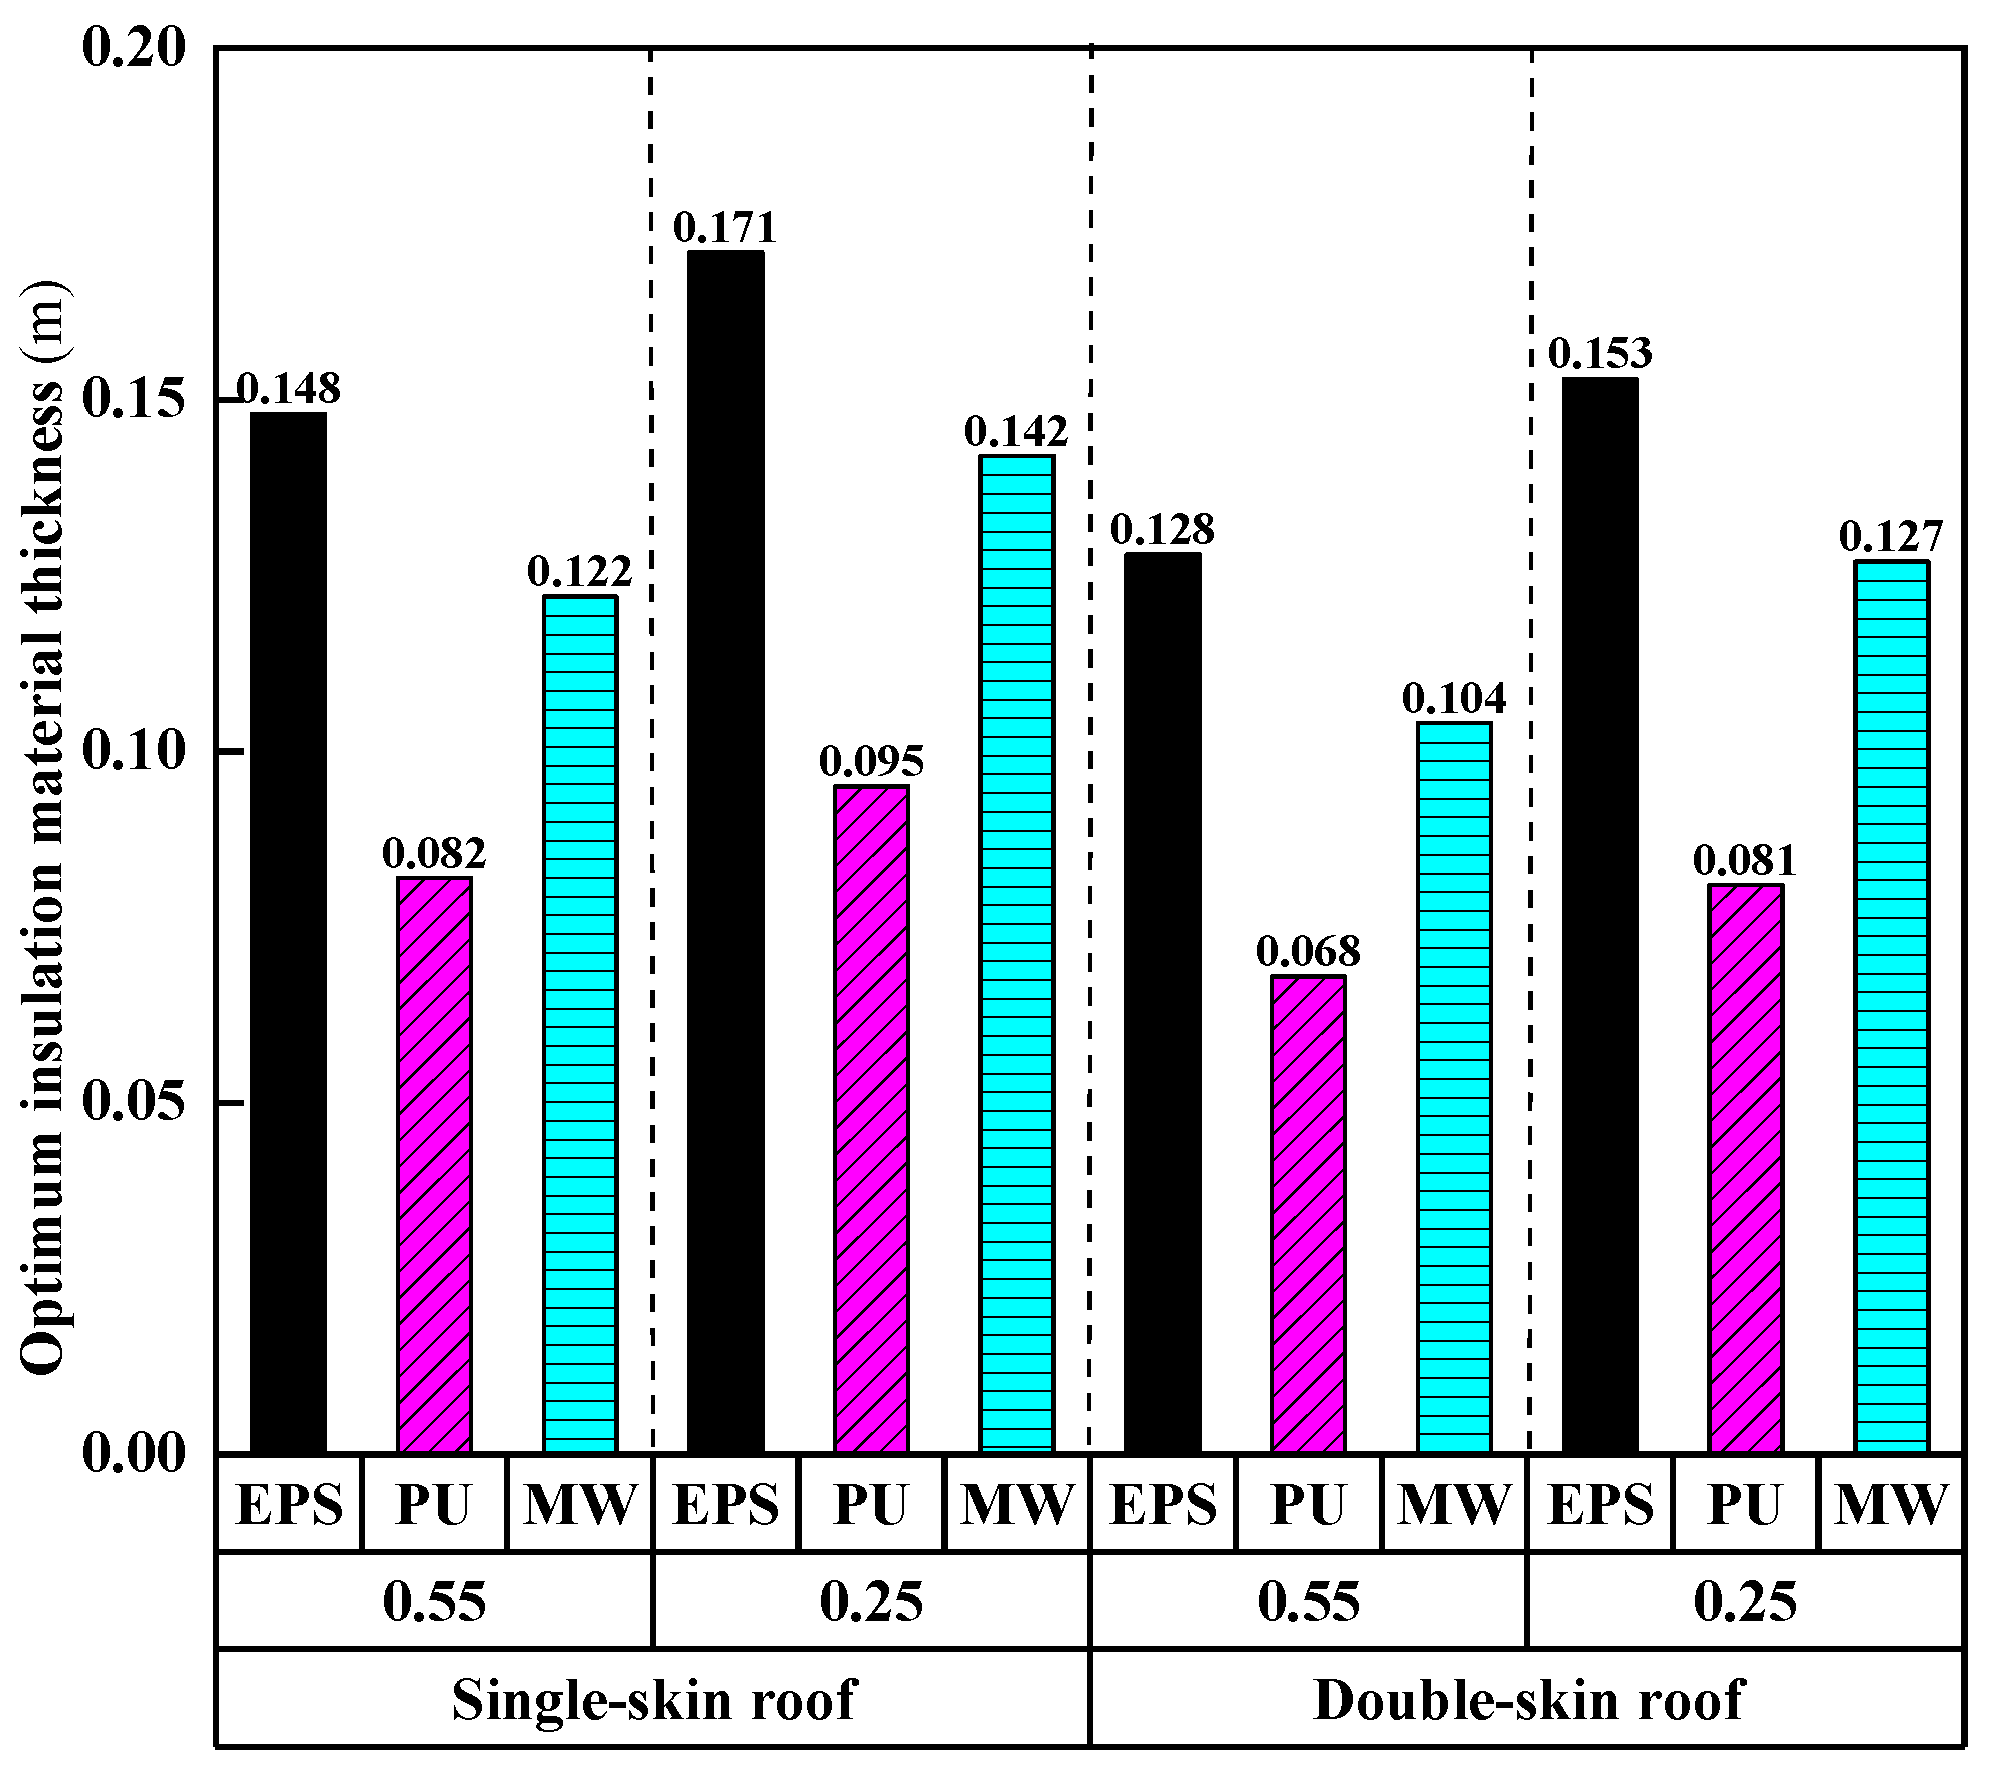
The optimum insulation thicknesses of EPS, MW, and PU are between 0.082 m and 0.171 m for the single-skin roof in the low-temperature granary in the Changsha region in China. A double-skin ventilation roof can reduce the optimum thickness of roof thermal insulation. The best result is obtained by EPS for the double-skin roof with a grey outer surface color for the low-temperature granary roof in the Changsha region in China. The ranking of the integrated assessment indexes of thermal insulation is EPS > MW > PU.

Author Contributions

H.W.: writing-original draft, conceptualization, methodology, investigation. Y.H.: data curation, conceptualization, validation. L.Y.: supervision, formal analysis, writing—review and editing. All authors have read and agreed to the published version of the manuscript.

Funding

The research work presented in this paper is financially supported by Cultivation Programme for Young Backbone Teachers of Henan University of Technology (No. 21420069), and Innovative Funds Plan of Henan University of Technology (No. 2020ZKCJ05, 2020ZKCJ022).

Institutional Review Board Statement

The study did not require ethical approval.

Informed Consent Statement

Informed consent was obtained from all subjects involved in the study.

Data Availability Statement

Not applicable.

Conflicts of Interest

The authors declare no conflict of interest.

References

  1. Su, S.; Wang, Q.; Han, L.X.; Hong, J.Q.; Liu, Z.W. BIM-DLCA: An integrated dynamic environmental impact assessment model for buildings. Build. Environ. 2020, 183, 107218. [Google Scholar] [CrossRef]
  2. Geng, Y.; Ji, W.J.; Lin, B.R.; Hong, J.J.; Zhu, Y.X. Building energy performance diagnosis using energy bills and weather data. Energy Build. 2018, 172, 181–191. [Google Scholar] [CrossRef]
  3. Zhang, Y.; Sun, H.; Long, J.; Zeng, L.; Shen, X. Experimental and numerical study on the insulation performance of a photo-thermal roof in hot summer and cold winter areas. Buildings 2022, 12, 410. [Google Scholar] [CrossRef]
  4. Kemal, C.; Bedri, Y. Environmental impact of thermal insulation thickness in buildings. Appl. Therm. Eng. 2004, 24, 933–940. [Google Scholar]
  5. Yue, H.; Worrell, E.; Crijns-Graus, W. Impacts of regional industrial electricity savings on the development of future coal capacity per electricity grid and related air pollution emissions—A case study for China. Appl. Energy 2021, 282, 116241. [Google Scholar] [CrossRef]
  6. Zhang, X.C.; Wang, F.L. Life-cycle assessment and control measures for carbon emissions of typical buildings in China. Build. Environ. 2015, 86, 89–97. [Google Scholar] [CrossRef]
  7. Lou, Y.L.; Ye, Y.Y.; Yang, Y.Z.; Zuo, W.D. Long-term carbon emission reduction potential of building retrofits with dynamically changing electricity emission factors. Build. Environ. 2022, 210, 108683. [Google Scholar] [CrossRef]
  8. Las-Heras-Casas, J.; López-Ochoa, L.M.; López-González, L.M.; Olasolo-Alonso, P. Energy renovation of residential buildings in hot and temperate mediterranean zones using optimized thermal envelope insulation thicknesses: The case of Spain. Appl. Sci. 2021, 11, 370. [Google Scholar] [CrossRef]
  9. Akan, A.P.; Akan, A.E. Modeling of CO2 emissions via optimum insulation thickness of residential buildings. Clean Technol. Environ. 2022, 24, 949–967. [Google Scholar] [CrossRef]
  10. Annibaldi, V.; Cucchiella, F.; Rotilio, M. Economic and environmental assessment of thermal insulation. A case study in the Italian context. Case Stud. Constr. Mater. 2021, 15, e00682. [Google Scholar]
  11. Shadram, F.; Mukkavaara, J. Improving life cycle sustainability and profitability of buildings through optimization: A case study. Buildings 2022, 12, 497. [Google Scholar] [CrossRef]
  12. Kurekci, N.A. Determination of optimum insulation thickness for building walls by using heating and cooling degree-day values of all Turkey’s provincial centers. Energy Build. 2016, 118, 197–213. [Google Scholar] [CrossRef]
  13. Cay, Y.; Gürel, A.E. Determination of optimum insulation thickness, energy savings, and environmental impact for different climatic regions of Turkey. Environ. Prog. Sustain. 2013, 32, 365–372. [Google Scholar] [CrossRef]
  14. Axaopoulos, P.; Panagakis, P.; Axaopoulos, I. Effect of wall orientation on the optimum insulation thickness of a growing-finishing piggery building. Energy Build. 2014, 84, 403–411. [Google Scholar] [CrossRef]
  15. Yu, J.H.; Yang, C.Z.; Tian, L.W.; Liao, D. A study on optimum insulation thicknesses of external walls in hot summer and cold winter zone of China. Appl. Energy 2009, 86, 2520–2529. [Google Scholar] [CrossRef]
  16. Yang, W.; Wang, Y.Y.; Liu, J.P. Optimization of the thermal conductivity test for building insulation materials under multifactor impact. Constr. Build. Mater. 2022, 332, 127380. [Google Scholar] [CrossRef]
  17. Ozel, M. Cost analysis for optimum thicknesses and environmental impacts of different insulation materials. Energy Build. 2012, 49, 552–559. [Google Scholar] [CrossRef]
  18. Liu, X.W.; Chen, Y.M.; Ge, H.; Fazio, P.; Chen, G.J.; Guo, X.G. Determination of optimum insulation thickness for building walls with moisture transfer in hot summer and cold winter zone of China. Energy Build. 2015, 109, 361–368. [Google Scholar] [CrossRef]
  19. Ye, Y.Y.; Hinkelman, K.; Zhang, J.; Zuo, W.D.; Wang, G. A methodology to create prototypical building energy models for existing buildings: A case study on U.S. religious worship buildings. Energy Build. 2019, 194, 351–365. [Google Scholar] [CrossRef]
  20. Gobakis, K.; Kolokotsa, D. Coupling building energy simulation software with microclimatic simulation for the evaluation of the impact of urban outdoor conditions on the energy consumption and indoor environmental quality. Energy Build. 2017, 157, 101–115. [Google Scholar] [CrossRef]
  21. Zhang, L.L.; Liu, Z.A.; Hou, C.P.; Hou, J.W.; Wei, D.; Hou, Y.Y. Optimization analysis of thermal insulation layer attributes of building envelope exterior wall based on DeST and life cycle economic evaluation. Case Stud. Therm. Eng. 2019, 14, 100410. [Google Scholar] [CrossRef]
  22. Ji, R.; Zhang, Z.T.; He, Y.; Liu, J.; Qu, S.L. Simulating the effects of anchors on the thermal performance of building insulation systems. Energy Build. 2017, 140, 501–507. [Google Scholar] [CrossRef]
  23. Xu, F.S.; Gao, Z. Study on indoor air quality and fresh air energy consumption under different ventilation modes in 24-hour occupied bedrooms in Nanjing, using Modelica-based simulation. Energy Build. 2022, 257, 111805. [Google Scholar] [CrossRef]
  24. Kim, C.H.; Kim, M.; Song, Y.J. Sequence-to-sequence deep learning model for building energy consumption prediction with dynamic simulation modeling. J. Build. Eng. 2021, 43, 102577. [Google Scholar] [CrossRef]
  25. Altun, A.F. Determination of optimum building envelope parameters of a room concerning window-to-wall ratio, orientation, insulation thickness and window type. Buildings 2022, 12, 383. [Google Scholar] [CrossRef]
  26. Malanho, S.; Veiga, R.; Farinha, C.B. Global performance of sustainable thermal insulating systems with cork for building facades. Buildings 2021, 11, 83. [Google Scholar] [CrossRef]
  27. Chan, M.; Masrom, M.A.; Yasin, S.S. Selection of low-carbon building materials in construction projects: Construction professionals’ perspectives. Buildings 2022, 12, 486. [Google Scholar] [CrossRef]
  28. Ye, Y.Y.; Lou, Y.L.; Zuo, W.D.; Franconi, E.; Wang, G. How do electricity pricing programs impact the selection of energy efficiency measures?—A case study with U.S. Medium office buildings. Energy Build. 2020, 224, 110267. [Google Scholar] [CrossRef]
  29. Du, Z.; Liu, Y.; Zhang, Z. Spatiotemporal analysis of influencing factors of carbon emission in public buildings in China. Buildings 2022, 12, 424. [Google Scholar] [CrossRef]
  30. Wang, Z.; Zhou, Y.; Zhao, N.; Wang, T.; Zhang, Z. Spatial correlation network and driving effect of carbon emission intensity in China’s construction industry. Buildings 2022, 12, 201. [Google Scholar] [CrossRef]
  31. Wi, S.; Ji, J.H.; Kim, Y.U.; Kim, S. Evaluation of environmental impact on the formaldehyde emission and flame-retardant performance of thermal insulation materials. J. Hazard. Mater. 2020, 402, 123463. [Google Scholar] [CrossRef] [PubMed]
  32. Dylewski, R.; Adamczyk, J. The environmental impacts of thermal insulation of buildings including the categories of damage: A Polish case study. J. Clean. Prod. 2016, 137, 878–887. [Google Scholar] [CrossRef]
  33. Dylewski, R.; Adamczyk, J. The comparison of thermal insulation types of plaster with cement plaster. J. Clean. Prod. 2014, 83, 256–262. [Google Scholar] [CrossRef]
  34. Buyle, M.; Braet, J.; Audenaert, A. Life cycle assessment in the construction sector: A review. Renew. Sustain. Energ. Rev. 2013, 26, 379–388. [Google Scholar] [CrossRef]
  35. Monteiro, H.; Freire, F.; Fernández, J.E. Life-cycle assessment of alternative envelope construction for a new house in south-western Europe: Embodied and operational magnitude. Energies 2020, 13, 4145. [Google Scholar] [CrossRef]
  36. Obyn, S.; Moeseke, G.V. Variability and impact of internal surfaces convective heat transfer coefficients in the thermal evaluation of office buildings. Appl. Therm. Eng. 2015, 87, 258–272. [Google Scholar] [CrossRef]
  37. Duffie, J.A.; Beckman, W.A. Solar energy thermal processes. Phys. Today 1976, 29, 62–67. [Google Scholar] [CrossRef]
  38. FRED Economic Data. Interest Rates, Discount Rate for China. Available online: https://fred.stlouisfed.org/series/INTDSRCNM193N (accessed on 21 July 2020).
  39. Trading Economics. China Inflation Rate. Available online: https://tradingeconomics.com/china/inflation-cpi (accessed on 21 July 2020).
  40. Kayfeci, M.; Keçebaş, A.; Gedik, E. Determination of optimum insulation thickness of external walls with two different methods in cooling applications. Appl. Therm. Eng. 2013, 50, 217–224. [Google Scholar] [CrossRef]
  41. Hurtubia, B.; Sauma, E. Economic and environmental analysis of hydrogen production when complementing renewable energy generation with grid electricity. Appl. Energy 2021, 304, 117739. [Google Scholar] [CrossRef]
  42. Noelia, L.; Marta, C.; Luisa, F.C. A comparative life cycle assessment (LCA) of different insulation materials for buildings in the continental Mediterranean climate. Energy Build. 2020, 225, 110323. [Google Scholar]
  43. Dylewski, R.; Adamczyk, J. Economic and environmental benefits of thermal insulation of building external walls. Build. Environ. 2011, 46, 2615–2623. [Google Scholar] [CrossRef]
  44. Tayfun, U.; Sevcan, O.; Metehan, C. Effect of plaster thickness on performance of external thermal insulation cladding systems (ETICS) in buildings. Constr. Build. Mater. 2016, 122, 496–504. [Google Scholar]
  45. Göswein, V.; Rodrigues, C.; Silvestre, J.D.; Freire, F.; Habert, G.; König, J. Using anticipatory life cycle assessment to enable future sustainable construction. J. Ind. Ecol. 2020, 24, 178–192. [Google Scholar] [CrossRef]
  46. Molinos-Senante, M.; Hanley, N.; Sala-Garrido, R. Measuring the CO2 shadow price for waste water treatment: A directional distance function approach. Appl. Energy 2015, 144, 241–249. [Google Scholar] [CrossRef]
  47. Berre, D.; Boussemart, J.P.; Leleu, H.; Tillard, E. Economic value of greenhouse gases and nitrogen surpluses: Society vs. farmers’ valuation. Eur. J. Oper. Res. 2013, 226, 325–331. [Google Scholar] [CrossRef] [Green Version]
  48. Rad, E.A.; Fallahi, E. Optimizing the insulation thickness of external wall by a novel 3E (energy, environmental, economic) method. Constr. Build. Mater. 2019, 205, 196–212. [Google Scholar]
  49. Dylewski, R.; Adamczyk, J. Economic and ecological indicators for thermal insulating building investments. Build. Environ. 2012, 54, 88–95. [Google Scholar] [CrossRef]
Figure 1. Block diagram of optimization design method for roof insulation.
Buildings 12 00916 g001
Figure 2. Schematic diagram of heat transfer of a double-skin roof.
Buildings 12 00916 g002
Figure 3. Section plan of double-skin ventilation roof for building.
Buildings 12 00916 g003
Figure 4. Measured and predicted inner surface temperature of roofs.
Buildings 12 00916 g004
Figure 5. COMSOL model of the low-temperature granary.
Buildings 12 00916 g005
Figure 6. Life cycle total investment of roof thermal insulation.
Buildings 12 00916 g006
Figure 7. Life cycle net present value of roof thermal insulation.
Buildings 12 00916 g007
Figure 8. Environmental benefit of roof thermal insulation.
Buildings 12 00916 g008
Figure 9. Optimum roof thermal insulation of buildings.
Buildings 12 00916 g009
Figure 10. Payback period of roof thermal insulation of buildings.
Buildings 12 00916 g010
Table 1. Performance parameters of roof components [15,18].
Layer No.Material NameThermal Conductivity (W·m−1·K−1)Density (kg·m−3)Specific Heat (J·kg−1·K−1)Thickness (mm)
1Fine aggregate concrete1.51230092040
2Cement mortar0.931800105020
3Expanded polystyrene0.03214138050
4Waterproofing membrane0.2390016204
5Fly ash ceramsite concrete0.951700105080
6Reinforced concrete1.742500920350
7Cement mortar0.93230092020
Table 2. Characteristic parameters of thermal insulation [15,18].
Insulation TypeThermal Conductivity (W·m−1·K−1)Density (kg·m−3)Specific Heat (J·kg−1·K−1)Cost (USD·m−3)
Expanded polystyrene 0.04225138064.3
Polyurethane 0.033401380201.2
Mineral wool0.03590122093.1
Table 3. The results of LCA analysis for insulation materials and electricity [33].
Damage Category EPS (Pt·m−3)MW (Pt·m−3)PU (Pt·m−3)Electricity (Pt·kWh−1)
Human health0.8152.5945.0110.007113
Ecosystem quality0.1170.7820.6250.002033
Resources3.2734.73310.4360.012037
Total4.0258.10816.0620.021183
Table 4. The total cooling loads and energy consumption cost.
Roof Structure γ Insulation TypeTotal Cooling Loads (W·m−2)Energy Consumption Cost (USD·m−2)
Single-skin0.55EPS374,783,559.243.97
PU348,368,639.803.69
MW395,268,997.004.18
None900,378,784.889.53
0.25EPS473,520,261.525.01
PU424,853,756.564.50
MW498,547,095.485.27
None1,086,532,922.8011.50
Double-skin0.55EPS282,514,714.482.99
PU266,464,228.762.82
MW333,083,337.083.52
None785,868,935.688.32
0.25EPS360,895,384.243.82
PU325,217,166.963.44
MW392,573,166.484.15
None919,641,484.569.73
Table 5. Economic benefits of thermal insulation.
Roof Structure γ ECB of EPS
(USD·m−2)
ECB of PU
(USD·m−2)
ECB of MW
(USD·m−2)
Single-skin0.5583.0564.3175.11
0.2594.4176.0086.96
Double-skin0.5568.8553.9764.39
0.2577.9063.3473.52
Table 6. Environmental benefits of roof thermal insulation.
Roof StructureγCategory of DamageENB of EPS (Pt·m−2)ENB of PU (Pt·m−2)ENB of MW (Pt·m−2)
Single-skin0.55Human health45.9253.6166.05
Natural environment13.1415.3918.87
Resources77.4390.56111.74
Total136.53159.55196.66
0.25Human health56.0658.0677.14
Natural environment16.0416.6722.04
Resources94.5598.07130.49
Total166.69172.80229.67
Double-skin0.55Human health65.4581.7785.34
Natural environment18.7223.4324.39
Resources110.51138.24144.38
Total194.70243.43254.11
0.25Human health82.2088.8497.80
Natural environment23.5125.4627.95
Resources138.81150.19165.46
Total244.54264.49291.20
Table 7. Integrated assessment index of thermal insulation.
Roof StructureSolar Radiation Reflectivity CoefficientAssessment IndexEPSPUMW
Single-skin roof0.55 E C B 10.7740.905
E N B 0.6940.8111
b 0.9390.7820.924
0.25 E C B 10.8050.921
E N B 0.7260.7521
b 0.9450.7950.937
Double-skin roof0.55 E C B 10.7840.935
E N B 0.7660.9581
b 0.9530.8010.948
0.25 E C B 10.8130.944
E N B 0.8400.9081
b 0.9680.8320.955
Publisher’s Note: MDPI stays neutral with regard to jurisdictional claims in published maps and institutional affiliations.

