1. Introduction
Urbanisation causes considerable changes in land use and land cover in urban regions. Rapid urbanisation and uncontrolled urban growth obviously alter the physical landscape and might negatively affect different environmental components. According to extensive studies, urban areas are warmer than suburban and rural surroundings. This phenomenon is known as the heat island (HI), a local geospatial feature in urban environments with complicated dynamics and geographical distribution that varies significantly over time. The phenomenon has been reported in over 450 major cities worldwide, with temperatures reaching as high as 10 degrees Celsius and an average of 5 to 6 degrees Celsius. [
1]. This phenomenon dramatically amplifies the impact of heat waves on cities [
2]. UHI’s effects are extensively established in the scientific literature.
Reviews include the radiative and thermal characteristics of building materials and urban infrastructure, darkened asphalt walkways, the urban canopy, a lack of vegetation, and a slower evaporation process in cities. This impact is widely known for raising building-cooling energy consumption, and maximum electricity consumption increases harmful emissions.
UHI negatively affects indoor and outdoor thermal comfort and heat-related mortality and morbidity levels, reducing the disadvantaged population’s survivability, increasing cities’ ecological footprint, and causing significant economic damage. Numerous heat mitigation technologies and strategies have been developed and implemented on large-scale projects [
3,
4]. Urban climate mitigation technologies and techniques [
5] have already been applied in more than 200 accurate-scale projects, with an average temperature drop of 2 °C [
6]. Mitigation technologies involve highly reflective materials for urban spaces and the fabric of buildings, the use of additional greenery, and the implementation of evaporative systems [
7,
8], and the adoption of a combination of mitigation approaches seems promising in reducing the temperature in tropical cities.
Two of the more essential mitigation technologies are associated with buildings’ roofs, roads, and pavements: (a) Those aiming to increase the albedo, known as relaxed or reflective surfaces [
9], and (b) those that propose roofs or pavements partially or completely covered with vegetation, known as green or living roofs and pavements [
10]. Both technologies can lower the surface temperatures of roofs and pavements and thus decrease the corresponding sensible heat flux to the atmosphere. Critical simulation studies have been carried out to identify the heat island mitigation potential of calm and green surfaces [
11,
12,
13]. An increase in the albedo of urban areas through the implementation of reflective materials in open urban spaces and the building environment revealed a very significant cooling potential for cities [
14,
15]). Numerous projects have evaluated the mitigation potential of modified urban albedo on ambient temperature. Most of the studies are performed using mesoscale simulation climatic models ([
13,
16]).
According to a study and analysis of fourteen extensive research studies on the influence of increasing urban albedo on ambient temperature and heat-related mortality, an increase in albedo leads to an afternoon ambient temperature reduction of roughly 0.18 °C for every increase in albedo by 0.1. This is heavily influenced by unique environment, climate, and urban planning factors [
17].
Based on the literature review, we found a shortcoming of knowledge in the study of large urban areas that will be addressed in this study. We implement a novel grid-based method for classifying urban texture into a logical division which improves the accuracy of the simulation method. In addition, this strategy includes the boundary condition of each division on others’ models in our research. We aim to conduct the study in a large urban area with software domain limitations.
This paper investigates the advantages of mitigation strategies incorporating cool pavements, streets, and roofs, including greenery for outdoor pavements and roofs, on the lessening of maximum ambient temperature and its impact on outdoor thermal comfort based on PMV indicators. Metropolitan Sydney (NSW, Australia) was chosen as an example of a metropolis impacted by high HI intensity. Comprehensive parametric research revealed that the Sydney metropolitan region had substantial temperature variations within its bounds, with a maximum temperature differential of 6 °C [
18].
2. Materials and Methods
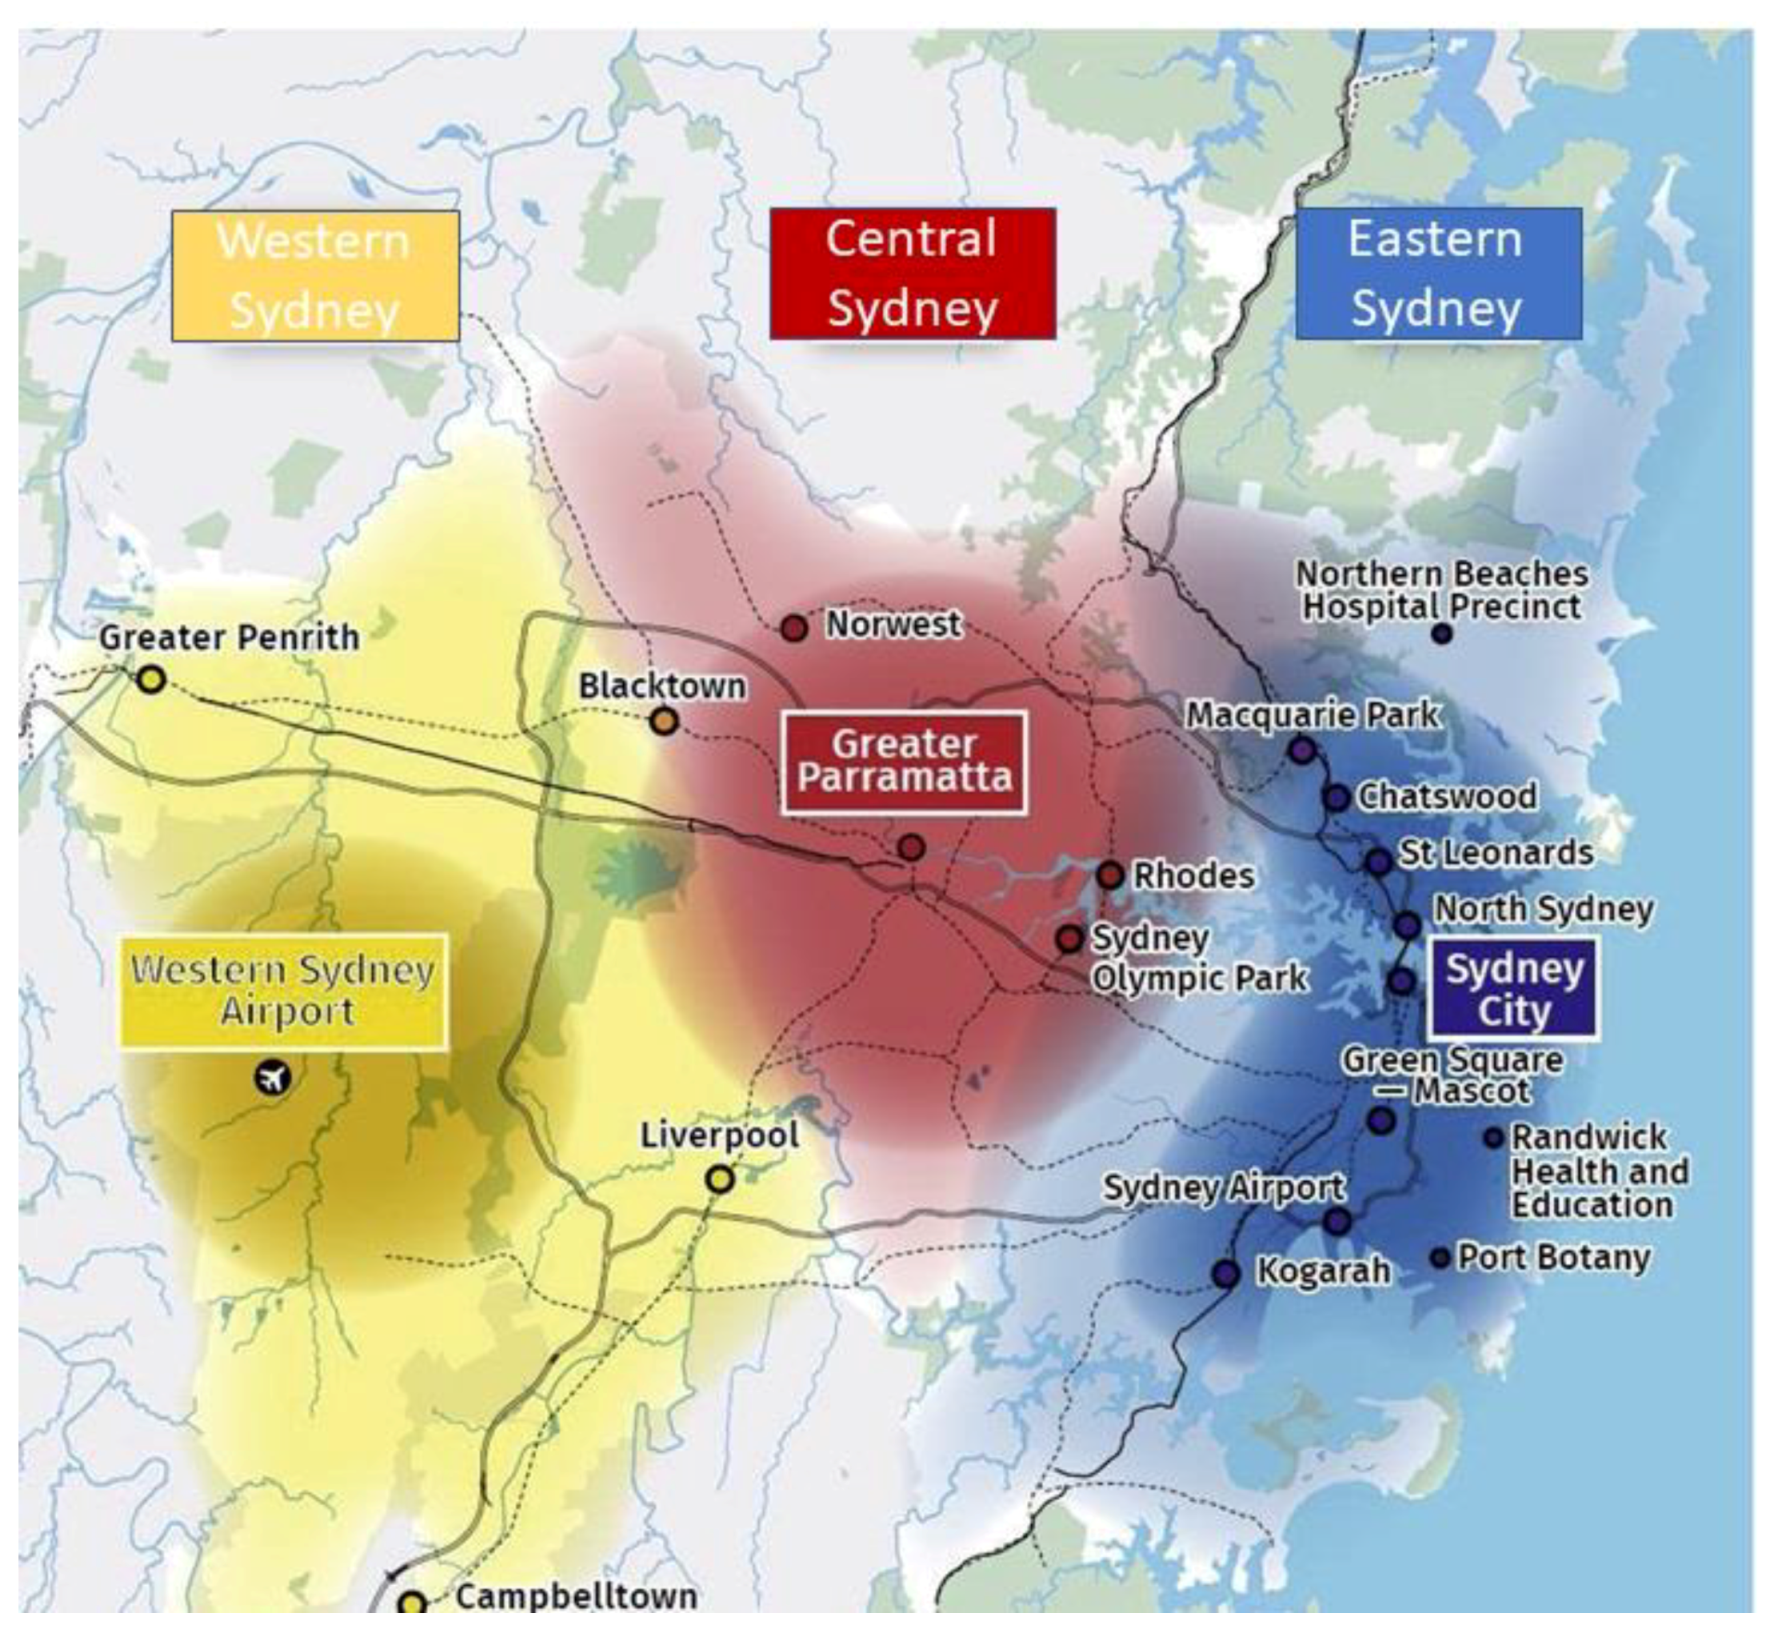
The study area is in the context of Greater Sydney, NSW, Australia. Greater Sydney suffers from UHI effects with a peak intensity of up to 6 °C [
16]. Greater Sydney is the capital city of NSW and is a metropolis of three cities, including the eastern city, central city, and western city, as shown in
Figure 1.
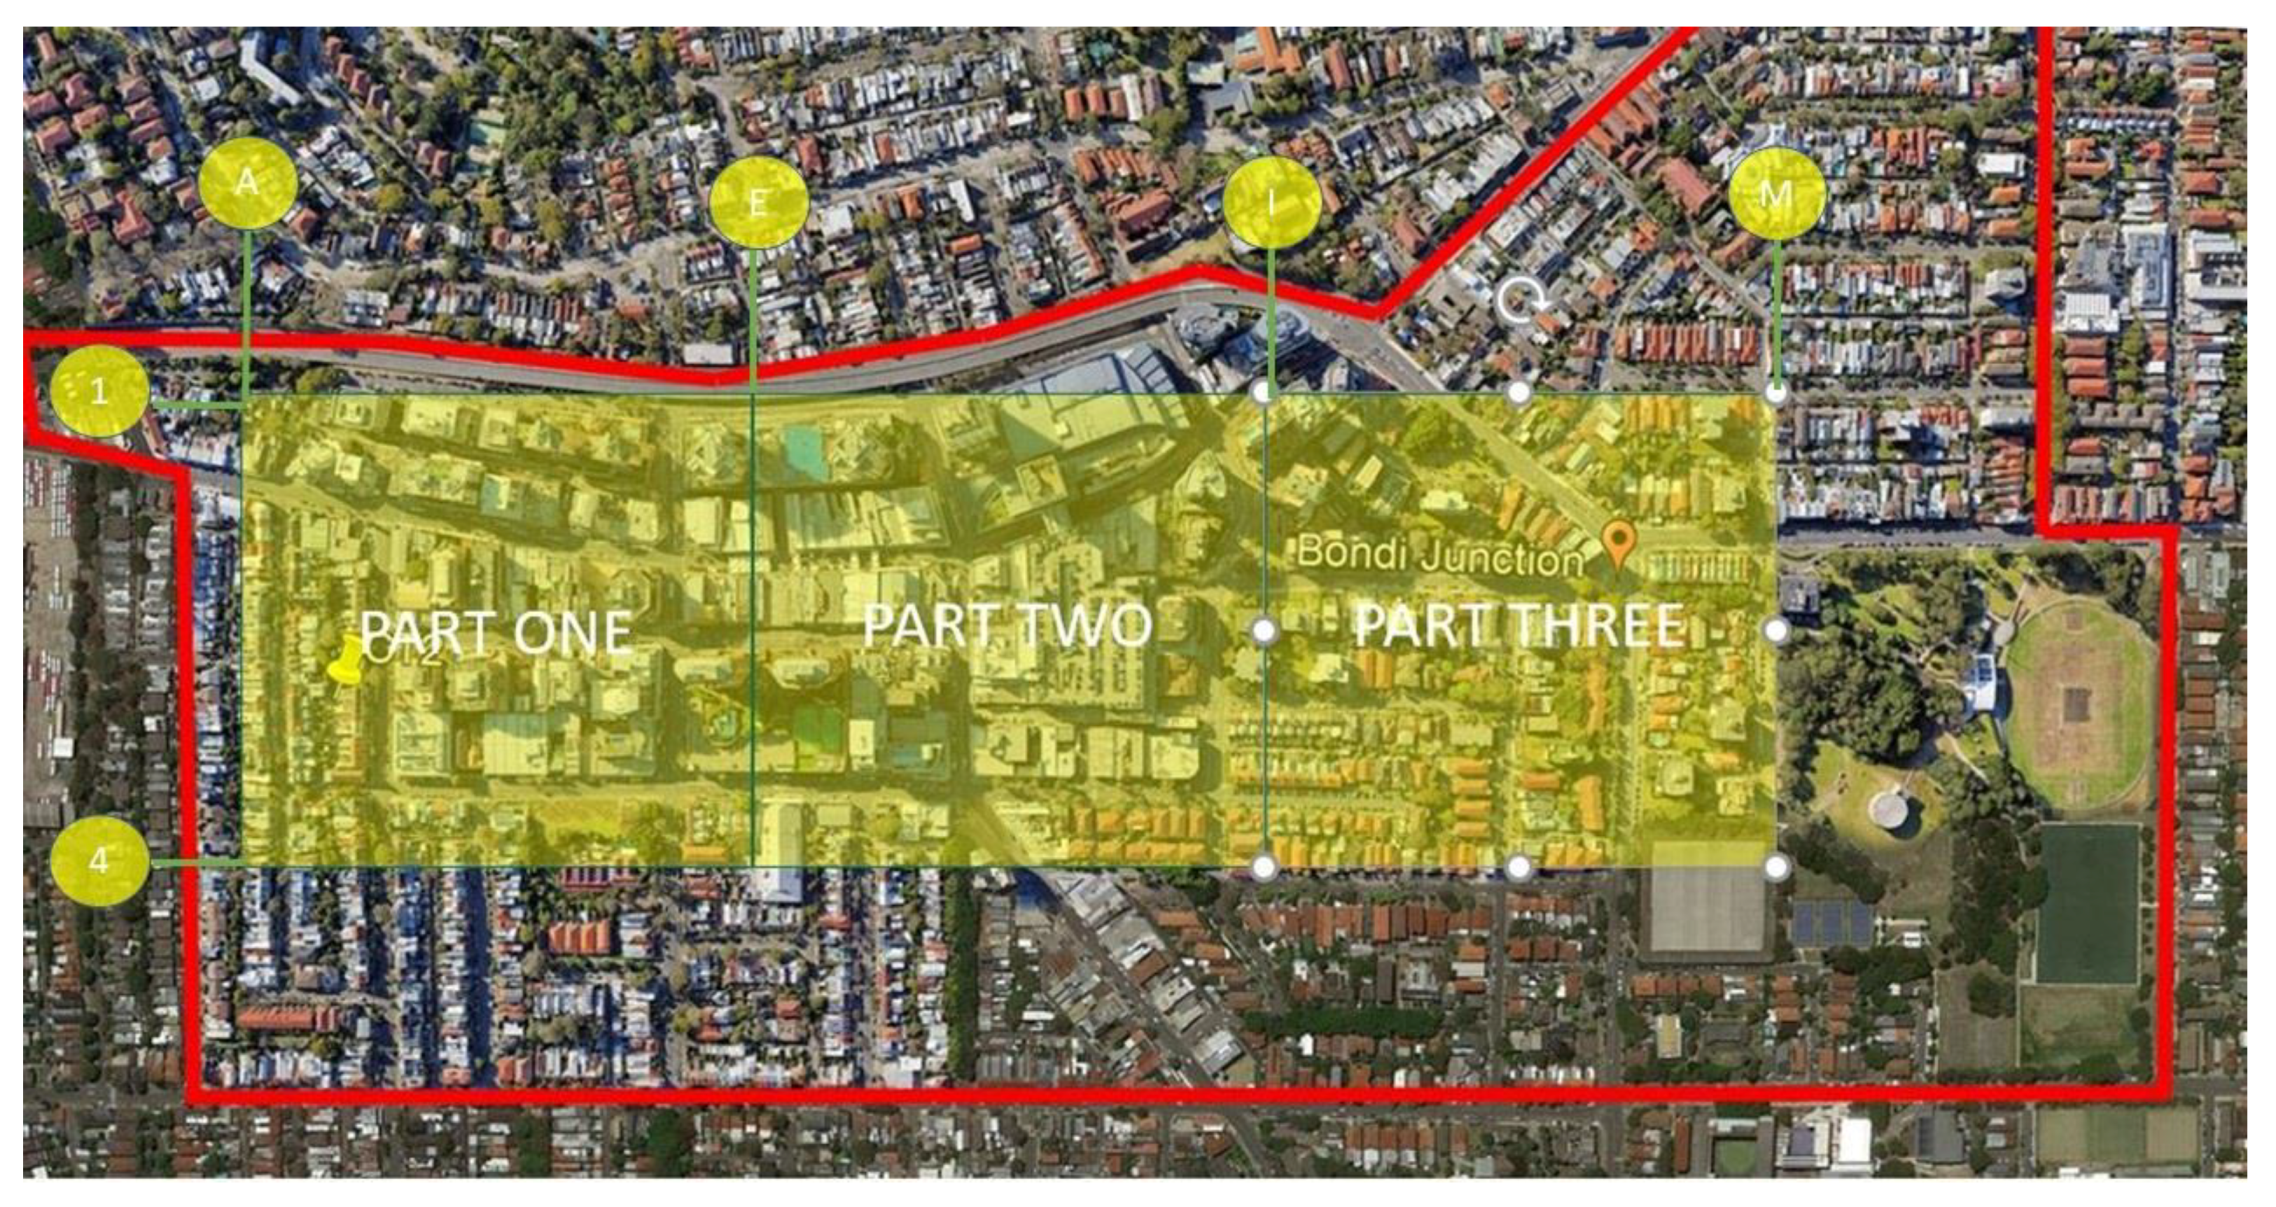
An urban zone extending about 450 m south-north and 1600 m in the east-west direction within the neighbourhood of Bondi Junction, Sydney (33°53′35.4′′ S 151°14′58.9′′ E) was selected as a case study.
The suburbs contribute residential functions and contain a shopping and transport hub, shopping mall, casual fashion stores, and branches of some of the city’s trendiest restaurants. Housing types range from detached, semi-detached, or terraced houses with 1–2 stories to units or apartments with 2–4 levels and, in some mixed-use buildings, reaching more than twenty stories, representative of diverse urban typology in Bondi Junction, Sydney, and presented in
Figure 2.
There are heavy-traffic roads in the east-west direction (Syd Einfeld Highway) that separate the precinct from adjacent areas. The selected area represents a compact, open urban site’s typical pattern. The area consists of three main parts, A, B, and C, representative of the (A–E, E–I, and I–M) (1–5) axis presented in
Figure 2. Parts A to C comprise a combination of the different urban configurations and the model’s connectivity secures accurate boundary conditions for our analysis.
Framework and Data Processing
Over the past several decades, research efforts have been devoted to developing and evaluating UHI mitigation strategies through measurements, remote sensing techniques, and numerical simulations.
The most widely investigated HI mitigation strategies include green infrastructure (e.g., trees and grass) [
19,
20,
21]), cool roofs [
22,
23], pavement-related strategies [
24], and designs of urban morphology and building geometry [
25].
This research explores the optimum implementation of mitigation technologies in typical urban settlements under Sydney’s climate conditions during a heatwave with fieldwork measurement and numerical simulation. We implemented, tested, and analysed different mitigation and composite scenarios to mitigate the heat island effect. These scenarios included applying high-albedo materials on the road surfaces and rooftops and increasing greenery on the pedestrian level and rooftops.
Pavement-related UHI mitigation strategies such as reflective and permeable pavements [
26] are often called cool pavements. They usually have lower surface temperatures than conventional paving materials such as impervious asphalt [
27]. Impressive progress has been achieved in developing advanced reflective materials presenting superior thermal and optical characteristics, including highly reflective white materials; IR reflective coatings; and thermochromic, fluorescent, and super cool plasmonic and photonic materials [
28].
IR materials reflect and transmit in the infrared spectrum (0.750–1000 μm). Most IR materials in optical applications are in the short-wave (1.4–3 μm) to mid-wave (3–8 μm) infrared regions. Advanced white reflective materials and IR-reflective coatings exhibit surface temperatures up to 10 °C below the temperature of same-colour conventional materials [
29]. Coloured high-reflective materials have been developed. Typical liquid products involve white paints and elastomeric, polyurethane, or acrylic coatings. Examples of white single-ply products involve EPDM (ethylene-propylenediene-tetrolymer membrane), PVC (polyvinyl chloride), CPE (chlorinated polyethylene), CPSE (chlorosulfonated polyethylene), and TPO (thermoplastic polyolefin) materials. A review of the recent developments in the field of liquid-applied materials used in reflective roofs is given in Santamouris et al. [
30].
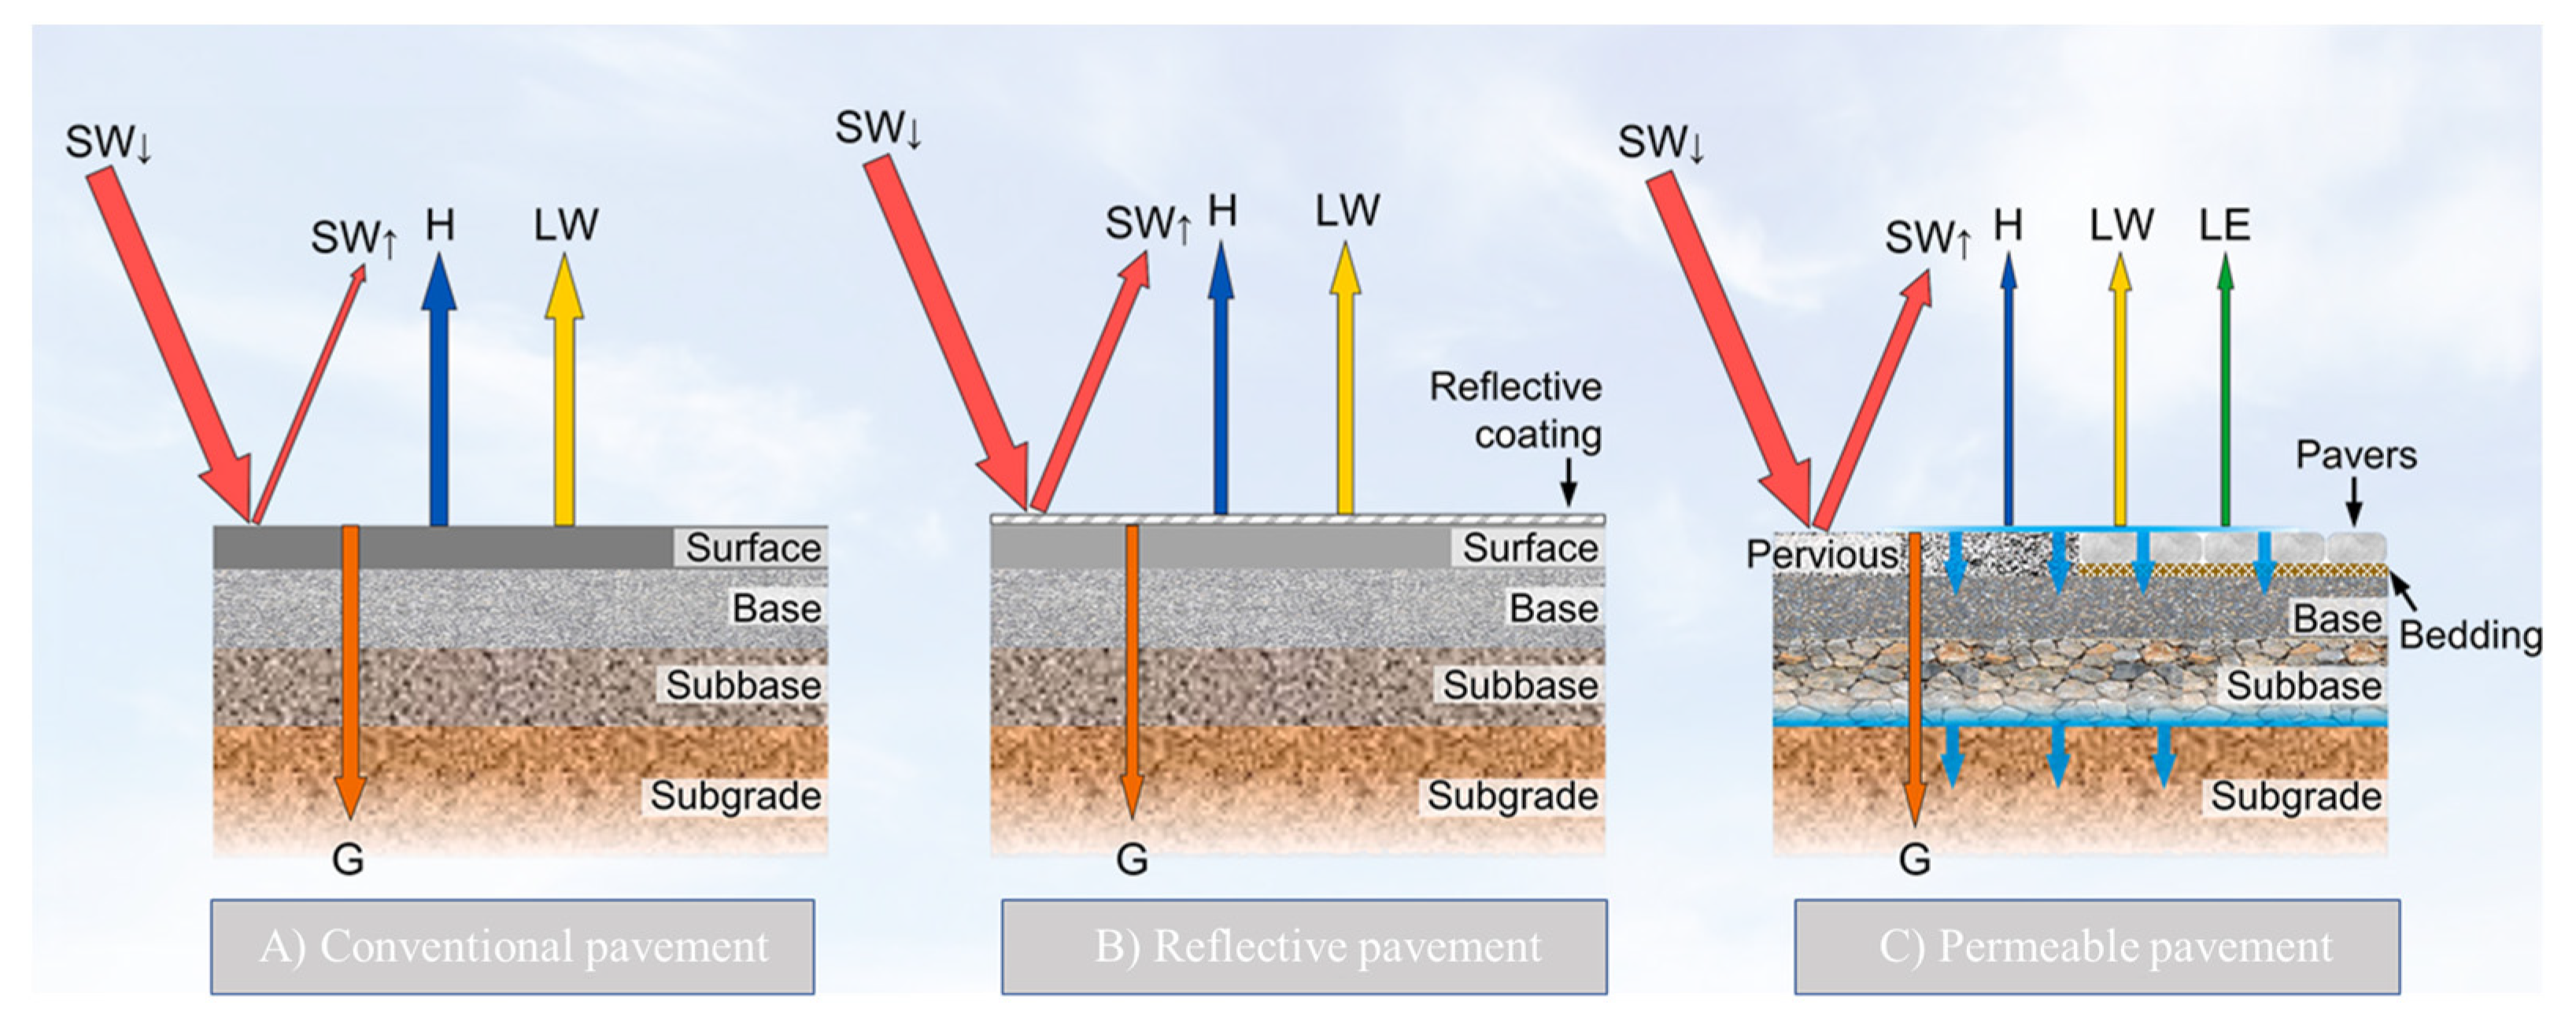
Figure 3 compares the structures of conventional pavement (dense graded asphalt or concrete pavement with a low albedo) and two types of cool pavements: reflective pavement with a reflective surface (e.g., coating) and permeable pavement with a permeable surface layer (e.g., pervious concrete, porous asphalt, or permeable concrete pavers). Pavements that emit sunlight lessen surface and air temperatures by enhancing reflected solar radiation compared to traditional pavements.
Arrows with letters in each subplot show the simplified energy balance for each pavement type: SW↓ − SW↑ + LW = G + H + LE, where SW↓, SW↑, LW, G, H, and LE denote downward short-wave radiation (solar radiation), upward short-wave radiation (reflected), net long-wave radiation, heat conduction, sensible heat flux, and latent heat flux, respectively.
Roofs represent a very high fraction of the exposed urban area. The available free ground area in the urban environment is quite limited and of very high economic value, and it is relatively complex to implement large-scale mitigation technologies. Several experimental and theoretical studies have been performed to identify the energy conservation potential of green roofs [
31,
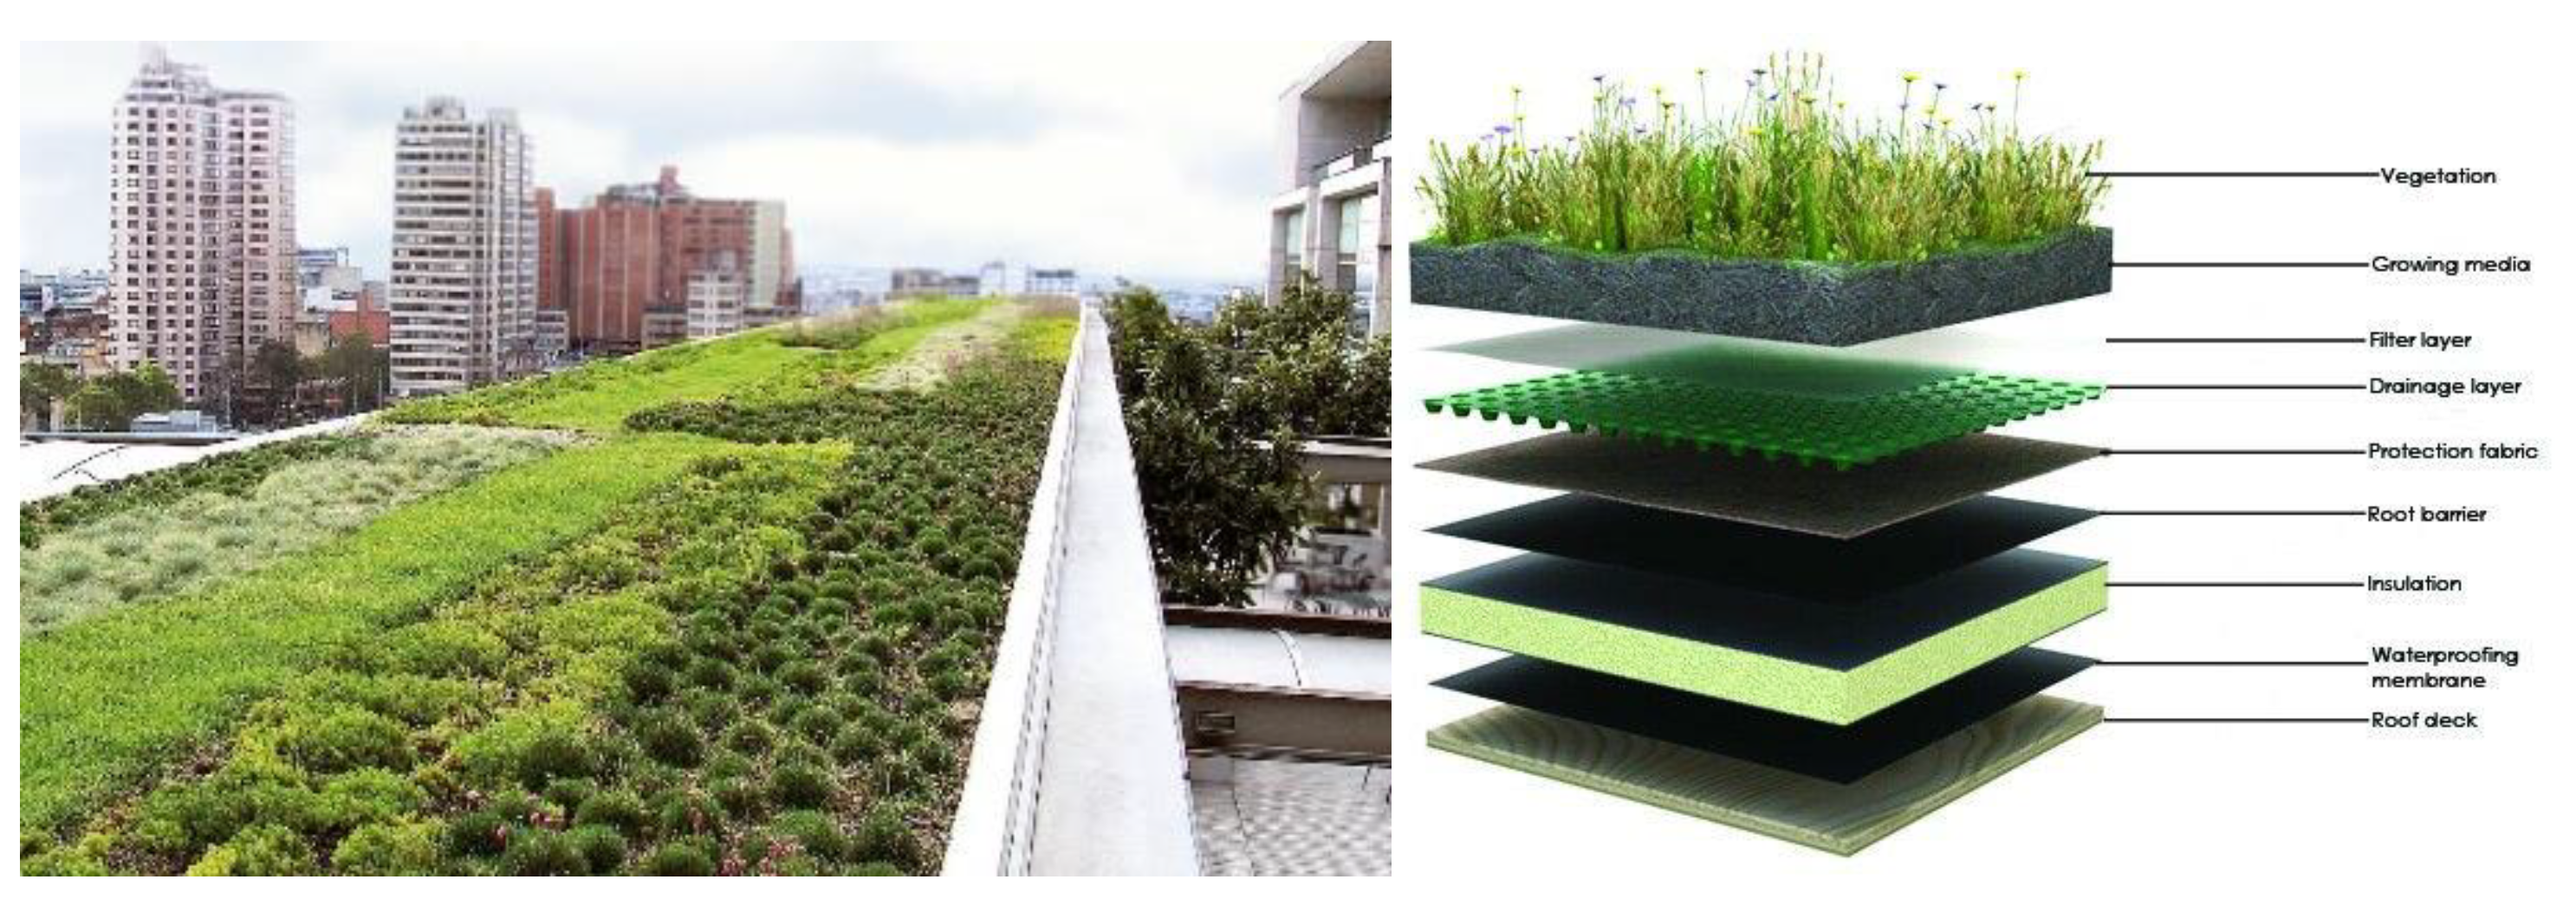
32]. There are two main types of green roofs: expensive roofs that are light and covered by a thin layer of vegetation, and intensive roofs that are heavier and can support small trees and shrubs. The specific energy benefits depend on the local climate; the green roof design; and, more importantly, specific building characteristics. The system performs better in dry climates because heat transfer benefits are mainly provided through latent heat processes in green roofs. In parallel, the thickness and the thermal characteristics of the vegetative roof broadly define its U value and the corresponding heat transfer to the building.
In contrast, the type and features of the plants (LAI) specify the shading levels and the transfer of radiation through the layers. Finally, watering is essential, as it determines the latent heat release and regulates the thermal balance of the roof. The green roof type implemented in our study consists of a shallow Sedum area with herbaceous perennials and grasses, as presented in
Figure 4.
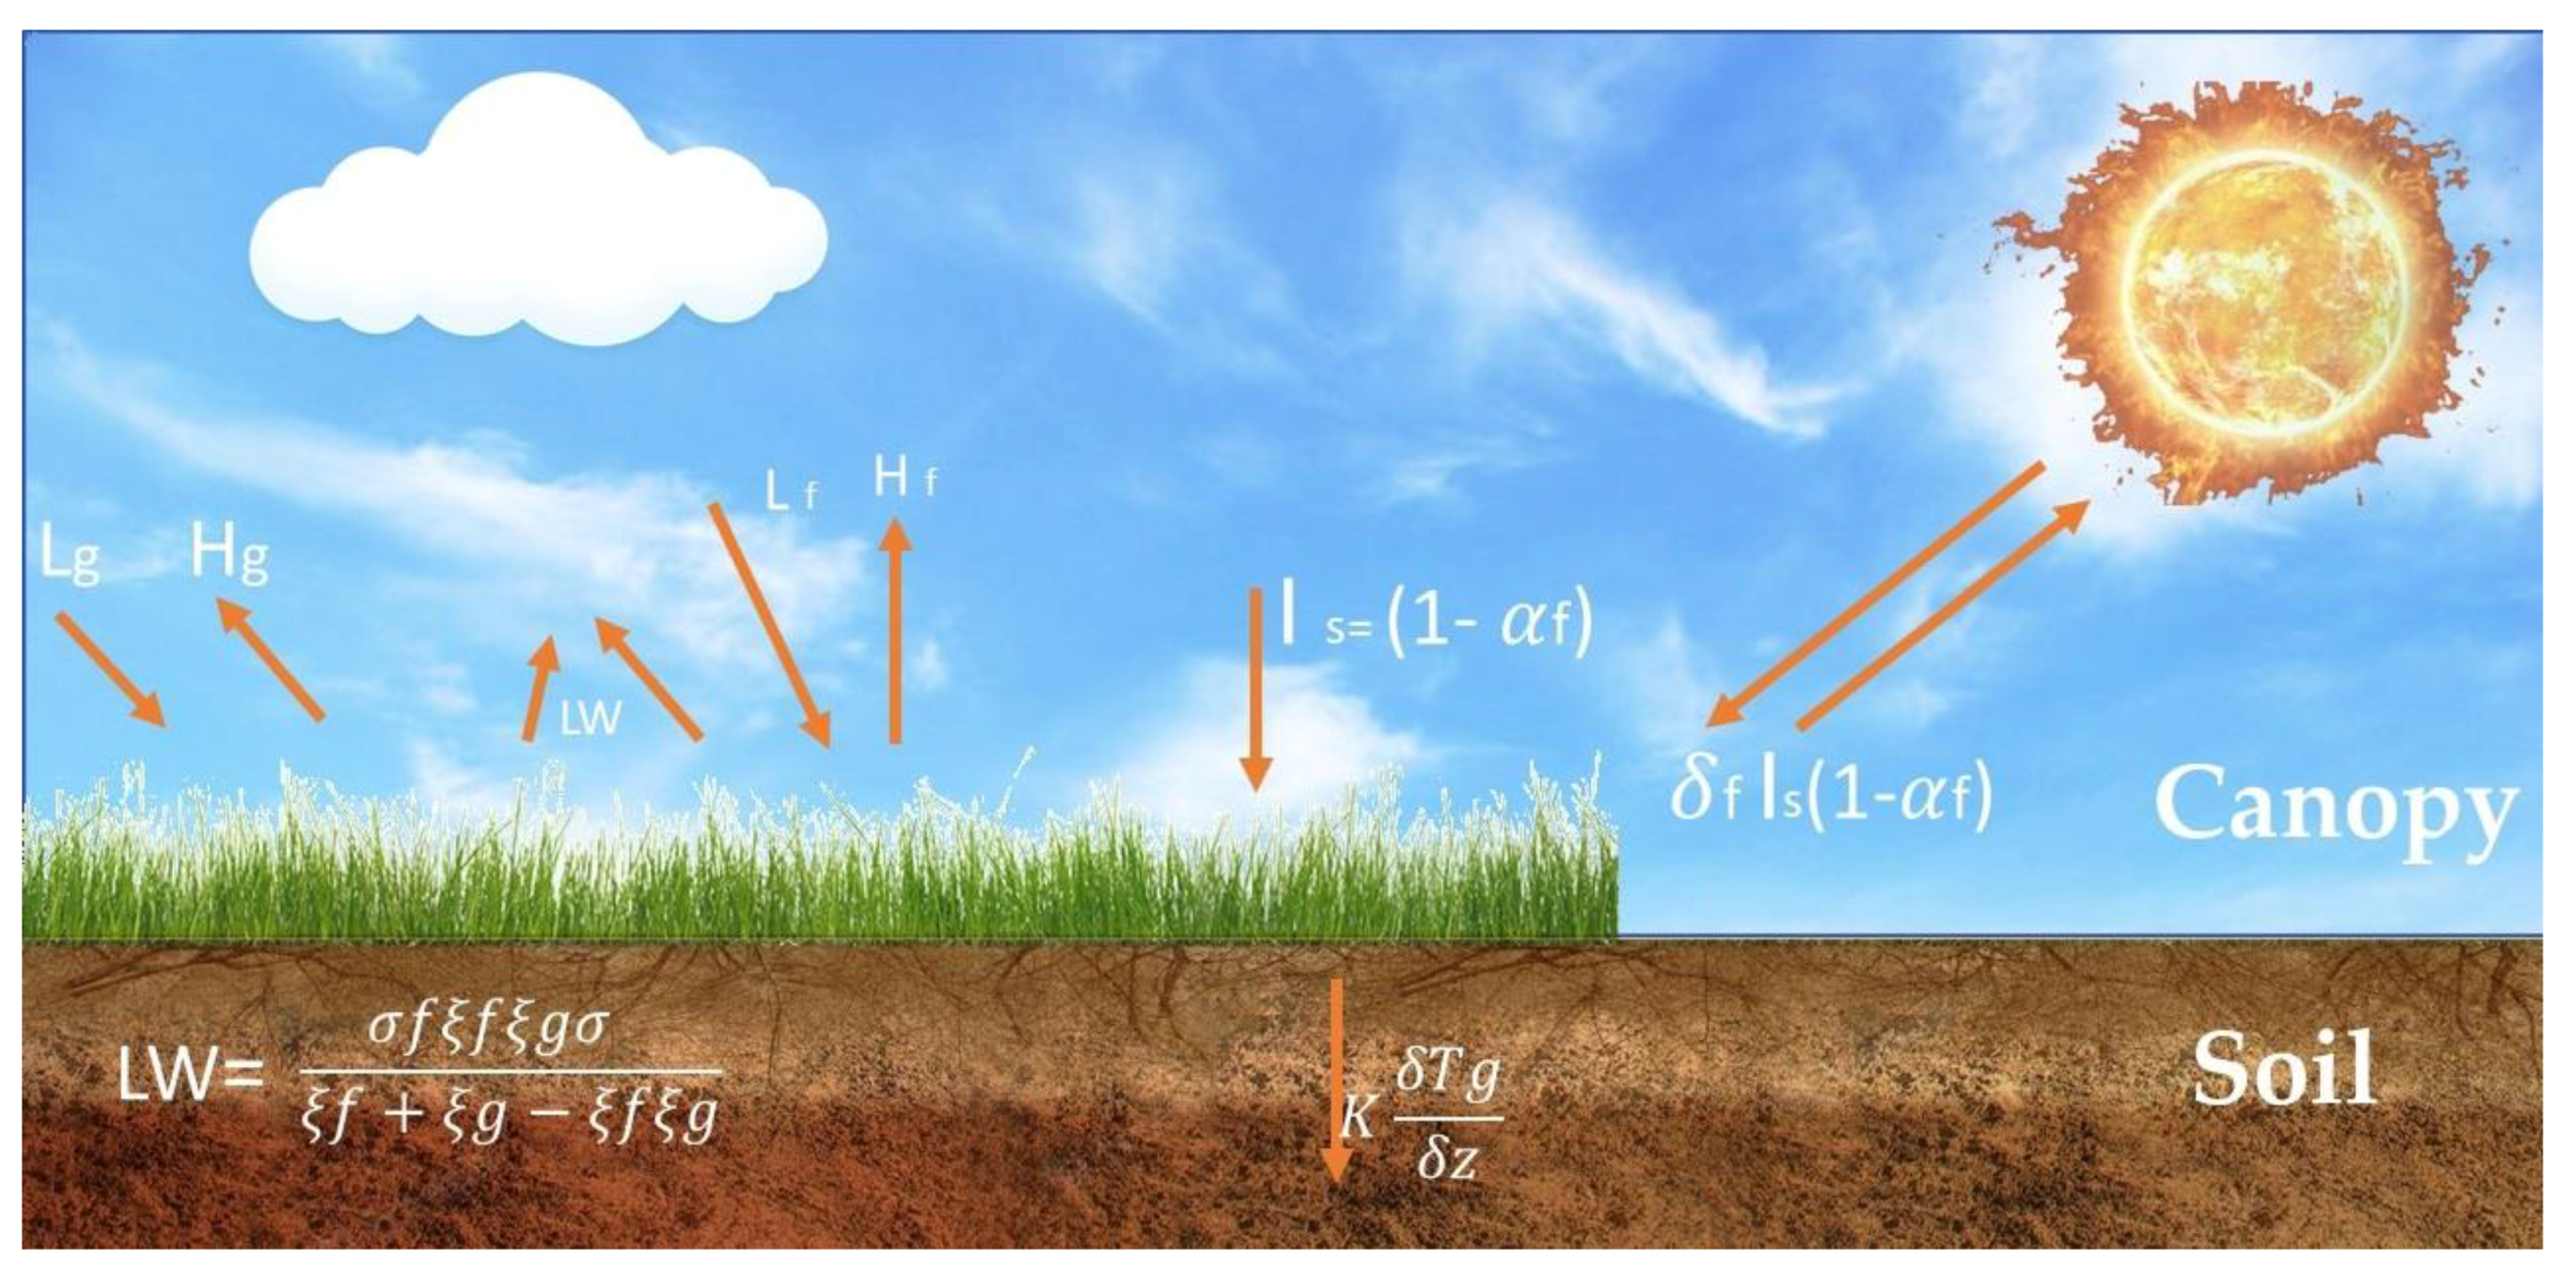
Figure 5 shows the green roof’s main heat fluxes and energy balance.
The incident solar radiation reaching the soil surface is called global radiation. The short-wave radiation reflected from the surface of the green roof.
- ·
The long-wave radiation emitted by the green roof.
- ·
The heat flow of radiation emitted by the roof.
- ·
The sensible heat exchange by convection.
- ·
The latent heat flux derived from evapotranspiration.
- ·
The sensible heat flux by conduction through the roof soil.
Pavements present a high potential for cooling capacity in cities, as conventional dense-graded pavements with a relatively low albedo (such as asphalt) absorb a large amount of incident solar radiation—this causes warmer-than-natural vegetation during both daytime and night-time. Increasing green spaces in urban areas contributes to decreasing the urban surface and ambient temperatures and mitigating the heat island effect. We explore a comprehensive analysis of the main climatological variables by Envi-met software. ENVI-met is a software-based, tridimensional model for predicting energy and water interactions between outdoor surfaces (buildings’ facades and roofs, outdoor streets and pavements), air, plants, and greenery [
33,
34].
The model uses an integrated Computational Fluid Dynamics (CFD) technique to account for long-wave and short-wave radiation fluxes, transpiration and evapotranspiration from plants, and air movement. ENVI-met has been extensively validated by comparing its results against real measurements [
35,
36,
37].
ENVI-met has a spatial discretisation range of 0.5 m to 10 m, and, in this experiment, spatial discretisation of 2 m and 2 m was used for the horizontal plane. In comparison, the vertical height of the cells was set equal to 2 m with a telescopic factor varying between 5% to 9% to provide sufficient boundaries to the model. The total model includes a grid of 200 × 200 × 28 cells, thus resulting in an entire dimension of the modelled volume of 400 m × 400 m with varying heights. Moreover, open lateral boundary conditions were applied.
The results are compared and discussed with the base case to explore the mitigation scenarios and their corresponding cooling potential: It is expected that the following research questions will be answered in this study:
The following method was followed to evaluate the applied mitigation technologies in typical urban settlements.
We rendered a grid-based urban area with Envi-met software on 17 January 2019, representing the summer’s hottest day. We collected the primary climatological data from a fixed weather station near the case study area.
We studied the impact of the different mitigation scenarios presented in
Table 1 on heat islands during 24 consecutive hours. We investigated the average main climatological variables and all settlements and compared them with the reference model during the 24 h of the day. We discuss and analyse the results regarding their cooling potential under different mitigation scenarios to provide a holistic approach to how various urban settlements react to the mitigation scenarios.
Table 1 presents a summary of mitigation scenarios applied to the three parts. Albedo (locally applied to streets, outdoor pavements, or roofs) is the main parameter, with a range of variability between a minimum of 0.1 for the base case and a maximum of 0.6. The percentage of outdoor pavements integrating greenery has an expected value of 5% and maximum value of 60%. The range of variability of the albedo (global, streets, pavements, roofs) has been selected to represent all scenarios. The highest limit (0.9) is the maximum potential, and ageing might hinder many materials.
The grid classification of the studied area provides a clear understanding of the thermal behaviour of individual cells with their corresponding types under compound mitigation scenarios.
Simulation and comparison of these compound scenarios provide a clear understanding of the cooling potential of different mitigation scenarios on a diverse range of urban configurations. The entire simulation process is shown in
Table 2.
- 2.
Which mitigation scenario shows the maximum cooling potential over this study?
To evaluate the cooling potential of mitigation scenarios, we compare and analyse mitigated strategies with their corresponding models with regard to the average ambient temperature, outdoor thermal comfort, and wind speed.
We compare different scenarios based on their cooling potential and capacity to improve outdoor thermal comfort in the precinct based on the PMV indices to evaluate the most compatible mitigation scenario.
The models rendered the existing greenery and paved materials presented in detail in
Table 2 and described in this section.
The proposed scenarios were rendered under the 17 January 2019 Sydney climate conditions to represent the heatwave period.
As an input to the base case model, we employed climatic data from a terrestrial survey in the Bondi Junction precinct and compared the results. The Bureau of Meteorology provided the actual wind speed and direction. (Observatory Hills weather station). Observatory Hill (151°120′18″ E) is on a hill covered by greenery. It is close to the coast and Sydney’s central business district (CBD), extending over 27 km², with tree canopy cover of approximately 15.2%. The wind mostly blows from the sea to the site, and NE/SE winds represent the sea breeze. NW/SW winds blow from inner Sydney towards the reference station.
We calculated ambient air temperature and relative humidity data at 2 m and wind speed data at 10 m above the ground. The following instruments and measurement techniques were applied to collect the methodological data. The monitoring campaign area was the entirety of Council St. from Waverly St. to Allen Parade St. and its surrounding areas in Bondi Junction. We defined the exact location of the measurement points based on one preliminary on-site supervisor-led inspection.
We took spot measurements at many locations along Council St. and its surroundings. The measured variables included incoming solar radiation, air temperature, relative humidity, and wind speed. We performed this about three times per point with a portable station mounted on a cart at 1.5 m and moved along the designated track from 10:30 a.m. until 6.30 p.m.
We equipped the carts with a set of sensors on a Met Pak Pro presented in
Table 3 and
Table 4;
- -
A net radiometer (NR01 by Hukse flux) collected the incoming solar radiation with an ISO 9060 s-class pyranometer (
Table 4);
- -
A weather station (Met Pak Pro) with an integrated Wind Sonic ultrasonic wind sensor by Gill Instruments (
Table 5).
The Met Pak Pro weather station collected spot measurements of climatological variables (
Table 6).
A data logger (DT85 by Lontek) set the sampling rate for the weather station to 1 s and recorded over 30 s.
We collected microclimate data for Council St. using multiple measurement techniques on a terrestrial survey at different locations on the pedestrian level. Variables included ambient air temperature, relative humidity, wind speed/direction, incoming solar radiation, and surface temperature.
Table 5 presents a sample of the geographic coordination of the locations with their corresponding measured parameters and a summary of fieldwork measurements and recorded variables. We performed the campaign from 10:30 a.m. to 6:30 p.m. (local solar time) on Council St and in the surrounding area on 24 October 2019. We collected measurements at least three times at similar locations and at different times to ensure redundancy.
A T540 thermal camera with FLIR and an infrared thermometer collected thermal information. The instruments collected the surface temperatures of asphalt, sidewalks and roof coverings and thermal images of vertical surfaces (
Table 3). The T540 was sensitive enough to detect temperature differences at <30 K to render low-noise results.
Table 6 presents a summary of the applied equipment.
Table 7 presents the main meteorological variables applied in the simulation domain.
We applied simple forcing simulation methods for ambient air temperature and wind speed/direction. We performed the simulations for 24 consecutive hours, starting from 1 am to 24 p.m., at the human height level (H = 1.6 m) on these three days in all typologies. We considered the 24 h cycle to balance computational time and the precision of the outputs. Heat maps based on ambient air distribution, wind speed, outdoor thermal comfort, and maximum/minimum temperature difference were evaluated for all configurations. We examined heat maps of the layouts and discussed how mitigation techniques affect heat island formation. We looked at the relationship between mitigating potential and applicable scenarios and established the general trend of the data. A detailed analysis of the simulated data and conclusion are presented in the following sections.
3. Results
We present the three parts rendered under the 17 January 2019 climate condition as a reference model and the results at 2 p.m. in
Table 8. The reference model characteristics include street albedo = 0.12, pavement albedo = 0.3, and roof albedo = 0.3, with the existing greenery. The reference model applies for a comparison between the results and evaluates the mitigation potential of different scenarios.
A study of the ambient air temperature map indicates micro heat islands and large asphalt paved areas with almost 2 °C higher records. Part three presents the maximum ambient temperature value while part two shows the minimum value, with almost a 2 °C temperature difference due to the buildings’ configuration. The urban layout has a temperature difference of 0.7 °C at maximum, 1.53 °C at minimum, and 2.17 °C on average across the study area.
The thermal difference across the precinct can reach 12.13 °C in the base scenario on 17 January 2019.
Part one predicted a minimum of 28.3 °C, a maximum of 30.4 °C at 2 p.m., and an average of 28.92 °C in a large area. Wind speed varied between 0.4 m/s in a large area between buildings, perpendicular to the wind direction, and 4 m/s near the building edges and in the middle of the canyon, parallel to wind flow. The PMV indices predicted very hot outdoor thermal conditions, with an average of 2.88 at 2 p.m.
Heat maps predicted a minimum of 28 °C, a maximum of 30.72 °C, and an average of 28.92 °C in part two at 2 p.m. Wind speed varied between 0.44 m/s in most canyons perpendicular to the wind flow and 4.4 m/s in canyons parallel to the wind direction. The PMV indices predicted very hot outdoor thermal conditions, with an average of 2.85 at 2 p.m. in the entire area.
At 2 p.m., the ambient air temperature fluctuated from a minimum of 28.3 °C to 30.4 °C, with an average of 28.92 °C in part three. The outdoor thermal comfort map predicted hot conditions across a large area in all canyons, with an average of 2.24 based on the PMV at 2 p.m. Because of the high-rise buildings’ shading, the space between the high-rise buildings on the northwest side had a more relaxing environment, with an average PMV of 1.61.
Wind speed varied between 0.55 m/s in most canyons perpendicular to the wind flow and 5.17 m/s in canyons parallel to the wind direction.
The wind speed increased slightly from morning to midnight in all parts and remained almost stable for 24 h.
Table 8 shows the ambient air temperature, outdoor thermal comfort, and wind speed distribution map at 2 p.m.
General comments:
A large asphalt paved area on the north-east side of part three, perpendicular to the wind flow, showed the maximum ambient temperature value of 30.8 °C. On the other hand, a canyon shaded mainly by the high-rise adjacent buildings, with an almost low wind speed value, presented a minimum of 28 °C. Due to the buildings‘ configuration, this area had a nearly 2.08 °C temperature difference. Part three offered an almost lower average ambient air temperature value than the other parts, which could have resulted from a more significant green proportion.
Except for tiny canyons perpendicular to the wind flow that are completely covered by surrounding high-rise structures, the whole area is expected to suffer from high temperatures and a high PMV value.
3.1. Scenario Two (High-Albedo Streets and Pavements)
Scenario two applies high-albedo material on road and pedestrian levels in all three urban configurations.
All models’ characteristics remain the same as with the reference model except for the substitution of the asphalt road surface (albedo = 0.12) with medium-albedo asphalt (albedo = 0.24) and the concrete pavement (albedo = 0.3) with white concrete (albedo = 0.6).
All models ran with the reference config file, and the results were compared with regards to their highest, lowest, and average ambient air temperatures.
Table 9 illustrates ambient air, outdoor thermal comfort, and wind speed maps for the second scenario at 2 p.m.
Part one:
The maximum ambient temperature decreased by 0.56 °C, the minimum by 0.49 °C, and the average by 0.2 °C. The heat maps predicted very hot outdoor conditions, while the average PMV declined by 0.17 compared to the reference model.
Part two:
The maximum decreased by 1.99 °C, the minimum by 0.61 °C, and the average by 1.7 °C compared to the reference model. The PMV ranged between 0.81 and 2.84, with a mean of 1.86, 0.99 lower than the reference model.
Part three:
A heat map study shows that the application of high-albedo material decreased the maximum by 1.35 °C, the minimum by 1.18 °C, and the average by 0.88 °C compared to the reference model. Heat maps predicted hot outdoor conditions slightly more relaxed than the reference model.
General comments:
Part two presents the maximum temperature decreases in this scenario. However, applying high-albedo material decreases the ambient air temperature, but the entire precinct experiences very hot conditions. The location of the heat island remains almost like the reference model, mainly in large asphalt paved road with smaller sizes. The wind map presents almost similar behaviour compared to the reference model.
3.2. Scenario Three (High-Albedo Streets and Pavements)
Scenario three applies high-albedo material on roads and pedestrian levels in all three urban configurations.
All models’ characteristics remain the same as with the base case study except for substitution of the asphalt road surface (albedo = 0.12) with high-albedo asphalt (albedo = 0.36) and the concrete pavement (albedo = 0.3) with high-albedo white concrete (albedo = 0.9).
All models ran with the reference config file; the results are compared based on their highest and lowest average ambient air temperatures—
Table 10 shows the ambient air, outdoor thermal comfort, and wind speed distribution maps at 2 p.m.
Part one:
A heat map study shows that the application of high albedo material decreased the maximum by 1.18 °C, the minimum by 0.5 °C, and the average by 0.24 °C compared to the reference model. Outdoor thermal comfort increased, with PMV indices which are slightly hotter than the reference model.
Part two:
The maximum ambient air temperature decreased by 0.99 °C and the average by 0.06 °C, while the minimum increased by 0.07 °C compared to the reference model. There was a decrease in the minimum PMV indices, while the average PMV increased.
Part three:
The maximum decreased by 1.07 °C, the minimum by 0.92 °C, and the average by 0.68 °C compared to the reference model. There was a decrease in the minimum PMV value; however, the average value slightly increased.
General comments:
Part three presents the maximum temperature decreases in scenario three. The location of the heat map remains almost like the reference model, mainly along a large asphalt paved road. The wind map presents almost similar behaviour compared to the reference model. However, the application of high-albedo materials declines the ambient temperature value; but still, the entire precinct is predicted to have very hot outdoor thermal comfort. High-albedo material slightly reduces the wind speed value but has almost no impact on the wind pattern across the precinct.
3.3. Scenario Four (High-Albedo Material on Building’s Rooftops, up to 60%)
Scenario five is dedicated to increasing buildings’ rooftop albedos from 0.5 to 0.7 by applying medium-albedo plaster on the outer layers in all three urban configurations. At the same time, the rest of the models’ characteristics remain the same as the reference model.
Models ran with the reference config file. The results are compared based on their highest, lowest, and average ambient air temperatures—
Table 11 shows the ambient air, outdoor thermal comfort, and wind speed distribution maps at 2 p.m.
Part one:
A heat map study shows that the application of medium-albedo material on building rooftops decreased the maximum by 0.31 °C, the minimum by 0.67, and the average by 0.34 °C compared to the reference model. Outdoor thermal comfort increased, with PMV indices which were slightly hotter than the reference model.
Part two:
The application of medium-albedo material on buildings’ rooftops increased the maximum by 0.21 °C, the minimum by 0.56 °C, and the average by 0.36 °C. Outdoor thermal comfort increased, with PMV indices increased by 0.23, slightly hotter than the reference model.
Part three:
A heat map study shows that the application of medium-albedo material on building rooftops decreased the maximum by 0.7 °C, the minimum by 0.43 °C, and the average by 0.86 °C compared to the reference model. Outdoor thermal comfort increased, with PMV indices which were slightly hotter than the reference model.
3.4. Scenario Five (High-Albedo Building Rooftops, up to 90%)
Scenario five is the increasing of buildings’ rooftop albedos from 0.5 to 0.9 by applying high-albedo plaster on the outer layers in all three urban configurations. At the same time, the rest of the models’ characteristics remain the same as the reference model.
All models ran with the reference config file, and the results are compared based on their maximum, minimum, and average ambient air temperatures.
Table 12 shows the ambient air, outdoor thermal comfort, and wind speed distribution maps in all parts at 2 p.m.
Part one:
A heat map study shows that high-albedo material on buildings’ rooftops decreased the maximum by 0.31 °C, while increasing the minimum by 0.23 °C and the average by 0.05 °C compared to the reference model. Outdoor thermal comfort increased by 0.33 in PMV indices, which were slightly hotter than the reference model.
Part two:
Applying high-albedo material on buildings’ rooftops increased the maximum by 0.22 °C, the minimum by 0.56 °C, and the average by 0.37 °C. Outdoor thermal comfort increased, with PMV indices increased by 0.23, slightly hotter than the reference model.
Part three:
The maximum decreased by 0.85 °C, the minimum by 0.66 °C, and the average by 1.06 °C compared to the reference model. Outdoor thermal comfort increased by 0.29 in PMV indices, which were slightly hotter than the reference model.
3.5. Scenario Six (Increase Pavements’ Greenery by up to 30%)
Scenario six is the application of 50 cm of grass of average density on up to 30% of the pavement in all three urban configurations. At the same time, the rest of the models’ characteristics remain the same as the reference model.
Models ran with the reference config file. The results are compared based on their highest, lowest, and average ambient air temperatures—
Table 13 shows the ambient air, outdoor thermal comfort, and wind speed distribution maps at 2 p.m.
Part one:
A heat map study shows an increase in pavement greenery by up to 30% decreased the maximum by 0.37 °C, while increasing the minimum by 0.21 °C and the average by 0.05 °C compared to the reference model. Outdoor thermal comfort decreased by 0.28 in PMV indices, slightly more relaxed than the reference model.
Part two:
Scenario six shows a decrease in the maximum by 0.07 °C, while increasing the minimum by 0.3 °C and the average by 0.16 °C. Outdoor thermal comfort decreased, with PMV indices decreased by 0.38, slightly more relaxed than the reference model.
Part three:
The maximum decreased by 0.67 °C, the minimum by 0.9 °C, and the average by 0.91 °C compared to the reference model. Outdoor thermal comfort decreased by 0.63 in PMV indices, which are more relaxed than the reference model.
3.6. Scenario Seven (Increase Pavements’ Greenery by up to 60%)
In scenario seven, we increase the pavements’ greenery by up to 60% with 50 cm of grass of average density in all three urban configurations.
All models ran with the reference config file, and the results are compared to their ambient air temperature—
Table 14 shows the ambient air, outdoor thermal comfort, and wind speed distribution maps at 2 p.m.
Part one:
Scenario seven decreased the maximum by 0.26 °C, while increasing the minimum by 0.25 °C and the average by 0.11 °C compared to the reference model. Outdoor thermal comfort decreased by 0.35 in PMV indices, slightly more relaxed than the reference model.
Part two:
Scenario six showed a decrease in the maximum by 0.09 °C, while increasing the minimum by 0.5 °C and the average by 0.16 °C. Outdoor thermal comfort decreased, with PMV indices decreased by 0.38, slightly more relaxed than the reference model.
Part three:
The maximum decreased by 0.85 °C, the minimum by 0.46 °C, and the average by 0.71 °C compared to the reference model. Outdoor thermal comfort decreased by 0.76 in PMV indices, which were more relaxed than the reference model.
3.7. Scenario Eight (Green Roof Application)
Scenario eight is the application of 50 cm grass of average density (refer to
Table 1) on buildings’ rooftops to up to sixty percent of gross roof area. All models’ characteristics remain the same compared to the base case, and the model was rendered with a similar config file.
Table 15 shows the ambient air, outdoor thermal comfort, and wind speed distribution maps at 2 p.m.
Part one:
A heat map study shows that an increase in the green roof area decreased the maximum by 0.06 °C, had no impact on the minimum, and increased the average by 0.03 °C compared to the reference model. Outdoor thermal comfort improved in PMV indices, with a slightly hotter condition than the reference model.
Part two:
Compared to the reference model, the maximum ambient air temperature decreased by 0.8 °C, the minimum by 0.05 °C and the average by 1.47 °C. The PMV value decreased compared to the reference model, and the entire precinct presented a more relaxed condition.
Part three:
The maximum temperature increased by 1.07 °C, the minimum by 0.92 °C, and the average by 0.29 °C compared to the standard. The PMV value presented a slight increase, and the area was predicted to have a hotter condition than the reference model.
General comments:
Part two presents the maximum temperature decreases in scenario eight, by an average of 2.97 °C compared to the reference model. The location of the heat map remains almost like the reference model, mainly along a large asphalt paved road. The wind map presents almost similar behaviour compared to the reference model. This scenario shows that an increase in green roofs hurts the ambient temperature and outdoor thermal comfort value in parts one and three. These two parts mainly consist of low-rise compact types of buildings incompatible with green roofing.
3.8. Scenario Nine (Full Mitigation)
This is the full mitigation scenario which includes the following features:
- -
Application of 50 cm of grass of average density on buildings’ rooftops on up to sixty percent of gross area.
- -
Application of 50 cm of grass of average density on up to sixty percent of pavements.
- -
Increase in buildings’ rooftop albedos from 0.5 to 0.9 by application of high-albedo plaster on the outer layers.
- -
Substitution of the asphalt road surface (albedo = 0.12) with high-albedo asphalt (albedo = 0.36) and the concrete pavement (albedo = 0.3) with high-albedo white concrete (albedo = 0.9).
All models’ characteristics remain the same as with the reference, and the model was rendered with a similar config file.
Table 16 shows the ambient air, outdoor thermal comfort, and wind speed distribution maps at 2 p.m.
Part one:
The heat map shows that scenario nine decreased the maximum by 0.67 °C, had almost no impact on the minimum, and decreased the average by 0.11 °C compared to the reference model. Outdoor thermal comfort increased, with PMV indices increased by 0.22, a slightly hotter condition than the reference model.
Part two:
Compared to the reference model, the maximum ambient air temperature decreased by 0.49 °C and the average by 0.05 °C, while increasing the minimum by 0.2 °C. The PMV value increased compared to the reference model by 0.18, and the entire precinct presented a slightly hotter condition.
Part three:
The maximum decreased by 1.35 °C, the minimum by 0.75 °C, and the average by 1.26 °C compared to the reference model. PMV value presented a slight increase by 0.22, and the area was predicted to have a hotter condition than the reference model.
4. Discussion
The outcomes of the mitigation scenarios summarised in
Table 1, simulated using ENVI-Met software in parts one, two, and three. The actual findings of ambient temperature fluctuations measured at 2 p.m. at the height of 3 m above the ground are presented in this section.
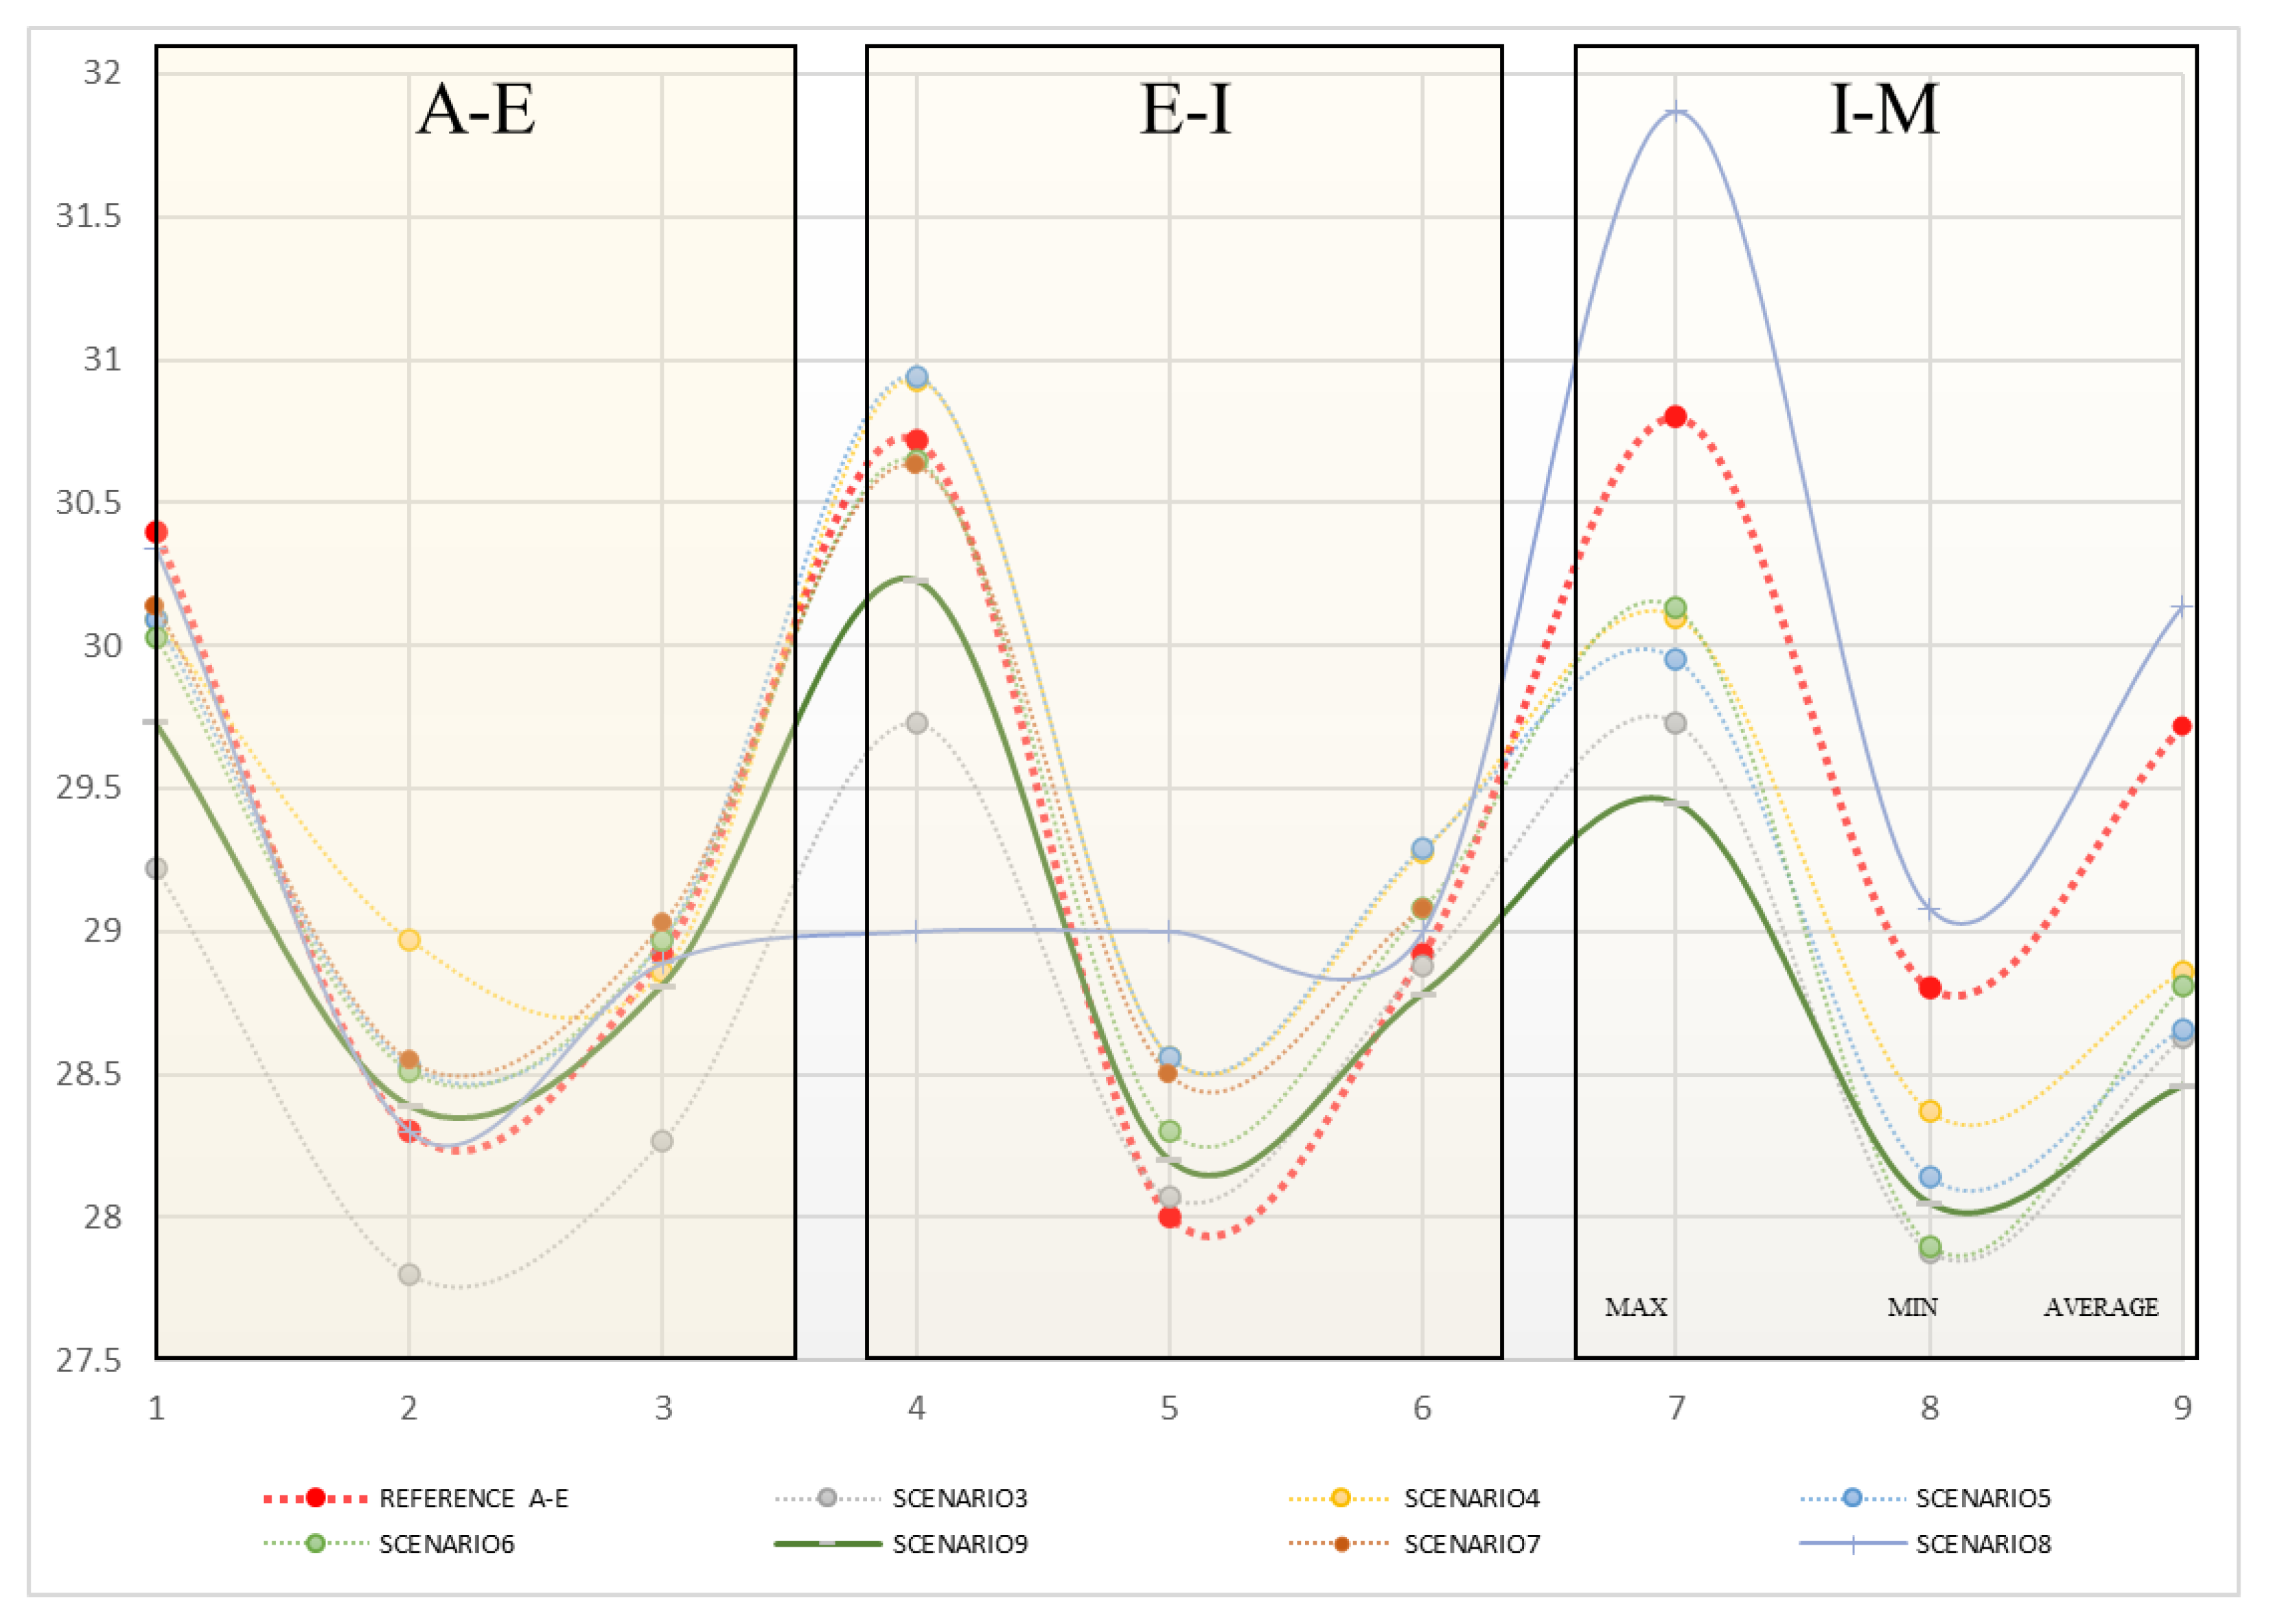
The red dotted line presents the ambient air temperature value in the base case, and the solid green line shows the values for the full mitigation scenario.
As summarised in
Figure 2, in the base case scenario, the maximum temperature recorded at 2 p.m. on a typical summer day varies between 28 °C and 30.8 °C, with an average ambient temperature close to 29 °C.
The general trend of the data shows that the mitigation strategies decline the maximum ambient temperature by up to 1.18 °C while declining the minimum by up to 0.65 °C. This indicates that the mitigation strategies benefitted the maximum ambient temperature rather than the minimum.
Interestingly the heat island location remains almost the same as the base case model in all scenarios.
Figure 6 indicates a summary of results in the main three parts.
Overall, the simulations showed that the possible mitigation technologies might contribute to a decrease in the peak ambient temperature of up to 4.1 °C
As the graph shows, it is predicted that applying high-albedo material on the street and pavements on up to 60% of the floor area would cause a large area around low-rise compact-type buildings on the A–E axis to have a minimum of 27.7 °C. In all mitigation scenarios, this record is almost 0.6 °C lower than the base case at 2 p.m. at 3 m above the ground level.
On the other hand, an asphalt paved area surrounded by low-rise compact configurations presents a maximum of 31.8 °C on the I–M axis when we increase the buildings’ rooftop greenery in scenario eight. Scenario eight (an increase in the green roof value up to 60%) presented the least-compatible heat mitigation scenario. Part three showed a higher ambient temperature value than the base case scenario.
This is the maximum ambient air temperature record at 2 p.m. on the pedestrian level in all mitigation strategies, almost 1 °C higher than the base case.
This shows that greenery on the buildings’ rooftops harms the heat island effect. In our opinion, there are two concurrent reasons for this result. Firstly, the results were highly affected by the specific typology of building selection. We simulated a combination of low-rise to high-rise buildings, in which the relative cooling benefits of high-rise buildings’ green roofs on the pedestrian level are limited. The second factor is the influence on the cooling potential of greenery by Sydney’s climate, with a high relative humidity that affects this strategy’s evaporative cooling potential.
Moreover, the study shows a mitigation strategy with a cooling potential close to 4.1 °C in temperature over this precinct.
The average ambient temperature varies between 28.27 °C in A–E when we apply light-colour material with an albedo of 0.9 on the road and pavements in scenario three and 30.14 °C in I–M when we improve the roof greenery to up to 60% of the roof area.
This means that there is a 1.87 °C temperature difference in average ambient air temperature over this study due to the implementation of heat island mitigating strategies.
Scenario nine (the full mitigation scenario) presents the maximum cooling potential among all scenarios in this study. A combination of mitigation scenarios shows a maximum cooling potential of 1.35 °C on the I–M axis.
It is essential to highlight that simulating scenarios involving different mitigation technologies can help in understanding the relative benefits of each technology.
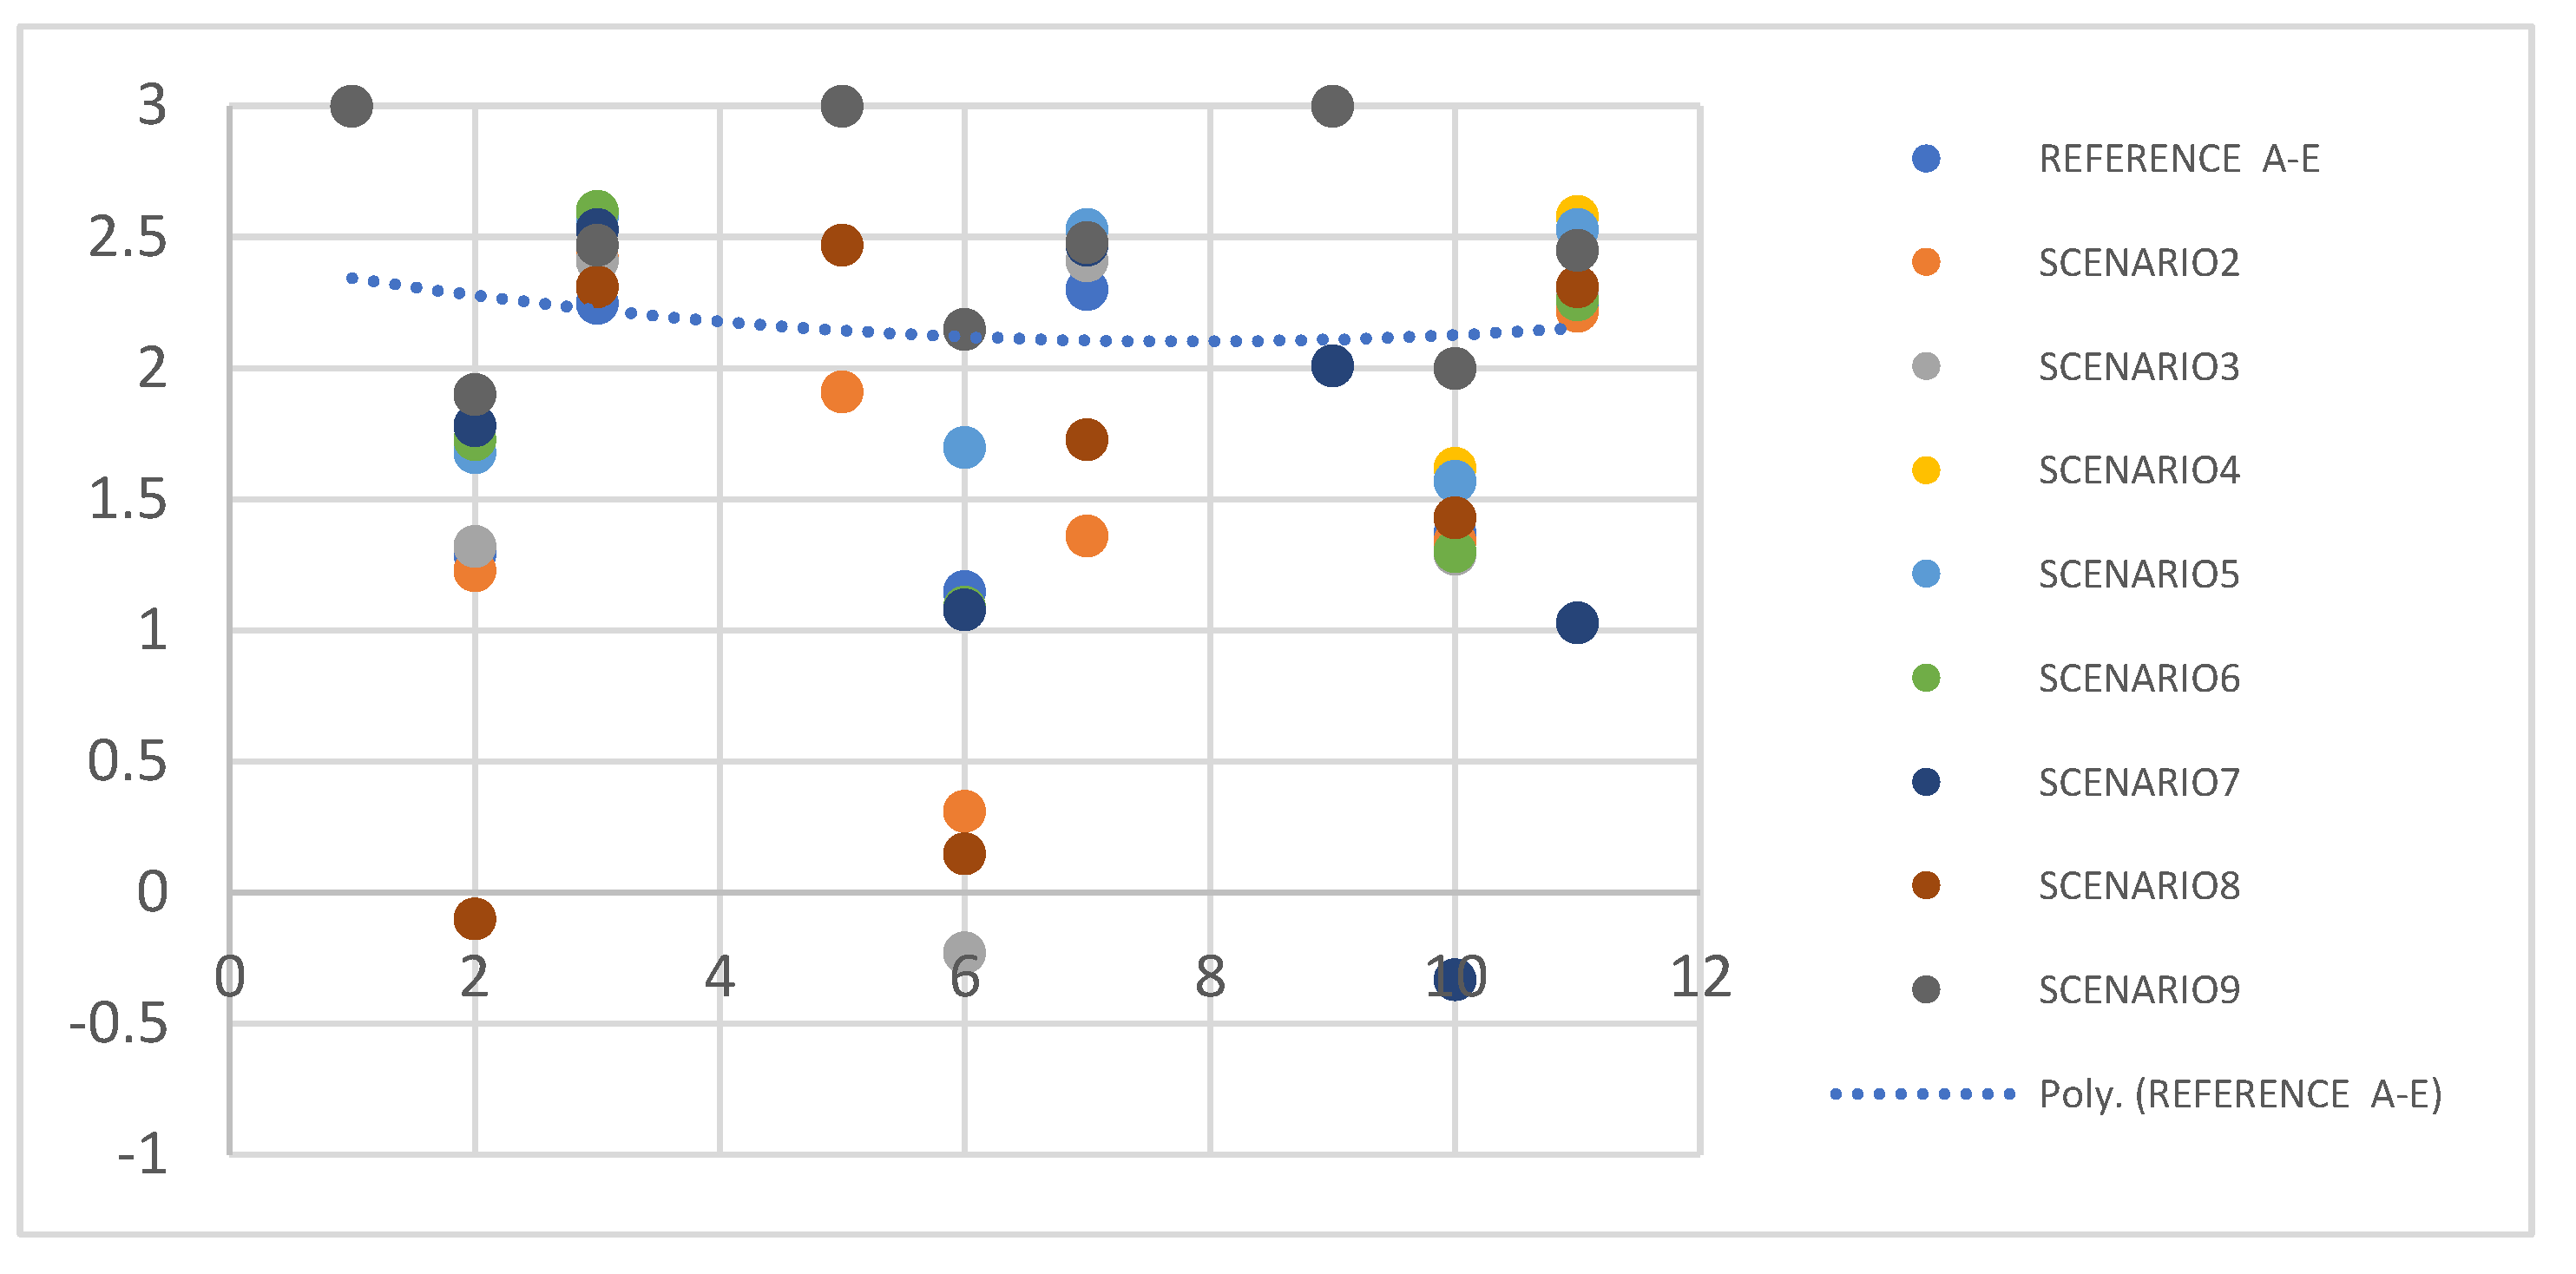
Analysis of the PMV value:
The analysis of outdoor thermal comfort based on PMV indices is summarised in
Table 1, simulated employing ENVI-Met software in parts one, two, and three, and presented in
Figure 7.
This section explains the findings of PMV fluctuations measured at 2 p.m. at 3 m above ground height.
The PMV value varies between a minimum of −0.33 in scenario seven in large layout areas and 3 in most cases.
The general trends of the data suggest that when mitigation strategies are used, the PMV indices moderately drop in most scenarios. However, a large portion of the layout is predicted to experience hot and very hot conditions with an average PMV value close to 2.3 during the heat wave periods.
Scenarios nine and three, associated with increased-albedo materials on the road and pavement, present an almost higher outdoor thermal comfort value than the base case model. Despite their excellent performance in cooling potential, we assume that a high reflection rate on the pedestrian level increases the PMV value.


