Article

Performance Evaluation of Reinforced Concrete Columns under Simultaneously Combined Fire and Cyclic Loads

1
State Key Laboratory of Disaster Reduction in Civil Engineering, Tongji University, Shanghai 200092, China
2
College of Civil Engineering, Tongji University, Shanghai 200092, China
*
Author to whom correspondence should be addressed.
Buildings 2022, 12(7), 1062; https://doi.org/10.3390/buildings12071062
Submission received: 18 June 2022 / Revised: 6 July 2022 / Accepted: 18 July 2022 / Published: 21 July 2022
(This article belongs to the Special Issue Improvement Technology on Building Seismic Toughness)

Abstract

:
Reinforced concrete (RC) structures could suffer from the combined action of fires, earthquakes, and other loads during their life cycle; more importantly, coupled disasters lead to further deterioration and damage to structural performance. This paper investigated the multiple performances and distinguished the safe working conditions of the RC column subjected to simultaneously combined fire and cyclic loads. The numerical model considered the degradation of the mechanical properties of steel and concrete and the bond-slip performance between steel and concrete at high temperatures. The results show that the performance of RC columns with different section sizes, longitudinal reinforcement ratios, cover thicknesses, axial load ratios, and cyclic loads differs greatly under simultaneously combined fire-cyclic loads. In specific, when the cyclic load application time is less than 2 h, the cyclic load has little effect on the response of the RC column. According to the different characteristics of RC columns when subjected to combined fire-cyclic loads, the firing process of RC columns is divided into four stages. To avoid the excessive performance degradation of RC columns, the minimum designed fire resistance time of RC columns is recommended to be 2.5 times the fire resistance time of the RC column under static loads.

1. Introduction

Reinforced concrete (RC) structures may suffer fire, earthquake [1,2,3,4], or dynamic loads during the life cycle. In case of fire, the mechanical properties of steel bars and concrete, which are the constituent materials of the RC structure, will degrade [5,6,7], the concrete may burst at high temperatures [8,9,10], and serious redistribution of internal forces will occur in the structures, resulting in a significant decline in the bearing capacity of RC structures [11,12,13]. It is common for earthquakes/dynamic loads to occur simultaneously or sequentially with fires, such as the Loma Prieta earthquake in 1989 [14], the Northridge earthquake in 1994 [15], and the Kobe earthquake in 1995 [16]. Aftershocks may occur during the continuous fire process. Under the condition of coupling of these disasters, the deformation, bearing capacity, and damage mechanism of RC structures are more complicated, which will cause more damage to RC structures than one disaster alone (fire, earthquake, and other dynamic loads). RC components are the important parts of the structure, and the combined action of fire and earthquake/dynamic loads will lead to aggravated performance degradation of components, which will lead to the partial and overall collapse of the structure. Therefore, studying the performance of RC components under the combined action of fire and dynamic loads has great engineering significance and can provide a reference for the design of engineering structures under the combined action of fire and earthquake/dynamic loads.
At present, research on the performance of RC components under the combined action of fire and earthquake/dynamic loads mainly focuses on post-earthquake fires (PEFs) or post-fire earthquakes (PFEs). For example, Shah et al. [17] proposed that non-ductile plates and shells of RC frames are prone to brittle failure in PEF, while RC frames with ductile design have good lateral resistance before and after a fire. Wen et al. [18] indicated that the concrete spalling width has a greater influence on the deformation of the seismically damaged RC column when it is exposed to fire, while the spalling length has less of an effect. Wang et al. [19] presented that the lateral resistance, effective stiffness, and ductility of RC columns decreased under PEF. Ni et al. [20] pointed out the fire would reduce the bearing capacity and stiffness of RC walls. Wang et al. [21] showed that the load level of beams and columns has little effect on the residual bearing capacity of the joint, but the load level has a significant effect on the ductility of the joint, and the ductility coefficient can more truly reflect the response of the joint after the fire than the limit displacement. Liu et al. [22] proposed that the failure mode of RC frame joints changed from plastic hinge failure at ambient temperature to shear failure in the joint area after the fire. Lu et al. [23] found that except for the core area failure of the plane nodes after exposure to fire, the rest of the nodes were all beam end bending failures. Jin et al. [24] simulated the seismic performance of 3D mesoscale RC columns after exposure to fire and proposed that axial compression ratios in the range of 0.2 to 0.6 are beneficial for improving the lateral force resistance and initial stiffness of RC short columns, but have a negative impact on ductility. Demir et al. [25] reported that the time after exposure to fire had a limited influence on the residual lateral resistance and ductility of the column. Han et al. [26] proposed that factors such as the fire exposure time, cross-sectional size, slenderness ratio, and concrete strength have significant effects on the residual strength of steel-tube RC columns after exposure to fire.
In short, most of the existing studies are on the performance of RC structures or components under exposure to fire and earthquake/dynamic load successively, but there are few reports on the simultaneous fire and earthquake/dynamic load, which could be the dominant design condition for the RC columns. The RC column is an important vertical load member of the structure, and its static bearing capacity and deformation capacity are significantly reduced during fire exposure [27,28,29,30,31,32]. The empirical model of Shah et al. [31] showed that tie spacing, confinement of columns, and axial load ratio have a marked influence on the fire resistance of the RC column. When the RC column is subjected to axial dynamic loads (such as vertical seismic motion or vertical mechanical vibration [33,34,35]) during fire exposure, the performance of the RC column will further deteriorate. Therefore, it is necessary to study the performance of RC columns under axial cyclic loads and exposure to fire which can provide a reference for the design of RC structures under the combined action of fire and dynamics.
In this paper, the RC column subjected to the simultaneously combined fire and cyclic loads is taken as the research object. Firstly, the nonlinear bond-slip constitutive of the connector element is used for simulating the nonlinear bond-slip behavior between the steel bar and the concrete, and the effectiveness of the numerical simulation method was verified by comparing the deformation and damage. Secondly, the effects of amplitudes and the number of cycles of cyclic loads on the axial deformation, stiffness, and fire resistance time of RC columns were analyzed. Finally, the specific cyclic characteristics (amplitude and number of cycles) were selected as the basic cyclic loads, and the effect of cyclic loads on the response of RC columns with different column characteristics (section size, cover thickness, longitudinal reinforcement ratio, tie spacing, and axial load ratio) were analyzed.

2. Description of Models and Verification of Numerical Method

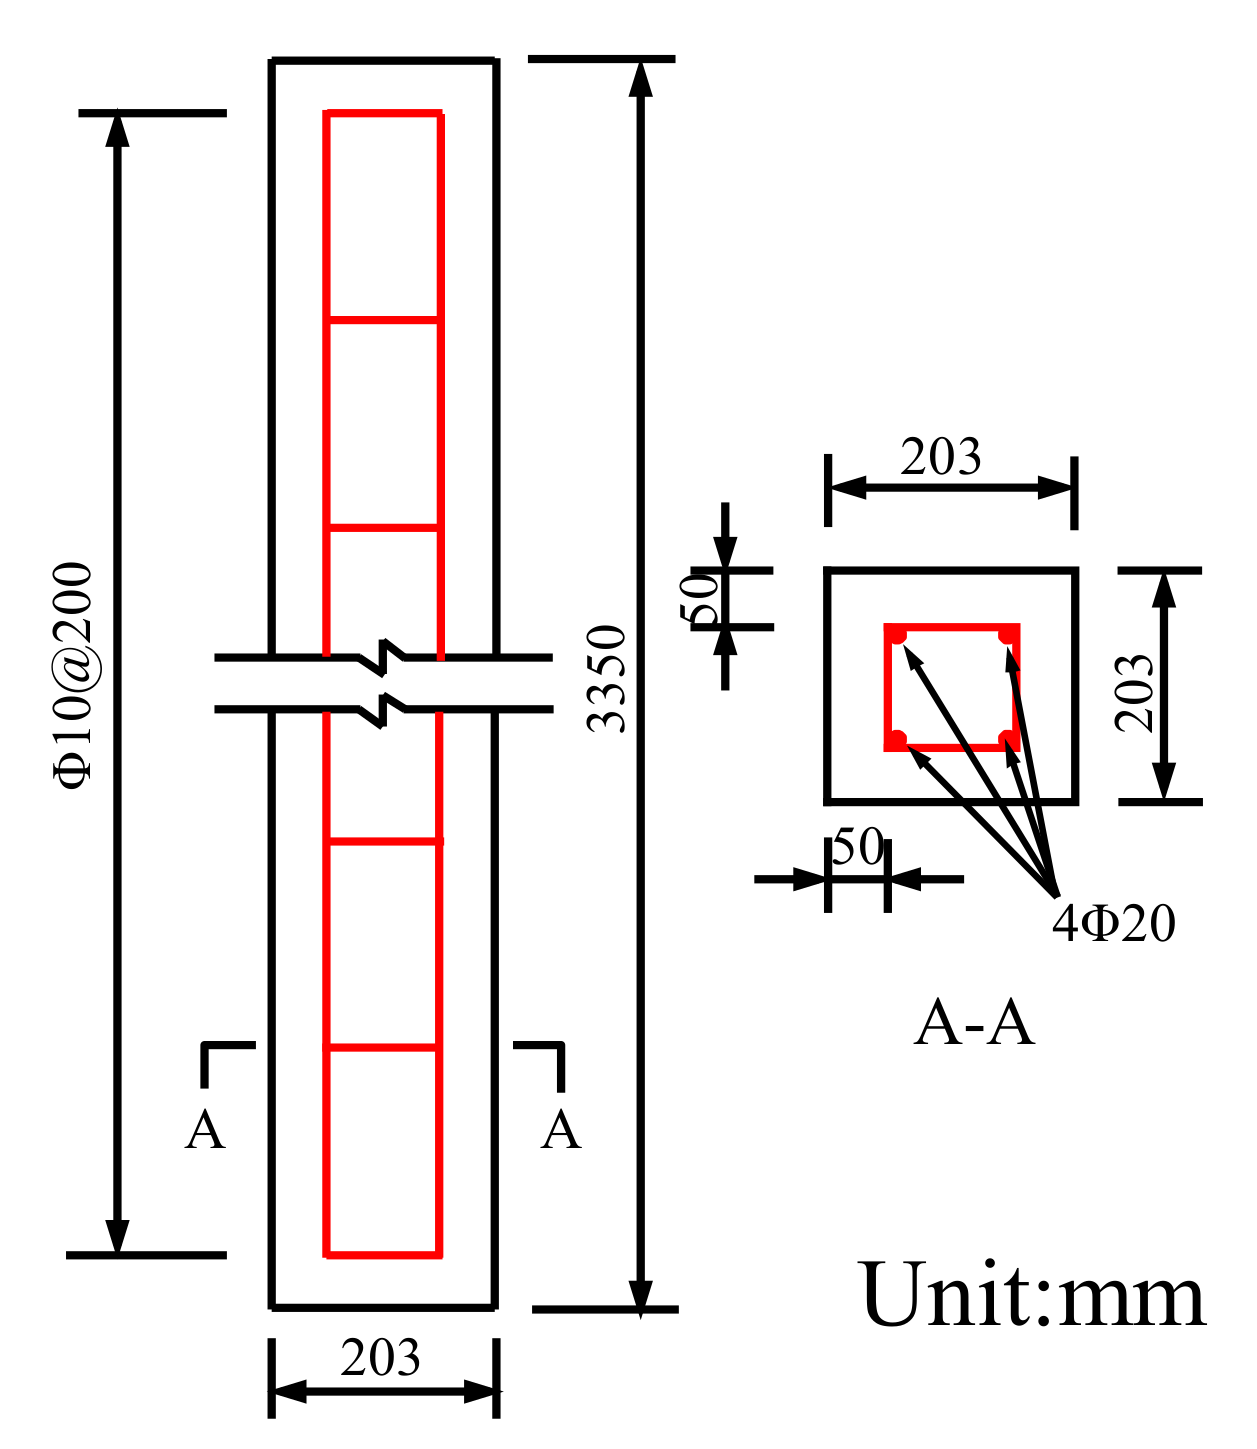
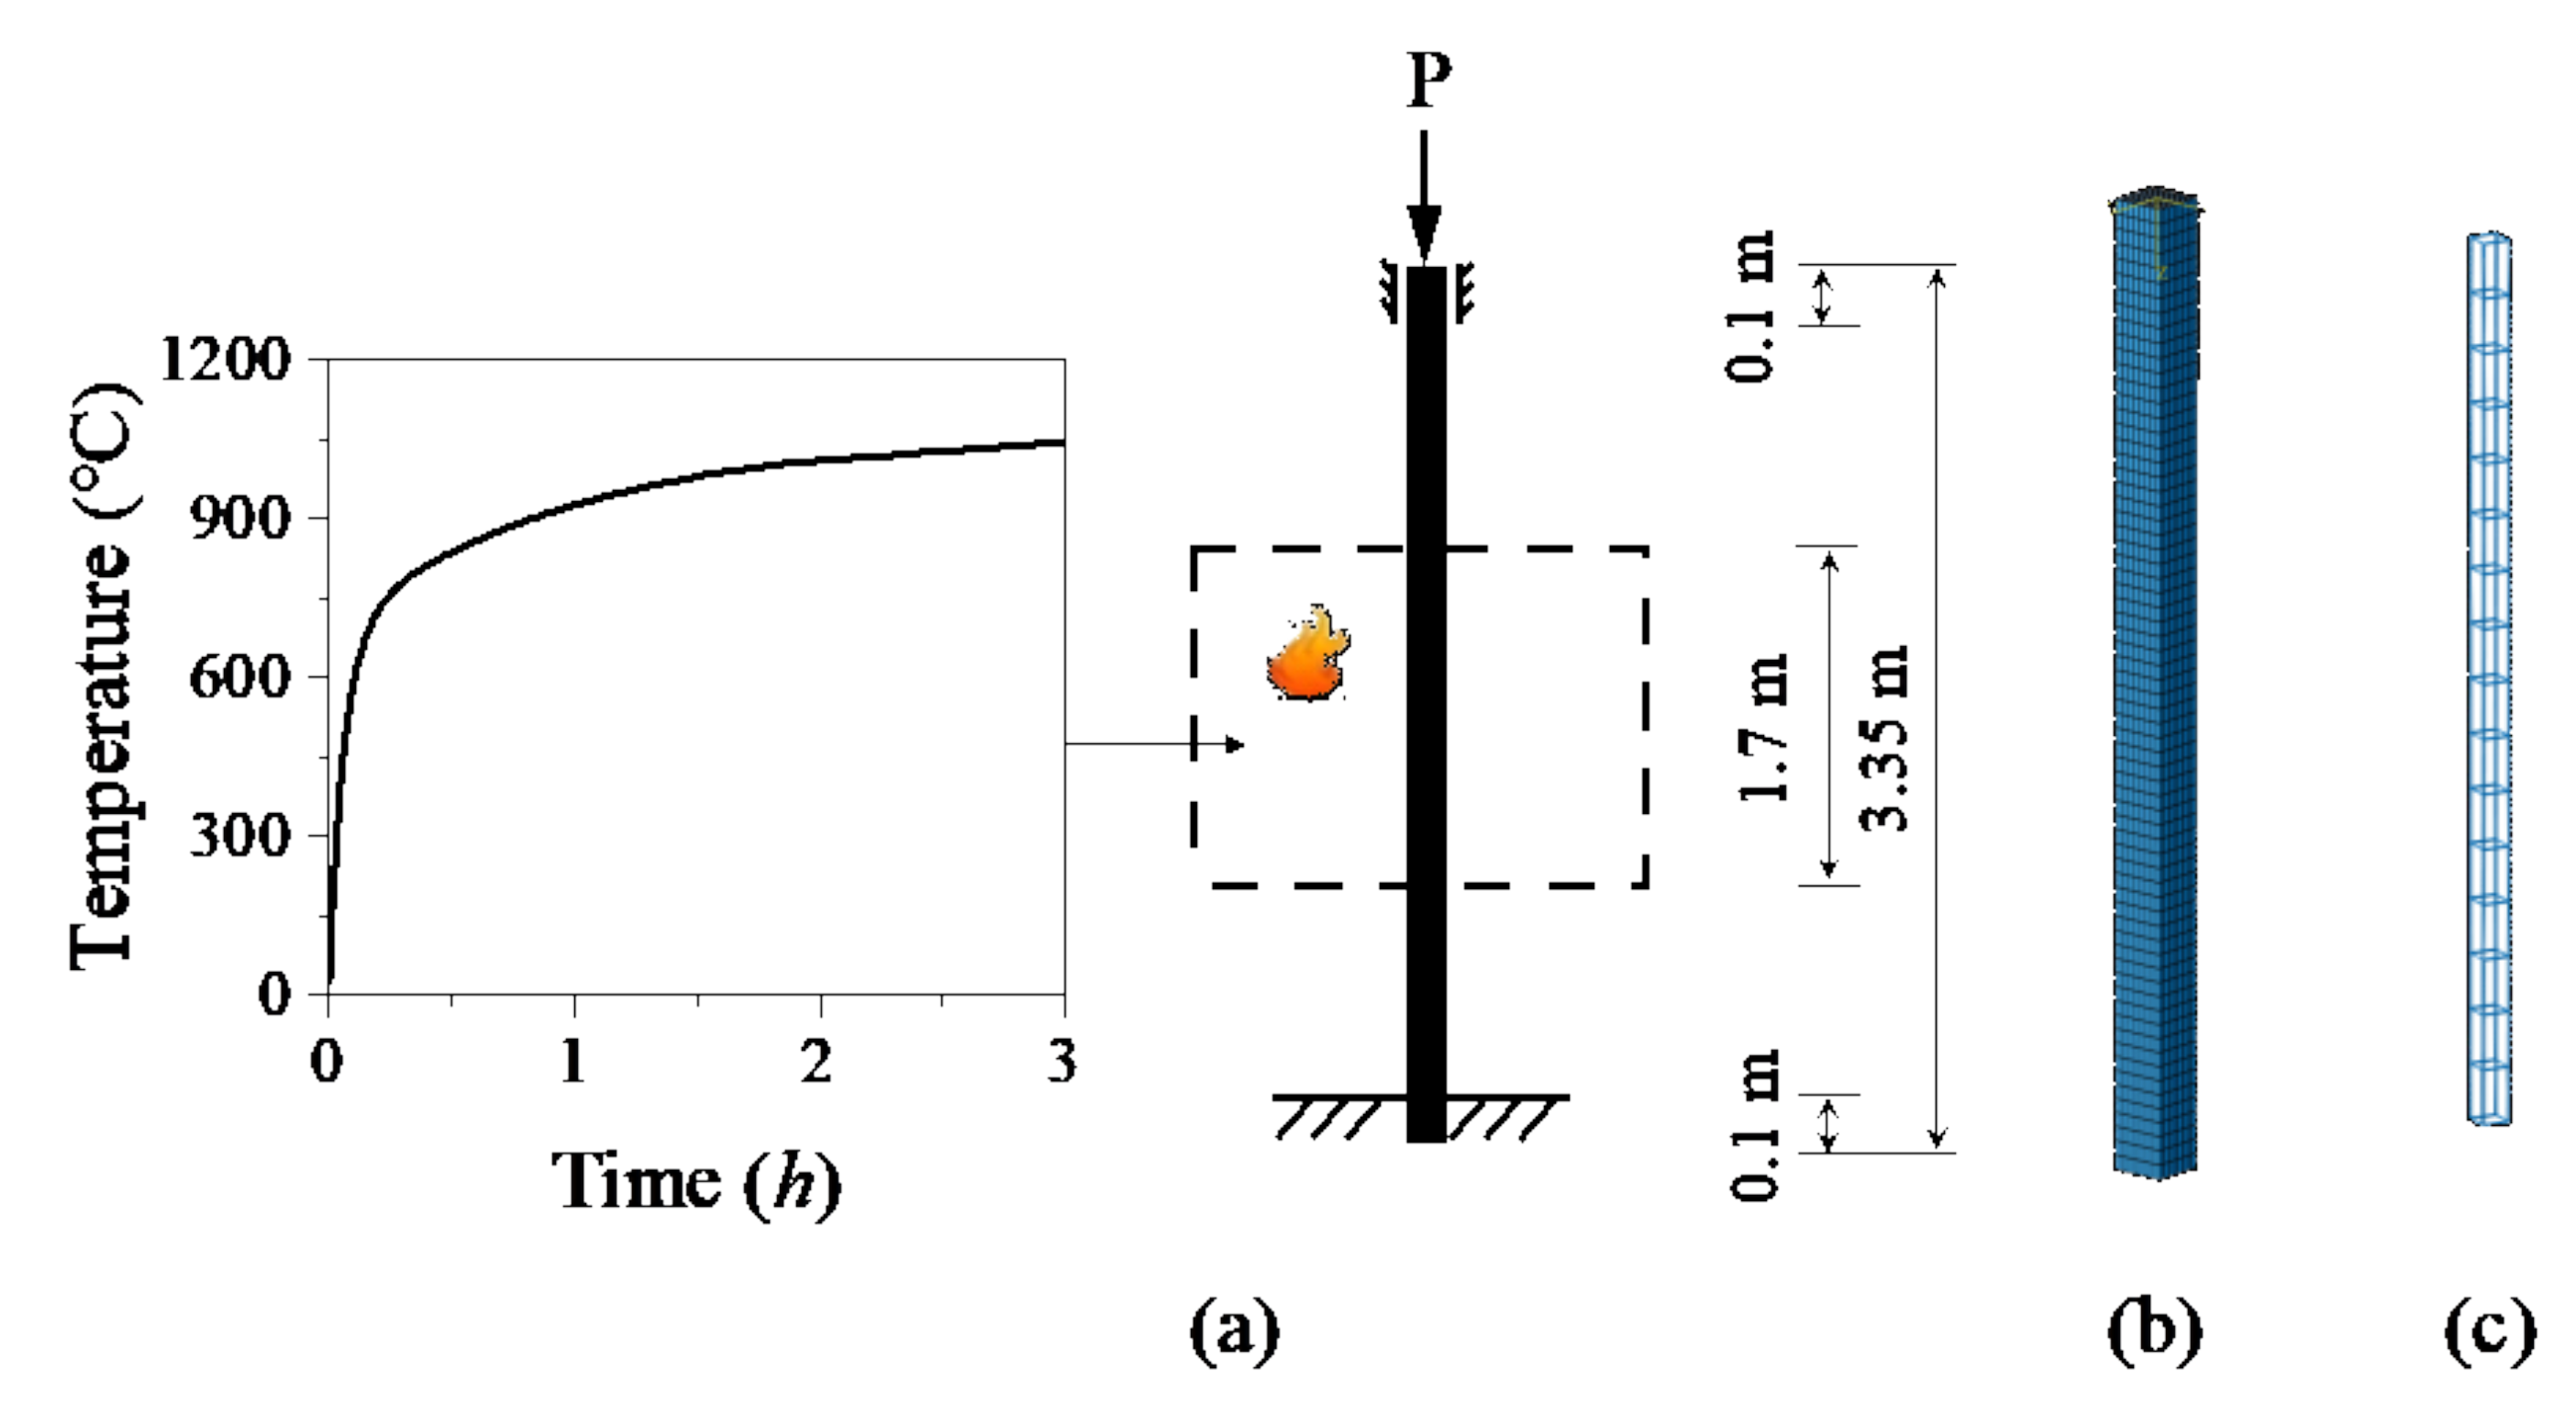
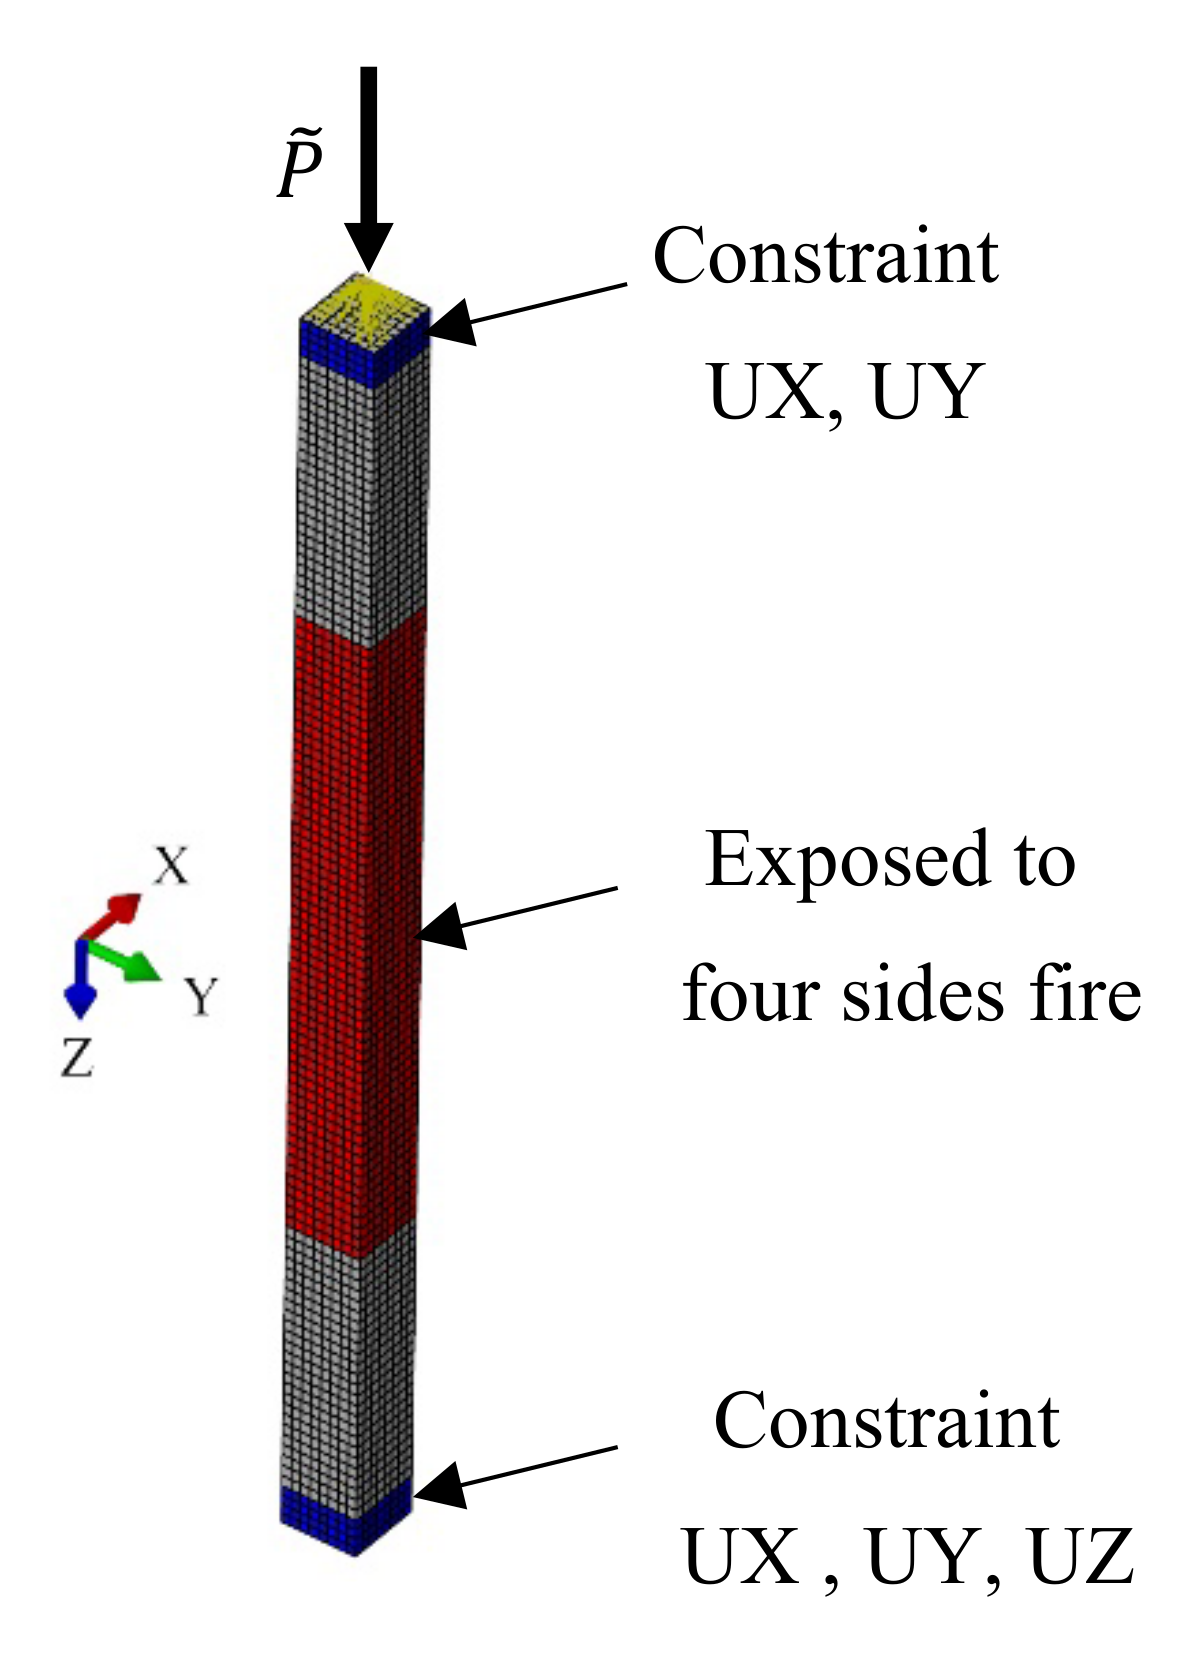
2.1. Description of Column

Raut and Kodur [36] conducted a fire resistance test on several RC columns, and this paper takes the test specimen NSC1 as the basic research object. NSC1 is 3350 mm long with a cross-section of 203 mm × 203 mm and 50 mm cover thickness. NSC1 has four Φ20-mm longitudinal reinforcements and a Φ10-mm stirrup with 200 mm spacing. Figure 1 shows the elevation and cross-section details of the NSC1. The top of NSC1 is under a concentric load with an axial compression ratio of 0.4. The boundary conditions are shown in Figure 2a, the bottom 100 mm range of the column is fixed displacement in all directions, and the top 100 mm range of the column is fixed displacement except axial displacement. The middle 1.7 m of the column height is exposed to a four-sided fire. The heating curve is shown in Figure 2a and the ambient temperature is 25 °C.
Due to physicochemical properties changes and microstructural degradation of reinforcing steel and concrete during fire exposure [37,38], concrete and reinforcing steel have different mechanical properties and thermophysical properties at elevated temperatures. Therefore, this paper adopts the thermophysical parameters (Section 2.2) and mechanical parameters (Section 2.3) of reinforcing steel and concrete at elevated temperatures. The temperature field calculation needs to consider the actual thermal boundary conditions to set the corresponding heat transfer calculation parameters (Section 2.4).
In this paper, ABAQUS is used for the thermal-mechanical coupling calculation of RC column at high temperatures, in which the concrete was modeled by eight-node thermally coupled brick with trilinear displacement and temperature element (C3D8T) with an approximately uniform size of 25 mm × 25 mm × 50 mm, and the reinforcing steel is simulated by two-node 3-D thermally coupled truss elements (T3D2T) with a size of 25 mm. The RC column mesh and reinforcement details are shown in Figure 2b,c, respectively.
Figure 1. The evolution and cross-section and reinforcing details of NSC1.
Buildings 12 01062 g001
Figure 2. Numerical model details: (a) boundary conditions and temperature rise curve; (b) concrete mesh; and (c) reinforcing steel details.
Buildings 12 01062 g002

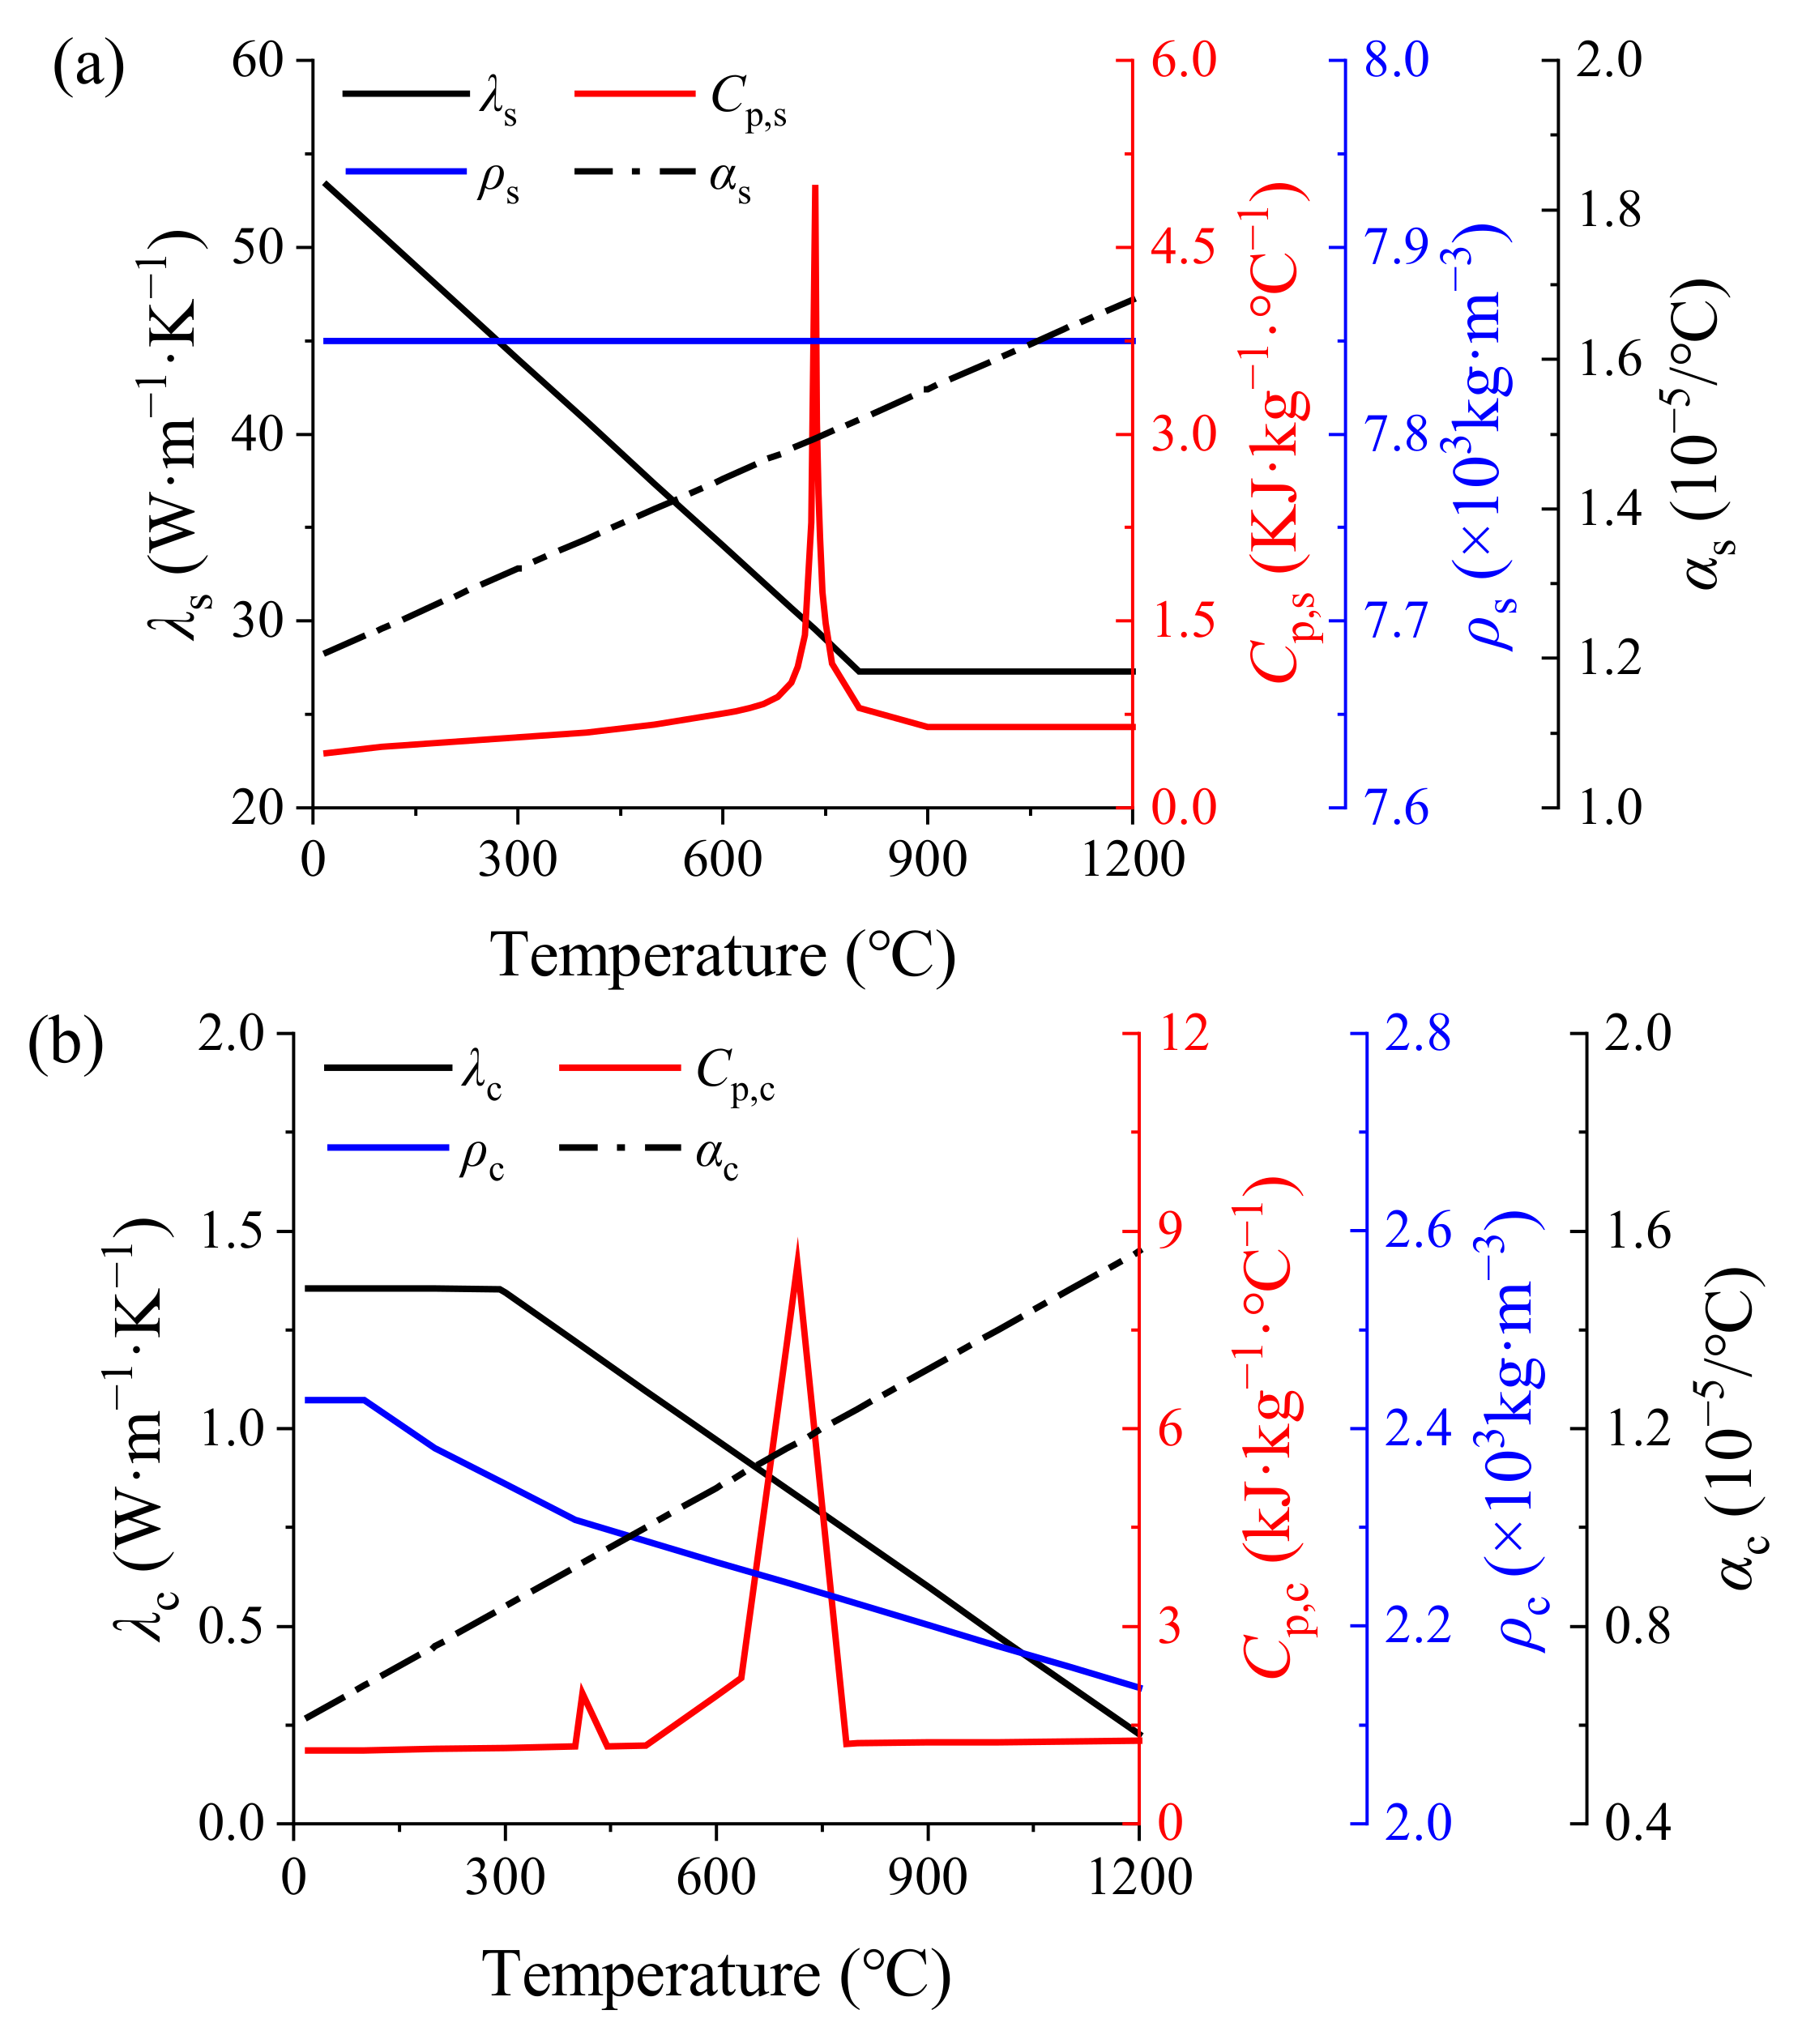
2.2. Thermophysical Parameters

Because the density of the reinforcing steel can be considered to be independent of the temperatures [39], the value ρ s = 7850   k g / m 3 is taken. The specific heat capacity C p , s and thermal conductivity λ s of reinforcing steel at high temperatures refer to EN 1994-1-2:2005 [39], and the thermal expansion coefficient α s follows the suggested formula values by Lie [40]. Thermophysical parameters of steel are shown in Figure 3a.
The density ρ c of concrete at high temperatures is taken according to EN1992-1-2:2004 [41], and the specific heat capacity C p , c , thermal conductivity λ c , and thermal expansion coefficient α c are taken according to the recommended values of Lie [40]. All the thermophysical parameters of concrete are shown in Figure 3b.
Figure 3. Thermophysical parameters of (a) reinforcement steel and (b) concrete.
Buildings 12 01062 g003

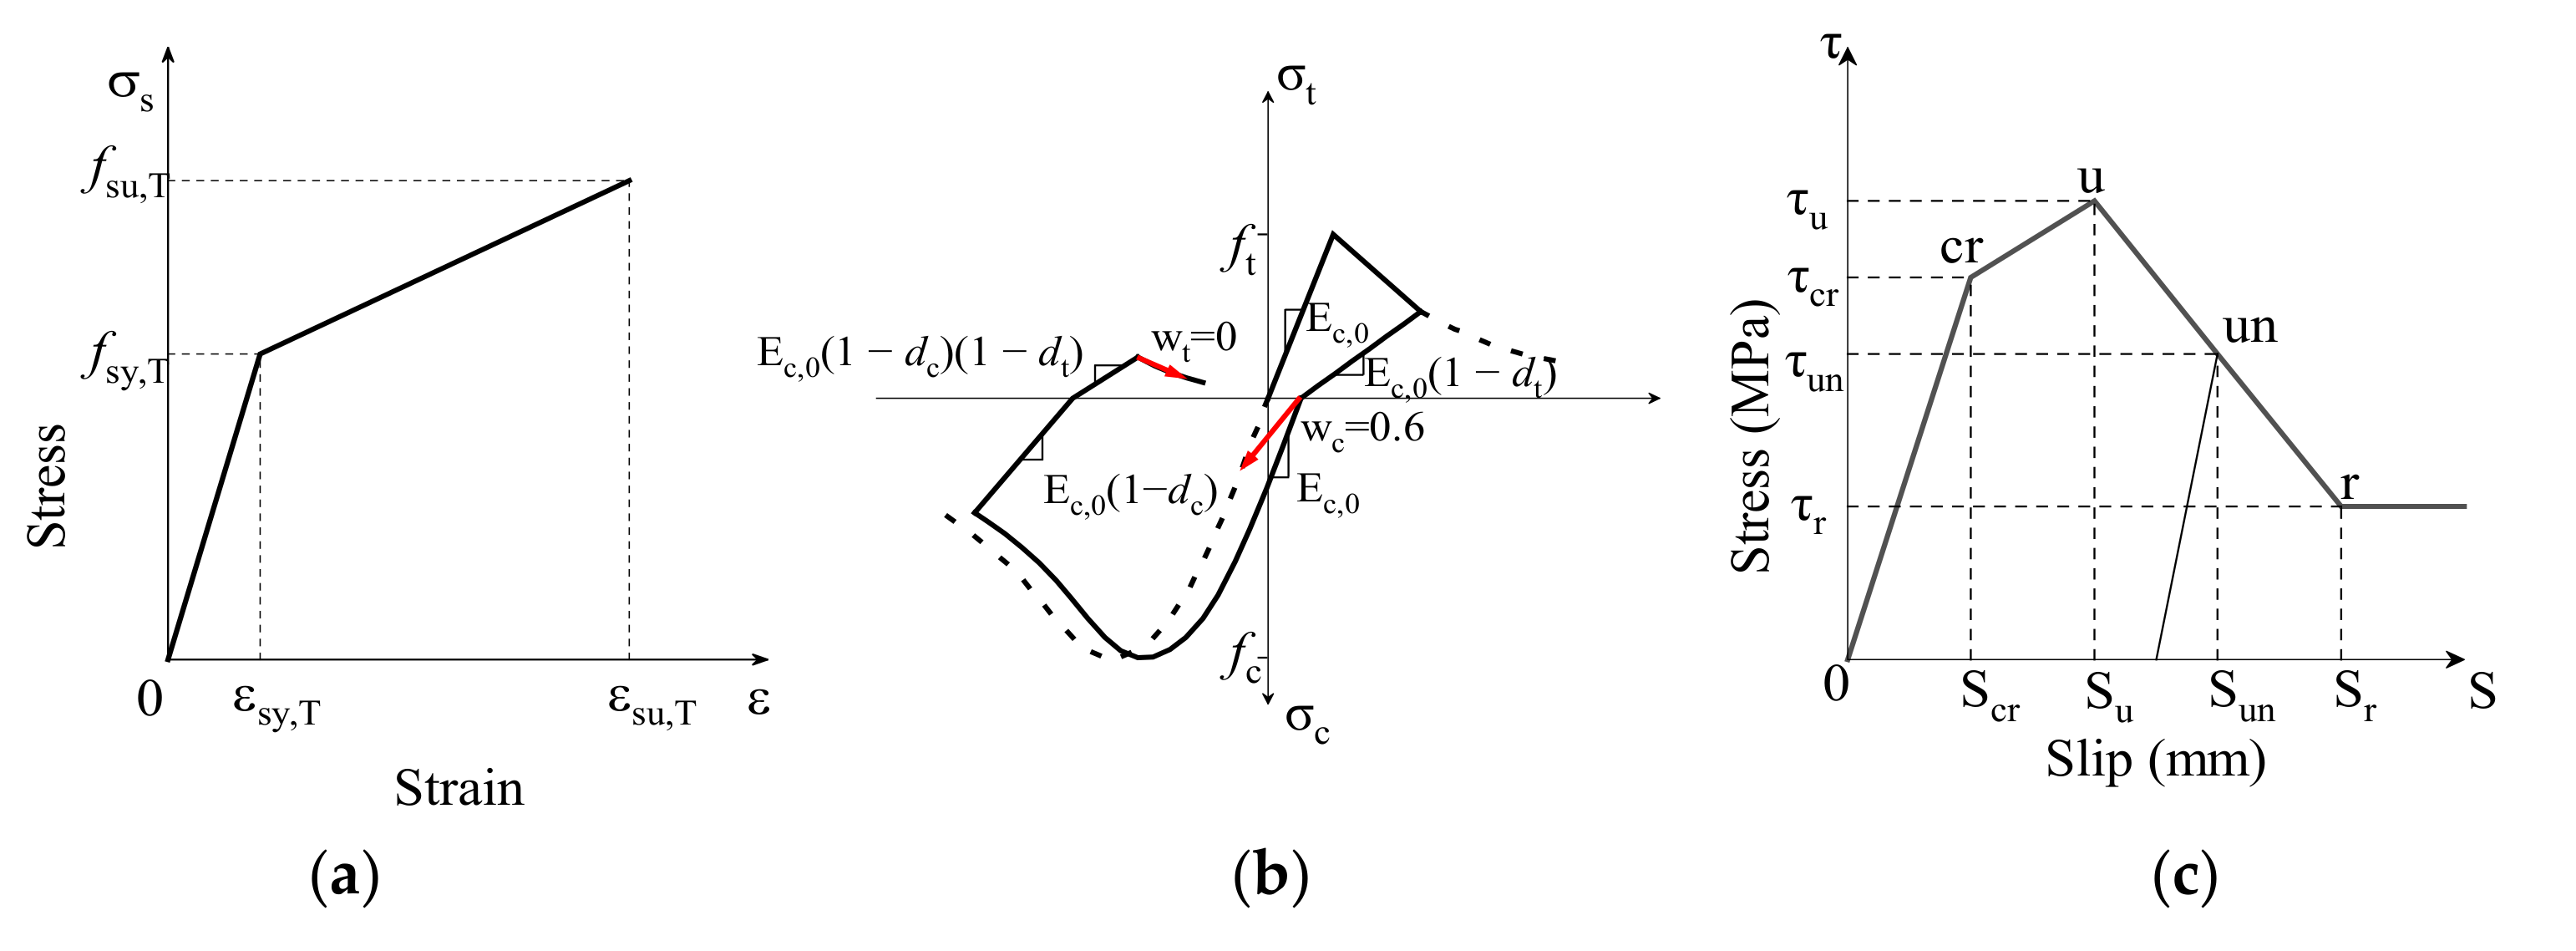
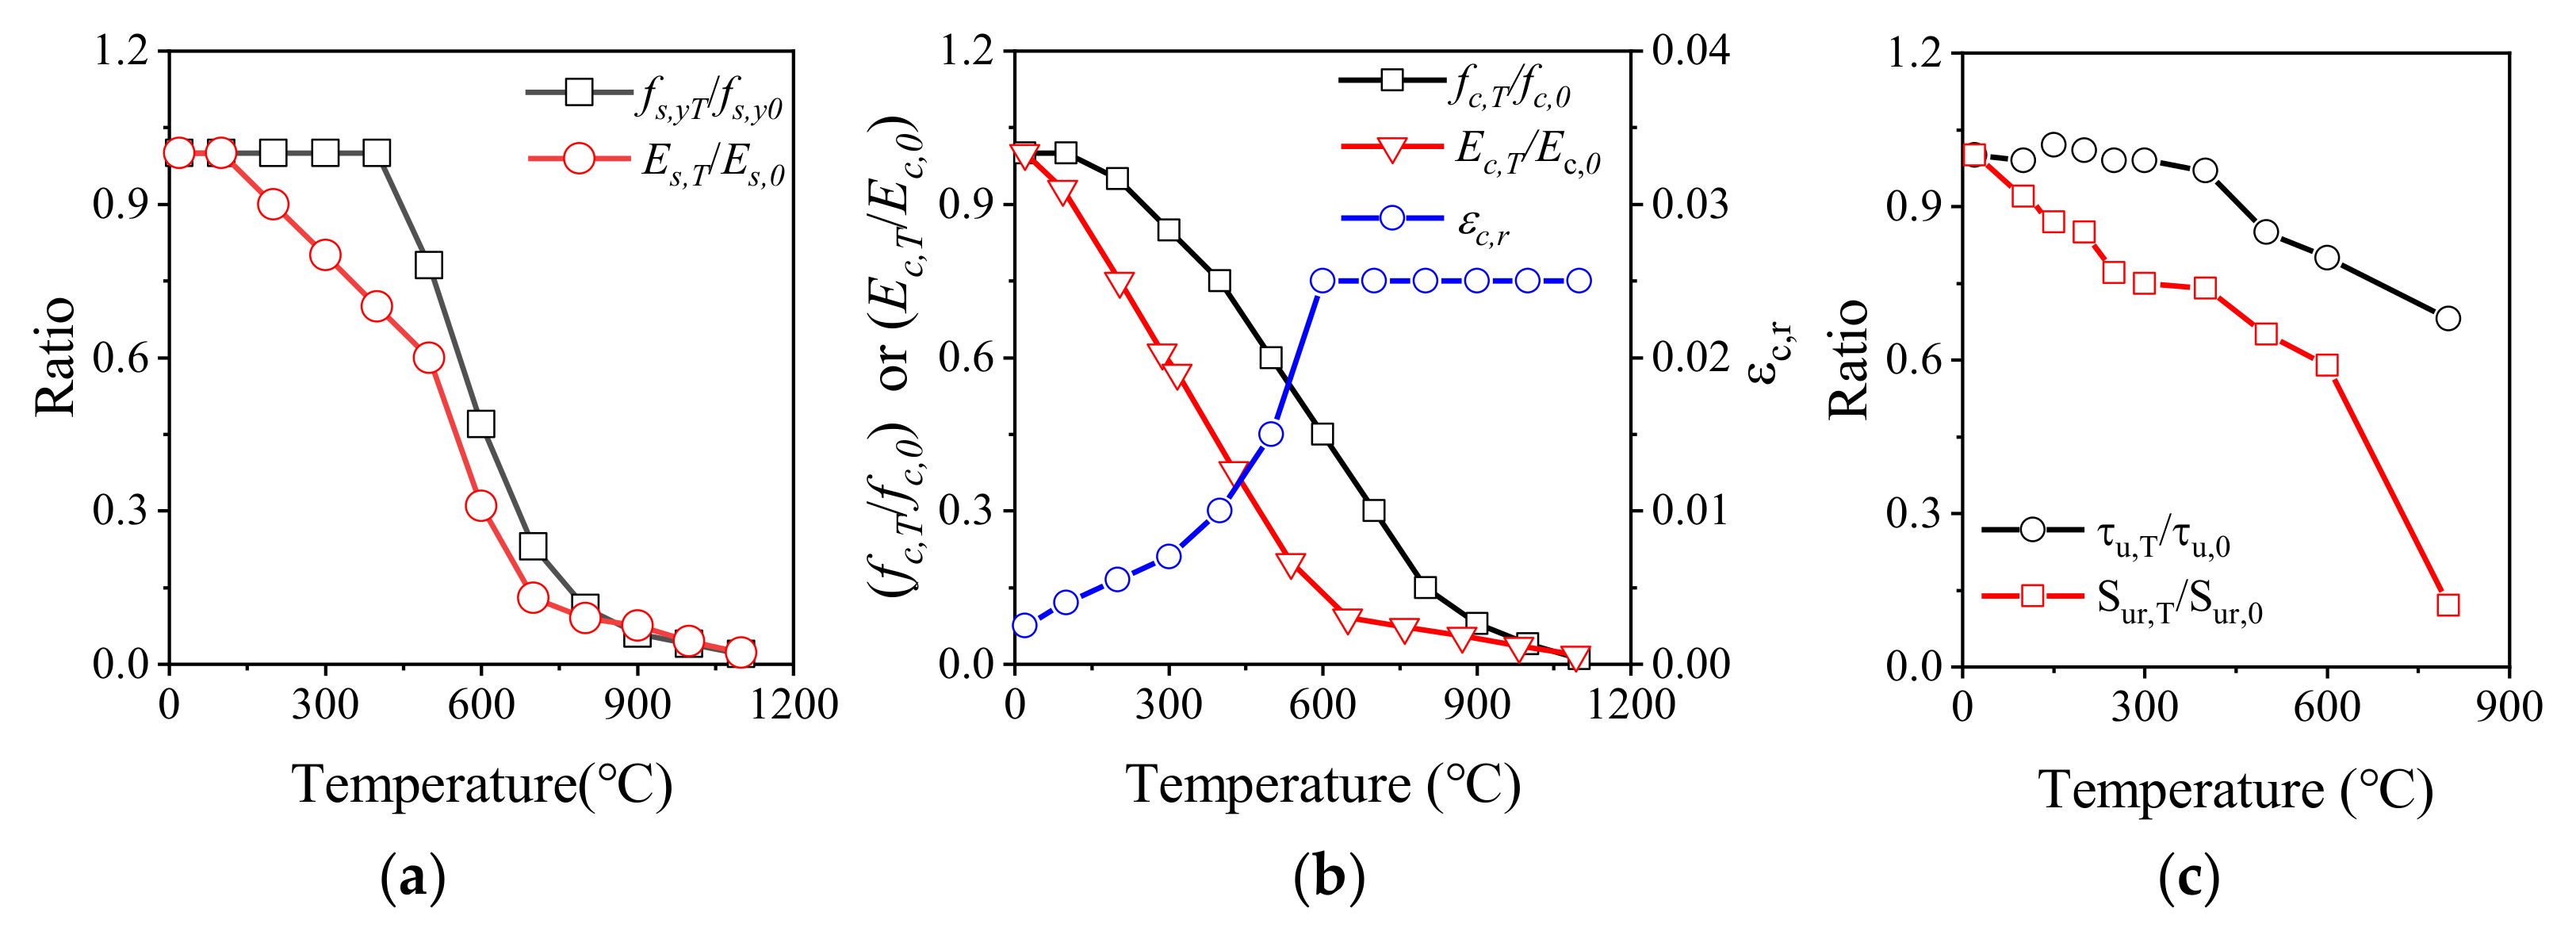
2.3. Constitutive Model and Mechanical Parameters

The elastic, linear hardening model is used for the reinforcing steel. Figure 4a shows the stress-strain curve of reinforcement at elevated temperatures, where f s y , T , f s y , T , ε s y , T , and ε s u , T are the yield strength, ultimate strength, yield strain, and ultimate strain at elevated temperatures, and the ratio of ultimate strength to yield strength is assumed to be constant at elevated temperatures. Young’s modulus E s , T   and yield strength f s y , T decline gradually with temperature increases, and the corresponding attenuation parameters are selected according to the recommendations of EN1994-1-2:2005 [39], as shown in Figure 5a, where E s , 0 is Young’s modulus at ambient temperature. The yield strength, ultimate strength, ultimate strain, and the Poisson’s ratio of both longitudinal reinforcement and stirrups at ambient temperature are 450 MPa, 705 MPa, 0.17, and 0.3, respectively.
The concrete adopts the plastic-damage model [42,43] which is widely used for describing the dynamic behavior of concrete, and the constitutive curve based on GB50010-2010 [44] is depicted in Figure 4b. The compressive strength f c , 0 , tensile strength f t , 0 , Young’s modulus E c , T , and Poisson’s ratio of the concrete at ambient temperature are 51 MPa, 3.5 MPa, 32.5 GPa, and 0.2, respectively. The degradations of the mechanical properties are shown in Figure 5b, where the degradation of the compressive strength f c , T and the peak strain ε c r , T   are selected according to EN1992-1-2:2004 [41], whereas the deterioration of Young’s modulus E c , T is taken from AISC-360-10 [45]. The ratio of the peak tensile strain to the compressive peak strain and the ratio of the tensile strength to the compressive strength at elevated temperatures are constant.
The bond-slip behavior [46] between the reinforcing steel and the concrete is simulated by adding the connector element between the reinforcing steel node and the concrete node and giving the connector element nonlinear bond-slip constitutive properties. To simplify the calculation, the connector is only subjected to axial force, i.e., the slip between the reinforcement and the concrete is assumed to be along the axial direction of the reinforcement.
The bond-slip constitutive which references GB50010-2010 [44] is shown in Figure 4c, where c r , u , u n , and r represent the cracking point, the peak point, the unloading point, and the residual point, respectively. Figure 5c shows the peak bond stress and the peak slip at elevated temperatures according to the test of Özkal [47], and τ u , 0 , τ u , T , S u , 0 , and S u , T are the bond strength at ambient temperature, the bond strength at elevated temperatures, the peak slip at ambient temperature and the peak slip at elevated temperatures, respectively. Table 1 shows the values of bond-slip parameters at ambient temperature, where d is the diameter of the reinforcing steel, and f t , T is the tensile strength of the concrete.
Table 1. Bond stress-slip constitutive of concrete and reinforcing steel at ambient temperature.
Feature PointCrack Point (cr)Peak Point (u)Residual Point (r)
Bond stress (N/mm2) 2.5   f t , T 3   f t , T f t , T
Slip (mm) 0.025   d 0.04     d 0.55     d
Figure 4. Constitutive models of (a) reinforcing steel (b) concrete and (c) bond strength-slip.
Buildings 12 01062 g004
Figure 5. Degradation of mechanical performance of (a) reinforcing steel (b) concrete and (c) bond-slip at high temperature.
Buildings 12 01062 g005

2.4. Equation and Calculation Parameter of Heat Transfer

The heat transfer inside the reinforced concrete during fire exposure can be calculated according to the Fourier heat transfer theory, and the heat exchange between the surface of the concrete and the outside occurs through heat convection and heat radiation [48]. Convective heat transfer heat flux density q c h , radiant heat transfer heat flux density q r h , and composite heat transfer heat flux density q h are defined as Equations (1)–(3). The internal heat conduction equation of the RC column is calculated according to Equation (4).
q c h = h c h T w h T f h
q r h = ε h C b T w h 4 T a m 4
q h = q c h + q r h
ρ c T t = x λ T x + y λ T y + z λ T z
where T w h is the surface temperature of the wall, T f h is the temperature of the thermal fluid (this parameter is the input temperature curve in ABAQUS), and T a m is the ambient temperature. According to EN1992-1-2:2004 [41], the convective heat transfer coefficient h c h is 25   W / m 2 · K for the fire-exposed surface and 9 W/(m2·K) for the unexposed surface. The emissivity ε h is 0.7 and 0 for fire exposed surface and unexposed surface, respectively. The Stefan-Boltzmann constant C b is 5.67 × 10⁻⁸  W / m 2 · K 4 . In Equation (4), ρ , c , λ , T , and t are the density, specific heat compacity, thermal conductivity, temperature, and time, respectively.

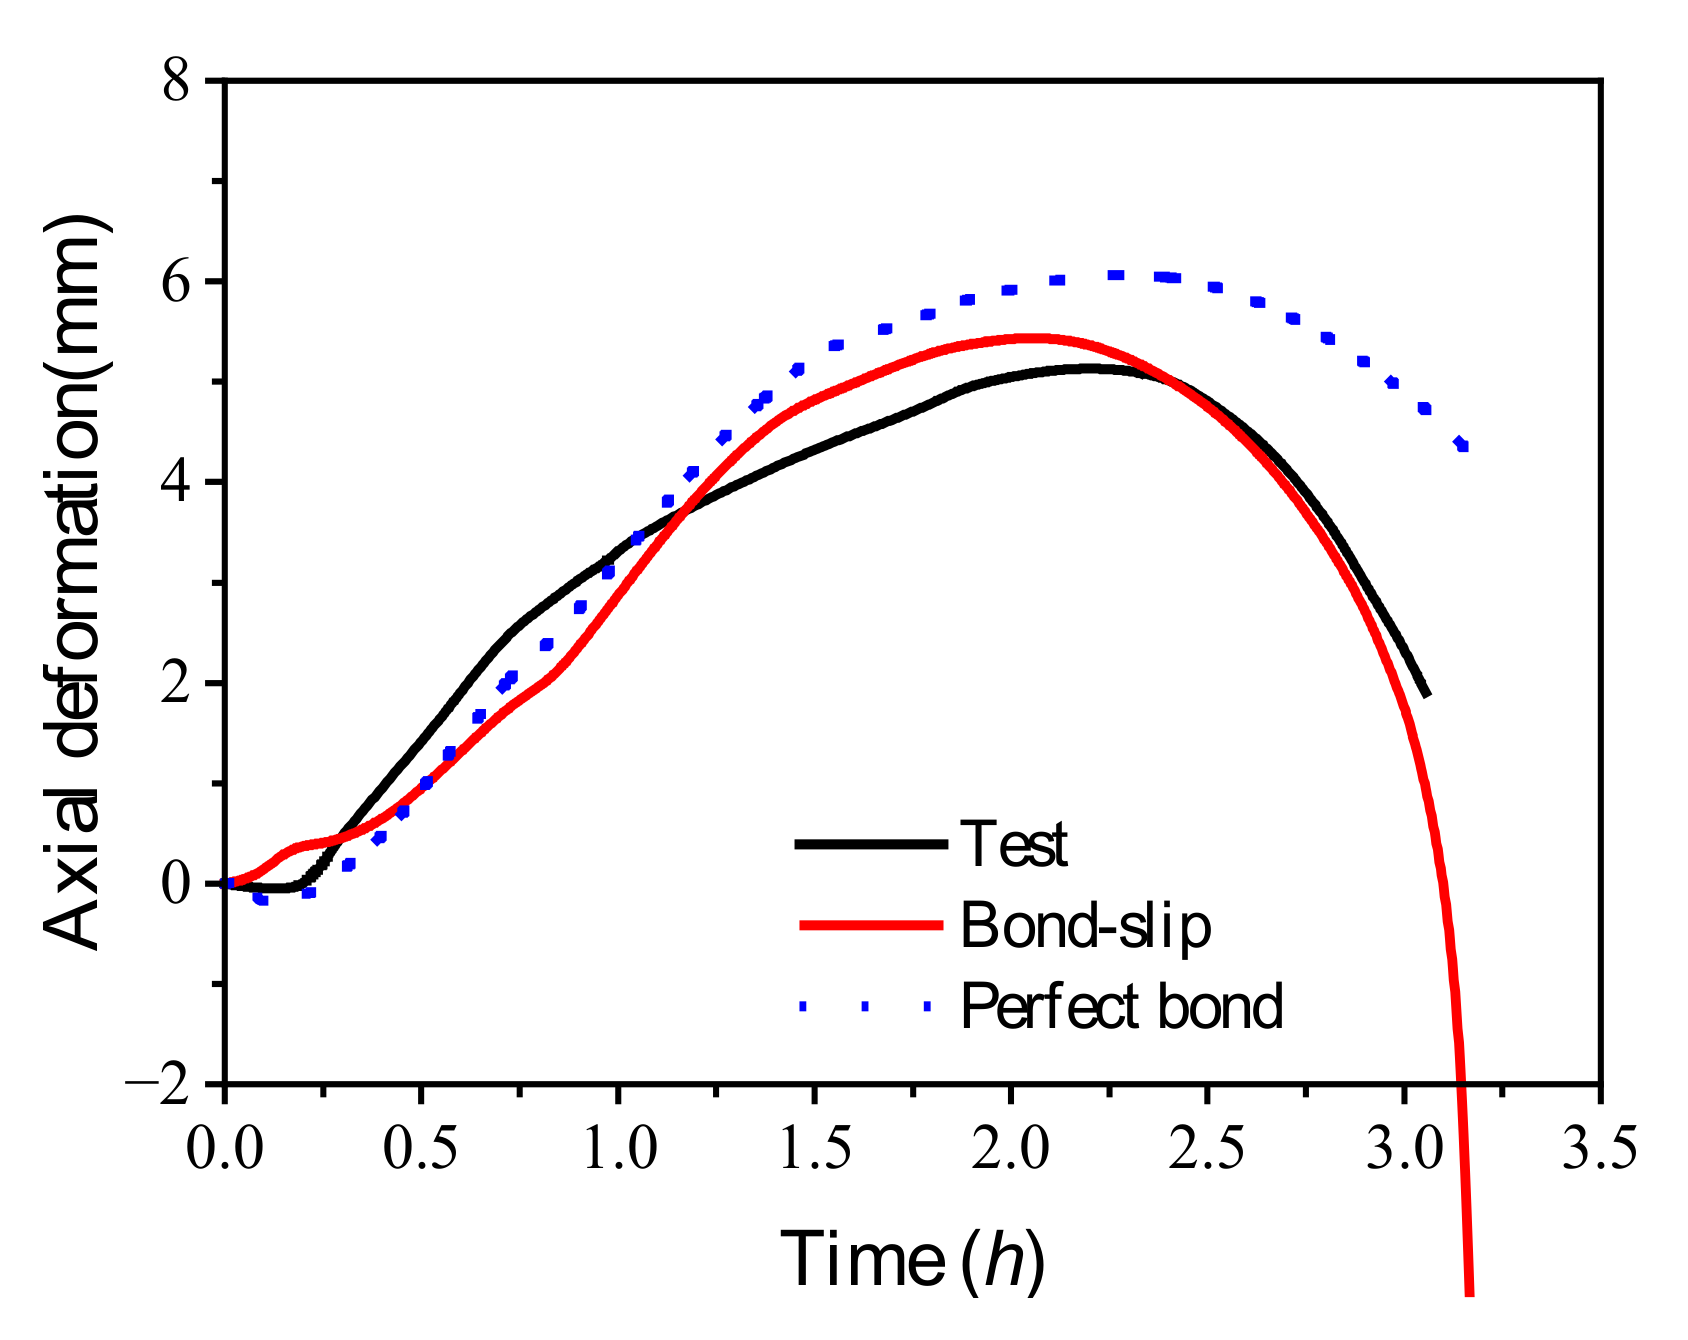
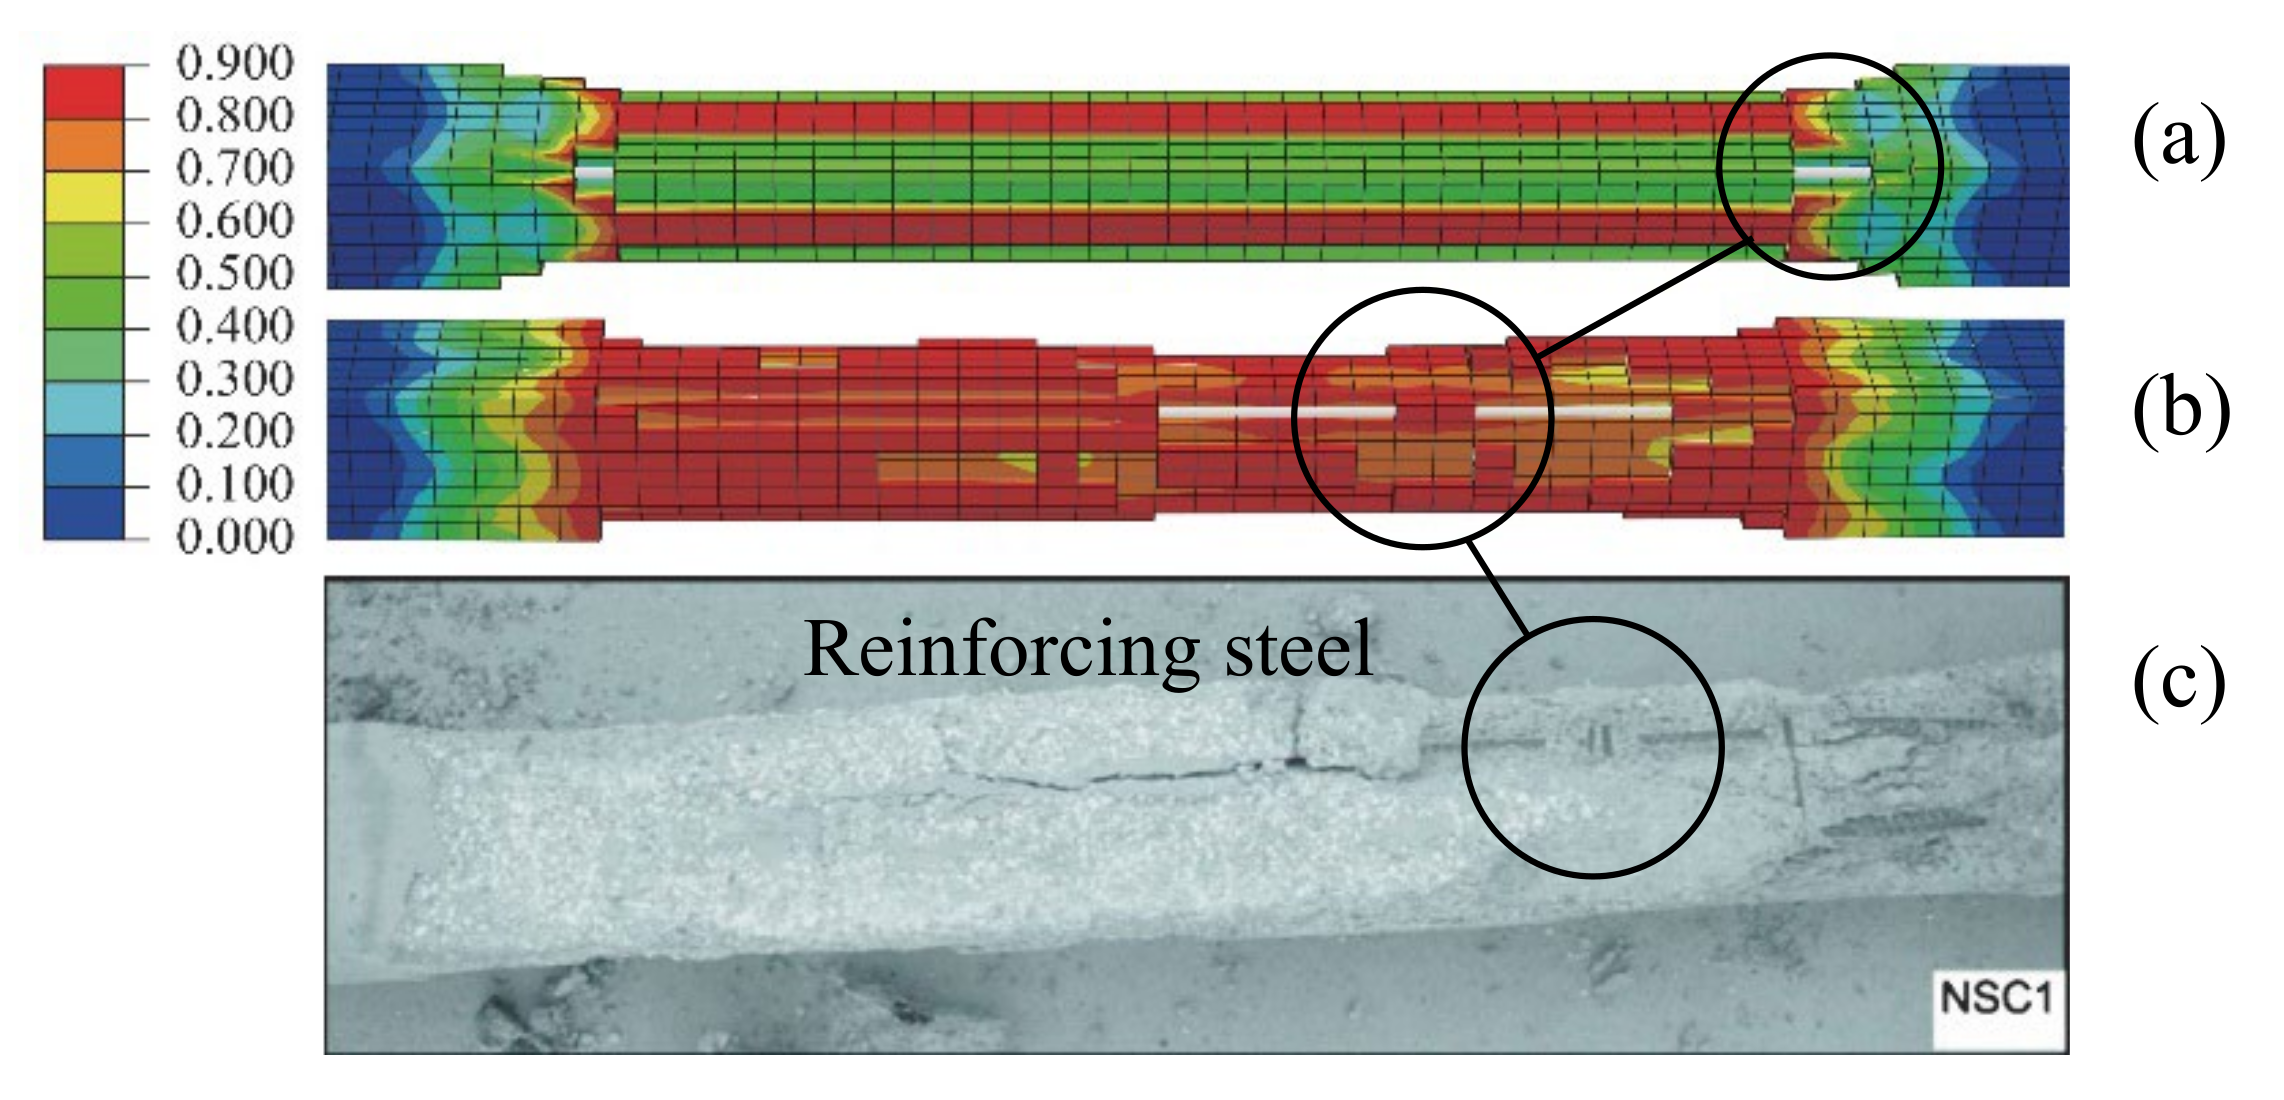
2.5. Verification of Models

The mesh size selection is comprehensively considered through parametric analysis. Table 2 shows the peak deformation, fire resistance time, calculation time ratio, and connector generation of RC columns with different mesh sizes. The approximate mesh size of 25 mm × 25 mm × 50 mm shows a medium error of the peak deformation, lowest error of the fire resistance time, and lower calculation time ratio than other mesh sizes. Additionally, the approximate mesh size of 25 mm × 25 mm × 50 mm can easily generate the connector, so it is suitable for numerical simulation.
Axial deformation and damage of RC columns under fire exposure were used to compare the test results (Test) with the numerical simulation results (Perfect bond means that the reinforcement and concrete showed a perfect bond with no slip between them, whereas Bond-slip means that nonlinear bond-slip behavior between the reinforcement and concrete were considered) to verify the validity of the numerical model.
Figure 6 compares the axial deformation-time curve of the numerical simulation with the test. It can be found that the peak value and the descending value of the bond-slip are closer to the test value than the value of the perfect bond, but the value of the perfect bond is closer to the test value than the value of the bond-slip at the early stage of fire exposure. To quantitatively evaluate the simulation quality of the test, the error analysis is used between the simulated value y s and the experimental value y e , and Mean Absolute Percentage Error ( M A P E ) and coefficient of determination R 2 are selected as evaluation indexes [49], where:
M A P E = 100 % n i = 1 n y e y s y e
R 2 = 1 i = 1 n y s y e ¯ 2 i = 1 n y e y e ¯ 2
Figure 6. The comparison of the axial deformation-time curve of numerical simulation and test.
Buildings 12 01062 g006
Through the error analysis comparing the numerical simulation results and the test values (due to the deformation of 0~0.25, h is an excessive relative error of the test value near 0 mm, so this part of the error is not considered, and the error analysis calculation starts after 0.25 h ), it is found that the M A P E of the perfect bond is 34.94% while it is 14.42% of the bond-slip, and the coefficients of determination R 2 of the perfect bond and bond-slip are 0.923 and 0.987, respectively. The above results show that the bond-slip can better reflect the axial deformation of the RC column during fire exposure.
To compare the damage of the test and numerical model, the quality of the numerical simulation is determined by the volume loss ratio and the morphology. In the literature [36], the fire duration was 3.05 h , and the volume loss ratio was 15%. In the numerical model, this paper defines the percentage of the element volume with damage greater than 0.9 as the volume loss ratio. Figure 7 shows the numerically simulated damage diagram with the element of damage factor greater than 0.9 removed and damage after the test. The volume loss ratio of the perfect bond and bond-slip are 6.46 and 14.77%, respectively. Comparing the morphology of the perfect bond and bond-slip with the test, the damage morphology of the bond-slip can better reflect the damage of the test.
To sum up, the bond-slip model can better reflect the axial deformation during fire exposure and damage morphology of RC columns after exposure to fire. On this basis, the axial deformation, stiffness, and fire resistance time of RC columns subjected to cyclic loads during fire exposure can be studied.

3. Performance Evaluation of RC Column Subject to Various Cyclic Loads and Fire

In this section, the response of RC columns under different cyclic loads and exposure to fire are investigated. The deformation, stiffness, and fire resistance time of RC columns are quantitatively analyzed by axial deformation, cyclic load effect coefficient, stiffness degradation ratio, and fire resistance time ratio. Firstly, the response of RC columns subjected to fire and cyclic loads of different amplitudes are studied.

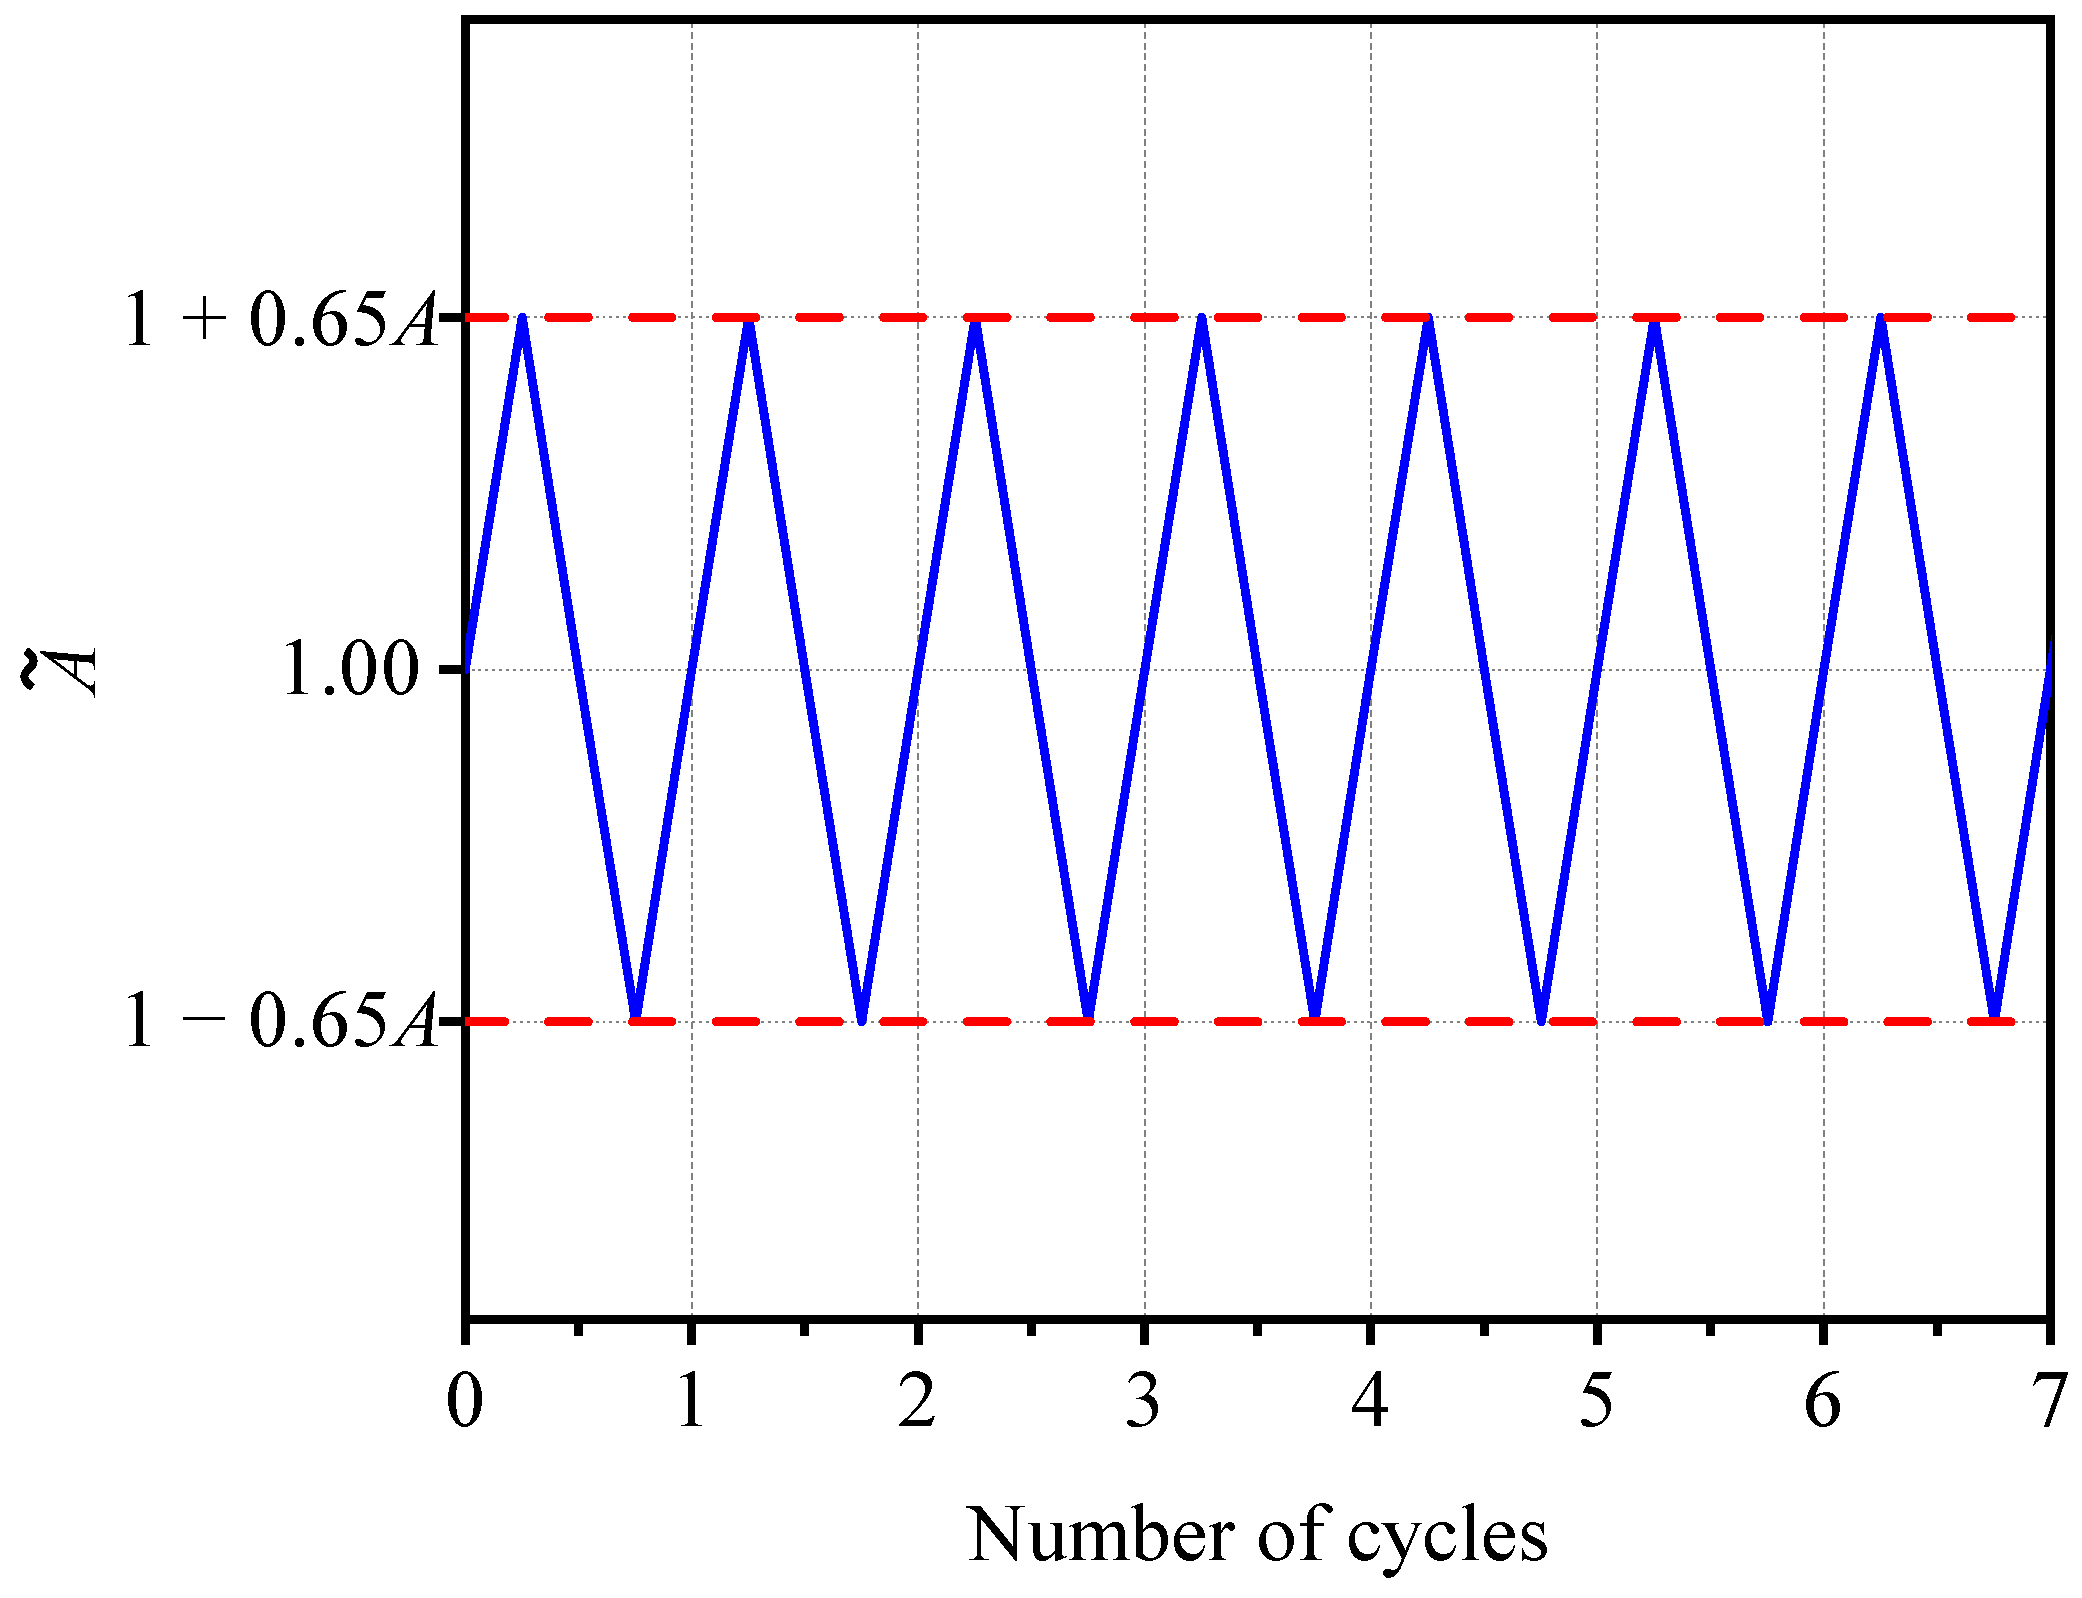
3.1. Working Condition

The vertical cyclic load is taken as 30 s according to the common duration of the earthquake and is applied to different time points ( T P ) during fire. Figure 8 shows the vertical load P ˜ applied during the cyclic load duration, and P ˜ is determined by Equation (7).
P ˜ = P · A ˜
where P is the axial compression load, and the cyclic load coefficient A ˜ is shown in Figure 9. The amplitude ( A in Figure 9) of the cyclic load is set according to the maximum acceleration under the earthquake action, which is 0.05, 0.10, 0.15, 0.20, 0.30, and 0.40, respectively. The ratio of vertical ground motion to horizontal ground motion is 0.65 [50], and the cyclic load of the reference column is 2 s in a cycle, that is, 15 cycles in 30 s. The working conditions are shown in Table 3. Taking F040T05 as an example, F040 indicates that the cyclic amplitude is 0.4, and T05 indicates that the insertion time point of cyclic load is 0.5 h (abbreviated to h ).

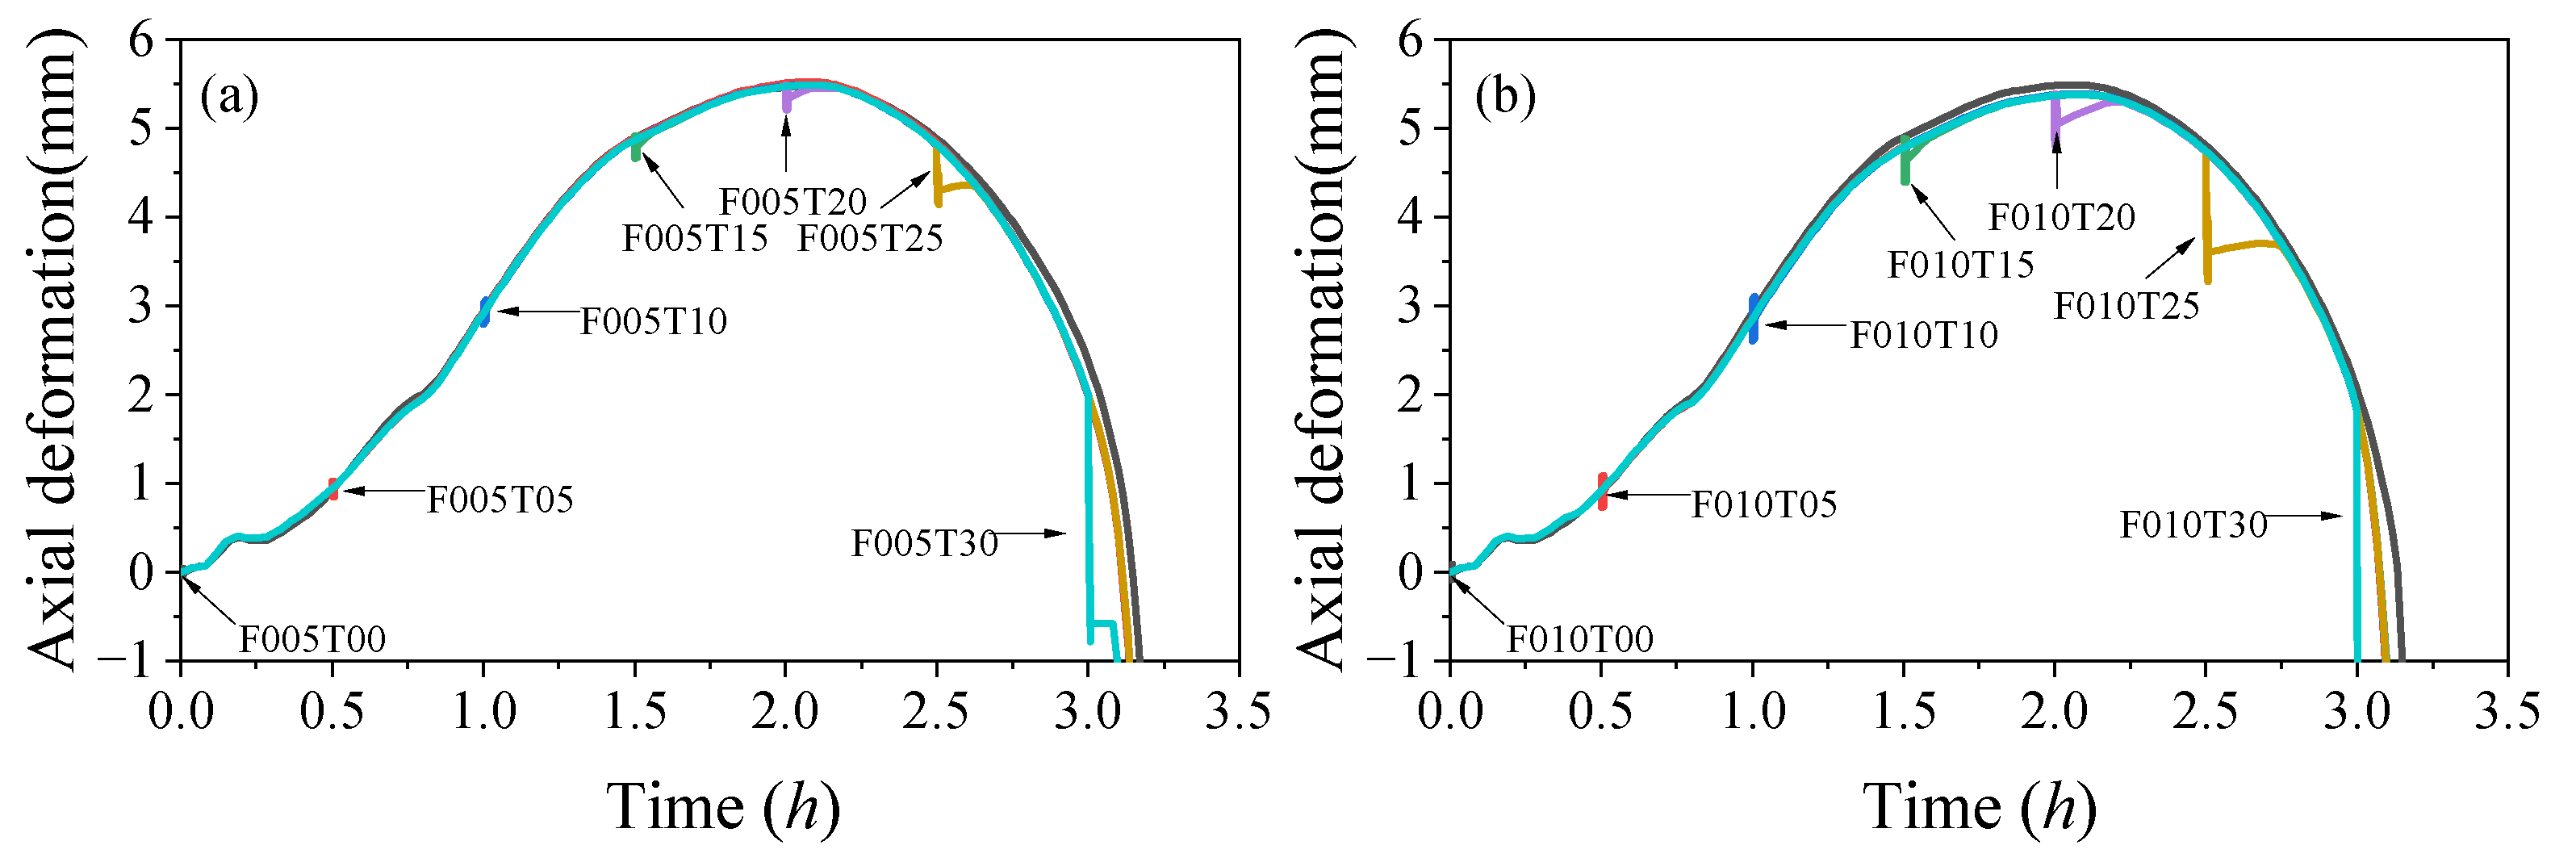
3.2. Axial Deformation
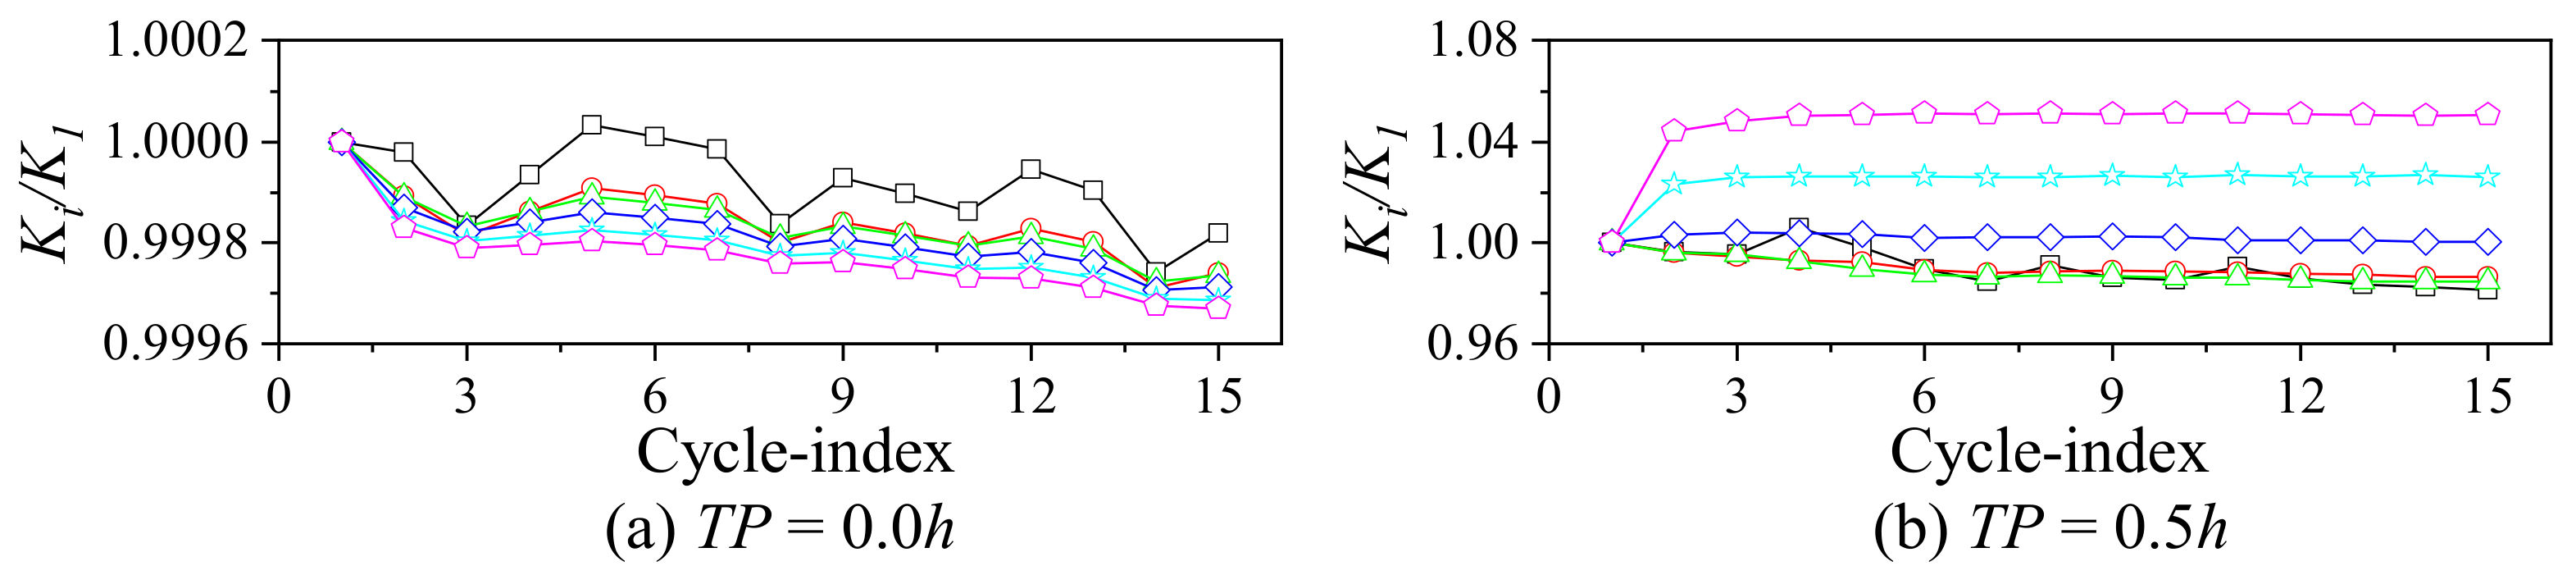
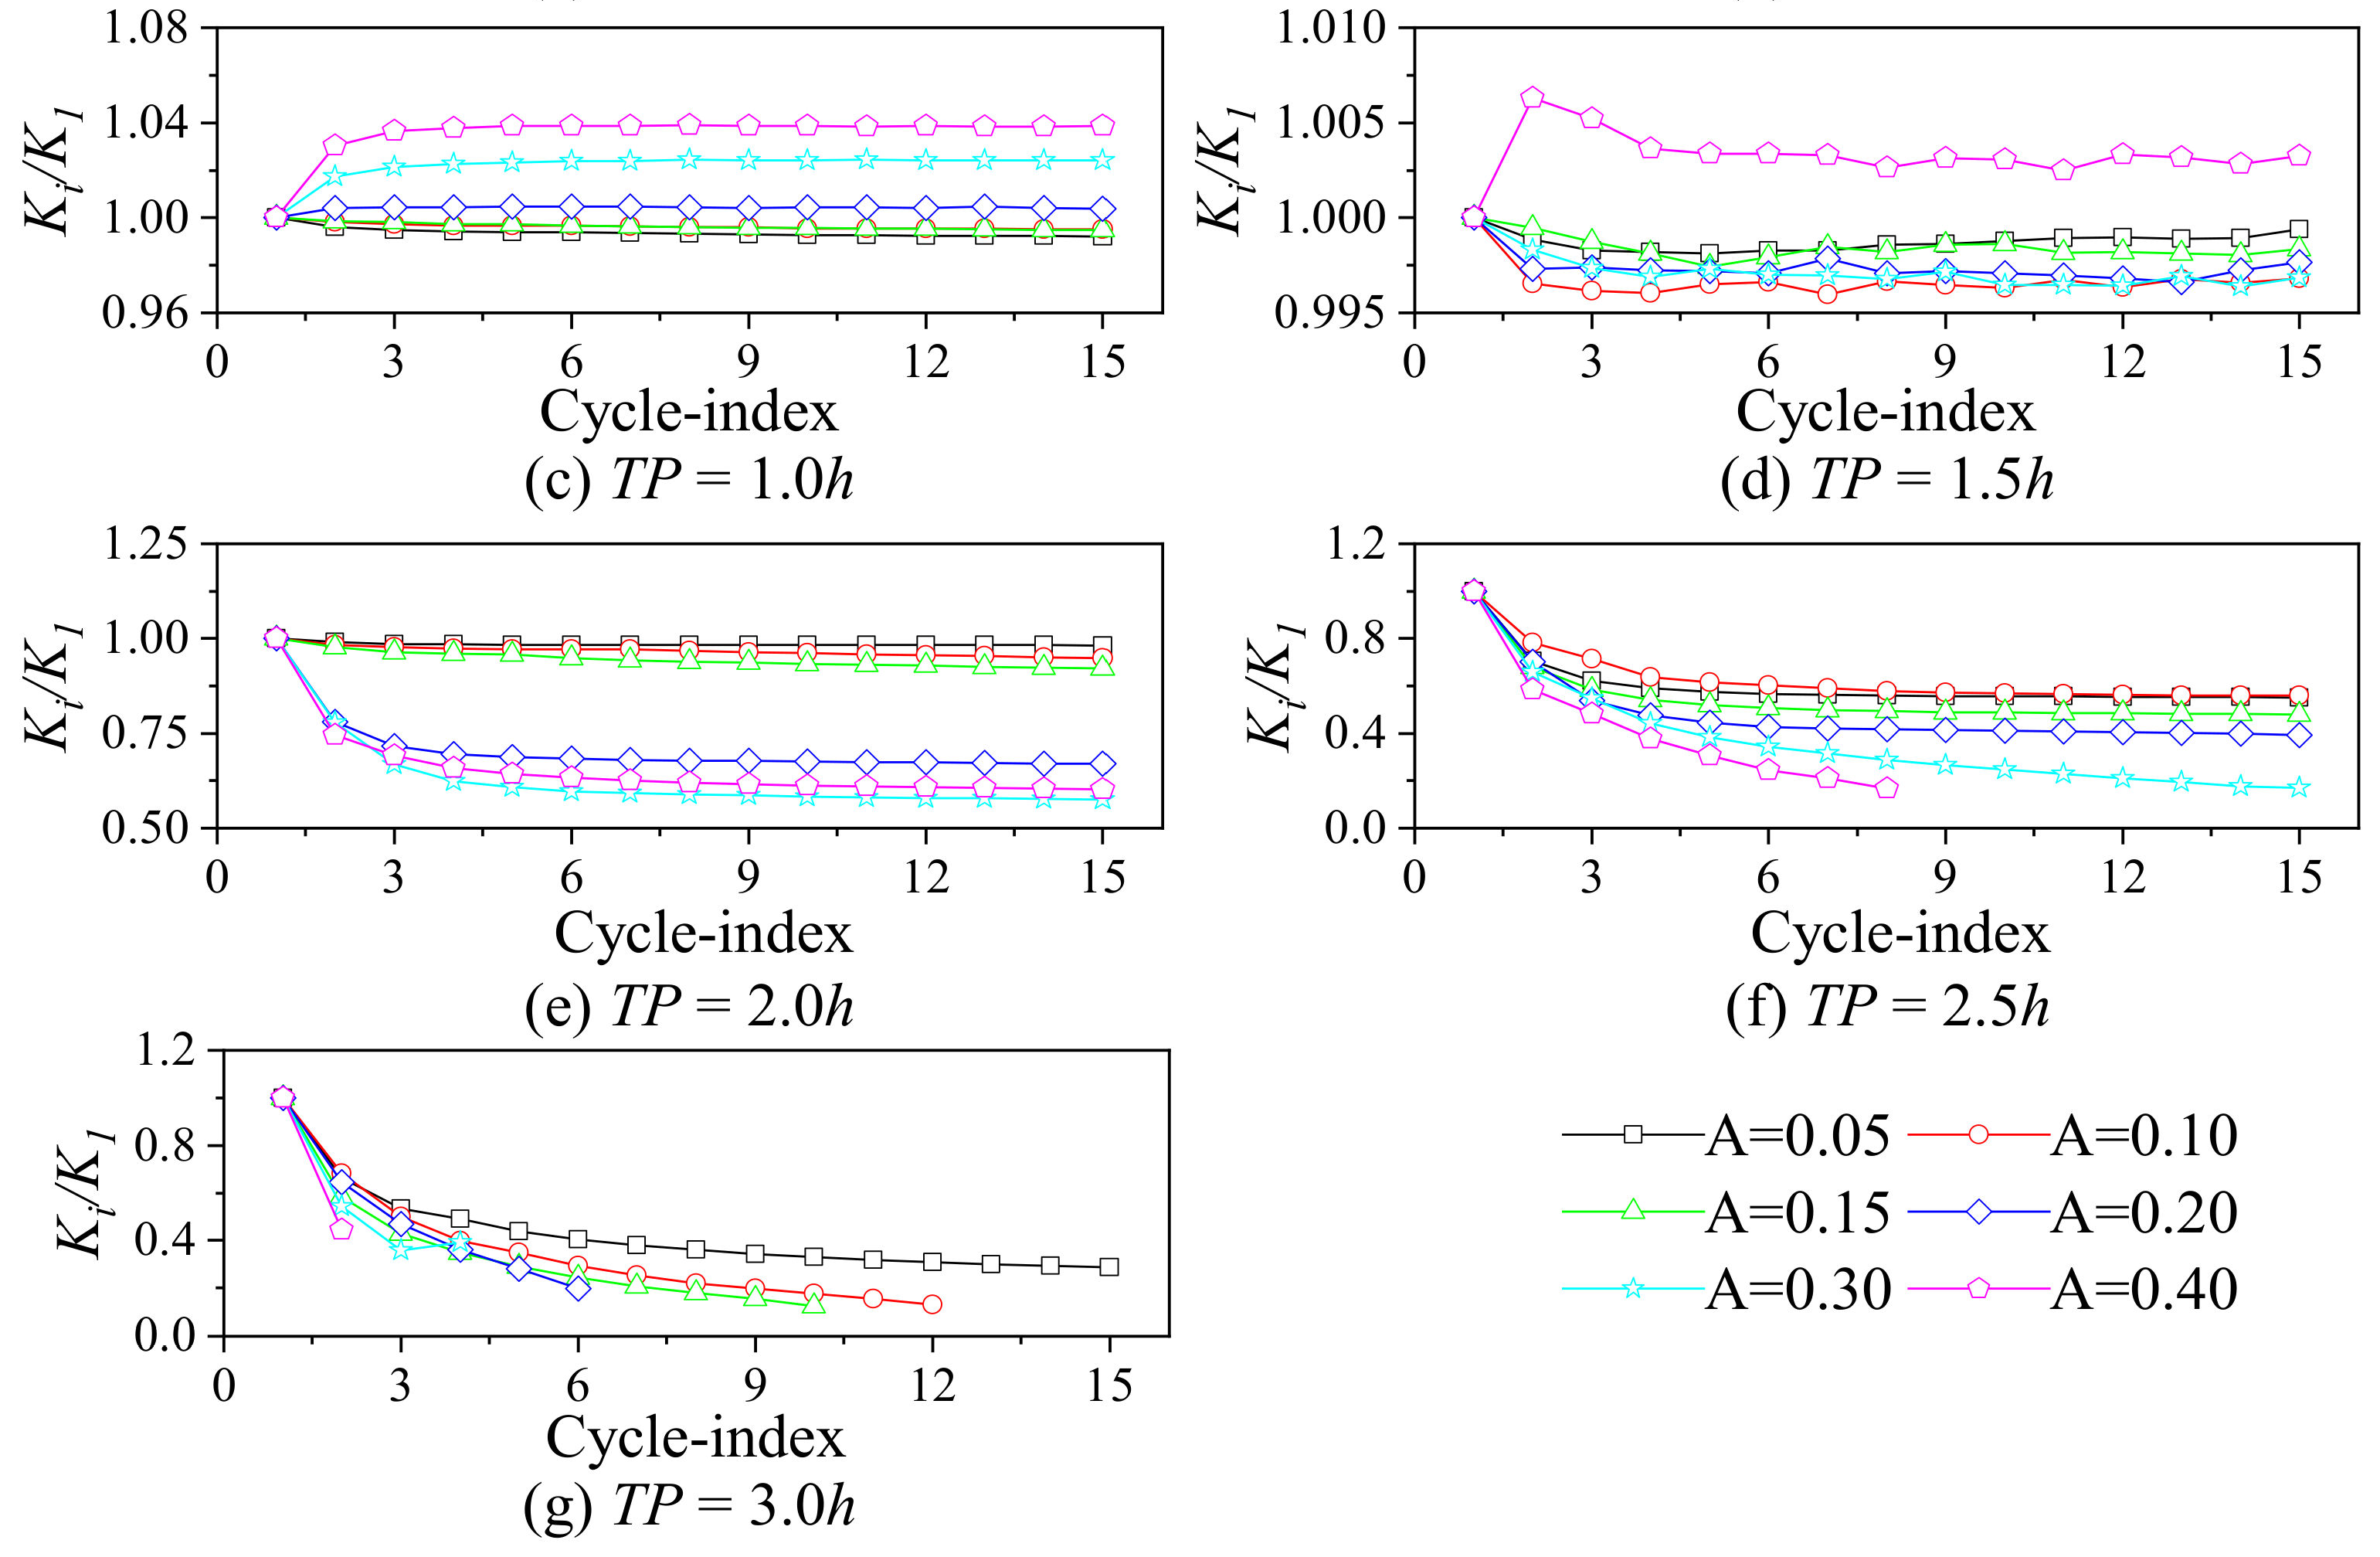
The axial deformation-time curves of RC columns under different amplitudes are summarized in Figure 10.
Figure 9. Cyclic load coefficient curve.
Buildings 12 01062 g009
In general, cyclic loads with different T P and different amplitudes have various degrees of effect on the axial deformation-time curves of RC columns. The axial deformation-time curves of RC columns are affected within a certain period after the cyclic load is applied, while the subsequent axial deformation-time curve almost overlaps; some RC columns are damaged during the process of cyclic load or after the cyclic load is applied for a while (with the continuous decline of axial deformation as the failure symbol). When T P = 3.0   h , except for the condition of A = 0.05 , the other conditions are damaged during the loading process. To quantitatively analyze the effect of cyclic load on the axial deformation of the RC column during fire exposure, the axial deformation-time curve of the RC column under static load during fire exposure is taken as the benchmark, and the axial deformation-time curve of the RC column under cyclic load during fire exposure is analyzed by error analysis parameter ( M A P E is chosen as a representative parameter). The M A P E of each working condition is shown in Figure 11. There is no subsequent axial deformation in the working condition that is damaged during the loading process, so it can be seen from the definition of M A P E that there is no M A P E .
As shown in Figure 11, when T P 1.5   h and the amplitude is between 0.05~0.40, the effect on the subsequent axial deformation-time curve is less than 10%; when T P 2.0   h and the amplitude is greater than 0.3, the cyclic load has a large impact on the subsequent axial deformation-time curve, and the impact increases as the amplitude increases.
Figure 10. Axial deformation-time curve of different working conditions. (a) A = 0.05; (b) A = 0.10; (c) A = 0.15; (d) A = 0.20; (e) A = 0.30; (f) A = 0.40.
Buildings 12 01062 g010aBuildings 12 01062 g010b
Figure 11. M A P E of working conditions.
Buildings 12 01062 g011
To quantitatively analyze the effect of the cyclic load on the axial deformation of RC column under cyclic load during fire exposure, the cyclic load effect coefficient η is chosen. η is defined by Equation (1) and the calculation parameters of η are shown in Figure 12, with the deformation Δ d at t 0 at the end of the application of cyclic load, the deformation Δ 0 at t 0 and the peak deformation Δ m a x under static load.
η = Δ 0 Δ d Δ m a x × 100 %
According to the definition of η , there is no such parameter in the case when the RC column is damaged during the cyclic load. When η > 10 % , it is considered to have a large impact, and η < 10 % means a small impact. The cyclic load effect coefficient η under different T P and different amplitudes is listed in Figure 13. Overall, under the same T P , the larger the amplitude, the greater the effect on the axial deformation of the column. When T P 1.5   h , the effect of different amplitude cyclic loads on the axial deformation of the RC column is small, and when T P > 1.5   h , the η of the amplitudes of 0.20~0.40 exceeds 10%. The cyclic load with the amplitude of 0.05 exerted a great effect on the axial deformation of the RC column at 3 h, while it had little effect on the axial deformation of the RC column when T P 2.5   h .
Figure 12. Calculation parameters diagram of cyclic load effect coefficient ( η ).
Buildings 12 01062 g012
Figure 13. Cyclic load effect coefficient ( η ) with different working conditions.
Buildings 12 01062 g013

3.3. Stiffness

The secant stiffness K i at the maximum displacement of the nth cycle under the vertical cyclic load is calculated according to Equation (9), where Δ P i + and Δ P i are the difference between the cyclic load and the static load at the corresponding moments of t i + and t i , respectively; i represents the number i cycle; other parameters are shown in Figure 14. The stiffness degradation ratios under different working conditions are summarized in Figure 15.
K i = Δ P i + + Δ P i Δ i + + Δ i = 2 P Δ i + + Δ i
As shown in Figure 15, when T P 1.5   h , the stiffness degradation ratio K i / K 1 of each cycle in each working condition is between 0.99 and 1.05, indicating that the stiffness degradation caused by cyclic loading has little effect, and the existence of cyclic load leads to slight stiffness strengthening (less than 5%) within a certain cycle number range; when T P = 2.0   h , the stiffness of the working conditions with an amplitude greater than or equal to 0.2 dropped sharply in the first and second cycles, and the stiffness decreased slowly after the third cycle. However, with the increase of the cycle, the stiffness decreases slowly for the working conditions with the amplitude less than 0.2, and the cyclic load has little effect on these working conditions. When T P 2.5   h , the cyclic load has a significant effect on the stiffness, and the larger the amplitude, the greater the impact. In some cases, failure occurs due to excessive stiffness attenuation, and the larger the amplitude, the earlier the failure.

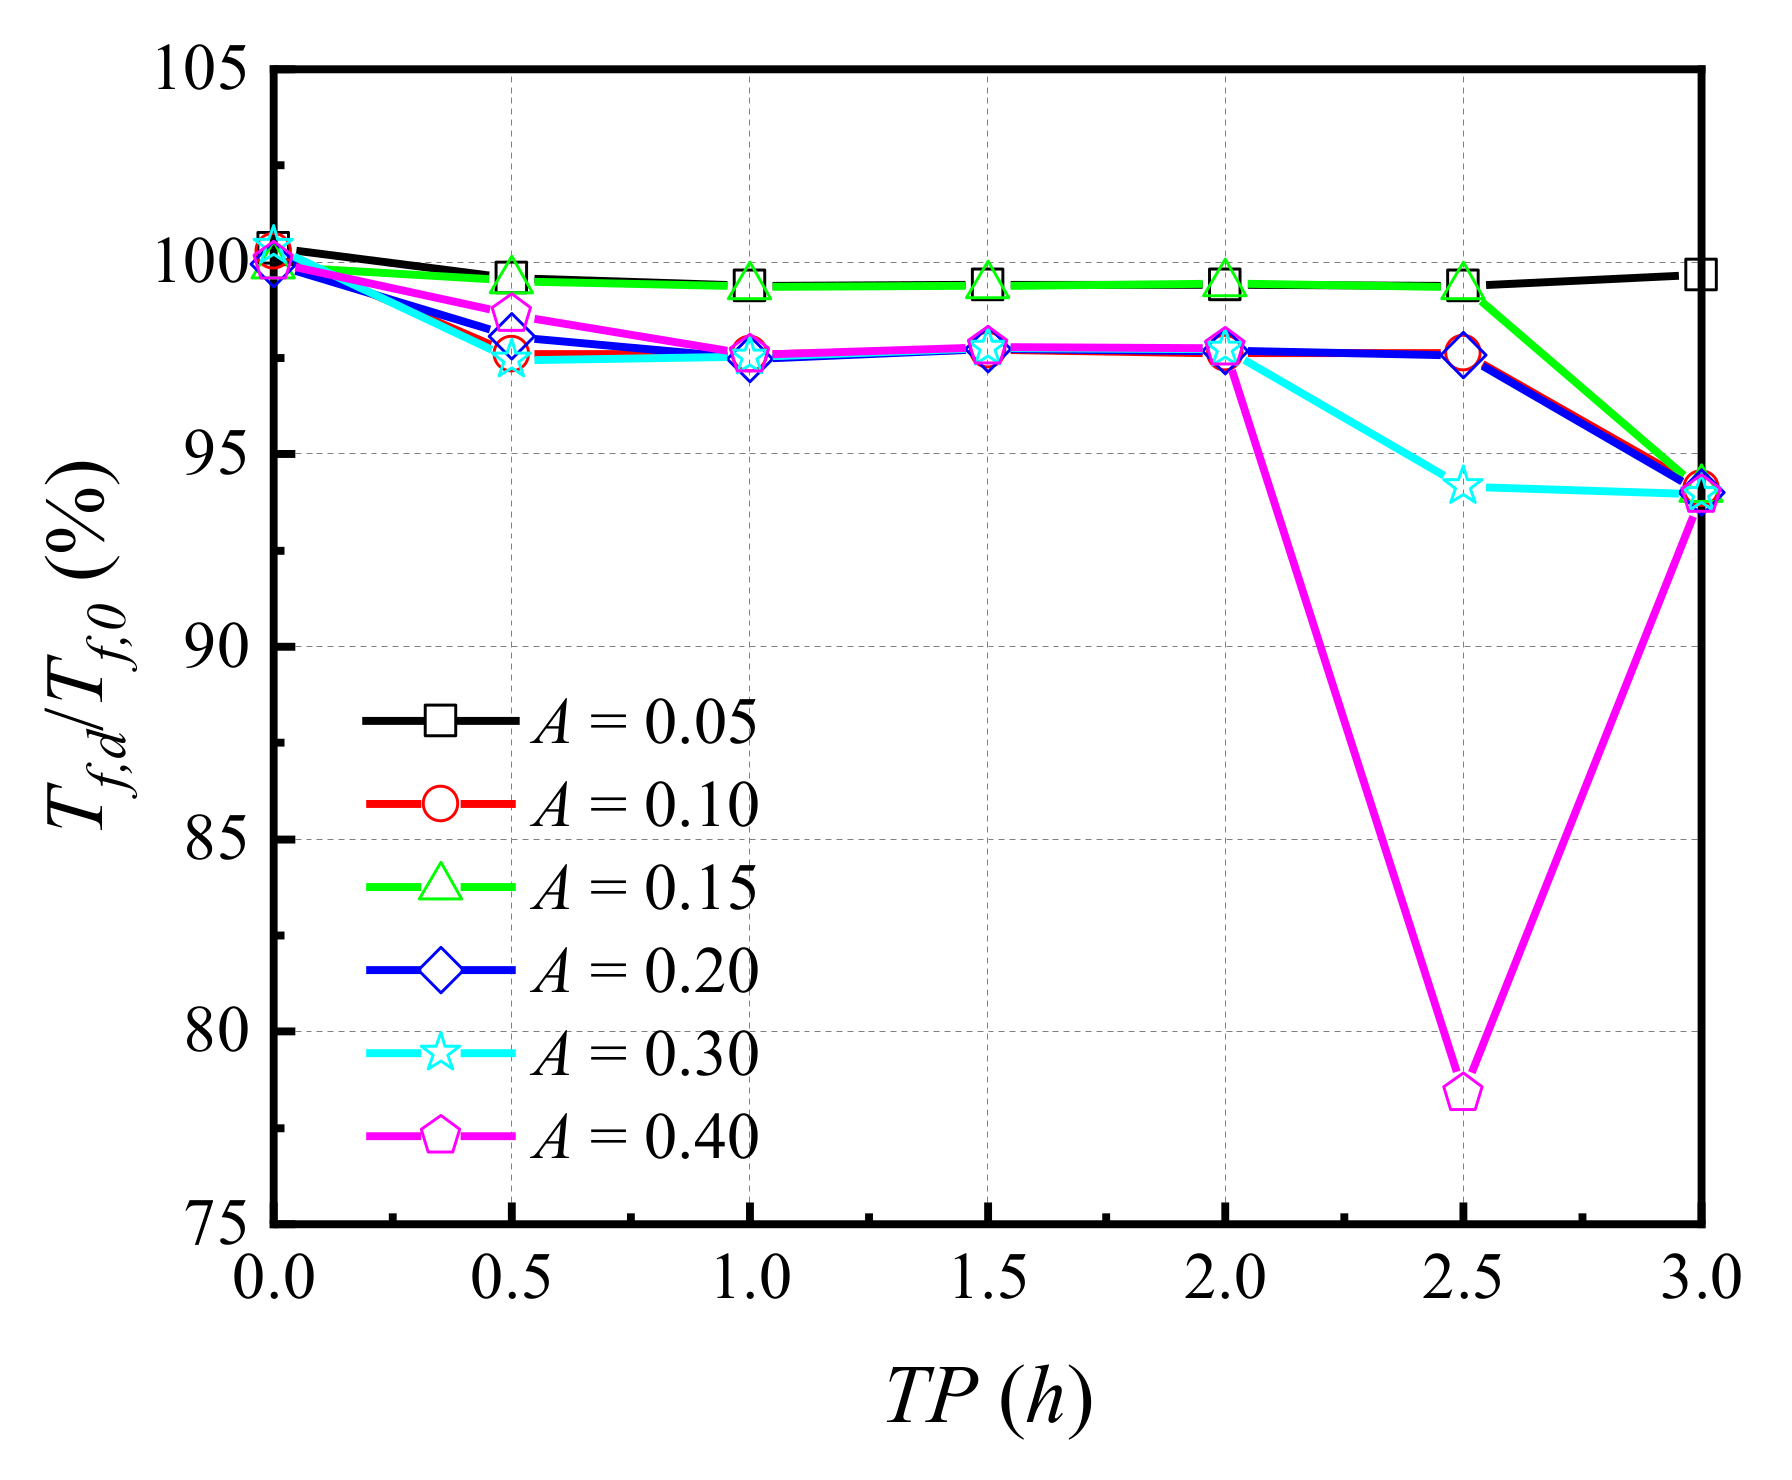
3.4. Fire Resistance Time and Damage

The time from the start of the fire to the failure of the RC column under different working conditions is defined as the fire resistance time. The fire resistance time of the RC column under static load is T f , 0 , and the fire resistance time under the cyclic load is T f , d . The fire resistance time ratios ( T f , d / T f , 0 ) of different working conditions are displayed in Figure 16. It can be seen that the cyclic load applied within 2 h has little effect on the fire resistance time of the RC column, and the reduction in the fire resistance time is within 5%. When T P = 2.5   h , the fire resistance time of the amplitudes of 0.30 and 0.40 is reduced by more than 5%, and the fire resistance time of the amplitude of 0.40 is reduced by more than 20% due to the failure during the loading process; when T P = 3.0   h , the fire resistance time of different amplitude conditions is only reduced within 7%, because the cyclic load applied time is close to the failure time of the static load fire condition.
Figure 15. Variation curve of stiffness degradation ratio ( K i / K 1 ) with cycle index under different working conditions.
Buildings 12 01062 g015aBuildings 12 01062 g015b
To compare and analyze the damage under different working conditions, the damage time consistent with Section 0 is selected. When the fire resistance time is greater than 3.05 h , the damage at 3.05 h is selected, otherwise the damage at failure time is chosen. Figure 17 shows the comparative analysis of damage in working conditions with an amplitude of 0.40, which has a greater impact on the fire resistance time. The elements with damage greater than 0.9 increase with the increases in T P , resulting in a significant decrease in the number of elements that can bear the load. When the T P is greater than 2.5 h , the buckling failure time of the RC column is less than 3.05 h .
Figure 16. Effect of amplitude and T P of cyclic load on fire resistance time.
Buildings 12 01062 g016
Figure 17. Damage of RC column with different TP and amplitude of 0.40.
Buildings 12 01062 g017

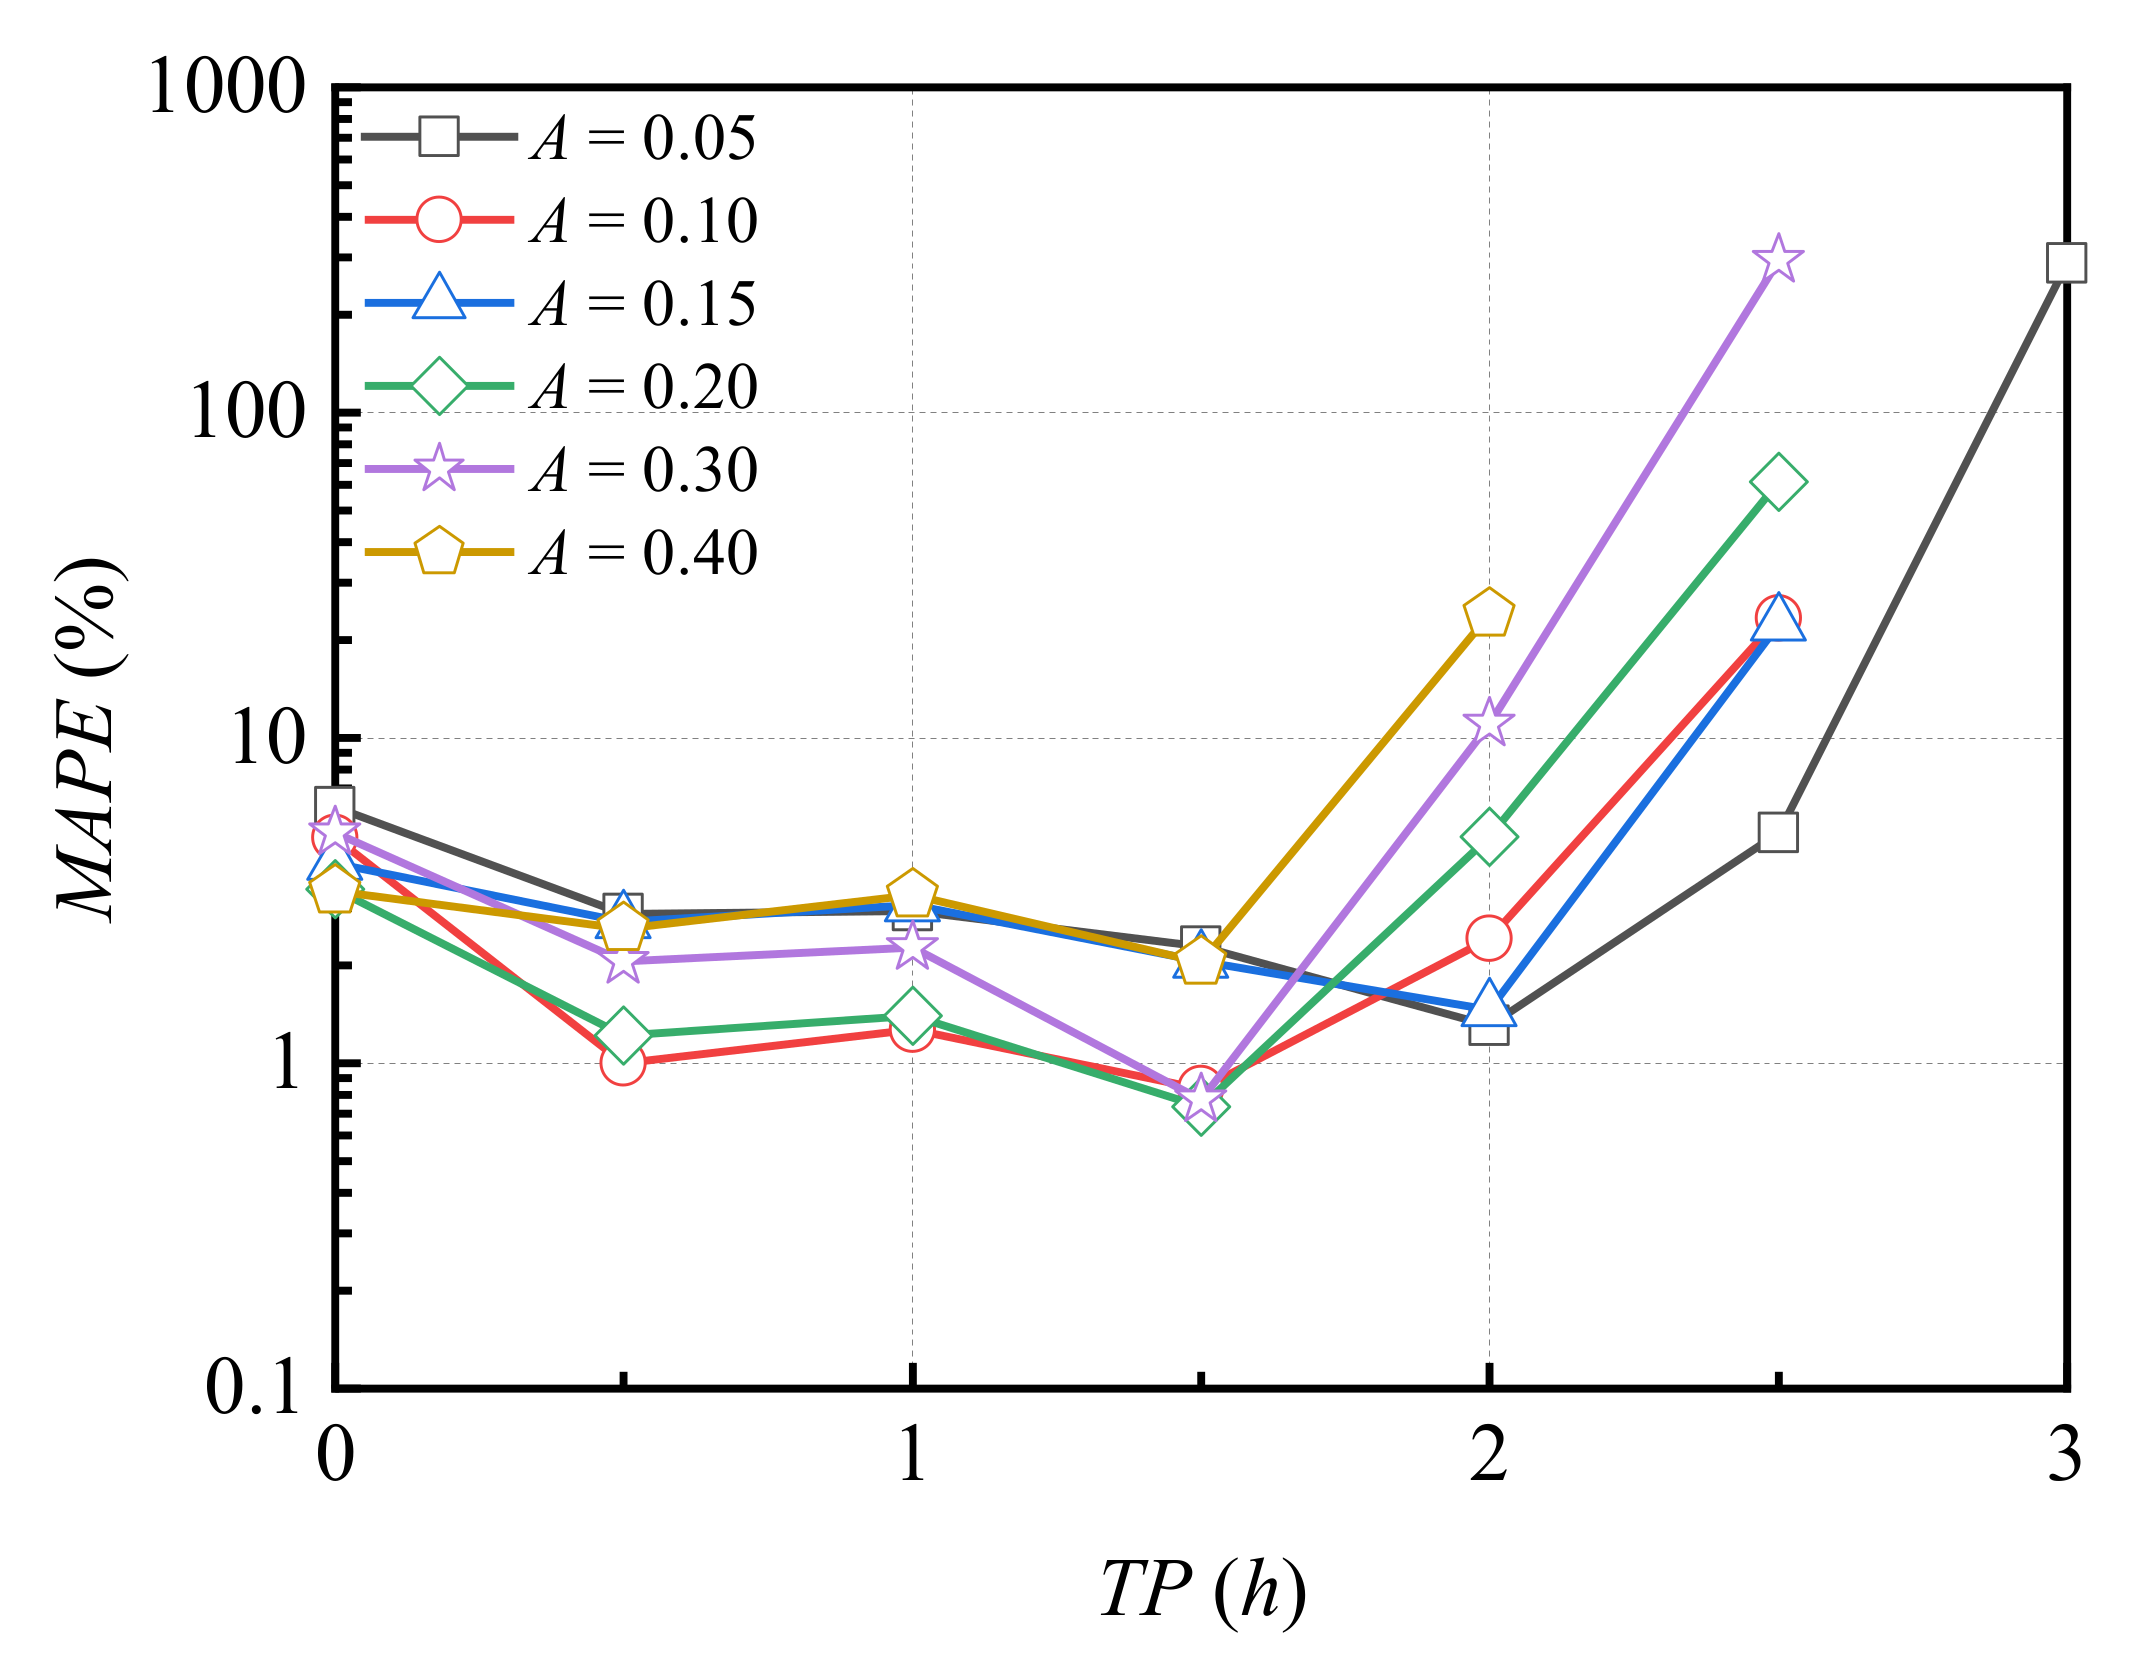
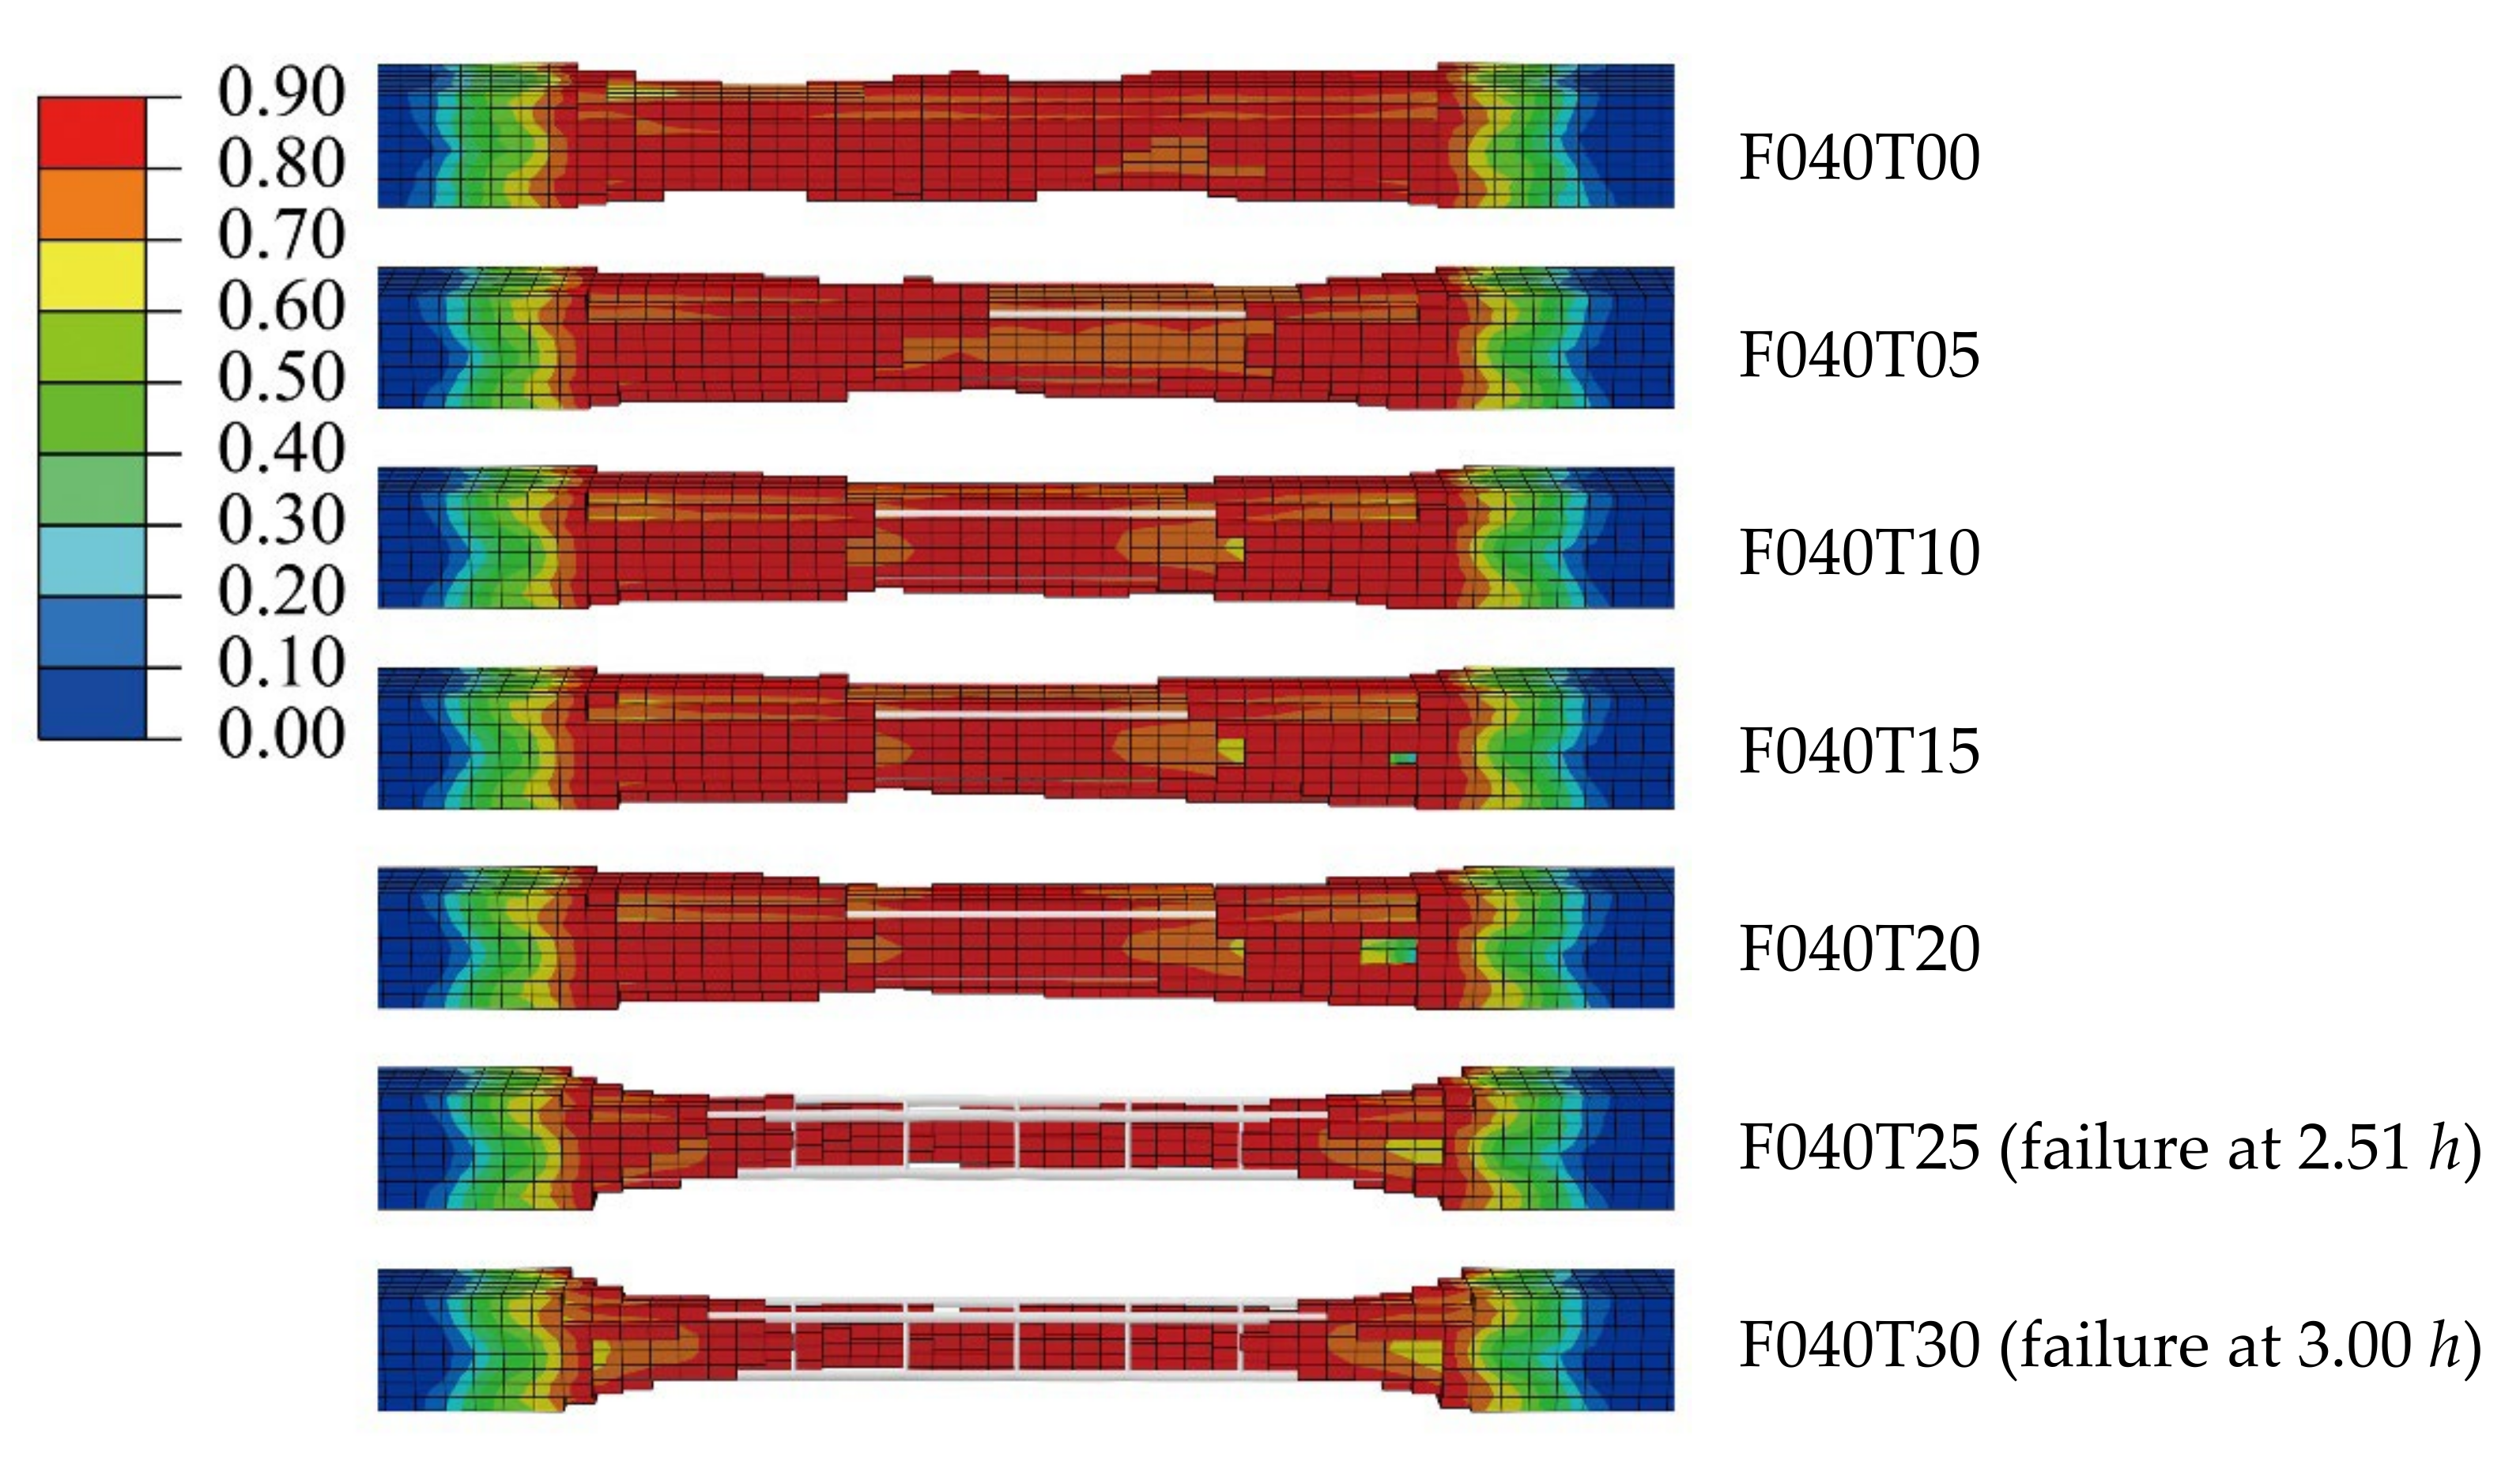
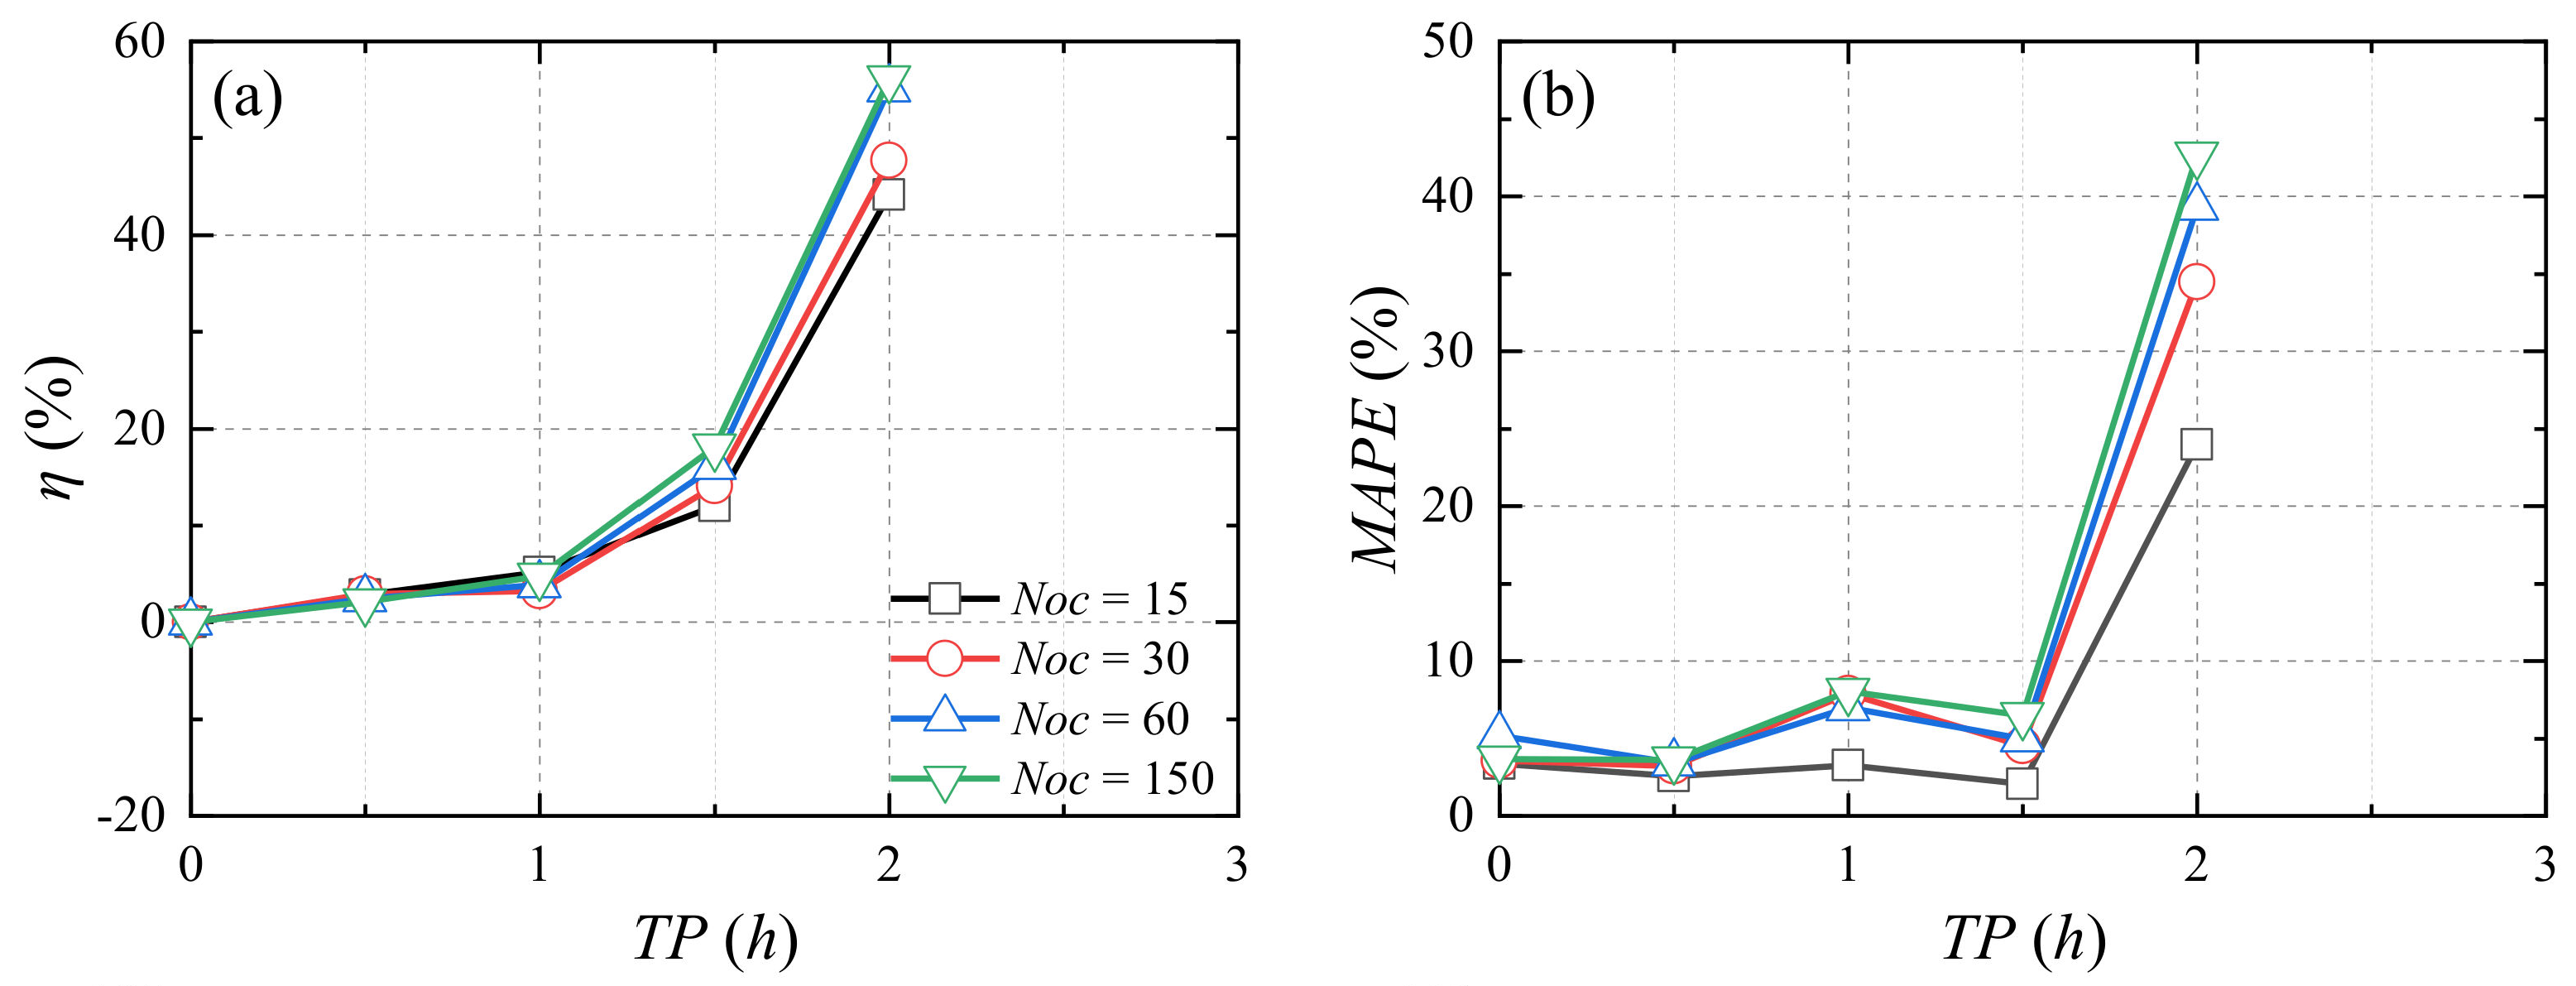
3.5. Response Analysis of RC Column under Cyclic Load with Different Cycle Times during Fire Exposure

Through the analysis in Section 3.2, Section 3.3 and Section 3.4, when the cycle amplitude is 0.4, the deformation, stiffness, and fire resistance time of the RC column under different TPs are significantly different. Therefore, when the cyclic amplitude is 0.4, the cyclic load duration is 30 s, and the number of cycles ( N o c ) is taken as 15, 30, 60, and 150 times, respectively, the effects of cyclic loads on the deformation, stiffness, and fire resistance time of RC columns under different TPs are investigated. The representative parameters are the cyclic load effect coefficient η, M A P E , stiffness degradation ratio (represented by the ratio K 1 / K 1 of the last cyclic stiffness K 1 to the first cyclic stiffness K 1 , the same below), and the fire resistance time ratio T f , d / T f , 0 ). The effect of the number of cycles on the deformation, stiffness, and fire resistance time ratio of the RC column during fire exposure is shown in Figure 18. Different cycle times have similar effects on the axial deformation and subsequent axial deformation, stiffness, and fire resistance time ratio of the RC column during the cyclic load duration and fire exposure. The later the cyclic load is added, the greater the effect on the axial deformation. When T P 1.5   h , different cycle times have little effect on the stiffness of the RC column during fire exposure. When T P > 1.5   h , the more cycles, the greater the effect of cyclic load on the stiffness of the RC column. When the cyclic load is added for the same time, the fire resistance time of different cycle times has little difference.

4. Multi-Performance Comparison of Various RC Columns Subject to Coupling Effect of Cyclic Loads and Fire
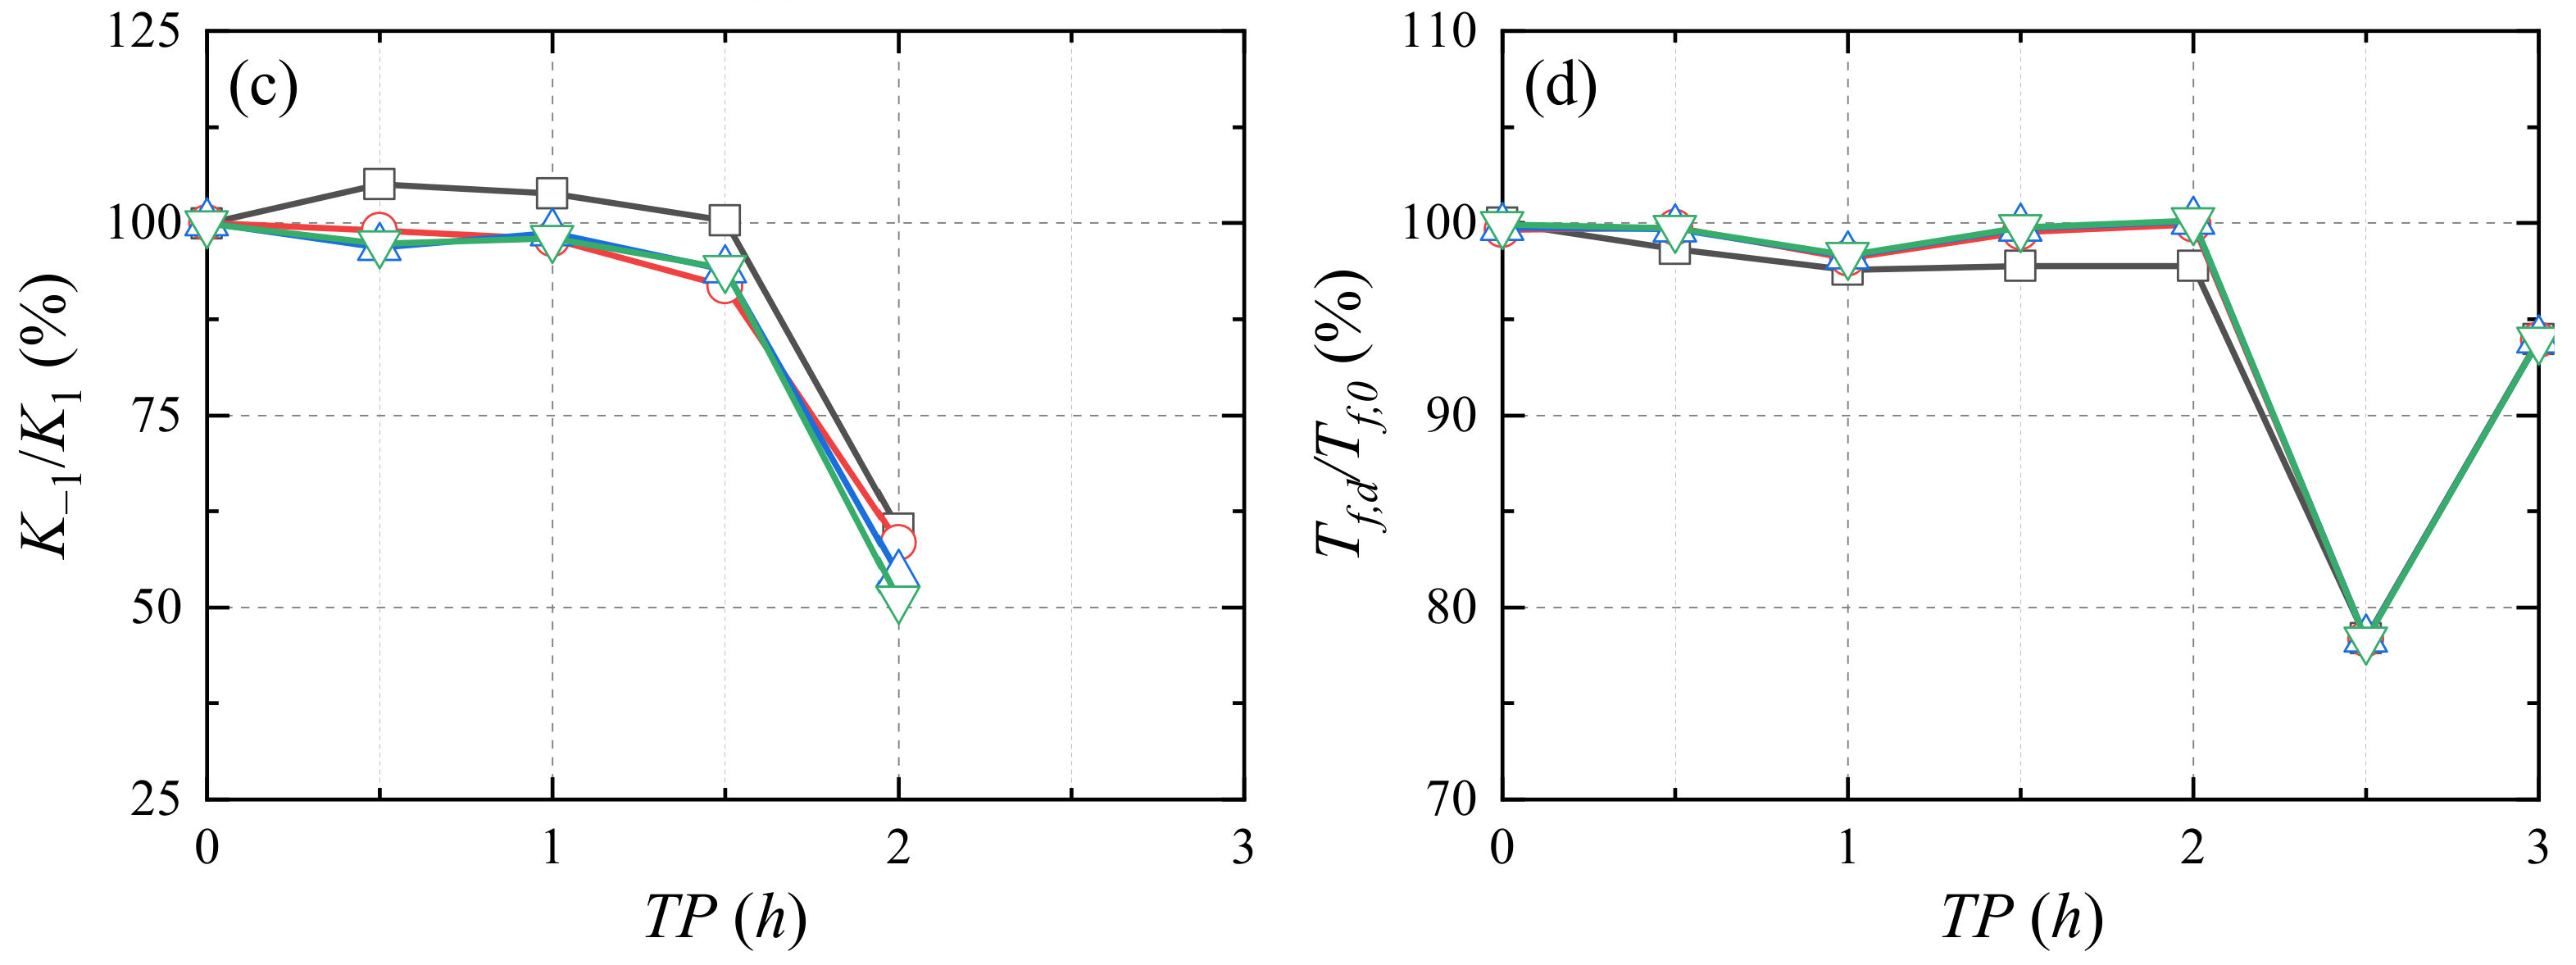
Given the obtained results for one typical RC column, the multi-performance evaluation is further performed for a series of RC columns with various application scenarios. The section size, protective cover thickness, longitudinal reinforcing ratio, tie spacing, and axial load ratio of the RC columns are considered to simulate the inherent characteristics of columns. The cyclic amplitude and circles of the cyclic load are assumed as 0.40 and 15 times for reference. The η, MAPE, stiffness degradation ratio K 1 / K 1 , and fire resistance time ratio T f , d / T f , 0 were used as representative parameters to investigate the influence of cyclic load on the deformation and damage of RC column with different characteristics. Table 4 summarizes the working conditions of reference columns and columns with different characteristics. For all the columns, the material mechanical properties, thermal mechanical properties, and boundary conditions are the same. Table 4 summarizes the fire resistance time of the reference column and different column characteristics. When improving the section size, cover thickness, and longitudinal reinforcement ratio or reducing the axial load ratio and tie spacing, the fire resistance time of RC columns increases. The fire resistance time of RC columns with different characteristics is consistent with previous research [31,51]. When confinement increases by 50%, the fire resistance time of the RC column increases by 6 and 3.5 to 12% respectively in Table 4 and previous research [31].

4.1. Section Size

The effects of cyclic loading on the deformation, stiffness, and fire resistance time of RC columns with different cross-sectional sizes during fire exposure are shown in Figure 19. The larger the cross-sectional size is, the less the cyclic loads affect the RC columns. When T P < 2.0   h , the cyclic load has little effect on the axial deformation of RC columns with different cross-sectional sizes during fire exposure, and the cyclic load has a strengthening effect on the stiffness of RC columns with different cross-sectional sizes; when T P 2.0   h , the larger the section size, the smaller the effect of the cyclic load on the subsequent axial deformation, and the effect of the cyclic load on the stiffness of the RC column decreases with the increase in the section size. For an RC column with a section size of 406 mm × 406 mm, when the cyclic load is applied within 3 h, the cyclic load has little effect on the stiffness of the RC column. Except for some working conditions that occur failure during cyclic load, the effect of the cyclic load on the fire resistance time of RC columns with a large section size is smaller under the same T P .

4.2. Cover Thickness

The effects of cyclic loading on the deformation, stiffness, and fire resistance time of RC columns with different cover thicknesses during fire exposure are shown in Figure 20. The larger the cover thickness, the smaller the effect of the cyclic load on the axial deformation of the RC column, and the greater effect on the fire resistance time. When T P 1   h , the cyclic load can improve the stiffness of RC columns with the cover thickness of 40 mm and 50 mm during fire exposure. When T P > 1   h , the thicker the cover thickness, the smaller the effect of cyclic load on the stiffness of the RC column during fire exposure, but when the cyclic load is applied at the same TP, the stiffness ratios of different cover thickness shows little difference.

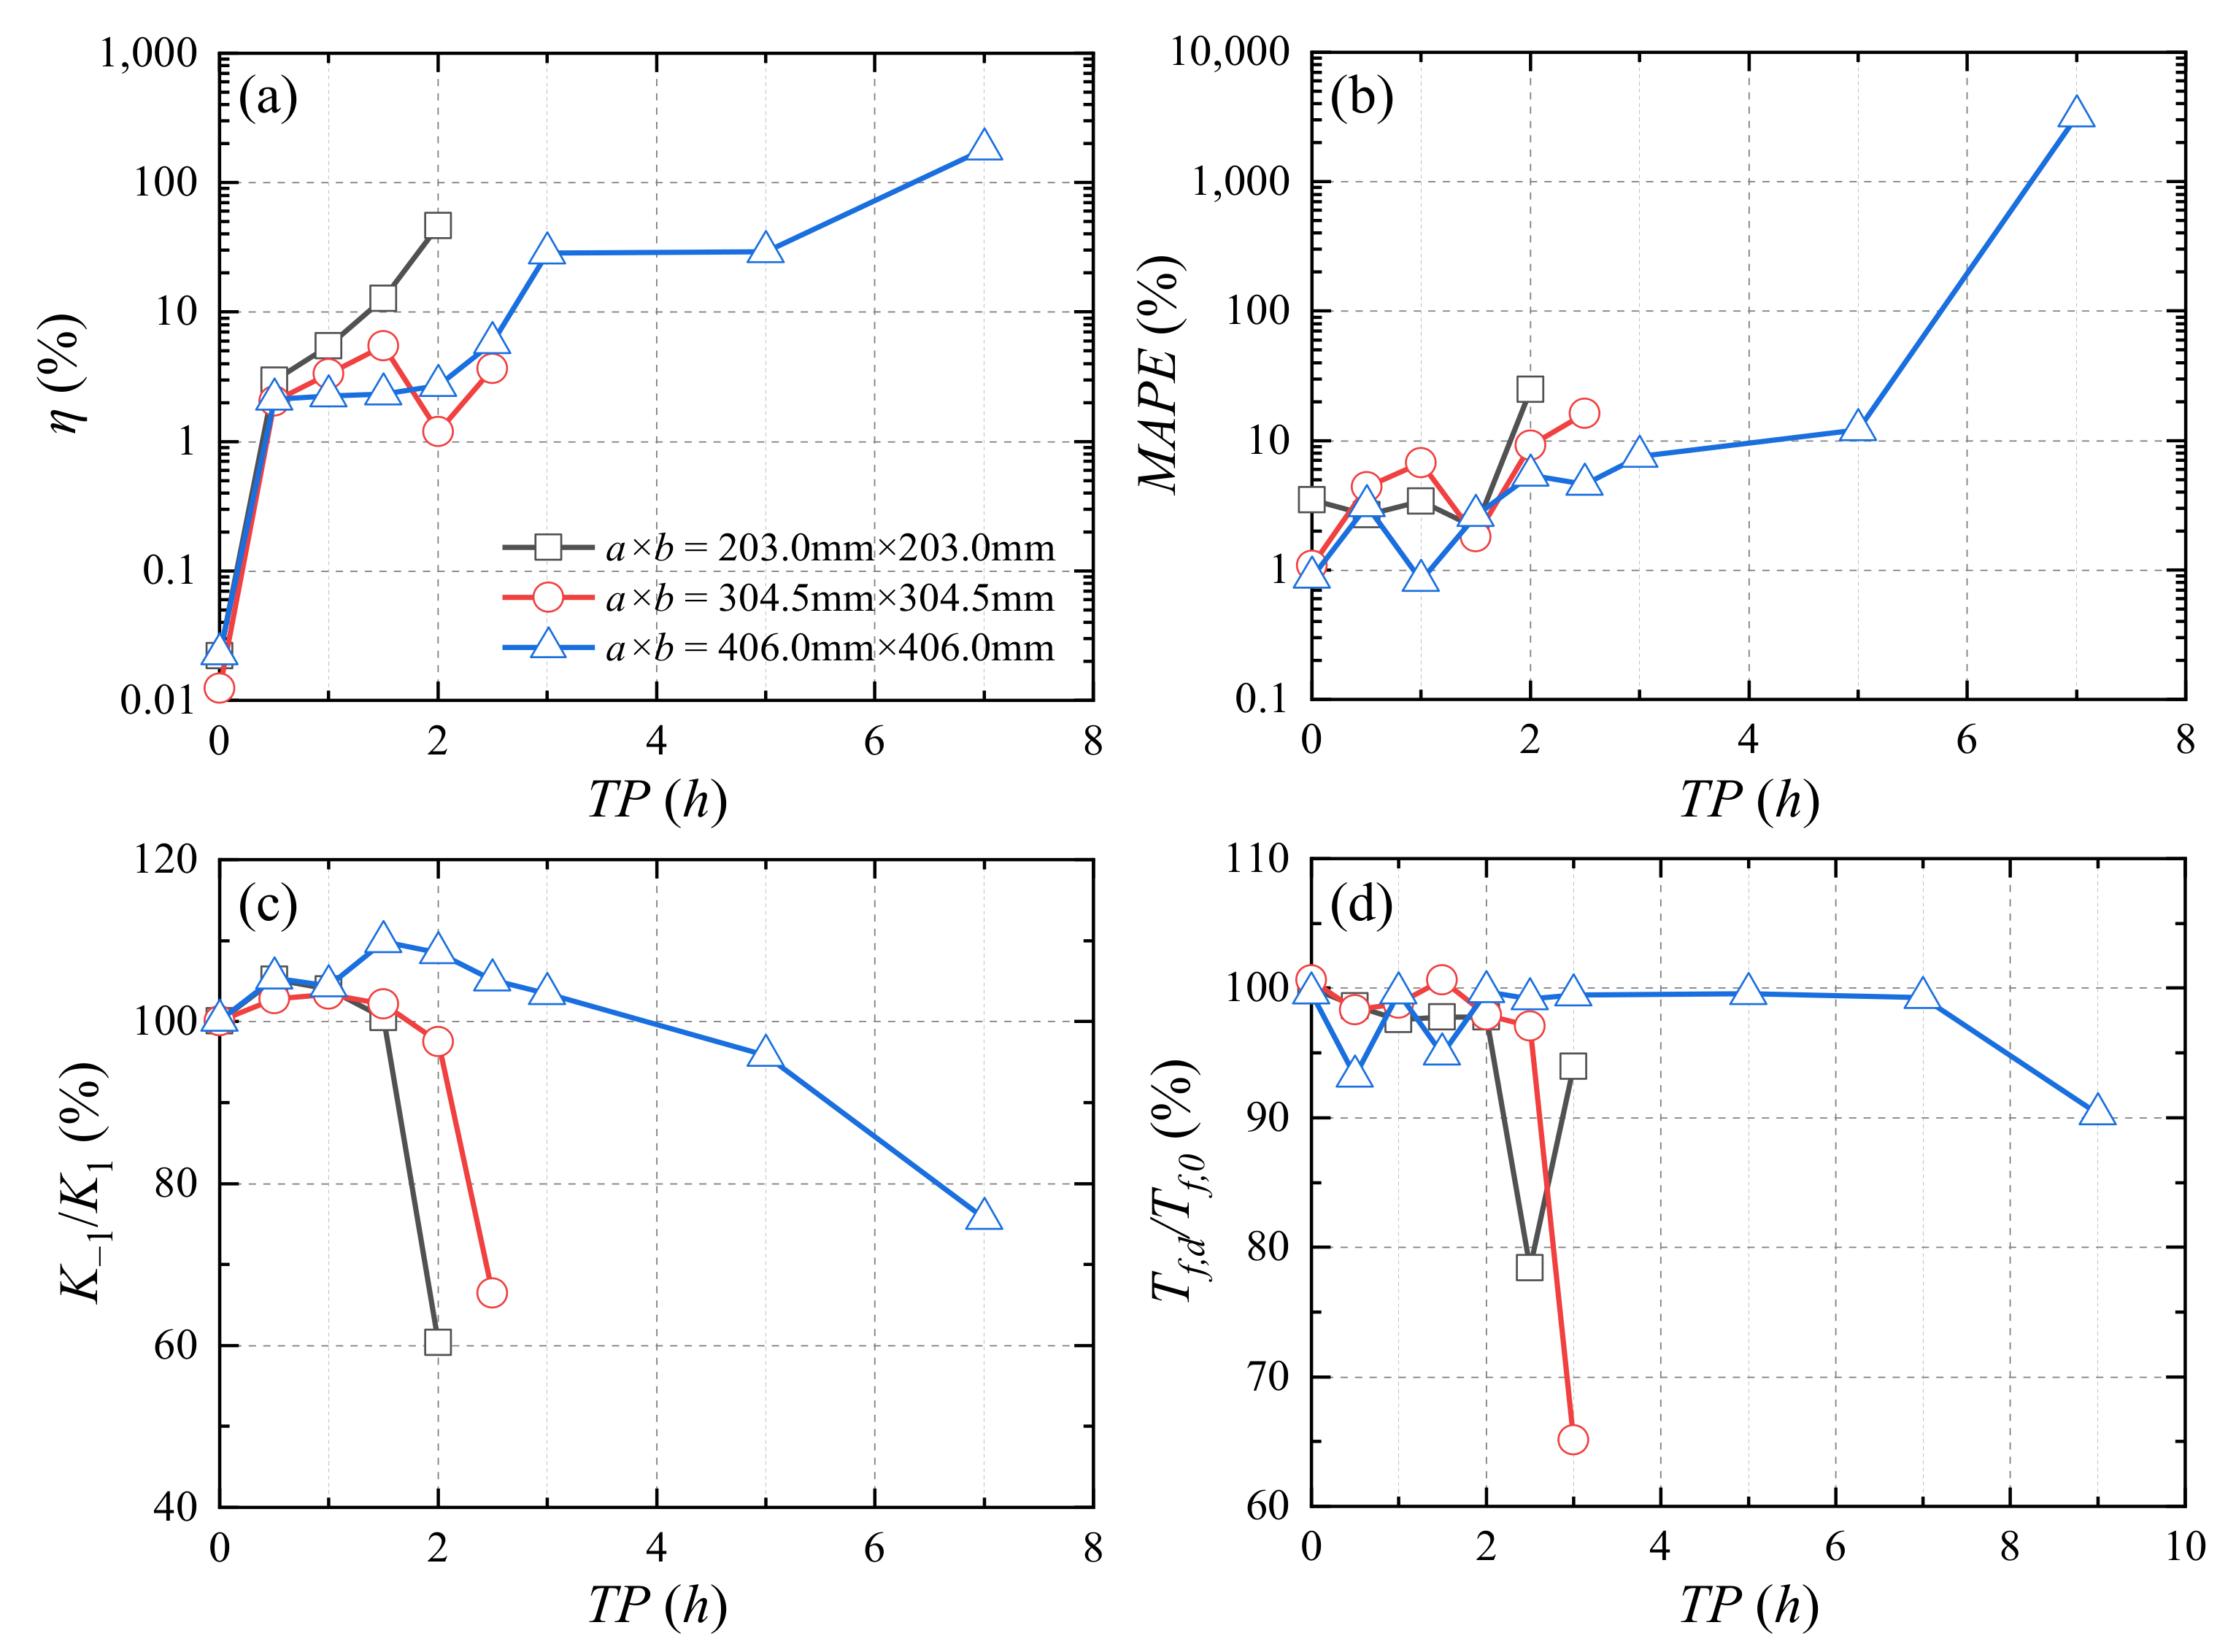
4.3. Longitudinal Reinforcement Ratio
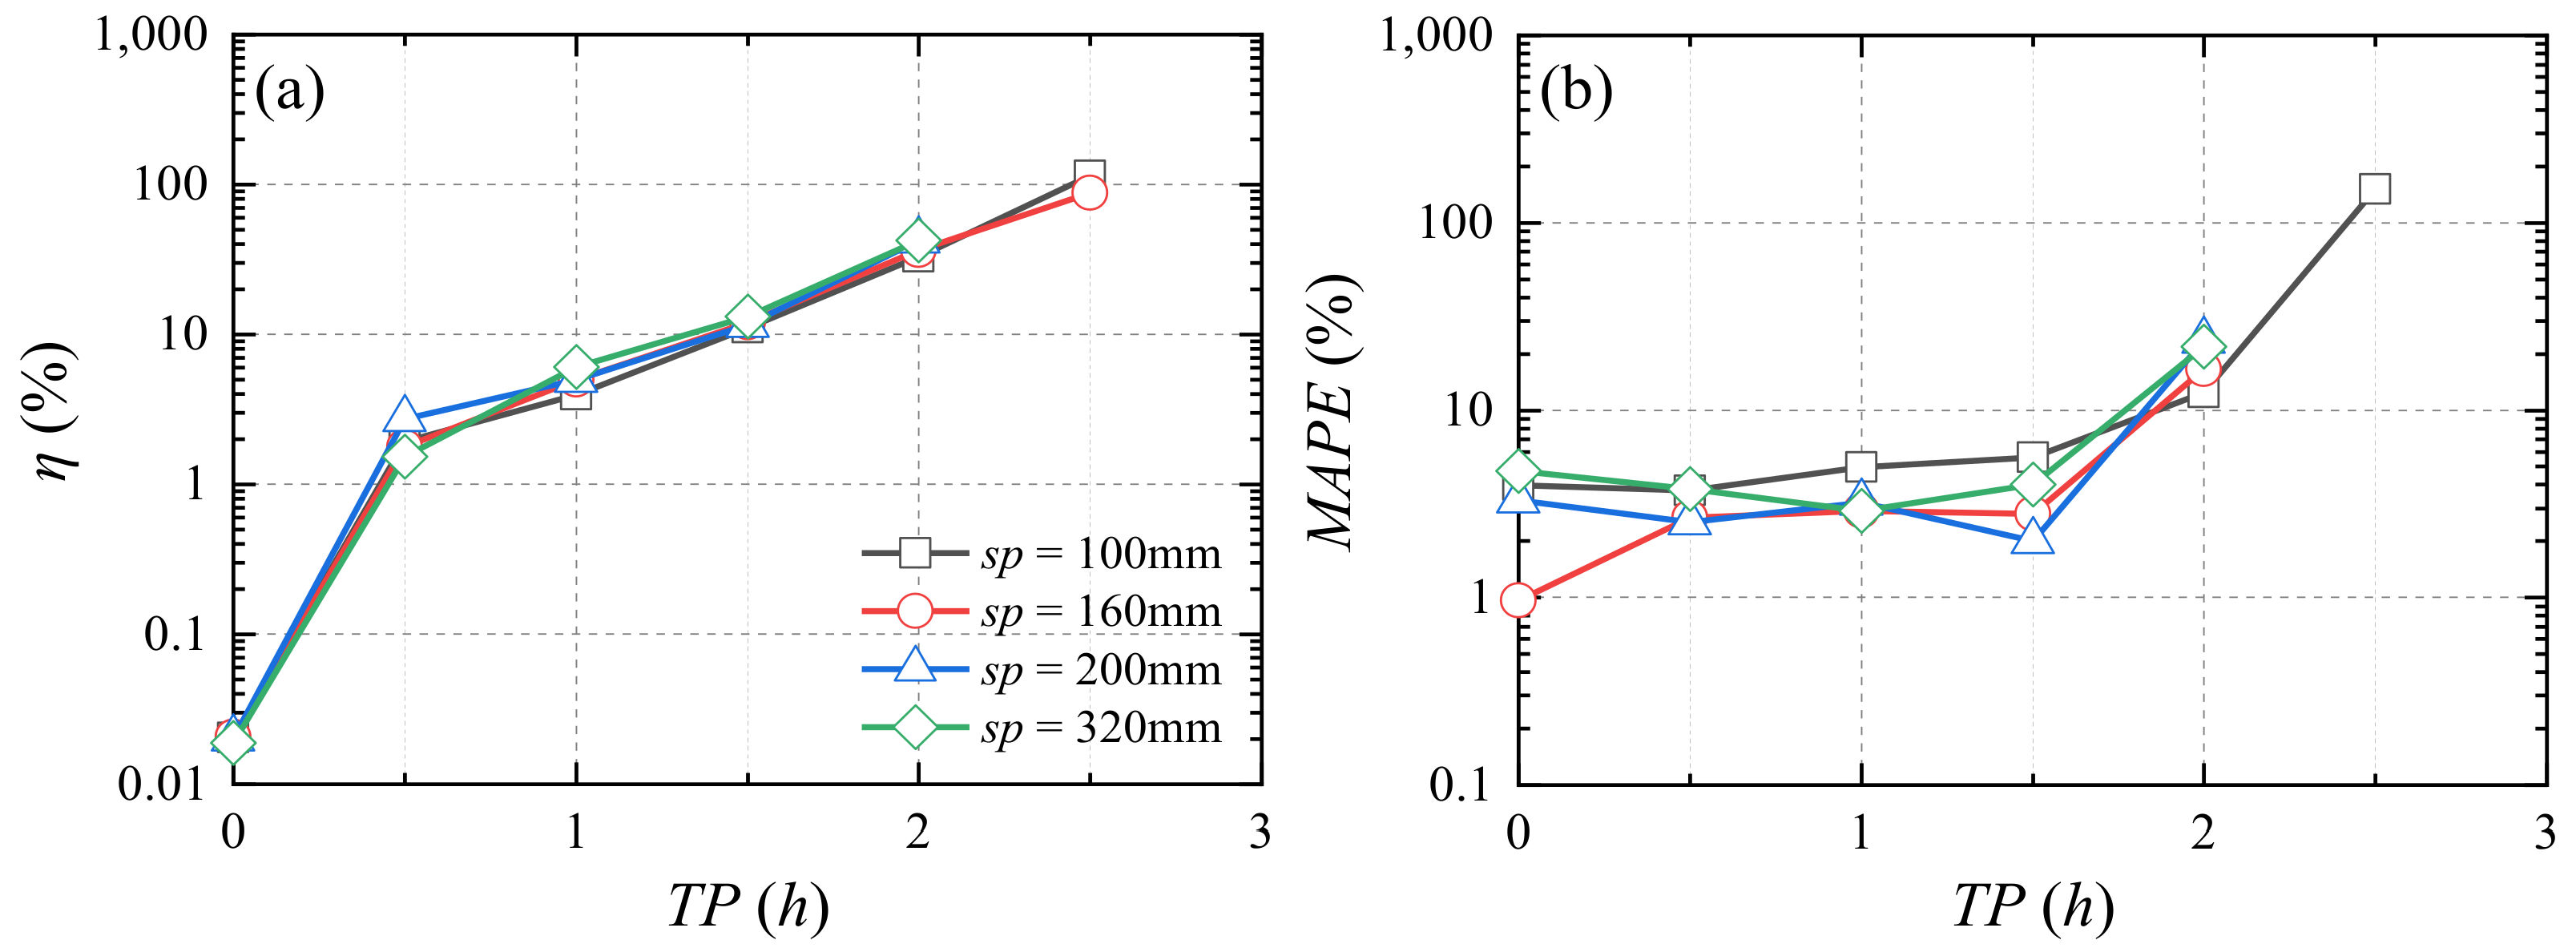
The effects of the cyclic loads on the axial deformation, stiffness, and fire resistance time of RC columns with different reinforcement ratios during fire exposure are shown in Figure 21. Because larger reinforcement ratios can supply a larger capacity to RC columns during the same fire conditions, there is a smaller effect of the cyclic load on the axial deformation, subsequent axial deformation, stiffness ratio, and fire resistance time of the RC column with larger reinforcement ratios under the cyclic load and fire exposure at the same T P .

4.4. Tie Spacing

The effects of the cyclic loads on the deformation, stiffness, and fire resistance time of RC columns with different tie spacings during fire exposure are shown in Figure 22. Under the same T P , the effects of cyclic loads on the axial deformation, subsequent axial deformation, and stiffness of RC columns with different tie spacings are not significantly different. Except for the RC column with a 100 mm tie spacing, the effect of the cyclic load on the fire resistance time ratio of RC columns with different tie spacing shows little difference, and the fire resistance time is reduced by more than 20% when the cyclic load is applied for 2.5 h. When the cyclic load is applied for 3 h, the fire resistance time of the RC column with 100 mm tie spacing decreases significantly.
Figure 21. Impact of cyclic load on the response of different longitudinal reinforcement ratio ( ρ l ) of RC column during fire exposure: (a) cyclic load effect coefficient η ; (b) M A P E ; (c) stiffness degradation ratio; (d) fire resistance time ratio.
Buildings 12 01062 g021

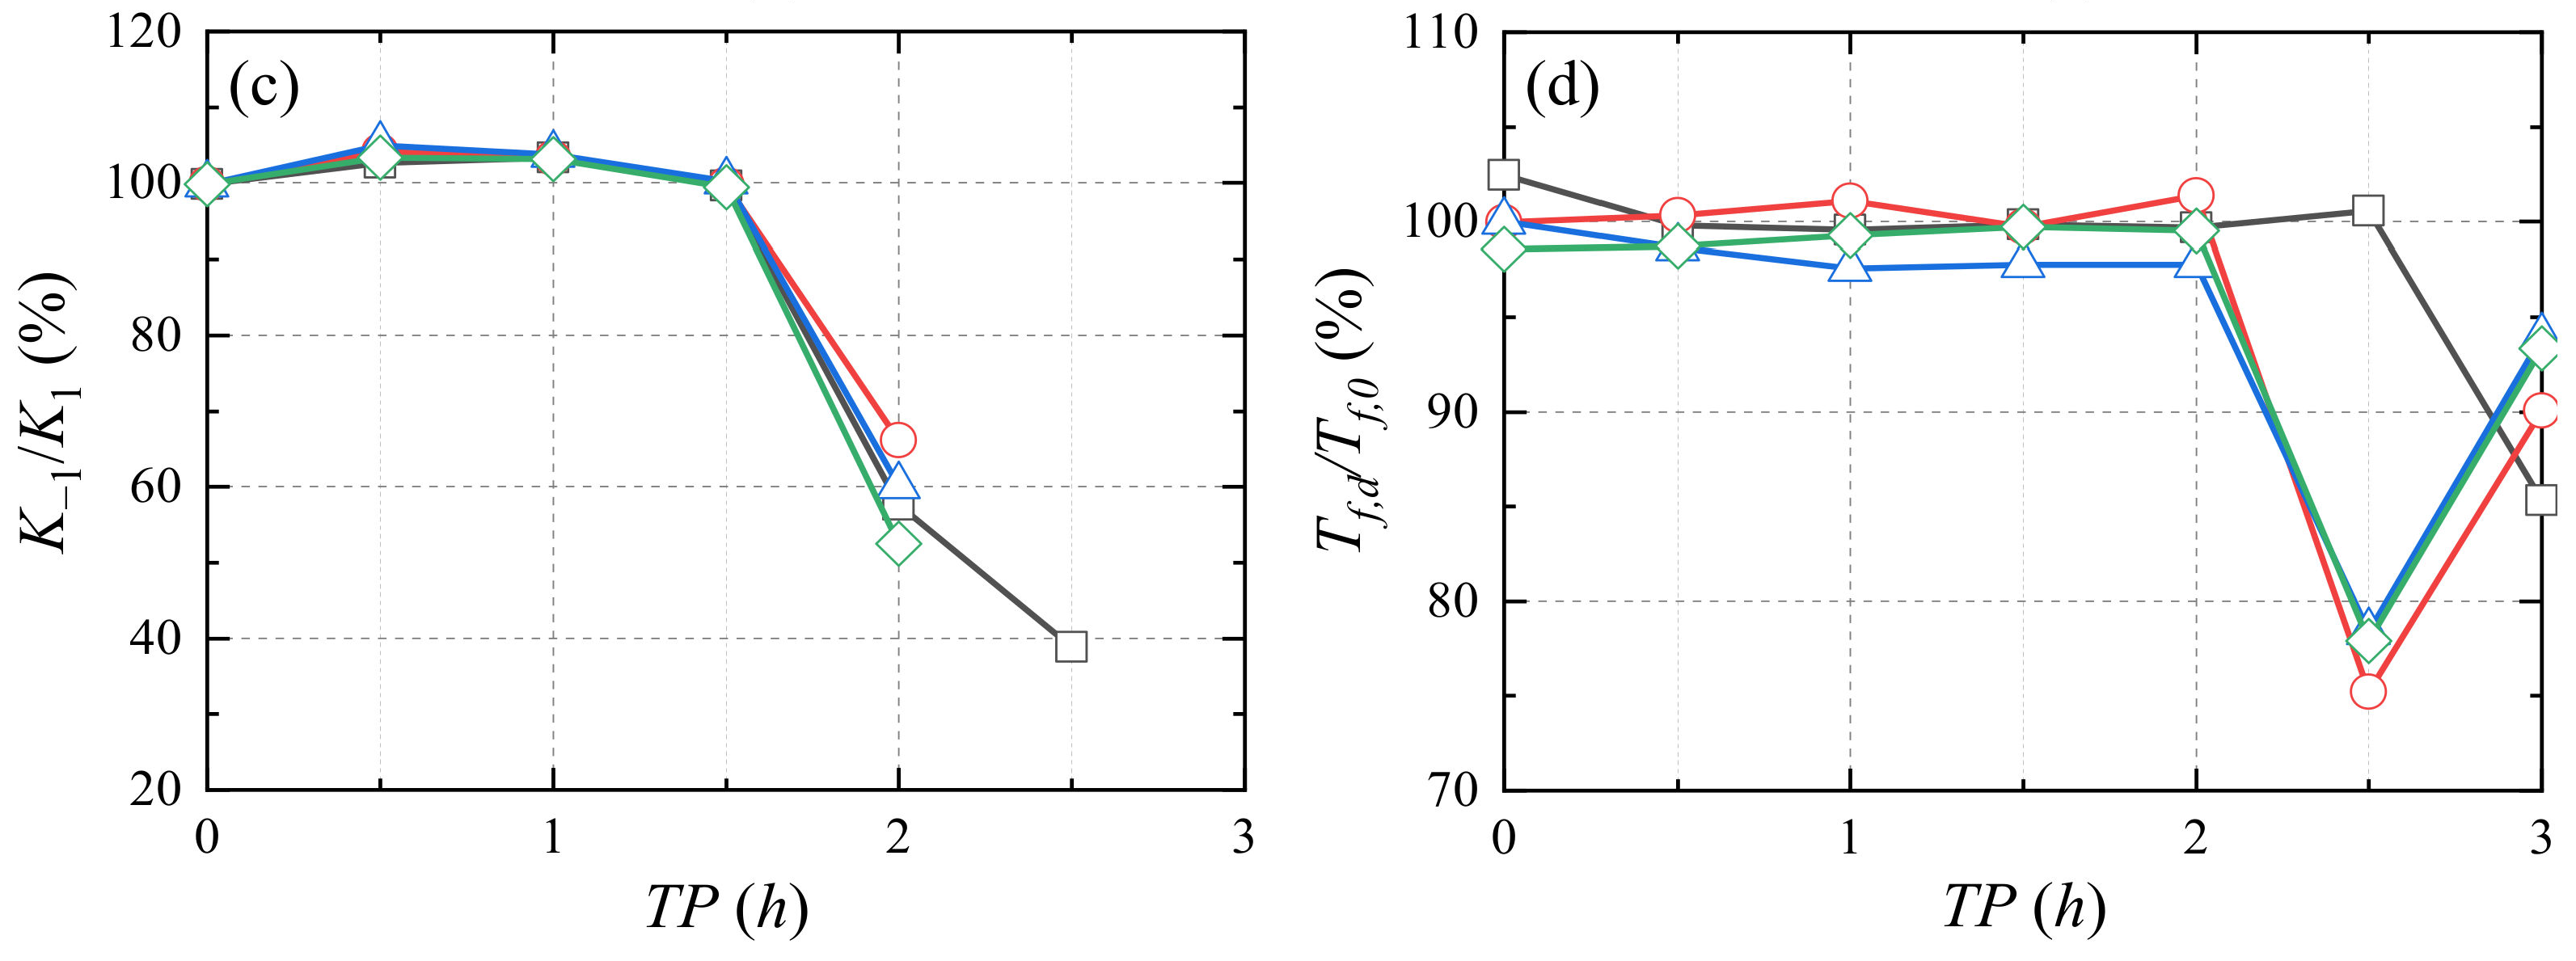
4.5. Axial Load Ratio

The effects of cyclic loads on the deformation, stiffness, and fire resistance time of RC columns with different axial compression ratios during fire exposure are shown in Figure 23. The larger the axial compression ratio, the smaller the effect of cyclic load on the axial deformation, subsequent axial deformation, stiffness, and fire resistance time of the RC column with the same T P during fire exposure. When the axial compression ratio is 0.2 and 0.3, the cyclic load has little effect on the fire resistance time of the RC column, and the fire resistance time is more than 4 h, which is significantly improved compared to the reference column.
Figure 22. Impact of cyclic load on the response of RC column with different tie spacing ( s p ) during fire exposure: (a) cyclic load effect coefficient η ; (b) M A P E ; (c) stiffness degradation ratio; (d) fire resistance time ratio.
Buildings 12 01062 g022aBuildings 12 01062 g022b

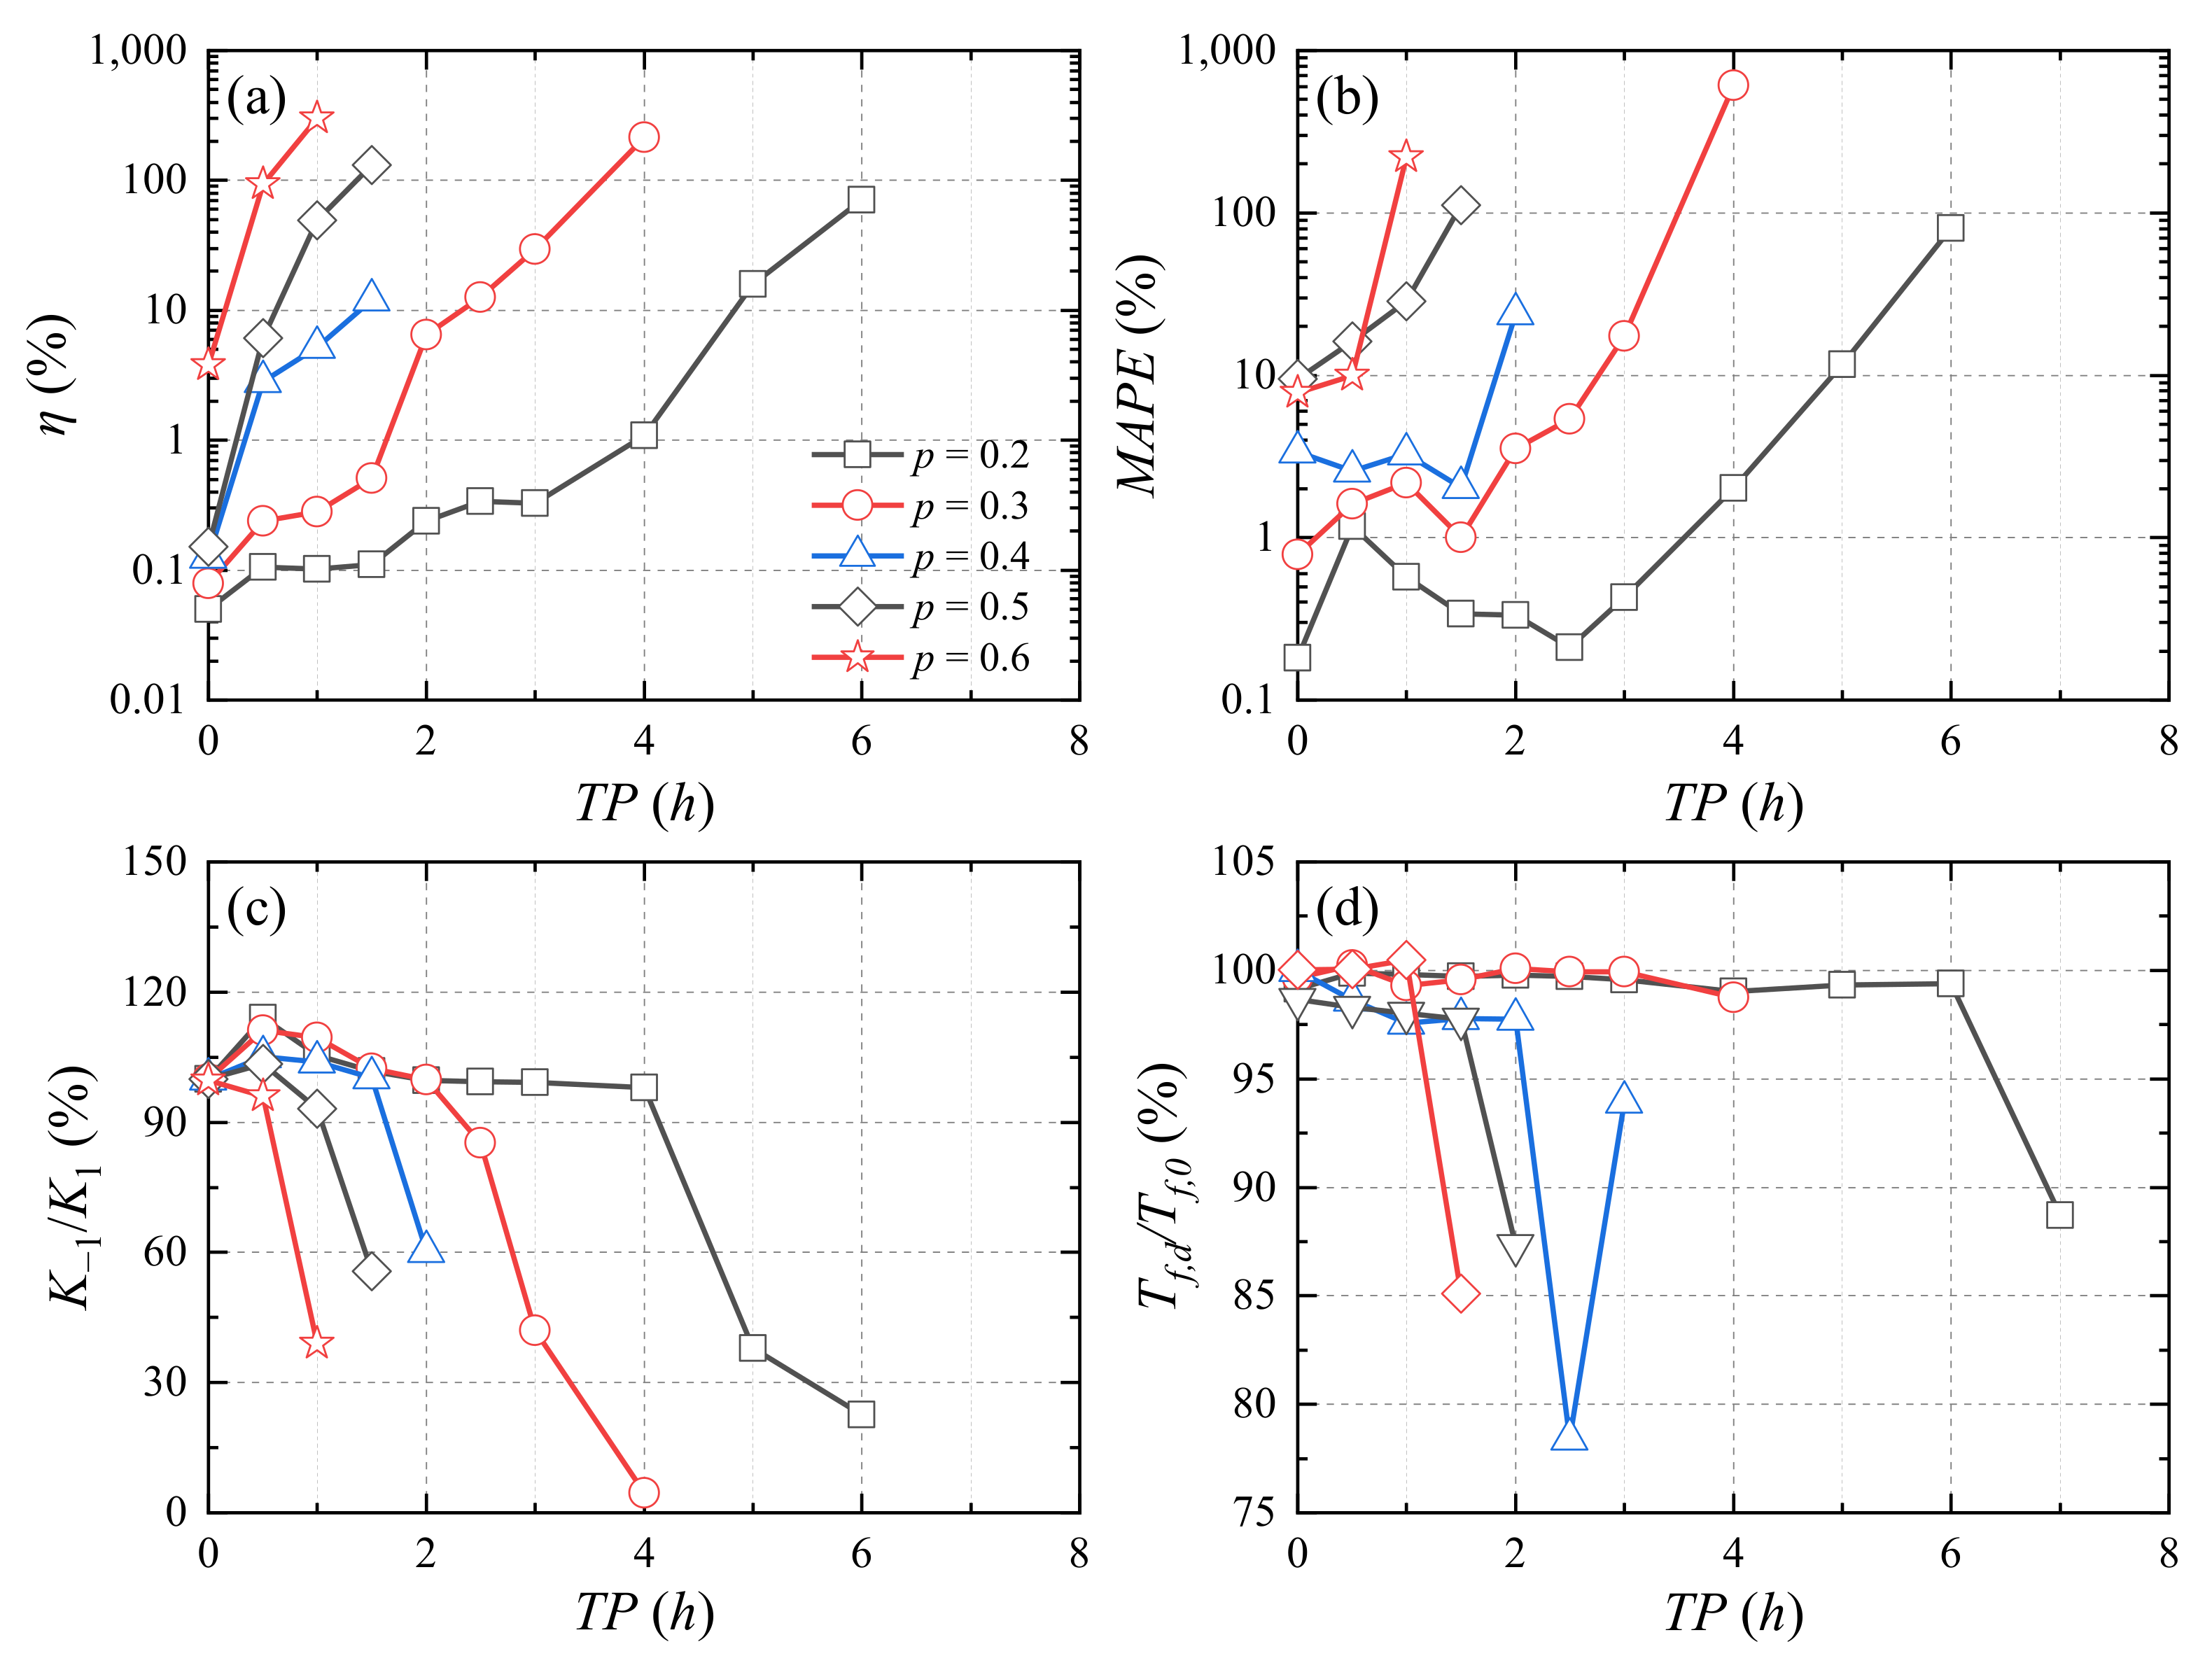
4.6. Stage Division of RC Columns under Fire and Cyclic Loads

The normalized time ratio T P / T f , 0 is obtained by comparing the cyclic load application time T P with the fire resistance time T f , 0 of the RC column of the same column characteristic, and the time-normalized data of all working conditions in Section 4.1, Section 4.2, Section 4.3, Section 4.4 and Section 4.5 are summarized to Figure 24. As seen in Figure 24, the effect of the cyclic load on the response of RC columns during fire exposure can be divided into four stages.
Figure 23. Impact of cyclic load on the response of different axial load ratio ( p ) of RC column during fire exposure: (a) cyclic load effect coefficient η ; (b) M A P E ; (c) stiffness degradation ratio; (d) fire resistance time ratio.
Buildings 12 01062 g023
The first stage is the low-impact stage, and T P / T f , 0 0 , 0.4 . In this stage, the effects of cyclic loads on the axial deformation, subsequent deformation, stiffness ratio, and fire resistance time of RC columns are predominantly within 10%. The second stage is the medium impact stage, and T P / T f , 0 0.4 , 0.6 . In this stage, the effect of the cyclic load on the axial deformation and subsequent deformation of RC columns are chiefly in the range of 1 to 100%, while the effect on the stiffness is 10~60% and the effect on the fire resistance time is slight. The third stage is the high impact stage, and T P / T f , 0 0.6 , 0.8 . In this stage, the effect of the axial deformation and subsequent deformation of RC columns are 10–1000%, the effect on the stiffness is more than 20–80%, and the effect on the fire resistance is 0–40%. The fourth stage is the failure stage, and T P / T f , 0 0.8 , 1 . In this stage, the cyclic load has a great effect (more than 100%) on the axial deformation, subsequent deformation, and stiffness of the RC column; the failure of the RC column occurs when the cyclic load is applied or after being applied for a few minutes; the fire resistance time of the RC column is about 0–15%.
When designing an RC column under cyclic load and fire exposure, we need to avoid the excessive effect of the cyclic load on the deformation and stiffness of the RC column during fire exposure. Based on the analysis of the above stages, the cyclic load should be applied during the low impact stage within the target fire resistance time ( T f , 0 ). The fire resistance time is set to T f , 0 . Taking the upper bound ( T P = 0.4 T f , 0 ) of the low impact stage, and taking the maximum T P as T f , 0 , then the minimum fire resistance time of the RC column under cyclic load is T f , 0 = 2.5 T f , 0 ; that is, the minimum fire resistance time of the RC column under cyclic load should be designed to be 2.5 times the fire resistance time under static load.
Figure 24. The effect of cyclic load on different columns during fire exposure: (a) cyclic load effect coefficient η ; (b) M A P E ; (c) stiffness degradation ratio; (d) fire resistance time ratio.
Buildings 12 01062 g024

5. Conclusions

In this study, after the FE model effectively simulated the axial deformation during fire exposure and damage morphology of RC columns after exposure to fire, multiple dynamic performances of RC columns were evaluated in the simultaneously coupling effect of fire and cyclic loads, where the deformation and damage regularity of RC columns were systematically quantified by considering different cyclic load characteristics and structural features. The main conclusions can be summarized as follows:
  • The effect of cyclic loads with different amplitudes at different time points on the deformation-time curve, stiffness degradation ratio, and fire resistance time of RC columns increase with increase in cyclic load addition time points and amplitudes. For the benchmark column, when the cyclic load application time is less than 2 h and the cyclic amplitude is less than 0.30, the cyclic load has little effect on the response of the RC column. The cyclic load with a large amplitude applied later results in buckling failure.
  • Different number of cycles have similar influences on the axial deformation, stiffness degradation ratio, the fire resistance time of RC columns during fire exposure, and axial deformation; stiffness degradation ratio of RC columns is greatly affected by the applied time point of cyclic loading.
  • The reinforcement ratio and the cover thickness have a significant effect on the deformation, stiffness degradation ratio, and fire resistance time of the reinforced concrete column. Increasing the cover thickness, the reinforcement ratio, and the section size can effectively reduce the effect of the cyclic load on the RC column during fire exposure.
  • The effect of cyclic loads on RC columns with different column characteristics during fire exposure can be divided into four stages: low impact stage, medium impact stage, high impact stage, and failure stage. To avoid the excessive deformation and stiffness of RC columns under the cyclic load and fire exposure, it is recommended that the minimum fire resistance time of RC columns under cyclic load be designed to be 2.5 times the fire resistance time under static load. The pertinent experiments will be conducted in the future.

Author Contributions

Conceptualization, Y.J. and Q.C.; methodology, Y.J.; software, Y.J.; validation, Y.J.; formal analysis, Y.J.; investigation, Y.J.; writing—original draft preparation, Y.J.; writing—review and editing, Y.J. and Q.C.; supervision, Q.C. All authors have read and agreed to the published version of the manuscript.

Funding

This research was funded by Basic Research Project of State Key Laboratory of Ministry of Science and Technology (grant number SLDRCE19A-02).

Institutional Review Board Statement

Not applicable.

Informed Consent Statement

Not applicable.

Data Availability Statement

Not applicable.

Acknowledgments

Portions of this research were conducted with the computing resources provided by Tongji University.

Conflicts of Interest

The authors declare no conflict of interest.

Nomenclature

ρ density P axial compression load
A ˜ cyclic load coefficient
c p specific heat compacity η cyclic load effect coefficient
λ thermal conductivity Δ deformation
α thermal expansion coefficient K stiffness
f strength T f fire resistance time
ε strain N o c the number of cycles
E Young’s modulus a × b section size
f t tensile strength of concrete c cover thickness
τ bond strength ρ l longitudinal reinforcement ratio
S slip s p tie spacing
d diameter of the reinforcing steel p axial load ratio
q c h convective heat transfer heat flux densitySubscript
q r h radiant heat transfer heat flux densitydunder cyclic load
q h composite heat transfer heat flux density0at ambient temperature or under static load
T w h surface temperature of the wallyyield
T f h temperature of the thermal fluiduultimate or peak
T a m ambient temperatureTat elevated temperatures
h c h convective heat transfer coefficientsreinforcing steel
ε h emissivitycconcrete or compressive
C b Stefan-Boltzmann constantAbbreviation
T temperatureRCreinforced concrete
y s simulated value T P time point
y e experimental value A amplitude
R 2 coefficient of determination M A P E Mean Absolute Percentage Error
P ˜ cyclic load h hours/hour

References

  1. Fu, B.; Jiang, H.; Wu, T. Experimental study of seismic response reduction effects of particle damper using substructure shake table testing method. Struct. Control Health Monit. 2019, 26, e2295. [Google Scholar] [CrossRef]
  2. Jiang, H.; Fu, B.; Lu, X.; Chen, L. Seismic Damage Assessment of RC Members by a Modified Park-Ang Model. Adv. Struct. Eng. 2015, 18, 353–364. [Google Scholar] [CrossRef]
  3. Cherif, S.; Chourak, M.; Abed, M.; Douiri, A. Potential Seismic Damage Assessment of Residential Buildings in Imzouren City (Northern Morocco). Buildings 2018, 8, 179. [Google Scholar] [CrossRef] [Green Version]
  4. Fujii, K. Pushover-Based Seismic Capacity Evaluation of Uto City Hall Damaged by the 2016 Kumamoto Earthquake. Buildings 2019, 9, 140. [Google Scholar] [CrossRef] [Green Version]
  5. Xiao, J.; Xie, Q.; Xie, W. Study on high-performance concrete at high temperatures in China (2004–2016)—An updated overview. Fire Saf. J. 2018, 95, 11–24. [Google Scholar] [CrossRef]
  6. Hassan, A.; Arif, M.; Shariq, M. Mechanical Behaviour and Microstructural Investigation of Geopolymer Concrete After Exposure to Elevated Temperatures. Arab. J. Sci. Eng. 2020, 45, 3843–3861. [Google Scholar] [CrossRef]
  7. Liu, Y.Z.; Jin, B.; Huo, J.S.; Li, Z. Effect of microstructure evolution on mechanical behaviour of concrete after high temperatures. Mag. Concr. Res. 2018, 70, 770–784. [Google Scholar] [CrossRef]
  8. Hertz, K.D. Concrete strength for fire safety design. Mag. Concr. Res. 2005, 57, 445–453. [Google Scholar] [CrossRef]
  9. Naser, M.Z. Heuristic machine cognition to predict fire-induced spalling and fire resistance of concrete structures. Automat. Constr. 2019, 106, 102916. [Google Scholar] [CrossRef]
  10. Liu, J.; Tan, K.H.; Yao, Y. A new perspective on nature of fire-induced spalling in concrete. Constr. Build. Mater. 2018, 184, 581–590. [Google Scholar] [CrossRef]
  11. Zhang, B.; Zhu, H.; Chen, J.; Yang, O. Evaluation of bond performance of corroded steel bars in concrete after high temperature exposure. Eng. Struct. 2019, 198, 109479. [Google Scholar] [CrossRef]
  12. Caetano, H.; Ferreira, G.; Rodrigues, J.P.C.; Pimienta, P. Effect of the high temperatures on the microstructure and compressive strength of high strength fibre concretes. Constr. Build. Mater. 2019, 199, 717–736. [Google Scholar] [CrossRef]
  13. Liu, Z.; Wang, Y.; Li, G.; Jiang, J.; Fu, C. Mechanical behavior of cross-shaped steel reinforced concrete columns after exposure to high temperatures. Fire Saf. J. 2019, 108, 102857. [Google Scholar] [CrossRef]
  14. Levenson, L.M. Residential water heater damage and fires following the Loma Prieta and Big Bear Lake earthquakes. Earthq. Spectra 1992, 8, 595–603. [Google Scholar] [CrossRef]
  15. Trifunac, M.D.; Todorovska, M.I. The Northridge, California, earthquake of 1994: Fire ignition by strong shaking. Soil Dyn. Earthq. Eng. 1998, 17, 165–175. [Google Scholar] [CrossRef]
  16. Scawthorn, C. Fire following the Northridge and Kobe earthquakes. In Proceedings of the Thirteenth Meeting of the UJNR Panel on Fire Research and Safety, Gaithersburg, MD, USA, 13–20 March 1996. [Google Scholar]
  17. Shah, A.H.; Sharma, U.K.; Bhargava, P. Outcomes of a major research on full scale testing of RC frames in post earthquake fire. Constr. Build. Mater. 2017, 155, 1224–1241. [Google Scholar] [CrossRef]
  18. Wen, B.; Wu, B.; Niu, D. Post-earthquake fire performance of reinforced concrete columns. Struct. Infrastruct. E. 2016, 12, 1106–1126. [Google Scholar] [CrossRef]
  19. Wang, J.; Zhang, X.; Kunnath, S.; He, J.; Xiao, Y. Post-Earthquake Fire Resistance and Residual Seismic Capacity of Reinforced Concrete Columns. ACI Struct. J. 2021, 118, 123–135. [Google Scholar] [CrossRef]
  20. Ni, S.; Birely, A.C. Post-fire seismic behavior of reinforced concrete structural walls. Eng. Struct. 2018, 168, 163–178. [Google Scholar] [CrossRef]
  21. Wang, Y.; Kodur, V.; Fu, C.; Liu, C.; Zhou, H.; Naser, M. Seismic Performance of Reinforced Concrete Frame Joints after Exposure to Fire. ACI Struct. J. 2021, 118, 3–14. [Google Scholar] [CrossRef]
  22. Liu, X.; Gernay, T.; Li, L.; Lu, Z. Seismic performance of post-fire reinforced concrete beam-column joints strengthened with steel haunch system. Eng. Struct. 2021, 234, 111978. [Google Scholar] [CrossRef]
  23. Lu, Z.; Chen, Y.; Li, L.; Liu, X.; Wei, K. Experimental Study on Seismic Behavior of Plane and Spatial Concrete Beam-column Joints After Exposure to Fire. J. Tongji Univ. Nat. Sci. 2020, 48, 340–348. [Google Scholar] [CrossRef]
  24. Jin, L.; Li, X.; Zhang, R.; Du, X. Meso-scale modelling the post-fire seismic behavior of RC short columns. Eng. Fail. Anal. 2021, 120, 105117. [Google Scholar] [CrossRef]
  25. Demir, U.; Goksu, C.; Binbir, E.; Ilki, A. Impact of time after fire on post-fire seismic behavior of RC columns. Structures 2020, 26, 537–548. [Google Scholar] [CrossRef]
  26. Han, L.; Zhou, K.; Tan, Q.; Song, T. Performance of steel reinforced concrete columns after exposure to fire: Numerical analysis and application. Eng. Struct. 2020, 211, 110421. [Google Scholar] [CrossRef]
  27. Chen, Y.; Chang, Y.; Yao, G.C.; Sheu, M. Experimental research on post-fire behaviour of reinforced concrete columns. Fire Saf. J. 2009, 44, 741–748. [Google Scholar] [CrossRef]
  28. Tan, K.H.; Yao, Y. Fire Resistance of Reinforced Concrete Columns Subjected to 1-, 2-, and 3-Face Heating. J. Struct. Eng. 2004, 130, 1820–1828. [Google Scholar] [CrossRef]
  29. Bengar, H.A.; Shahmansouri, A.A. Post-fire behavior of unconfined and steel tube confined rubberized concrete under axial compression. Structures 2021, 32, 731–745. [Google Scholar] [CrossRef]
  30. Jaszczak, B.; Kuczma, M.; Szymkuć, W. Comparison of the load-bearing capacity of reinforced concrete columns under fire conditions using the method A, zone method and isotherm 500 method. Fire Saf. J. 2021, 124, 103396. [Google Scholar] [CrossRef]
  31. Shah, A.H.; Sharma, U.K. Fire resistance and spalling performance of confined concrete columns. Constr. Build. Mater. 2017, 156, 161–174. [Google Scholar] [CrossRef]
  32. Pul, S.; Atasoy, A.; Senturk, M.; Hajirasouliha, I. Structural performance of reinforced concrete columns subjected to high-temperature and axial loading under different heating-cooling scenarios. J. Build. Eng. 2021, 42, 102477. [Google Scholar] [CrossRef]
  33. Saljoughian, A.; Mostofinejad, D. Grooving methods in square RC columns strengthened with longitudinal CFRP under cyclic axial compression. Eng. Struct. 2018, 174, 724–735. [Google Scholar] [CrossRef]
  34. Shao, Y.; Zhu, Z.; Mirmiran, A. Cyclic modeling of FRP-confined concrete with improved ductility. Cem. Concr. Comp. 2006, 28, 959–968. [Google Scholar] [CrossRef]
  35. Lam, L.; Teng, J.G. Stress–strain model for FRP-confined concrete under cyclic axial compression. Eng. Struct. 2009, 31, 308–321. [Google Scholar] [CrossRef]
  36. Raut, N.K.; Kodur, V.K.R. Response of High-Strength Concrete Columns under Design Fire Exposure. J. Struct. Eng. 2011, 137, 69–79. [Google Scholar] [CrossRef]
  37. Handoo, S.K.; Agarwal, S.; Agarwal, S.K. Physicochemical, mineralogical, and morphological characteristics of concrete exposed to elevated temperatures. Cem. Concr. Res. 2002, 32, 1009–1018. [Google Scholar] [CrossRef]
  38. Du, H.; Jiang, Y.; Liu, G.; Yan, R. CT image-based analysis on the defect of polypropylene fiber reinforced high-strength concrete at high temperatures. J. Wuhan Univ. Technol. Mater. Sci. Ed. 2017, 32, 898–903. [Google Scholar] [CrossRef]
  39. EN1994-1-2: 2005; Eurocode 4-Design of Composite Steel and Concrete Structures Part 1-2: General Rules—Structural Fire Design. European Committee for Standardization: Brussels, Belgium, 2005.
  40. Lie, T.T.; Irwin, R.J. Fire Resistance of Rectangular Steel Columns Filled with Bar-Reinforced Concrete. J. Struct. Eng. 1995, 121, 797–805. [Google Scholar] [CrossRef]
  41. EN1992-1-2: 2004; Eurocode 2: Design of Concrete Structures. European Committee for Standardization: Brussels, Belgium, 2004.
  42. Lee, J.; Fenves, G.L. Plastic-damage model for cyclic loading of concrete structures. J. Eng. Mech. 1998, 124, 892–900. [Google Scholar] [CrossRef]
  43. Lubliner, J.; Oliver, J.; Oñate, S.O. A plastic-damage model for concrete. Int. J. Solids Struct. 1989, 25, 299–326. [Google Scholar] [CrossRef]
  44. GB50010-2010; Code for Design of Concrete Structures. China Architecture & Building Press: Beijing, China, 2011.
  45. ANSI/AISC 360-10; Specification for Structural Steel Buildings. American Institute of Steel Construction: Chicago, IL, USA, 2010.
  46. Fu, B.; Chen, S.; Liu, X.; Feng, D. A probabilistic bond strength model for corroded reinforced concrete based on weighted averaging of non-fine-tuned machine learning models. Constr. Build. Mater. 2022, 318, 125767. [Google Scholar] [CrossRef]
  47. Özkal, F.M.; Polat, M.; Yağan, M.; Öztürk, M.O. Mechanical properties and bond strength degradation of GFRP and steel rebars at elevated temperatures. Constr. Build. Mater. 2018, 184, 45–57. [Google Scholar] [CrossRef]
  48. Bergman, T.L.; Lavine, A.S.; Incropera, F.P.; Dewitt, D.P. Introduction to Heat Transfer; John Wiley & Sons: Hoboken, NJ, USA, 2011. [Google Scholar]
  49. Kim, S.; Kim, H. A new metric of absolute percentage error for intermittent demand forecasts. Int. J. Forecast. 2016, 32, 669–679. [Google Scholar] [CrossRef]
  50. GB50011-2010; Code for Seismic Design of Buildings. China Architecture & Building Press: Beijing, China, 2010.
  51. Gernay, T. Fire resistance and burnout resistance of reinforced concrete columns. Fire Saf. J. 2019, 104, 67–78. [Google Scholar] [CrossRef]
Figure 7. FEM damage and test damage of RC column. (a) Perfect bond; (b) Bond-slip; (c) Test.
Buildings 12 01062 g007
Figure 8. Cyclic load application and boundary conditions.
Buildings 12 01062 g008
Figure 14. Stiffness degradation parameter diagram.
Buildings 12 01062 g014
Figure 18. Impact of cyclic loads with different number of cycles ( N o c ) on the response of RC column during fire exposure: (a) cyclic load effect coefficient η ; (b) M A P E ; (c) stiffness degradation ratio; (d) fire resistance time ratio.
Buildings 12 01062 g018aBuildings 12 01062 g018b
Figure 19. Impact of cyclic load on the response of different section size ( a × b ) of RC column during fire exposure: (a) cyclic load effect coefficient η ; (b) M A P E ; (c) stiffness degradation ratio; (d) fire resistance time ratio.
Buildings 12 01062 g019
Figure 20. Impact of cyclic load on the response of different cover thickness ( c ) of RC column during fire exposure: (a) cyclic load effect coefficient η ; (b) M A P E ; (c) stiffness degradation ratio; (d) fire resistance time ratio.
Buildings 12 01062 g020
Table 2. Parametric analysis of mesh size.
Approximate Mesh Size (mm)Peak
Deformation
Fire Resistance Time Calculation Time RatioConnector Generation
(mm)Err% ( h ) Err%
Test5.14-3.05---
50 × 50 ×505.8313.42 1.87−38.65 0.34 easy
40 × 40 × 505.7712.26 2.49−18.40 0.90 hard
34 × 34 × 505.7311.48 2.74−10.17 1.60 hard
25 × 25 × 506.0718.09 3.339.18 1.00 easy
20 × 20 × 506.2020.62 3.4613.61 11.73 hard
Table 3. Description of working condition.
A TP   ( h )
0.00.51.01.52.02.53.0
0.05F005T00F005T05F005T10F005T15F005T20F005T25F005T30
0.10F010T00F010T05F010T10F010T15F010T20F010T25F010T30
0.15F015T00F015T05F015T10F015T15F015T20F015T25F015T30
0.20F020T00F020T05F020T10F020T15F020T20F020T25F020T30
0.30F030T00F030T05F030T10F030T15F030T20F030T25F030T30
0.40F040T00F040T05F040T10F040T15F040T20F040T25F040T30
Table 4. Column characteristic and fire resistance time.
DescriptionSection Size
a × b (mm)
Cover
Thickness
c
(mm)
Longitudinal
Reinforcement
Ratio ρ l
Tie
Spacing
sp (mm)
Axial Load Ratio
p
Fire
Resistance Time (h)
Reference
column
203.0 × 203.0503.05%2000.43.20
a × b 304.5 × 304.5503.05%2000.44.63
406.0 × 406.0503.05%2000.49.97
c 203.0 × 203.0303.05%2000.41.89
203.0 × 203.0403.05%2000.42.86
ρ l 203.0 × 203.0500.76%2000.40.86
203.0 × 203.0501.72%2000.42.08
203.0 × 203.0502.47%2000.42.81
203.0 × 203.0504.76%2000.44.57
s p 203.0 × 203.0403.05%1000.43.52
203.0 × 203.0403.05%1600.43.33
203.0 × 203.0403.05%3200.43.22
p 203.0 × 203.0503.05%2000.27.90
203.0 × 203.0503.05%2000.34.87
203.0 × 203.0503.05%2000.52.29
203.0 × 203.0503.05%2000.61.77
Publisher’s Note: MDPI stays neutral with regard to jurisdictional claims in published maps and institutional affiliations.

