
Morphological Evolution of Passive Soil Arch in Front of Horizontal Piles in Three Dimensions

Abstract
:1. Introduction
- (1)
- Direct observation, as demonstrated by Jiang [11] and Dou [12], or scanning and observing the interior of soil using novel methods and technologies, as demonstrated by Jin [13] who used infrared imaging technology to study the soil arching effect from an energy perspective and Chen [14] who used transparent soil technology. This strategy is only appropriate for qualitative analysis; it is not appropriate for reasonable quantitative research.
- (2)
- (3)
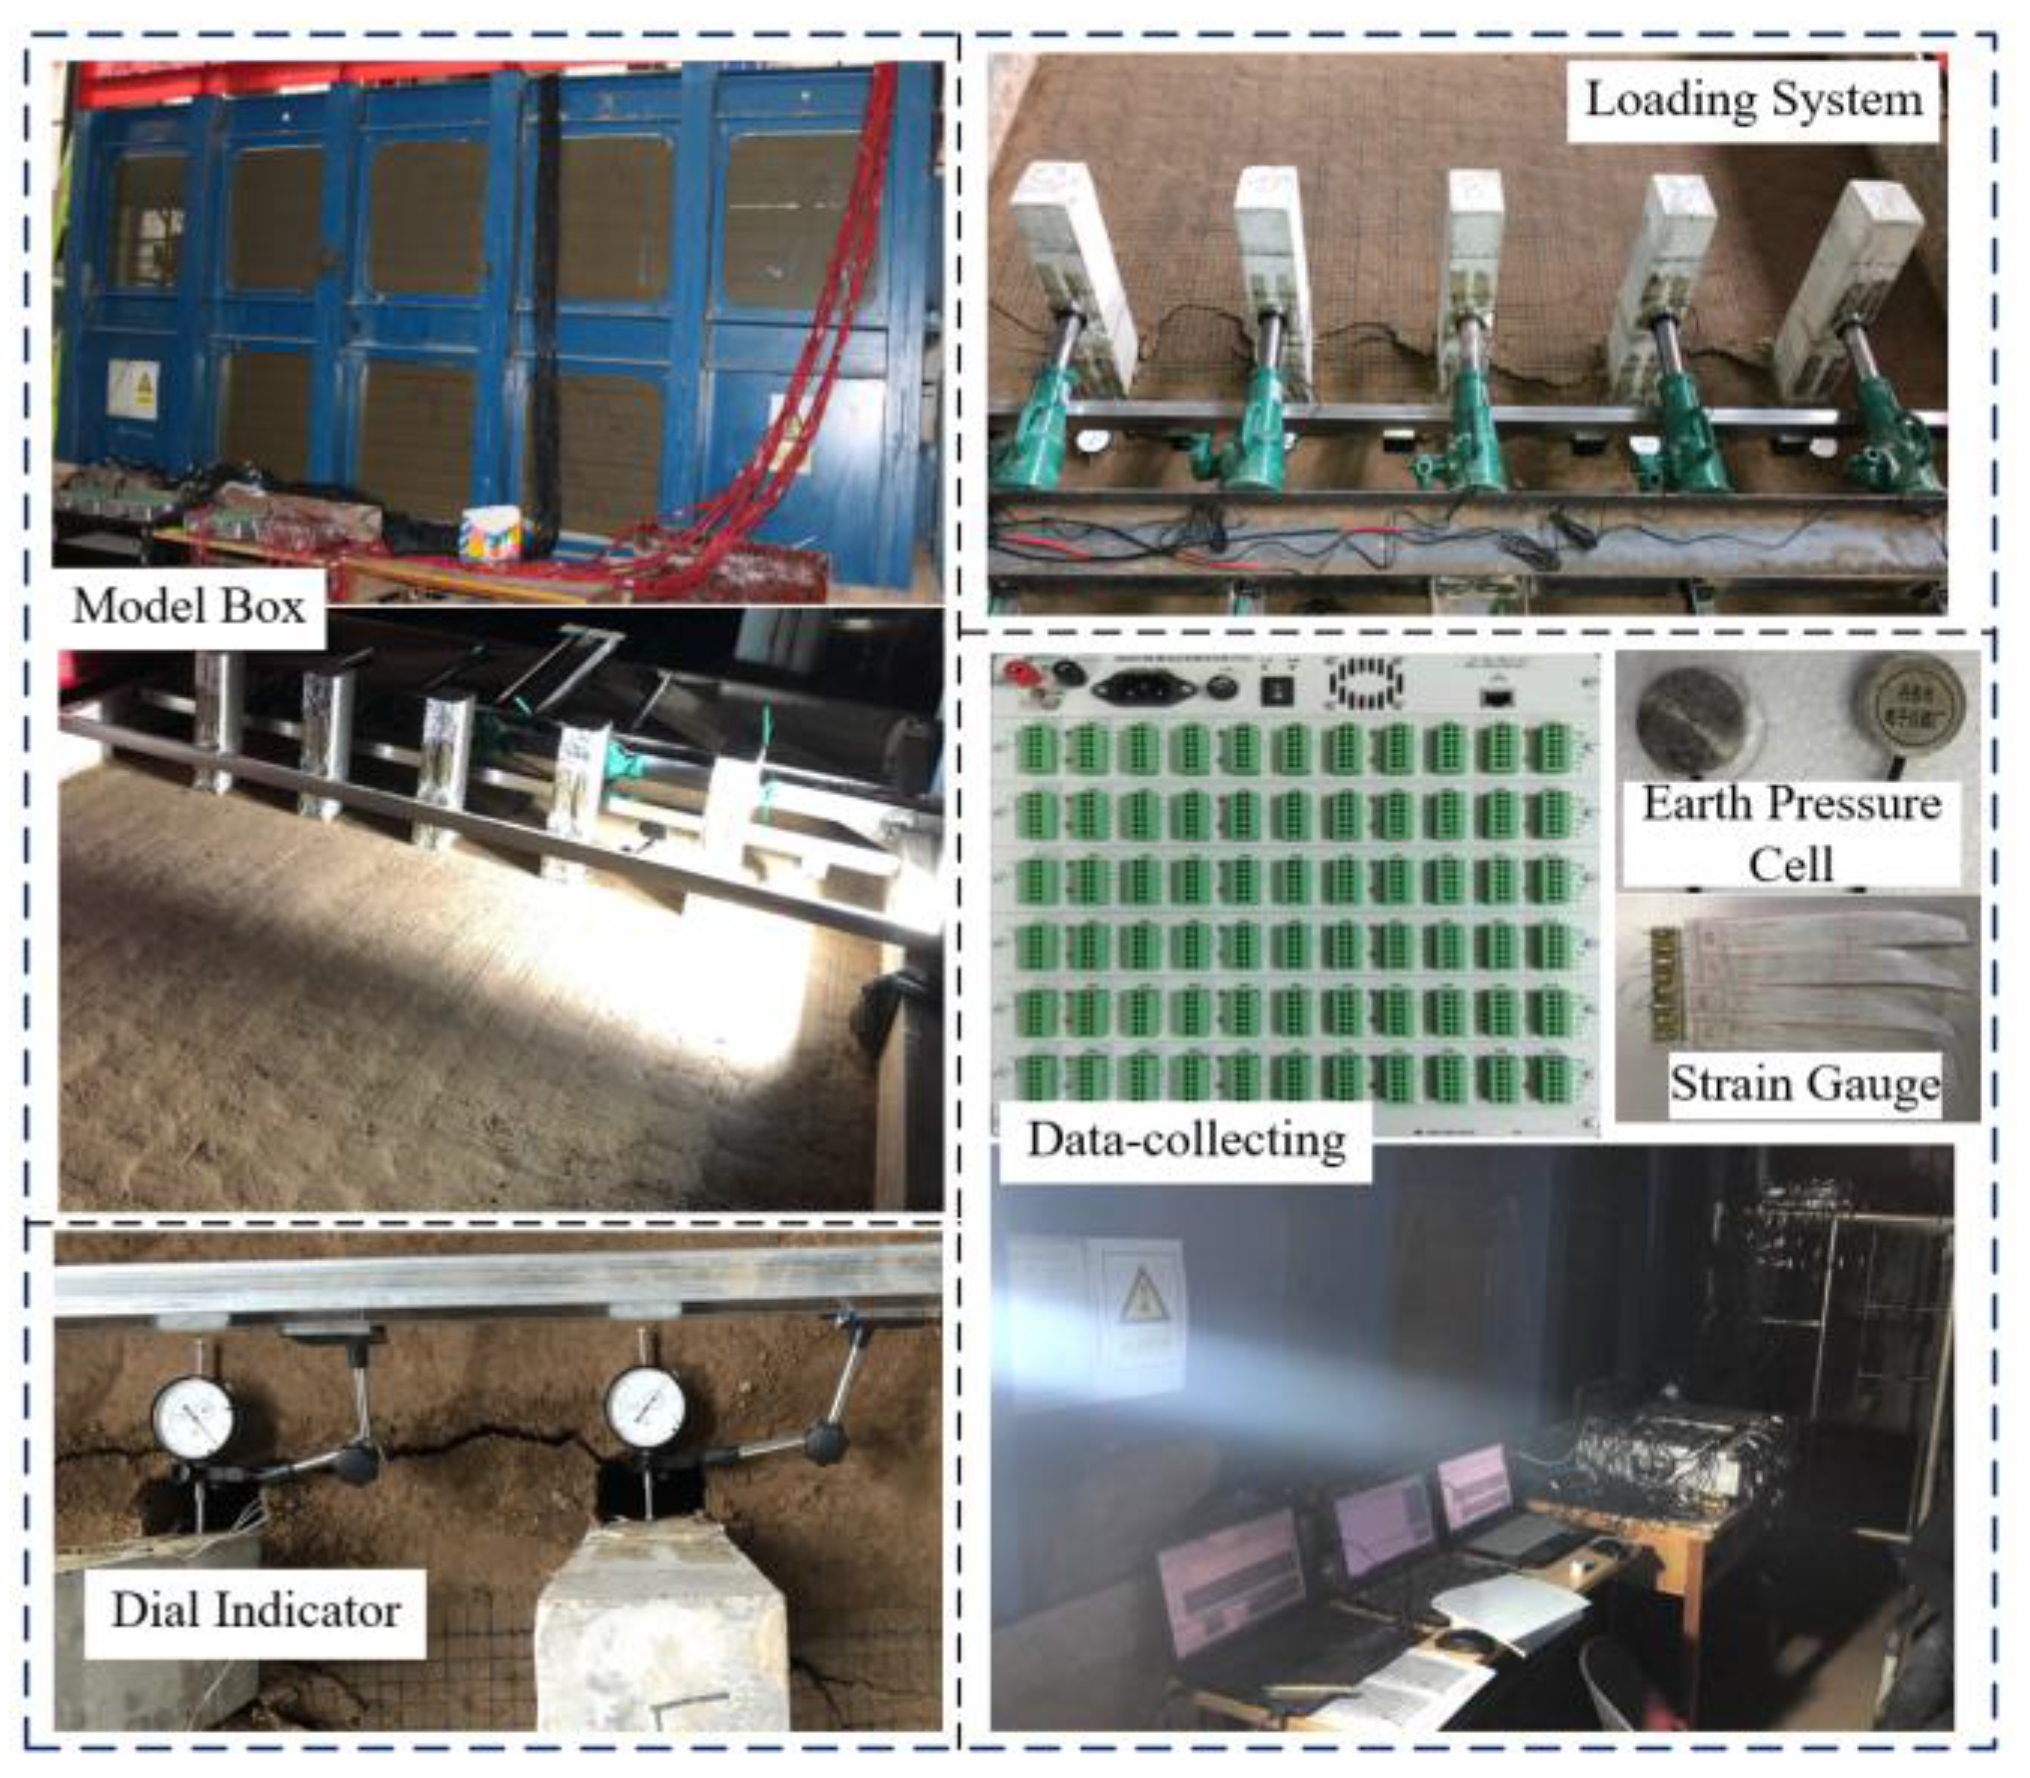
2. Experimentation
2.1. Model Similarity Ratio
2.2. Model Materials
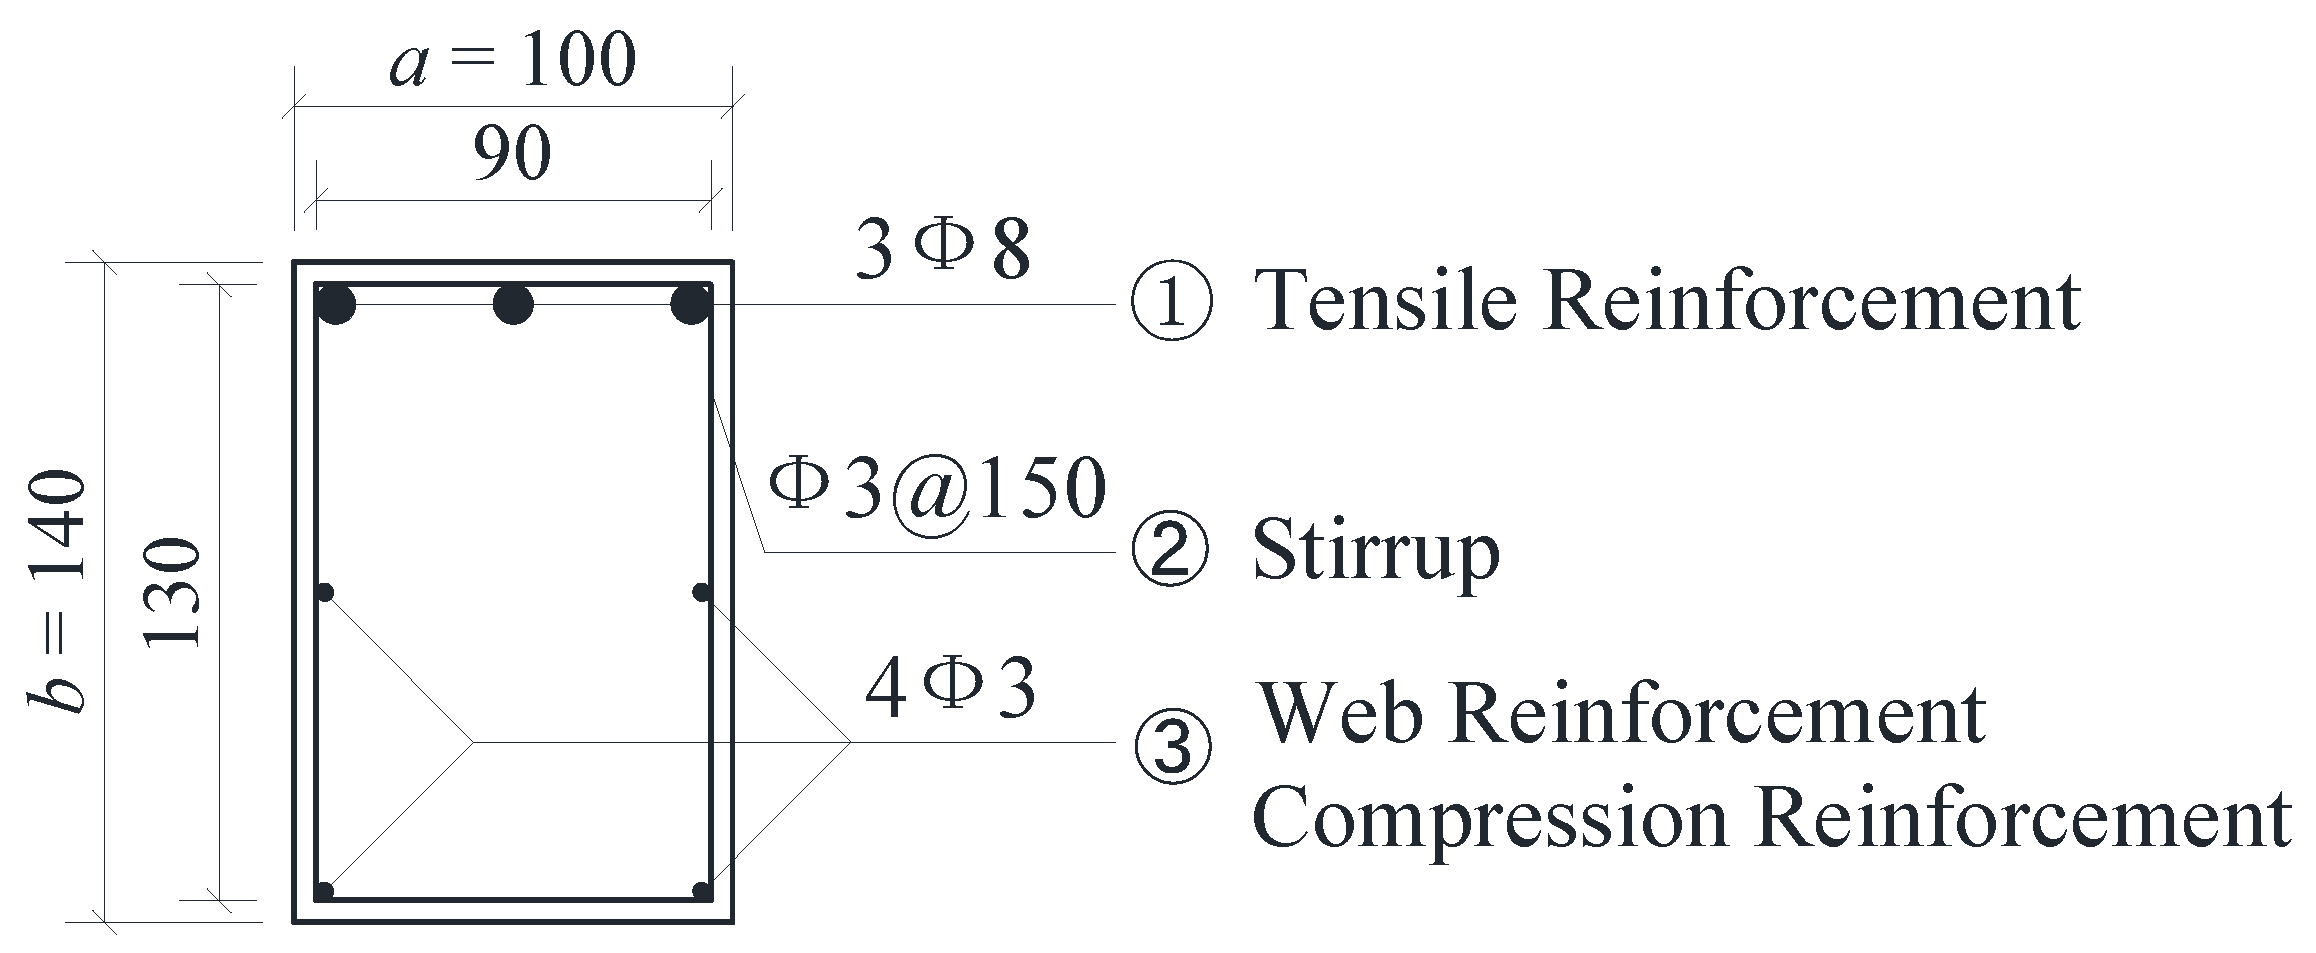
2.2.1. Model Piles
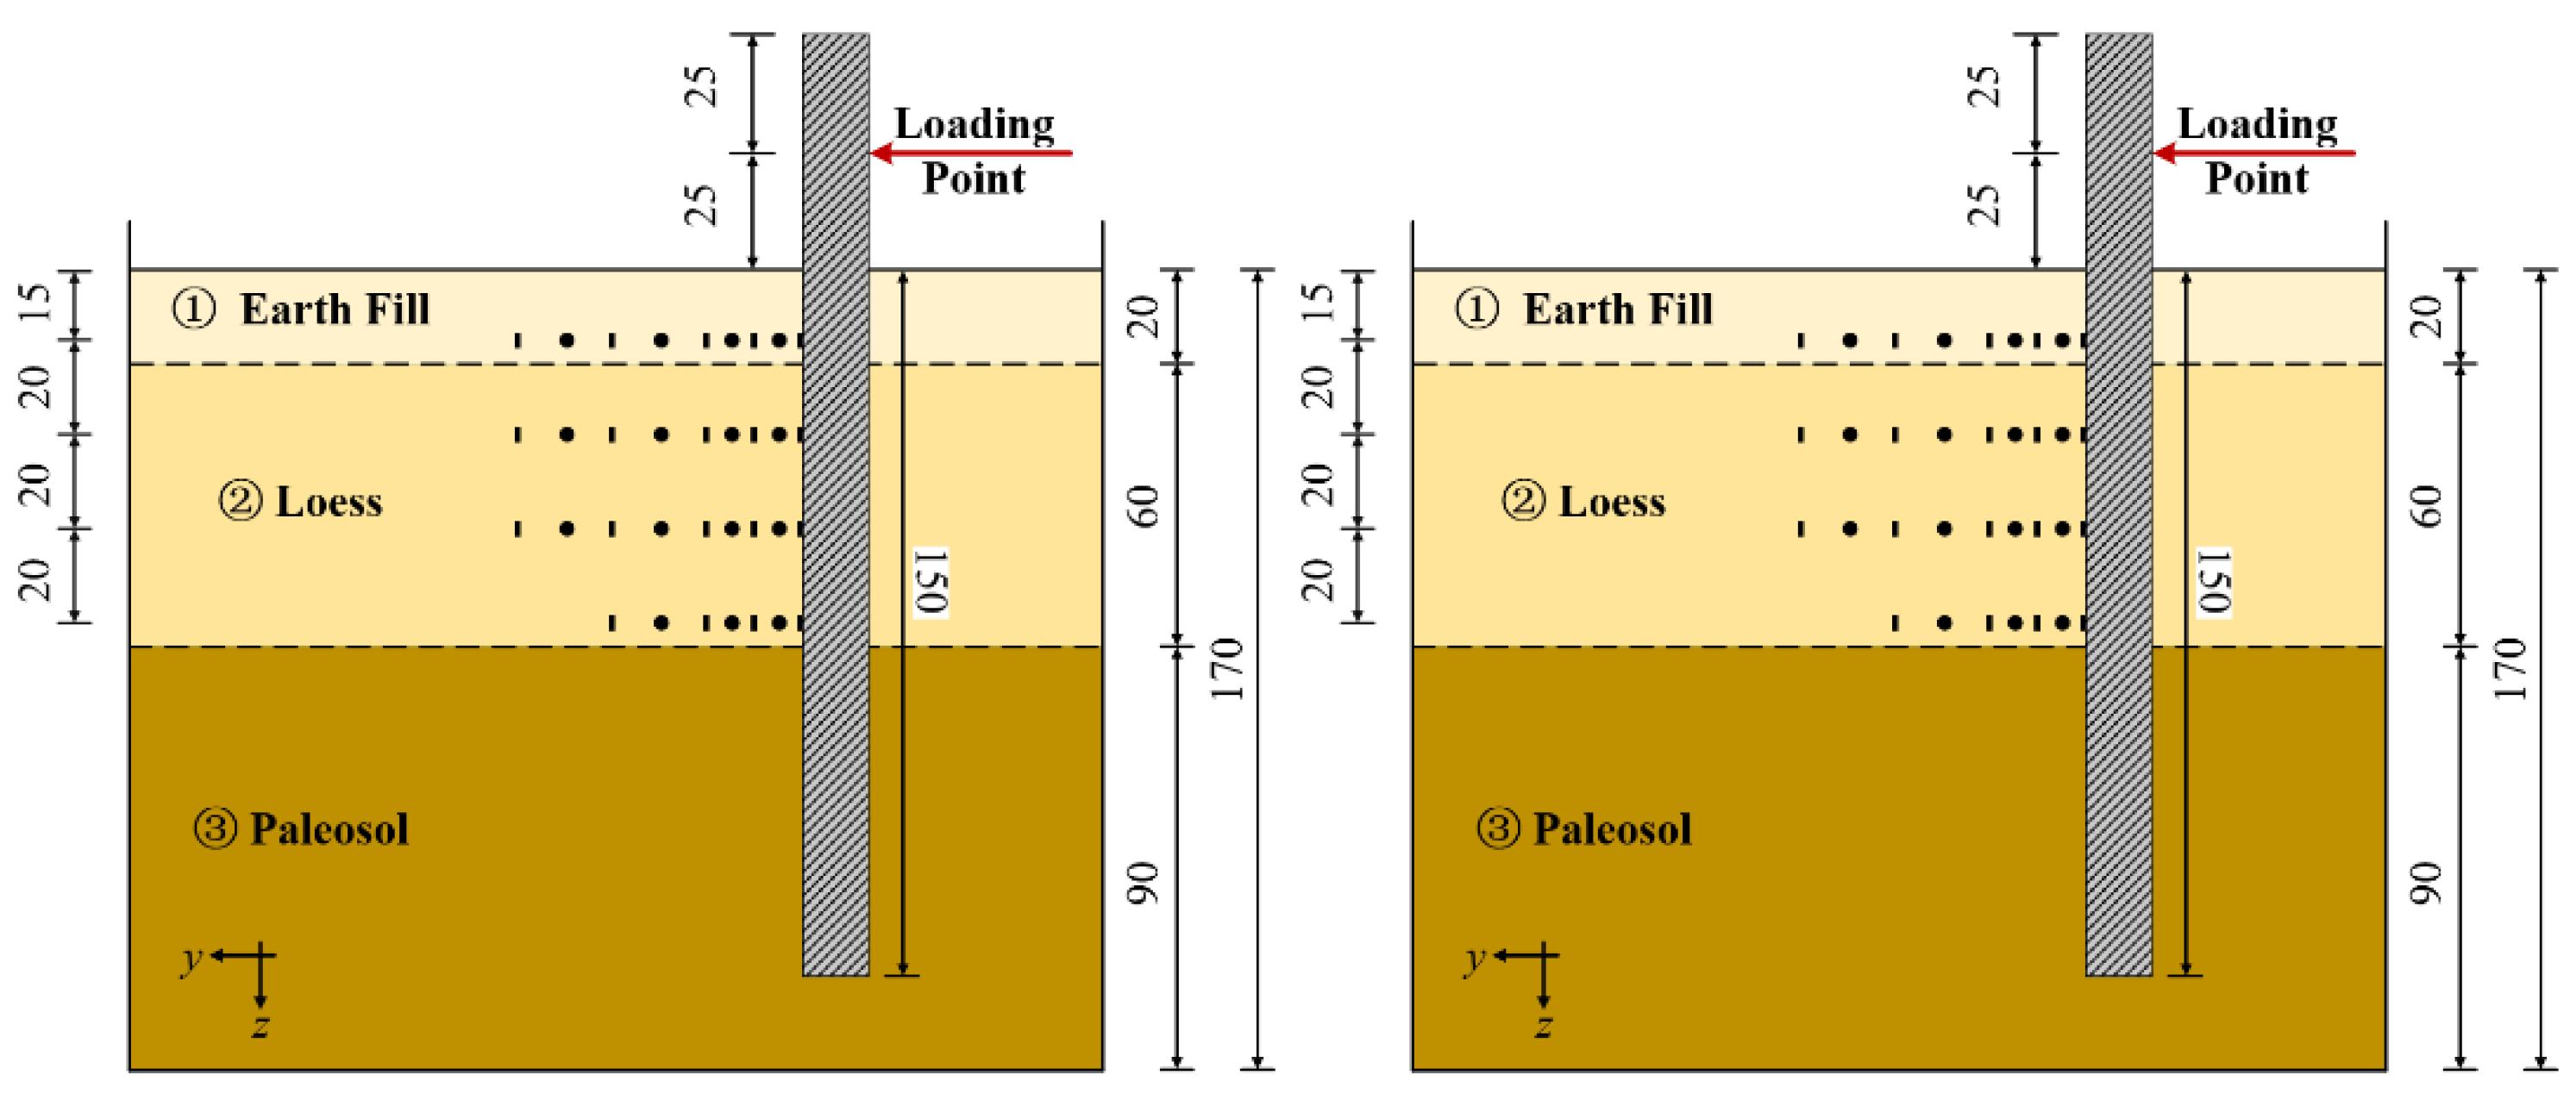
2.2.2. Model Soil
2.3. Sensors Arrangement
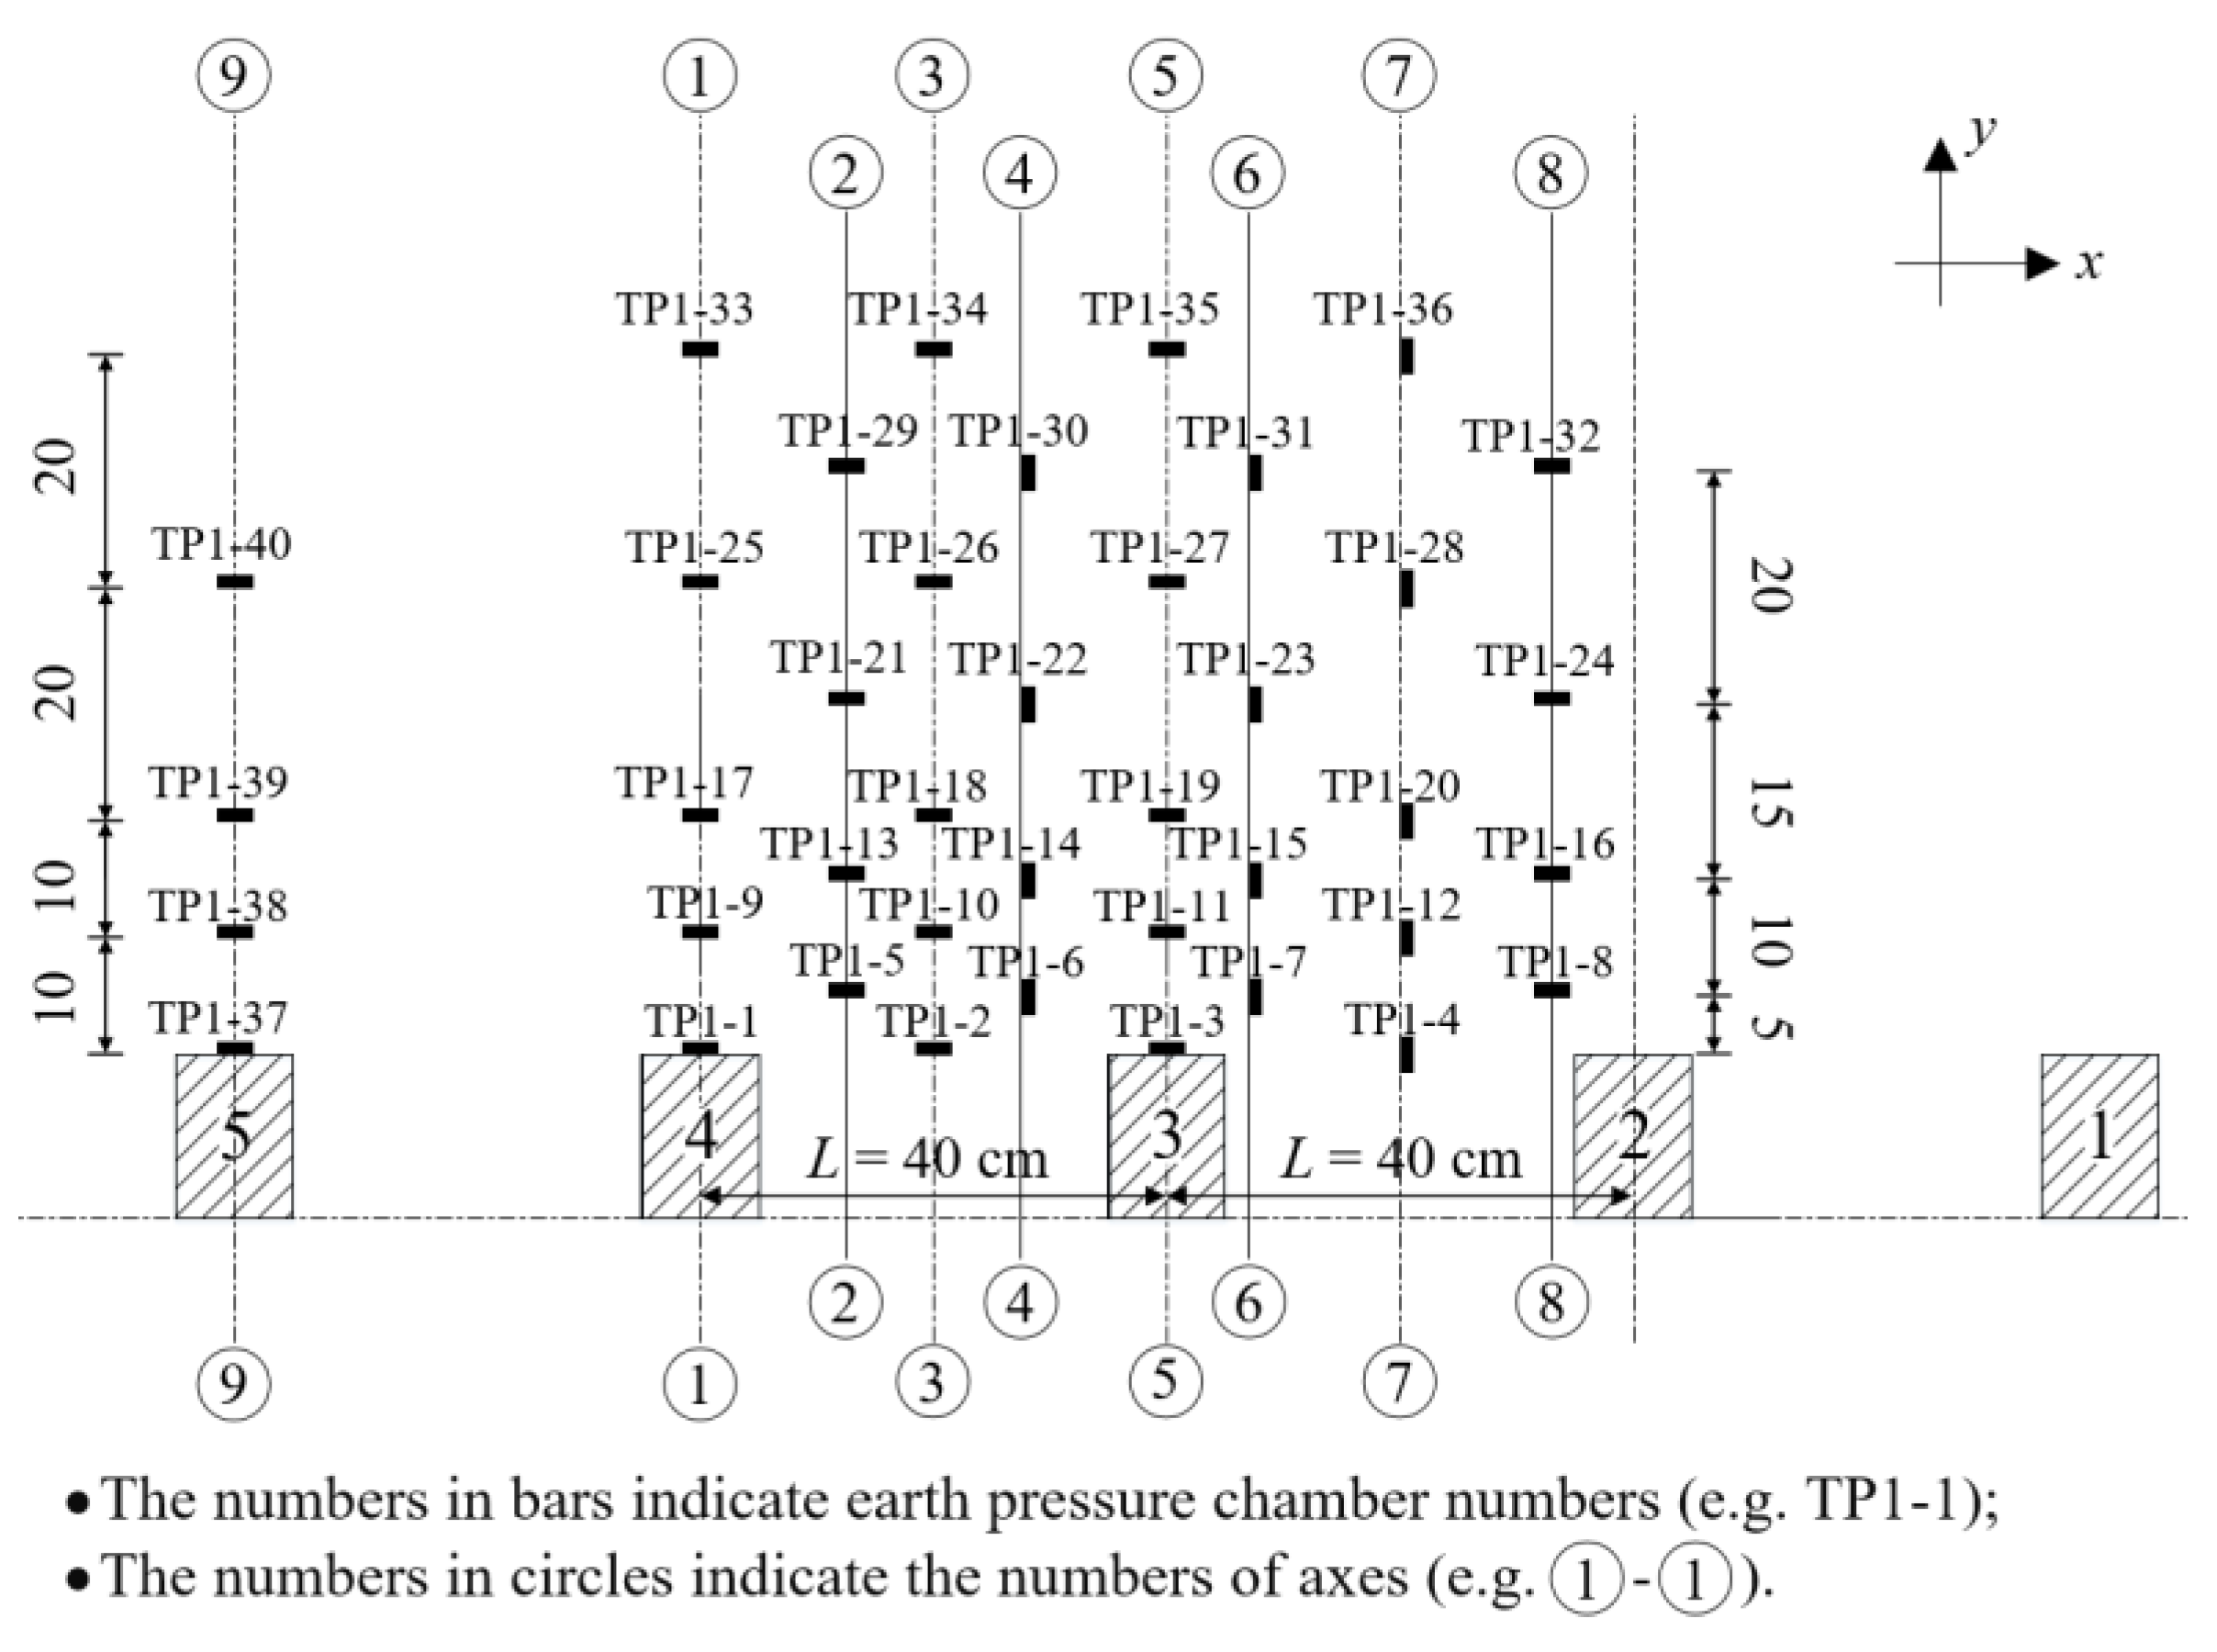
2.3.1. Layout of Earth Pressure Cells
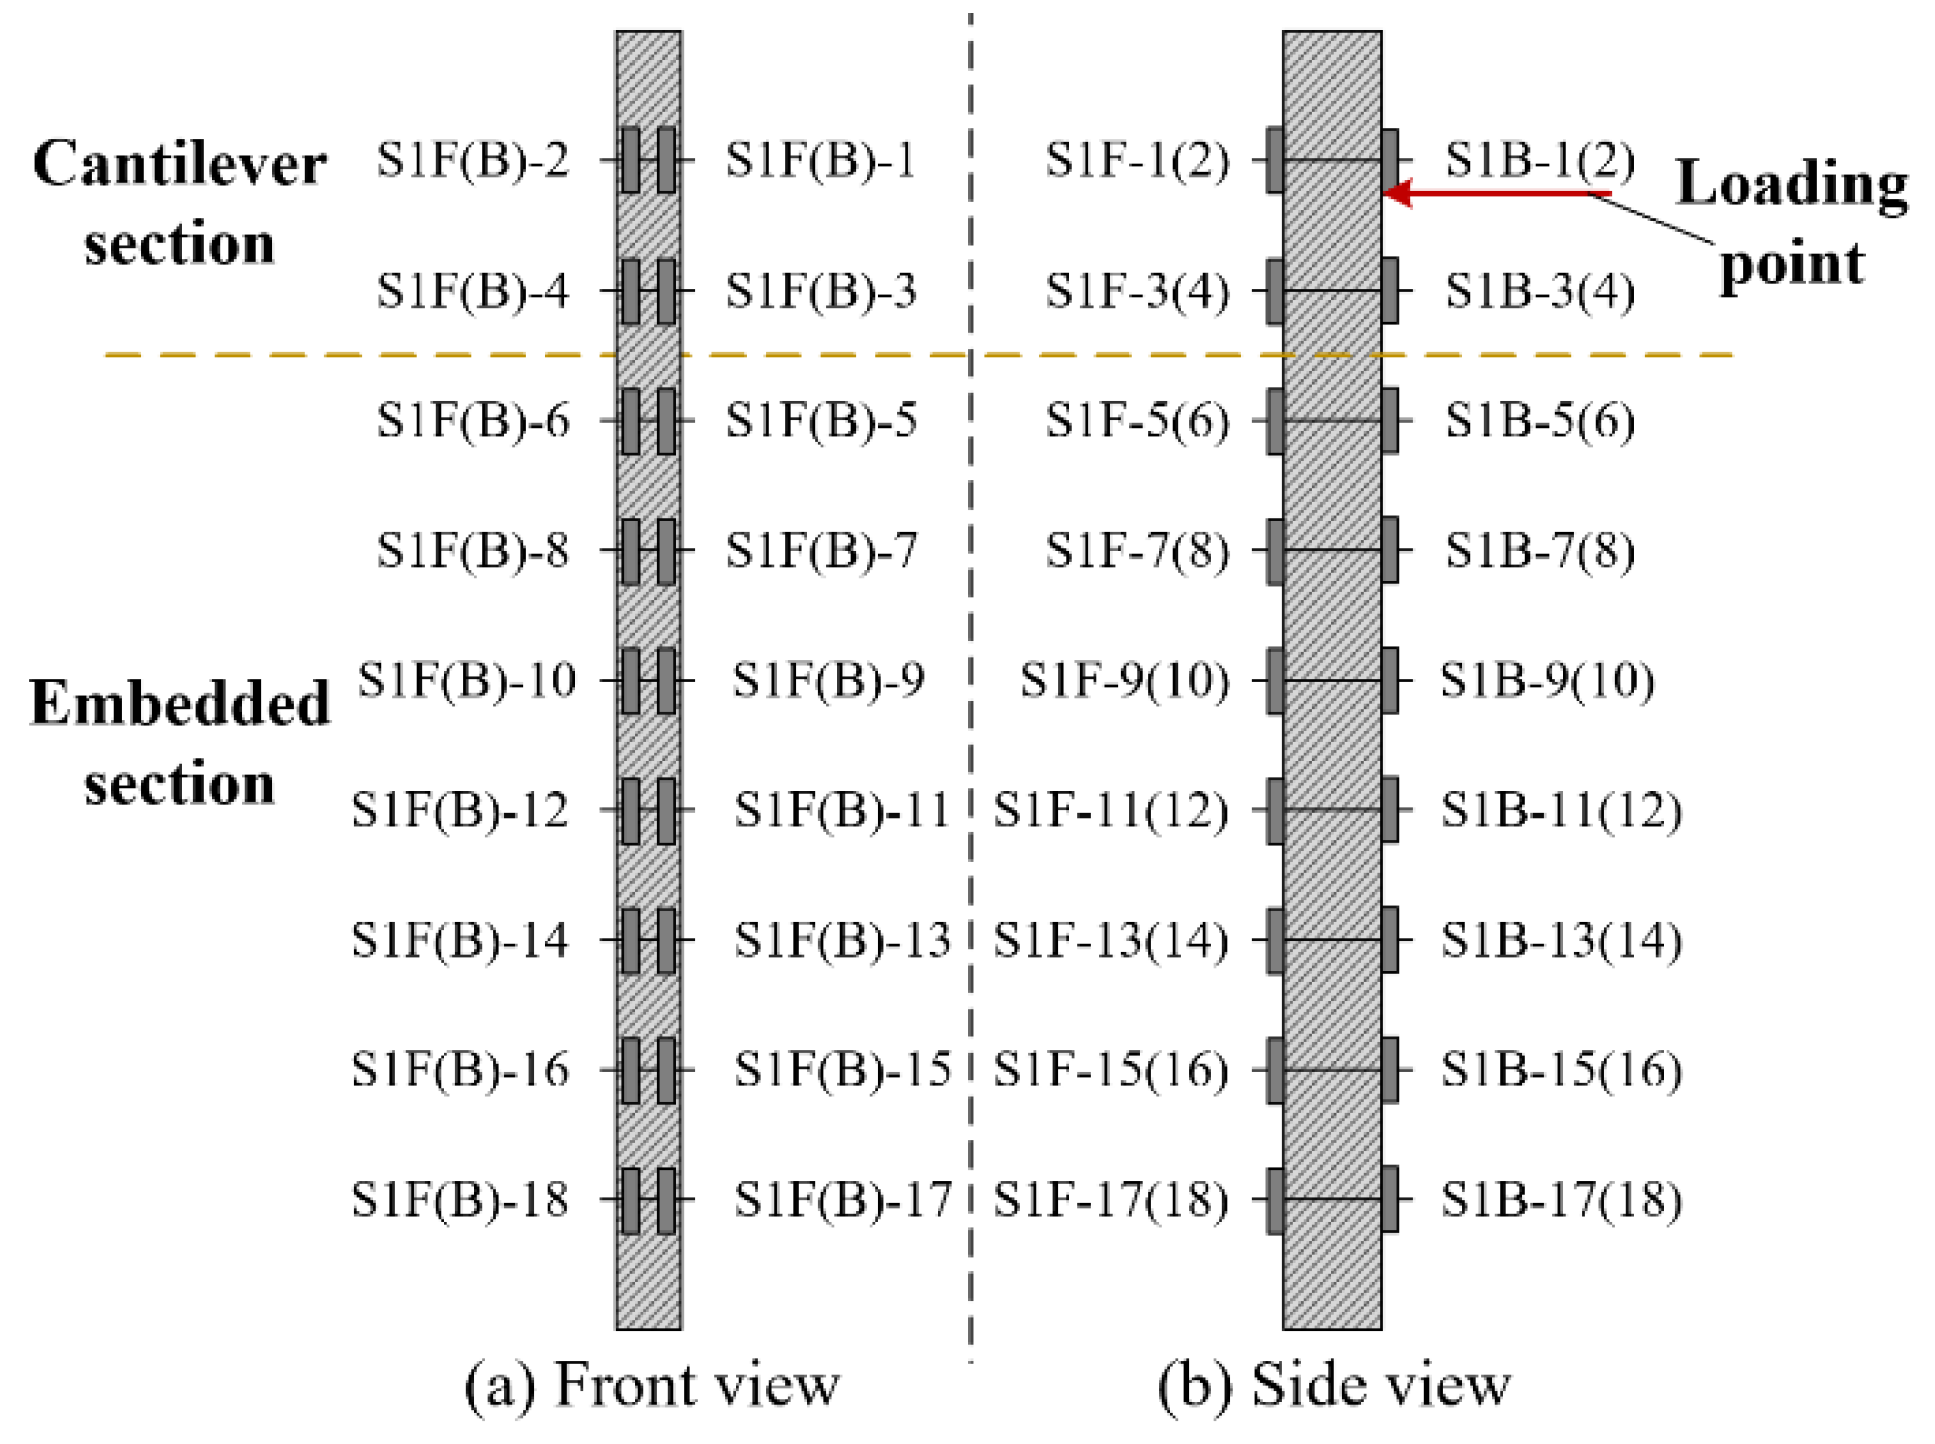
2.3.2. Layout of Strain Gauges
2.4. Loading and Data Collection Schemes
- (1)
- The 0.1 mm preload was used as the initial state of the test, 30 min after the data acquisition instrument’s data balance;
- (2)
- Each stage was loaded with 0.5 mm, and data were collected after 30 min of static loading until δ = 10 mm;
- (3)
- Each stage was loaded with 1 mm, and data were collected after 45 min until δ = 40 mm;
- (4)
- Each stage was loaded with 2 mm, and data were collected after standing for 80 min until δ = 70 mm.
3. Analysis of Test Results
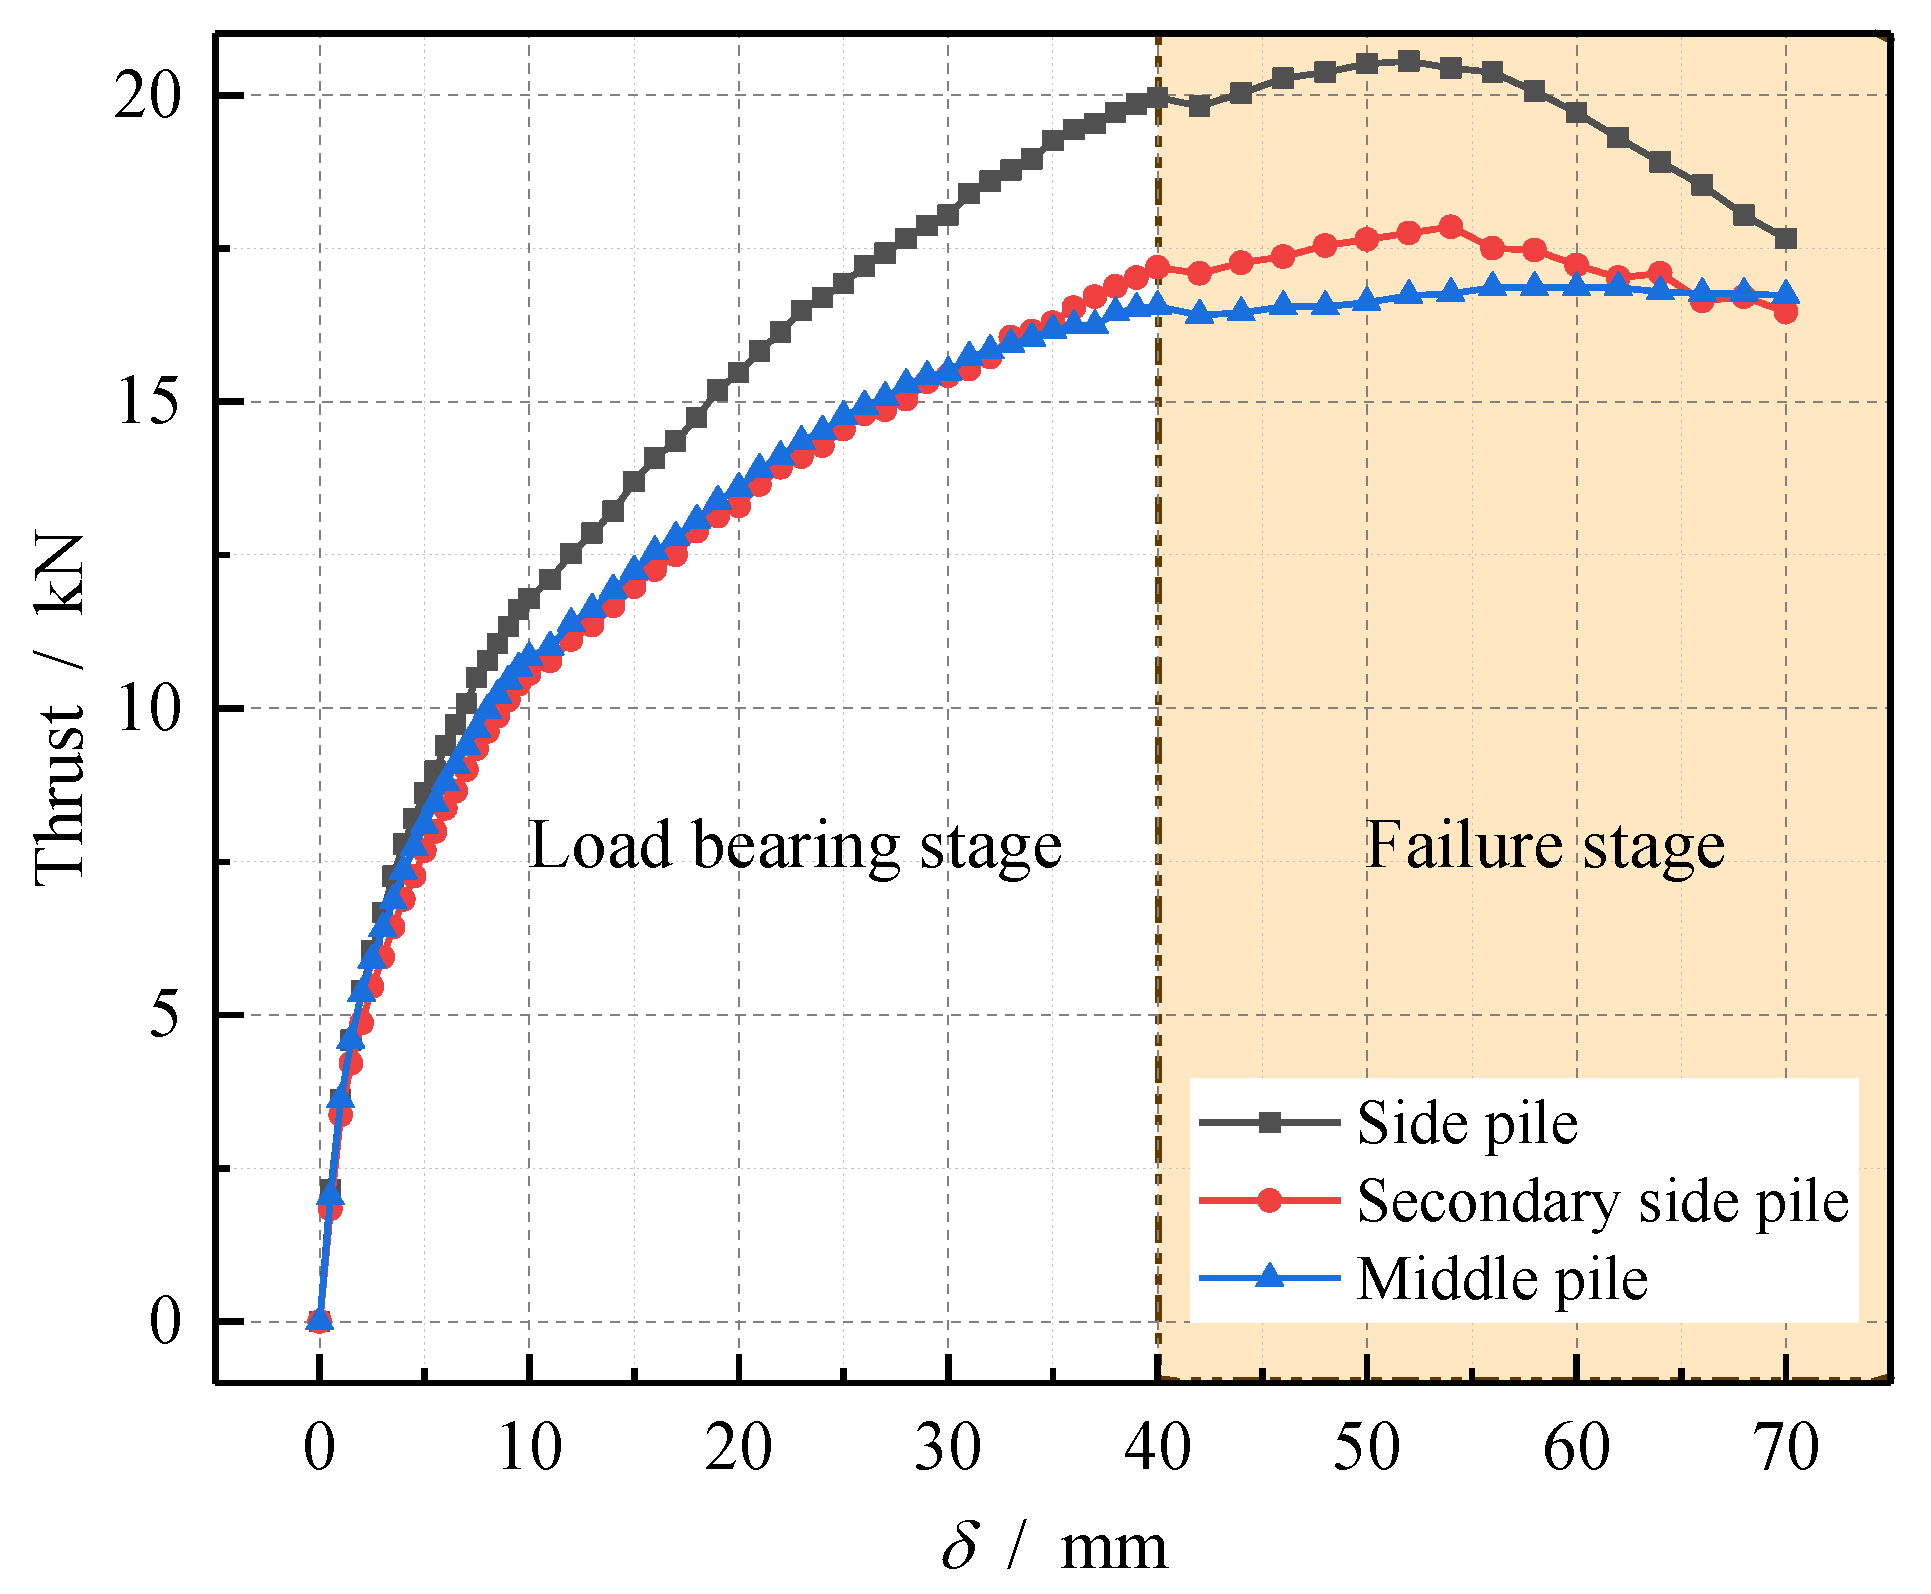
3.1. Horizontal Thrust
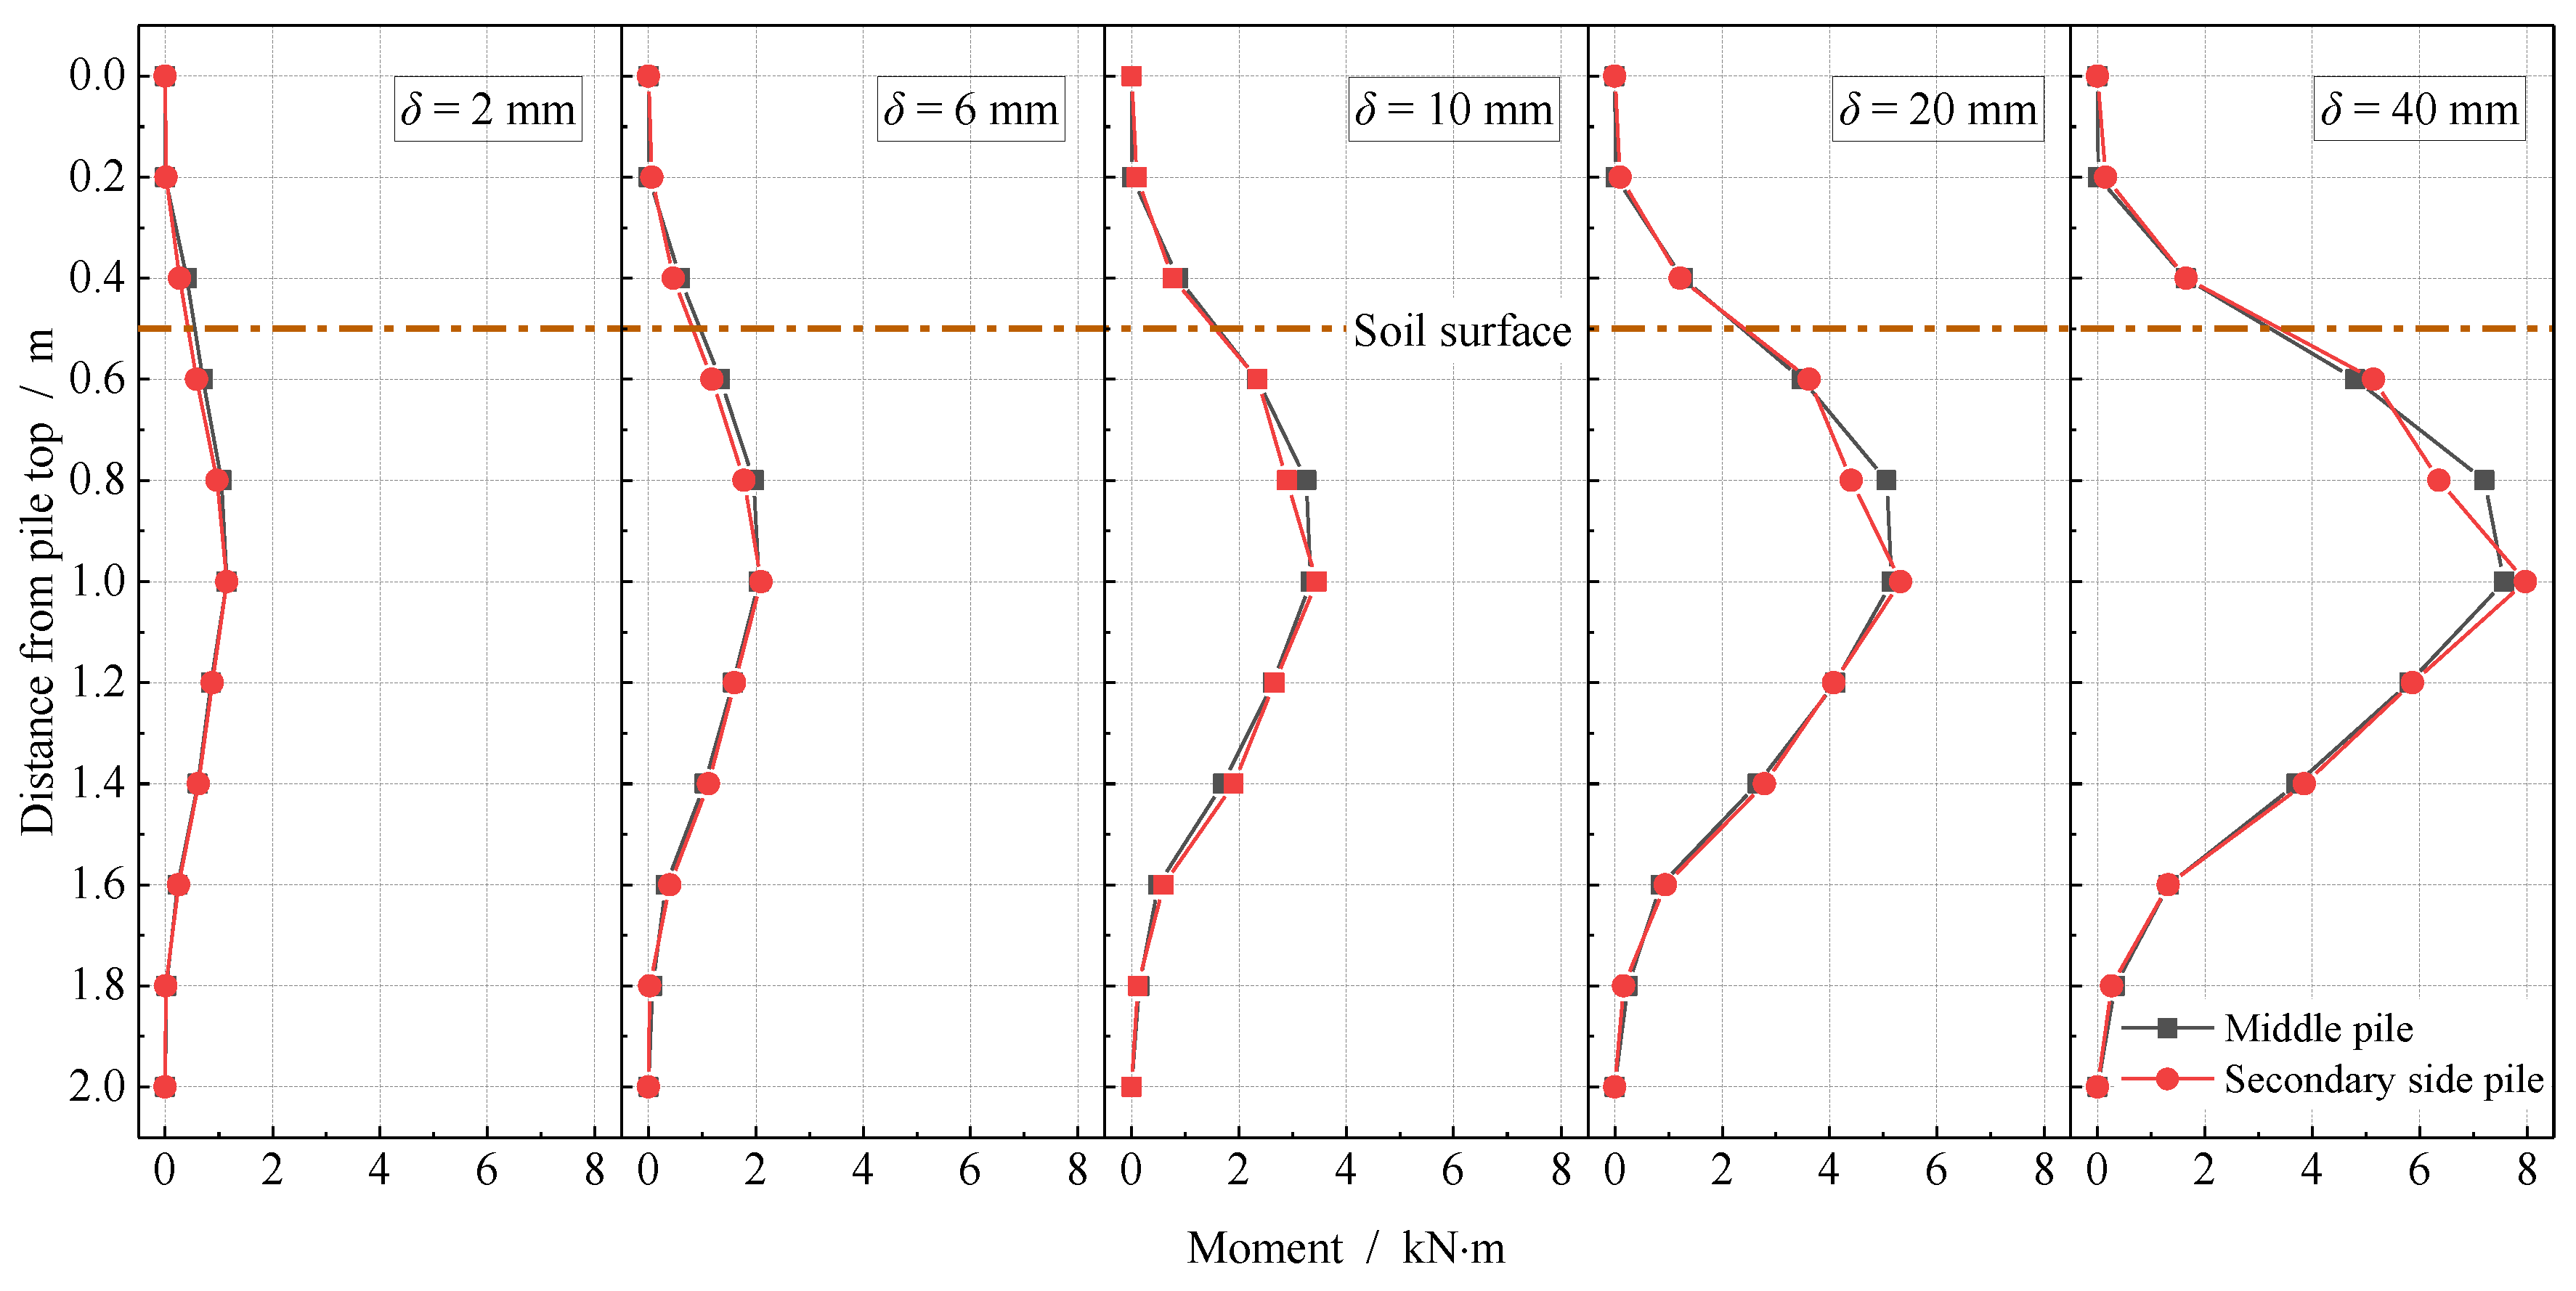
3.2. Bending Moment of the Piles
3.3. Analysis of Soil Stress in Front of Pile
4. Numerical Simulation
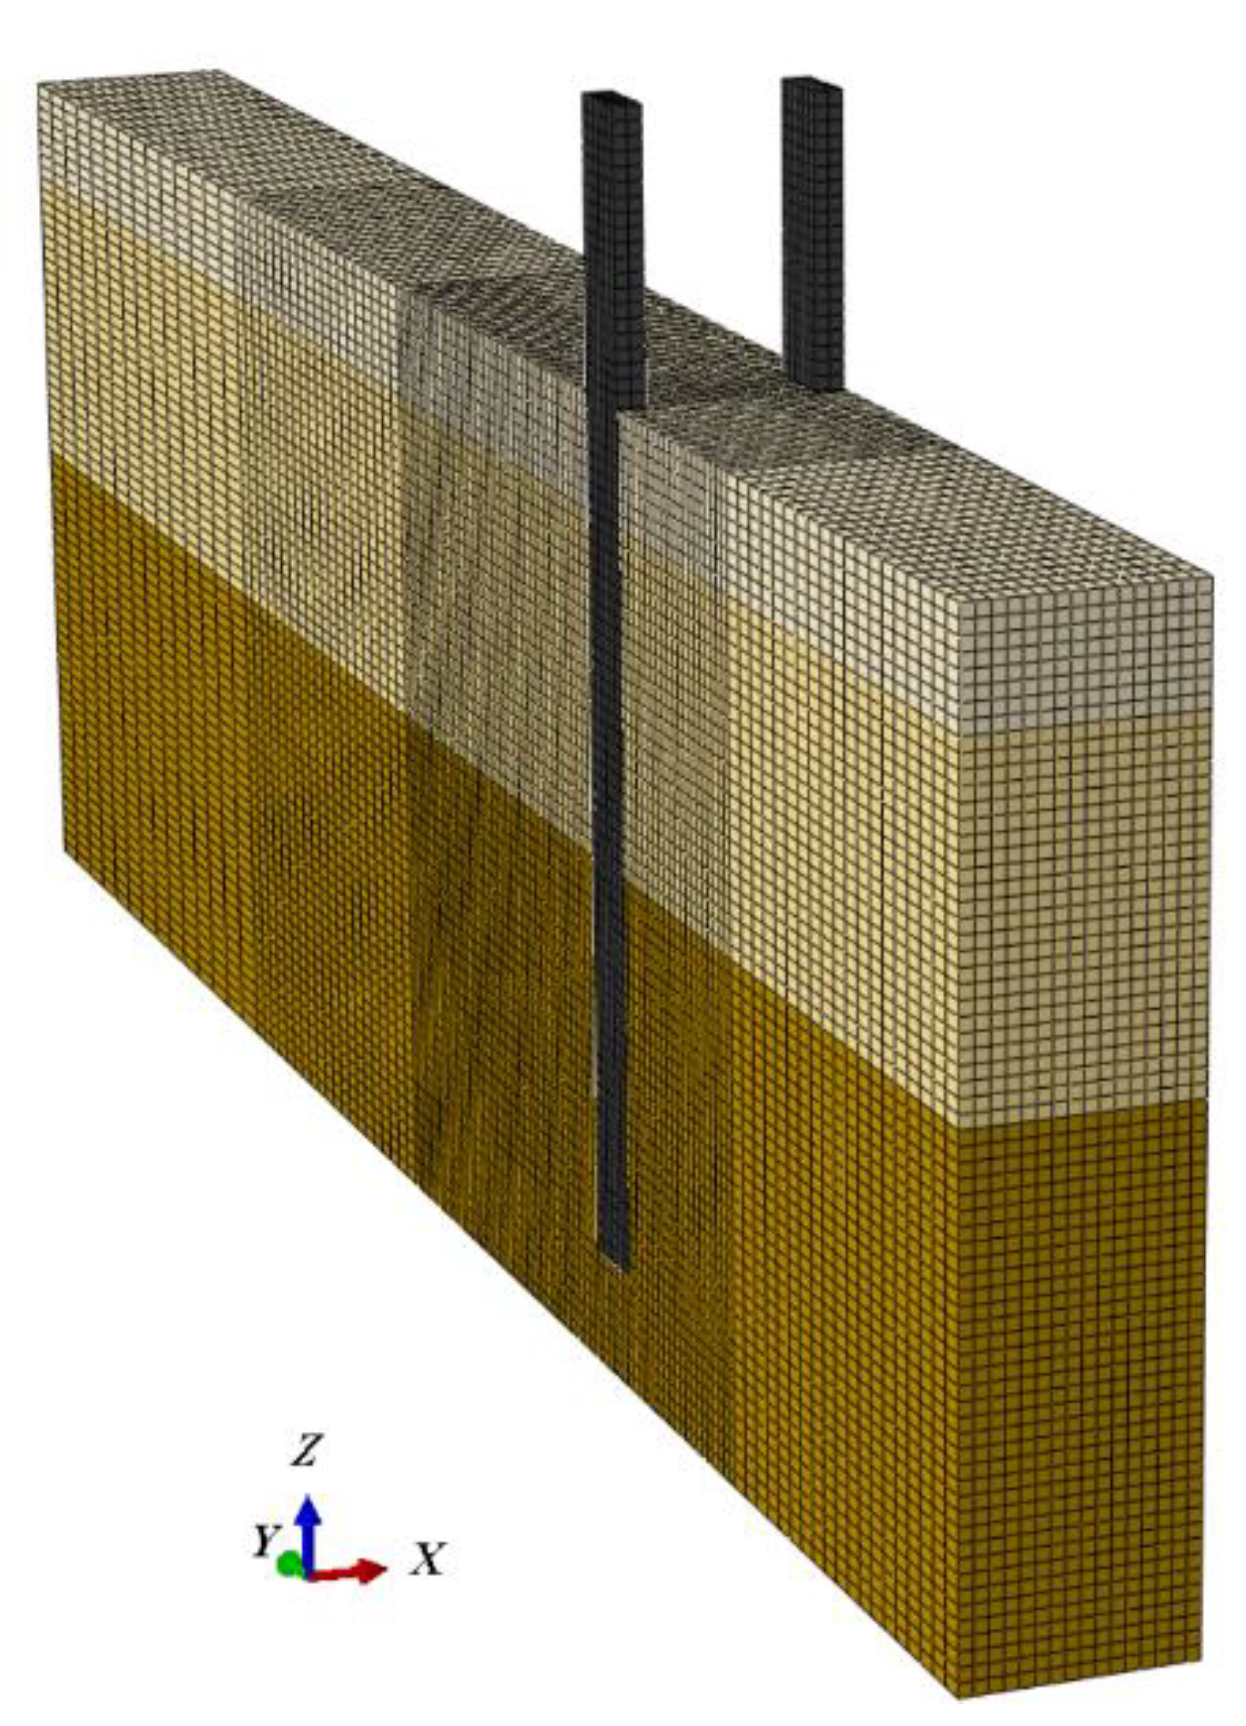
4.1. Finite Element Model
4.2. Accuracy of Numerical Simulation Results
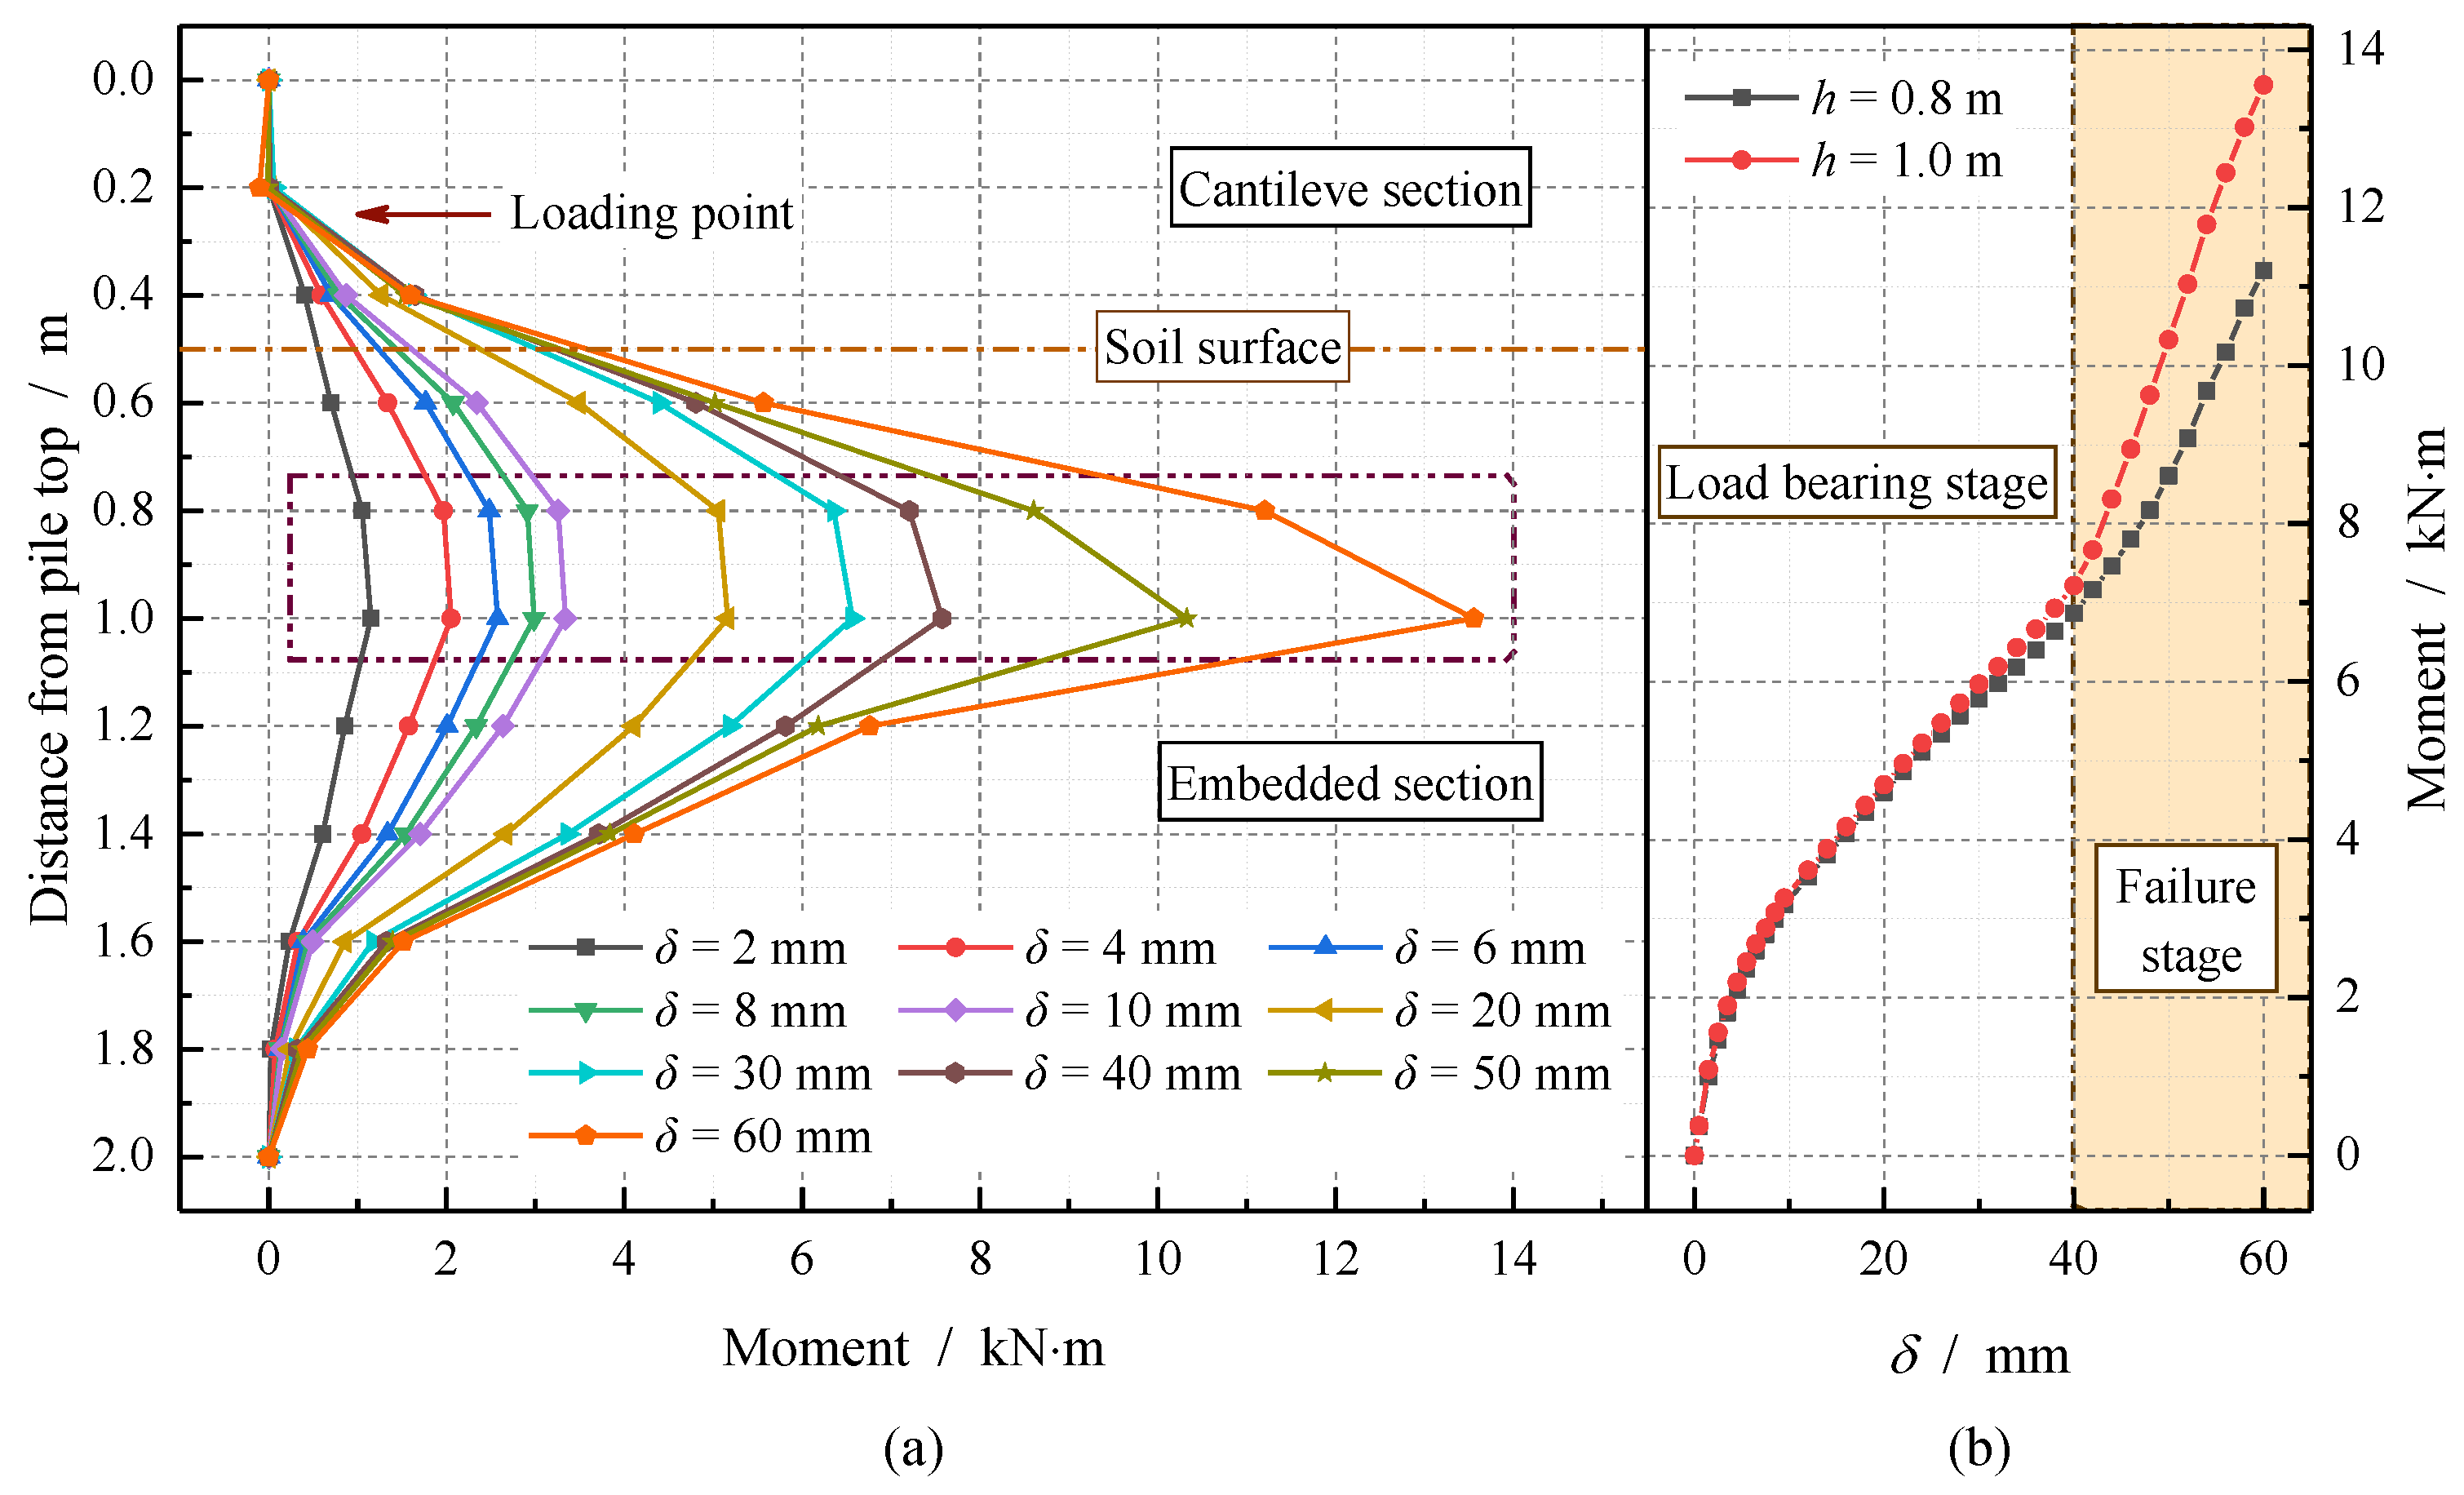
4.2.1. Bending Moment of Piles
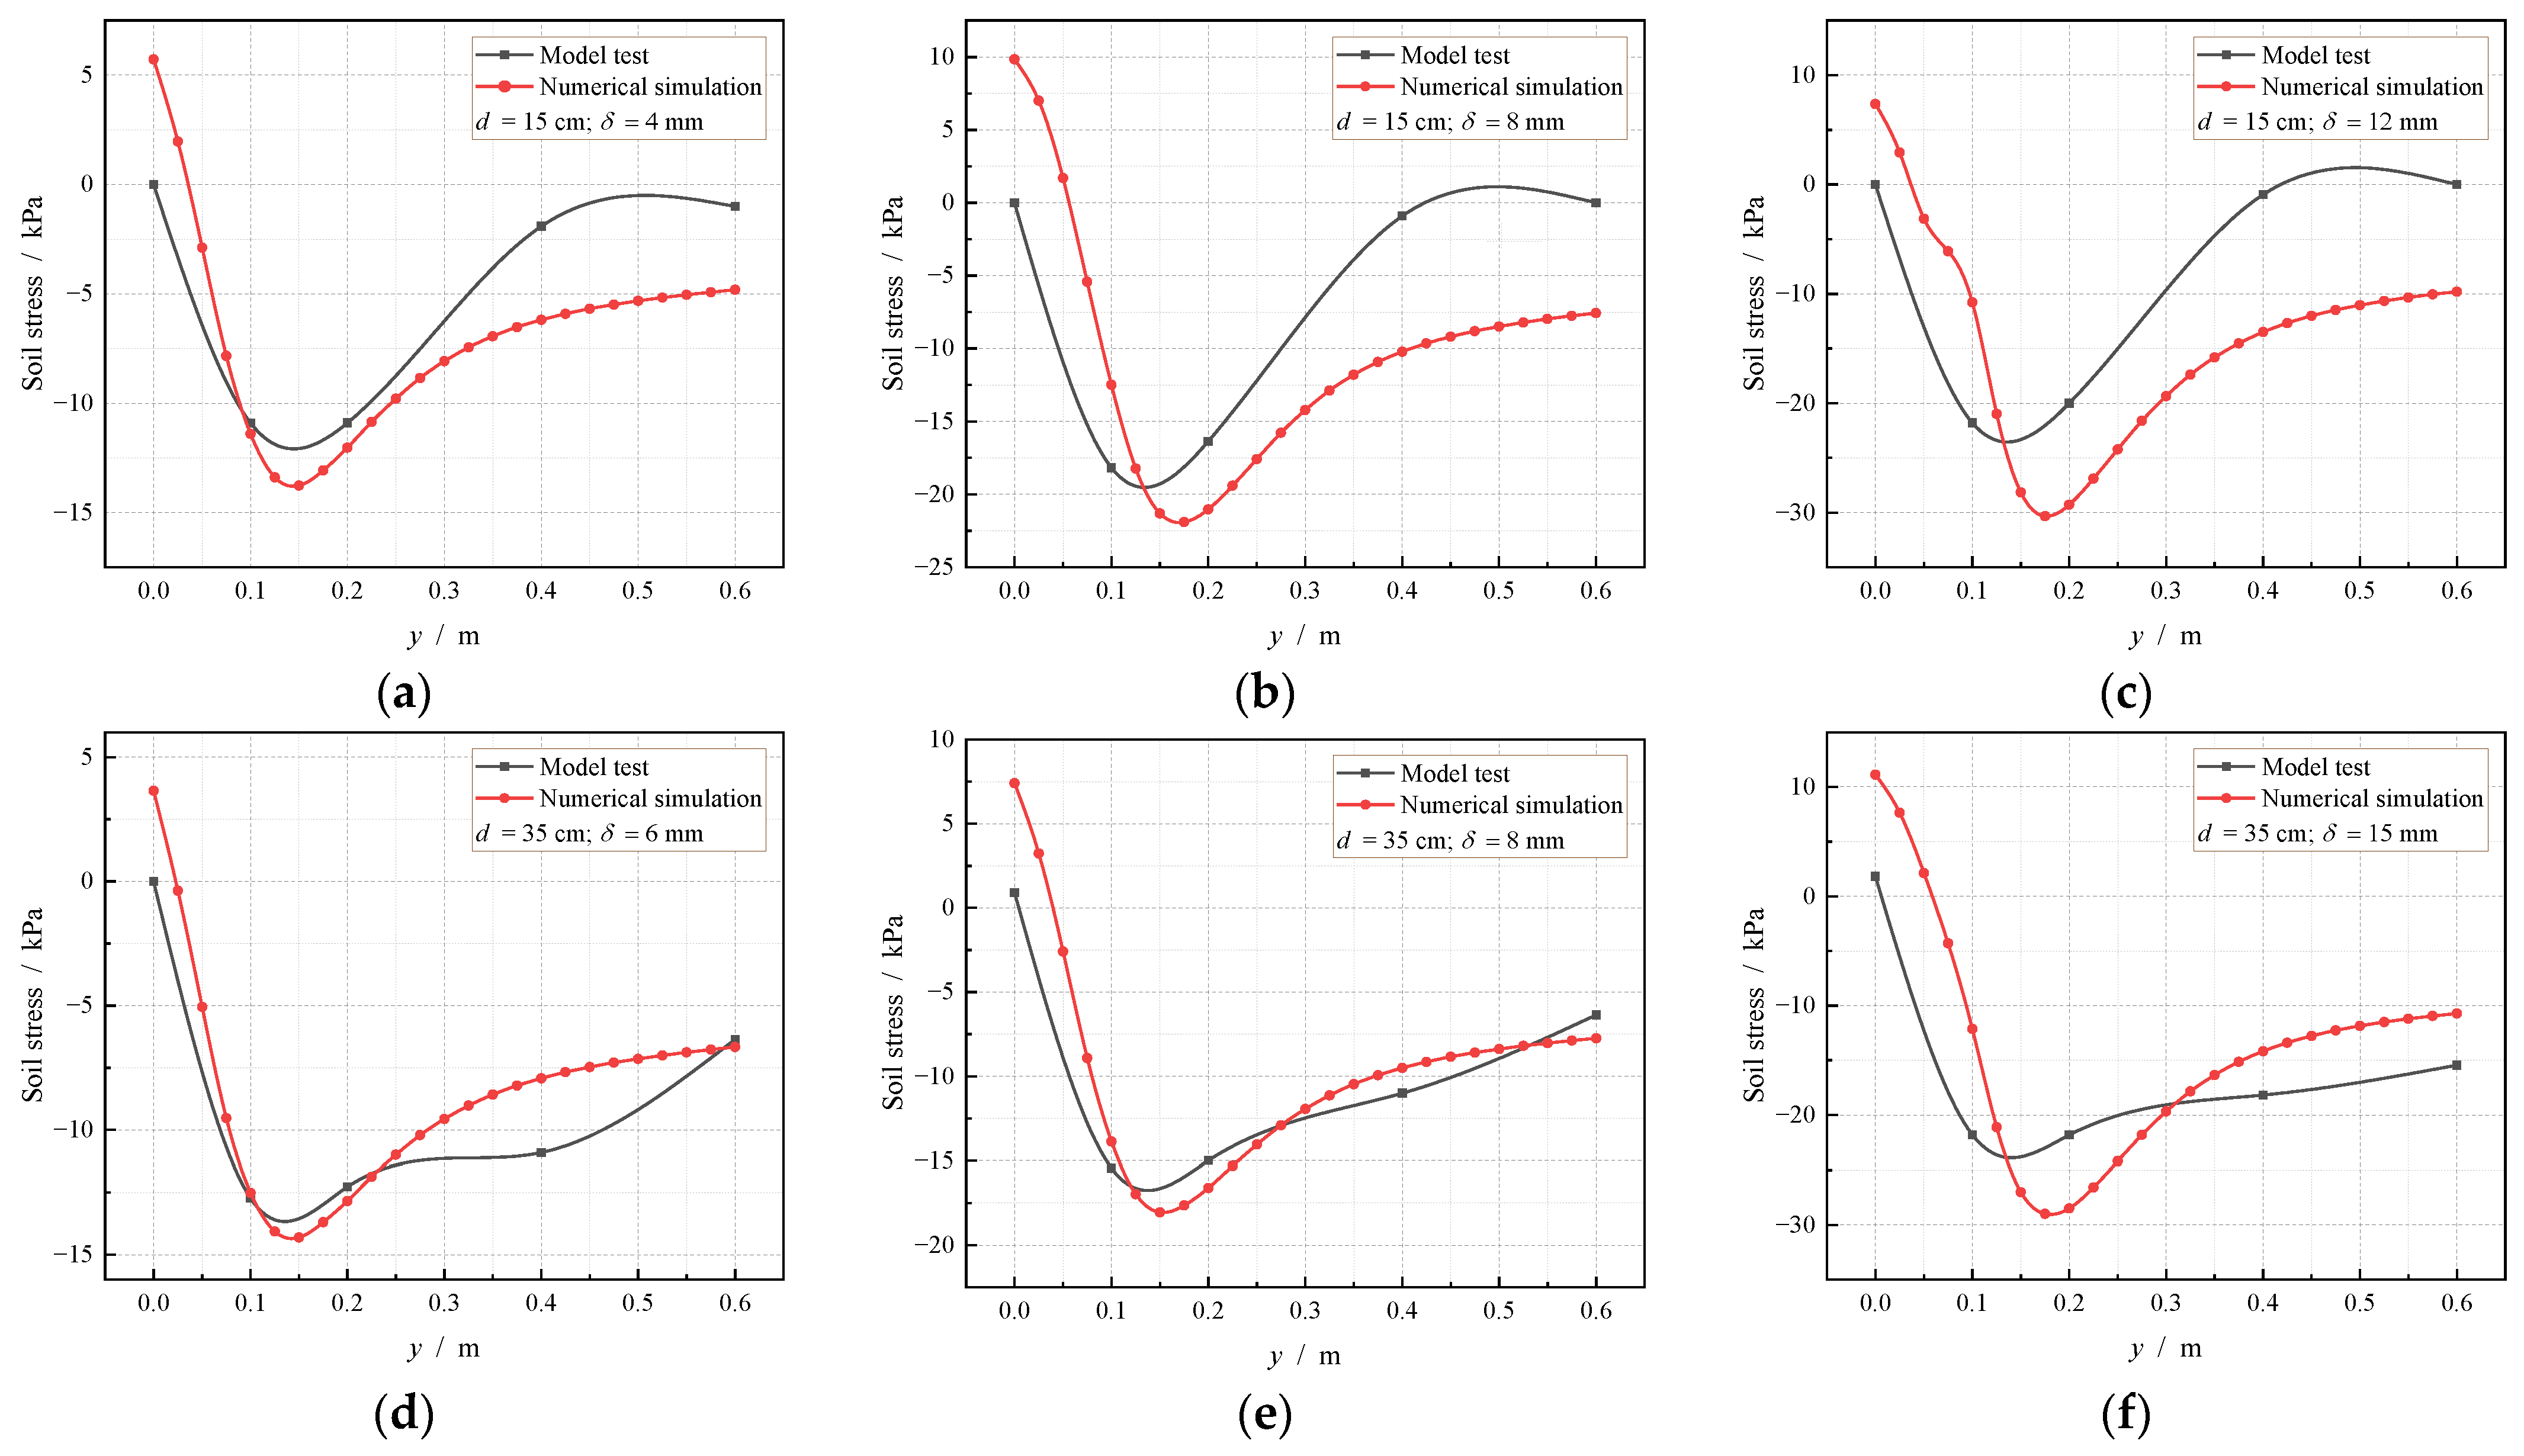
4.2.2. Soil Stress in Front of Pile
4.3. Axis and Space Form of Passive Soil Arch in Front of Piles
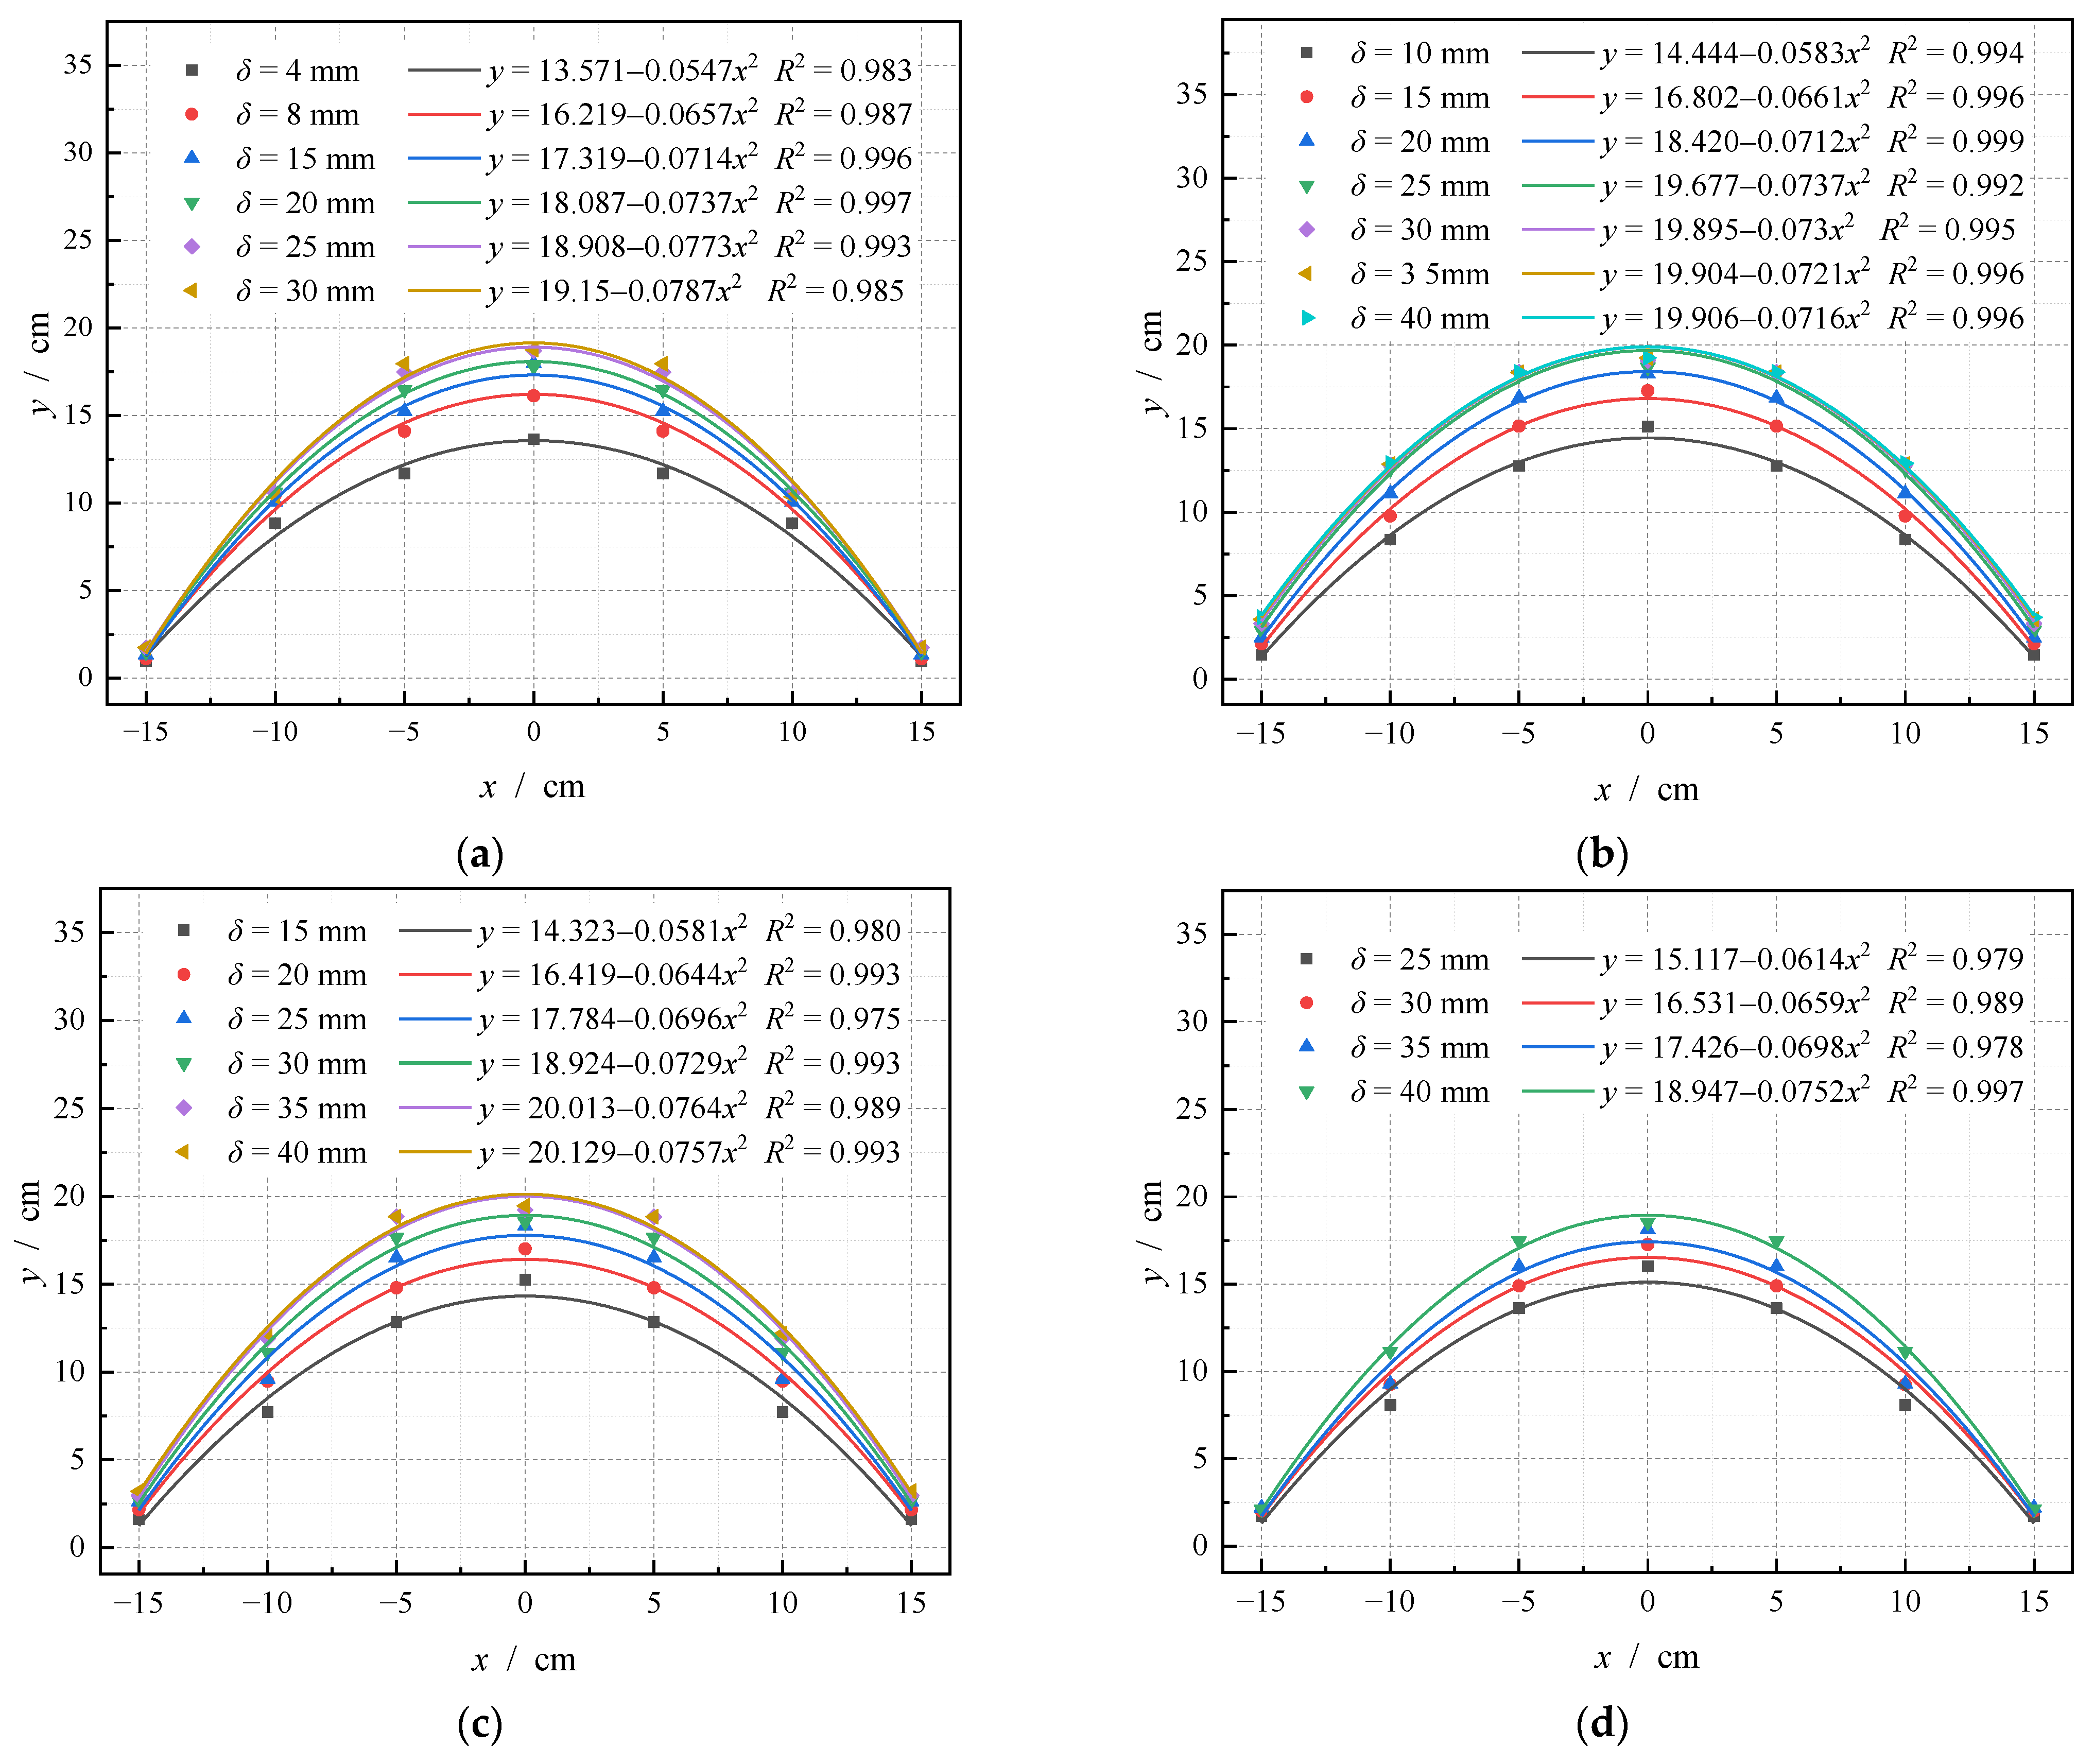
4.3.1. Axis of Passive Soil Arch in Front of Pile
- (1)
- The passive soil arch in front of piles is related to the relative displacement between the piles and the soil. With increasing buried depth and the same force condition, the relative displacement of pile-soil reduces. Thus, the shallower the buried depth, the less loading is required, and the sooner the arch is destroyed. Passive soil arches at 15, 35, and 55 cm depth can exhibit four distinct stages as the load increases: formation, development, completion, and destruction.
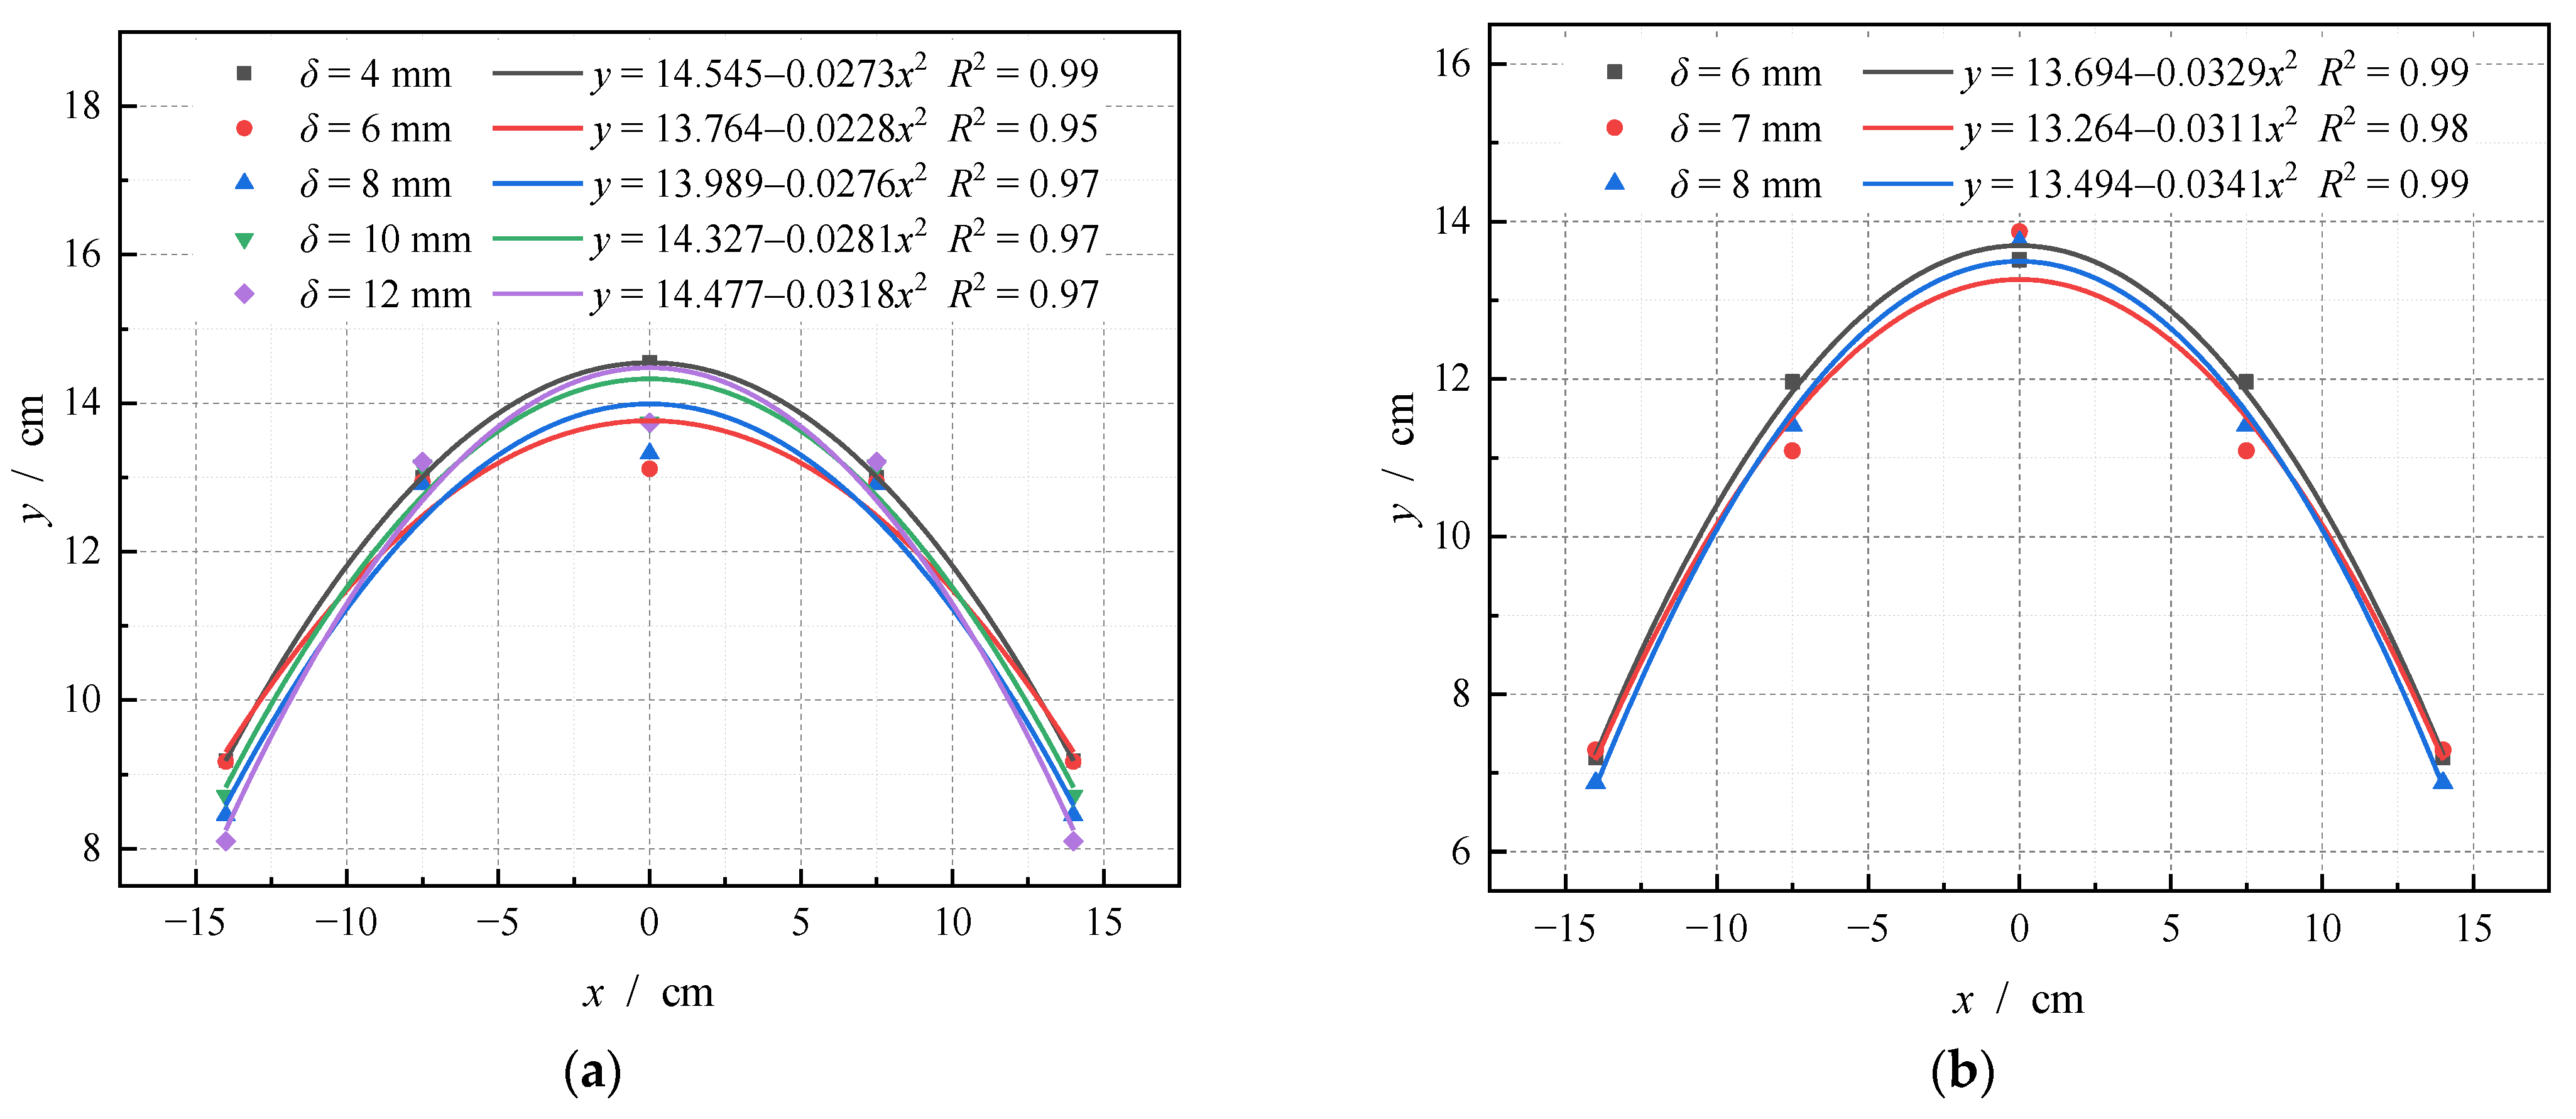
- (2)
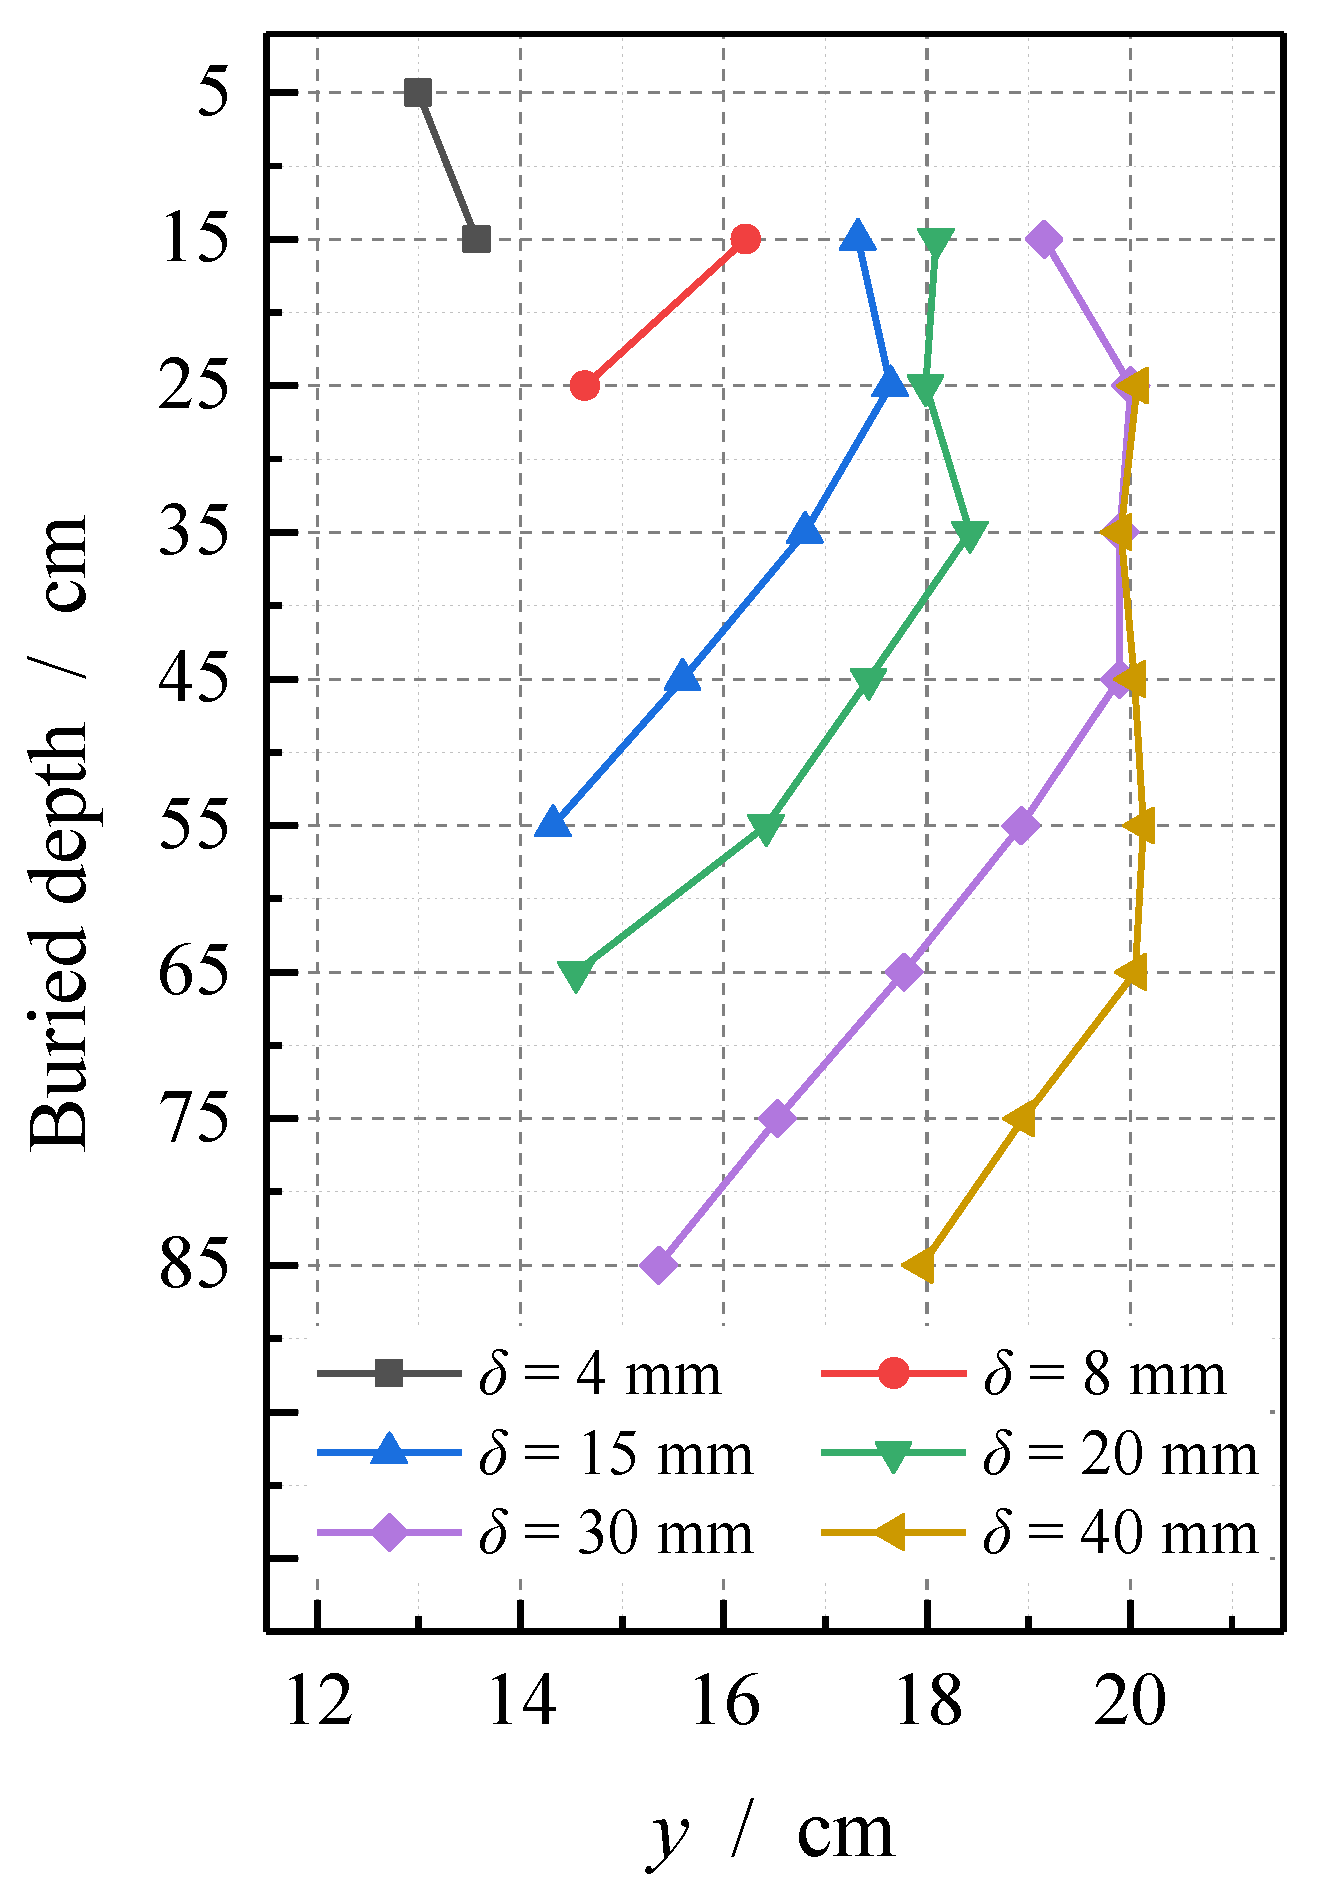
- Prior to failure, the y value of the apex of the passive soil arch axis at a depth of 15 cm is approximately 19.15 cm. At depths of 35 and 55 cm, the passive soil arch appeared to have reached a stable stage, indicating that it had entered the completion phase. As well, the y values of the apex of the passive soil arch axis were all about 20 cm, with little difference in shape and position, slightly larger than the buried depth of 15 cm. At a buried depth of 75 cm, the passive soil arch varies continually and is not stable, indicating that the passive soil arch is in the development stage.
- (3)
- When the buried depth exceeds 85 cm, no visible passive soil arch is formed as δ ≤ 40 mm.
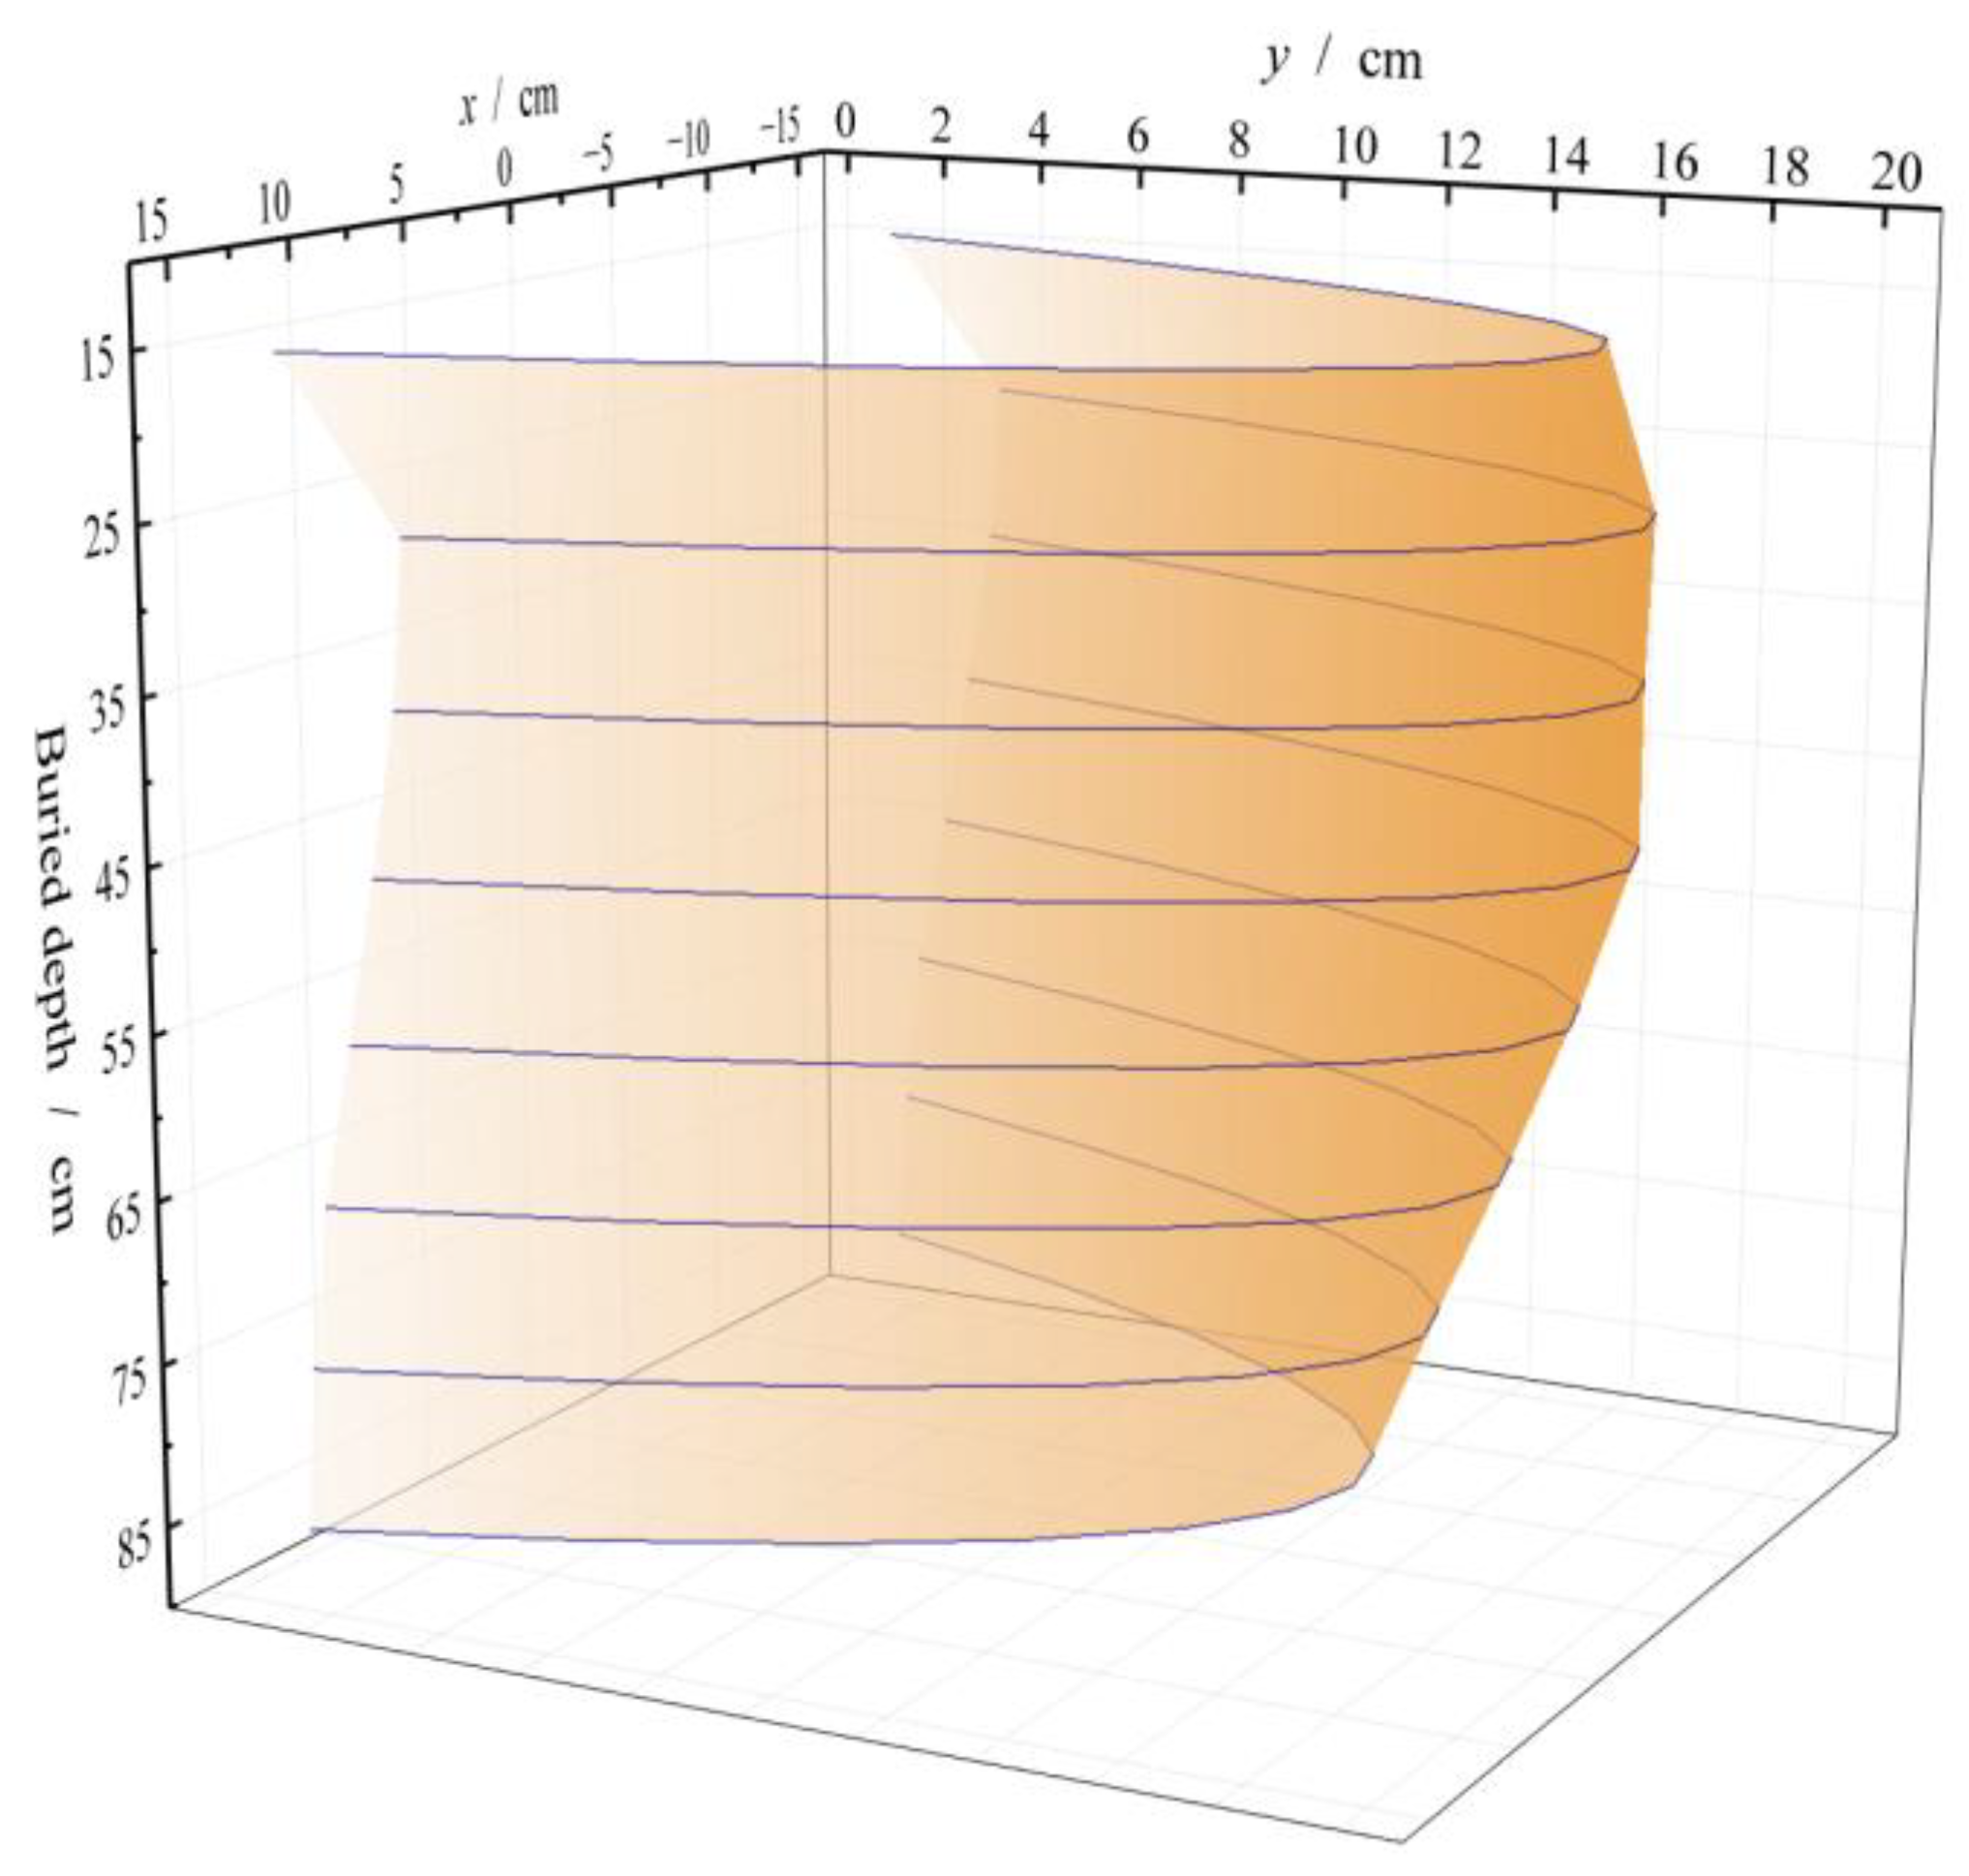
4.3.2. Spatial Form of Passive Soil Arch
- (1)
- When the same amount of load is applied, the spatial distribution of passive soil arch essentially follows the distribution rule that along the buried depth, gradually approaching the pile front.
- (2)
- When the buried depth is less than 15 cm, the loading amount associated with the passive soil arch from formation to failure is negligible, and its effect on the bearing capacity of the embedded section of the anti-slide pile is negligible. The passive soil arch is most prevalent in the 15~80 cm buried depth range.
- (3)
- As stress increases, the passive soil arch in front of the pile gradually develops downward along the buried depth. Gradually, the three-dimensional surface grows, and the entire structure slides away from the pile. Additional soil arching from top to bottom till the anti-slide piling structure fails.
5. Conclusions
- (1)
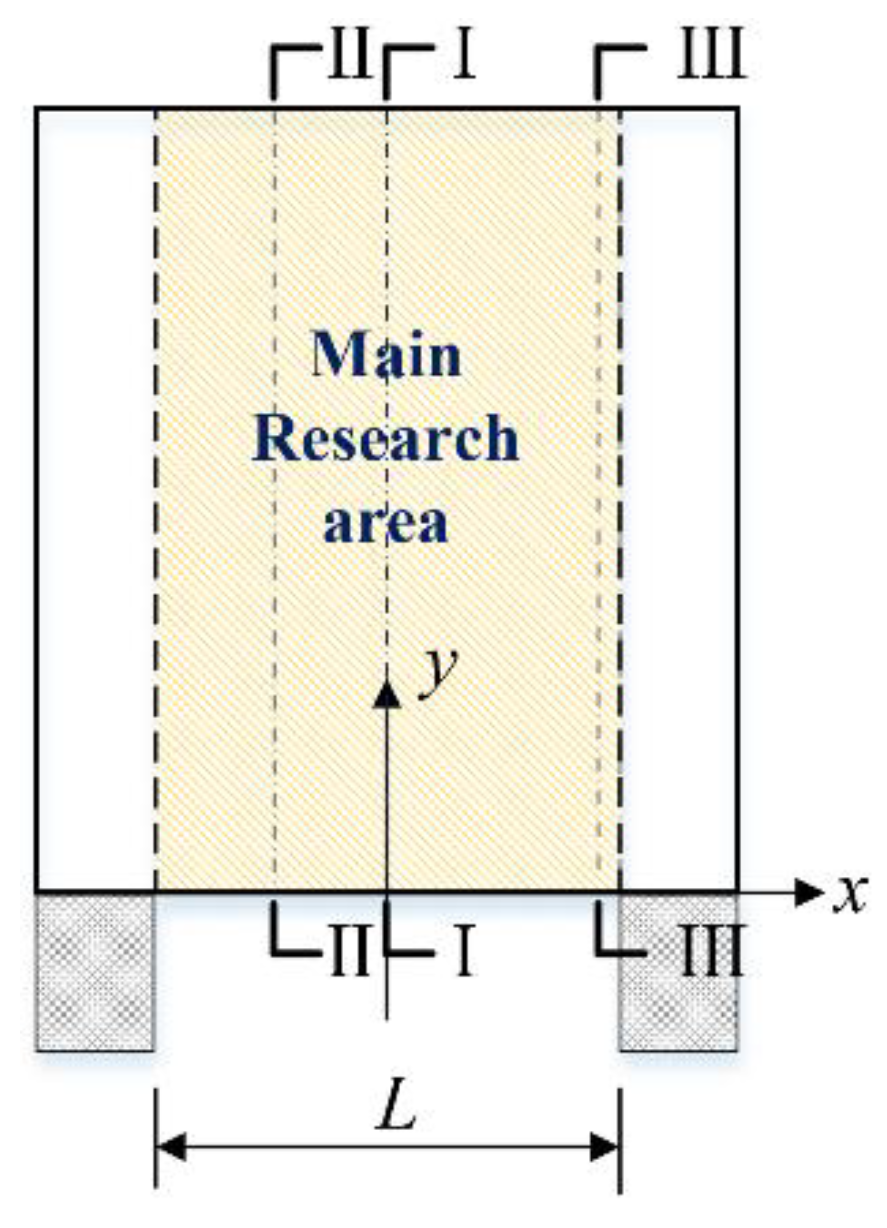
- By installing side piles, the boundary effect problem can be greatly alleviated. It is proposed that side piles be placed beyond the main focus of the study in order to eliminate boundary effects in the pile row and pile group model tests. The jack’s force on the anti-slide pile steadily increases as the load grows, and the growth rate gradually decreases. When the loading amount reaches δ ≥ 40 mm, the thrust becomes essentially constant as the loading amount increases, and the anti-slide pile system enters the failure stage.
- (2)
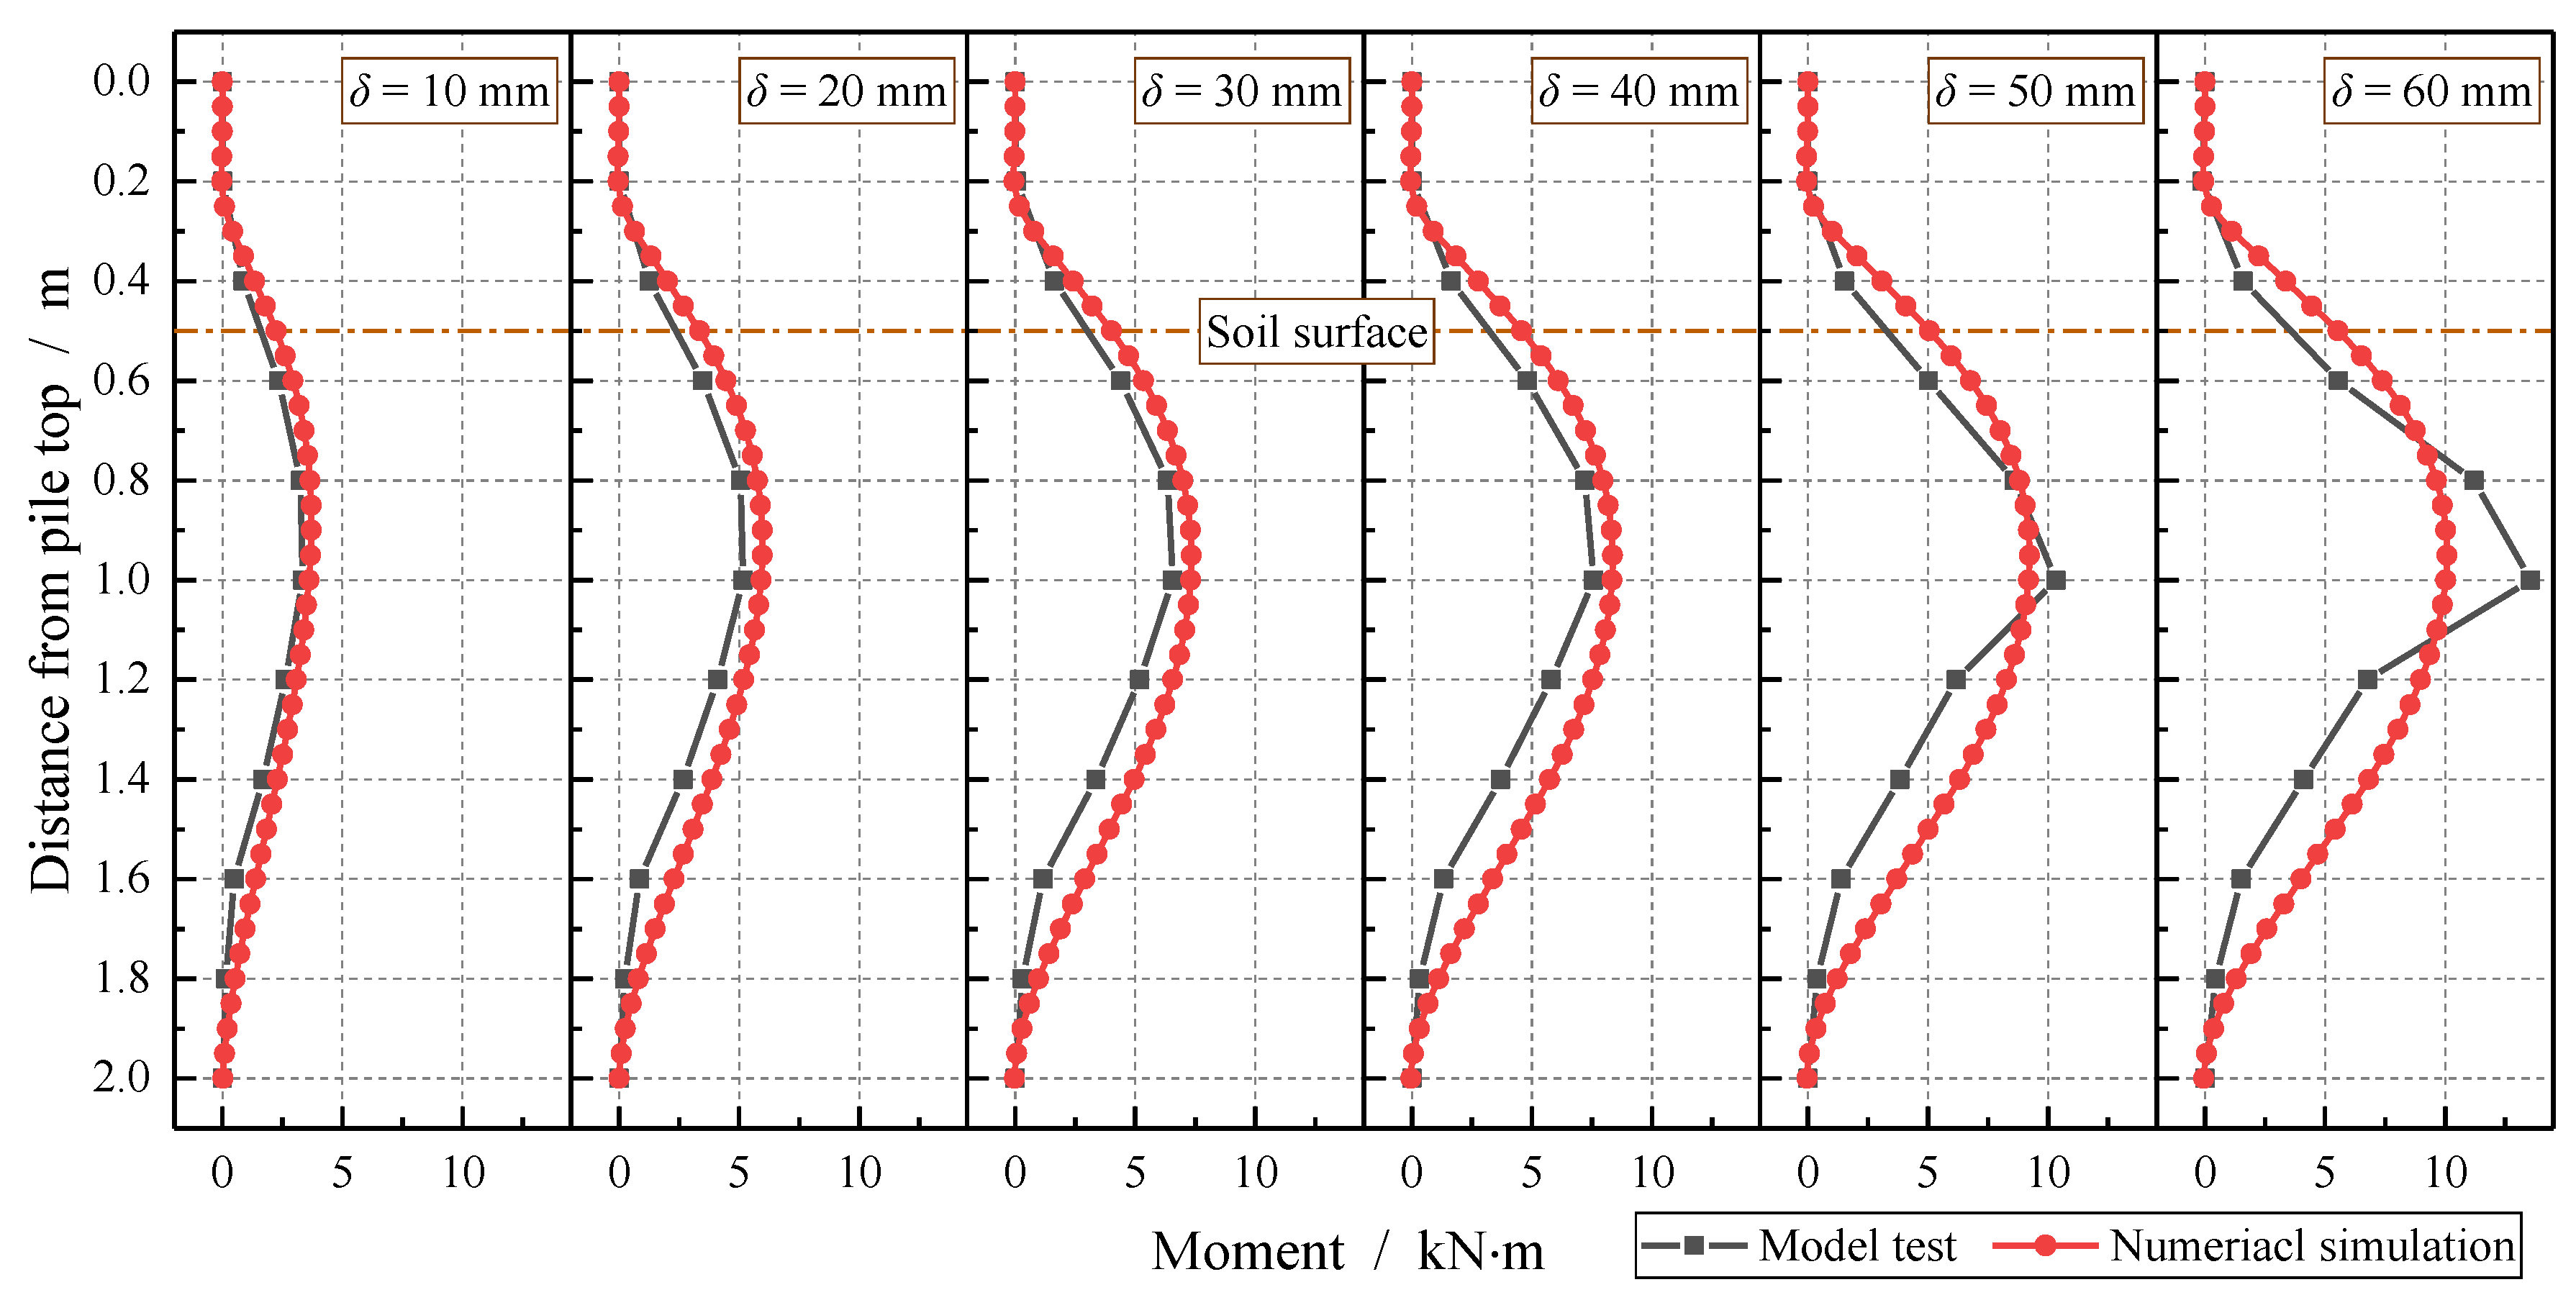
- The parabola distribution of the pile’s bending strain after loading is referred to as the parabola distribution. When the strain value exceeds 40 mm, it rapidly increases between 0.8 m and 1.0 m from the pile top. This shows that bending failure occurs on the pile body at this position, with the failure point located between 0.8 and 1.0 m. Follow-up observation confirms that the breakdown point is around 0.9 m from the pile top. Simultaneously, the pile strain values obtained using model test and numerical modeling accord well when δ ≤ 40 mm.
- (3)
- The parabola form can be used to fit the σx,max0 corresponding points at 15 and 35 cm depth. The existence of a passive soil arch in front of a pile with a spacing of four times the pile width is demonstrated. Simultaneously, when the loading amount is small, the measured value of the model test agrees well with the numerical simulation results, demonstrating the reasonableness of the numerical model presented in this article.
- (4)
- The soil arch evolution law can be divided into four stages within a pile spacing of four times the width of the pile: formation, development, completion, and destruction. With increasing loading, passive soil arches in front of piles are produced and destroyed. As loading increases, the three-dimensional surface formed by the passive soil arch in front of the pile eventually develops downward along the buried depth and moves toward the loading direction in its entirety. Additionally, the soil arch destroys from top to bottom until the anti-slide piling mechanism fails.
Author Contributions
Funding
Data Availability Statement
Conflicts of Interest
References
- Tomio, I.; Tamossu, M. Methods to estimate lateral force acting on stabilizing piles. Soils Found. 1975, 15, 43–59. [Google Scholar]
- Tomio, I. Extended design method for multi-row stabilizing piles against landslide. Soils Found. 1982, 22, 1–13. [Google Scholar]
- Wu, Z.S.; Zhang, L.M.; Hu, D. Studies on the mechanism of arching action in loess. J. Chengdu Univ. Sci. Technol. 1995, 2, 15–19. [Google Scholar]
- Wang, C.H.; Chen, Y.B.; Lin, L.X. Soil arch mechanical character and suitable space between one another anti-sliding pile. J. Mt. Sci. 2001, 19, 556–559. [Google Scholar]
- Zhao, M.H.; Liao, B.B.; Liu, S.S. Calculation of anti-slide piles spacing based on soil arching effect. Rock Soil Mech. 2010, 31, 1211–1216. [Google Scholar]
- Li, S.J.; Chen, J.; Cao, L. Mechanical model of soil arch for interaction of piles and slope and problem of pile spacing. Rock Soil Mech. 2010, 31, 1352–1358. [Google Scholar]
- Zhang, H.K.; Zhang, Y.; Liu, T.; Li, C.D. Maximum pile spacing of stabilizing piles in multilayer sliding mass based on unified strength theory. Geol. Sci. Technol. Inf. 2017, 36, 209–215. [Google Scholar]
- Wang, P.Y.; Dong, T.; Li, X.D. Analysis on rational spacing between adjacent anti-slide piles based on interaction effect of soil arches. Chin. J. Undergr. Space Eng. 2018, 14, 1634–1638. [Google Scholar]
- Zhang, L.; Chen, J.H.; Zhao, M.H. Maximum cantilever anti-slide piles spacing determination with consideration of soil of arching effect. Rock Soil Mech. 2019, 40, 4497–4505+4522. [Google Scholar]
- Zhao, M.H.; Peng, W.Z.; Yang, C.W.; Xiao, Y. Study on spacing of anti-slide piles considering combined soil arching effect on lateral side and bank. J. Highw. Transp. Res. Dev. 2019, 36, 87–94+116. [Google Scholar]
- Jiang, T.; Lei, J.H.; Wang, R.Z.; Zhang, J.R. Comparative model test study on reinforcement effect of anti-slide pile with different arrangements. J. Basic Sci. Eng. 2019, 27, 404–417. [Google Scholar]
- Dou, H.Q.; Sun, Y.X.; Wang, H.; Nie, W.F. Experimental study on transfer behavior of earth pressure on the retaining wall slab in the pile-sheet retaining wall. Adv. Eng. Sci. 2019, 51, 77–84. [Google Scholar]
- Jin, L.; Hu, X.L.; Tan, F.L.; He, C.C.; Zhang, H.; Zhang, Y.M. Model test of soil arching effect of anti-slide piles based on infrared thermal imaging technology. Rock Soil Mech. 2016, 37, 2332–2340. [Google Scholar]
- Chen, Q.; Dong, G.C.; Wang, C.; Zhu, B.L.; Zhao, X.Y. Characteristics analysis of soil arching effect behind pile based on transparent soil technology. J. Southwest Jiaotong Univ. 2020, 55, 509–522. [Google Scholar]
- Yang, M.; Yao, L.K.; Wang, G.J. Study on effect of width and space of anti-slide piles on soil arching between piles. Chin. J. Geotech. Eng. 2007, 29, 1477–1482. [Google Scholar]
- Yang, M.; Yao, L.K.; Wang, G.J. Study of centrifuge model tests and numerical simulation on soil arching in space of piles. Rock Soil Mech. 2008, 29, 817–822. [Google Scholar]
- Zhang, Y.X.; Dong, J.; Huang, Z.Y. Experimental investigation on three-dimensional soil arching effect between adjacent cantilever anti-slide piles with rational spacing. Chin. J. Geotech. Eng. 2009, 31, 1874–1881. [Google Scholar]
- Zhang, Y.X.; Dong, J.; Wen, H.J.; Tan, H.J.; Tan, H.H. Research on Three-dimensional Soil Arching Effect and Appropriate Spacing of Cantilever Anti-slide Piles with Consideration of Geostatic Stress. China J. Highw. Transp. 2009, 22, 18–25. [Google Scholar]
- Gu, H.D.; Yang, M. Analysis of internal forces and displacement of pit supporting structure with scattered row piles considering soil arching effect. Rock Soil Mech. 2014, 35, 3531–3540. [Google Scholar]
- Gu, H.D.; Luo, C.H. Experiment on soil arching effect of pit supporting structure with scattered row piles and soil nail wall. J. Jilin Univ. (Eng. Technol. Ed.) 2018, 48, 1712–1724. [Google Scholar]
- Luo, L.J.; Jiang, G.; Hu, Z.P.; Xia, X.B.; Liu, P. Model test of interaction between the segmental protection-wall and the integral pile structure of artificial drilled anti-slide pile. J. Sichuan Univ. (Eng. Sci. Ed.) 2015, 47, 53–63. [Google Scholar]
- Luo, L.J.; Xia, X.B.; Wang, R.; Chen, Y. Research on passive soil-arching effect before cantilever anti-slide pile. J. Archit. Civ. Eng. 2017, 130, 580–592. [Google Scholar]
- Ye, J.B.; Yu, J.; Lin, Z.C.; Zhou, X.Q.; Liu, S.Y.; Tu, X.B. Model test of cantilever double-row anti-slide pile using horizontal pushing method. China Civ. Eng. J. 2019, 52, 193–201. [Google Scholar]
- Dai, Z.H. Study on distribution laws of landslide-thrust and resistance of sliding mass acting on antislide piles. Chin. J. Rock Mech. Eng. 2002, 21, 517–521. [Google Scholar]
- Liu, H.J.; Men, Y.M.; Li, X.C.; Zhang, T. Study of model test on cantilever anti-slide pile. Rock Soil Mech. 2012, 33, 2960–2966. [Google Scholar]


| Physical Quantities | Similarity Constant |
|---|---|
| Geometry | Cl = 15 |
| Modulus of elasticity | CE = 2 |
| Strain | Cε = 1 |
| Stress | Cσ = CE Cε = 2 |
| Poisson ratio | Cμ = 1 |
| Concentrated load | CF = Cσ Cl2 = 450 |
| Linear load | Cq = Cσ Cl = 30 |
| Area load | Cp = Cσ = 2 |
| Moment | CM = Cσ Cl3 = 6750 |
| Cement | Water | Fly-Ash | River Sand | Coarse Aggregate |
|---|---|---|---|---|
| 1 | 0.93 | 0.35 | 4.23 | 4.43 |
| Soil Layers | Volumetric Weight (kN·m−3) | Void Ratio | Cohesive Strength (kPa) | Internal Friction Angle (°) | Compression Modulus/MPa | ||
|---|---|---|---|---|---|---|---|
| Model Soil | Prototype Soil | Similarity Ratio | |||||
| ➀ Earth fill | 17.87 | 0.76 | 35.45 | 28.15 | 10.45 | 20 | 1.91 |
| ➁ Loess | 17.13 | 0.84 | 27.20 | 29.95 | 8.10 | 16.8 | 2.07 |
| ➂ Paleosol | 18.38 | 0.72 | 34.50 | 28.4 | 10.85 | 26 | 2.39 |
Publisher’s Note: MDPI stays neutral with regard to jurisdictional claims in published maps and institutional affiliations. |
© 2022 by the authors. Licensee MDPI, Basel, Switzerland. This article is an open access article distributed under the terms and conditions of the Creative Commons Attribution (CC BY) license (https://creativecommons.org/licenses/by/4.0/).
Share and Cite
Ren, X.; Luo, L.; Zheng, Y.; Ma, J.; An, X. Morphological Evolution of Passive Soil Arch in Front of Horizontal Piles in Three Dimensions. Buildings 2022, 12, 1056. https://doi.org/10.3390/buildings12071056
Ren X, Luo L, Zheng Y, Ma J, An X. Morphological Evolution of Passive Soil Arch in Front of Horizontal Piles in Three Dimensions. Buildings. 2022; 12(7):1056. https://doi.org/10.3390/buildings12071056
Chicago/Turabian StyleRen, Xiang, Lijuan Luo, Yunxin Zheng, Jiakuan Ma, and Xuexu An. 2022. "Morphological Evolution of Passive Soil Arch in Front of Horizontal Piles in Three Dimensions" Buildings 12, no. 7: 1056. https://doi.org/10.3390/buildings12071056