Article

Investigation on Dynamic Mechanical Properties of Recycled Concrete Aggregate under Split-Hopkinson Pressure Bar Impact Test

1
Key Laboratory of Concrete and Prestressed Concrete Structures of the Ministry of Education, School of Civil Engineering, Southeast University, Nanjing 210096, China
2
Department of Civil Engineering, Ghent University, 9052 Zwijnaarde, Belgium
3
College of Civil Engineering and Mechanics, Xiangtan University, Xiangtan 411105, China
4
Jiangsu Huatong Engineering Testing Co., Ltd., Nanjing 210000, China
5
Jiangsu Eastern Expressway Management Co., Ltd., Lianyungang 222000, China
*
Author to whom correspondence should be addressed.
Buildings 2022, 12(7), 1055; https://doi.org/10.3390/buildings12071055
Submission received: 12 June 2022 / Revised: 13 July 2022 / Accepted: 18 July 2022 / Published: 20 July 2022

Abstract

:
The dynamic mechanical properties of recycled concrete (RC) and natural concrete (NC) were studied by impact tests and numerical simulation. The quasi-static tests were conducted by a servo-hydraulic machine, while the impact test used a 50 mm diameter split-Hopkinson pressure bar (SHPB). The ANSYS/LS-DYNA software simulation was selected to validate the experimental results. The recycled coarse aggregates (RCAs) came from the housing demolition and were conducted with the microwave-assisted beneficiation method. The stress–strain curves, compressive strength, dynamic increase factor (DIF), initial elastic modulus and failure modes were analyzed and discussed. The results showed that the quasi-static compressive strengths of the RC were lower than that of the NC by 5.0%. The maximum dynamic compressive strengths of the NC increased by 105.9% when the strain rates varied from 46–108, while the RC increased by 102.2% when the strain rates varied from 42 to 103. The stress–strain curves of the RC and NC demonstrated a similar pattern. The DIF showed an increasing tendency with the increasing of strain rates, while the initial elastic modulus showed a decreasing tendency. The failure modes first initiated from the edge of specimens and then propagated to the center of specimens. An empirical equation was proposed for the estimation of the DIF of the RC which was obtained from the microwave-assisted beneficiation. The simulation results for the prediction of stress–strain curves of the RC showed good agreement with the experimental results. In addition, these results suggested that the RCAs were obtained by the microwave-assisted beneficiation can be recycled and may be used in some actual engineering.

1. Introduction

In the entire world, construction generates 2.2 billion tons of waste every year [1], and this increasing trend will reach approximately 6.2 billion tons by 2025 [2]. The concrete waste from the demolition of old city buildings constituted 58% of the 18 million tons of waste generated in China over the past year. However, the recycling coefficient of utilization is low. The recycling of waste concrete not only purifies the environment, but also reduces the over consumption of natural resources [3]. To solve the above problem, many novel, efficient technologies are being continuously developed. Examples include conventional heating [4], particle-shape-collecting technology [5], thermal–mechanical technology [6], a chemical immersion method [7,8], hybrid techniques [9] and microwave-assisted beneficiation [10,11]. Scholars mainly focus on mechanical and chemical properties to obtain high-quality coarse aggregate. The quasi-static mechanical properties method of obtaining recycled concrete (RC) is mature. However, the dynamic behavior of concrete under different strain rates is more complex than that of the quasi-static mechanical properties. Therefore, related investigation of impact behaviors is scarce. The dynamic tests mainly concentrated on split-Hopkinson pressure bar (SHPB) and drop-hammer impact tests [12]. However, the dynamic mechanics of RC according to different beneficiation methods were investigated. The investigation of the dynamic mechanism of natural concrete (NC) was started by Abrams. It was then expanded by a large number of scholars. The relationship between strain rate and other mechanical properties was the primary focus of scholars [13,14,15]. The dynamic mechanism of RC was investigated mainly according to the same method as NC. Then, the mechanisms and models of dynamic failure modes, strength [16], stress–strain curves [6,17] and fragmentation [18] were summarized. The dynamic behavior of recycled aggregate concrete was simulated by the SHPB with different diameters and drop weight impact loads [19]. Although the fundamental behaviors had been investigated, the environmental, economic and durability aspects of the RC also required investigation because they were important to concrete structures’ serviceability [20,21,22,23]. To study the influence of nanoparticle chemical composite on the dynamic mechanical performance of the RC, the impact load was simulated by a 100 mm diameter SHPB. The results showed that some nanoparticles can improve the RC’s dynamic compressive strength [24]. In the field of concrete, concrete-filled steel tubes are widely applied in engineering. Therefore, it was necessary to study the dynamic mechanics performance of recycled-aggregate-concrete-filled steel tubes under different conditions. Combined with the experiment and simulation, the mechanical behavior of the recycled-aggregate-concrete-filled steel tube was investigated. The results showed that reinforcement ratio and strength can improve impact behaviors [25,26]. Construction and demolition wastes were obtained from different districts. Therefore, the recycled coarse aggregate (RCA) may contain different materials. However, the rubber [11,27,28] and asphalt may have had a significant influence on the performance of the RC. There were some other investigations into the integrated assessment of RCA [29], the splice strength of steel reinforcement embedded in the RCA [30] and recycled aggregate concrete under daily temperature variations [31].
Although there have been many achievements in investigating the dynamic behaviors of RC (coarse aggregate from the tradition methods), The investigations of RCAs obtained from microwave-assisted beneficiation are scarce. In this paper, according to the most recent investigations, the dynamic behaviors of RC and NC were thoroughly investigated using the SHPB impact test. Then, the finite element method was selected to verify the dynamic behaviors. The stress–strain curves, compressive strength, dynamic increase factor (DIF), initial elastic modulus and failure modes were the main parameters that were investigated. Finally, a model was developed for the prediction of the stress–strain curve of the RC under dynamic loading, which showed good agreement with the impact experiment results.

2. Materials and Methods

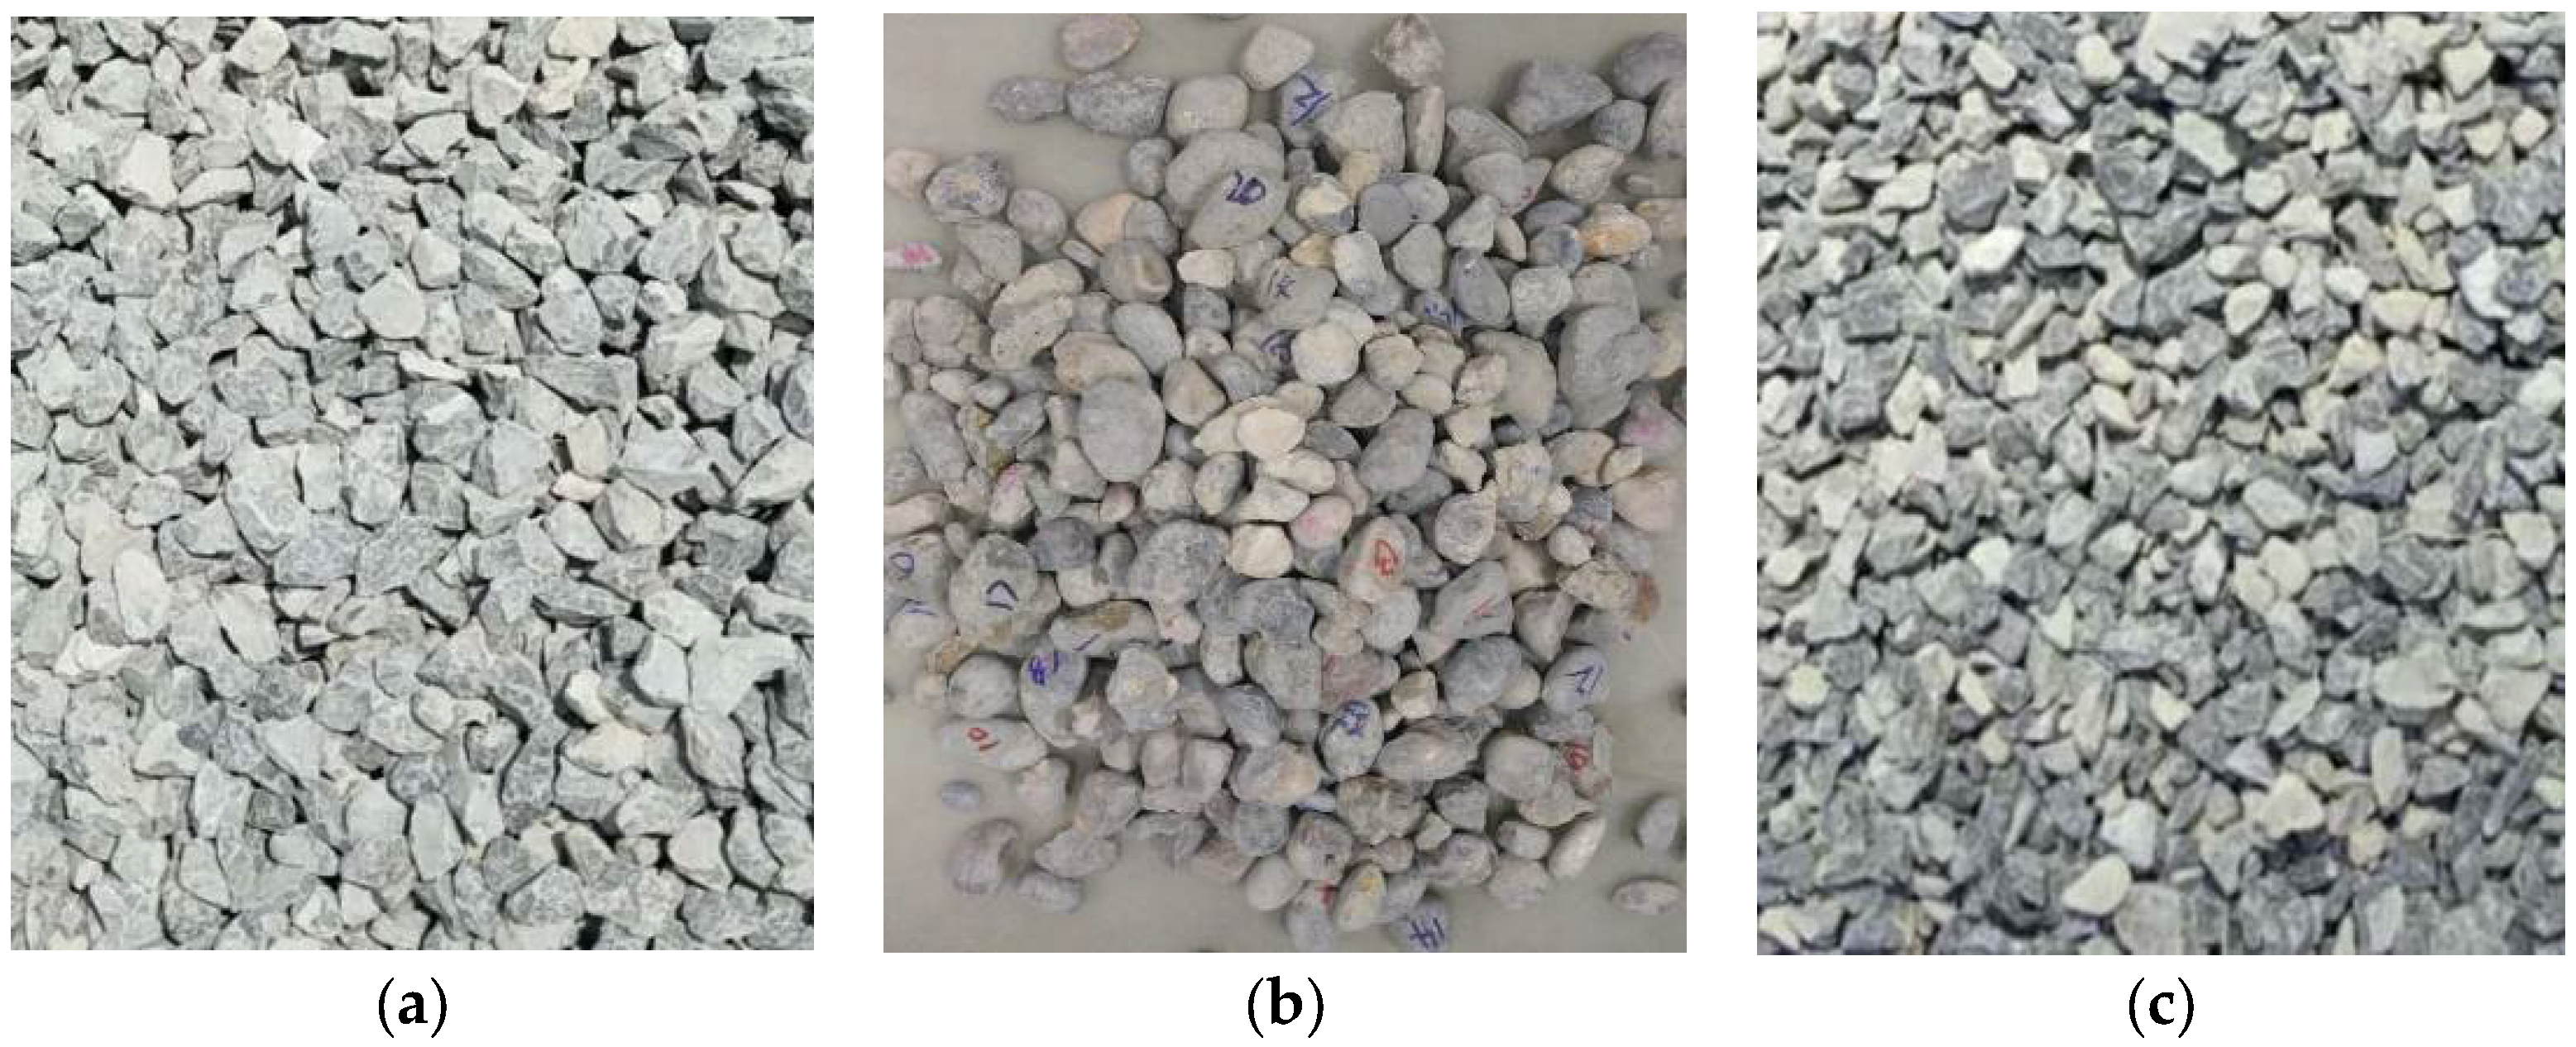
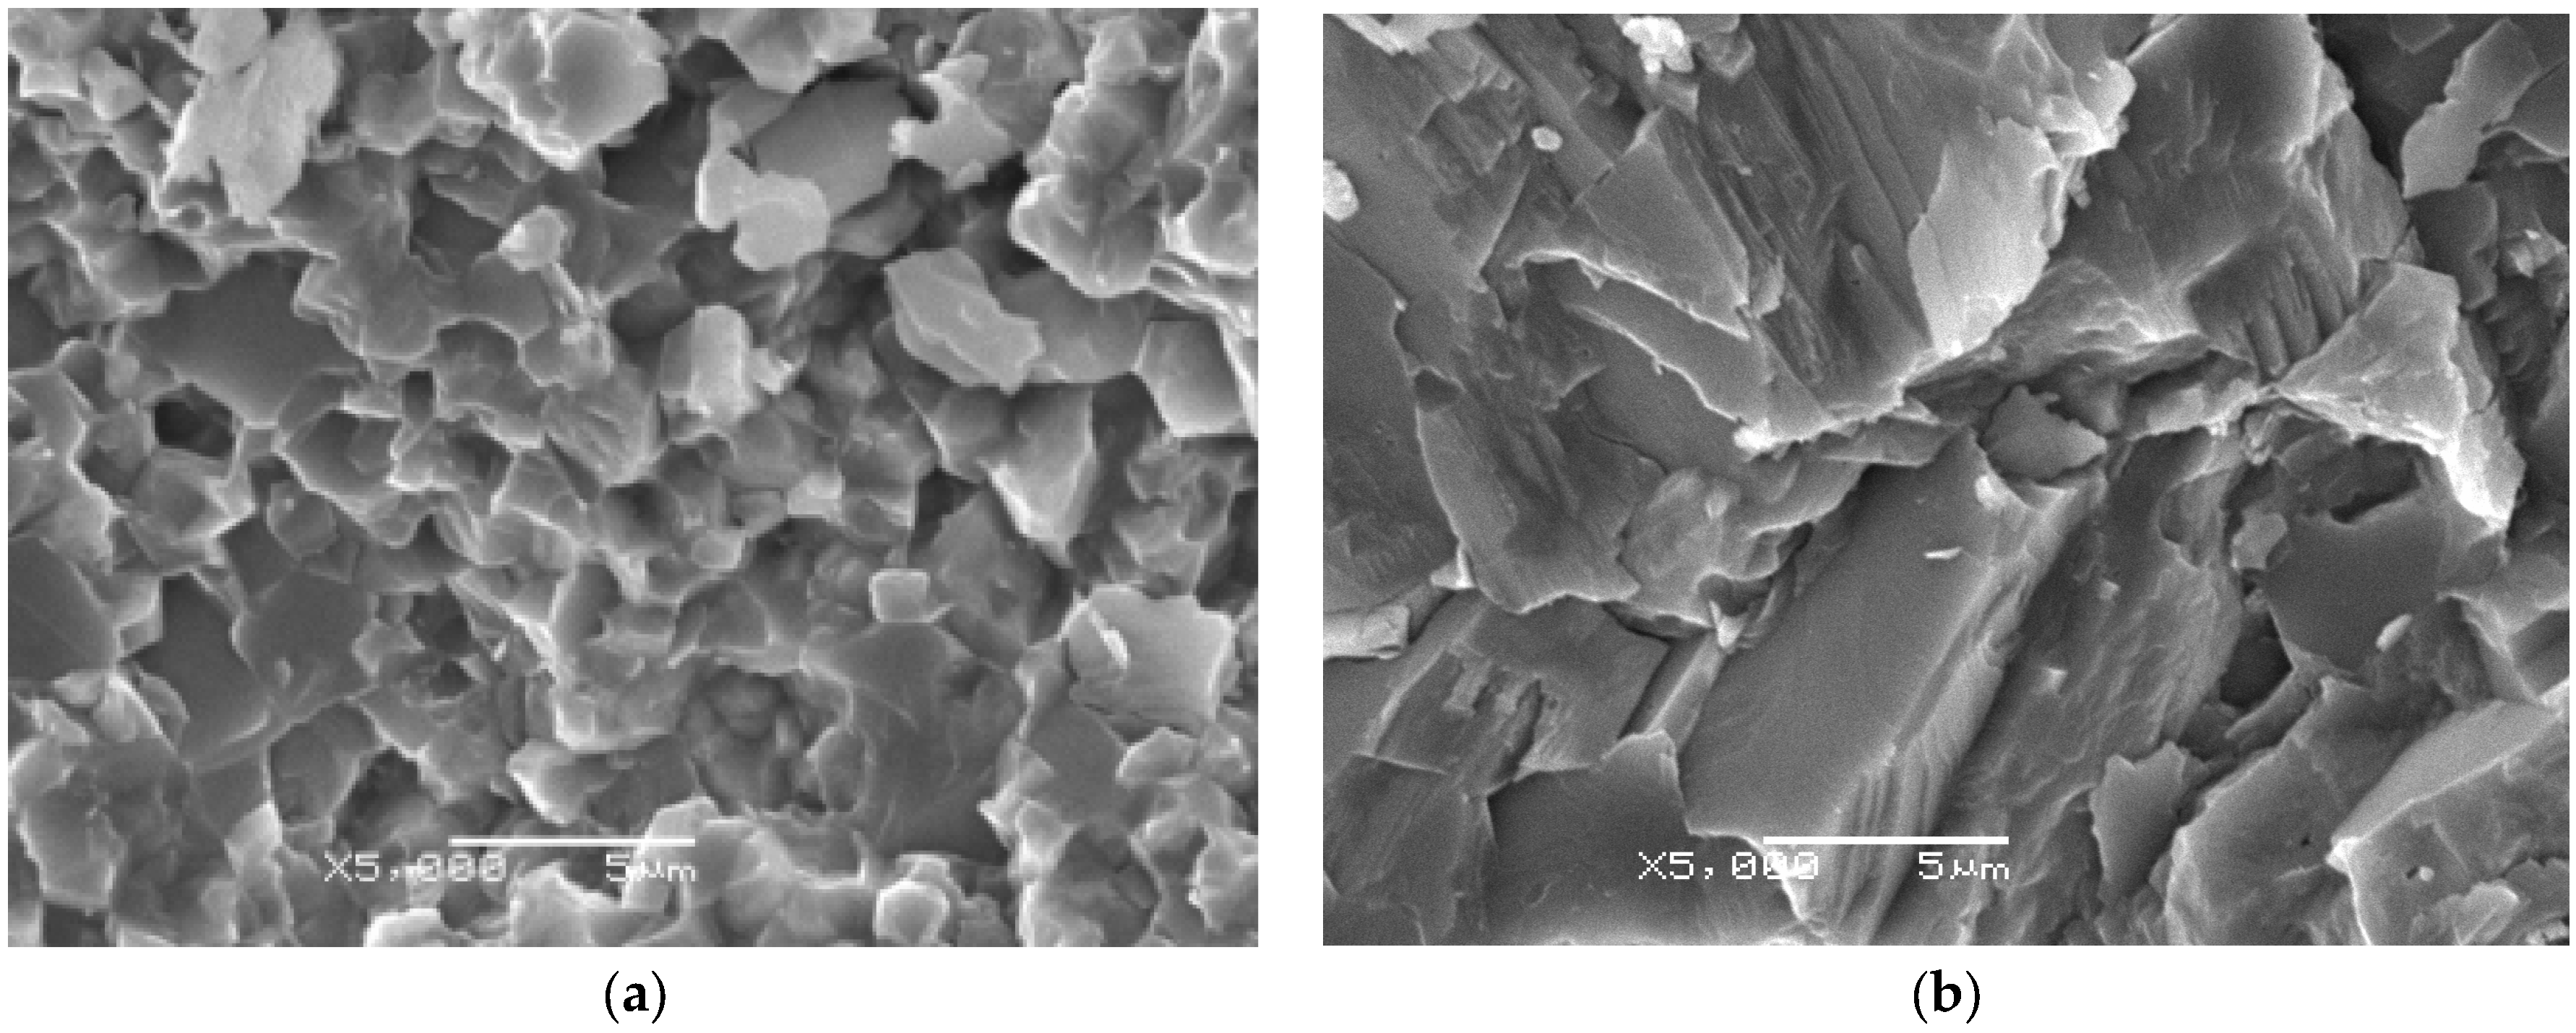
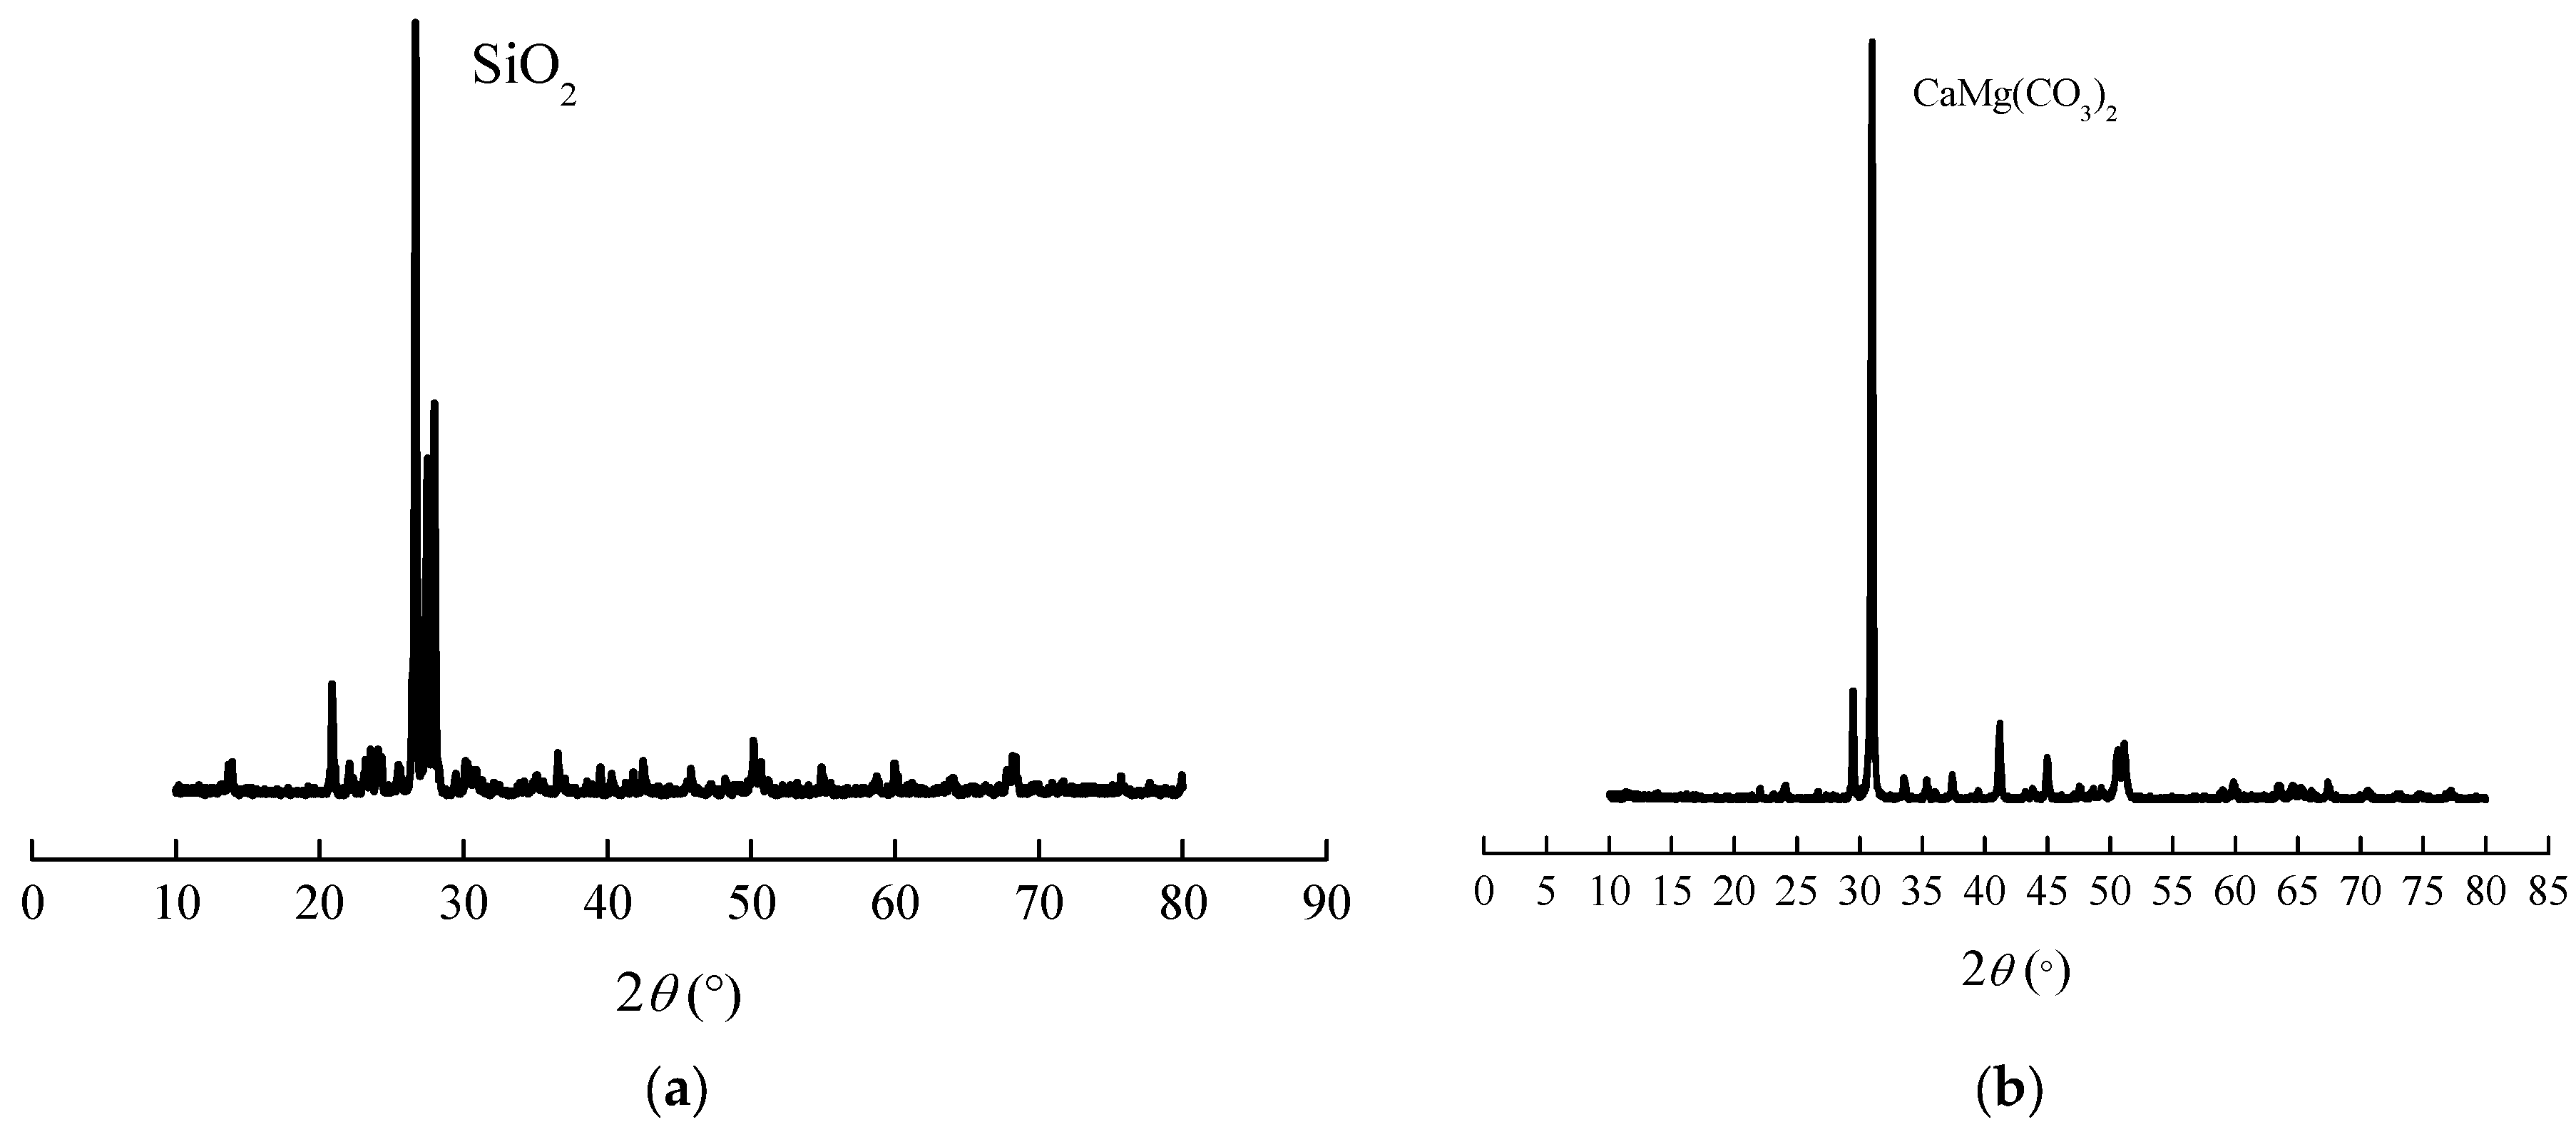
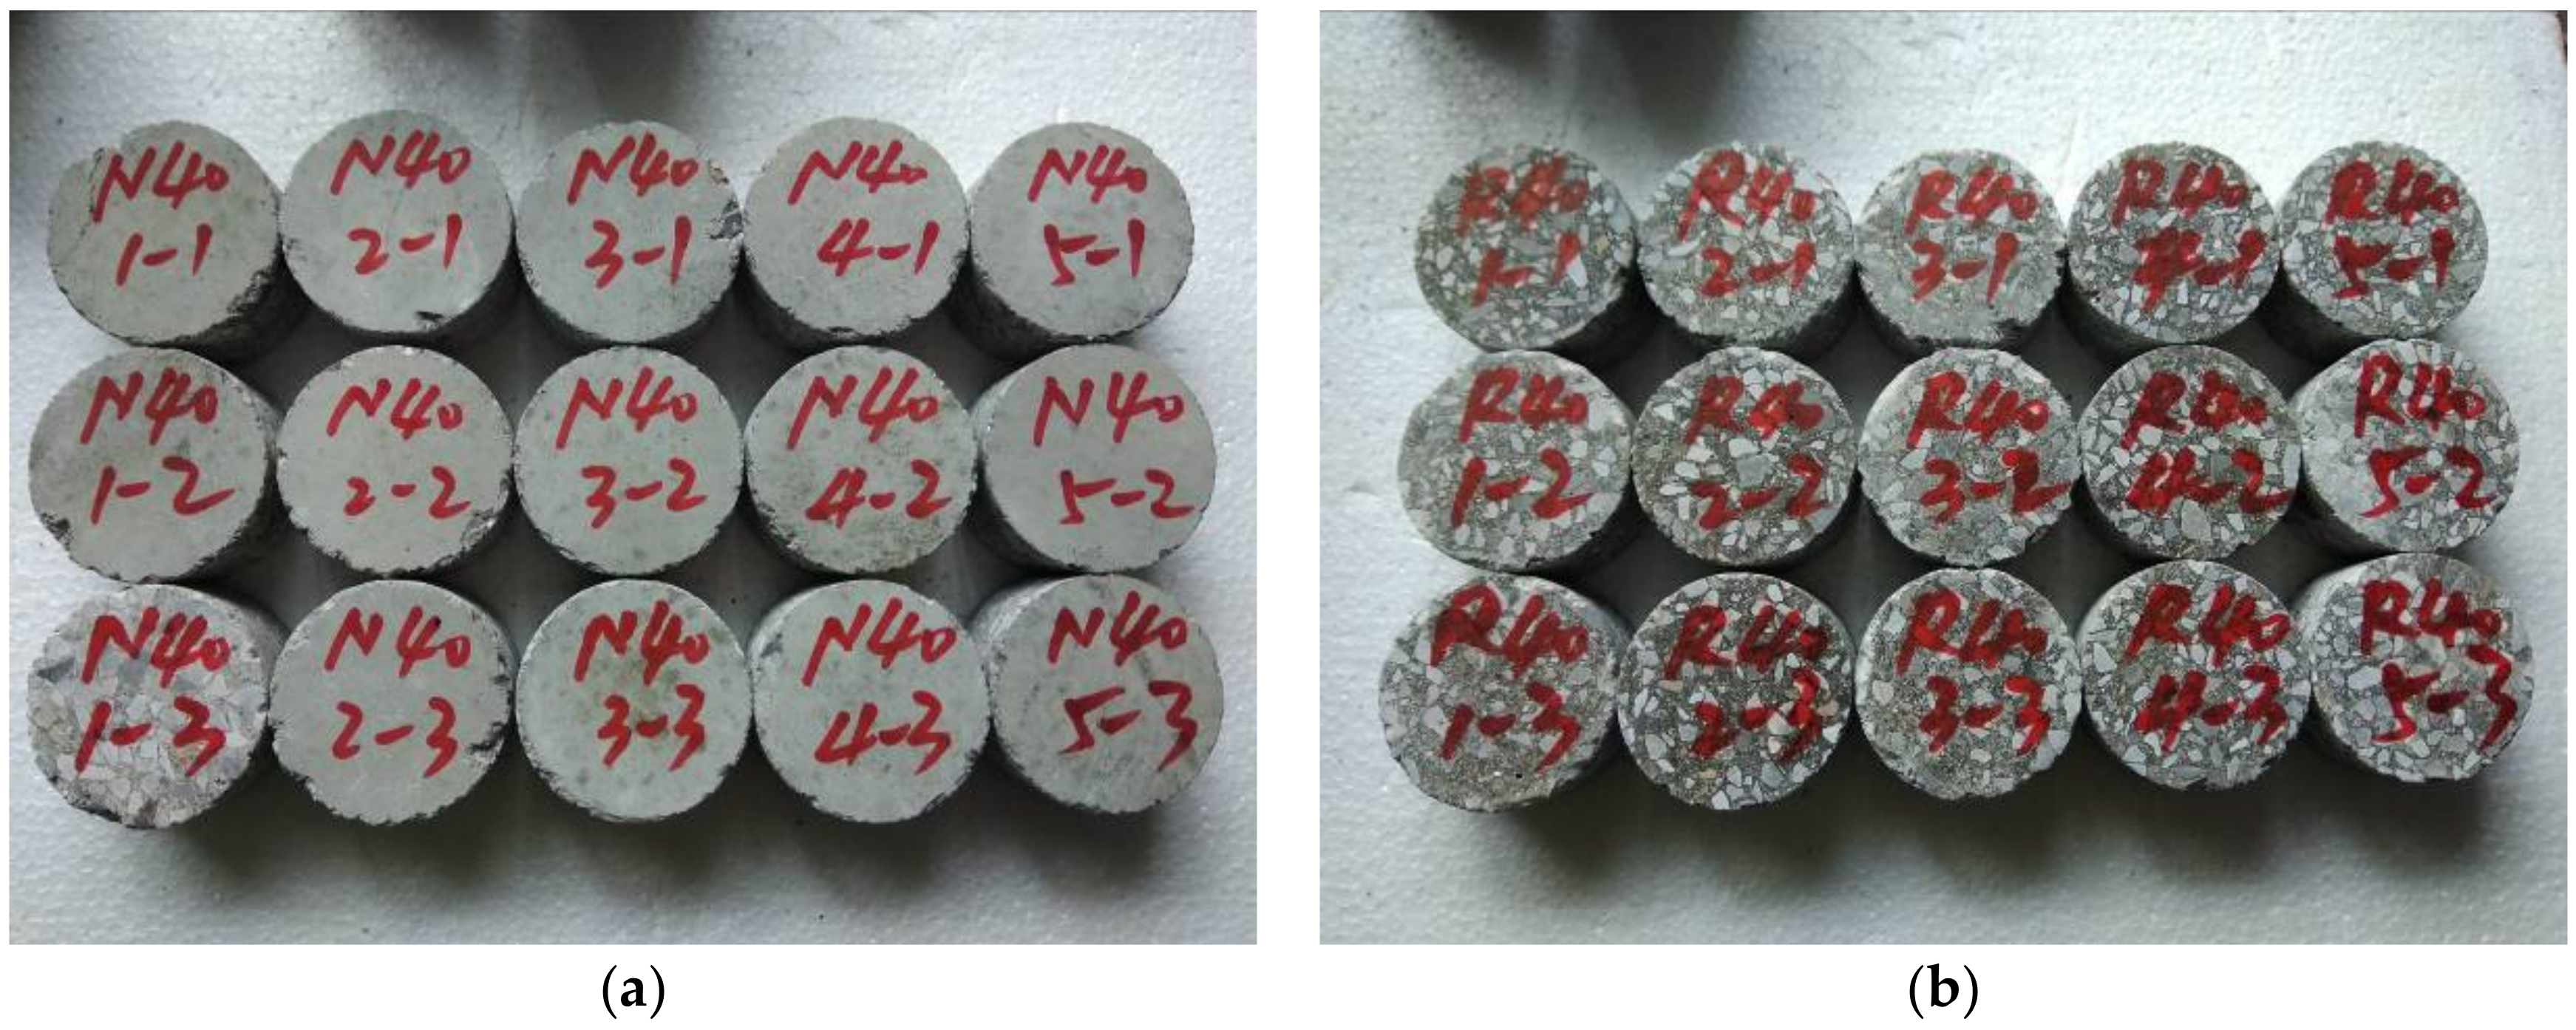
2.1. Materials and Specimens
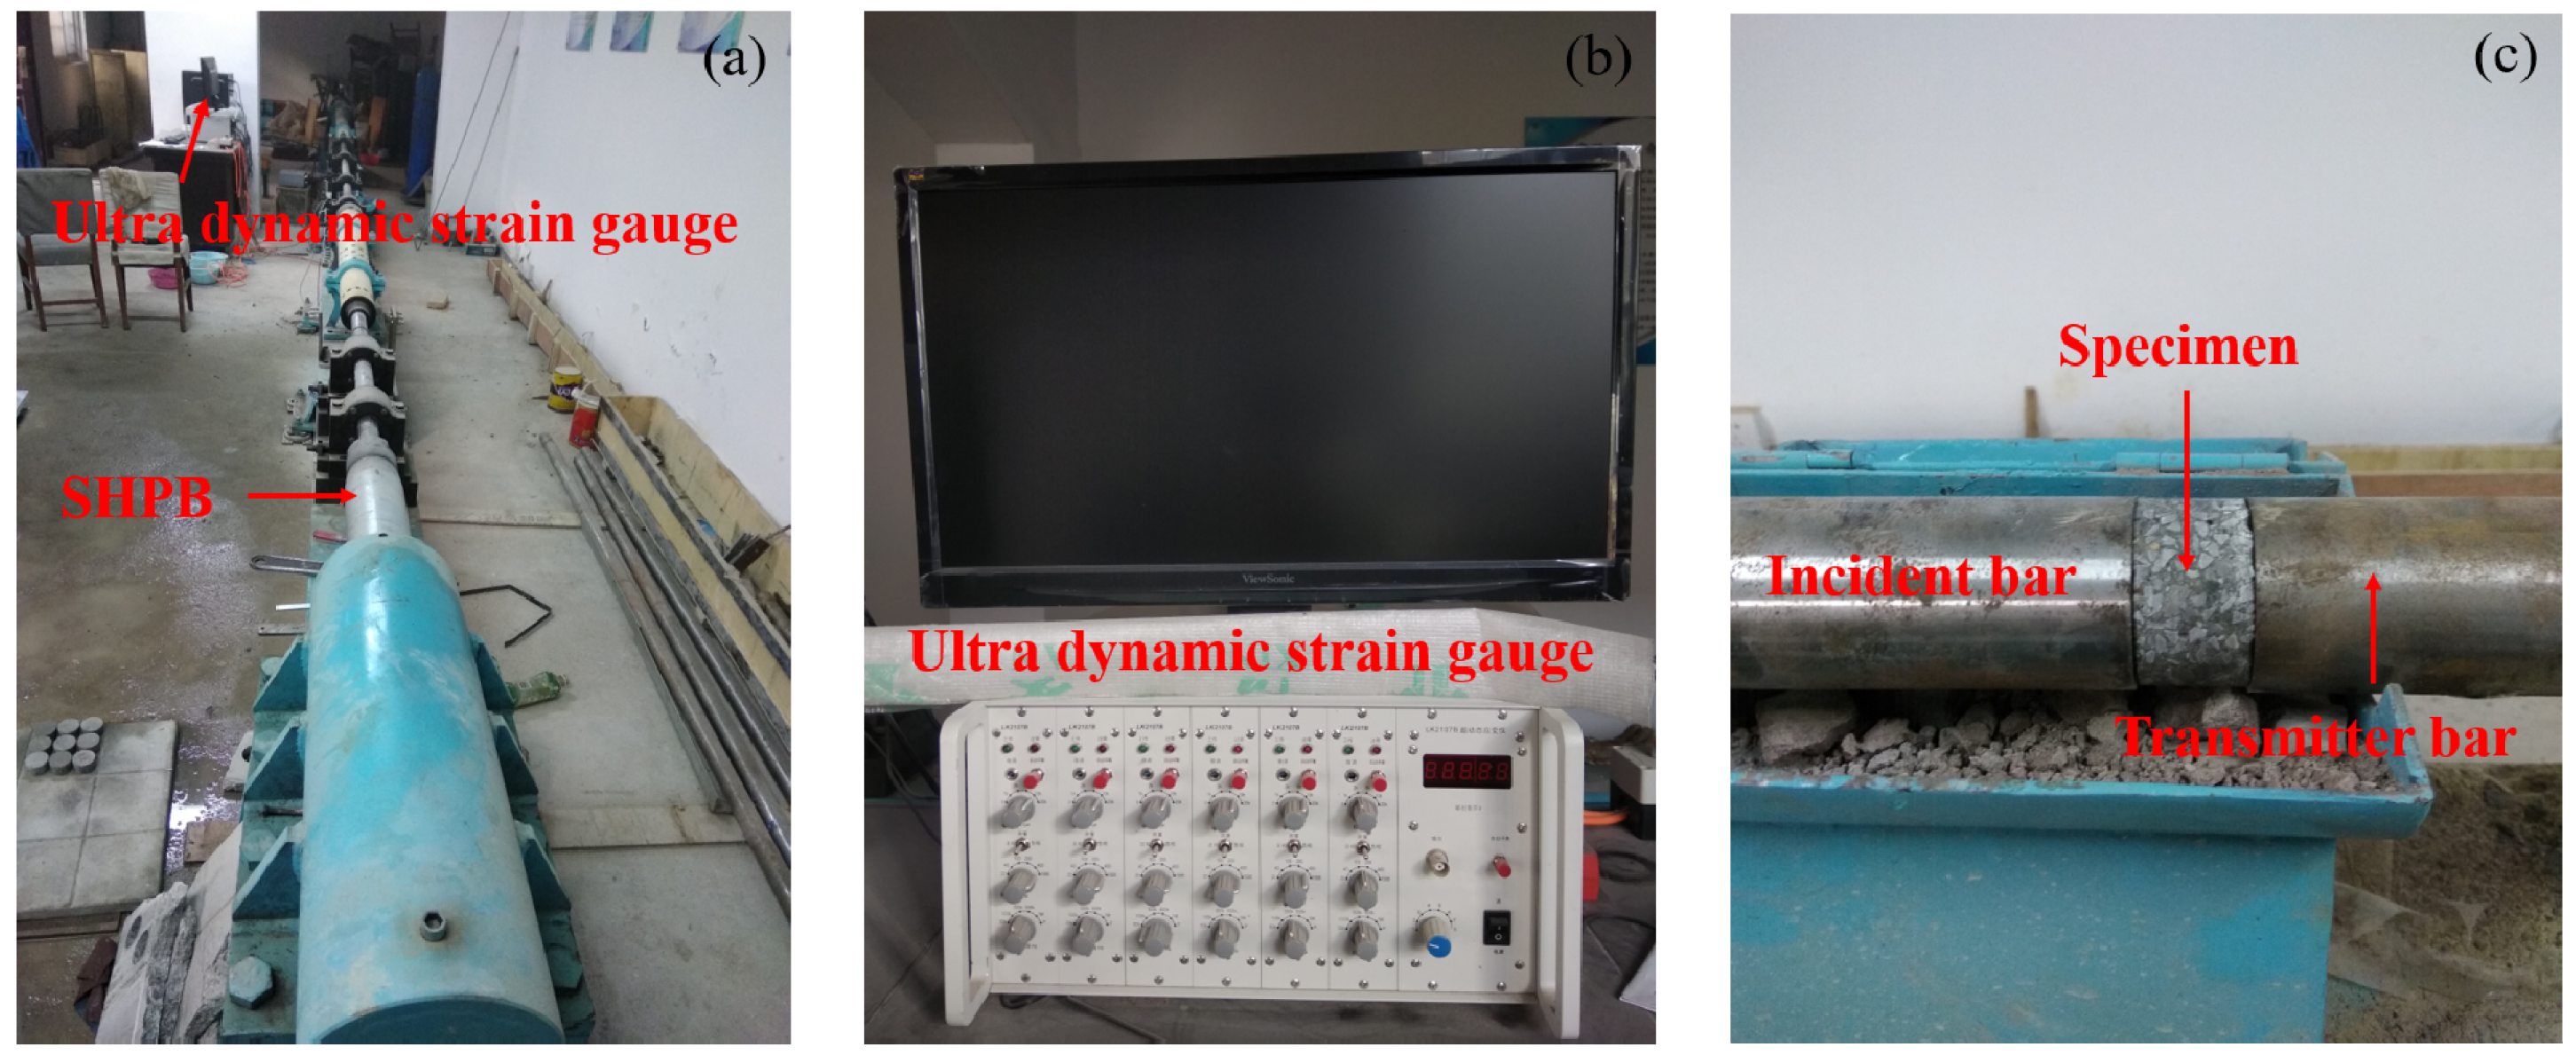
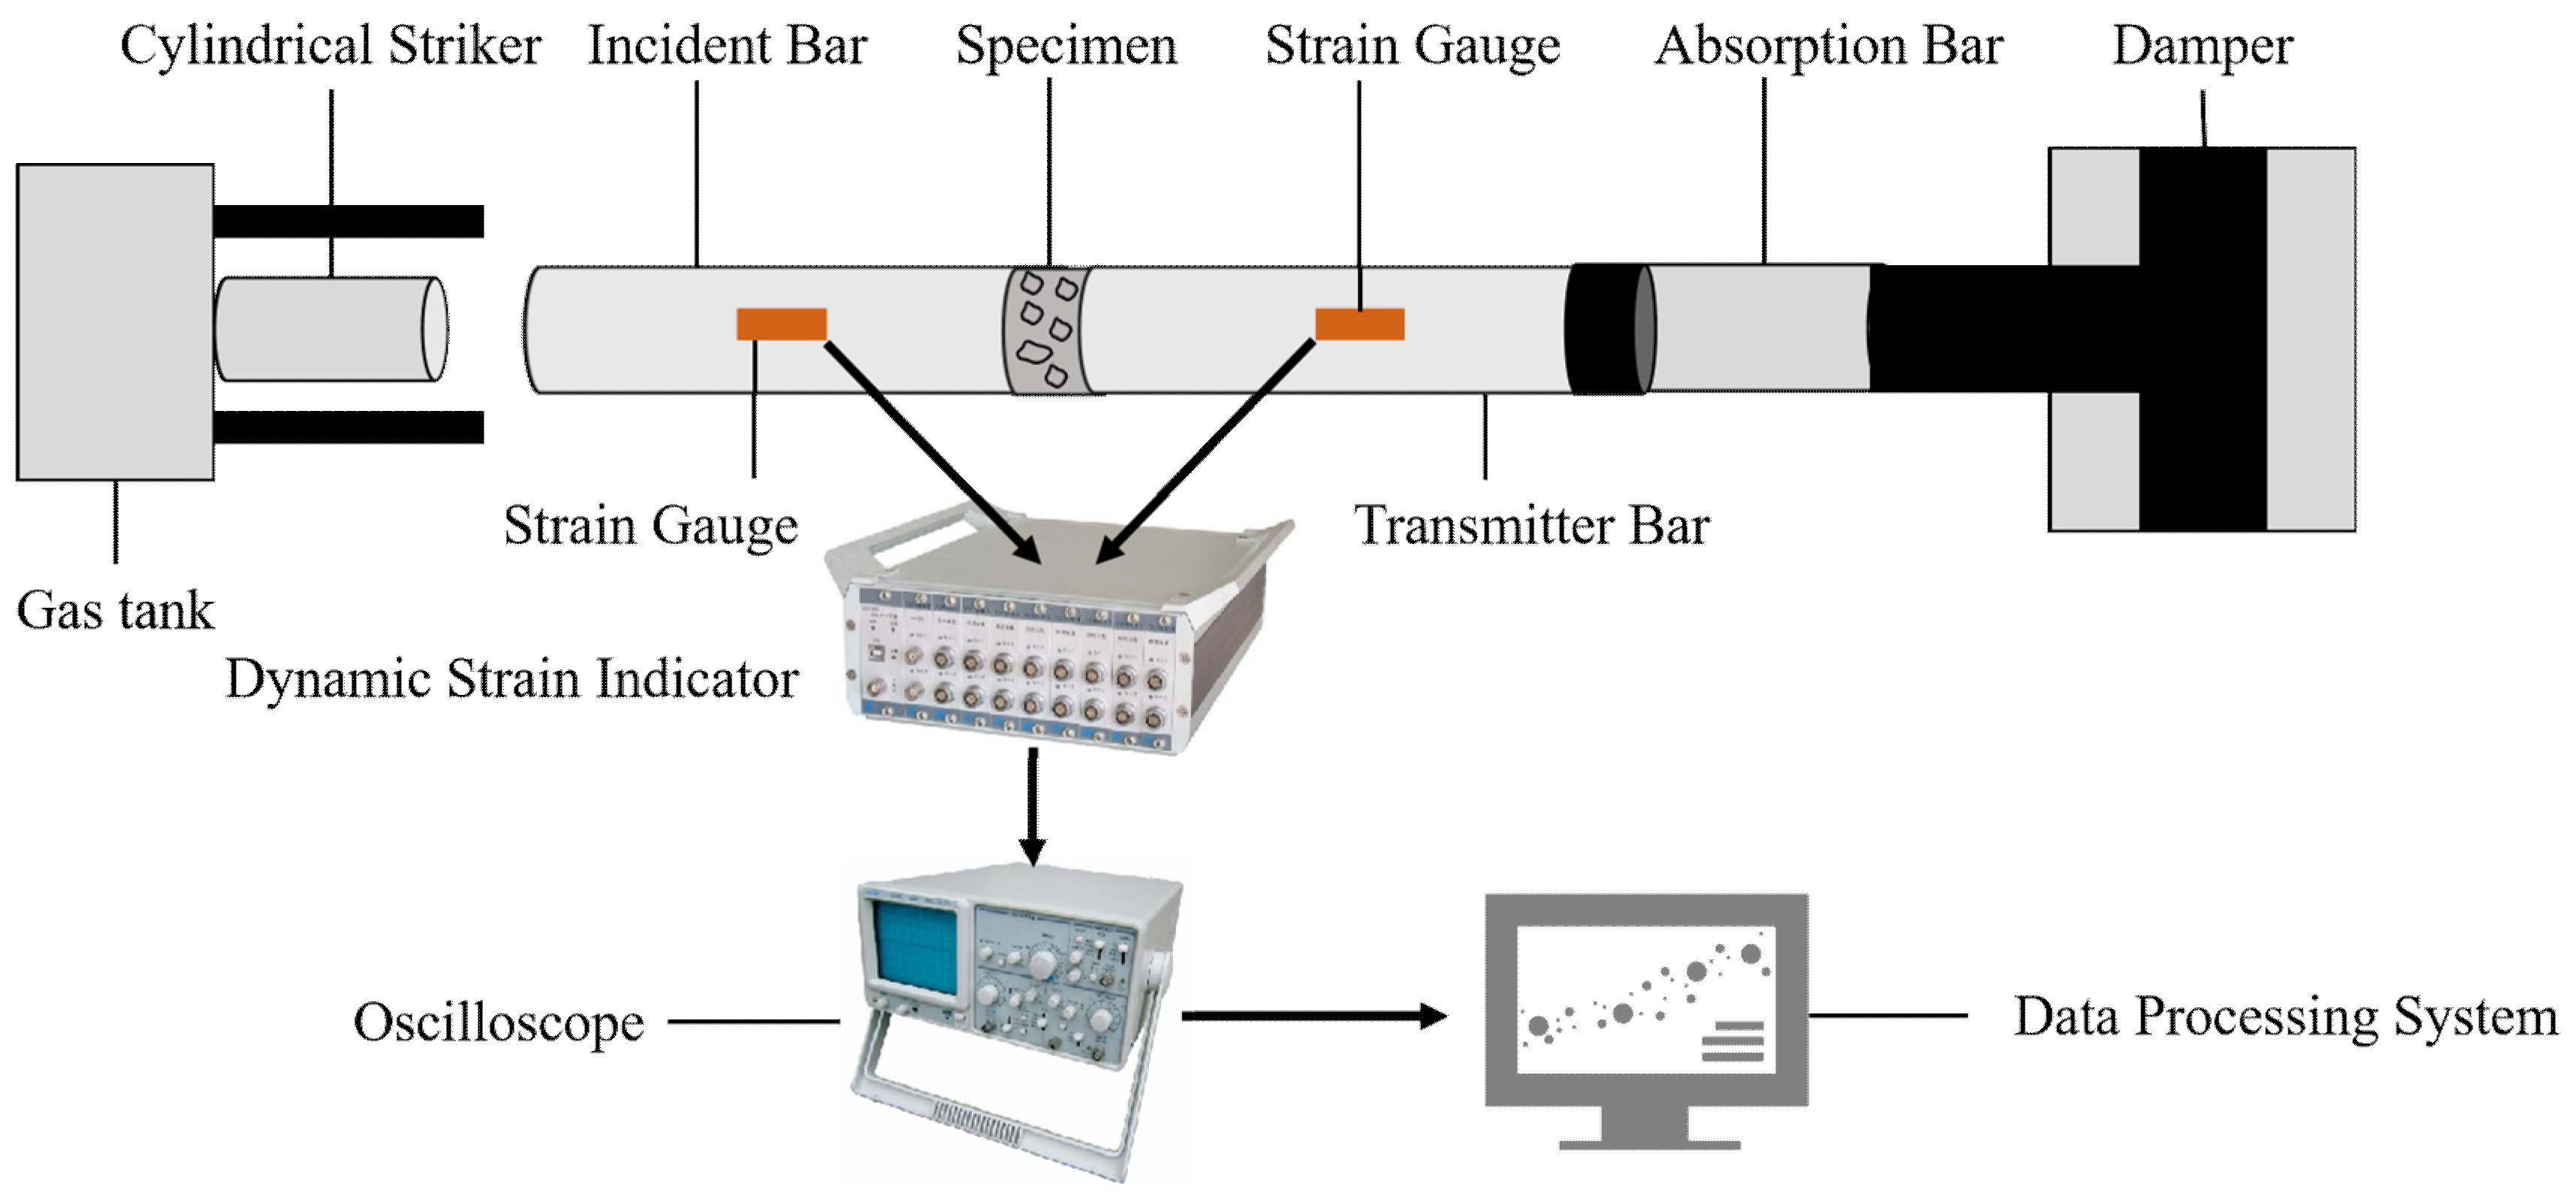
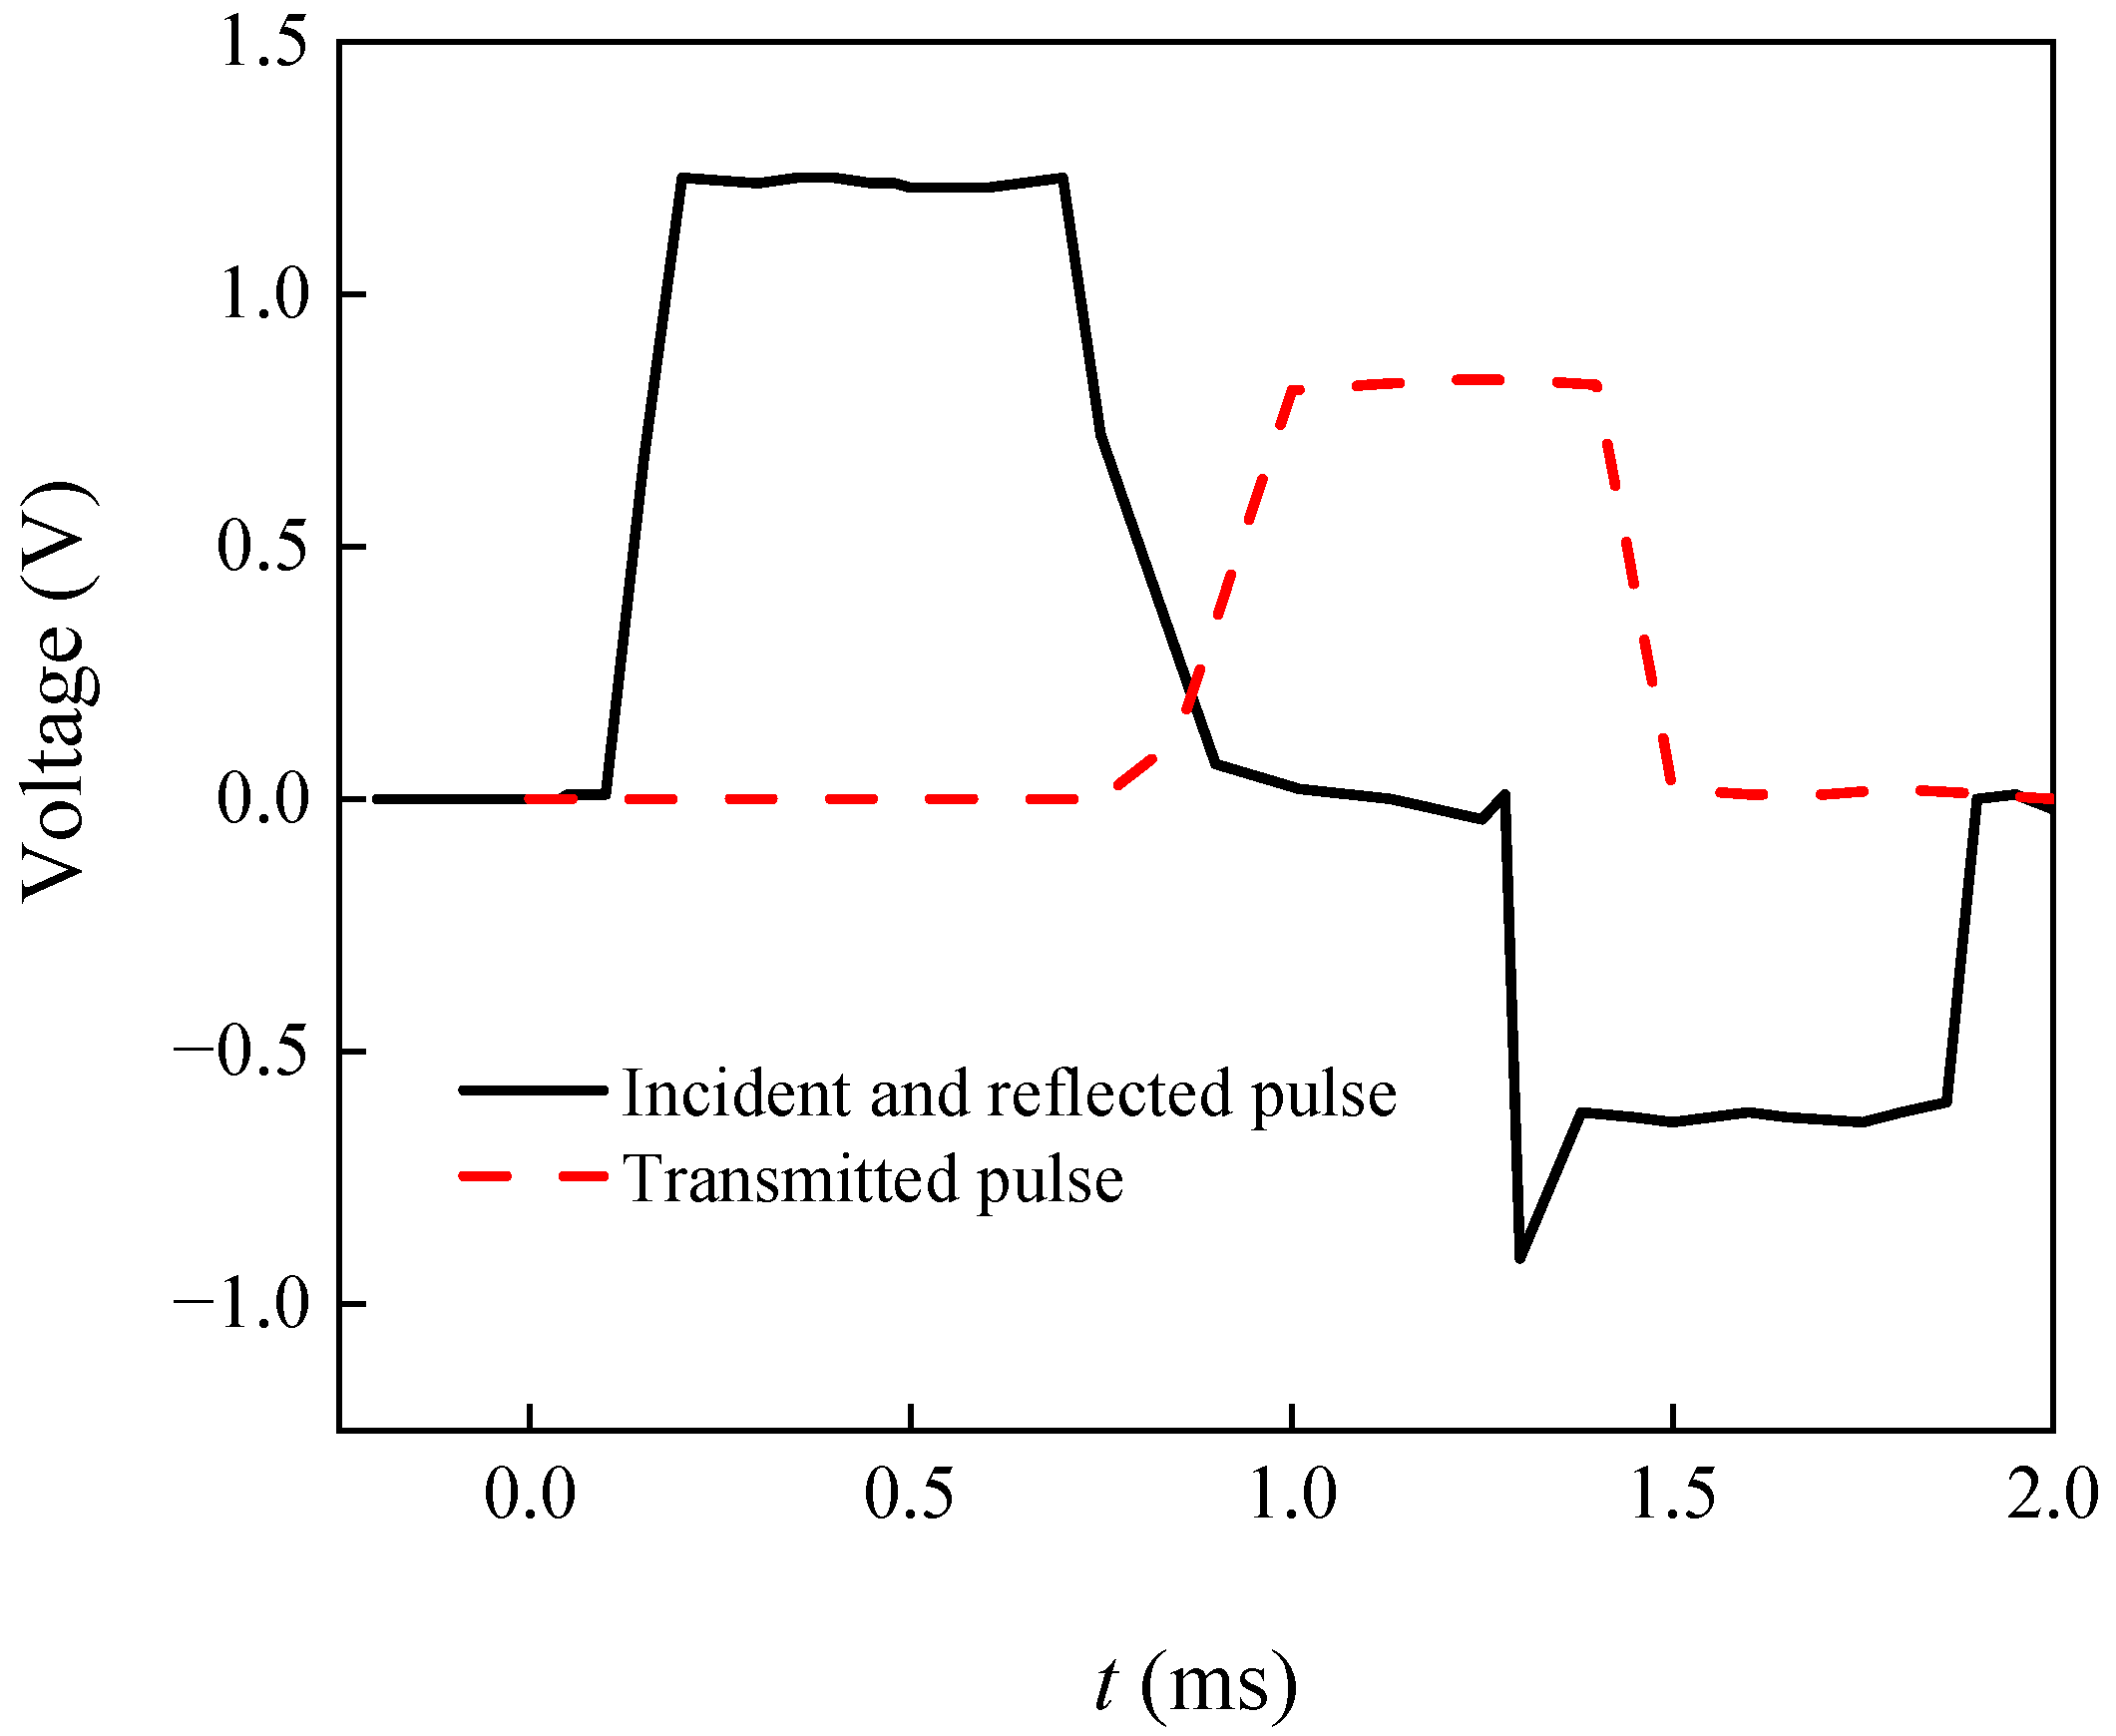
In quasi-static and dynamic tests, the NC included Portland cement (42.5R), fine aggregate, coarse aggregate and water. The difference between the NC and RC was the coarse aggregate, as shown in Figure 1. The design strength grade of concrete specimens was C40. The fine aggregate was river sand. The coarse aggregate of the NC was crushed stone (see Figure 1a) the maximum diameter of which was less than 6 mm, while the coarse aggregate of the RC was gravel (see Figure 1b) which was obtained from demolition waste and treated by microwave-assisted beneficiation. Then, the RCAs were crushed (see Figure 1c) and used as recycling materials for cost-effectiveness and environmental purification. The coarse aggregate replacement rate was 100% in the RC, i.e., the coarse aggregate of the RC was totally replaced by RCA. Differently from the most prior investigations, the beneficiation method was microwave-assisted beneficiation. Figure 2 and Figure 3 present the scanning electron microscope (SEM) images and X ray diffraction (XRD) patterns of natural coarse aggregate and RCA. It was found that the microwave-assisted beneficiation had a slight influence on the coarse aggregate. The related tests indicated that the natural coarse aggregate and RCA showed similar mechanical properties [10]. Therefore, the RCA may be recovered and reused.
The impact test was selected to investigate the dynamic behavior of the NC and RC specimens. For the RC specimens, the water absorption was higher than that of the NC. Therefore, it was necessary to use additional water to assure the same water–binder ratio. According to the mix design specification of the concrete (JGJ55-2011), The water–binder ratio was 0.38. The additional water in the RC specimens was 4.6%. Five cubic specimens with dimensions of 150 mm were fabricated and cured for 28 days at room temperature. Their compressive strengths were measured according to the standard compression tests. The SHPB specimens had diameters of 50 mm and heights of 25 mm [29]. The specimens were divided into two groups and tested after 28 days of standard curing. Each specimen is named using a X40-Y format, where X denotes NC or RC, and Y represents the number of specimens, as shown in Figure 4.

2.2. SHPB Test

The SHPB device used in the dynamic impact testing is shown in Figure 5a,b. The SHPB apparatus consisted of the following parts: gas tank, cylindrical striker (50 mm in diameter, 400 mm in length), incident bar (50 mm in diameter, 3000 mm in length), transmitter bar (50 mm in diameter, 3000 mm in length), absorption bar, damper, dynamic strain indicator, oscilloscope, data processing system and testing specimen. The specimens are sandwiched between the incident and transmitter bars, as shown in Figure 5c. During the test, the pressurized gas promoted the striker bar, and a stress pulse was produced in the incident bar. The stress pulse impinged the specimen. The achieved strain rates in the SHPB test were not constant throughout the test. The dynamic impact process of the SHPB is shown in Figure 6. Five rating air pressures (0.1 MPa, 0.2 MPa, 0.3 MPa, 0.4 MPa and 0.5 MPa) were investigated. Figure 7 shows the typical pulse signals during SHPB impact test. According to the impulses, the stress, strain and strain rates can be obtained [22].

3. Experimental Results

The experimental results of the quasi-static compressive strength testing are given in Table 1. The average compressive strengths of the NC and RC were 41.52 MPa and 39.44 MPa, respectively. It can be concluded that the compressive strength of the NC was higher than that of the RC by 5.0%. This phenomenon indicated that the waste concrete blocks conducted with microwave-assisted beneficiation had a certain recycling value [10]. The micro-cracks propagated in the longitudinal direction; there were several cracks running through the specimens. Simultaneously, concrete spalling occurred on the edge of specimens.
Table 2 gives the results of dynamic compressive strength testing. Compared to Table 1, the dynamic strengths were higher than the quasi-static strengths. The dynamic compressive strength of the RC increased by 12.9%, 39.6%, 63.2%, 83.3% and 102.2% under five strain rates when compared to the quasi-static compressive strength, respectively, while the NC increased by 17.8%, 44.3%, 67.6%, 87.4% and 105.9%, respectively. The relationship between dynamic compressive strength and strain rate was linear. This also indicated the dynamic strengthening characteristics of concrete.

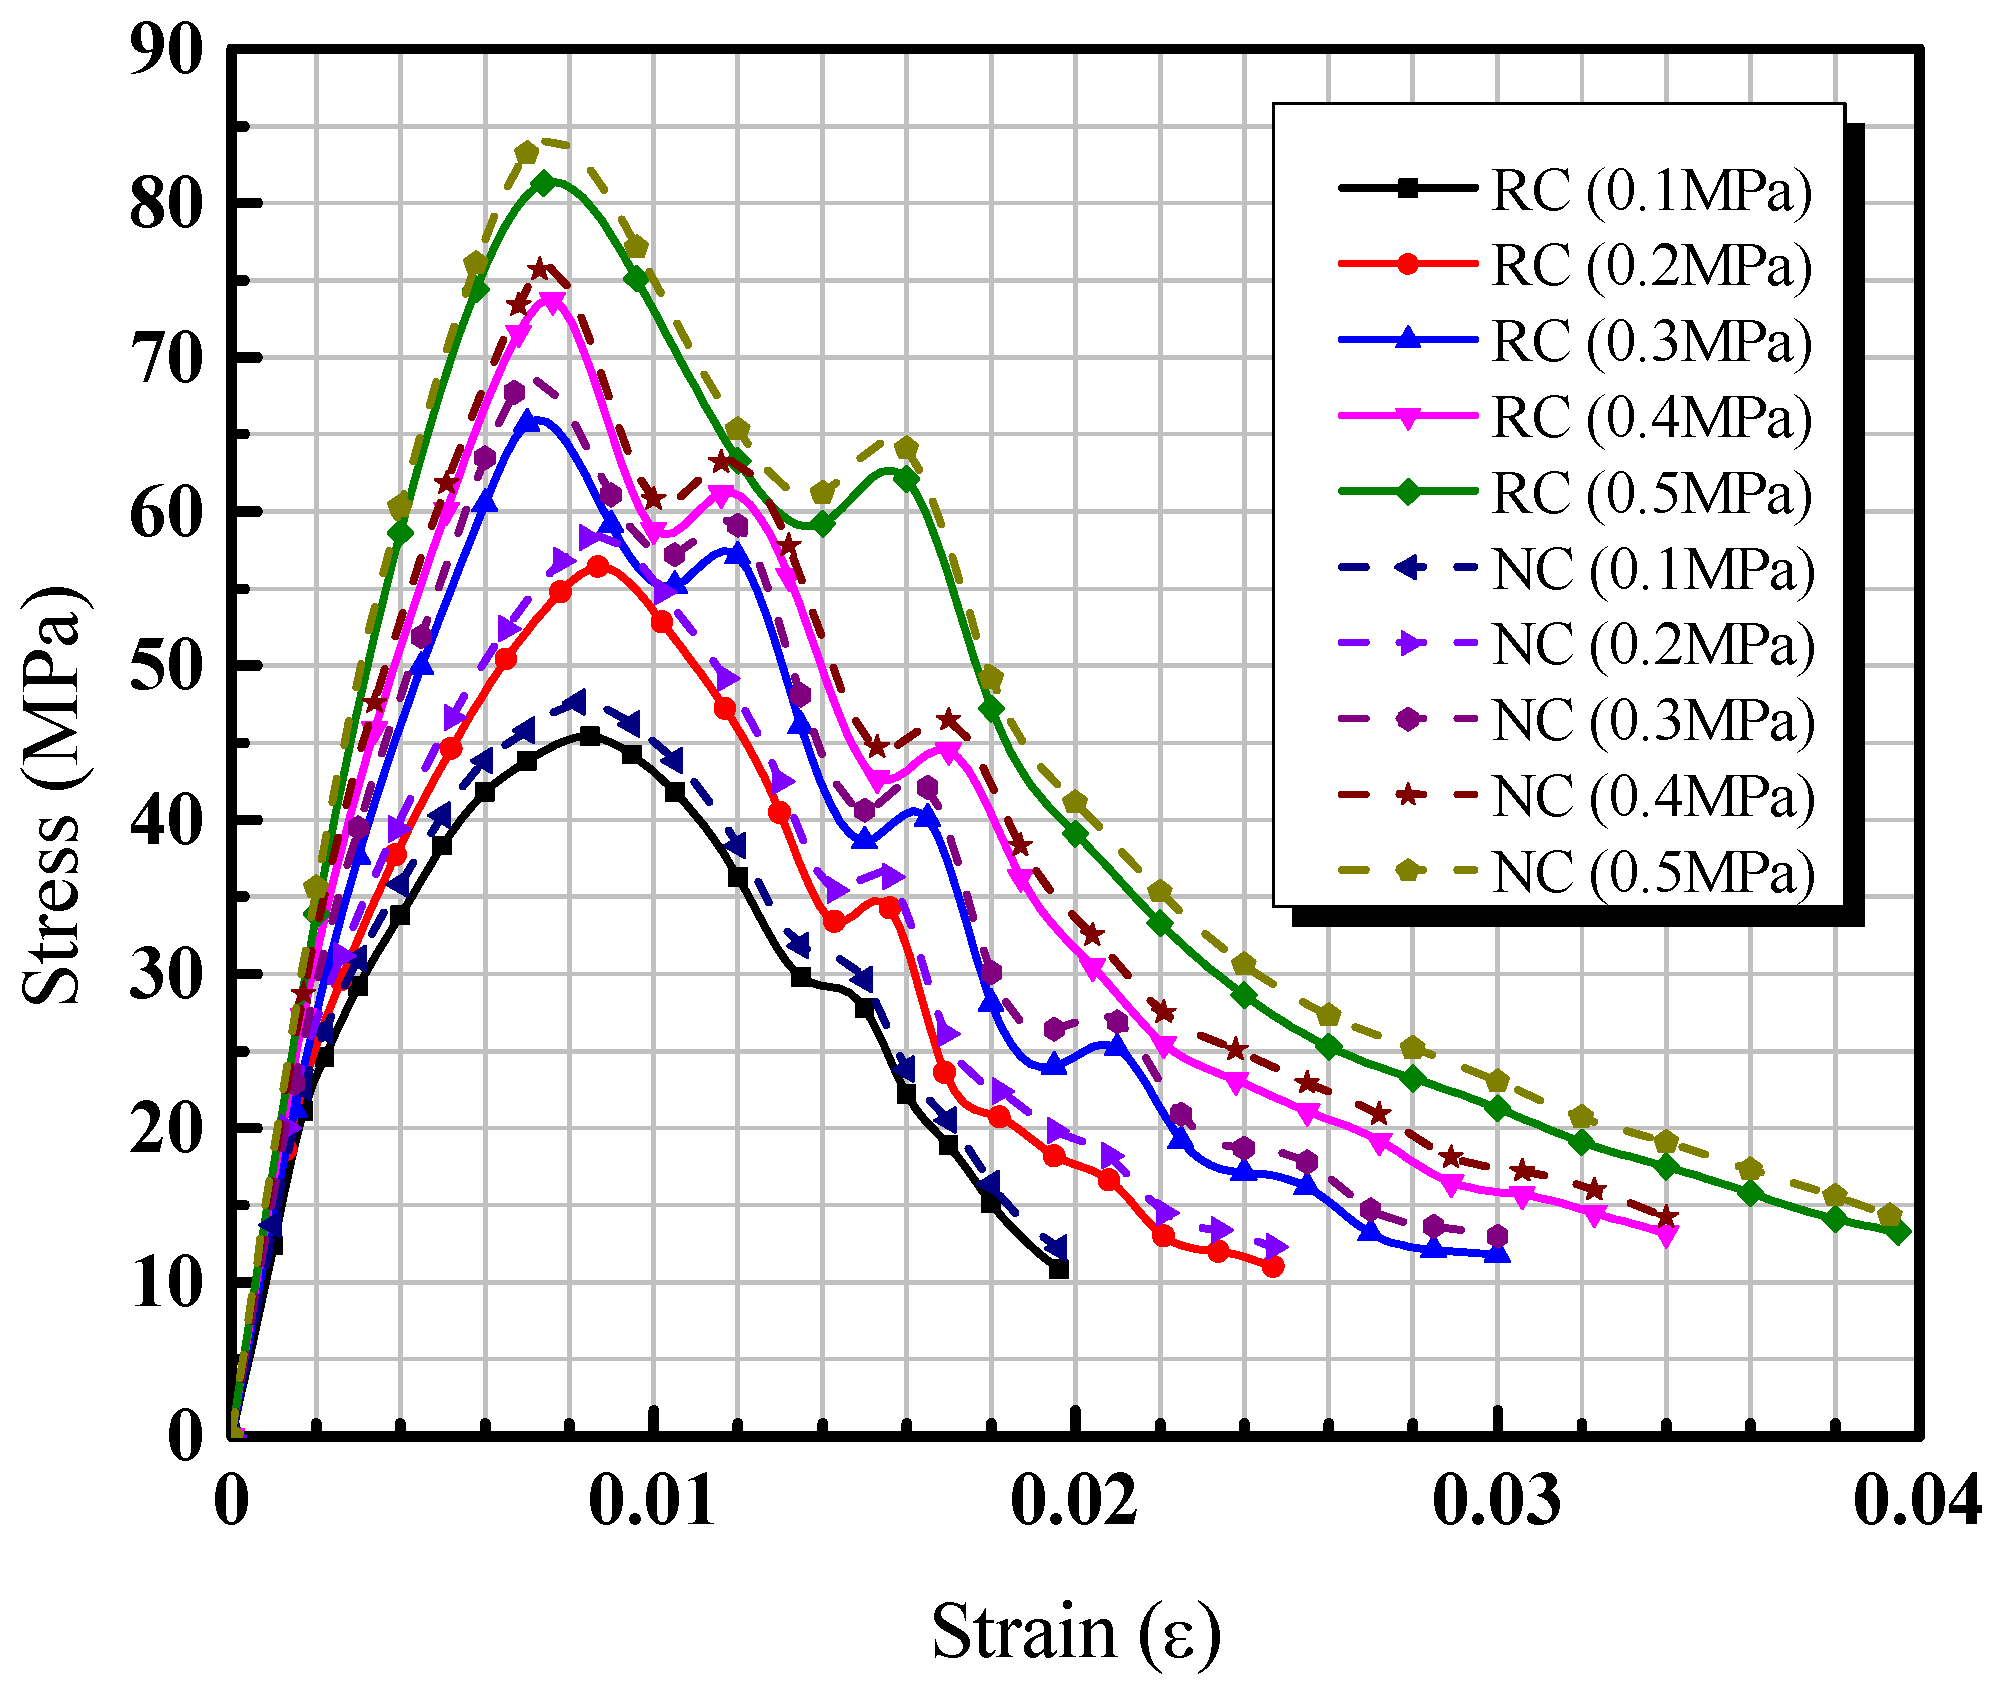
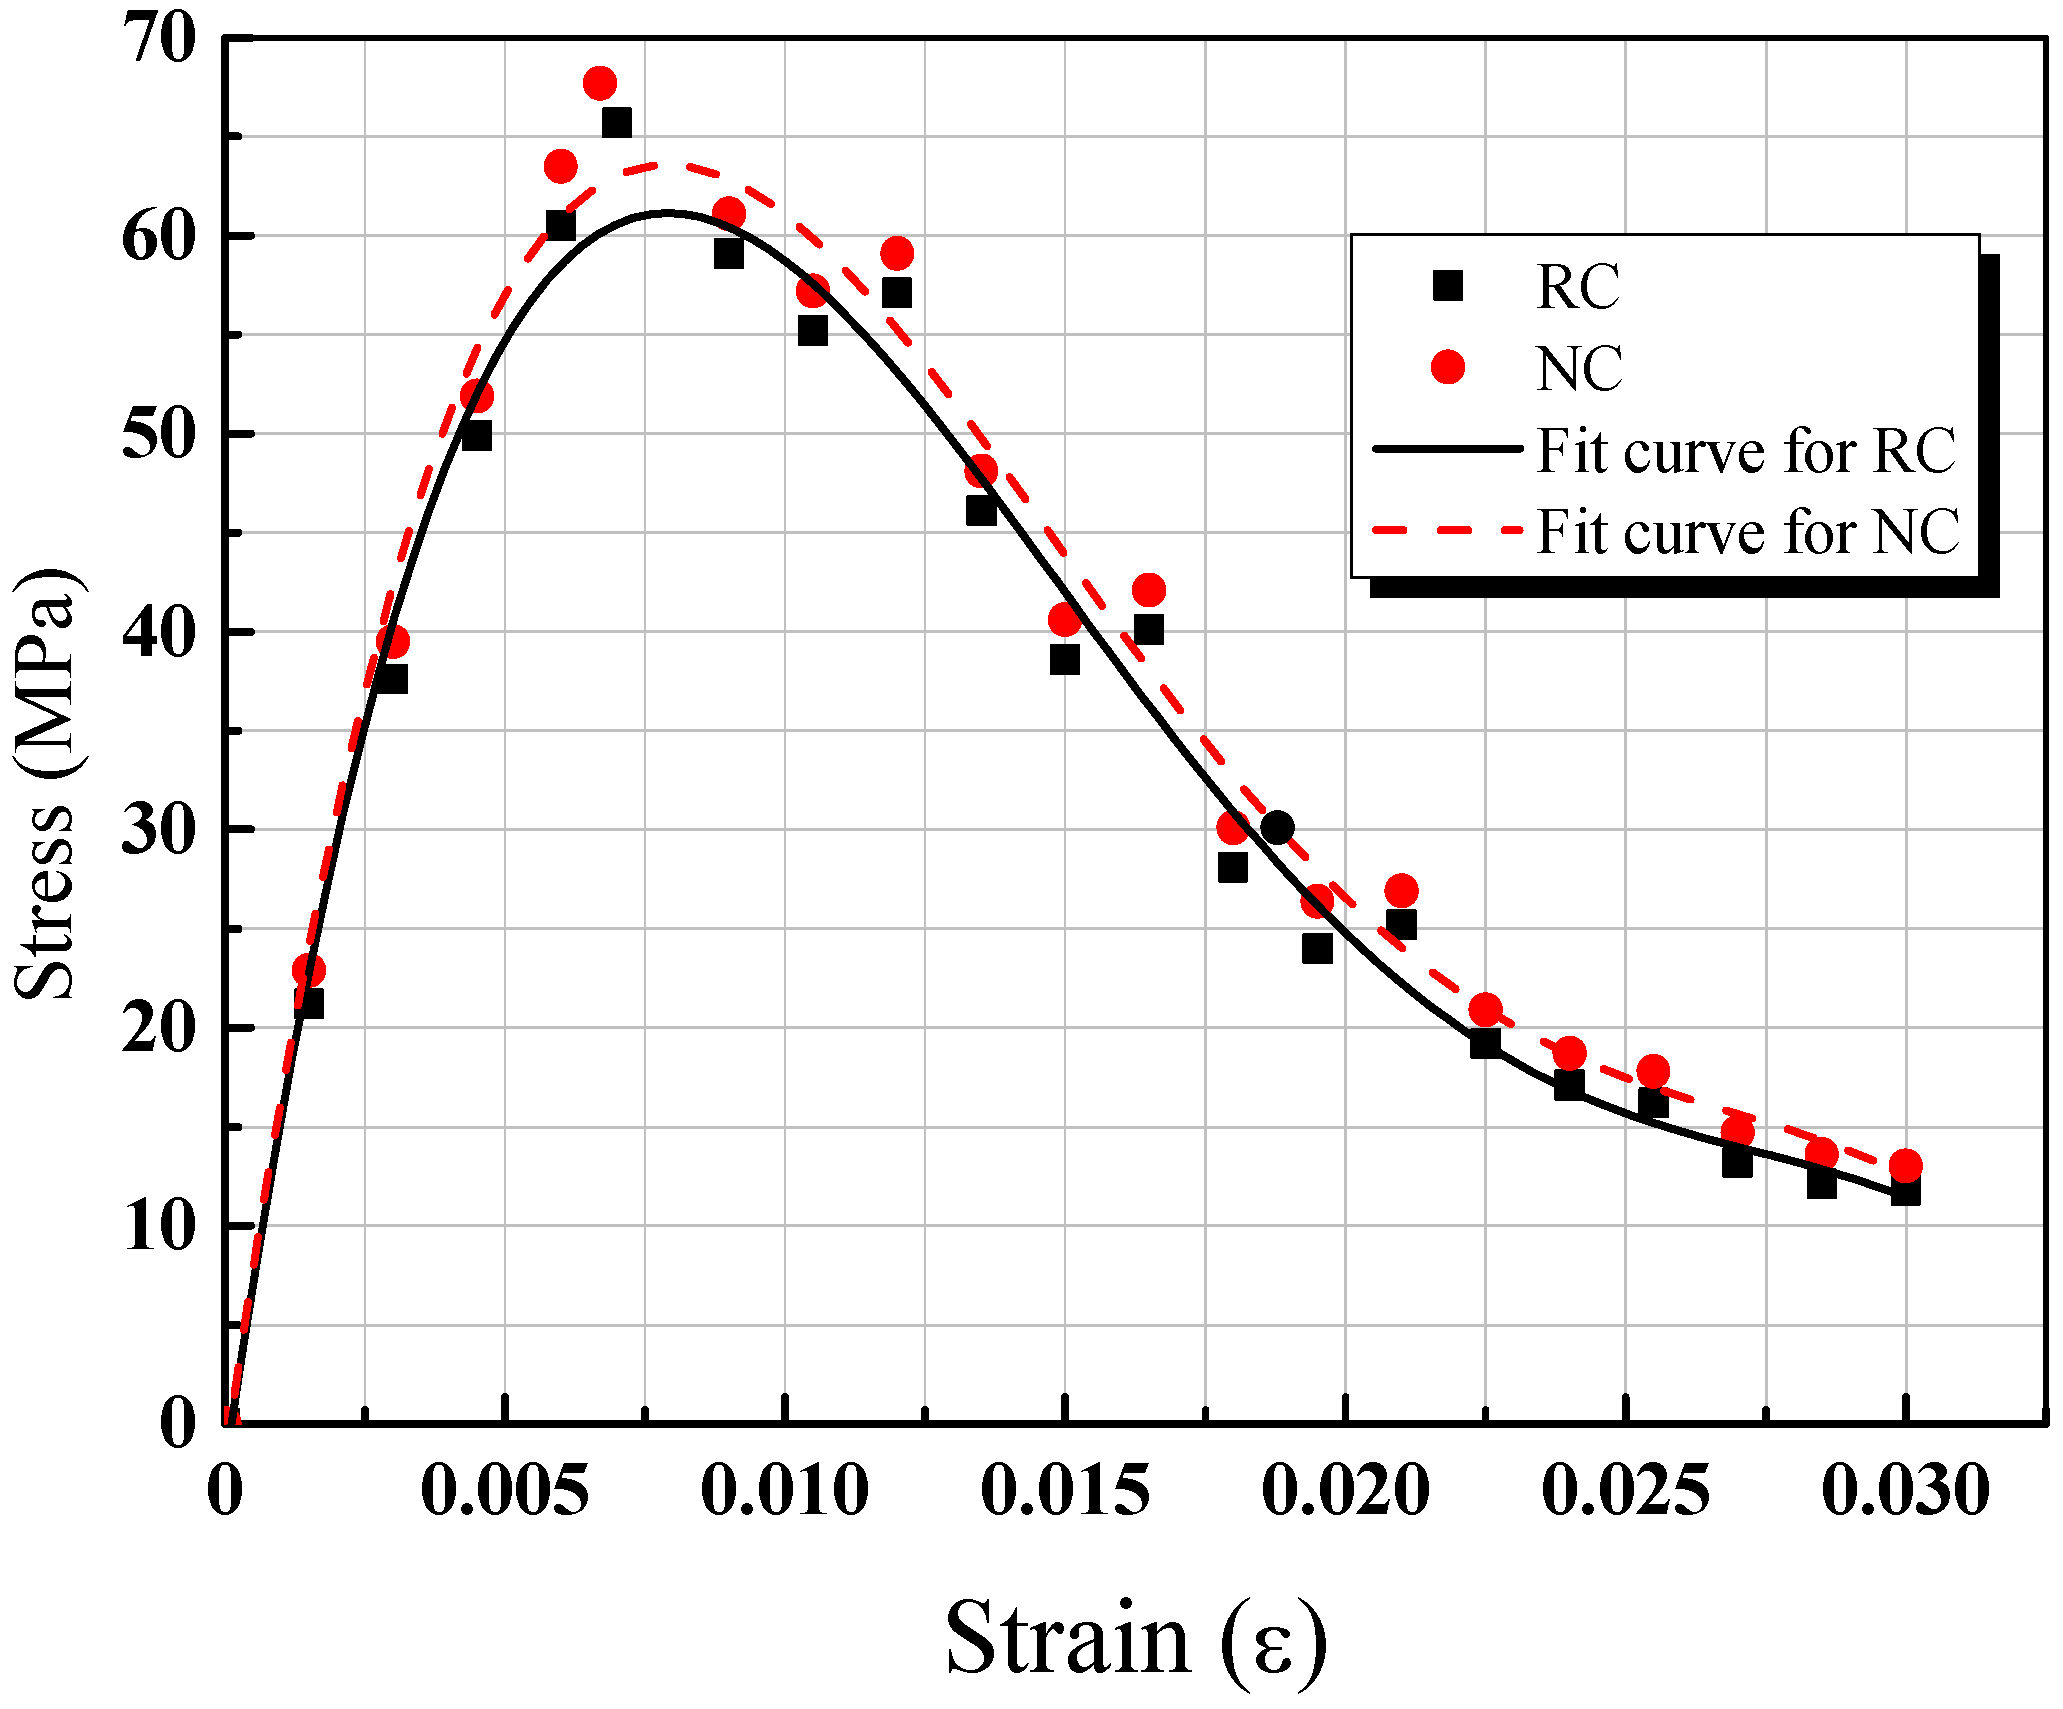
3.1. Stress–Strain Curves

Figure 8 demonstrates the stress–strain curves of concrete specimens under different impact pressures. It can be concluded that the relationship between stress and strain was linear at the elastic stage. The deformation of concrete was mainly influenced by the coarse aggregate and cement mortar. Then, the specimen entered an elastic–plastic state; the increasing rate of strain was faster than that of the stress. The strain further accelerated, while the stress increased slightly. The plastic deformation played a major role at this stage. The micro-cracks originated inside the concrete. However, the concrete was in a stable state before the stress reached its compressive strength. When the stress reached the peak values, the curves presented a decreasing tendency. The bearing capacity of concrete specimens decreased with the increasing of strain. This phenomenon was defined as strain softening.
Compared to the NC and RC impact tests results, it can be found that the impact time was longest when the impact pressure was 0.1 MPa. When the stress increased up to the maximum value, the stress was found to descend gradually and slowly with the increase in strain. This stage was an elastic strengthening stage, and the pores and cracks were compacted. Therefore, the concrete presented a strain hardening phenomenon under the impact loading. The overall impact resistance improved and had an excellent energy dissipation effect. During this initial stage, the relationship between stress and strain was linear when the impact pressure varied from 0.2 MPa to 0.5 MPa. The stress increased up to the peak values in a short time; the specimen was rapidly destroyed. The curves began to decrease rapidly, and the stress value decreased immediately with the increase in strain. When the strain rate increased gradually, the curvatures of the stress–strain curves on the ascending stage became smaller. It was indicated that the concrete damage evolution occurred completely. i.e., it was the strain rate strengthening effect of concrete.
Compared to the stress–strain curves at descending phase, an oscillating reaction was found when the impact pressure varied from 0.2 MPa to 0.5 MPa. This oscillation reaction was illustrated the softening property of the concrete. The slope of the stress–strain curves increased with the increasing of impact pressure. The linear line segment become longer and showed the obvious brittle failure advantages. It can also be seen that the higher impact pressure made the concrete harden easily. The higher the strength, the higher the corresponding brittleness. When the impact pressure increased, the stress corresponding to the high impact pressure was greater than that of the low impact pressure. That is, when the impact pressure increased gradually, the strain rate was higher. The relationship between the stress and strain of concrete also developed from strain hardening to strain softening.

3.2. Parameters Study

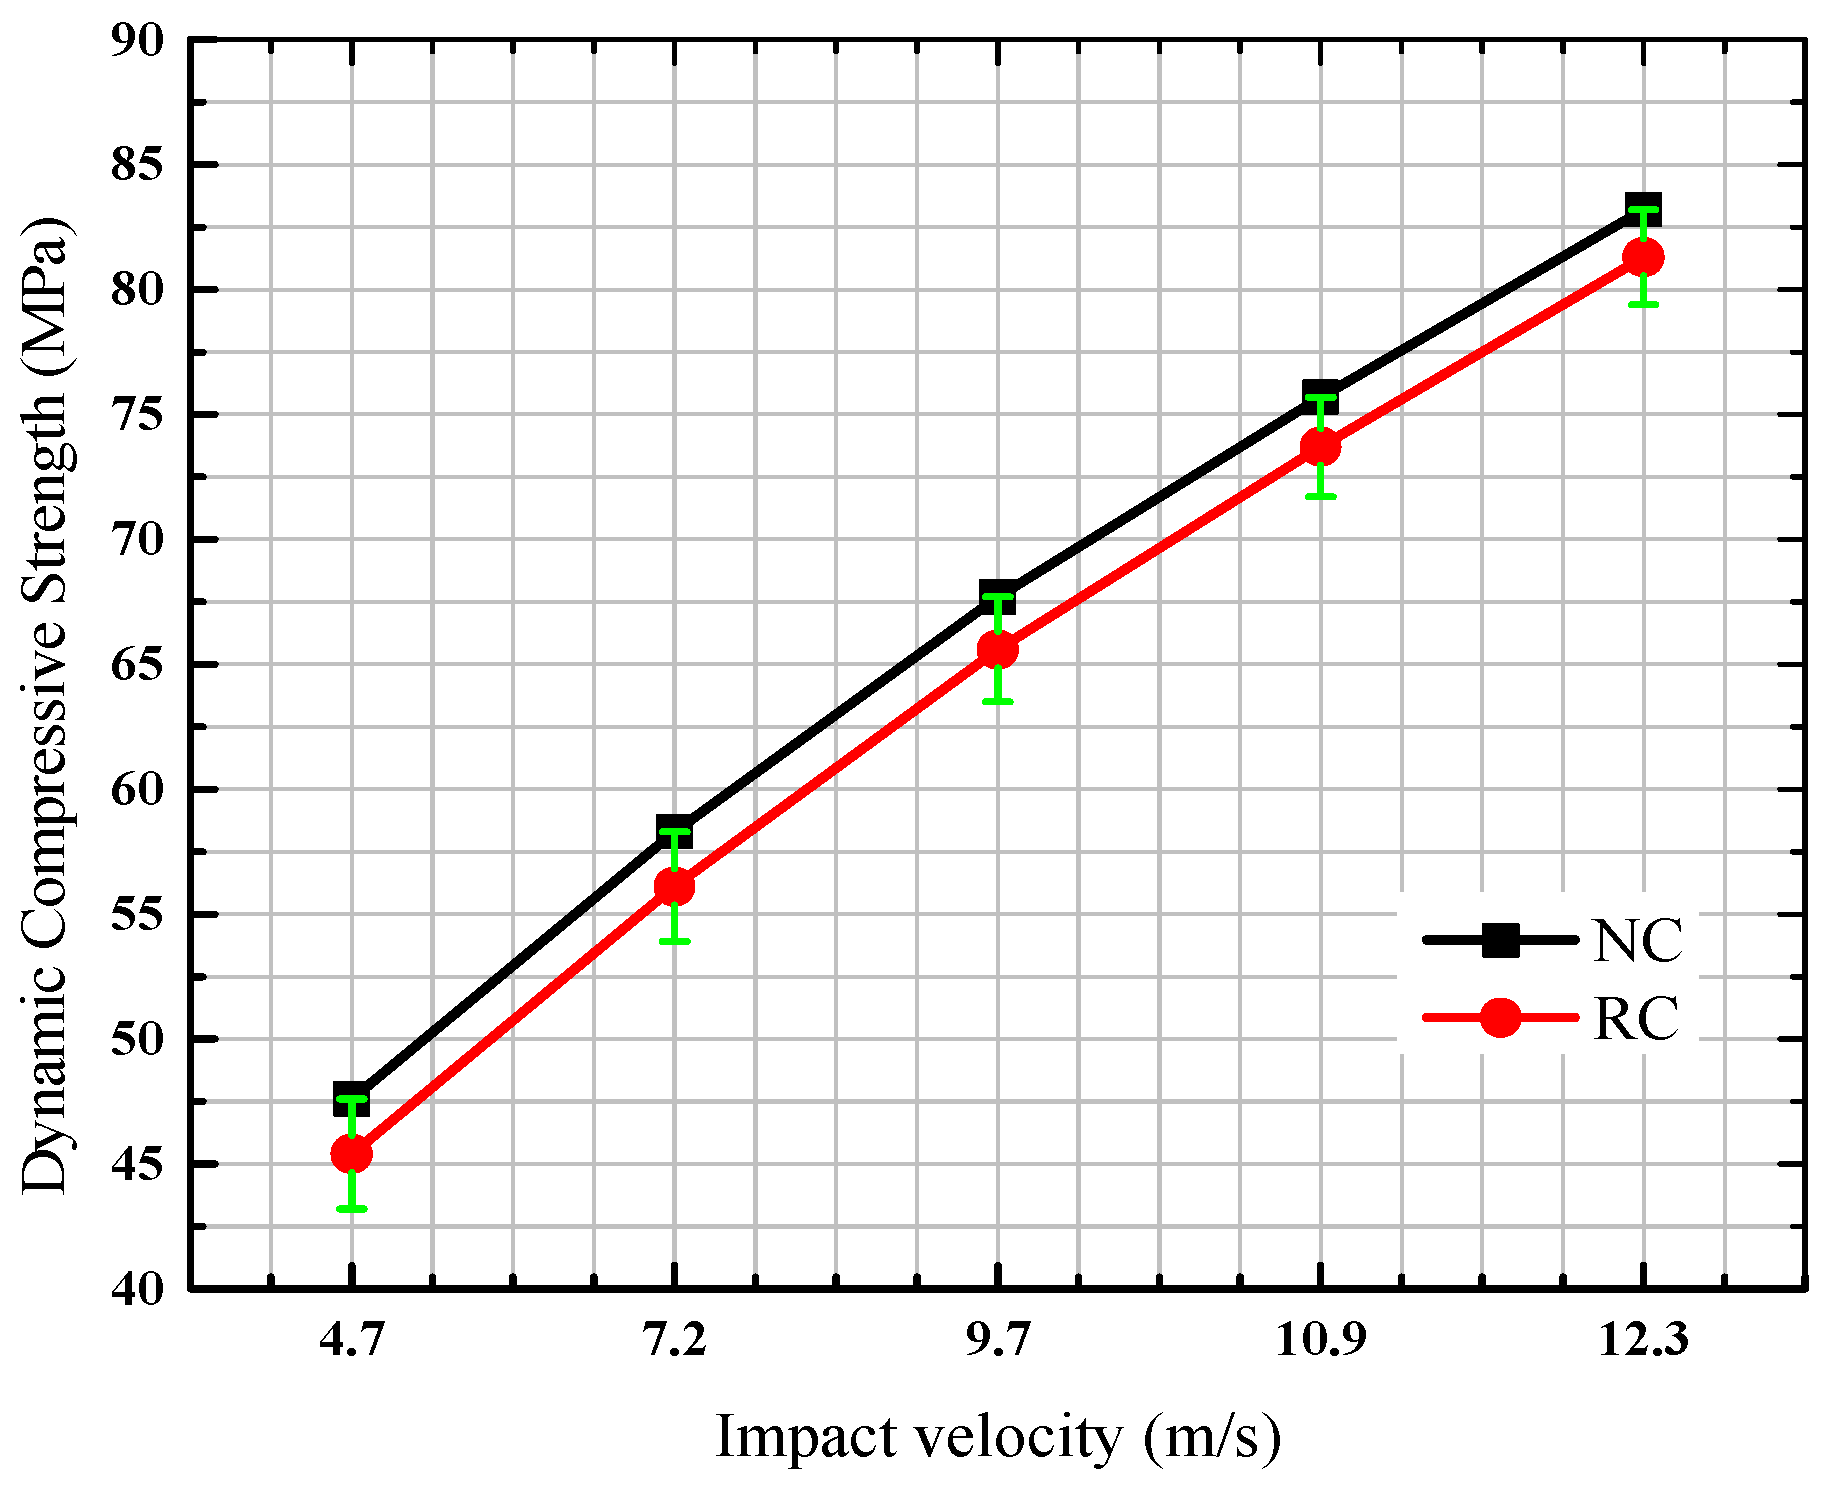
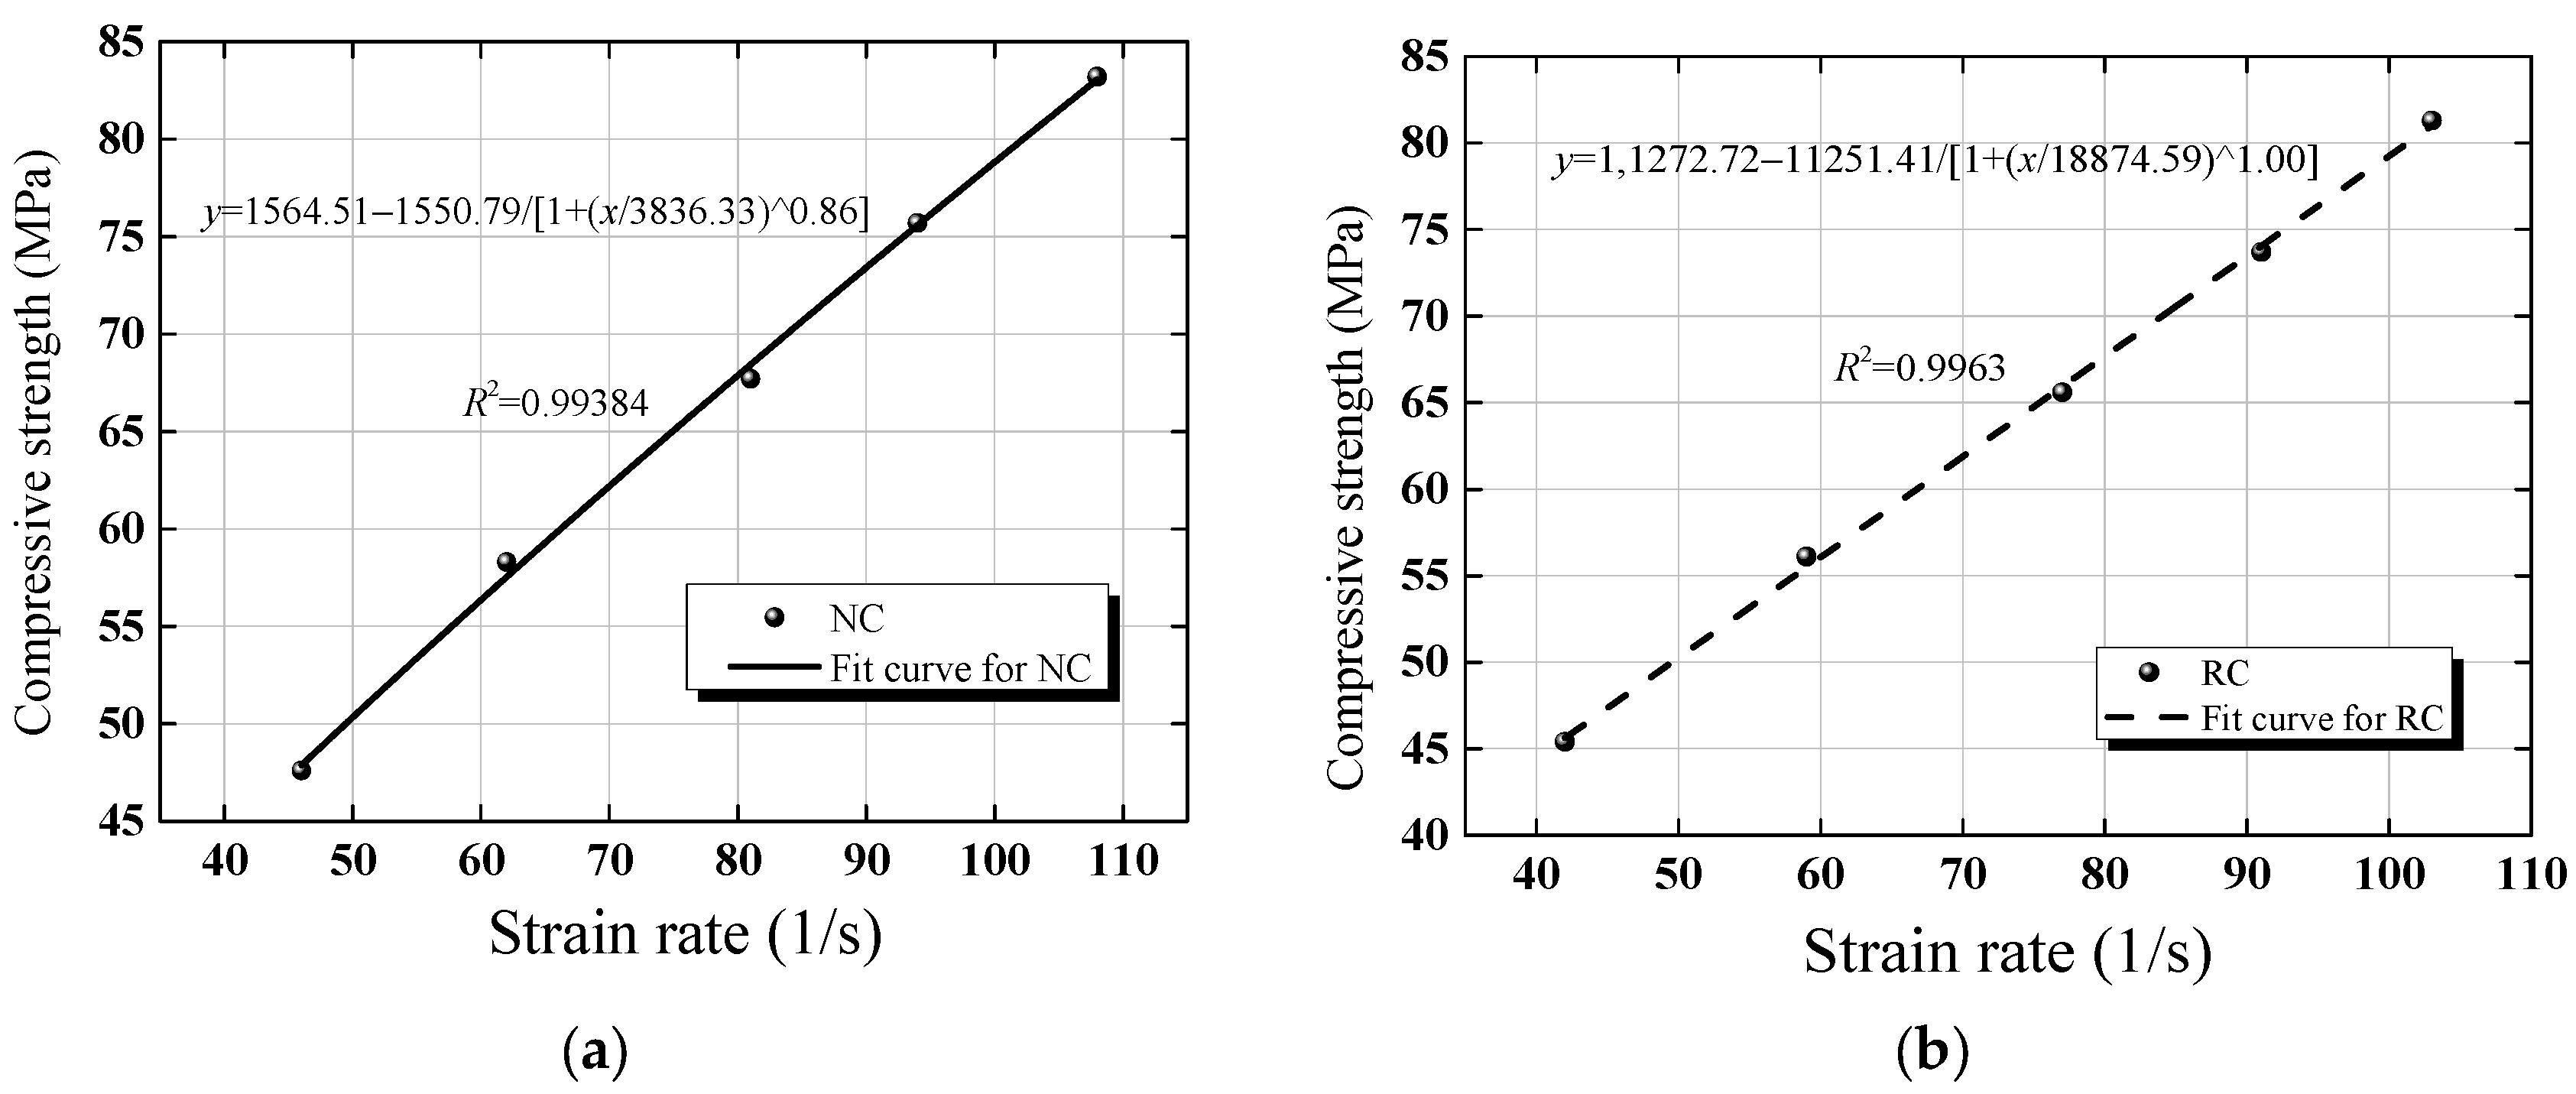
3.2.1. Dynamic Compressive Strength

As shown in Figure 9, it can be concluded that the relationship between impact velocity and dynamic compressive strength is linear. The dynamic compressive strength increased linearly when the impact velocity of the NC and RC varied from 4.7 m/s to 12.3 m/s (0.1 MPa–0.5 MPa). At the same the impact velocity, the dynamic compressive strength of the NC was greater than that of the RC. The absolute error between the NC and RC is shown in Figure 9 (in green). With the increase in impact velocity, the growth rate of dynamic compressive strength became smaller. This indicated that the influence of impact on concrete—first more obviously and then more slowly—approached smoothness.

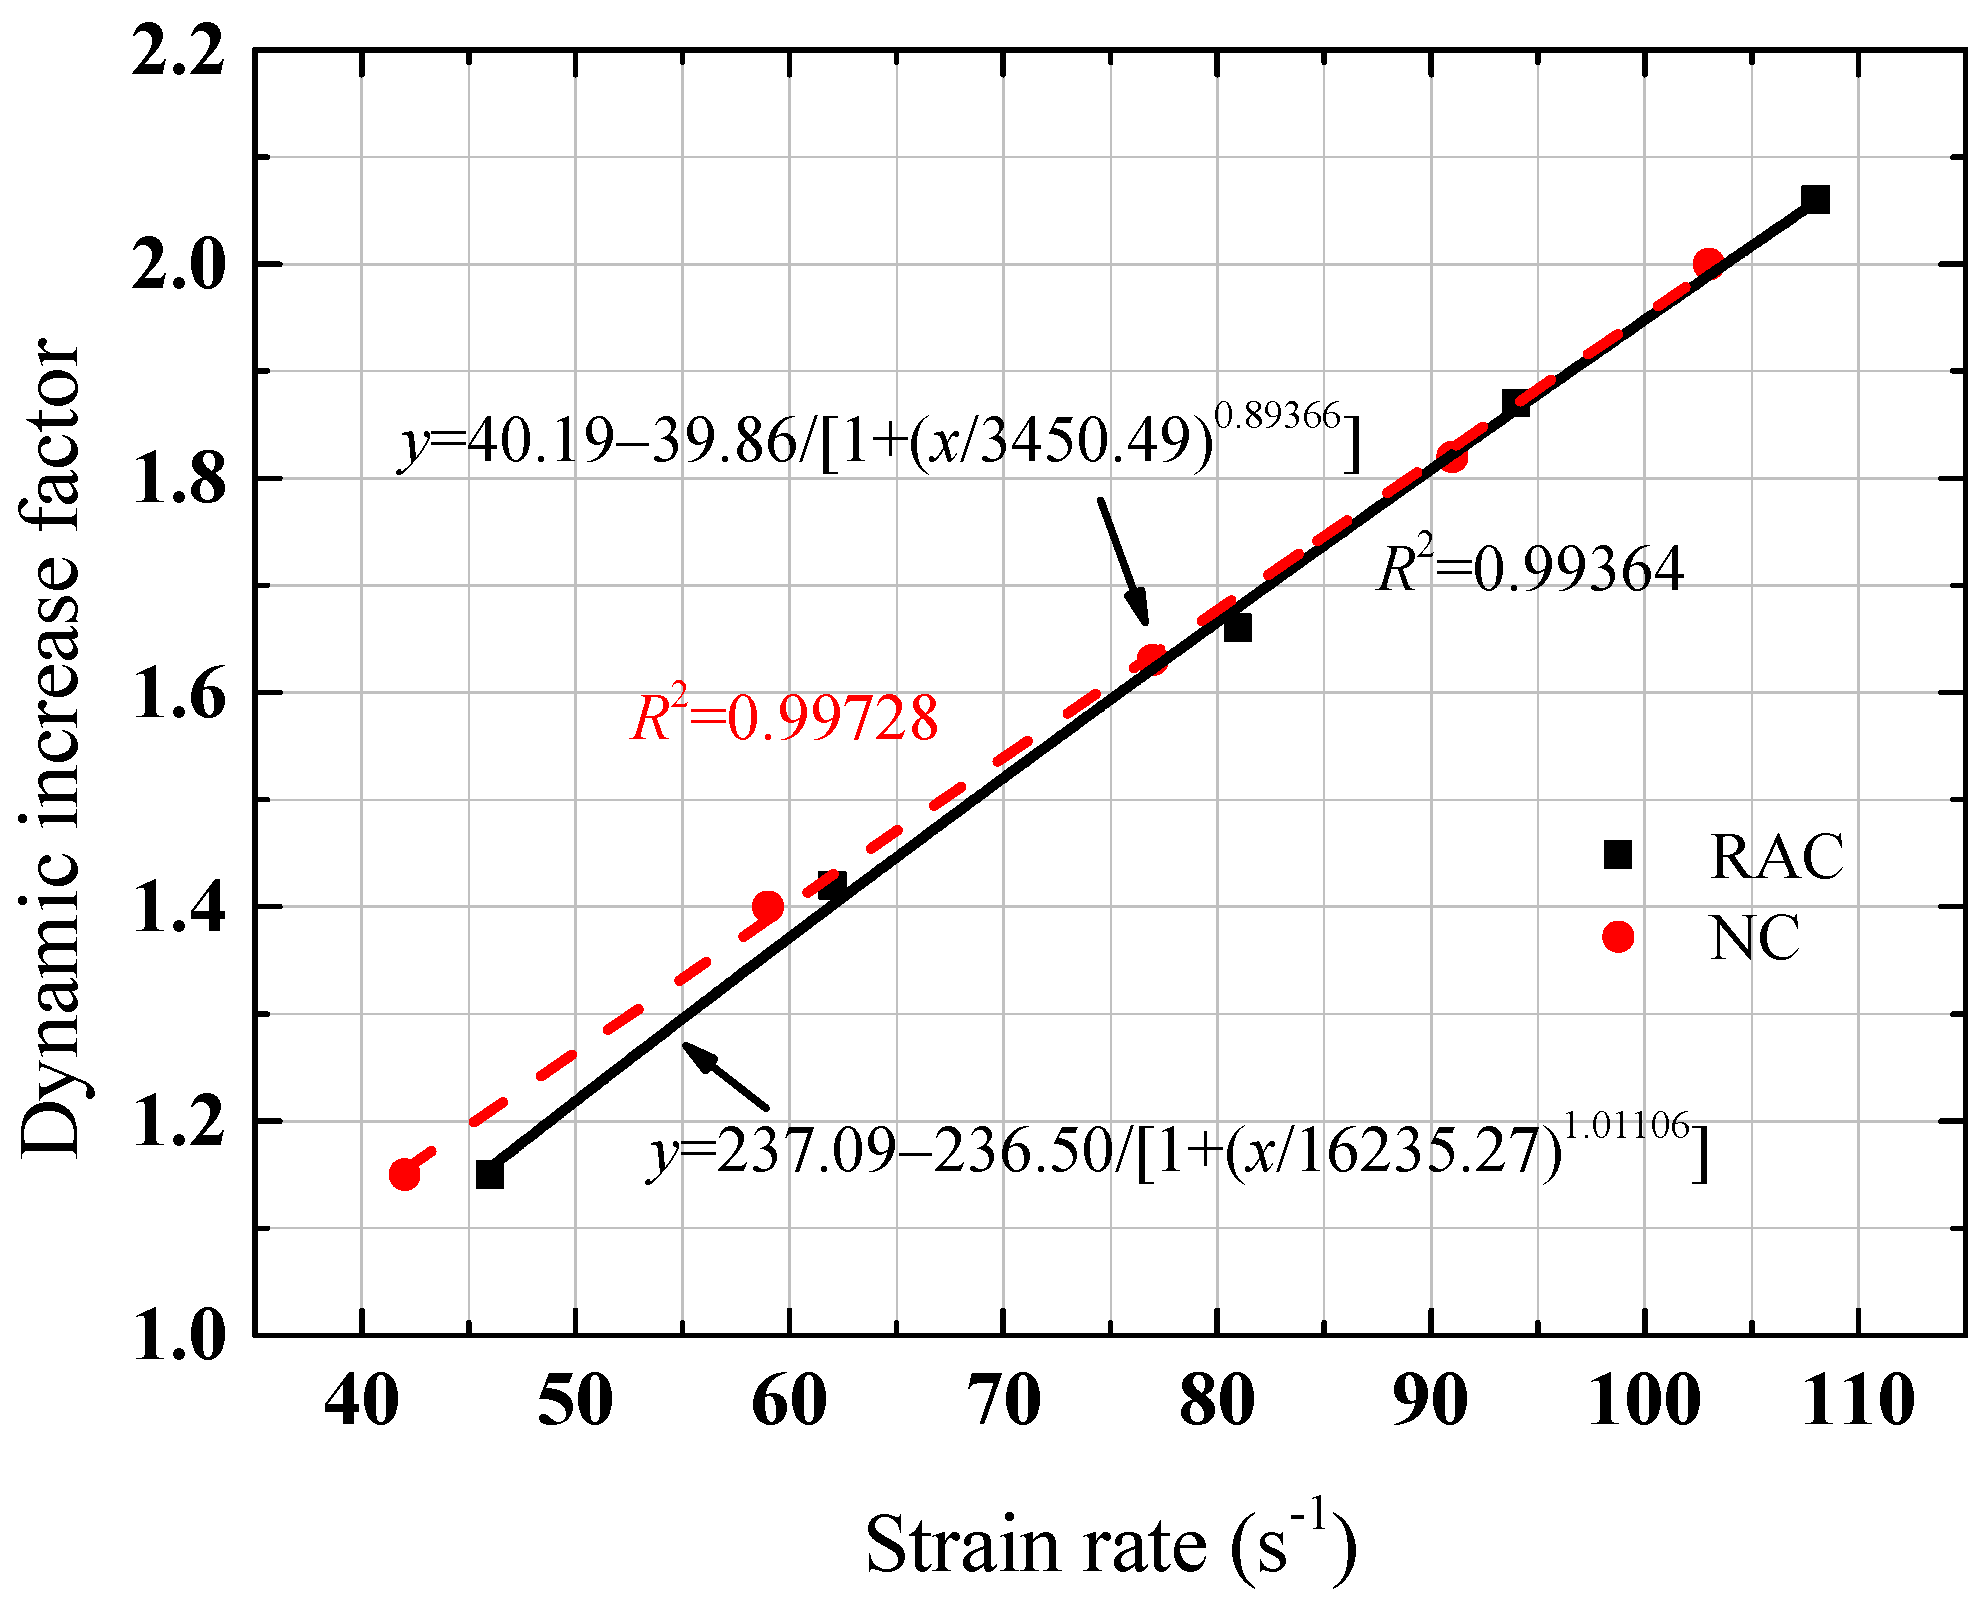
3.2.2. Dynamic Increase Factor

The influence of strain rates on the dynamic compressive strength is shown in Figure 10. The relationship between the strain rate and DIF was a logistic function form, and the coefficients between the NC and RC were different. The R square values of the NC and RC are 0.994 and 0.996, respectively. According to the experimental results and fitting curves, the expression of the DIF is shown in Equation (1) and Figure 11. The R square values of the NC and RC are 0.994 and 0.997, respectively, which was different from the expression [32]; the same function was logarithmic. Equation (1) has reasonable accuracy for evaluating the DIF of the RC.
DIF = a + b / 1 + ( ε d / c ) d
where a, b and c are constants, ε d is the strain rate and d is the index.

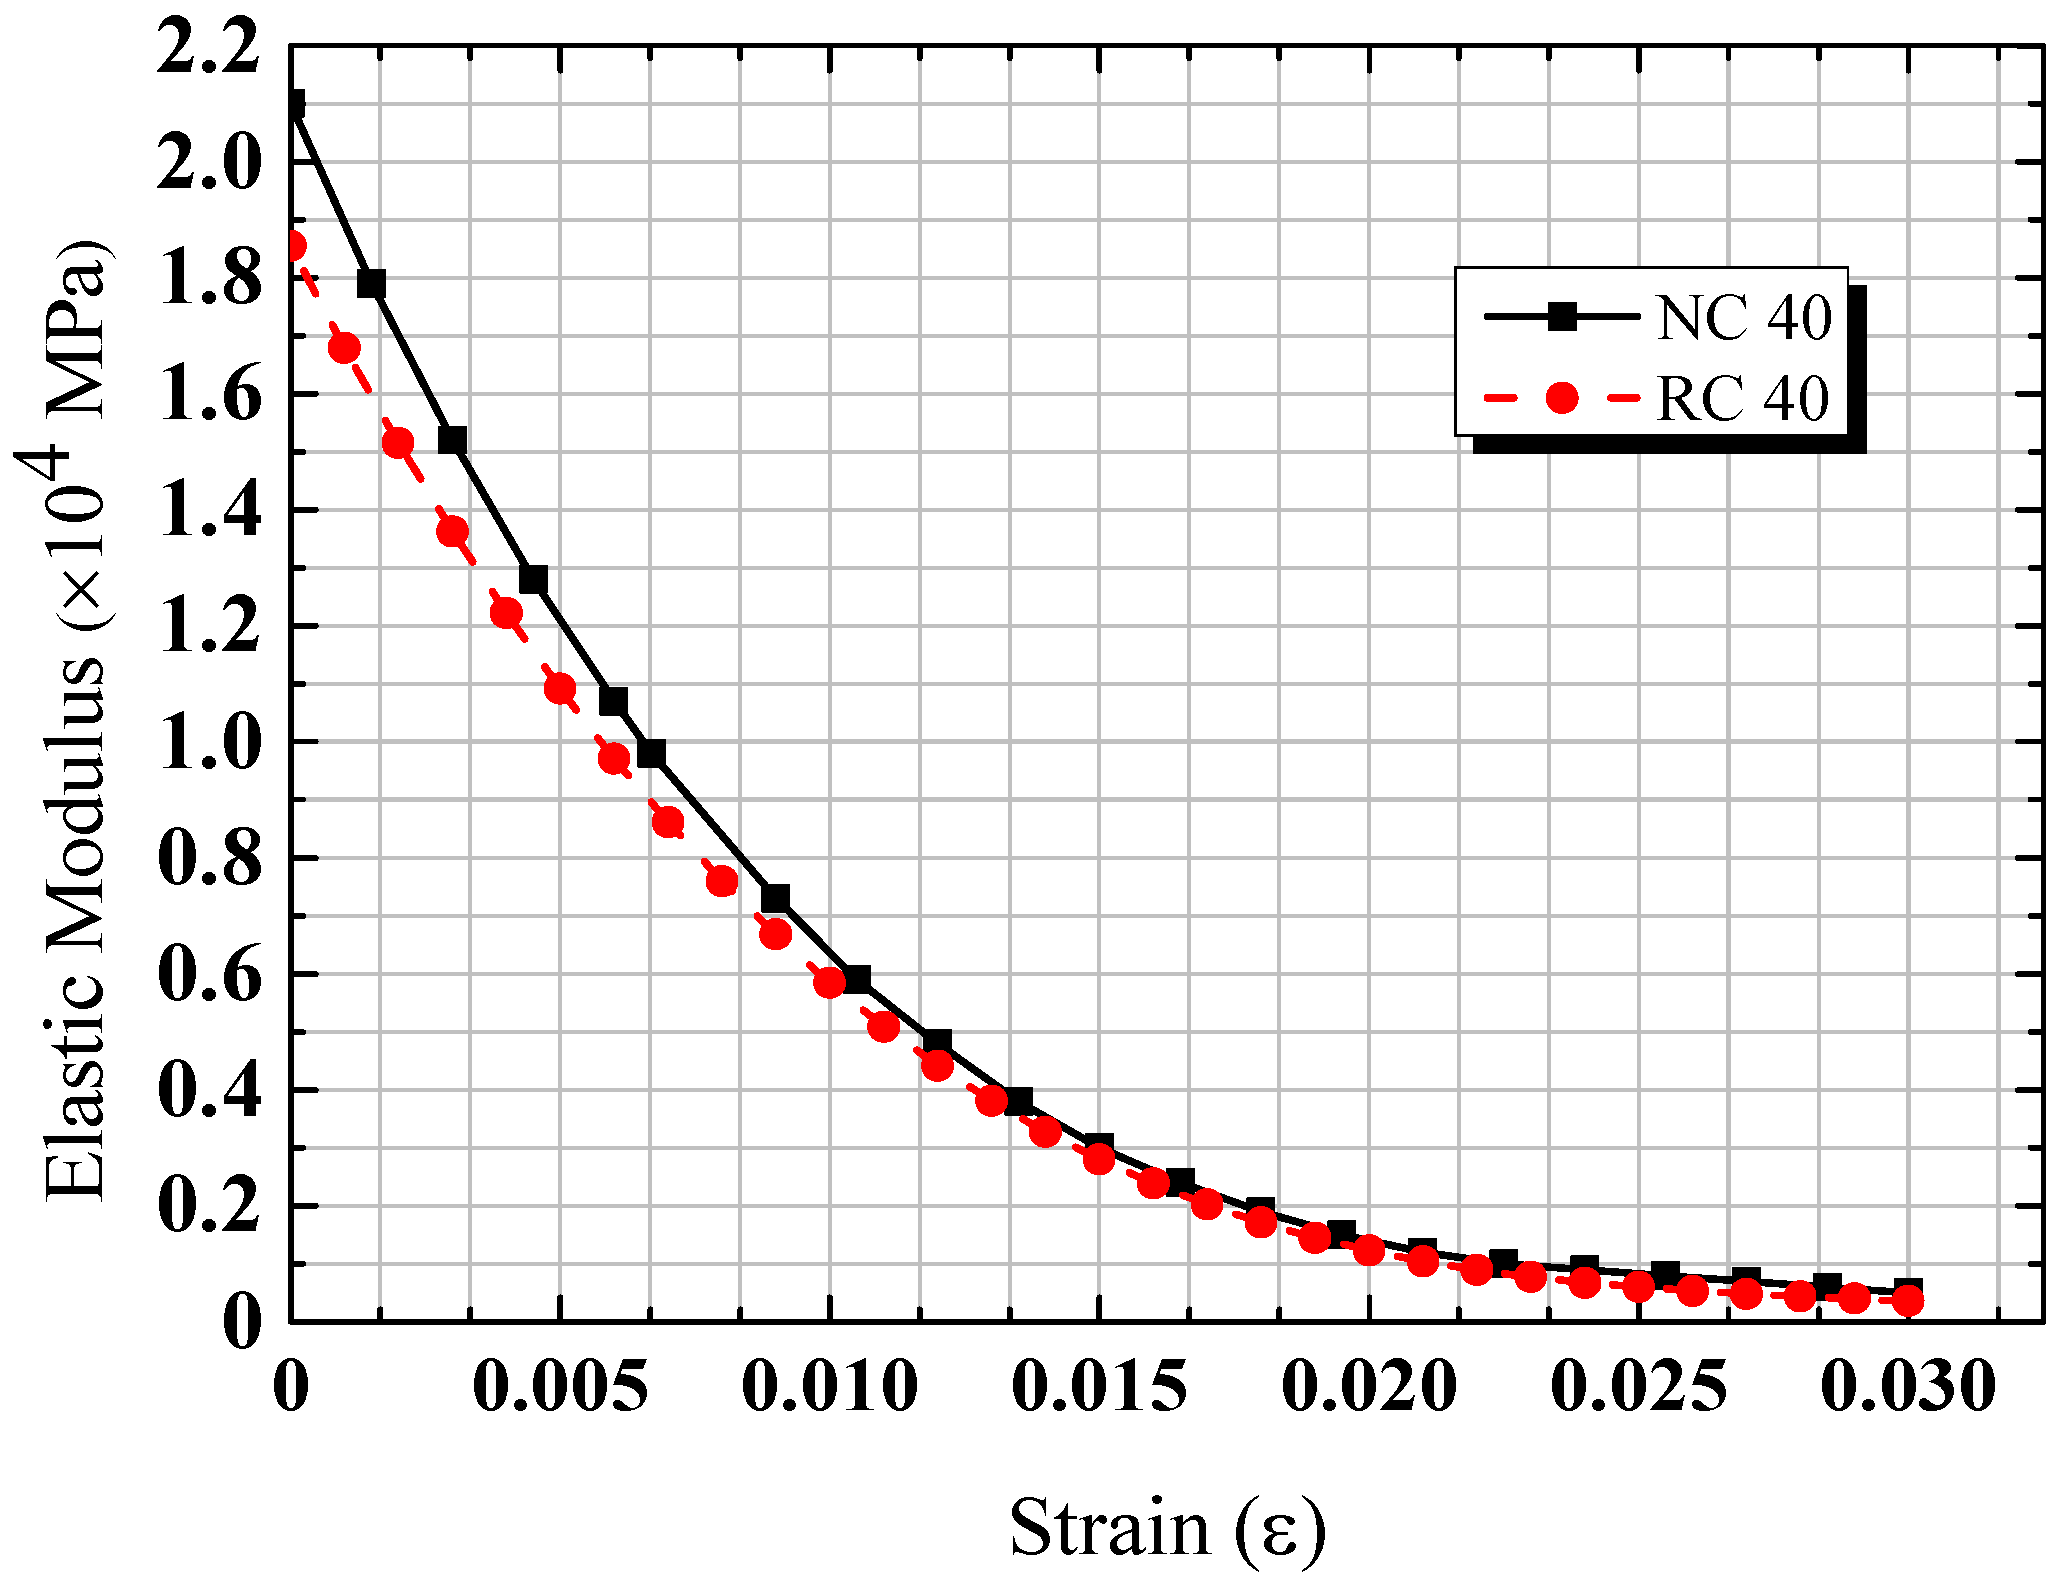
3.2.3. Initial Elastic Modulus

To further study the initial elastic modulus of concrete, the stress–strain curves of concrete were fitted when the impact pressure was 0.3 MPa. The fitting curves (as shown in Figure 12) and initial elastic modulus (as shown in Figure 13) were obtained.
According to the experimental results of the NC and RC, the fitting curve of stress is proportional to the biquadrate of the strain, as shown in Figure 12. A derivative of the stress is obtained the initial elastic modulus, as shown in Figure 13. It can be concluded that there was much difference between the initial elastic modulus of the NC and RC when the strain was less than 0.010, while they were in good agreement with each other when the strain was more than 0.010. Therefore, it can be concluded that RC can replace NC in some specific conditions.

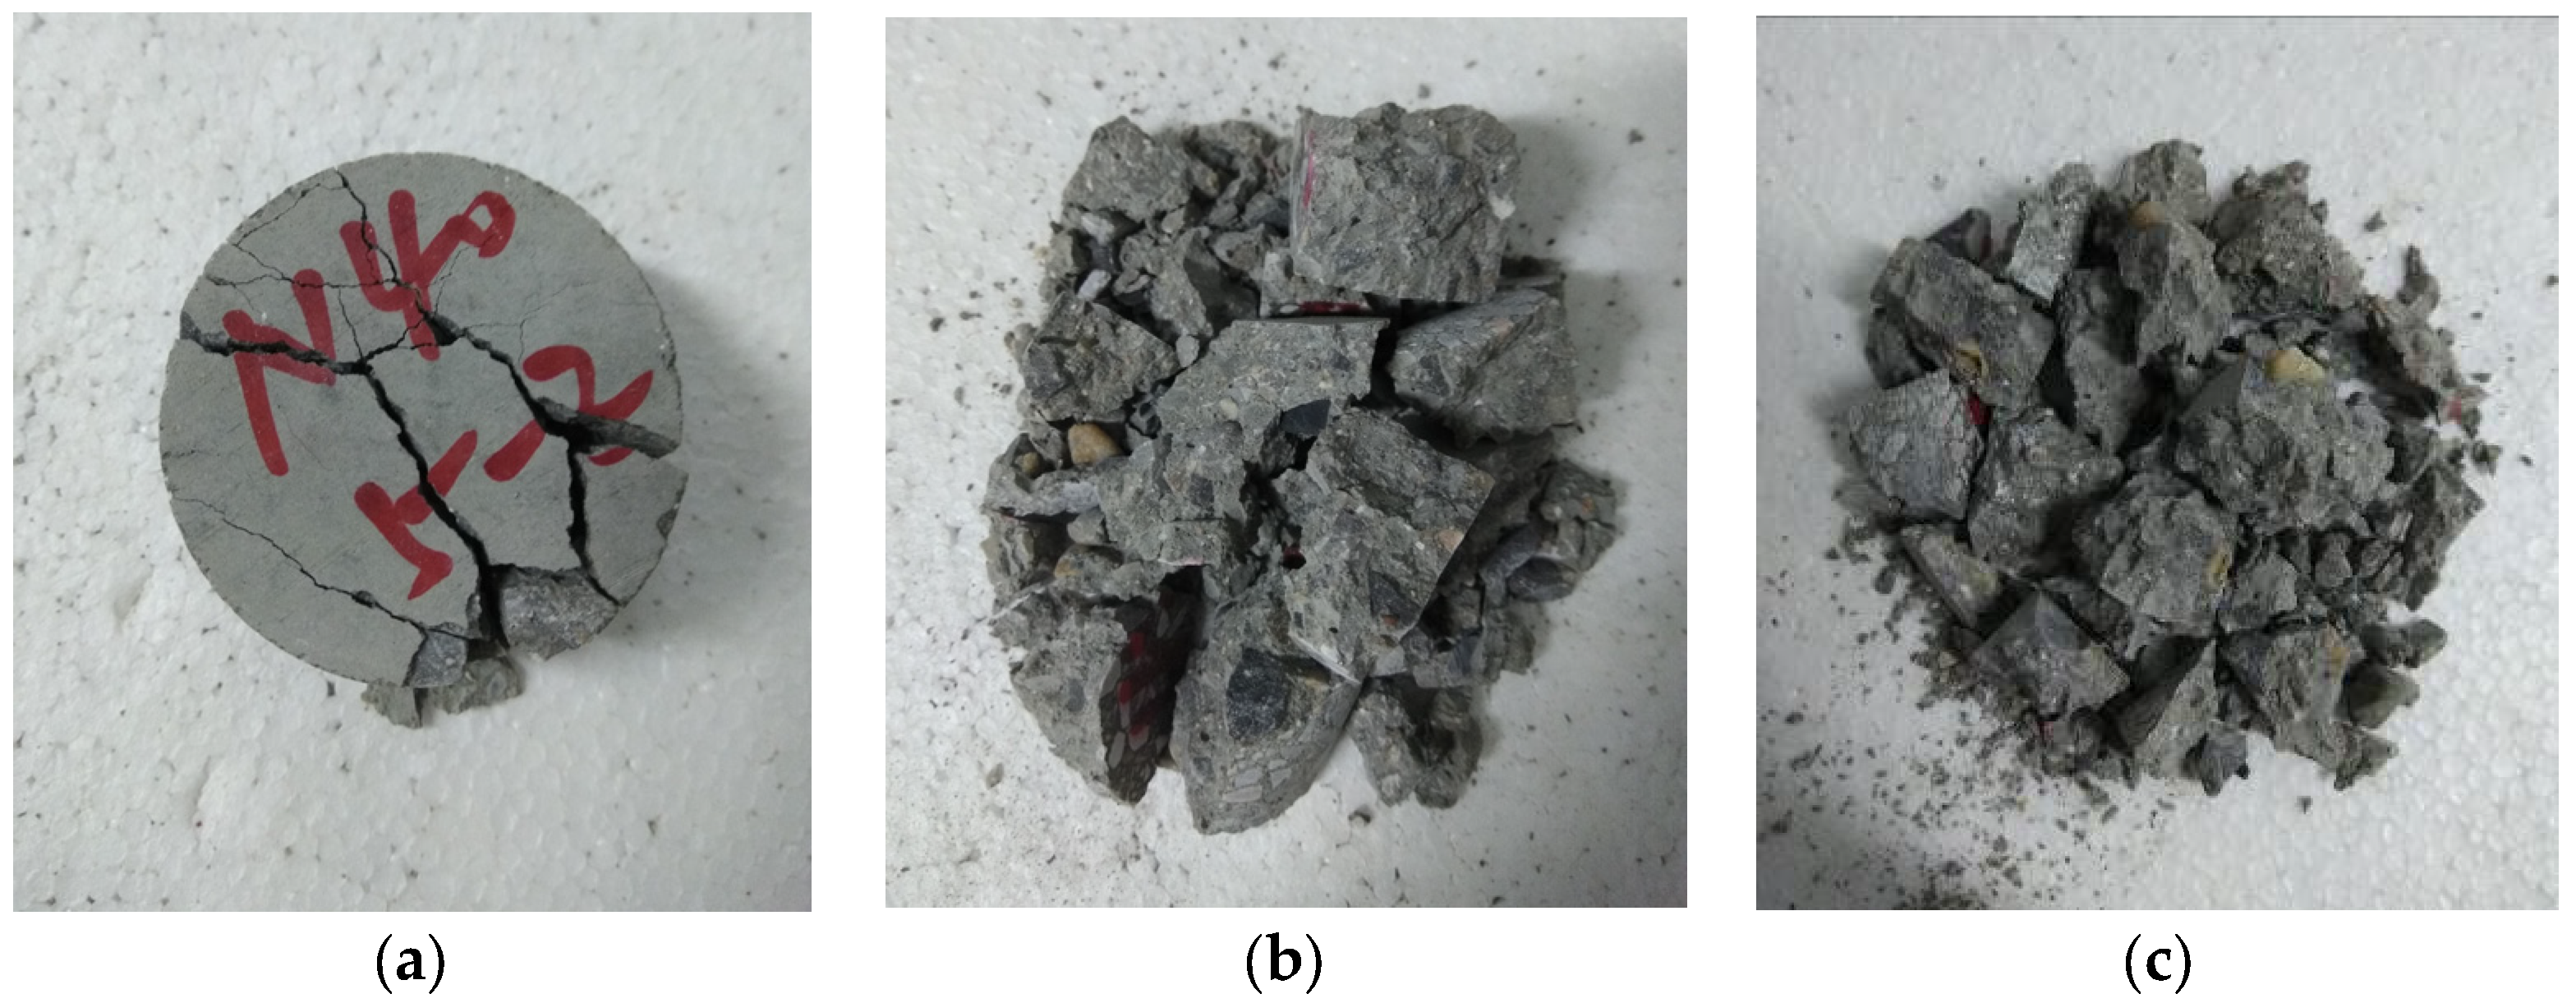
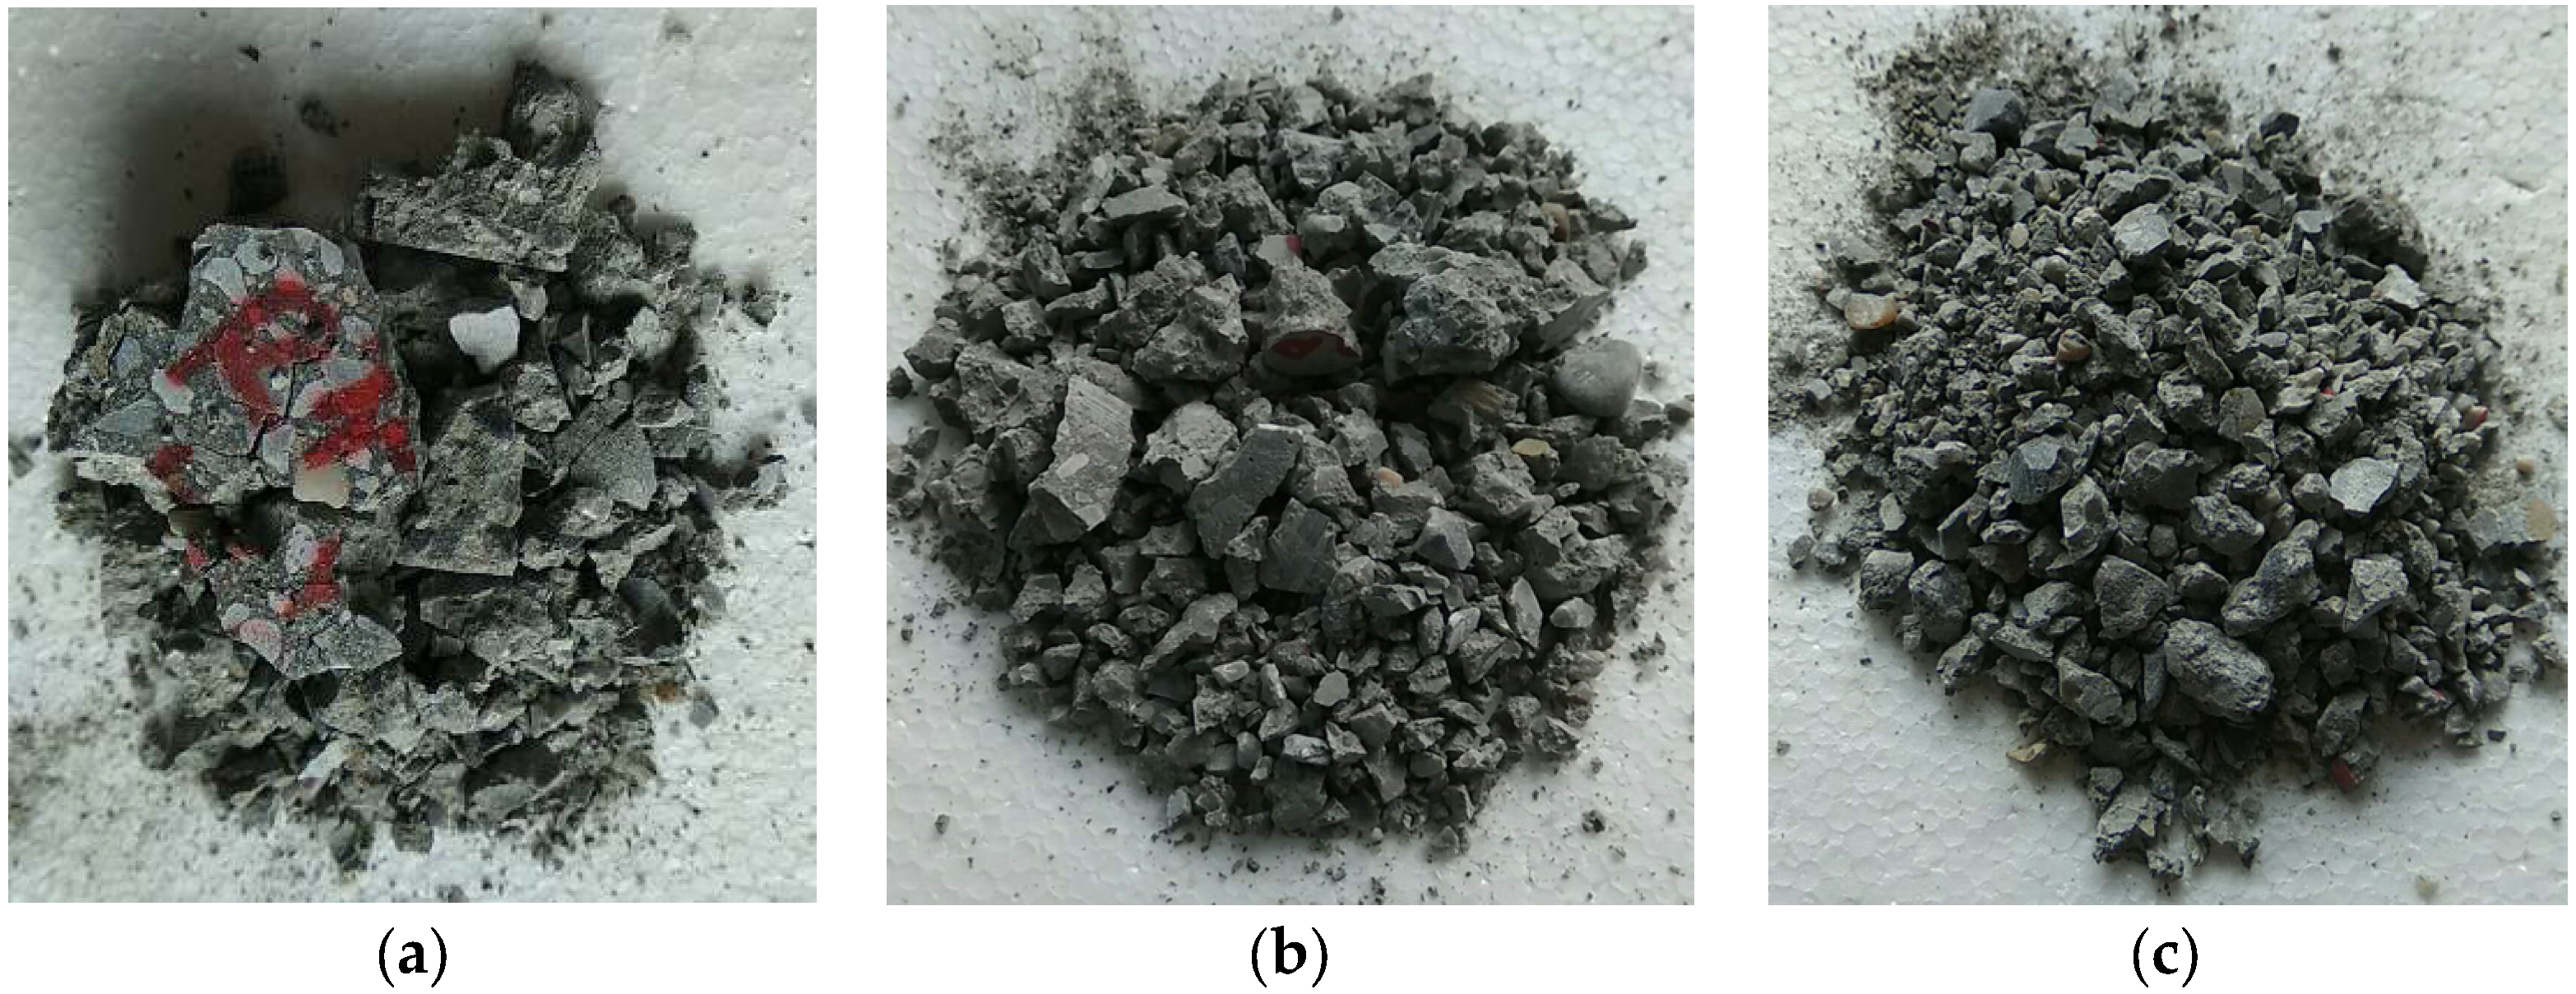
3.2.4. Failure Modes

According to Figure 14 and Figure 15, the failure modes of the NC and RC specimens under different impact loads can be obtained. Two cracks were observed on cross section of the NC when the impact pressure was 0.2 MPa. Figure 14a and Figure 15a show that the RC is completely destroyed when compared to the NC. Concrete spalling occurred on the edge of specimens, which was accompanied by many micro-cracks, and the cracks presented as “H”-type. The NC specimen showed good integrity, while the RC specimen showed a more severe degree of damage. Some micro-cracks originated near the main crack of the NC specimen. When the impact pressure was 0.3 MPa, the concrete is crushed as shown in Figure 14b and Figure 15b. However, the size of the NC was larger than that of the RC. There were about six fragments on the NC. When the impact pressure was 0.4 MPa, the concrete specimens were completely broken. Figure 14c and Figure 15c show that the RC was seriously damaged. At the same impact pressure, the failure modes of the RC specimen were more damaged than those of the NC specimen. For the quasi-static test, the concrete cracking occurred from the edge of specimens to the center, while in the dynamic test, the concrete cracking occurred from the center to the edge.

4. Numerical Model Validation

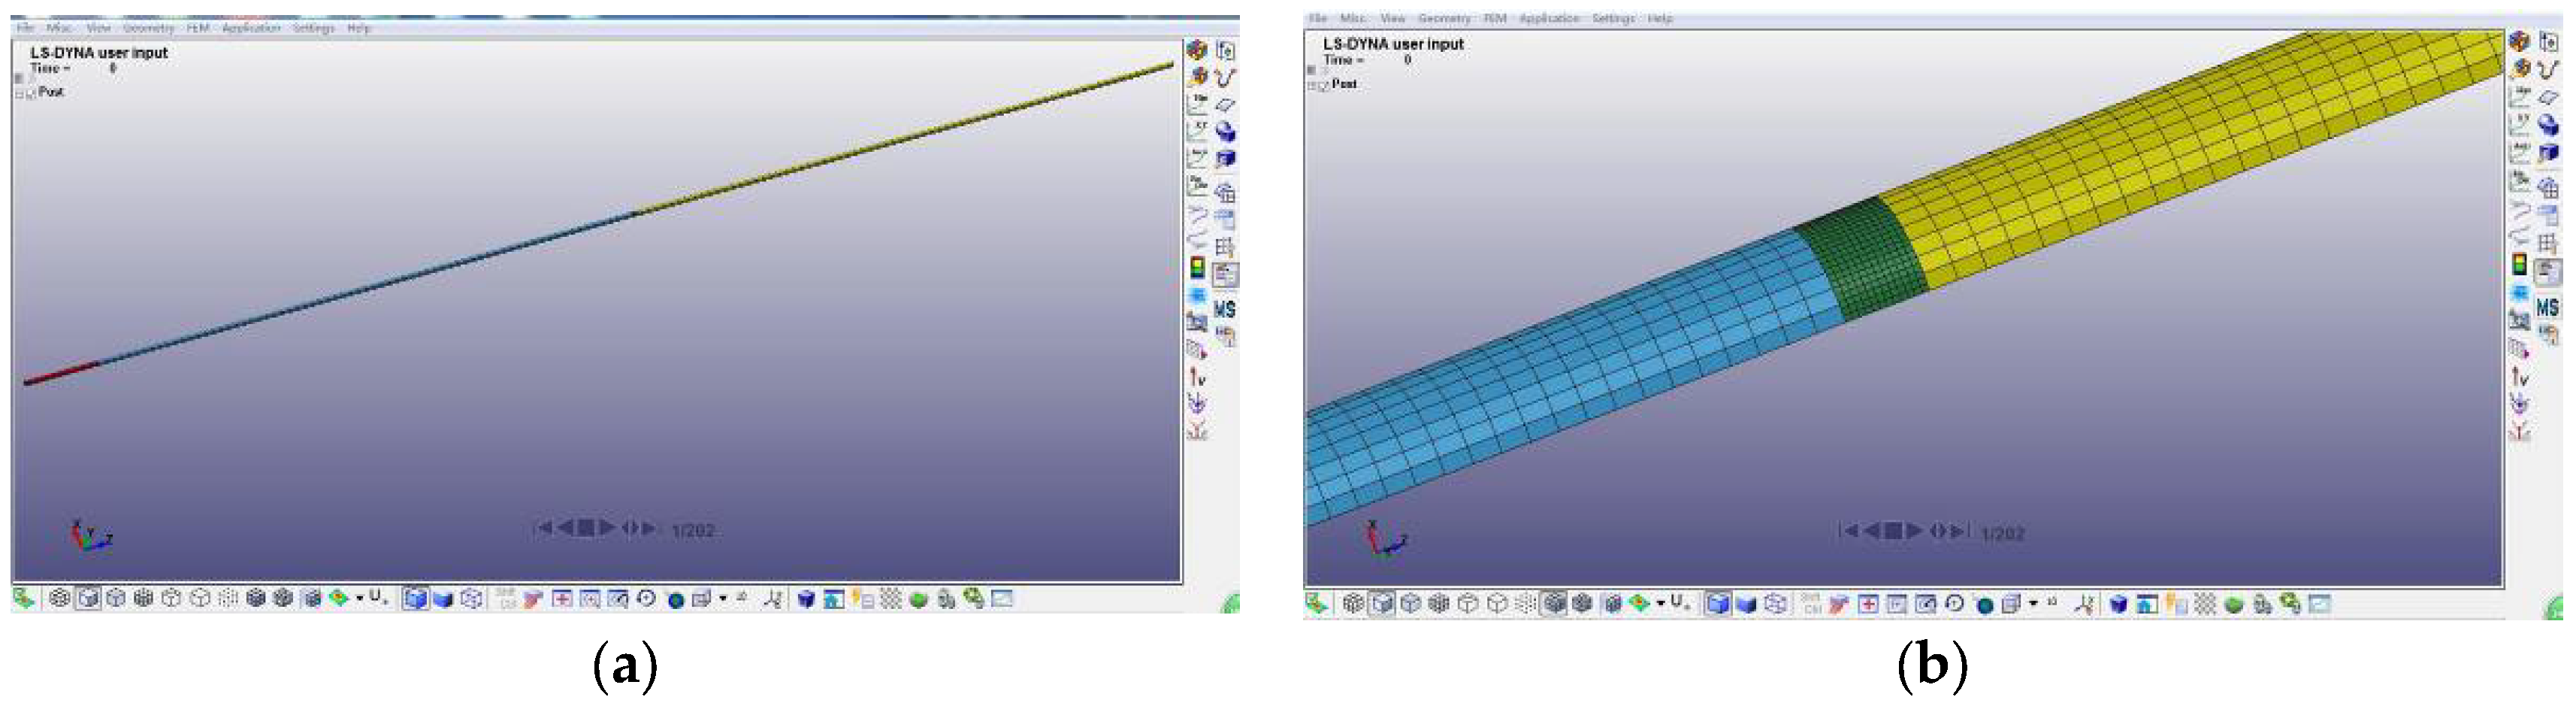
4.1. Numerical FEM Model

To estimate the accuracy of impact test results, ANSYS/LS-DYNA finite element software, developed by Ansys, Inc., Canonsburg, Pennsylvania, USA, was used to establish a three-dimensional finite element calculation model of SHPB impact tests. During the ANSYS/LS-DYNA simulation, the constitutive model of concrete is Holmquist-Johnson-Cook (HJC) model, as given in Table 3. The HJC model of the RC is given in Table 4. Figure 16 shows stress–strain curves of concrete. It included elastic stage (OA segment), plastic stage (AB segment) and close-grained stage components after crushing. At the elastic stage, the relationship between the stress and strain was linear. At the point of A, the stress reached the tensile strength of concrete. The corresponding stress was cracking stress. Then, the specimen entered the plastic stage after concrete cracking. Many cracks initiated with the increase in strain rate. Finally, the specimen entered the close-grained stage after crushing.
The contact automatic types were selected to simulate the interface between the specimen and the SHPB (surface to surface). The reliability and validity of model were verified when compared to the experimental values. The dynamic mechanics of the RC were further improved and proved whether RC can be used in actual engineering. For the SHPB, the parameters of the striker and pressure bar are given in Table 5. A quarter-scale model was established to simulate the whole SHPB impact process.
Impact velocities of 4.7 m/s (0.1 MPa), 9.6 m/s (0.3 MPa) and 12.2 m/s (0.5 MPa) were selected to simulate the impact process of the SHPB. The wave forms can be obtained through using the post-processing software LS-PREPOST, developed by Ansys, Inc., Canonsburg, Pennsylvania, USA. The direction of impact loads is shown in Figure 17a along the left to right. Figure 17b shows the model after meshing. The relationship between stress–strain and time was recorded by two different cements along the velocity direction of incident and transmitter bar. The final stress–strain curves were obtained after recalculation. This paper mainly investigated the dynamic mechanical properties of recycled concrete aggregate at the impact velocity of 9.6 m/s (0.3 MPa).

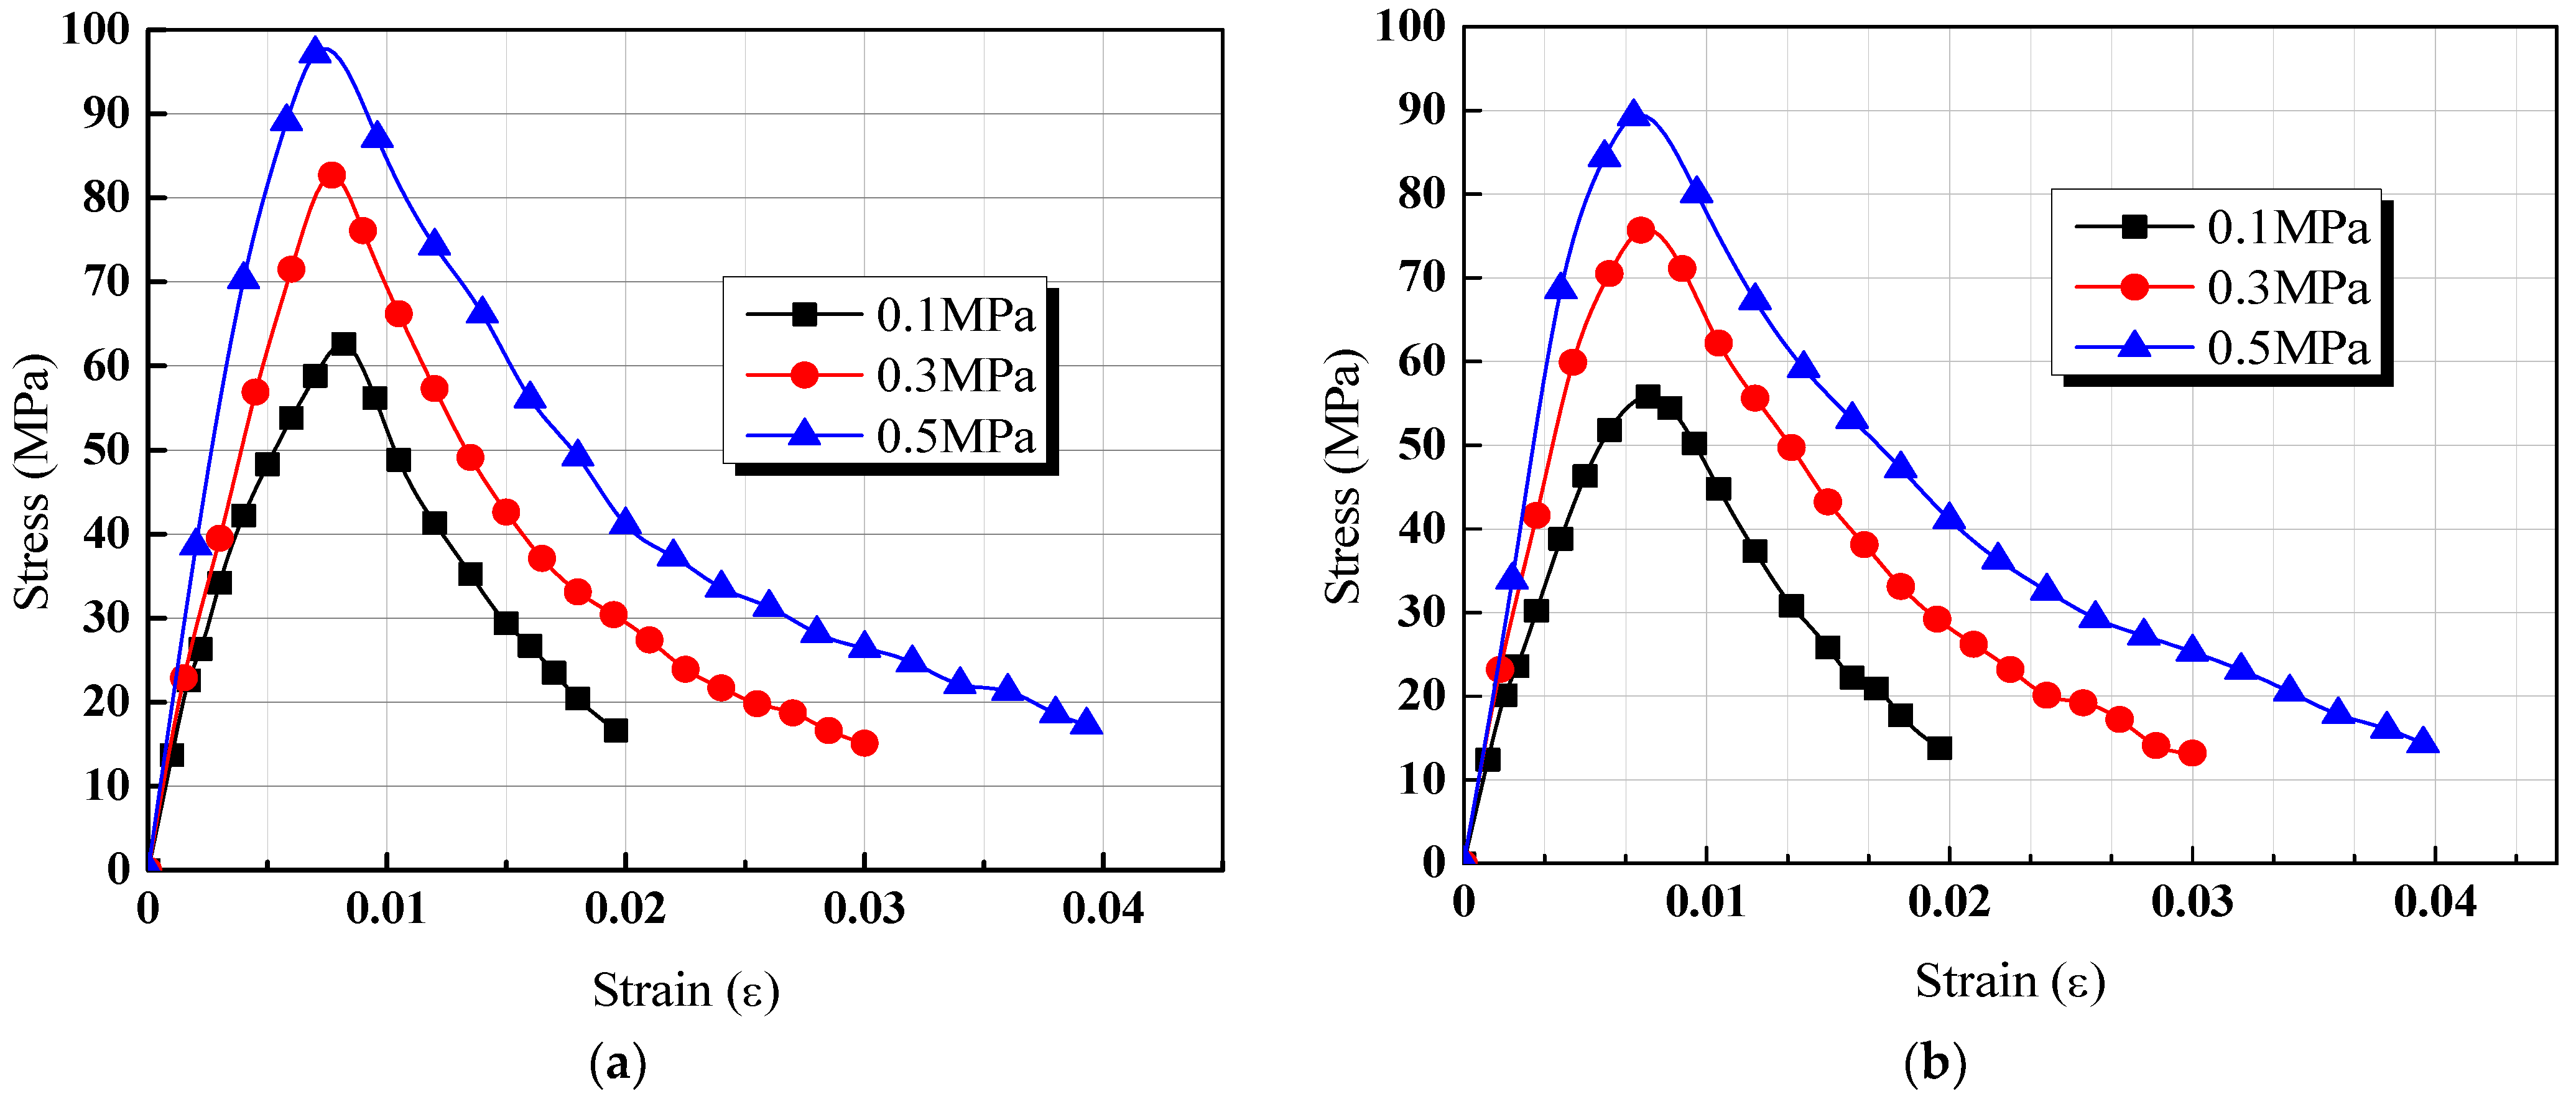
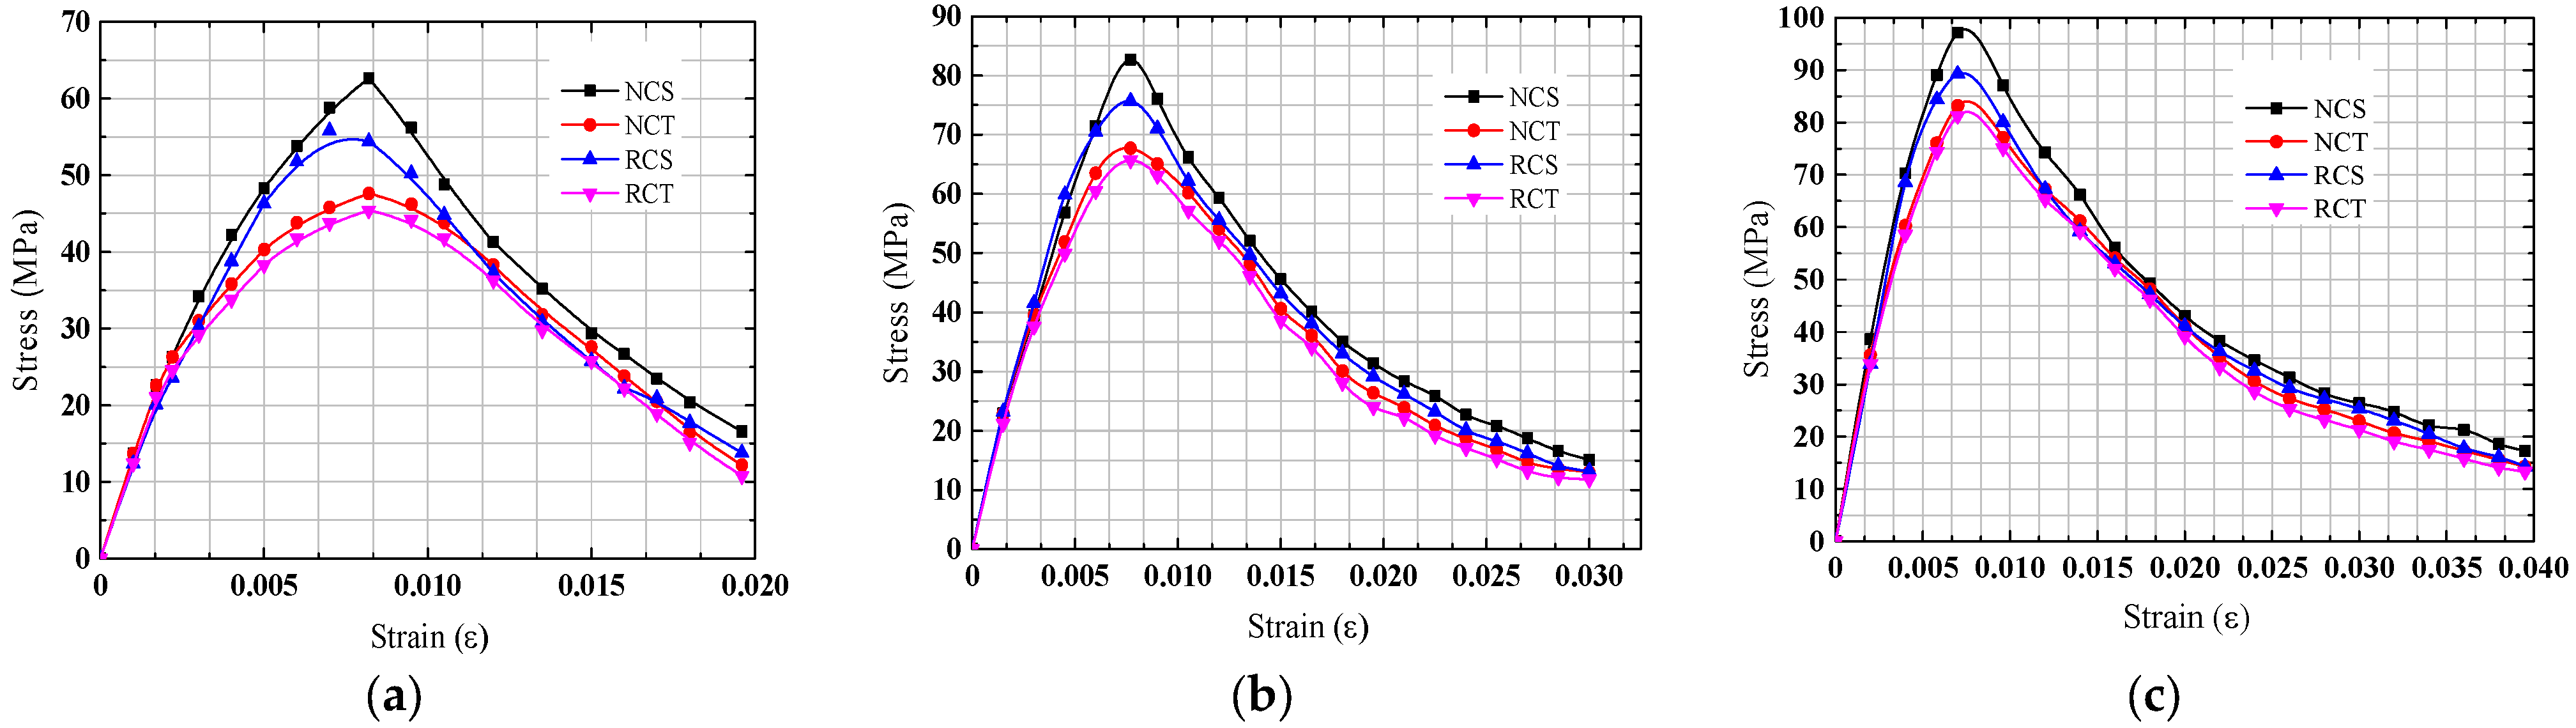
4.2. Impact Stress–Strain Curves
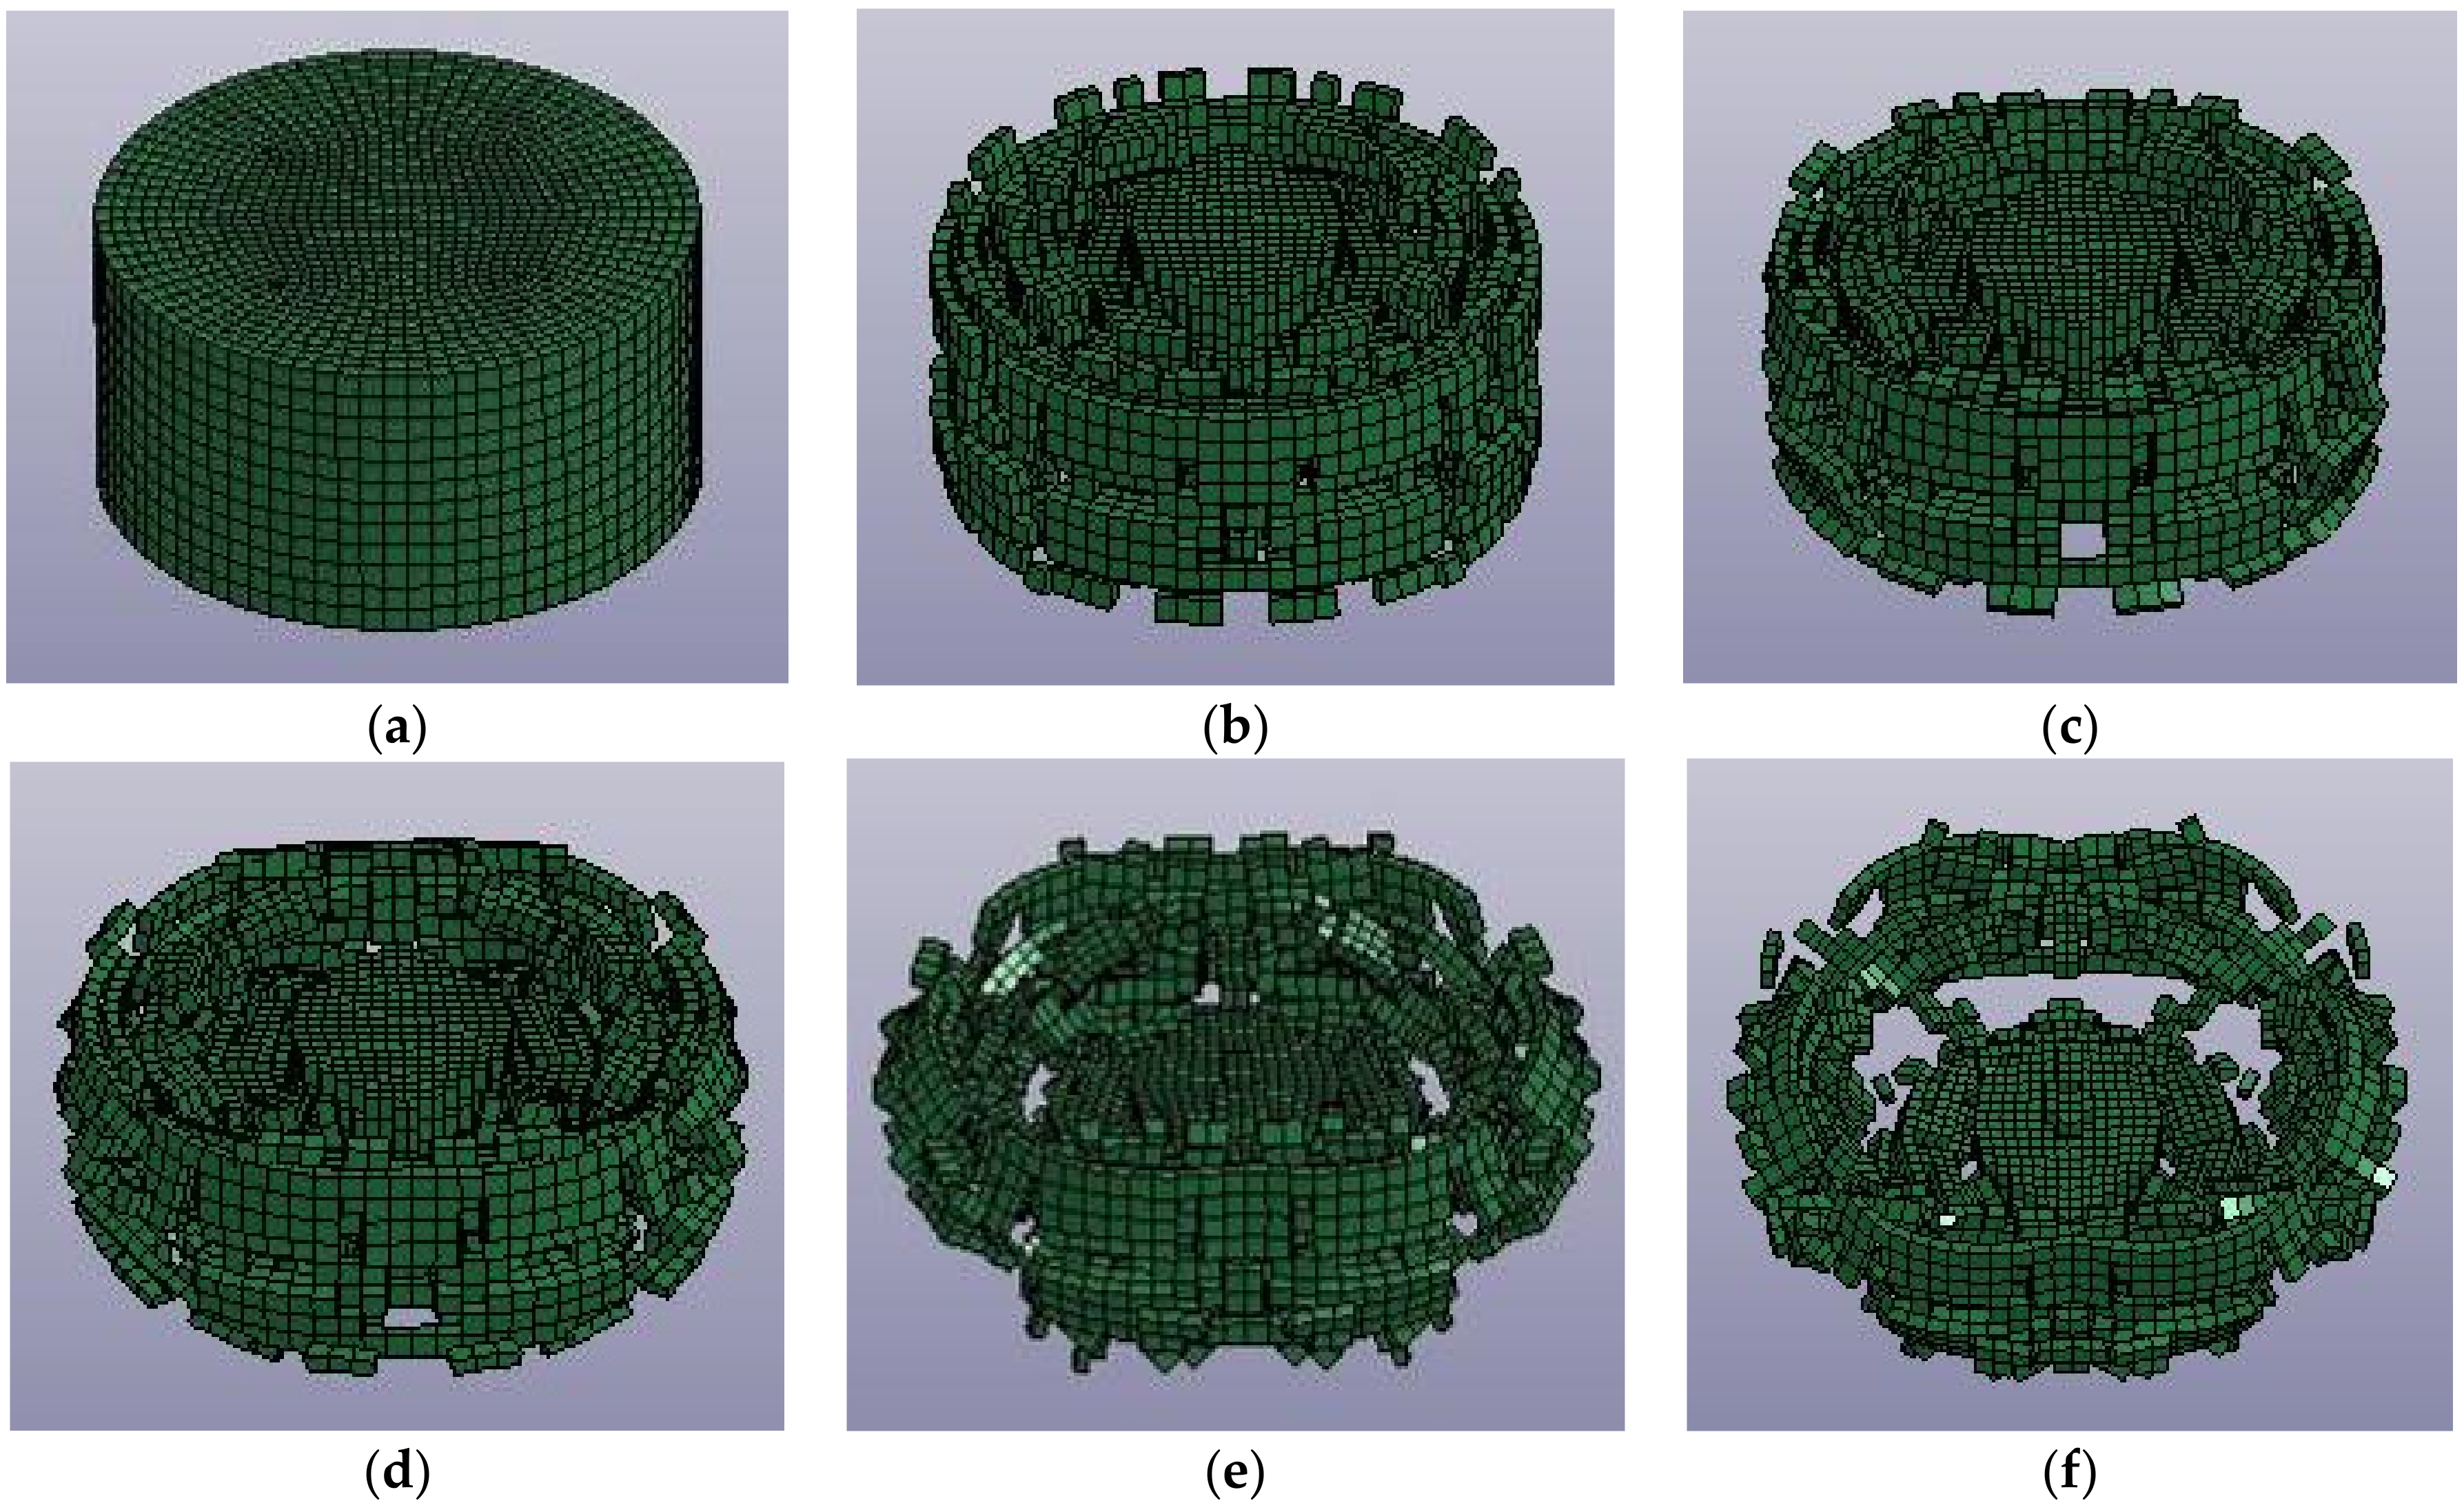
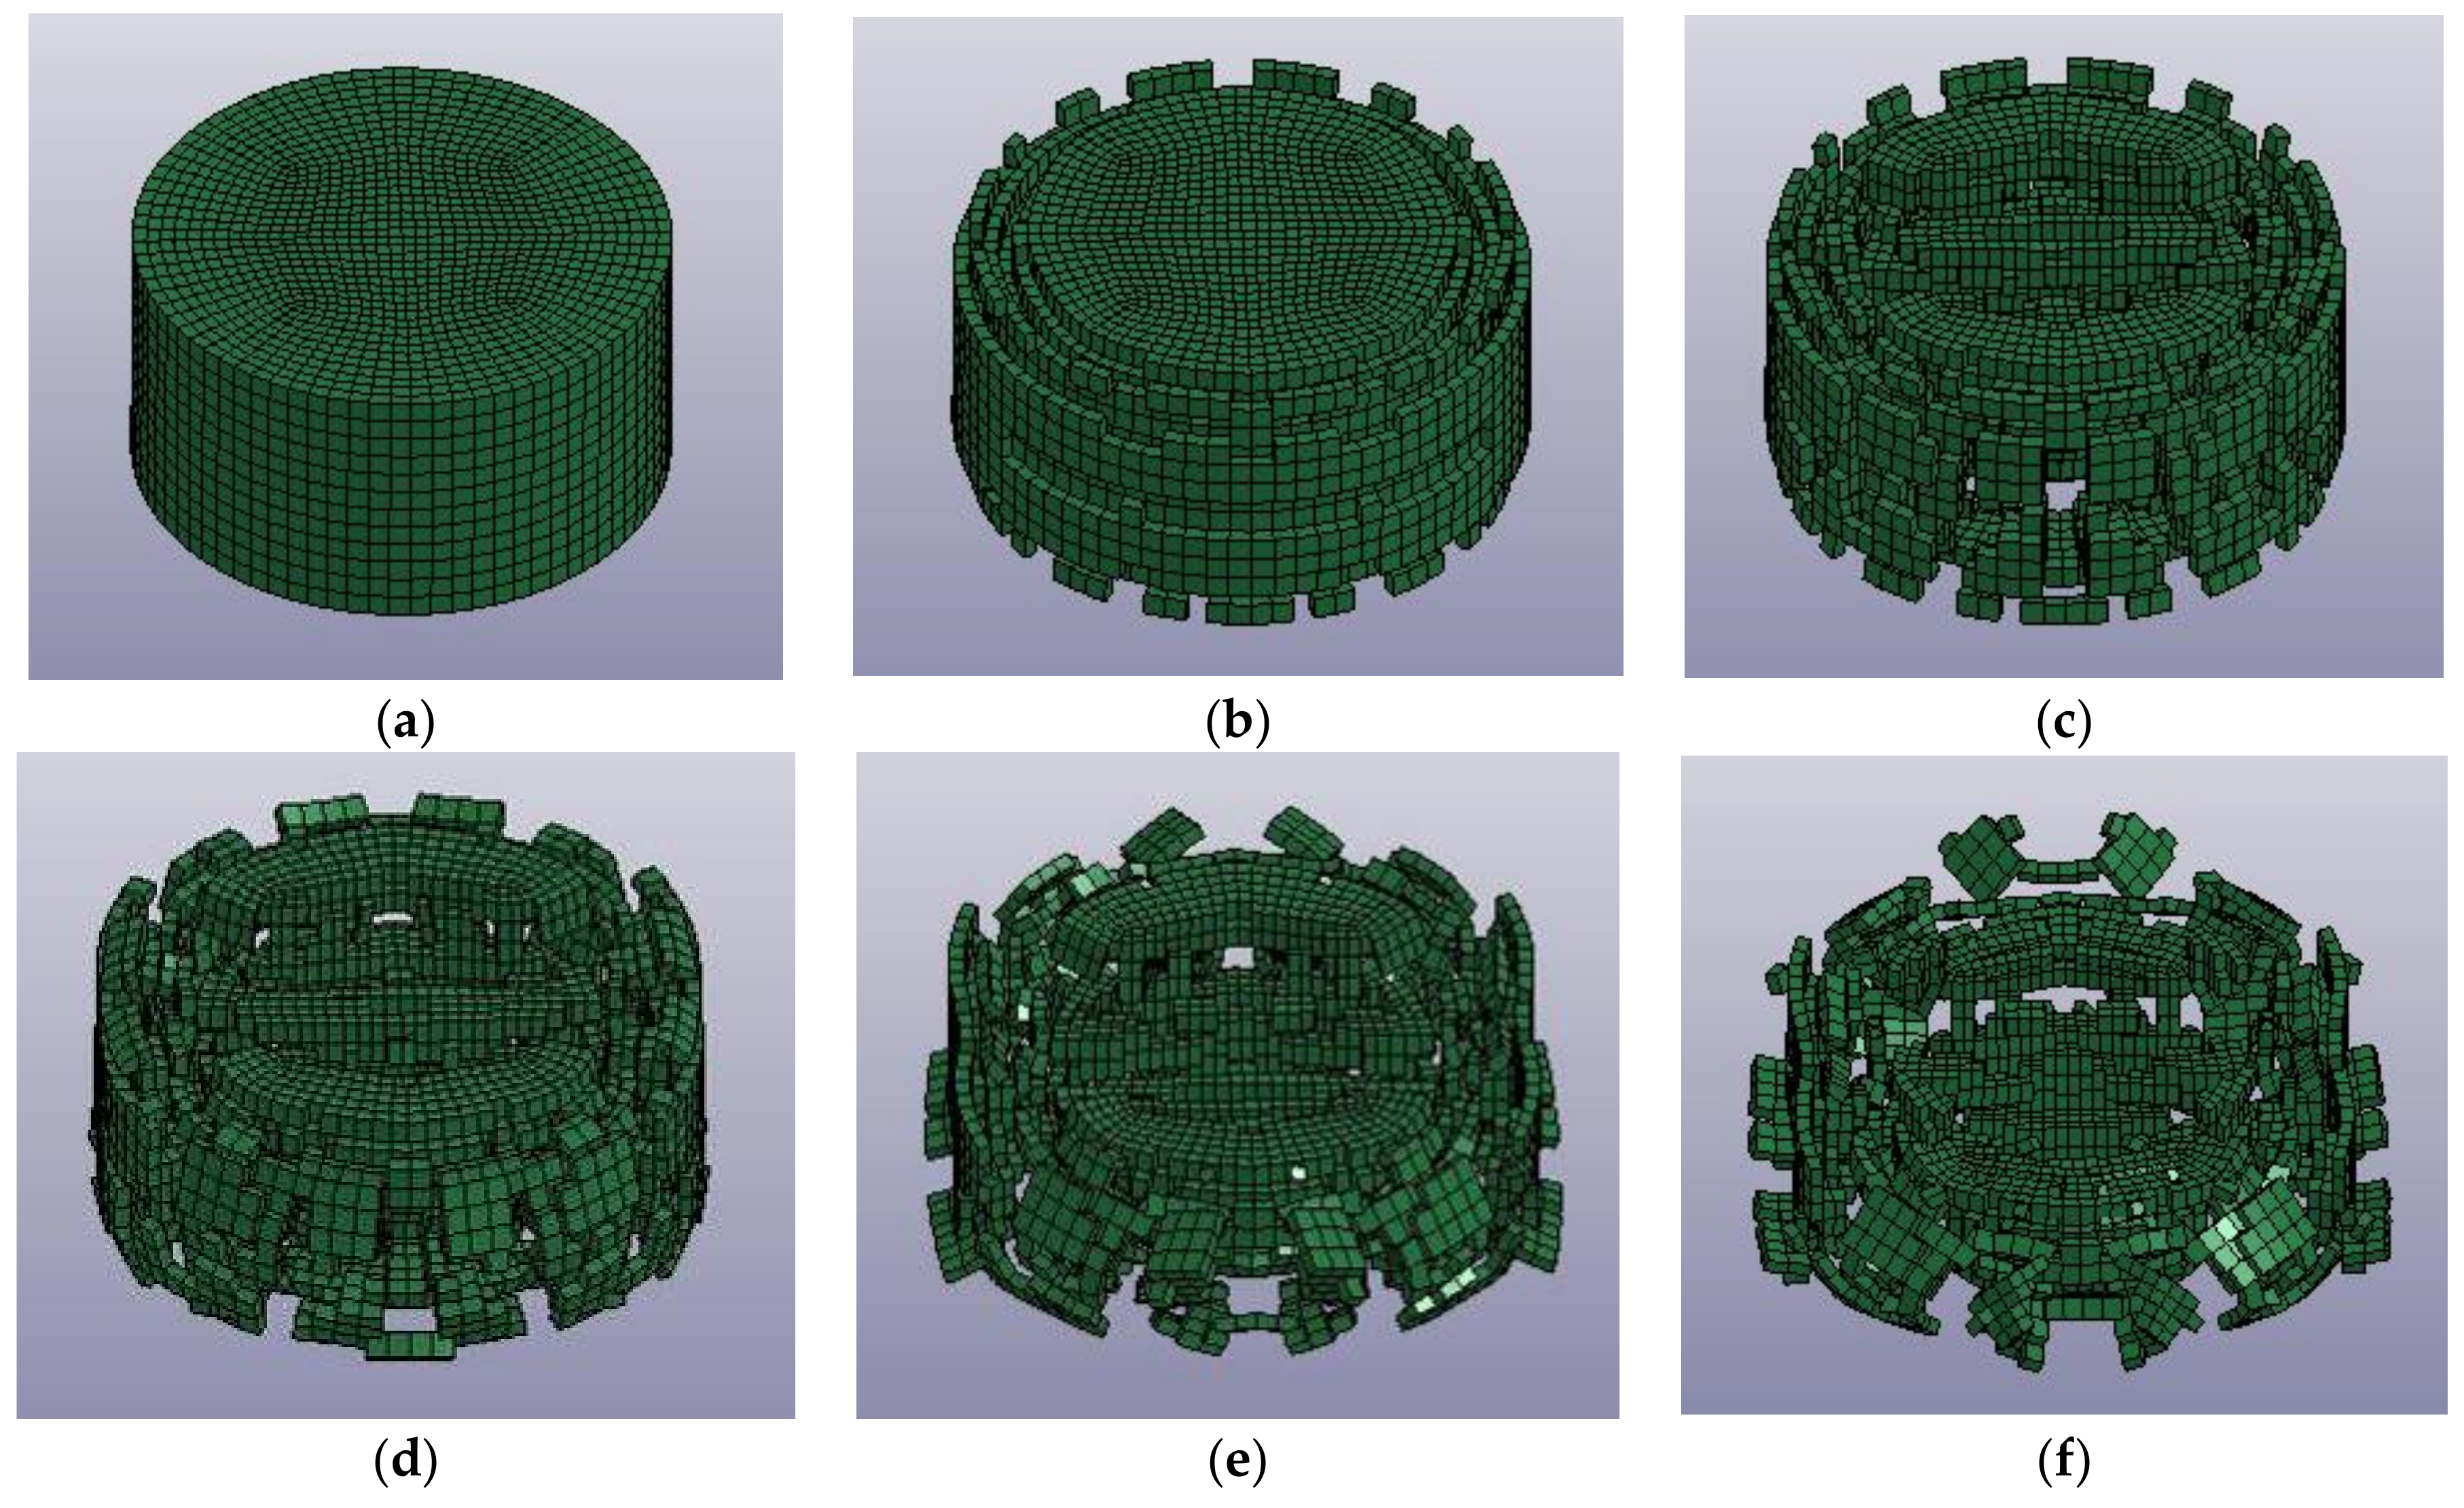
A monitoring unit was set on the surface of incident and transmitter bar. The wave form tendencies of the different concretes were basically similar to each other. The stress wave propagated in the bar, and the reflection phenomenon occurred on the contact interface between the input bar and the specimen. Because the strength of concrete was relatively low, the transmission wave was negligible. It was found that the NC’s stress maximum of incident and transmission waves was higher than that of the RC. Nevertheless, the difference between the NC and RC specimens was small. These simulation results were coincident with the impact test results, while the peak value of the simulation results was higher than that of the test value.
According to Figure 18, it is obvious that the NC’s dynamic compressive strength was larger than that of the RC. At the same impact pressure, the increasing tendency of stress was similar to the impact test results. However, the oscillating reaction did not occur at the descending stage. The reason was that the stress wave was assumed to be a constant and unchanged by the increase in simulation duration, while the stress wave varied with the increase in impact test duration.
The compressive stress–strain curves of concrete specimens under the same impact velocities are presented in Figure 19. In the figure, N/RCi (i = S and T) represents the simulation and test values of the NC and RC. The stress–strain curves presented similar tendencies under three different impact velocities. The test and simulation values of concrete specimens are in good agreement with each other, expect that the strain varied from 0.005 to 0.010. At the ascending stage, the stress–strain curves were consistent with each other when the strain was less than 0.001. With the increasing of impact velocities, the relative error of peak stress became smaller. At the descending stage, the stresses were approximately close to each other. This phenomenon became more obvious with increasing impact velocity. The simulation results showed good accuracy with the experimental results. It can be verified that the NC and RC had the same mechanical behavior under the impact loads, and the accuracy of the finite element model was validated. Therefore, RC can replace NC in some actual engineering.

4.3. Failure Modes

The failure modes of the RC (as shown in Figure 20) and NC (as shown in Figure 21) specimens showed similar behavior at three impact velocities. In this paper, only the failure modes at an impact velocity of 9.6 m/s were given. Figure 20 and Figure 21 display the failure modes of concrete at different times. It was found that the failure tendencies of the NC and RC were very similar. At the initial impact velocities, the center elements were not destroyed and maintained good integrity, as shown in Figure 20a and Figure 21a. With the increase in impact time, the concrete on the edge begins to fall and show damage, as shown in Figure 20b and Figure 21b. This means that a failure mode was developed. Then, the cracks gradually propagated to the center of the specimen, as shown in Figure 20c and Figure 21c. Due to the size of the concrete specimens, the terminal of the specimens will easily produce the stress concentration phenomenon during loading. The failure modes of the specimens gradually extend from the edge to the center, as shown in Figure 20d and Figure 21d. Figure 20e and Figure 21e show that many through-cracks originate at the center of the specimens. The main parts of the specimens were completely separated and destroyed, as shown in Figure 20f and Figure 21f. The overall failure process can be described as the stress wave having had a significant influence on the dynamic behavior. Compared to Figure 20 and Figure 21, it can be concluded that multiple cracks initiate on the RC specimens at the same time. The damage degree of the RC was relatively heavier than that of the NC. The RC specimens were completely crushed. This also indicates that the impact resistance of the RC was slightly worse than that of the NC. This conclusion is basically consistent with the impact test results. Therefore, it was feasible to use the simulation software to make qualitative analysis of the SHPB impact test of the RC.

5. Conclusions

In this paper, quasi-static and dynamic tests of the NC and RC specimens were investigated. The relationship between stress and strain, compressive strength, dynamic increase factor, initial elastic modulus and failure modes were studied in detail. Combined with the ANSYS/LS-DYNA finite element software, the whole impact process of the concrete was simulated. Finally, the main results were obtained as follows:
(1)
Quasi-static test results showed that the compressive strength of the NC was about 1.05 times higher than that of the RC. The dynamic results obtained suggest that the compressive strength of the NC was higher than that of the RC. With the increase in impact velocity, the compressive strength and the dynamic increase factor increased gradually. According to the impact tests, the logistic function expression of dynamic increase factor was obtained.
(2)
From the relationship between stress and the varying strain rates, it can be concluded that the stress–strain curves showed a linear behavior at the initial stage of loading. When the stress reached the maximum value, the curves presented a decreasing tendency. The concrete specimens presented the strain softening phenomenon.
(3)
With the increase in impact velocity, the growth rate of dynamic compressive strength became smaller. The expression of DIF gives an adequate estimate of the dynamic compression strength of the RC and NC within the strain rate range of 40–100 s−1. The proposed empirical model gives an adequate estimate of stress–strain curves of the RC and NC at the impact velocity of 9.6 m/s.
(4)
The initial elastic modulus showed a decreasing tendency with the increase in strain. The strain had a significant influence on the initial elastic modulus when the strain was less than 0.010, while they were in good agreement with each other when the strain was more than 0.010.
(5)
Failure modes can conclude that the damage degree of concrete developed from the edge of specimens. Then, the failure gradually extends to the center of the specimens. With the increase in impact time, many through-cracks originated at the center of specimens. Then, the main part of the specimens were completely separated and destroyed. The simulation results showed good agreement with the SHPB impact test. Therefore, this model was feasible for performing qualitative analysis of the SHPB impact test of the RC.

Author Contributions

W.D.: investigation, data curation, writing—original draft preparation. C.Y.: conceptualization, supervision, project administration, writing—review and editing. H.D.B.: writing—review and editing, supervision. C.L.: methodology, investigation. K.M.: methodology, investigation. H.Z.: resources, project administration. Y.P.: resources, project administration. All authors have read and agreed to the published version of the manuscript.

Funding

This research was funded by the National Science Foundation of China (Grant No. 52078122), Innovative Venture Technology Investment Project of Hunan Province (2018GK5028), Key R&D Program of Hunan Province (2018WK2111) and China Scholarship Council (202006090229).

Institutional Review Board Statement

Not applicable.

Informed Consent Statement

Not applicable.

Data Availability Statement

All data, models, and code generated or used during the study appear in the submitted article.

Acknowledgments

The authors would like to acknowledge the financial support from the National Science Foundation of China, Innovative Venture Technology Investment Project of Hunan Province, Key R&D Program of Hunan Province and China Scholarship Council.

Conflicts of Interest

The authors declare no conflict of interest.

References

  1. Islam, M.J.; Islam, K.; Shahjalal, M.; Khatun, E.; Islam, S.; Razzaque, A.B. Influence of different types of fibers on the mechanical properties of recycled waste aggregate concrete. Constr. Build. Mater. 2022, 337, 127577. [Google Scholar] [CrossRef]
  2. Huang, Y.J.; Wang, T.C.; Sun, H.L.; Li, C.X.; Yin, L.; Wang, Q. Mechanical properties of fibre reinforced seawater sea-sand recycled aggregate concrete under axial compression. Constr. Build. Mater. 2022, 331, 127338. [Google Scholar] [CrossRef]
  3. McGinnis, M.J.; Davis, M.; Rosa, A.D.L.; Weldon, B.D.; Kurama, Y.C. Strength and stiffness of concrete with recycled concrete aggregates. Constr. Build. Mater. 2017, 154, 258–269. [Google Scholar] [CrossRef]
  4. Akbarnezhad, A.; Ong, K.C.G.; Zhang, M.H.; Tam, C.T.; Foo, T.W.J. Microwave-assisted beneficiation of recycled concrete aggregates. Constr. Build. Mater. 2011, 25, 3469–3479. [Google Scholar] [CrossRef]
  5. Braga, A.M.; Silvestre, J.D.; Brito, J.D. Compared environmental and economic impact from cradle to gate of concrete with natural and recycled coarse aggregates. J. Clean. Prod. 2017, 162, 529–543. [Google Scholar] [CrossRef]
  6. Wang, C.Q.; Xiao, J.Z. Evaluation of the stress-strain behavior of confined recycled aggregate concrete under monotonic dynamic loadings. Cement. Concrete. Comp. 2018, 87, 149–163. [Google Scholar] [CrossRef]
  7. Xuan, D.X.; Zhan, B.J.; Poon, C.S. Durability of recycled aggregate concrete prepared with carbonated recycled concrete aggregates. Cement. Concrete. Comp. 2017, 84, 214–221. [Google Scholar] [CrossRef]
  8. Saravanakumar, P.; Abhiram, K.; Manoj, B. Properties of treated recycled aggregates and its influence on concrete strength characteristics. Constr. Build. Mater. 2016, 111, 611–617. [Google Scholar] [CrossRef]
  9. Song, I.H.; Ryou, J.S. Hybrid techniques for quality improvement of recycled fine aggregate. Constr. Build. Mater. 2014, 72, 56–64. [Google Scholar] [CrossRef]
  10. Du, W.P. Research on Beneficiation Technique of High Quality Recycled Concrete Aggregate; Xi’an University of Science and Technology: Xi’an, China, 2017. (In Chinese) [Google Scholar]
  11. Aslani, F.; Ma, G.W.; Wan, D.L.Y.; Muselin, G. Development of high-performance self-compacting concrete using waste recycled concrete aggregates and rubber granules. J. Clean. Prod. 2018, 182, 553–566. [Google Scholar] [CrossRef]
  12. Feng, W.H.; Tang, Y.C.; He, W.M.; Wei, W.B.; Yang, Y.M. Mode I dynamic fracture toughness of rubberised concrete using a drop hammer device and split Hopkinson pressure bar. J. Build. Eng. 2022, 48, 103995. [Google Scholar] [CrossRef]
  13. Bai, W.F.; Shen, J.X.; Guan, J.F.; Wang, J.Y.; Yuan, C.Y. Study on compressive mechanical properties of reycled aggregate concrete with silica fume at different strain rates. Mater. Today. Commun. 2022, 31, 103444. [Google Scholar] [CrossRef]
  14. Tang, Y.X.; Xiao, J.Z.; Zhang, H.H.; Duan, Z.H.; Xia, B. Mechanical properties and uniaxial compressive stress-strain behavior of fully recycled aggregate concrete. Constr. Build. Mater. 2022, 323, 126546. [Google Scholar] [CrossRef]
  15. Chen, A.J.; Han, X.Y.; Chen, M.; Wang, X.Y.; Wang, Z.H.; Guo, T.T. Mechanical and stress-strain behavior of basalt fiber reinforced rubberized recycled coarse aggregate concrete. Constr. Build. Mater. 2020, 260, 119888. [Google Scholar] [CrossRef]
  16. Xiao, J.Z.; Li, L.; Shen, L.M.; Poon, C.S. Compressive behaviour of recycled aggregate concrete under impact loading. Cement. Concrete. Res. 2015, 71, 46–55. [Google Scholar] [CrossRef]
  17. Xiao, J.Z.; Zhang, K.J.; Akbarnezhad, A. Variability of stress-strain relationship for recycled aggregate concrete under uniaxial compression loading. J. Clean. Prod. 2018, 181, 753–771. [Google Scholar] [CrossRef]
  18. Ramesh, K.T.; Hogan, J.D.; Kimberley, J.; Stickle, A. A review of mechanisms and models for dynamic failure, strength, and fragmentation. Planet. Space. Sci. 2015, 107, 10–23. [Google Scholar] [CrossRef]
  19. Rao, M.C.; Bhattacharyya, S.K.; Barai, S.V. Behaviour of recycled aggregate concrete under drop weight impact load. Constr. Build. Mater. 2011, 25, 69–80. [Google Scholar]
  20. Kong, X.Z.; Fang, Q.; Chen, L.; Wu, H. A new material model for concrete subjected to intense dynamic loadings. Int. J. Impact. Eng. 2018, 120, 60–78. [Google Scholar] [CrossRef]
  21. Guo, H.; Shi, C.J.; Guan, X.M.; Zhu, J.P.; Ding, Y.H.; Ling, T.C.; Zhang, H.B.; Wang, Y.L. Durability of recycled aggregate concrete—A review. Cement. Concrete. Comp. 2018, 89, 251–259. [Google Scholar] [CrossRef]
  22. Luccioni, B.; Isla, F.; Forni, D.; Cadoni, E. Modelling UHPFRC tension behavior under high strain rates. Cement. Concrete. Comp. 2018, 91, 209–220. [Google Scholar] [CrossRef]
  23. Jin, L.; Yu, W.X.; Du, X.L.; Zhang, S.; Li, D. Meso-scale modelling of the size effect on dynamic compressive failure of concrete under different strain rates. Int. J. Impact. Eng. 2019, 125, 1–12. [Google Scholar] [CrossRef]
  24. Li, W.G.; Luo, Z.Y.; Long, C.; Wu, C.Q.; Duan, W.H.; Shah, S.P. Effects of nanoparticle on the dynamic behaviors of recycled aggregate concrete under impact loading. Mater. Design. 2016, 112, 58–66. [Google Scholar] [CrossRef]
  25. Li, W.G.; Luo, Z.Y.; Wu, C.Q.; Tam, V.W.Y.; Duan, W.H.; Shah, S.P. Experimental and numerical studies on impact behaviors of recycled aggregate concrete-filled steel tube after exposure to elevated temperature. Mater. Design. 2017, 136, 103–118. [Google Scholar] [CrossRef]
  26. Li, W.G.; Luo, Z.Y.; Wu, C.Q.; Duan, W.H. Impact performances of steel tube-confined recycled aggregate concrete (STCRAC) after exposure to elevated temperatures. Cement. Concrete. Comp. 2018, 86, 87–97. [Google Scholar] [CrossRef]
  27. Li, L.J.; Tu, G.R.; Lan, C.; Liu, F. Mechanical characterization of waste-rubber-modified recycled-aggregate concrete. J. Clean. Prod. 2016, 124, 325–338. [Google Scholar] [CrossRef]
  28. Liu, F.; Chen, G.X.; Li, L.J.; Guo, Y.C. Study of impact performance of rubber reinforced concrete. Constr. Build. Mater. 2012, 36, 604–616. [Google Scholar] [CrossRef]
  29. Wijayasundara, M.; Mendis, P.; Crawford, R.H. Integrated assessment of the use of recycled concrete aggregate replacing natural aggregate in structural concrete. J. Clean. Prod. 2018, 174, 591–604. [Google Scholar] [CrossRef]
  30. Prince, M.J.R.; Gaurav, G.; Singh, B. Splice strength of steel reinforcement embedded in recycled aggregate concrete. Constr. Build. Mater. 2018, 160, 156–168. [Google Scholar] [CrossRef]
  31. Liu, F.; Feng, W.H.; Xiong, Z.; Tu, G.R.; Li, L.J. Static and impact behaviour of recycled aggregate concrete under daily temperature variations. J. Clean. Prod. 2018, 191, 283–296. [Google Scholar] [CrossRef]
  32. Bui, N.K.; Satomi, T.; Takahashi, H. Improvement of mechanical properties of recycled aggregate concrete basing on a new combination method between recycled aggregate and natural aggregate. Constr. Build. Mater. 2017, 148, 376–385. [Google Scholar] [CrossRef]
Figure 1. Coarse aggregate, (a) Natural, (b) RCA, (c) Crushed RCA.
Buildings 12 01055 g001
Figure 2. SEM images of natural coarse aggregate and RCA. (a) Natural coarse aggregate; (b) RCA.
Buildings 12 01055 g002
Figure 3. XRD pattern of natural coarse aggregate and RCA: (a) Natural coarse aggregate; (b) RCA.
Buildings 12 01055 g003
Figure 4. Concrete specimens. (a) NC; (b) RC.
Buildings 12 01055 g004
Figure 5. 50 mm diameter cross-sectional SHPB for impact test. (a) SHPB device; (b) ultra-dynamic strain gauge; (c) specimen.
Buildings 12 01055 g005
Figure 6. Split-Hopkinson pressure bar (SHPB).
Buildings 12 01055 g006
Figure 7. Typical pulse signals during SHPB impact test.
Buildings 12 01055 g007
Figure 8. Stress–strain curves of concrete specimens under different impact pressures.
Buildings 12 01055 g008
Figure 9. Relationship between impact velocity and dynamic compressive strength.
Buildings 12 01055 g009
Figure 10. Effect of strain rates on dynamic compressive strength. (a) Natural concrete; (b) recycled concrete.
Buildings 12 01055 g010
Figure 11. Dynamic increase factor of concrete.
Buildings 12 01055 g011
Figure 12. Dynamic compressive strength.
Buildings 12 01055 g012
Figure 13. Initial elastic modulus.
Buildings 12 01055 g013
Figure 14. Failure modes of NC specimen. (a) 0.2 MPa; (b) 0.3 MPa; (c) 0.4 MPa.
Buildings 12 01055 g014
Figure 15. Failure modes of the RC specimen. (a) 0.2 MPa; (b) 0.3 MPa; (c) 0.4 MPa.
Buildings 12 01055 g015
Figure 16. Stress–strain curve of concrete.
Buildings 12 01055 g016
Figure 17. Finite Element Model. (a) SHPB model; (b) mesh.
Buildings 12 01055 g017
Figure 18. Stress–strain curves of concrete. (a) Natural concrete; (b) recycled concrete.
Buildings 12 01055 g018
Figure 19. Compressive stress–strain curves of concrete. (a) 4.7 m/s; (b) 9.6 m/s; (c) 12.2 m/s.
Buildings 12 01055 g019
Figure 20. Failure modes of recycled concrete. (a) t = 0.0 ms; (b) t = 0.5 ms; (c) t = 0.7 ms; (d) t = 1.0 ms; (e) t = 1.5 ms; (f) t = 2.0 ms.
Buildings 12 01055 g020
Figure 21. Failure modes of natural concrete. (a) t = 0.0 ms; (b) t = 0.5 ms; (c) t = 0.7 ms; (d) t = 1.0 ms; (e) t = 1.5 ms; (f) t = 2.0 ms.
Buildings 12 01055 g021
Table 1. Results of quasi-static compressive strength.
SpecimensLoad (kN)Compressive Strength (MPa)Average (MPa)
N40-192941.341.52
N40-291840.8
N40-393641.6
N40-494742.1
N40-594141.8
R40-188039.139.44
R40-288439.3
R40-389139.6
R40-488739.4
R40-589639.8
Table 2. Results of dynamic compressive strength testing.
SpecimensImpact Velocity (m/s)Strain Rate (s1)Compressive
Strength (MPa)
SpecimensImpact Velocity (m/s)Strain Rate (s1)Compressive
Strength (MPa)
NC-100-14.85048.6RC-100-14.53744.7
NC-100-24.74747.4RC-100-24.74346.2
NC-100-34.64146.8RC-100-34.64645.3
NC-200-17.36658.8RC-200-17.26356.6
NC-200-27.15757.6RC-200-27.15455.5
NC-200-37.26358.5RC-200-37.36056.2
NC-300-19.78067.7RC-300-19.57464.3
NC-300-29.88668.1RC-300-29.97866.7
NC-300-39.67767.3RC-300-39.77965.8
NC-400-110.79075.3RC-400-110.98774.6
NC-400-211.19876.2RC-400-210.79272.6
NC-400-310.99475.6RC-400-310.89473.9
NC-500-112.310783.1RC-500-112.310582.1
NC-500-212.211282.8RC-500-212.110080.6
NC-500-312.410583.7RC-500-312.210481.2
Note: 100, 200, 300, 400 and 500 represent impact pressures of 0.1 MPa, 0.2 MPa, 0.3 MPa, 0.4 MPa and 0.5 MPa, respectively; 1, 2 and 3 represent the number of concrete specimens.
Table 3. HJC model of concrete.
Density
(kg·m−3)
Shear Modulus (GPa)StrengthHardening CoefficientStrain Rate CoefficientHardening ExponentCompressive Strength (MPa)Tensile Strength (MPa)Strain RateMinimum Plastic Strain
240014.860.791.60.0070.614841 × 10−60.01
Normalize strength (MPa)Compressive strainVolume strainStress (GPa)Strain rate (compacted)Damage constant 1Damage constant 2Material constant 1 (MPa)Material constant 2 (MPa)Material constant 3 (MPa)
7161 × 10−30.800.10.041.085−171208
Table 4. HJC model of the RC.
Density
(kg·m−3)
Shear Modulus
(GPa)
StrengthHardening CoefficientStrain rate CoefficientHardening ExponentCompressive Strength (MPa)Tensile Strength
(MPa)
Strain RateMinimum Plastic Strain
245018.470.791.80.0070.994541 × 10−60.01
Normalize strength (MPa)Compressive strainVolume strainStress (GPa)Strain rate (compacted)Damage constant 1Damage constant 2Material constant 1 (MPa)Material constant 2 (MPa)Material constant 3 (MPa)
7158.0 × 10−41.30.070.041.085−171208
Table 5. Parameters of Striker and pressure bars.
Density
(g/mm3)
Elastic Modulus
(MPa)
Poisson’s RatioYield Strength (MPa)Tangent Modulus
(MPa)
Failure Strain
7.8 × 10−32.1 × 1050.35006 × 1020.28
Publisher’s Note: MDPI stays neutral with regard to jurisdictional claims in published maps and institutional affiliations.

